Embed Size (px)
Citation preview
May 8, 2013 THE PHILIPPINE STOCK EXCHANGE, INC. Philippine Stock Exchange Plaza Ayala Triangle, Ayala Avenue Makati City
Attention: Ms. Janet A. Encarnacion Head – Disclosure Department Dear Ms. Encarnacion: We are pleased to furnish your good office with a copy of our SEC Form 17-Q as of March 31, 2013 filed with the Securities and Exchange Commission (SEC). Thank you. Very truly yours,
Aerol Paul B. Banal Corporate Planning Officer
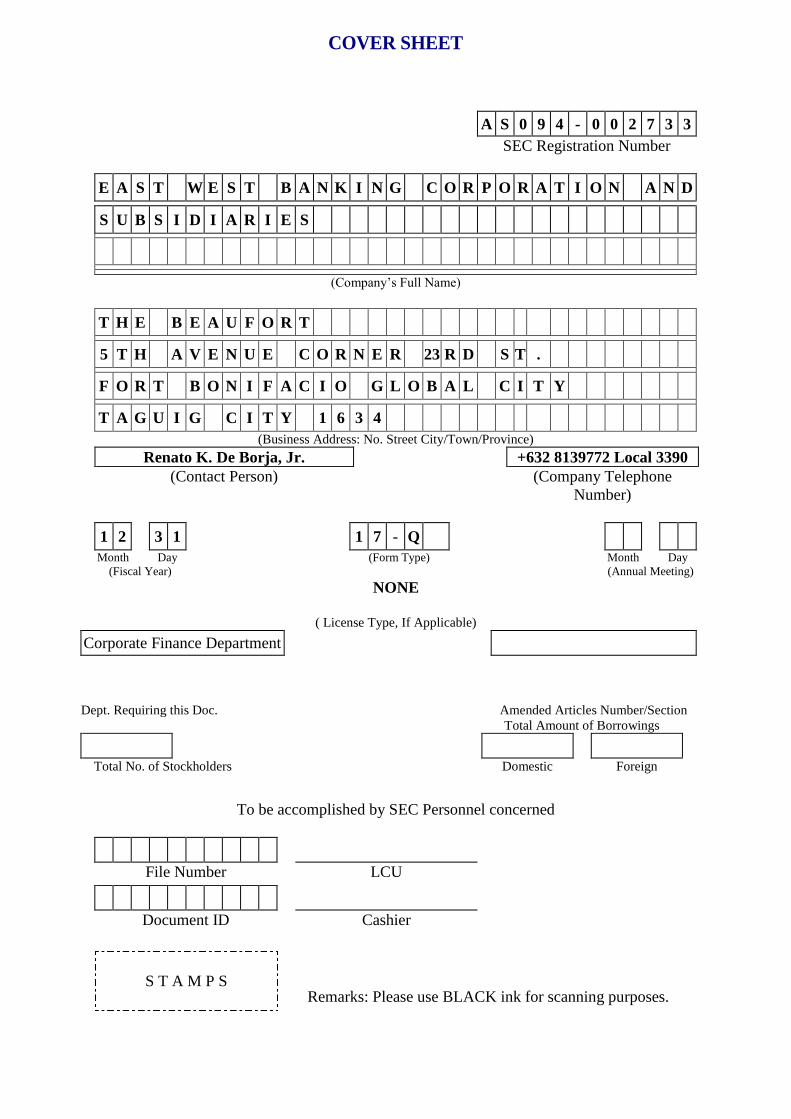
A S 0 9 4 - 0 0 2 7 3 3
SEC Registration Number
E A S T W E S T B A N K I N G C O R P O R A T I O N A N D
S U B S I D I A R I E S
(Company‟s Full Name)
T H E B E A U F O R T
5 T H A V E N U E C O R N E R 23 R D S T .
F O R T B O N I F A C I O G L O B A L C I T Y
T A G U I G C I T Y 1 6 3 4
(Business Address: No. Street City/Town/Province)
Renato K. De Borja, Jr. +632 8139772 Local 3390
(Contact Person) (Company Telephone
Number)
1 2 3 1 1 7 - Q
Month Day (Form Type) Month Day
(Fiscal Year) (Annual Meeting)
NONE
( License Type, If Applicable)
Corporate Finance Department
Dept. Requiring this Doc. Amended Articles Number/Section
Total Amount of Borrowings
Total No. of Stockholders Domestic Foreign
To be accomplished by SEC Personnel concerned
File Number LCU
Document ID Cashier
S T A M P S Remarks: Please use BLACK ink for scanning purposes.
COVER SHEET
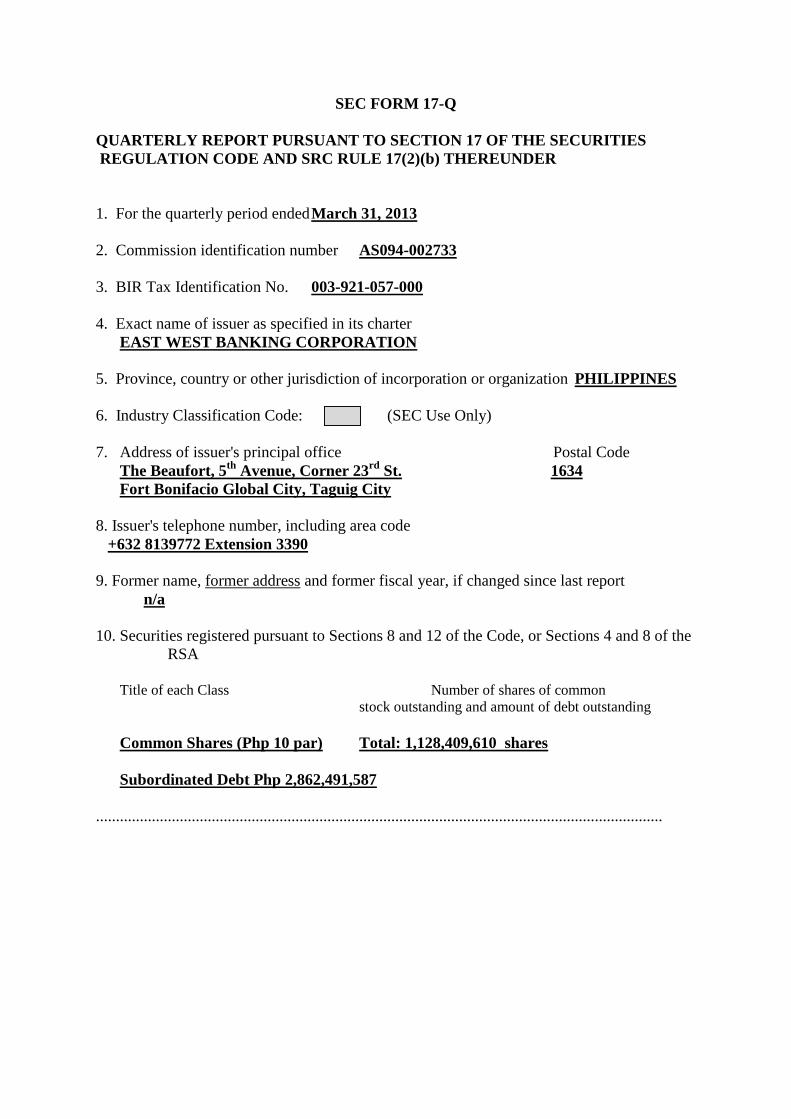
SEC FORM 17-Q
QUARTERLY REPORT PURSUANT TO SECTION 17 OF THE SECURITIES
REGULATION CODE AND SRC RULE 17(2)(b) THEREUNDER
1. For the quarterly period ended March 31, 2013
2. Commission identification number AS094-002733
3. BIR Tax Identification No. 003-921-057-000
4. Exact name of issuer as specified in its charter
EAST WEST BANKING CORPORATION
5. Province, country or other jurisdiction of incorporation or organization PHILIPPINES
6. Industry Classification Code: (SEC Use Only)
7. Address of issuer's principal office Postal Code
The Beaufort, 5th
Avenue, Corner 23rd
St. 1634
Fort Bonifacio Global City, Taguig City
8. Issuer's telephone number, including area code
+632 8139772 Extension 3390
9. Former name, former address and former fiscal year, if changed since last report
n/a
10. Securities registered pursuant to Sections 8 and 12 of the Code, or Sections 4 and 8 of the
RSA
Title of each Class Number of shares of common
stock outstanding and amount of debt outstanding
Common Shares (Php 10 par) Total: 1,128,409,610 shares
Subordinated Debt Php 2,862,491,587
..............................................................................................................................................
11. Are any or all of the securities listed on a Stock Exchange?
Yes [X] No [ ]
The company was listed in the Philippine Stock Exchange on May 7, 2012.
If yes, state the name of such Stock Exchange and the classes of securities listed therein:
Name of exchange: Philippine Stock Exchange
Class of securities: Common Shares
12. Indicate by check mark whether the registrant:
(a) has filed all reports required to be filed by Section 17 of the Code and SRC Rule
17 thereunder or Sections 11 of the RSA and RSA Rule 11(a)-1 thereunder, and
Sections 26 and 141 of the Corporation Code of the Philippines, during the
preceding twelve (12) months (or for such shorter period the registrant was
required to file such reports)
Yes [X] No [ ]
(b) has been subject to such filing requirements for the past ninety (90) days.
Yes [X] No []

PART I – FINANCIAL INFORMATION
Item I:
Management's Discussion & Analysis of Financial Position and Results of Operations
Item II:
Financial Statements (Attachment 1 - Unaudited Interim Financial Statements)
PART II – OTHER INFORMATION
Refer to the following:
Attachment 2 – Aging of Past Due Loans and Other Receivables
Attachment 3 – Consolidated Financial Ratios
There are no material disclosures that have not been reported under SEC Form 17-C during
the period covered by this report.

SIGNATURES
. Pursuant to the requirements of the Securities Regulation Code, the issuer has duly causedthis report to be signed on its behalf by the undersigned thereunto duly authorized.
East West Banking CorporationIssuer
By:
RenatoSenior VI
e B rja, Jr.-P sident and Chief Finance OffiW U-~
, May 8, 2013
5
Part I
Management's Discussion & Analysis of
Financial Position and Results of Operations
Financial Performance Highlights
The Bank‟s net income grew by 60% to P735 million from P460 million in the same period
last year, which resulted to an annualized Return on Equity and Return on Assets of 16.7%
and 2.5%, respectively.
Total Assets stood at P118.6 billion as of March 31, 2013. This is 34% higher and 2% lower
than March 31, 2013 and December 31, 2012, respectively. The y/y growth in assets is
driven mainly by the growth in lending. Customer loans grew by 54% y/y and 3% q/q. The
Bank remains focused on its strategies in growing its consumer and mid-market corporate
loans. Consumer loans grew by 44% y/y and 9% q/q, at the backed of strong consumer
demand. Corporate loans grew 70% y/y but went down by 4% q/q. Consumer loans still take
up more than half of the loan portfolio at 55% of total customer loans.
In the first quarter of the year, the Bank posted a significantly higher operating expenses and
credit costs. Operating expenses (exclusive of provision for impairment losses) increased by
47% to P2.0 billion from P1.4 billion in the same period last year resulting from the full year
effect of its 2012 branch store expansion. The Bank opened 123 branch stores in 2012 the
majority of which were opened in the 2nd
half of 2012. Provision for credit losses increased
by 194% to P904 million as the Bank accelerated its provisioning in line with strong revenue
growth. The Bank‟s operating income posted a growth of 66% to P3.6 billion from P2.2
billion in the same period last year. Strong growth in core earnings anchored on above
industry net interest margin (NIM) of 8.0% and boosted by hefty trading gains in the 1st
quarter. Fee-based income also posted double-digit growth driven mainly by consumer loan
related fees and branch related transaction fees.
Revenues
Net Revenues grew by 66% y/y to P3.6 billion from P2.2 billion in the same period last year.
Core earnings of the Bank composed of net interest income and fee-based income, exclusive
of trading income, increased by P703 million or 38% y/y.
Core recurring income was complemented by robust trading gains during the first quarter as
the Bank took advantage of favorable market conditions with fixed income securities trading
gains growing by nearly 4x to P1.0 billion from P271 million in the same period last year.
Foreign exchange trading, on the other hand, went down to P29 million from P70 million in
the same period last year.
Net Interest Income
Net Interest Income stood at P1.9 billion, 43% or P565 million higher than the P1.3 billion
posted in Q1 last year. The higher net interest income was a result of the double digit growth
in lending coupled by declining cost of funds. Net Interest Margin (NIM) improved to 8.0%
in 1Q2013 from 6.5% in the same period last year, even as corporate loan yields continue to
decline,due to (i) robust growth in loans, particularly consumer loans which accounts for 55%
of the portfolio; (ii) reduction in interest cost of high cost deposits; and (iii) CASA to Total
Deposit ratio increasing to 54% as against 48% in the same period last year.
Fee Income
Fee based income increased by 27% to end at P651 million from P513 million in the same
period last year. The increase primarily came from service charges, fees, commissions and
other charges which stood at P572 million or 42% higher. This is attributable to the
increasing deposit base and consumer loan portfolio which attract transaction fee income.
The increase in fees was partly offset by the decline in gain on sale of assets, which went
down by P50 million y/y.
Trading Income
The Bank took advantage of market opportunities as interest rates continue to drop and
posted strong trading results from fixed income securities. Trading income increased by
286% or P777 million to end at P1.0 billion as of the first quarter of 2013. Foreign exchange
gains was at P29 million, down by P41 million y/y, at the back of a volatile FX market.
Operating Costs
Total operating expenses increased by 47% to P2.0 billion from P1.4 billion in the same
period last year as the full year effect of the branch store expansion has started to reflect on
expenses. Compensation and fringe benefits of P726 million was P311 million or 75%
higher than the same period last year on account of the higher headcount for the new branch
stores and business expansion particularly in the areas of consumer and corporate lending.
Taxes and licenses increased by 36% to P245 million as a direct result of higher operating
income. Depreciation and amortization of P157 million was 24% higher while Rent expense
of P137 million was 55% higher both on account of the new branch stores that were opened
throughout 2012.
Miscellaneous expenses increased by 33% to P748 million due to the following: (1)
Advertising went down by P50 million due to the heavy re-branding spends in the first
quarter of 2012; (2) Service charges and commissions, postage and broker-collection fees
increased by a combined P122 million on account of expansion in consumer loans, esp. credit
cards; and (3) Securities, messengerial and janitorial expenses, as well as utilities cost
increased by P65 million on account of new corporate head quarters and branch stores. The
rest were spread out across various variable expenses such as PDIC insurance (o/a of higher
deposit level), repairs & maintenance, transportation and travel, directly related to growth in
loans and deposit businesses.
Cost-to-Income ratio declined to 55.8% in 1Q2013 from 63.1% in the same period last year
due to growth in core earnings and trading gains which offset the expenses arising from the
branch store expansion from last year.
Provisions
Provisioning were significantly higher, increasing by nearly 3x to P904 million from P308
million in the same period last year as the Bank accelerated loan loss provisions on account
of the rapid growth in consumer loans, particularly unsecured portfolios of credit cards and
personal loans. There were also some one-off non-credit loss provisions. All told, there were
about P500 million of non-recurring credit and non-credit impairment provisions in Q1.
Loans
Customer loans grew by 54% y/y and 3% q/q. The Bank remains focused in growing its
consumer and mid-market corporate loans. Consumer loans grew by 44% y/y and 9% q/q, at
the back of strong consumer demand. Corporate loans grew 70% y/y but went down by 4%
q/q. Similar to previous quarters, consumer loans take up more than half of the portfolio at
55% of total loans.
Deposits
Deposit levels as of the first quarter of 2013 was at P86.7 billion, up by 32% from the same
period last year but down by only 5% from end 2012. The decline coming from year-end
levels was expected as liquidity is usually high during the last quarter of the year. The y/y
growth is largely attributable to the expanded branch store network as reflected in the growth
of low cost deposits (CASA) which ended at P47.2 billion for an increase of 51% y/y. High
cost deposits (inclusive of LTNCDs) on the other hand increased by only 15% to end the
quarter at P39.5 billion. As a result, low cost (CASA) to total deposits ratio further improved
to 54%.
The strong growth in both lending and low cost funds, and the reduction in the cost of high
cost deposits resulted for the Bank to post another record NIM of 8.0% as of the first quarter
of 2013. This is more than 2x the industry average of about 3.6%.
Capital
The Bank‟s Capital Adequacy Ratio remain more than adequate at 17.5% in 1Q2013 despite
the increase in risk weighted assets, particularly customer loans which increased by 54% y/y.
The Bank‟s Tier 1 ratio stood at 14.0%. The Bank‟s Tier 1 capital is composed entirely of
common equity. While the Bank‟s capital levels are still above Basel 3 requirements, which
will take effect next year, the Bank is now reviewing its capital structure that will best
optimize returns for shareholders under Basel 3 regime.
Credit Quality
The Bank‟s overall NPL ratios declined y/y as the loan book continues to grow and maintain
its quality. The Bank‟s NPL to Total Customer Loans, net of fully provided NPLs, declined
to 3.7%1 in the first quarter of 2013 from 4.3%
1 in the same period last year. It increased
slightly from 3.5%1as of December 2012 due to higher credit cards past due, which is in line
with expectations as we continue to gain market share.
The Bank‟s net NPL ratio at solo level and as disclosed to the BSP declined to 2.05%2 in
March 2013 from 4.36%2
in March 2012. The y/y decline in NPL is largely due to the
change in BSP guidance in calculating NPL ratio, in which total specific allowances are now
a deductible from NPL in computing for NPL ratio, as compared to last year wherein only the
NPLs classified as loss by the BSP are considered as deductions in computing for its NPL.
The Bank‟s NPL ratio is relatively higher than industry average for two reasons: (i) more
than half of the Bank‟s portfolio is in the consumer segment which has a much higher yield
but also attracts higher credit costs; and (ii) the Bank has not fully written-off all its charged-
off NPLs to optimize its tax position.
The Bank‟s overall NPL coverage ratio is at 81%3. Unsecured consumer NPLs are 100%
provisioned while those with collaterals are provisioned after considering expected
recoveries. This explains why provisions are not 100% of total NPL.
1 Total NPLs less: 100% covered NPLs divided by Total Customer Loans less: 100% covered NPLs (at Group level) 2 NPL ratio disclosed to the BSP (at Parent level) 3 Allowance for Loan Losses divided by Total NPLs
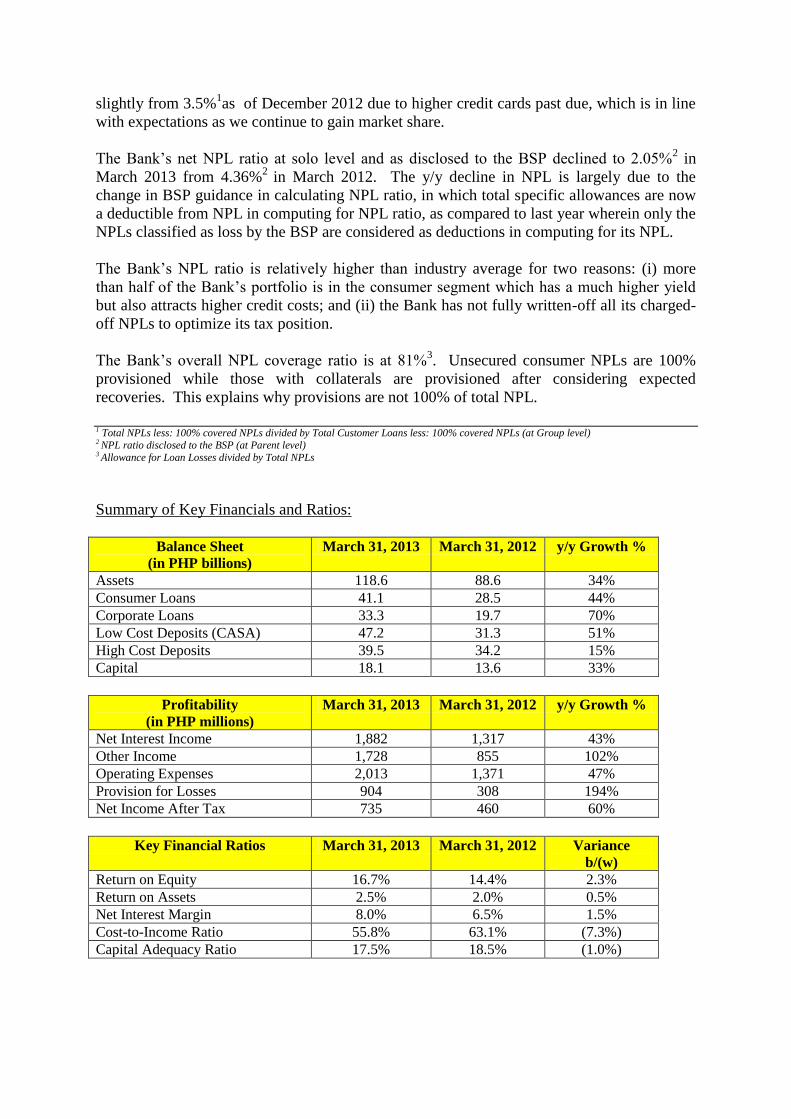
Summary of Key Financials and Ratios:
Balance Sheet
(in PHP billions)
March 31, 2013 March 31, 2012 y/y Growth %
Assets 118.6 88.6 34%
Consumer Loans 41.1 28.5 44%
Corporate Loans 33.3 19.7 70%
Low Cost Deposits (CASA) 47.2 31.3 51%
High Cost Deposits 39.5 34.2 15%
Capital 18.1 13.6 33%
Profitability
(in PHP millions)
March 31, 2013 March 31, 2012 y/y Growth %
Net Interest Income 1,882 1,317 43%
Other Income 1,728 855 102%
Operating Expenses 2,013 1,371 47%
Provision for Losses 904 308 194%
Net Income After Tax 735 460 60%
Key Financial Ratios March 31, 2013 March 31, 2012 Variance
b/(w)
Return on Equity
16.7% 14.4% 2.3%
Return on Assets 2.5% 2.0% 0.5%
Net Interest Margin 8.0% 6.5% 1.5%
Cost-to-Income Ratio 55.8% 63.1% (7.3%)
Capital Adequacy Ratio 17.5% 18.5% (1.0%)
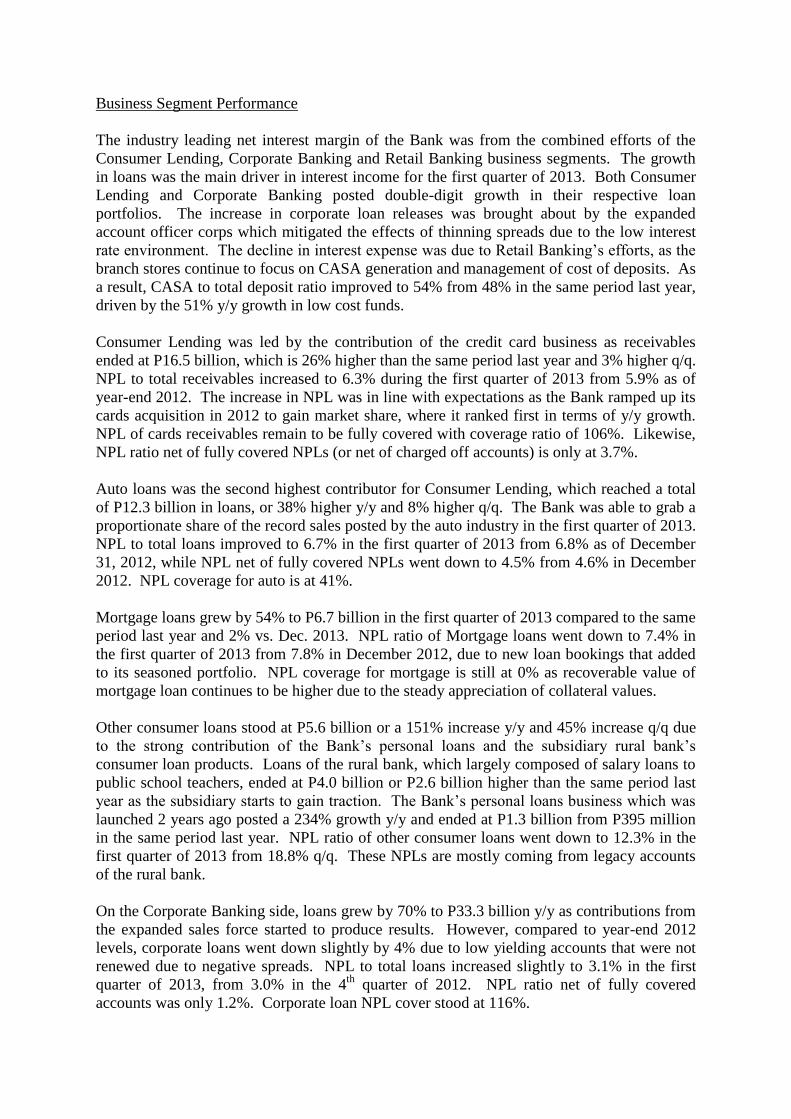
Business Segment Performance
The industry leading net interest margin of the Bank was from the combined efforts of the
Consumer Lending, Corporate Banking and Retail Banking business segments. The growth
in loans was the main driver in interest income for the first quarter of 2013. Both Consumer
Lending and Corporate Banking posted double-digit growth in their respective loan
portfolios. The increase in corporate loan releases was brought about by the expanded
account officer corps which mitigated the effects of thinning spreads due to the low interest
rate environment. The decline in interest expense was due to Retail Banking‟s efforts, as the
branch stores continue to focus on CASA generation and management of cost of deposits. As
a result, CASA to total deposit ratio improved to 54% from 48% in the same period last year,
driven by the 51% y/y growth in low cost funds.
Consumer Lending was led by the contribution of the credit card business as receivables
ended at P16.5 billion, which is 26% higher than the same period last year and 3% higher q/q.
NPL to total receivables increased to 6.3% during the first quarter of 2013 from 5.9% as of
year-end 2012. The increase in NPL was in line with expectations as the Bank ramped up its
cards acquisition in 2012 to gain market share, where it ranked first in terms of y/y growth.
NPL of cards receivables remain to be fully covered with coverage ratio of 106%. Likewise,
NPL ratio net of fully covered NPLs (or net of charged off accounts) is only at 3.7%.
Auto loans was the second highest contributor for Consumer Lending, which reached a total
of P12.3 billion in loans, or 38% higher y/y and 8% higher q/q. The Bank was able to grab a
proportionate share of the record sales posted by the auto industry in the first quarter of 2013.
NPL to total loans improved to 6.7% in the first quarter of 2013 from 6.8% as of December
31, 2012, while NPL net of fully covered NPLs went down to 4.5% from 4.6% in December
2012. NPL coverage for auto is at 41%.
Mortgage loans grew by 54% to P6.7 billion in the first quarter of 2013 compared to the same
period last year and 2% vs. Dec. 2013. NPL ratio of Mortgage loans went down to 7.4% in
the first quarter of 2013 from 7.8% in December 2012, due to new loan bookings that added
to its seasoned portfolio. NPL coverage for mortgage is still at 0% as recoverable value of
mortgage loan continues to be higher due to the steady appreciation of collateral values.
Other consumer loans stood at P5.6 billion or a 151% increase y/y and 45% increase q/q due
to the strong contribution of the Bank‟s personal loans and the subsidiary rural bank‟s
consumer loan products. Loans of the rural bank, which largely composed of salary loans to
public school teachers, ended at P4.0 billion or P2.6 billion higher than the same period last
year as the subsidiary starts to gain traction. The Bank‟s personal loans business which was
launched 2 years ago posted a 234% growth y/y and ended at P1.3 billion from P395 million
in the same period last year. NPL ratio of other consumer loans went down to 12.3% in the
first quarter of 2013 from 18.8% q/q. These NPLs are mostly coming from legacy accounts
of the rural bank.
On the Corporate Banking side, loans grew by 70% to P33.3 billion y/y as contributions from
the expanded sales force started to produce results. However, compared to year-end 2012
levels, corporate loans went down slightly by 4% due to low yielding accounts that were not
renewed due to negative spreads. NPL to total loans increased slightly to 3.1% in the first
quarter of 2013, from 3.0% in the 4th
quarter of 2012. NPL ratio net of fully covered
accounts was only 1.2%. Corporate loan NPL cover stood at 116%.

Non-interest income came from Treasury business segment which took advantage of the
declining rates and favorable market situation and posted hefty trading gains in the first
quarter of 2013. This was complemented by solid growth on transaction fee income from
Consumer loans and Branch banking businesses.
On the cost side, the headcount heavy Consumer lending and Retail banking led all business
segments in terms of operating expenses. This was largely due to the branch store expansion
program and the higher credit costs booked for Consumer loans mainly due to the increase in
credit cards receivables.
In summary, the Treasury business contributed the most to the net income for the Bank due to
strong trading performance. Consumer lending and Corporate banking, were the second and
third, respectively, in terms of net income contribution due to the robust increase in loans.
Retail banking on the other hand is still carrying the brunt of the heavy investment for the
branch store expansion.
Other Information:
As of March 31, 2013, the EW Bank has a total of 255 branches, with 124 of these branch
stores in the restricted areas and a total of 153 of these branch stores in all of Metro Manila.
For the rest of the country, the Bank has 52 branches in other parts of Luzon, 29 branches in
Visayas, and 21 branches in Mindanao. The total ATM network is at 301, composed of 243
on-site ATMs and 58 off-site ATMs. Total headcount of EW Bank is 3,866.
The rural bank subsidiaries have a total of 47 branches, 47 ATMs and 443 officers/staff,
bringing the group branch store network total to 302 with 348 ATMs and combined
manpower of 4,309.
Known trends, demands, commitments, events or uncertainties
There are no known demands, commitments, events or uncertainties that will have a material
impact on the Bank‟s liquidity within the next twelve (12) months.
Events that will trigger direct or contingent financial obligation
There are no events that will trigger direct or contingent financial obligation that is material
to the Bank, including any default or acceleration of an obligation.
Material off-balance sheet transactions, arrangements or obligations
There are no material off-balance sheet transactions, arrangements, obligations (including
contingent obligations), and other relationships of the Bank with unsolicited entities or other
persons created during the reporting period other than those disclosed in the financial
statements.
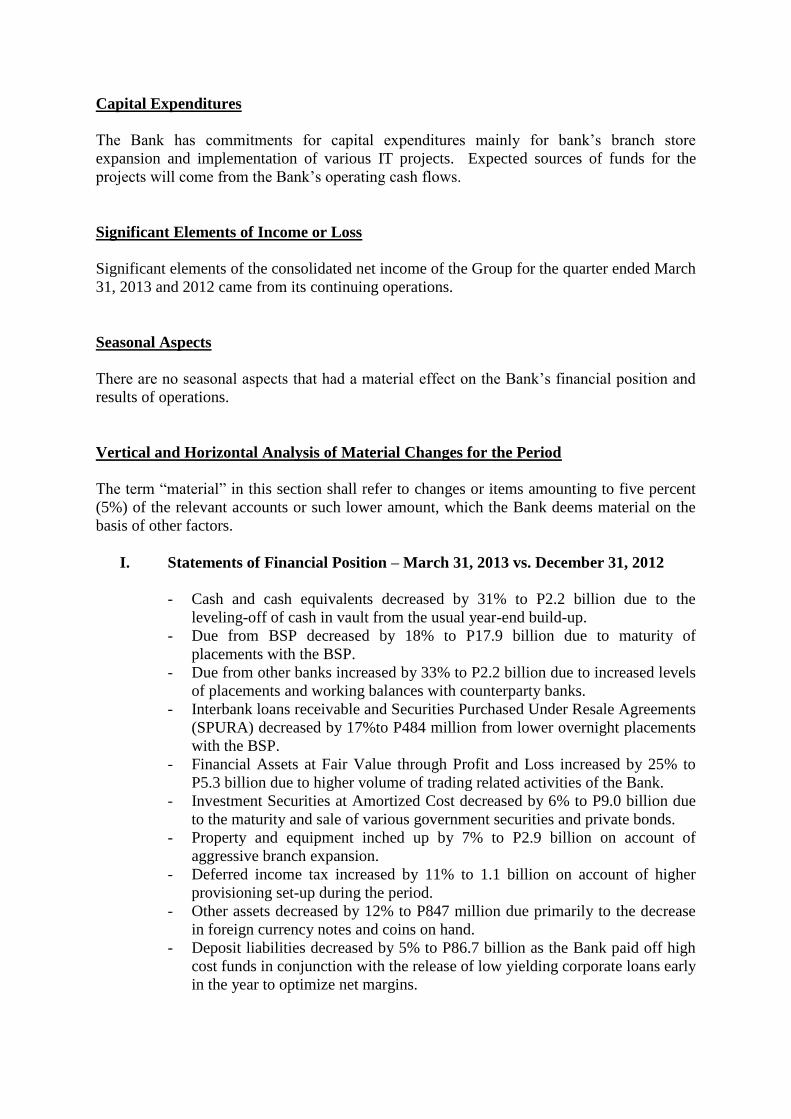
Capital Expenditures
The Bank has commitments for capital expenditures mainly for bank‟s branch store
expansion and implementation of various IT projects. Expected sources of funds for the
projects will come from the Bank‟s operating cash flows.
Significant Elements of Income or Loss
Significant elements of the consolidated net income of the Group for the quarter ended March
31, 2013 and 2012 came from its continuing operations.
Seasonal Aspects
There are no seasonal aspects that had a material effect on the Bank‟s financial position and
results of operations.
Vertical and Horizontal Analysis of Material Changes for the Period
The term “material” in this section shall refer to changes or items amounting to five percent
(5%) of the relevant accounts or such lower amount, which the Bank deems material on the
basis of other factors.
I. Statements of Financial Position – March 31, 2013 vs. December 31, 2012
- Cash and cash equivalents decreased by 31% to P2.2 billion due to the
leveling-off of cash in vault from the usual year-end build-up.
- Due from BSP decreased by 18% to P17.9 billion due to maturity of
placements with the BSP.
- Due from other banks increased by 33% to P2.2 billion due to increased levels
of placements and working balances with counterparty banks.
- Interbank loans receivable and Securities Purchased Under Resale Agreements
(SPURA) decreased by 17%to P484 million from lower overnight placements
with the BSP.
- Financial Assets at Fair Value through Profit and Loss increased by 25% to
P5.3 billion due to higher volume of trading related activities of the Bank.
- Investment Securities at Amortized Cost decreased by 6% to P9.0 billion due
to the maturity and sale of various government securities and private bonds.
- Property and equipment inched up by 7% to P2.9 billion on account of
aggressive branch expansion.
- Deferred income tax increased by 11% to 1.1 billion on account of higher
provisioning set-up during the period.
- Other assets decreased by 12% to P847 million due primarily to the decrease
in foreign currency notes and coins on hand.
- Deposit liabilities decreased by 5% to P86.7 billion as the Bank paid off high
cost funds in conjunction with the release of low yielding corporate loans early
in the year to optimize net margins.
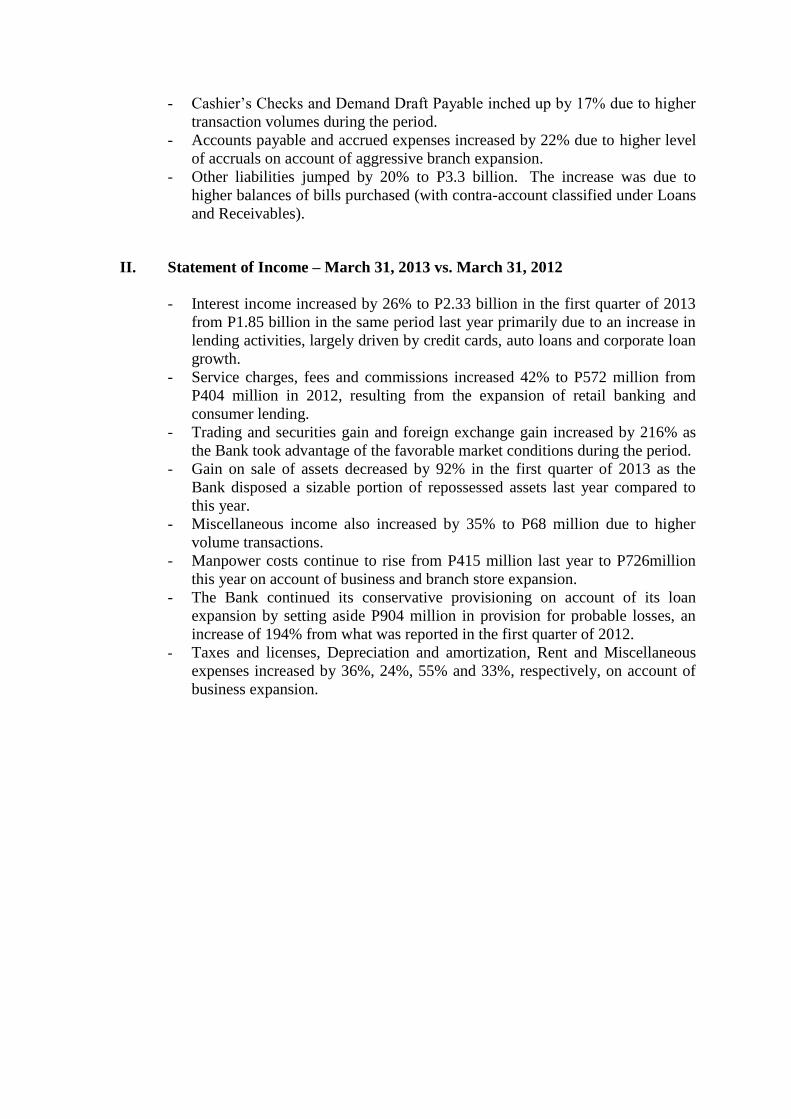
- Cashier‟s Checks and Demand Draft Payable inched up by 17% due to higher
transaction volumes during the period.
- Accounts payable and accrued expenses increased by 22% due to higher level
of accruals on account of aggressive branch expansion.
- Other liabilities jumped by 20% to P3.3 billion. The increase was due to
higher balances of bills purchased (with contra-account classified under Loans
and Receivables).
II. Statement of Income – March 31, 2013 vs. March 31, 2012
- Interest income increased by 26% to P2.33 billion in the first quarter of 2013
from P1.85 billion in the same period last year primarily due to an increase in
lending activities, largely driven by credit cards, auto loans and corporate loan
growth.
- Service charges, fees and commissions increased 42% to P572 million from
P404 million in 2012, resulting from the expansion of retail banking and
consumer lending.
- Trading and securities gain and foreign exchange gain increased by 216% as
the Bank took advantage of the favorable market conditions during the period.
- Gain on sale of assets decreased by 92% in the first quarter of 2013 as the
Bank disposed a sizable portion of repossessed assets last year compared to
this year.
- Miscellaneous income also increased by 35% to P68 million due to higher
volume transactions.
- Manpower costs continue to rise from P415 million last year to P726million
this year on account of business and branch store expansion.
- The Bank continued its conservative provisioning on account of its loan
expansion by setting aside P904 million in provision for probable losses, an
increase of 194% from what was reported in the first quarter of 2012.
- Taxes and licenses, Depreciation and amortization, Rent and Miscellaneous
expenses increased by 36%, 24%, 55% and 33%, respectively, on account of
business expansion.

Attachment I
East West Banking Corporation and Subsidiaries
Interim Consolidated Financial Statements
As of March 31, 2013 (Unaudited) and December 31, 2012 (Audited)
And for the Three Months Ended March 31, 2013 and 2012 (Unaudited)
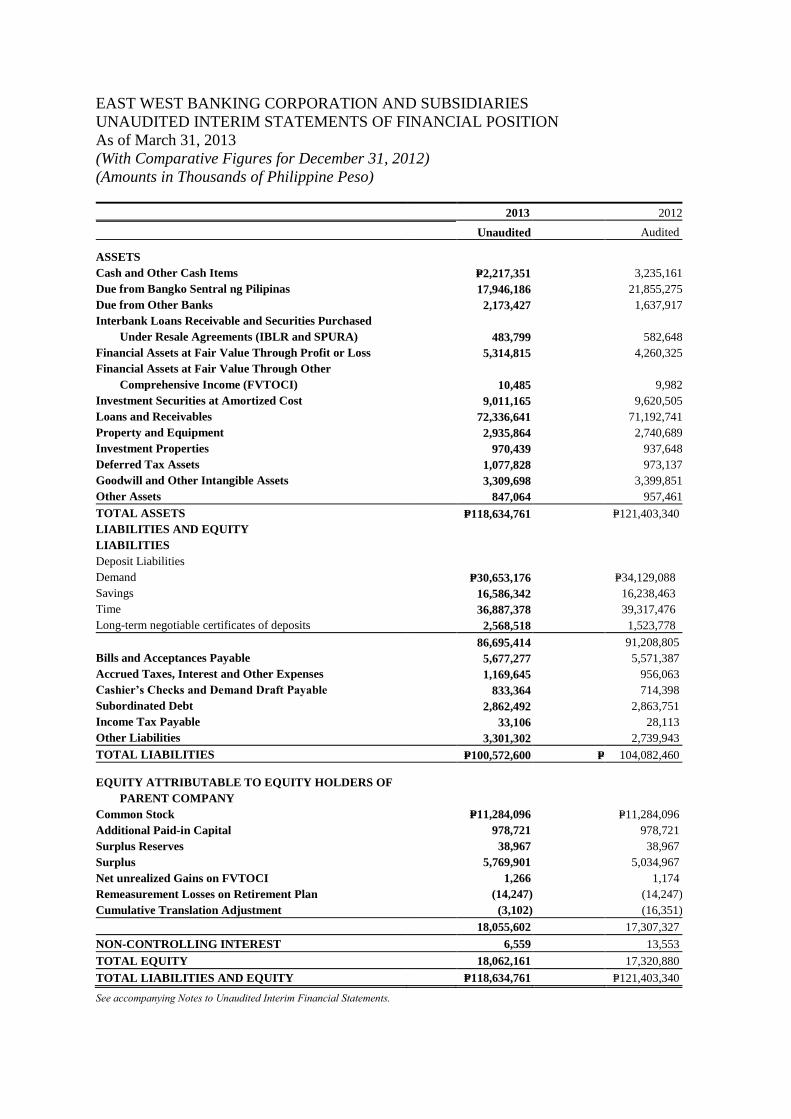
EAST WEST BANKING CORPORATION AND SUBSIDIARIES
UNAUDITED INTERIM STATEMENTS OF FINANCIAL POSITION
As of March 31, 2013
(With Comparative Figures for December 31, 2012)
(Amounts in Thousands of Philippine Peso)
2013 2012
Unaudited Audited
ASSETS
Cash and Other Cash Items P=2,217,351 3,235,161
Due from Bangko Sentral ng Pilipinas 17,946,186 21,855,275
Due from Other Banks 2,173,427 1,637,917
Interbank Loans Receivable and Securities Purchased
Under Resale Agreements (IBLR and SPURA) 483,799 582,648
Financial Assets at Fair Value Through Profit or Loss 5,314,815 4,260,325
Financial Assets at Fair Value Through Other
Comprehensive Income (FVTOCI) 10,485 9,982
Investment Securities at Amortized Cost 9,011,165 9,620,505
Loans and Receivables 72,336,641 71,192,741
Property and Equipment 2,935,864 2,740,689
Investment Properties 970,439 937,648
Deferred Tax Assets 1,077,828 973,137
Goodwill and Other Intangible Assets 3,309,698 3,399,851
Other Assets 847,064 957,461
TOTAL ASSETS P=118,634,761 P=121,403,340
LIABILITIES AND EQUITY
LIABILITIES
Deposit Liabilities
Demand P=30,653,176 P=34,129,088
Savings 16,586,342 16,238,463
Time 36,887,378 39,317,476
Long-term negotiable certificates of deposits 2,568,518 1,523,778
86,695,414 91,208,805
Bills and Acceptances Payable 5,677,277 5,571,387
Accrued Taxes, Interest and Other Expenses 1,169,645 956,063
Cashier’s Checks and Demand Draft Payable 833,364 714,398
Subordinated Debt 2,862,492 2,863,751
Income Tax Payable 33,106 28,113
Other Liabilities 3,301,302 2,739,943
TOTAL LIABILITIES P=100,572,600 P= 104,082,460
EQUITY ATTRIBUTABLE TO EQUITY HOLDERS OF
PARENT COMPANY
Common Stock P=11,284,096 P=11,284,096
Additional Paid-in Capital 978,721 978,721
Surplus Reserves 38,967 38,967
Surplus 5,769,901 5,034,967
Net unrealized Gains on FVTOCI 1,266 1,174
Remeasurement Losses on Retirement Plan (14,247) (14,247)
Cumulative Translation Adjustment (3,102) (16,351)
18,055,602 17,307,327
NON-CONTROLLING INTEREST 6,559 13,553
TOTAL EQUITY 18,062,161 17,320,880
TOTAL LIABILITIES AND EQUITY P=118,634,761 P=121,403,340
See accompanying Notes to Unaudited Interim Financial Statements.
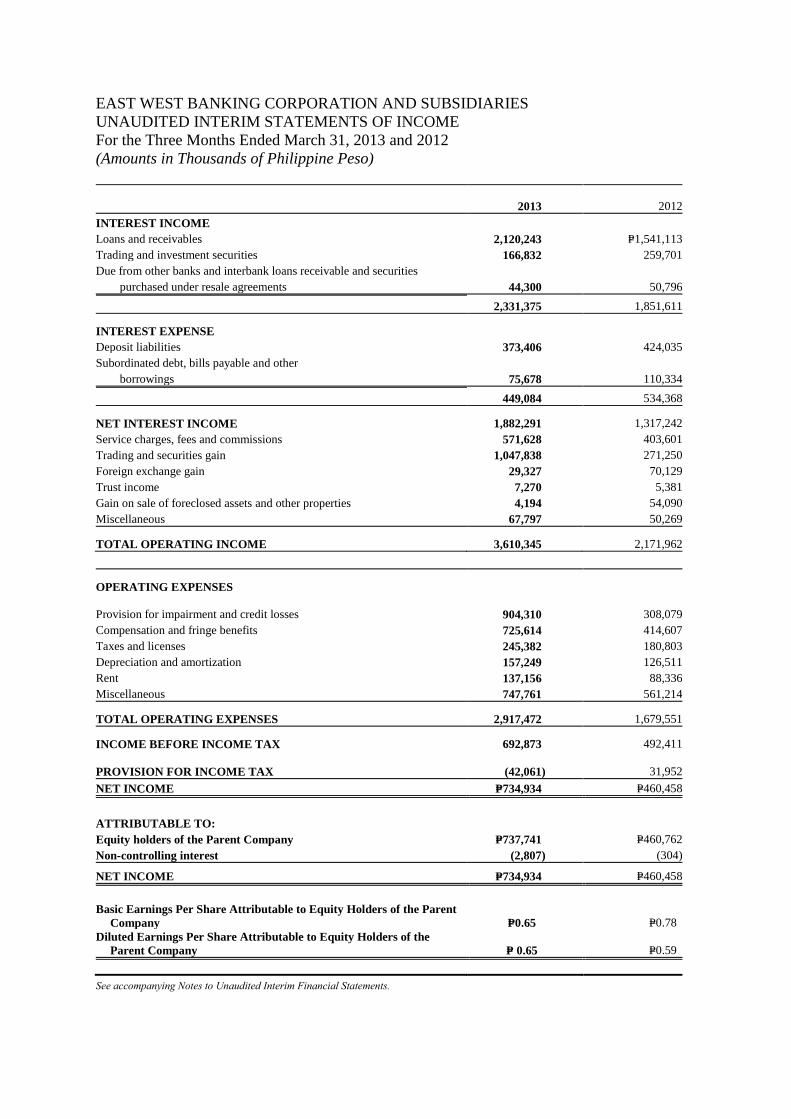
EAST WEST BANKING CORPORATION AND SUBSIDIARIES
UNAUDITED INTERIM STATEMENTS OF INCOME
For the Three Months Ended March 31, 2013 and 2012
(Amounts in Thousands of Philippine Peso)
2013 2012
INTEREST INCOME
Loans and receivables 2,120,243 P=1,541,113
Trading and investment securities 166,832 259,701
Due from other banks and interbank loans receivable and securities
purchased under resale agreements 44,300
50,796
2,331,375 1,851,611
INTEREST EXPENSE
Deposit liabilities 373,406 424,035
Subordinated debt, bills payable and other
borrowings 75,678
110,334
449,084 534,368
NET INTEREST INCOME 1,882,291 1,317,242
Service charges, fees and commissions 571,628 403,601
Trading and securities gain 1,047,838 271,250
Foreign exchange gain 29,327 70,129
Trust income 7,270 5,381
Gain on sale of foreclosed assets and other properties 4,194 54,090
Miscellaneous 67,797 50,269
TOTAL OPERATING INCOME 3,610,345 2,171,962
OPERATING EXPENSES
Provision for impairment and credit losses 904,310
308,079
Compensation and fringe benefits 725,614 414,607
Taxes and licenses 245,382 180,803
Depreciation and amortization 157,249 126,511
Rent 137,156 88,336
Miscellaneous 747,761 561,214
TOTAL OPERATING EXPENSES 2,917,472 1,679,551
INCOME BEFORE INCOME TAX 692,873 492,411
PROVISION FOR INCOME TAX
(42,061)
31,952
NET INCOME P=734,934 P=460,458
ATTRIBUTABLE TO:
Equity holders of the Parent Company P=737,741 P=460,762
Non-controlling interest (2,807) (304)
NET INCOME P=734,934 P=460,458
Basic Earnings Per Share Attributable to Equity Holders of the Parent
Company P=0.65 P=0.78
Diluted Earnings Per Share Attributable to Equity Holders of the
Parent Company P= 0.65 P=0.59
See accompanying Notes to Unaudited Interim Financial Statements.
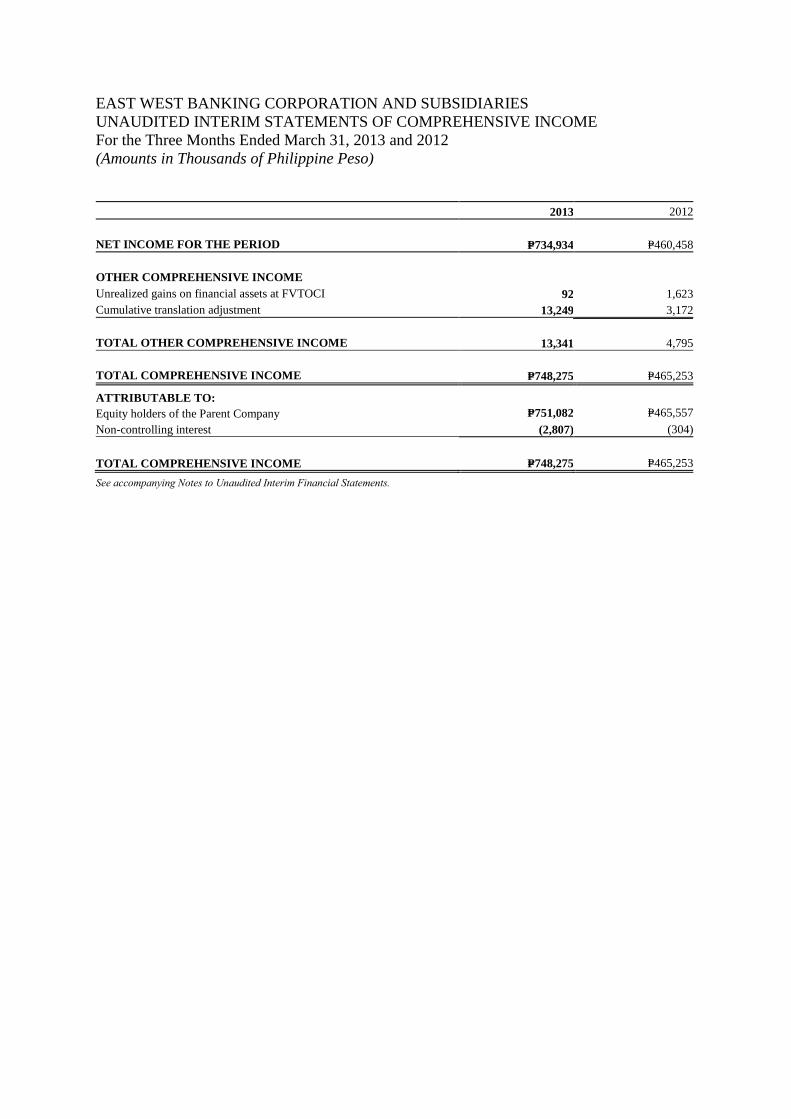
EAST WEST BANKING CORPORATION AND SUBSIDIARIES
UNAUDITED INTERIM STATEMENTS OF COMPREHENSIVE INCOME
For the Three Months Ended March 31, 2013 and 2012
(Amounts in Thousands of Philippine Peso)
See accompanying Notes to Unaudited Interim Financial Statements.
2013 2012
NET INCOME FOR THE PERIOD P=734,934 P=460,458
OTHER COMPREHENSIVE INCOME
Unrealized gains on financial assets at FVTOCI 92 1,623
Cumulative translation adjustment 13,249 3,172
TOTAL OTHER COMPREHENSIVE INCOME
13,341
4,795
TOTAL COMPREHENSIVE INCOME
P=748,275
P=465,253
ATTRIBUTABLE TO:
Equity holders of the Parent Company
Non-controlling interest
P=751,082 P=465,557
(2,807) (304)
TOTAL COMPREHENSIVE INCOME P=748,275 P=465,253
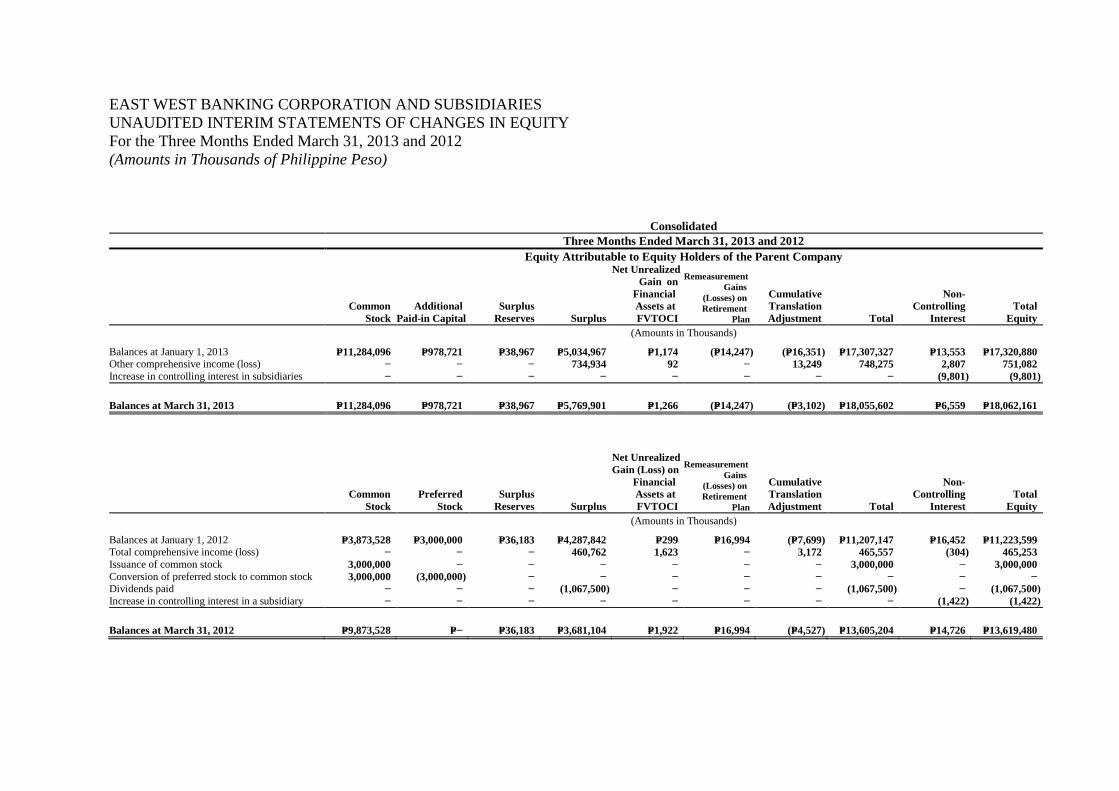
EAST WEST BANKING CORPORATION AND SUBSIDIARIES
UNAUDITED INTERIM STATEMENTS OF CHANGES IN EQUITY
For the Three Months Ended March 31, 2013 and 2012
(Amounts in Thousands of Philippine Peso)
Consolidated
Three Months Ended March 31, 2013 and 2012
Equity Attributable to Equity Holders of the Parent Company
Common
Stock
Additional
Paid-in Capital
Surplus
Reserves Surplus
Net Unrealized
Gain on
Financial
Assets at
FVTOCI
Remeasurement
Gains
(Losses) on
Retirement
Plan
Cumulative
Translation
Adjustment
Total
Non-
Controlling
Interest
Total
Equity
(Amounts in Thousands)
Balances at January 1, 2013 P=11,284,096 P=978,721 P=38,967 P=5,034,967 P=1,174 (P=14,247) (P=16,351) P=17,307,327 P=13,553 P=17,320,880
Other comprehensive income (loss) − − − 734,934 92 − 13,249 748,275 2,807 751,082
Increase in controlling interest in subsidiaries − − − − − − − − (9,801) (9,801)
Balances at March 31, 2013 P=11,284,096 P=978,721 P=38,967 P=5,769,901 P=1,266 (P=14,247) (P=3,102) P=18,055,602 P=6,559 P=18,062,161
Common
Stock
Preferred
Stock
Surplus
Reserves Surplus
Net Unrealized
Gain (Loss) on
Financial
Assets at
FVTOCI
Remeasurement
Gains
(Losses) on
Retirement
Plan
Cumulative
Translation
Adjustment
Total
Non-
Controlling
Interest
Total
Equity
(Amounts in Thousands)
Balances at January 1, 2012 P=3,873,528 P=3,000,000 P=36,183 P=4,287,842 P=299 P=16,994 (P=7,699) P=11,207,147 P=16,452 P=11,223,599
Total comprehensive income (loss) − − − 460,762 1,623 − 3,172 465,557 (304) 465,253
Issuance of common stock 3,000,000 − − − − − − 3,000,000 − 3,000,000
Conversion of preferred stock to common stock 3,000,000 (3,000,000) − − − − − − − −
Dividends paid − − − (1,067,500) − − − (1,067,500) − (1,067,500)
Increase in controlling interest in a subsidiary − − − − − − − − (1,422) (1,422)
Balances at March 31, 2012 P=9,873,528 P=− P=36,183 P=3,681,104 P=1,922 P=16,994 (P=4,527) P=13,605,204 P=14,726 P=13,619,480
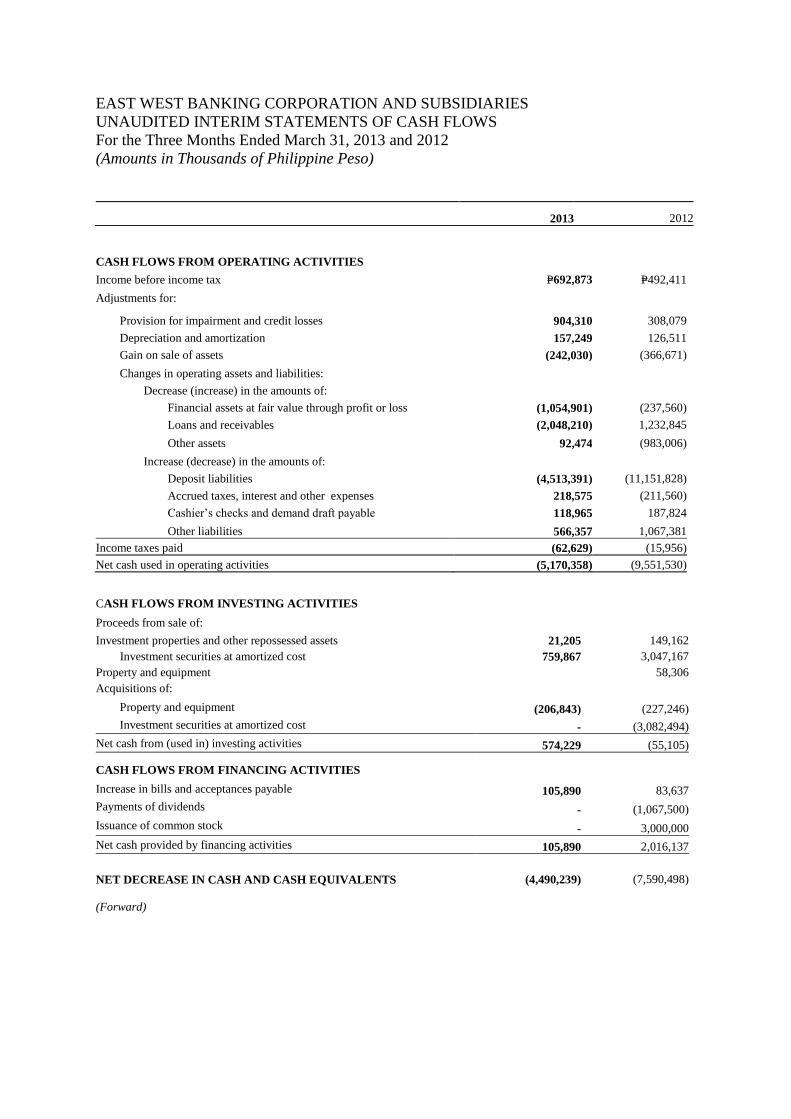
EAST WEST BANKING CORPORATION AND SUBSIDIARIES
UNAUDITED INTERIM STATEMENTS OF CASH FLOWS
For the Three Months Ended March 31, 2013 and 2012
(Amounts in Thousands of Philippine Peso)
CASH FLOWS FROM OPERATING ACTIVITIES
Income before income tax P=692,873 P=492,411
Adjustments for:
Provision for impairment and credit losses 904,310 308,079
Depreciation and amortization 157,249 126,511
Gain on sale of assets (242,030) (366,671)
Changes in operating assets and liabilities:
Decrease (increase) in the amounts of:
Financial assets at fair value through profit or loss (1,054,901) (237,560)
Loans and receivables (2,048,210) 1,232,845
Other assets 92,474 (983,006)
Increase (decrease) in the amounts of:
Deposit liabilities (4,513,391) (11,151,828)
Accrued taxes, interest and other expenses 218,575 (211,560)
Cashier‟s checks and demand draft payable 118,965 187,824
Other liabilities 566,357 1,067,381
Income taxes paid (62,629) (15,956)
Net cash used in operating activities (5,170,358) (9,551,530)
CASH FLOWS FROM INVESTING ACTIVITIES
Proceeds from sale of:
Investment properties and other repossessed assets 21,205 149,162
Investment securities at amortized cost 759,867 3,047,167
Property and equipment 58,306
Acquisitions of:
Property and equipment (206,843) (227,246)
Investment securities at amortized cost - (3,082,494)
Net cash from (used in) investing activities 574,229 (55,105)
CASH FLOWS FROM FINANCING ACTIVITIES
Increase in bills and acceptances payable 105,890 83,637
Payments of dividends - (1,067,500)
Issuance of common stock - 3,000,000
Net cash provided by financing activities 105,890 2,016,137
NET DECREASE IN CASH AND CASH EQUIVALENTS (4,490,239) (7,590,498)
(Forward)
2013 2012
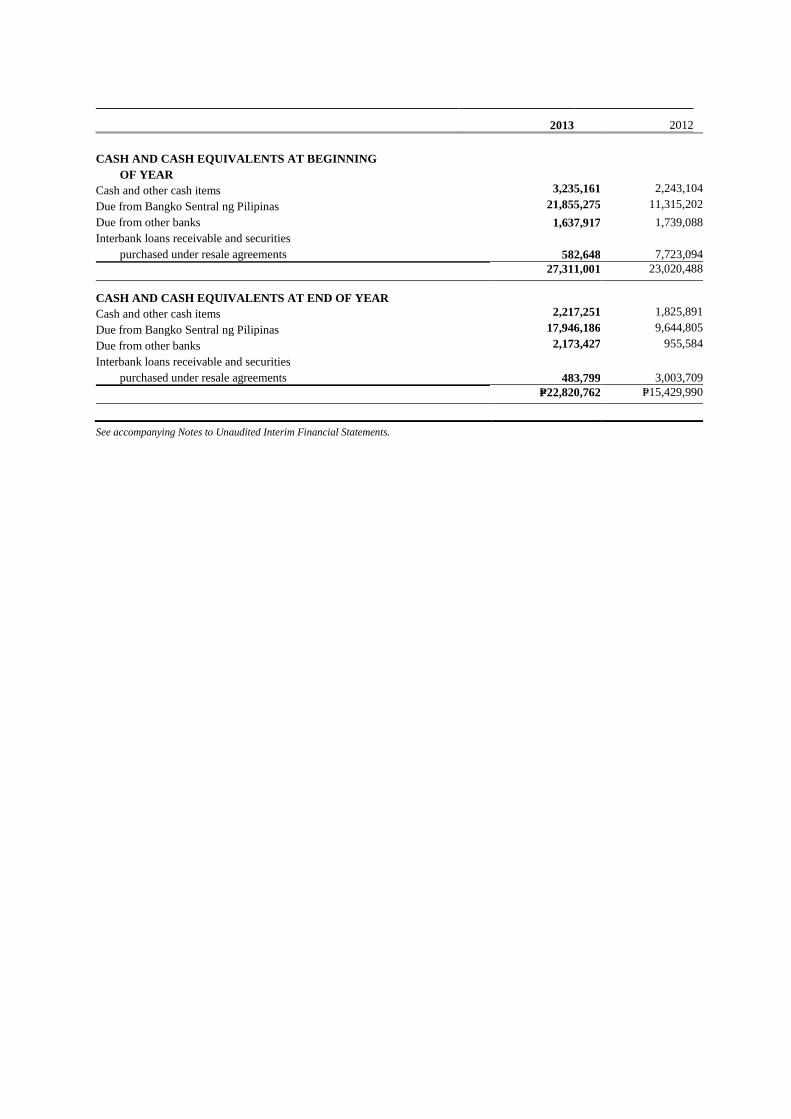
CASH AND CASH EQUIVALENTS AT BEGINNING
OF YEAR
Cash and other cash items 3,235,161 2,243,104
Due from Bangko Sentral ng Pilipinas 21,855,275 11,315,202
Due from other banks 1,637,917 1,739,088
Interbank loans receivable and securities
purchased under resale agreements 582,648 7,723,094
27,311,001 23,020,488
CASH AND CASH EQUIVALENTS AT END OF YEAR
Cash and other cash items 2,217,251 1,825,891
Due from Bangko Sentral ng Pilipinas 17,946,186 9,644,805
Due from other banks 2,173,427 955,584
Interbank loans receivable and securities
purchased under resale agreements 483,799 3,003,709
P=22,820,762 P=15,429,990
See accompanying Notes to Unaudited Interim Financial Statements.
2013 2012
EAST WEST BANKING CORPORATION AND SUBSIDIARIES
NOTES TO UNAUDITED INTERIM FINANCIAL INFORMATION
1. Corporate Information
East West Banking Corporation (the Parent Company) was granted authority by the
Bangko Sentral ng Pilipinas (BSP) to operate as a commercial bank under Monetary
Board (MB) Resolution No. 101 dated July 6, 1994, and commenced operations on July
8, 1994. The Parent Company was also granted authority by the BSP to operate an
expanded foreign currency deposit unit under MB Resolution No. 832 dated August 31,
1994. On July 31, 2012, the Bank received the approval of the BSP to operate as a
universal bank. As of March 31, 2013, the Parent Company is effectively 75%owned by
Filinvest Development Corporation (FDC). The Parent Company‟s ultimate parent
company is A.L. Gotianun, Inc.
The Parent Company is a domestic corporation registered with the Securities and
Exchange Commission (SEC) on March 22, 1994. In 2012, the Parent Company
conducted an initial public offering (IPO) of its 283,113,600 common shares. The Parent
Company‟s common shares were listed and commenced trading in the Philippine Stock
Exchange (PSE) on May 7, 2012.
The Parent Company provides a wide range of financial services to consumer and
corporate clients. The Parent Company‟s principal banking products and services include
deposit-taking, loan and trade finance, treasury, trust services, credit cards, cash
management and custodial services.
Both GBI and FRBI (the Subsidiaries) were consolidated with the Parent Company from
the time the latter gained control. As of March 31, 2013, the Parent Company controls
96.53% and 100% of GBI and FRBI, respectively.
On October 8, 2012, the Parent Company filed a change in business address with the SEC
from its previous location at 20th Floor, PBCom Tower, 6795 Ayala Avenue, corner V.
A. Rufino St., Makati City to its new principal place of business, The Beaufort, 5th
Avenue corner 23rd Street, Fort Bonifacio Global City, Taguig City.
2. Summary of Significant Accounting Policies
Basis of Presentation
The accompanying condensed consolidated interim financial statements have been
prepared in accordance with Philippine Accounting Standards (PAS) 34 Interim Financial
Reporting. Accordingly, the condensed consolidated interim financial statements do not
include all of the information and disclosures required in the annual audited financial
statements and should be read in conjunction with the Groups‟ annual audited financial
statements as at December 31, 2012 which have been prepared in accordance with
Philippine Financial Reporting Standards. The accompanying financial statements have
been prepared on a historical cost basis except for financial assets at fair value through
profit or loss (FVTPL), financial assets at fair value through other comprehensive income
(FVTOCI), and derivative financial instruments that have been measured at fair value.
The financial statements are presented in Philippine peso and all values are rounded to the
nearest thousand except when otherwise indicated.
Each entity in the Group determines its own functional currency and items included in the
financial statements of each entity are measured using that functional currency. The
functional currency of the subsidiaries is the Philippine peso.
Statement of Compliance
The accompanying consolidated financial statements have been prepared in compliance
with Philippine Financial Reporting Standards (PFRS).
Presentation of Financial Statements
The Group presents its statement of financial position broadly in order of liquidity.
Basis of Consolidation
The subsidiaries are fully consolidated from the date of acquisition, being the date on
which the Parent Company obtains control and continue to be consolidated until the date
when the control ceases. The financial statements of the subsidiaries are prepared for the
same reporting period as the Parent Company using consistent accounting policies.
All significant intra-group balances, transactions, income and expenses and profits and
losses resulting from intra-group transactions are eliminated in full.
Non-Controlling Interest
Non-controlling interest represents the portion of profit or loss and net assets not owned,
directly or indirectly, by the Parent Company.
Non-controlling interests are presented separately in the consolidated statement of
income, consolidated statement of comprehensive income, and within equity in the
consolidated statement of financial position, separately from parent shareholder‟s equity.
Any losses applicable to the non-controlling interests are allocated against the interests of
the non-controlling interest even if this results in the non-controlling interest having a
deficit balance. Acquisitions of non-controlling interests that does not result in a loss of
control are accounted for as equity transaction, whereby the difference between the
consideration and the fair value of the share of net assets acquired is recognized as an
equity transaction and attributed to the owners of the Parent Company.
Changes in Accounting Policies and Disclosures
The accounting policies adopted in the preparation of the unaudited interim condensed
consolidated financial statements are consistent with those followed in the preparation of
the audited annual consolidated financial statements as of and for the year ended
December 31, 2012. In addition, the following standards effective January 1, 2013
onwards were assessed to either be applicable or not applicable to the Group. The Group
is currently evaluating the impact of each of the standards below based on its audited
figures as of December 31, 2012.
PAS 27, Separate Financial Statements (as revised in 2011)
As a consequence of the new PFRS 10, Consolidated Financial Statements and PFRS 12,
Disclosure of Interests in Other Entities, what remains of PAS 27 is limited to accounting
for subsidiaries, jointly controlled entities, and associates in separate financial statements.
This standard will have no material impact on the Group‟s financial position and
performance upon its adoption.
PAS 28, Investments in Associates and Joint Ventures (as revised in 2011)
As a consequence of the new PFRS 11, Joint Arrangements and PFRS 12, PAS 28 has
been renamed PAS 28, Investments in Associates and Joint Ventures, and describes the
application of the equity method to investments in joint ventures in addition to associates.
This standard is not applicable to the Group.
PFRS 1 – Government Loans - Amendments to PFRS 1
These amendments require first-time adopters to apply the requirements of PAS 20
prospectively to government loans existing at the date of transition to PFRS. However,
entities may choose to apply the requirements of PFRS 9 (or PAS 39, as applicable) and
PAS 20 to government loans retrospectively if the information needed to do so had been
obtained at the time of initially accounting for those loans. The exception will give first-
time adopters relief from retrospective measurement of government loans with a below-
market rate of interest. As a result of not applying PFRS 9 (or IAS 39, as applicable) and
PAS 20 retrospectively, first-time adopters will not have to recognize the corresponding
benefit of a below-market rate government loan as a government grant. This standard is
not applicable to the Group.
Amendments to PFRS 7, Financial Instruments: Disclosures - Offsetting Financial Assets
and Financial Liabilities
These amendments require an entity to disclose information about rights of set-off and
related arrangements (such as collateral agreements). The new disclosures are required for
all recognized financial instruments that are set off in accordance with PAS 32. These
disclosures also apply to recognized financial instruments that are subject to an
enforceable master netting arrangement or „similar agreement‟, irrespective of whether
they are set-off in accordance with PAS 32. The amendments require entities to disclose,
in a tabular format unless another format is more appropriate, the following minimum
quantitative information. This is presented separately for financial assets and financial
liabilities recognized at the end of the reporting period:
a. The gross amounts of those recognized financial assets and recognized financial
liabilities;
b. The amounts that are set off in accordance with the criteria in PAS 32 when
determining the net amounts presented in the statement of financial position;
c. The net amounts presented in the statement of financial position;
d. The amounts subject to an enforceable master netting arrangement or similar
agreement that are not otherwise included in (b) above, including:
i. Amounts related to recognized financial instruments that do not meet some or
all of the offsetting criteria in PAS 32; and
ii. Amounts related to financial collateral (including cash collateral); and
e. The net amount after deducting the amounts in (d) from the amounts in (c) above.
The amendment affects disclosures only and has no impact on the Group‟s financial
position or performance.
PFRS 10, Consolidated Financial Statements
PFRS 10 replaces the portion of PAS 27, Consolidated and Separate Financial
Statements that addresses the accounting for consolidated financial statements. It also
includes the issues raised in SIC-12, Consolidation - Special Purpose Entities. PFRS 10
establishes a single control model that applies to all entities including special purpose
entities. The changes introduced by PFRS 10 will require management to exercise
significant judgment to determine which entities are controlled, and therefore, are
required to be consolidated by a parent, compared with the requirements that were in PAS
27. The adoption of the standard is not expected to have a material impact on the financial
position or performance of the Group.
PFRS 11, Joint Arrangements
PFRS 11 replaces PAS 31, Interests in Joint Ventures and SIC-13, Jointly-controlled
Entities - Non-monetary Contributions by Venturers. PFRS 11 removes the option to
account for jointly controlled entities (JCEs) using proportionate consolidation. Instead,
JCEs that meet the definition of a joint venture must be accounted for using the equity
method. This standard is not applicable to the Group.
PFRS 12, Disclosure of Interests in Other Entities
PFRS 12 includes all of the disclosures that were previously in PAS 27 related to
consolidated financial statements, as well as all of the disclosures that were previously
included in PAS 31 and PAS 28. These disclosures relate to an entity‟s interests in
subsidiaries, joint arrangements, associates and structured entities. A number of new
disclosures are also required. The adoption of the standard has no material impact on the
financial position or performance of the Group.
PFRS 13, Fair Value Measurement
PFRS 13 establishes a single source of guidance under PFRS for all fair value
measurements. PFRS 13 does not change when an entity is required to use fair value, but
rather provides guidance on how to measure fair value under PFRS when fair value is
required or permitted. Adoption of the standard is not expected to have a material impact
on the financial position or performance of the Group.
3. Significant Accounting Judgments and Estimates
The preparation of the financial statements in compliance with PFRS requires the Group
to make judgments and estimates that affect the reported amounts of assets, liabilities,
income and expenses and disclosure of contingent assets and contingent liabilities.
Future events may occur which will cause the judgments and assumptions used in
arriving at the estimates to change. The effects of any change in judgments and estimates
are reflected in the financial statements as these become reasonably determinable.
Judgments and estimates are continually evaluated and are based on historical experience
and other factors, including expectations of future events that are believed to be
reasonable under the circumstances.
4. Financial Risk Management
The risk exposure of the Parent Company and its subsidiaries in market, interest rate,
credit and liquidity remain contained within its risk limits and adequately covered by its
available capital.
Specifically, notable risk exposures, where most emanate from the Parent Company, as of
the first quarter of 2013 in the following areas are summarized below.
Market risk: At less than P90 million value-at-risk (VaR) on the Parent Company‟s
trading book for potential adverse movements in interest rate, foreign exchange rate,
and equity prices.
Interest rate risk: On the Parent Company‟s banking book, maximum potential loss
impact from adverse movement in interest rate is approximated to not exceed 3% and
10% of the full year 2013 net interest income and net income, respectively.
Credit risk: Potential risk is well within regulatory capital as gleaned from the
following indicators:
o Credit quality of portfolio remains at a composite rating of „Satisfactory‟ for
its corporate portfolio, „Standard‟ grade for most of its secured consumer
portfolio, „Substandard‟ grade for most of its unsecured consumer portfolio,
and its investment portfolio at „BB‟ composite rating.
o Loan portfolio security profile is around 39% secured given the significant
proportion of consumer lending business. For the portfolio of products that
normally require collateral, the Bank remains healthy at 53% secured.
o No credit concentration in size, borrower, and industry as defined by BSP and
internal risk policies.
Liquidity risk: There is no imminent liquidity risk as the Parent Company remains to
be generally liquid with sufficient sources of funding as and when the need arises.
Capital level, on the other hand, stands at P18 billion, more than enough to cover for the
above approximated exposures.
Thus, the Group‟s risk management policies remain generally the same as in 2012. The
Group‟s 2012 audited financial statements discuss in detail its risk exposures and its
related policies.
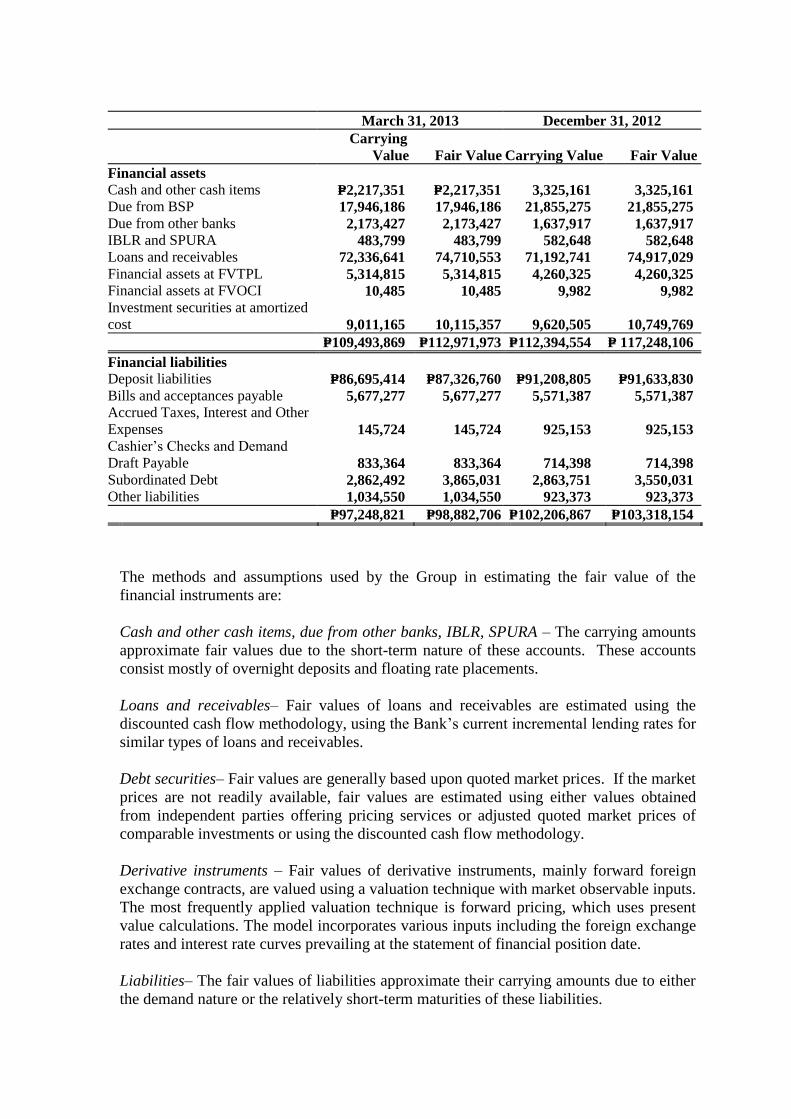
5. Fair Value Measurement
The table in the next page presents a comparison by category of carrying amounts and
estimated fair values of all of the Group‟s financial instruments as of March 31, 2013 and
December 31, 2012.
March 31, 2013 December 31, 2012
Carrying
Value Fair Value Carrying Value Fair Value
Financial assets
Cash and other cash items P=2,217,351 P=2,217,351 3,325,161 3,325,161
Due from BSP 17,946,186 17,946,186 21,855,275 21,855,275
Due from other banks 2,173,427 2,173,427 1,637,917 1,637,917
IBLR and SPURA 483,799 483,799 582,648 582,648
Loans and receivables 72,336,641 74,710,553 71,192,741 74,917,029
Financial assets at FVTPL 5,314,815 5,314,815 4,260,325 4,260,325
Financial assets at FVOCI 10,485 10,485 9,982 9,982
Investment securities at amortized
cost 9,011,165 10,115,357 9,620,505 10,749,769
P=109,493,869 P=112,971,973 P=112,394,554 P= 117,248,106
Financial liabilities
Deposit liabilities P=86,695,414 P=87,326,760 P=91,208,805 P=91,633,830
Bills and acceptances payable 5,677,277 5,677,277 5,571,387 5,571,387
Accrued Taxes, Interest and Other
Expenses 145,724 145,724 925,153 925,153
Cashier‟s Checks and Demand
Draft Payable 833,364 833,364 714,398 714,398
Subordinated Debt 2,862,492 3,865,031 2,863,751 3,550,031
Other liabilities 1,034,550 1,034,550 923,373 923,373
P=97,248,821 P=98,882,706 P=102,206,867 P=103,318,154
The methods and assumptions used by the Group in estimating the fair value of the
financial instruments are:
Cash and other cash items, due from other banks, IBLR, SPURA – The carrying amounts
approximate fair values due to the short-term nature of these accounts. These accounts
consist mostly of overnight deposits and floating rate placements.
Loans and receivables– Fair values of loans and receivables are estimated using the
discounted cash flow methodology, using the Bank‟s current incremental lending rates for
similar types of loans and receivables.
Debt securities– Fair values are generally based upon quoted market prices. If the market
prices are not readily available, fair values are estimated using either values obtained
from independent parties offering pricing services or adjusted quoted market prices of
comparable investments or using the discounted cash flow methodology.
Derivative instruments – Fair values of derivative instruments, mainly forward foreign
exchange contracts, are valued using a valuation technique with market observable inputs.
The most frequently applied valuation technique is forward pricing, which uses present
value calculations. The model incorporates various inputs including the foreign exchange
rates and interest rate curves prevailing at the statement of financial position date.
Liabilities– The fair values of liabilities approximate their carrying amounts due to either
the demand nature or the relatively short-term maturities of these liabilities.
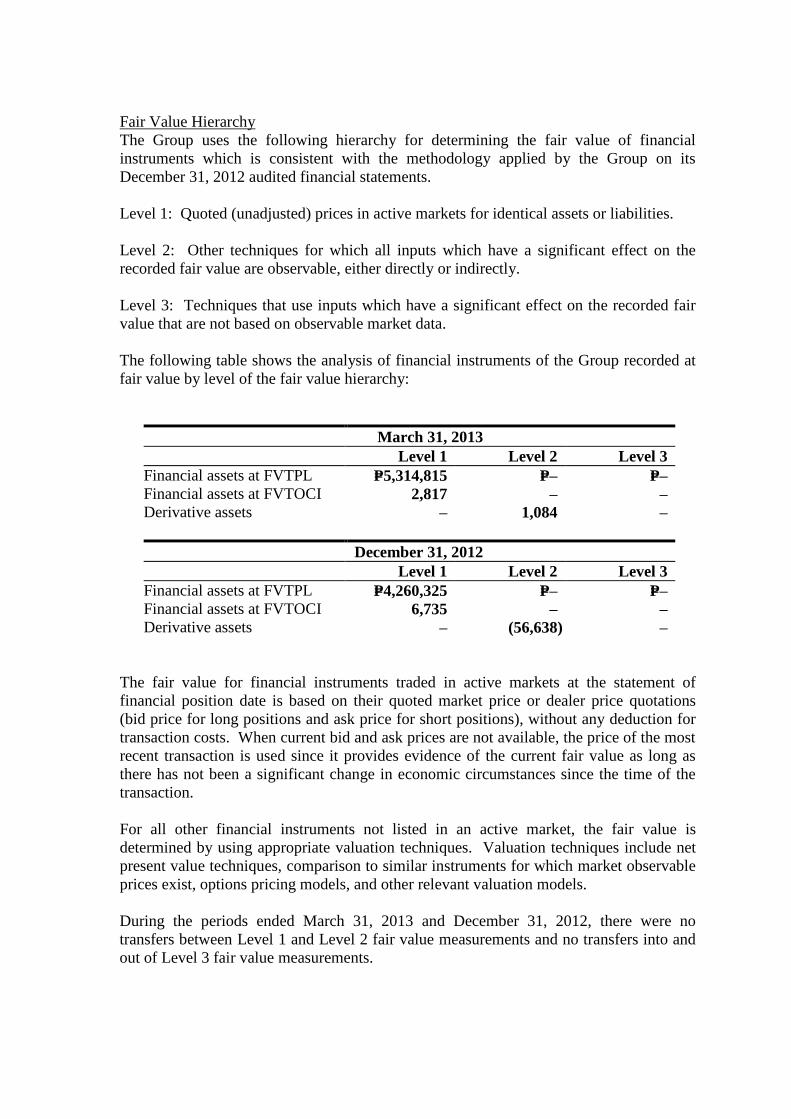
Fair Value Hierarchy
The Group uses the following hierarchy for determining the fair value of financial
instruments which is consistent with the methodology applied by the Group on its
December 31, 2012 audited financial statements.
Level 1: Quoted (unadjusted) prices in active markets for identical assets or liabilities.
Level 2: Other techniques for which all inputs which have a significant effect on the
recorded fair value are observable, either directly or indirectly.
Level 3: Techniques that use inputs which have a significant effect on the recorded fair
value that are not based on observable market data.
The following table shows the analysis of financial instruments of the Group recorded at
fair value by level of the fair value hierarchy:
March 31, 2013
Level 1 Level 2 Level 3
Financial assets at FVTPL P=5,314,815 P=– P=–
Financial assets at FVTOCI 2,817 – –
Derivative assets – 1,084 –
December 31, 2012
Level 1 Level 2 Level 3
Financial assets at FVTPL P=4,260,325 P=– P=–
Financial assets at FVTOCI 6,735 – –
Derivative assets – (56,638) –
The fair value for financial instruments traded in active markets at the statement of
financial position date is based on their quoted market price or dealer price quotations
(bid price for long positions and ask price for short positions), without any deduction for
transaction costs. When current bid and ask prices are not available, the price of the most
recent transaction is used since it provides evidence of the current fair value as long as
there has not been a significant change in economic circumstances since the time of the
transaction.
For all other financial instruments not listed in an active market, the fair value is
determined by using appropriate valuation techniques. Valuation techniques include net
present value techniques, comparison to similar instruments for which market observable
prices exist, options pricing models, and other relevant valuation models.
During the periods ended March 31, 2013 and December 31, 2012, there were no
transfers between Level 1 and Level 2 fair value measurements and no transfers into and
out of Level 3 fair value measurements.
The provision under PAS 39, Financial Instruments: Recognition and Measurement, on
the criteria used to determine whether the market of a financial instrument is active or
inactive, is not a required disclosure for the Bank.
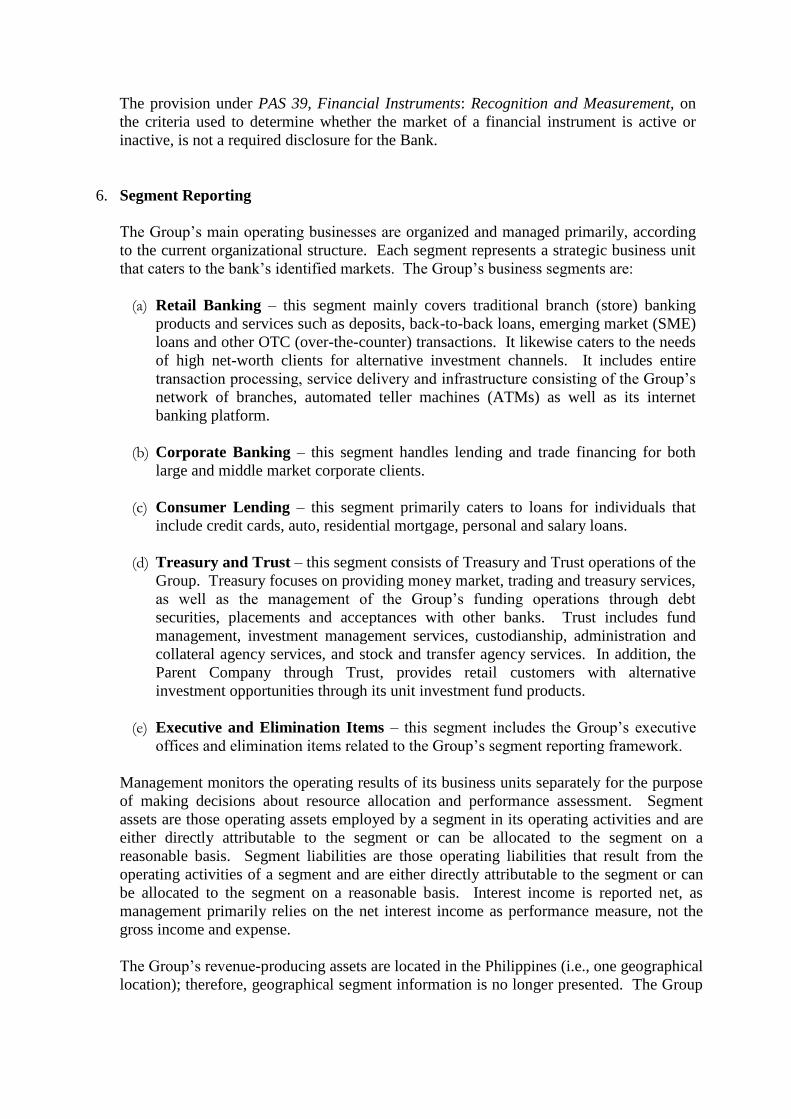
6. Segment Reporting
The Group‟s main operating businesses are organized and managed primarily, according
to the current organizational structure. Each segment represents a strategic business unit
that caters to the bank‟s identified markets. The Group‟s business segments are:
(a) Retail Banking – this segment mainly covers traditional branch (store) banking
products and services such as deposits, back-to-back loans, emerging market (SME)
loans and other OTC (over-the-counter) transactions. It likewise caters to the needs
of high net-worth clients for alternative investment channels. It includes entire
transaction processing, service delivery and infrastructure consisting of the Group‟s
network of branches, automated teller machines (ATMs) as well as its internet
banking platform.
(b) Corporate Banking – this segment handles lending and trade financing for both
large and middle market corporate clients.
(c) Consumer Lending – this segment primarily caters to loans for individuals that
include credit cards, auto, residential mortgage, personal and salary loans.
(d) Treasury and Trust – this segment consists of Treasury and Trust operations of the
Group. Treasury focuses on providing money market, trading and treasury services,
as well as the management of the Group‟s funding operations through debt
securities, placements and acceptances with other banks. Trust includes fund
management, investment management services, custodianship, administration and
collateral agency services, and stock and transfer agency services. In addition, the
Parent Company through Trust, provides retail customers with alternative
investment opportunities through its unit investment fund products.
(e) Executive and Elimination Items – this segment includes the Group‟s executive
offices and elimination items related to the Group‟s segment reporting framework.
Management monitors the operating results of its business units separately for the purpose
of making decisions about resource allocation and performance assessment. Segment
assets are those operating assets employed by a segment in its operating activities and are
either directly attributable to the segment or can be allocated to the segment on a
reasonable basis. Segment liabilities are those operating liabilities that result from the
operating activities of a segment and are either directly attributable to the segment or can
be allocated to the segment on a reasonable basis. Interest income is reported net, as
management primarily relies on the net interest income as performance measure, not the
gross income and expense.
The Group‟s revenue-producing assets are located in the Philippines (i.e., one geographical
location); therefore, geographical segment information is no longer presented. The Group
has no significant customers which contribute 10.00% or more of the consolidated
revenue, net of interest expense.
The segment results include internal transfer pricing adjustments across business units as
deemed appropriate by management. Transactions between segments are conducted at
estimated market rates on an arm‟s length basis. Interest is charged / credited to the
business units based on a pool rate which approximates the marginal cost of funds.
Non-interest income consists of service charges, fees and commissions, gain (loss) on sale
of assets, gain on asset foreclosure and dacion transactions, fixed income securities trading
gain (loss), foreign exchange gain (loss), trust income and miscellaneous income.
Non-interest expense consists of compensation and fringe benefits, taxes and licenses,
depreciation and amortization, rent, amortization of intangible assets, provision for
impairment and credit losses, and other expenses.
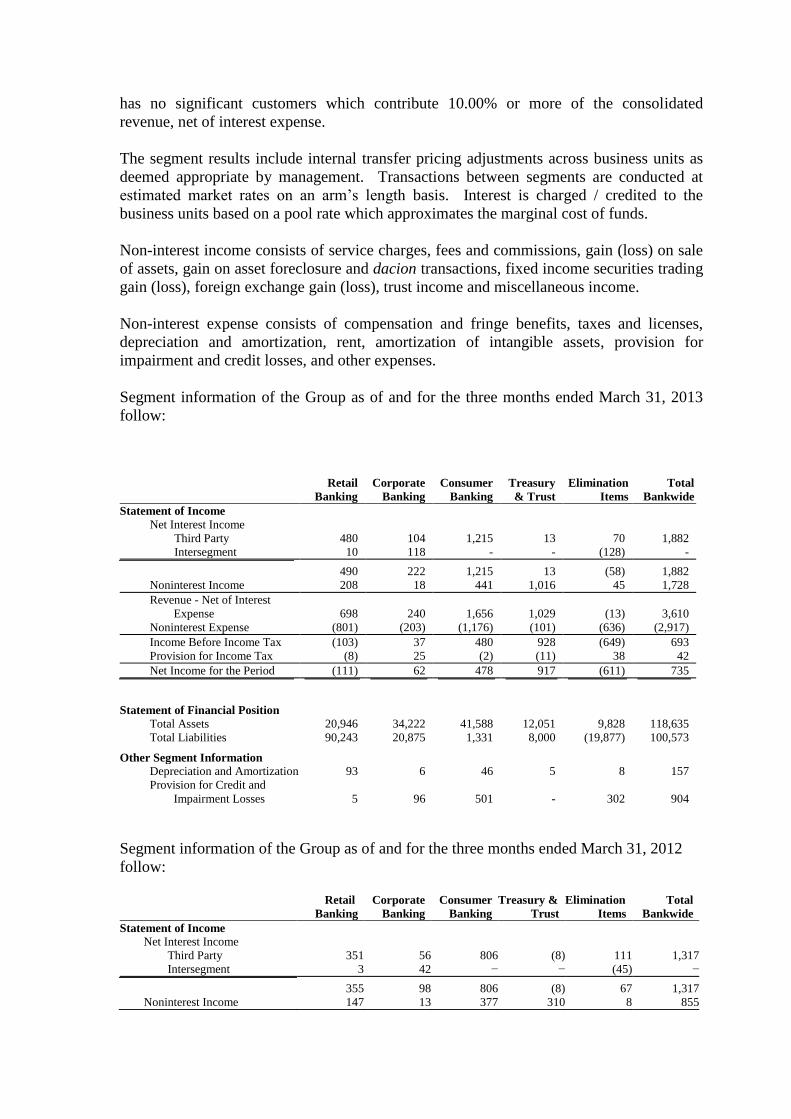
Segment information of the Group as of and for the three months ended March 31, 2013
follow:
Retail
Banking
Corporate
Banking
Consumer
Banking
Treasury
& Trust
Elimination
Items
Total
Bankwide
Statement of Income
Net Interest Income
Third Party 480 104 1,215 13 70 1,882
Intersegment 10 118 - - (128) -
490 222 1,215 13 (58) 1,882
Noninterest Income 208 18 441 1,016 45 1,728
Revenue - Net of Interest
Expense 698 240 1,656 1,029 (13) 3,610
Noninterest Expense (801) (203) (1,176) (101) (636) (2,917)
Income Before Income Tax (103) 37 480 928 (649) 693
Provision for Income Tax (8) 25 (2) (11) 38 42
Net Income for the Period (111) 62 478 917 (611) 735
Statement of Financial Position
Total Assets 20,946 34,222 41,588 12,051 9,828 118,635
Total Liabilities 90,243 20,875 1,331 8,000 (19,877) 100,573
Other Segment Information
Depreciation and Amortization 93 6 46 5 8 157
Provision for Credit and
Impairment Losses 5 96 501 - 302 904
Segment information of the Group as of and for the three months ended March 31, 2012
follow:
Retail
Banking
Corporate
Banking
Consumer
Banking
Treasury &
Trust
Elimination
Items
Total
Bankwide
Statement of Income
Net Interest Income
Third Party 351 56 806 (8) 111 1,317
Intersegment 3 42 − − (45) −
355 98 806 (8) 67 1,317
Noninterest Income 147 13 377 310 8 855
Retail
Banking
Corporate
Banking
Consumer
Banking
Treasury &
Trust
Elimination
Items
Total
Bankwide
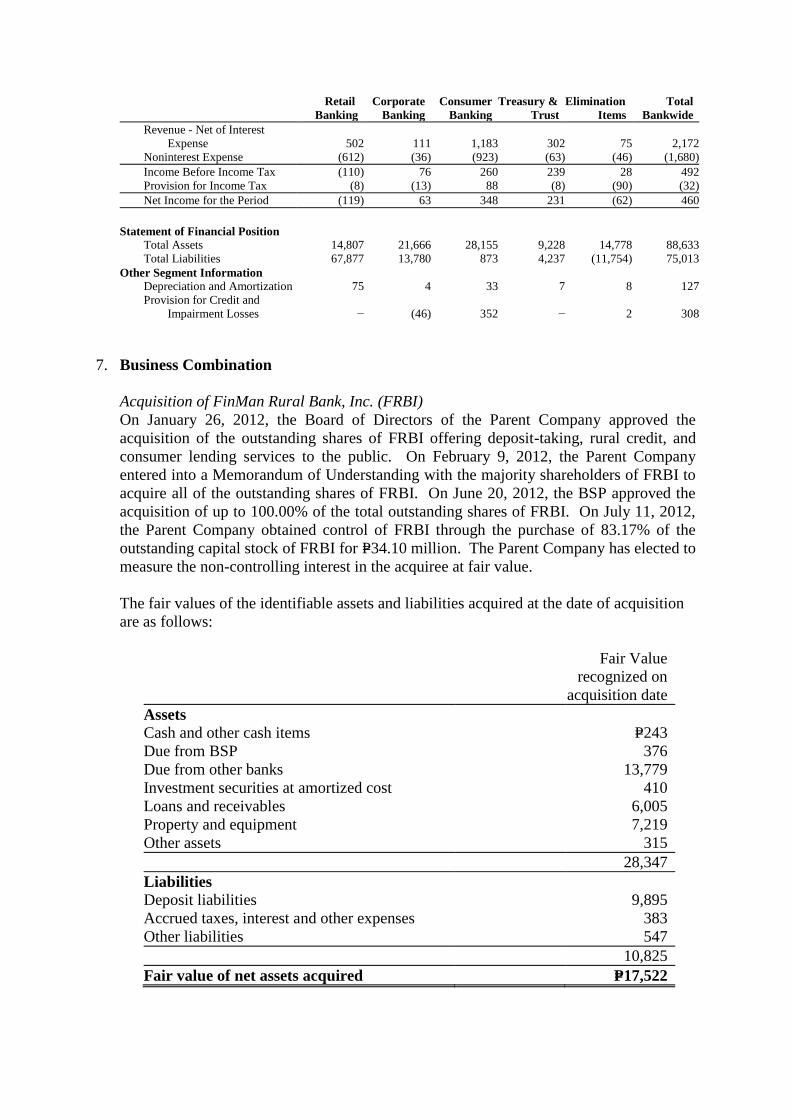
Revenue - Net of Interest
Expense 502 111 1,183 302 75 2,172
Noninterest Expense (612) (36) (923) (63) (46) (1,680)
Income Before Income Tax (110) 76 260 239 28 492
Provision for Income Tax (8) (13) 88 (8) (90) (32)
Net Income for the Period (119) 63 348 231 (62) 460
Statement of Financial Position
Total Assets 14,807 21,666 28,155 9,228 14,778 88,633
Total Liabilities 67,877 13,780 873 4,237 (11,754) 75,013
Other Segment Information
Depreciation and Amortization 75 4 33 7 8 127
Provision for Credit and
Impairment Losses − (46) 352 − 2 308
7. Business Combination
Acquisition of FinMan Rural Bank, Inc. (FRBI)
On January 26, 2012, the Board of Directors of the Parent Company approved the
acquisition of the outstanding shares of FRBI offering deposit-taking, rural credit, and
consumer lending services to the public. On February 9, 2012, the Parent Company
entered into a Memorandum of Understanding with the majority shareholders of FRBI to
acquire all of the outstanding shares of FRBI. On June 20, 2012, the BSP approved the
acquisition of up to 100.00% of the total outstanding shares of FRBI. On July 11, 2012,
the Parent Company obtained control of FRBI through the purchase of 83.17% of the
outstanding capital stock of FRBI for P=34.10 million. The Parent Company has elected to
measure the non-controlling interest in the acquiree at fair value.
The fair values of the identifiable assets and liabilities acquired at the date of acquisition
are as follows:
Fair Value
recognized on
acquisition date
Assets
Cash and other cash items P=243
Due from BSP 376
Due from other banks 13,779
Investment securities at amortized cost 410
Loans and receivables 6,005
Property and equipment 7,219
Other assets 315
28,347
Liabilities
Deposit liabilities 9,895
Accrued taxes, interest and other expenses 383
Other liabilities 547
10,825
Fair value of net assets acquired P=17,522
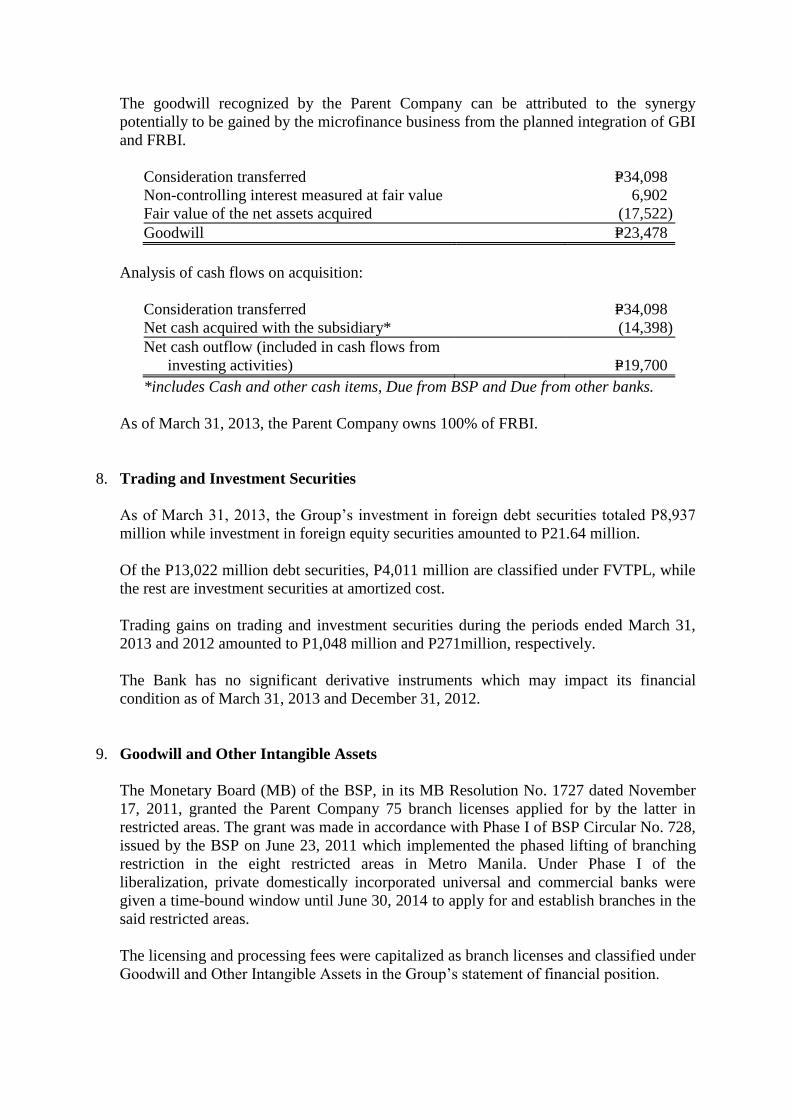
The goodwill recognized by the Parent Company can be attributed to the synergy
potentially to be gained by the microfinance business from the planned integration of GBI
and FRBI.
Consideration transferred P=34,098
Non-controlling interest measured at fair value 6,902
Fair value of the net assets acquired (17,522)
Goodwill P=23,478
Analysis of cash flows on acquisition:
Consideration transferred P=34,098
Net cash acquired with the subsidiary* (14,398)
Net cash outflow (included in cash flows from
investing activities) P=19,700
*includes Cash and other cash items, Due from BSP and Due from other banks.
As of March 31, 2013, the Parent Company owns 100% of FRBI.
8. Trading and Investment Securities
As of March 31, 2013, the Group‟s investment in foreign debt securities totaled P8,937
million while investment in foreign equity securities amounted to P21.64 million.
Of the P13,022 million debt securities, P4,011 million are classified under FVTPL, while
the rest are investment securities at amortized cost.
Trading gains on trading and investment securities during the periods ended March 31,
2013 and 2012 amounted to P1,048 million and P271million, respectively.
The Bank has no significant derivative instruments which may impact its financial
condition as of March 31, 2013 and December 31, 2012.
9. Goodwill and Other Intangible Assets
The Monetary Board (MB) of the BSP, in its MB Resolution No. 1727 dated November
17, 2011, granted the Parent Company 75 branch licenses applied for by the latter in
restricted areas. The grant was made in accordance with Phase I of BSP Circular No. 728,
issued by the BSP on June 23, 2011 which implemented the phased lifting of branching
restriction in the eight restricted areas in Metro Manila. Under Phase I of the
liberalization, private domestically incorporated universal and commercial banks were
given a time-bound window until June 30, 2014 to apply for and establish branches in the
said restricted areas.
The licensing and processing fees were capitalized as branch licenses and classified under
Goodwill and Other Intangible Assets in the Group‟s statement of financial position.
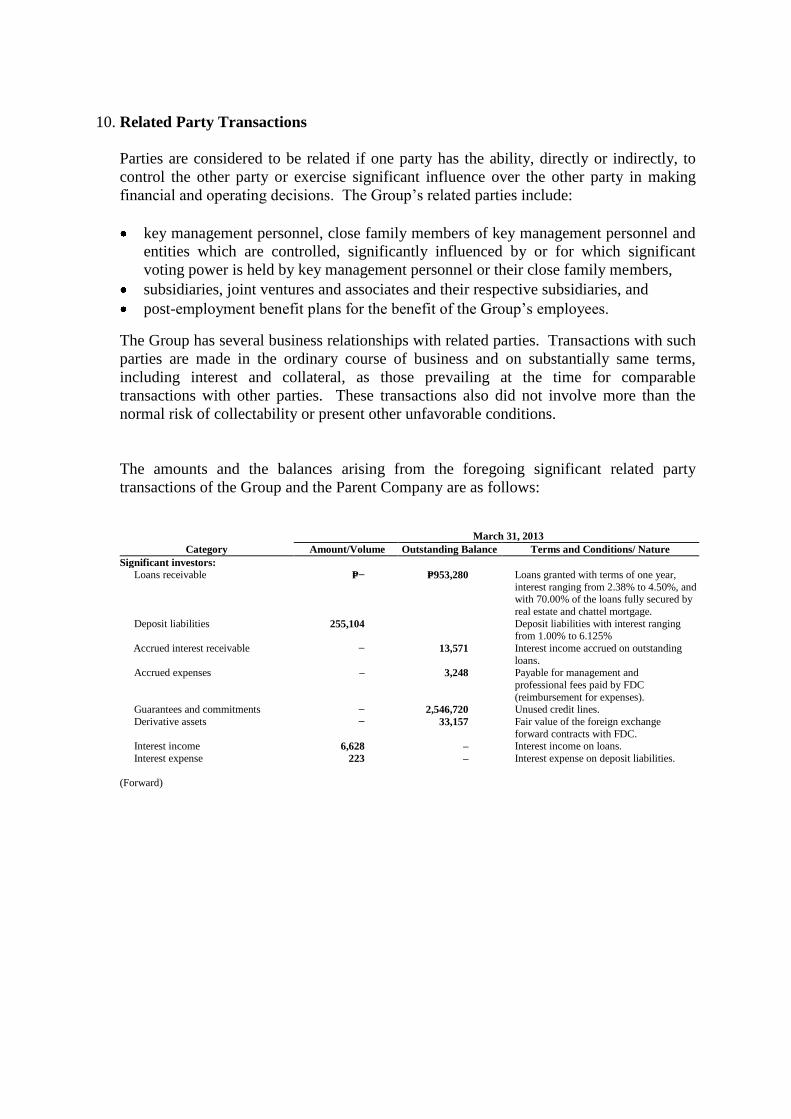
10. Related Party Transactions
Parties are considered to be related if one party has the ability, directly or indirectly, to
control the other party or exercise significant influence over the other party in making
financial and operating decisions. The Group‟s related parties include:
key management personnel, close family members of key management personnel and
entities which are controlled, significantly influenced by or for which significant
voting power is held by key management personnel or their close family members,
subsidiaries, joint ventures and associates and their respective subsidiaries, and
post-employment benefit plans for the benefit of the Group‟s employees.
The Group has several business relationships with related parties. Transactions with such
parties are made in the ordinary course of business and on substantially same terms,
including interest and collateral, as those prevailing at the time for comparable
transactions with other parties. These transactions also did not involve more than the
normal risk of collectability or present other unfavorable conditions.
The amounts and the balances arising from the foregoing significant related party
transactions of the Group and the Parent Company are as follows:
March 31, 2013
Category Amount/Volume Outstanding Balance Terms and Conditions/ Nature
Significant investors:
Loans receivable P=− P=953,280 Loans granted with terms of one year,
interest ranging from 2.38% to 4.50%, and with 70.00% of the loans fully secured by
real estate and chattel mortgage.
Deposit liabilities 255,104 Deposit liabilities with interest ranging
from 1.00% to 6.125%
Accrued interest receivable − 13,571 Interest income accrued on outstanding
loans. Accrued expenses – 3,248 Payable for management and
professional fees paid by FDC
(reimbursement for expenses). Guarantees and commitments − 2,546,720 Unused credit lines.
Derivative assets − 33,157 Fair value of the foreign exchange
forward contracts with FDC. Interest income 6,628 – Interest income on loans.
Interest expense 223 – Interest expense on deposit liabilities.
(Forward)
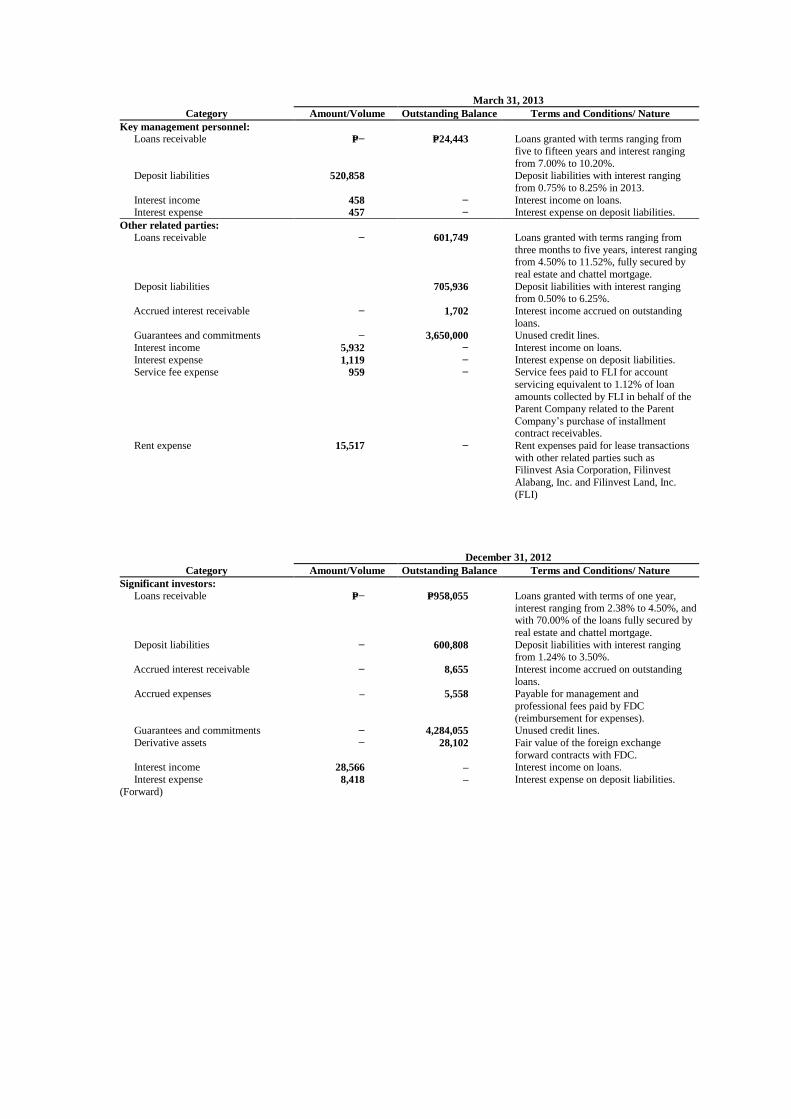
March 31, 2013
Category Amount/Volume Outstanding Balance Terms and Conditions/ Nature
Key management personnel: Loans receivable P=− P=24,443 Loans granted with terms ranging from
five to fifteen years and interest ranging
from 7.00% to 10.20%. Deposit liabilities 520,858 Deposit liabilities with interest ranging
from 0.75% to 8.25% in 2013.
Interest income 458 − Interest income on loans. Interest expense 457 − Interest expense on deposit liabilities.
Other related parties:
Loans receivable − 601,749 Loans granted with terms ranging from
three months to five years, interest ranging from 4.50% to 11.52%, fully secured by
real estate and chattel mortgage.
Deposit liabilities 705,936 Deposit liabilities with interest ranging from 0.50% to 6.25%.
Accrued interest receivable − 1,702 Interest income accrued on outstanding
loans. Guarantees and commitments − 3,650,000 Unused credit lines.
Interest income 5,932 − Interest income on loans.
Interest expense 1,119 − Interest expense on deposit liabilities. Service fee expense 959 − Service fees paid to FLI for account
servicing equivalent to 1.12% of loan
amounts collected by FLI in behalf of the Parent Company related to the Parent
Company‟s purchase of installment contract receivables.
Rent expense 15,517 − Rent expenses paid for lease transactions
with other related parties such as Filinvest Asia Corporation, Filinvest
Alabang, Inc. and Filinvest Land, Inc.
(FLI)
December 31, 2012
Category Amount/Volume Outstanding Balance Terms and Conditions/ Nature
Significant investors:
Loans receivable P=− P=958,055 Loans granted with terms of one year,
interest ranging from 2.38% to 4.50%, and with 70.00% of the loans fully secured by
real estate and chattel mortgage.
Deposit liabilities − 600,808 Deposit liabilities with interest ranging from 1.24% to 3.50%.
Accrued interest receivable − 8,655 Interest income accrued on outstanding
loans. Accrued expenses – 5,558 Payable for management and
professional fees paid by FDC
(reimbursement for expenses). Guarantees and commitments − 4,284,055 Unused credit lines.
Derivative assets − 28,102 Fair value of the foreign exchange
forward contracts with FDC. Interest income 28,566 – Interest income on loans.
Interest expense 8,418 – Interest expense on deposit liabilities.
(Forward)
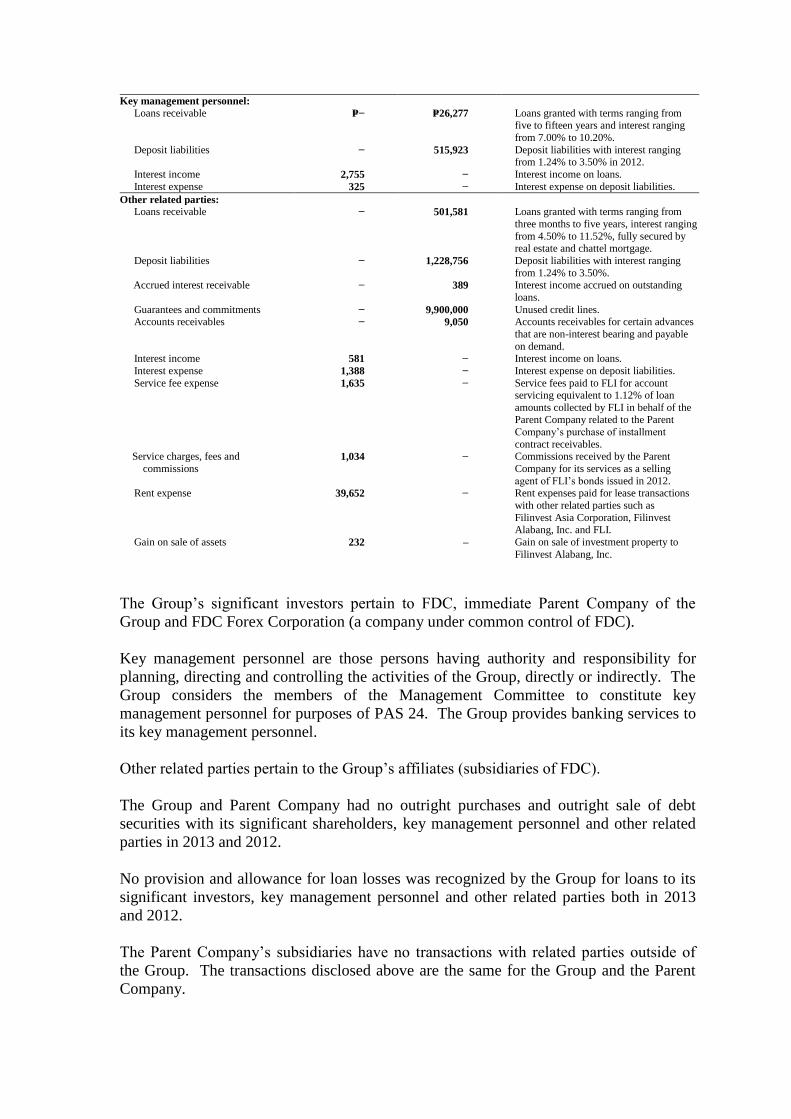
Key management personnel:
Loans receivable P=− P=26,277 Loans granted with terms ranging from
five to fifteen years and interest ranging
from 7.00% to 10.20%.
Deposit liabilities − 515,923 Deposit liabilities with interest ranging from 1.24% to 3.50% in 2012.
Interest income 2,755 − Interest income on loans.
Interest expense 325 − Interest expense on deposit liabilities.
Other related parties: Loans receivable − 501,581 Loans granted with terms ranging from
three months to five years, interest ranging
from 4.50% to 11.52%, fully secured by real estate and chattel mortgage.
Deposit liabilities − 1,228,756 Deposit liabilities with interest ranging
from 1.24% to 3.50%. Accrued interest receivable − 389 Interest income accrued on outstanding
loans.
Guarantees and commitments − 9,900,000 Unused credit lines. Accounts receivables − 9,050 Accounts receivables for certain advances
that are non-interest bearing and payable
on demand. Interest income 581 − Interest income on loans.
Interest expense 1,388 − Interest expense on deposit liabilities.
Service fee expense 1,635 − Service fees paid to FLI for account servicing equivalent to 1.12% of loan
amounts collected by FLI in behalf of the Parent Company related to the Parent
Company‟s purchase of installment
contract receivables. Service charges, fees and
commissions 1,034 − Commissions received by the Parent
Company for its services as a selling
agent of FLI‟s bonds issued in 2012. Rent expense 39,652 − Rent expenses paid for lease transactions
with other related parties such as
Filinvest Asia Corporation, Filinvest Alabang, Inc. and FLI.
Gain on sale of assets 232 – Gain on sale of investment property to
Filinvest Alabang, Inc.
The Group‟s significant investors pertain to FDC, immediate Parent Company of the
Group and FDC Forex Corporation (a company under common control of FDC).
Key management personnel are those persons having authority and responsibility for
planning, directing and controlling the activities of the Group, directly or indirectly. The
Group considers the members of the Management Committee to constitute key
management personnel for purposes of PAS 24. The Group provides banking services to
its key management personnel.
Other related parties pertain to the Group‟s affiliates (subsidiaries of FDC).
The Group and Parent Company had no outright purchases and outright sale of debt
securities with its significant shareholders, key management personnel and other related
parties in 2013 and 2012.
No provision and allowance for loan losses was recognized by the Group for loans to its
significant investors, key management personnel and other related parties both in 2013
and 2012.
The Parent Company‟s subsidiaries have no transactions with related parties outside of
the Group. The transactions disclosed above are the same for the Group and the Parent
Company.
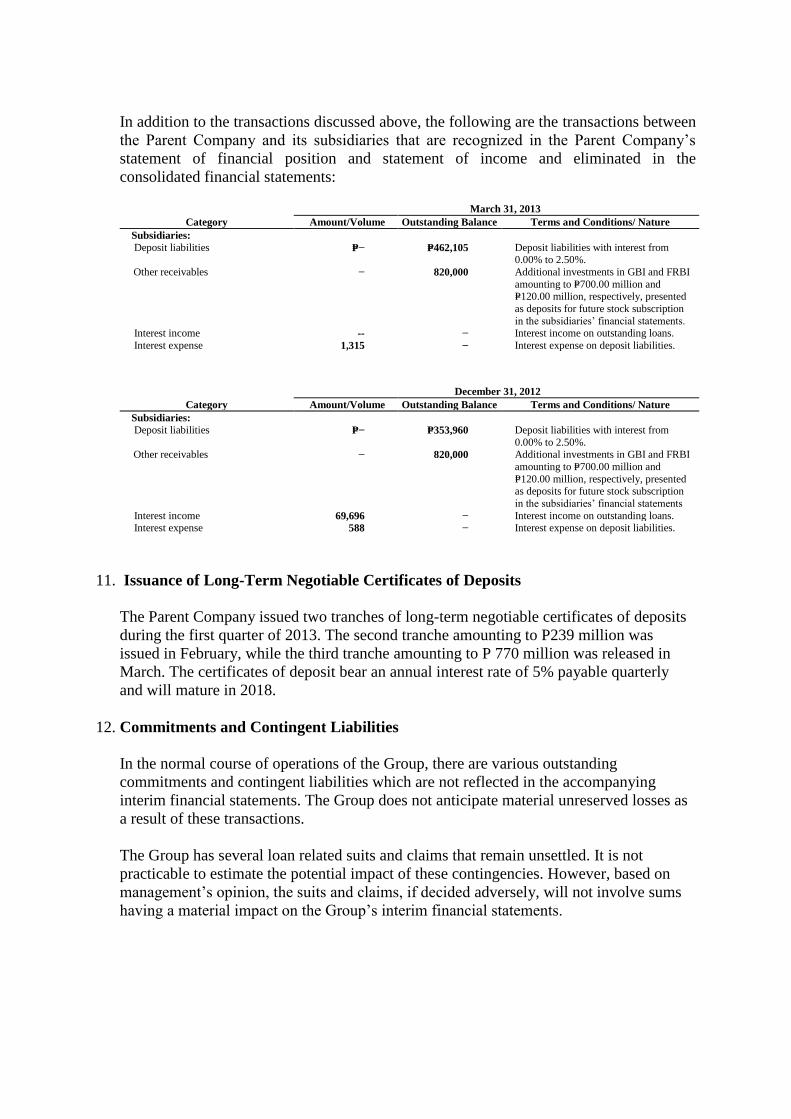
In addition to the transactions discussed above, the following are the transactions between
the Parent Company and its subsidiaries that are recognized in the Parent Company‟s
statement of financial position and statement of income and eliminated in the
consolidated financial statements: March 31, 2013
Category Amount/Volume Outstanding Balance Terms and Conditions/ Nature
Subsidiaries:
Deposit liabilities P=− P=462,105 Deposit liabilities with interest from 0.00% to 2.50%.
Other receivables − 820,000 Additional investments in GBI and FRBI
amounting to P=700.00 million and P=120.00 million, respectively, presented
as deposits for future stock subscription
in the subsidiaries‟ financial statements. Interest income -- − Interest income on outstanding loans.
Interest expense 1,315 − Interest expense on deposit liabilities.
December 31, 2012
Category Amount/Volume Outstanding Balance Terms and Conditions/ Nature
Subsidiaries:
Deposit liabilities P=− P=353,960 Deposit liabilities with interest from
0.00% to 2.50%. Other receivables − 820,000 Additional investments in GBI and FRBI
amounting to P=700.00 million and
P=120.00 million, respectively, presented as deposits for future stock subscription
in the subsidiaries‟ financial statements
Interest income 69,696 − Interest income on outstanding loans. Interest expense 588 − Interest expense on deposit liabilities.
11. Issuance of Long-Term Negotiable Certificates of Deposits
The Parent Company issued two tranches of long-term negotiable certificates of deposits
during the first quarter of 2013. The second tranche amounting to P239 million was
issued in February, while the third tranche amounting to P 770 million was released in
March. The certificates of deposit bear an annual interest rate of 5% payable quarterly
and will mature in 2018.
12. Commitments and Contingent Liabilities
In the normal course of operations of the Group, there are various outstanding
commitments and contingent liabilities which are not reflected in the accompanying
interim financial statements. The Group does not anticipate material unreserved losses as
a result of these transactions.
The Group has several loan related suits and claims that remain unsettled. It is not
practicable to estimate the potential impact of these contingencies. However, based on
management‟s opinion, the suits and claims, if decided adversely, will not involve sums
having a material impact on the Group‟s interim financial statements.
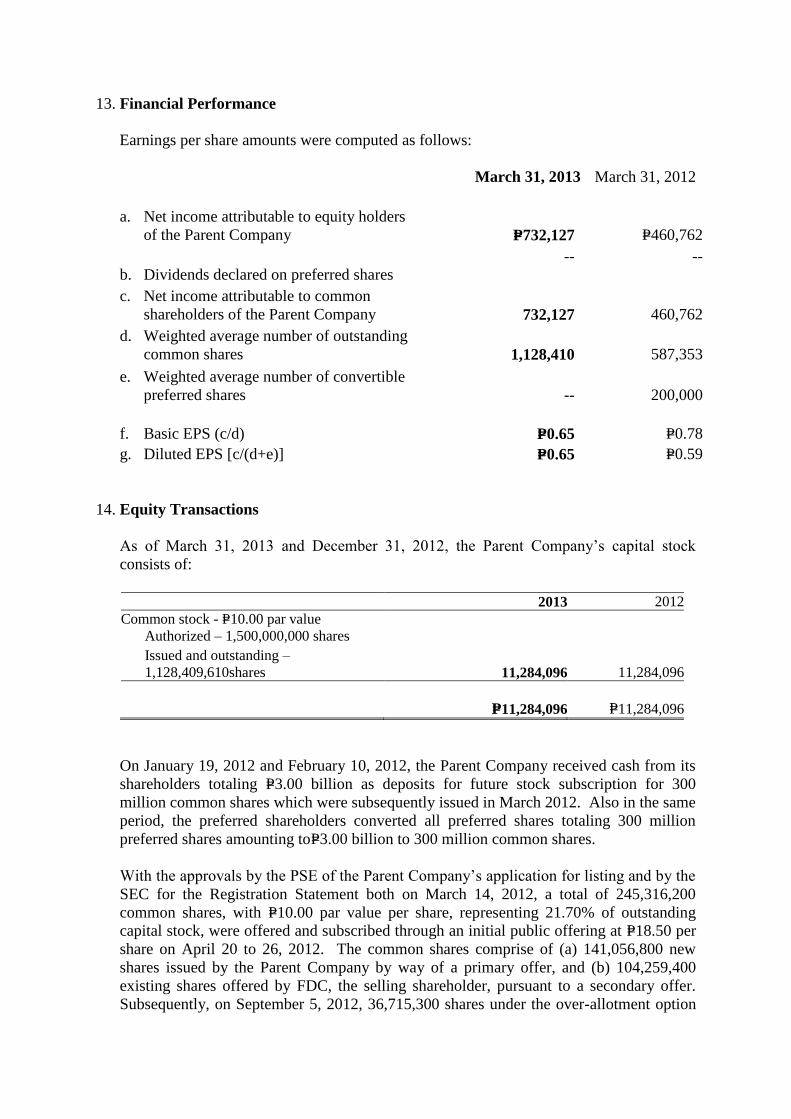
13. Financial Performance
Earnings per share amounts were computed as follows:
March 31, 2013 March 31, 2012
a. Net income attributable to equity holders
of the Parent Company P=732,127 P=460,762
b. Dividends declared on preferred shares
--
--
c. Net income attributable to common
shareholders of the Parent Company 732,127 460,762
d. Weighted average number of outstanding
common shares 1,128,410
587,353
e. Weighted average number of convertible
preferred shares
--
200,000
f. Basic EPS (c/d) P=0.65 P=0.78
g. Diluted EPS [c/(d+e)] P=0.65 P=0.59
14. Equity Transactions
As of March 31, 2013 and December 31, 2012, the Parent Company‟s capital stock
consists of:
2013 2012
Common stock - P=10.00 par value
Authorized – 1,500,000,000 shares
Issued and outstanding –
1,128,409,610shares 11,284,096 11,284,096
P=11,284,096 P=11,284,096
On January 19, 2012 and February 10, 2012, the Parent Company received cash from its
shareholders totaling P=3.00 billion as deposits for future stock subscription for 300
million common shares which were subsequently issued in March 2012. Also in the same
period, the preferred shareholders converted all preferred shares totaling 300 million
preferred shares amounting toP=3.00 billion to 300 million common shares.
With the approvals by the PSE of the Parent Company‟s application for listing and by the
SEC for the Registration Statement both on March 14, 2012, a total of 245,316,200
common shares, with P=10.00 par value per share, representing 21.70% of outstanding
capital stock, were offered and subscribed through an initial public offering at P=18.50 per
share on April 20 to 26, 2012. The common shares comprise of (a) 141,056,800 new
shares issued by the Parent Company by way of a primary offer, and (b) 104,259,400
existing shares offered by FDC, the selling shareholder, pursuant to a secondary offer.
Subsequently, on September 5, 2012, 36,715,300 shares under the over-allotment option
were exercised at a price of P=18.50 per share that brought the subscriptions to 25.00% of
the outstanding capital stock. The Parent Company‟s common shares were listed and
commenced trading in the PSE on May 7, 2012.
The total proceeds raised by the Parent Company from the sale of primary offer shares
amounted to P=2.61 billion while the net proceeds (after deduction of direct costs related to
equity issuance) amounted to P=2.39 billion.
No cash dividends were declared for the period ended March 31, 2013.
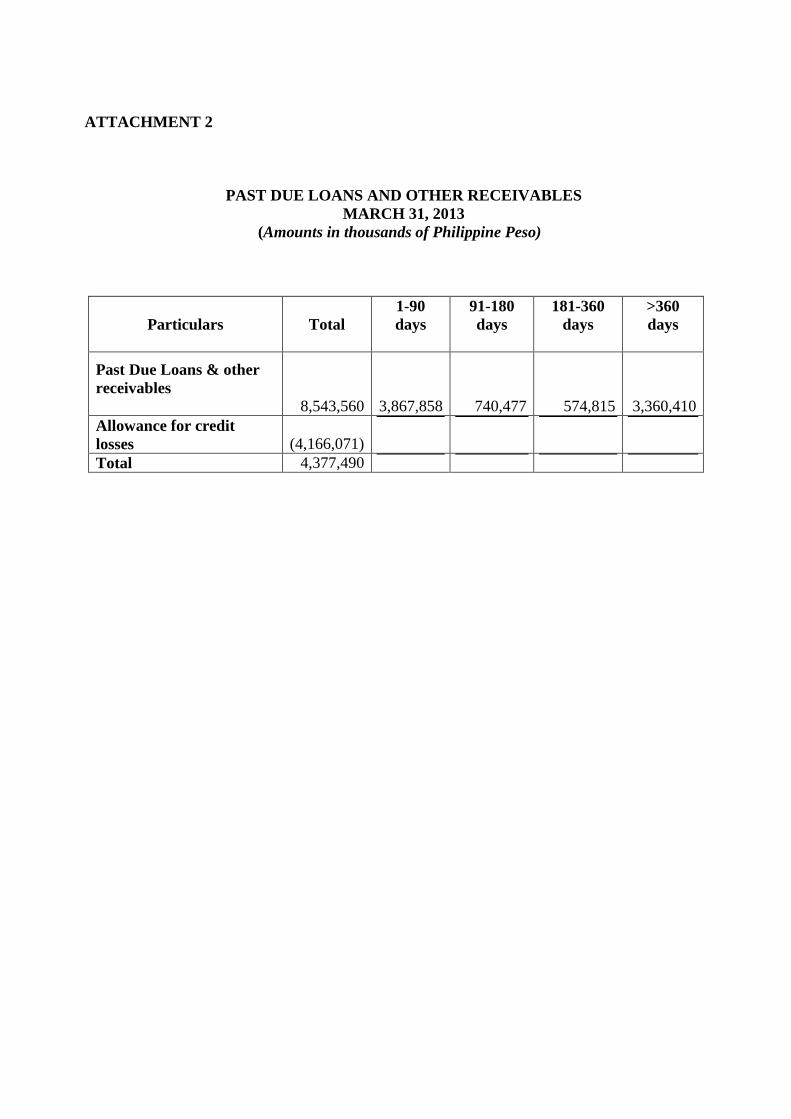
ATTACHMENT 2
PAST DUE LOANS AND OTHER RECEIVABLES
MARCH 31, 2013
(Amounts in thousands of Philippine Peso)
Particulars
Total
1-90
days
91-180
days
181-360
days
>360
days
Past Due Loans & other
receivables
8,543,560 3,867,858 740,477 574,815 3,360,410
Allowance for credit
losses (4,166,071)
Total 4,377,490
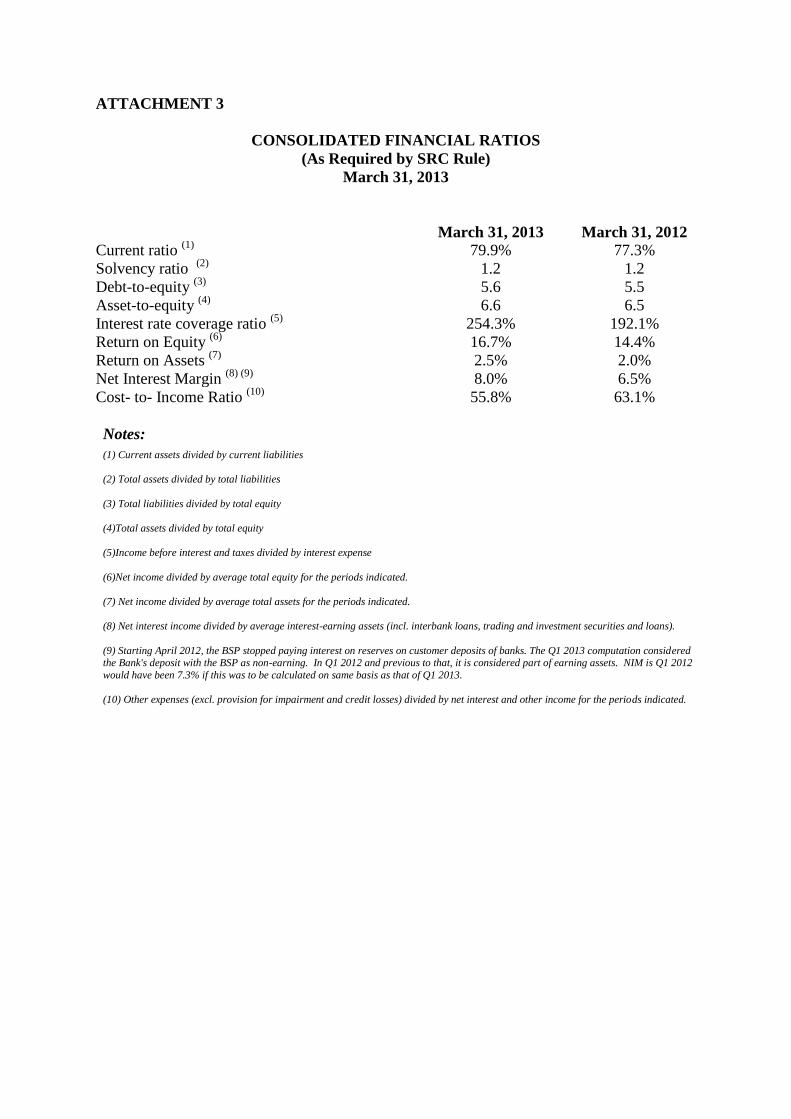
ATTACHMENT 3
CONSOLIDATED FINANCIAL RATIOS
(As Required by SRC Rule)
March 31, 2013
March 31, 2013 March 31, 2012
Current ratio (1)
79.9% 77.3%
Solvency ratio (2)
1.2 1.2
Debt-to-equity (3)
5.6 5.5
Asset-to-equity (4)
6.6 6.5
Interest rate coverage ratio (5)
254.3% 192.1%
Return on Equity (6)
16.7% 14.4%
Return on Assets (7)
2.5% 2.0%
Net Interest Margin (8) (9)
8.0% 6.5%
Cost- to- Income Ratio (10)
55.8% 63.1%
Notes:
(1) Current assets divided by current liabilities
(2) Total assets divided by total liabilities
(3) Total liabilities divided by total equity
(4)Total assets divided by total equity
(5)Income before interest and taxes divided by interest expense
(6)Net income divided by average total equity for the periods indicated.
(7) Net income divided by average total assets for the periods indicated.
(8) Net interest income divided by average interest-earning assets (incl. interbank loans, trading and investment securities and loans).
(9) Starting April 2012, the BSP stopped paying interest on reserves on customer deposits of banks. The Q1 2013 computation considered the Bank's deposit with the BSP as non-earning. In Q1 2012 and previous to that, it is considered part of earning assets. NIM is Q1 2012
would have been 7.3% if this was to be calculated on same basis as that of Q1 2013.
(10) Other expenses (excl. provision for impairment and credit losses) divided by net interest and other income for the periods indicated.