Embed Size (px)
Citation preview
The pharmacokinetics of morphine and morphine glucuronidemetabolites after subcutaneous bolus injection and subcutaneousinfusion of morphine
R. Stuart-Harris,1 S. P. Joel,2 P. McDonald,1 D. Currow1 & M. L. Slevin2
1Department of Medical Oncology and Palliative Care, Westmead Hospital, Westmead, NSW 2145, Australia and 2Department of Medical Oncology,
St Bartholomew's Hospital, London EC1A 7BE, UK.
Aims To investigate the pharmacokinetics of morphine, morphine-6-glucuronide
(M6G) and morphine-3-glucuronide (M3G) in healthy volunteers after the
administration of morphine by subcutaneous bolus injection (s.c.b.) and subcutaneous
infusion (s.c.i.) over 4 h, and to compare the results with the intravenous bolus (i.v.)
administration of morphine.
Methods Six healthy volunteers each received 5 mg morphine sulphate by i.v., s.c.b.
and short s.c.i. over 4 h, on three separate occasions, in random order, each separated
by at least 1 week. Plasma samples were assayed for morphine, M6G and M3G.
Results After i.v. morphine, the concentrations of morphine, M6G and M3G and
their pharmacokinetic parameters were similar to those we have observed previously,
in other healthy volunteers (when standardized to nmol lx 1, for a 10 mg dose to a 70
kg subject). After s.c.b. morphine, similar results were obtained except that the median
tmax values for morphine and M3G were signi®cantly longer than after i.v. morphine
(P<0.001 and P<0.05, respectively), with a trend to a longer tmax for M6G
(P =0.09). The appearance half-lives after s.c.b. morphine for M6G and M3G were
also signi®cantly longer than after i.v. morphine (P =0.03 and P<0.05, respectively).
Comparison of log-transformed AUC values indicated that i.v. and s.c.b.
administration of morphine were bioequivalent with respect to morphine, M6G
and M3G. In comparison with i.v. morphine, morphine by s.c.i. was associated with
signi®cantly longer median tmax values for morphine (P<0.001), M6G (P<0.001) and
M3G (P<0.05), and the mean standardized Cmax values signi®cantly lower than after
both i.v. and s.c.b. morphine (morphine P<0.001, M6G P<0.001 and M3G P<0.01
for each comparison). Comparison of log-transformed AUC values after i.v. and s.c.i.
morphine indicated that the two routes were not bioequivalent for morphine (log-
transformed AUC ratio 0.78, 90% CI 0.66±0.93), M6G (0.72, 90% CI 0.63±0.82), or
M3G (0.65, 90% CI 0.54±0.78). A small stability study indicated no evidence of
adsorptive losses from morphine infused over 4 h using the infusion devices from the
study.
Conclusions Although bioequivalence was demonstrated between the s.c.b. and i.v.
routes of morphine administration, the bioavailabilities of morphine, M6G and M3G
after s.c.i. were signi®cantly lower than after i.v. administration. However, despite this,
the study demonstrates that the subcutaneous route is an effective method for the
parenteral administration of morphine.
Keywords: infusion, morphine-3-glucuronide (M3G), morphine-6-glucuronide
(M6G), morphine, pharmacokinetics, subcutaneous
Correspondence: A Professor R. Stuart-Harris, Medical Oncology Unit, The Canberra
Hospital, Woden, ACT 2606, Australia. E-mail: [email protected]
Received December 1998, accepted 18 November 1999.
f 2000 Blackwell Science Ltd Br J Clin Pharmacol, 49, 207±214 207
Introduction
Pain is one of the commonest symptoms in patients with
advanced cancer and more than 70% of patients with
advanced cancer experience pain at some stage of their
disease. Pain is usually treated according to recommenda-
tions made by the World Health Organization [1], which,
in 1986 proposed an analgesic ladder for the treatment of
pain associated with advanced cancer. Morphine is the
drug of choice in the treatment of patients with moderate
or severe pain associated with their malignancy. Morphine
is usually given orally, either in solution as an immediate
release preparation, or in tablet form as a controlled-release
preparation. However, in those patients unable to
swallow, it can also be given parenterally. In recent
years, the subcutaneous (s.c.) route has been demonstrated
to be an effective and well tolerated method of parenteral
administration of morphine. When given subcutaneously,
it may either be given by 4 hourly s.c. bolus (s.c.b.)
injection through an indwelling needle placed subcuta-
neously or as a s.c. infusion (s.c.i.) over 4 h or longer,
delivered by an external infusion pump. We have shown
previously that the s.c. administration of morphine may be
associated with a reduction in nausea and vomiting
compared with oral administration [2]. S.c. morphine can
usually be administered by relatives and carers, enabling
terminally ill patients to be looked after at home rather
than being hospitalized, offering another advantage to
patients with advanced cancer.
Following oral administration, morphine is absorbed in
the upper bowel and metabolized extensively in the liver.
The two principal metabolites are morphine-6-glucur-
onide (M6G) and morphine-3-glucuronide (M3G). In
animal models M6G has been shown to produce potent
antinociception [3, 4], while a phase I study of M6G in 19
cancer patients noted analgesia in 17 assessable patients [5].
Subsequent studies have con®rmed this analgesic activity,
with the suggestion that M6G may be less toxic than
morphine at equi-analgesic doses [6, 7]. In contrast, M3G
appears to have little or no m-opioid agonist properties [8]
and no analgesic activity [9], and recent evidence from
animal studies has suggested that M3G may functionally
antagonize the analgesic and respiratory depressant effects
of morphine [10, 11] and M6G [10].
Our group has previously studied the pharmacokinetics
of morphine and these two glucuronide metabolites after
sublingual, buccal, oral and i.v. administration of
morphine [12]. This work clearly demonstrated the
importance of the two glucuronide metabolites of
morphine, particularly M6G. In view of the increasing
use of s.c. morphine, we have extended our previous
examination of morphine and its glucuronide metabolites
to the s.c. administration of morphine, both by s.c.b. and
short s.c.i. over 4 h.
Methods
Six healthy volunteers participated in this study. Their
mean age was 25.8 years (range 20±40 years), their mean
weight 71.4 kg (range 49.2±102.1 kg) and three were
male. Participation in the study required that each
volunteer had a normal full blood count and normal
hepatic and renal function, was not taking any regular
medications and gave written informed consent. The
volunteers received no ®nancial incentive to participate.
The study was approved by the Research and Ethics
Committee of Westmead Hospital, Sydney, Australia.
Each volunteer agreed to receive morphine sulphate
(5 mg) administered on three different occasions either by
i.v. bolus injection, by s.c.b. or by s.c.i. over 4 h. The
infusion time of 4 h for the s.c.i. was chosen to allow
comparability between the doses examined. Each admin-
istration was separated by a washout period of at least 1
week. The order of the method of administration was
randomised for each volunteer.
When morphine was administered s.c., either by s.c.b.
or s.c.i., it was given into the s.c. tissues of the upper arm
through a butter¯y needle (Terumo 25G, 9 cm tube)
placed subcutaneously. For the s.c.i., 5 mg morphine were
diluted in normal saline to a total volume of 10 ml and
placed in a syringe in an external syringe driver (Infusis
Medis, Italy), programmed to deliver the 10 ml of the
resulting solution over a 4 h period. The syringe driver
was connected to the butter¯y needle placed subcuta-
neously in the upper forearm. The 9 cm lead of the
butter¯y needle was primed with a solution of morphine,
prepared in an identical manner to that placed in the
syringe driver.
Blood samples (10 ml) were collected into lithium
heparin tubes through an i.v. cannula placed in the upper
forearm at 0 h (immediately prior to dosing), and then at
0.08, 0.17, 0.25, 0.50, 1.0, 1.5, 2.0, 2.5, 3.0, 3.5, 4.0, 5.0,
6.0, 8.0, 10.0 and 12.0 h following each administration of
morphine. Samples were taken from the opposite forearm
to that used for the administration of morphine. After each
sample was taken the cannula was locked with 1 ml of
heparinized saline. For each blood sample withdrawn, the
®rst 2 ml of blood withdrawn was taken into a separate
syringe and discarded.
Thirty minutes after collection, blood samples were
separated by centrifugation and plasma stored at x 40uC.
The frozen samples were subsequently air freighted in a
refrigerated container to London, for analysis. Plasma
concentrations of morphine, M6G and M3G were
determined using an h.p.l.c. procedure involving solid
phase extraction, followed by reverse phase ion-paired
chromatography with electrochemical and ¯uorescence
detection [13]. Brie¯y, 750ml of plasma were buffered
with 2.25 ml 500 mM ammonium sulphate, pH 9.3, and
R. Stuart-Harris et al.
208 f 2000 Blackwell Science Ltd Br J Clin Pharmacol, 49, 207±214
applied to a 100 mg C8 Bond-Elut cartridge (Anachem,
Luton, UK), which had been preconditioned with
methanol, eluant (10 mM sodium dihydrogen phosphate,
pH 2.1, with 10% acetonitrile), and water. After washing
with 5 mM ammonium sulphate, pH 9.3, compounds of
interest were eluted with 800ml eluant and 200ml injected
into the h.p.l.c. system. Separation was achieved by reverse
phase ion-paired chromatography with electrochemical
detection for morphine and M6G and ¯uorescence
detection for M3G. Limits of quanti®cation for this
assay were 2 nmol lx 1 for morphine and M6G, and
20 nmol lx 1 for M3G. Reproducibility of quality control
samples at three levels (low 20 nmol lx 1 for morphine and
M6G, 200 nmol lx 1 for M3G; medium 100 nmol lx 1 for
morphine and M6G, 1000 nmol lx 1 for M3G; high
200 nmol lx 1 for morphine and M6G, 2000 nmol lx 1
for M3G) analysed with the study samples was <10% for
morphine and <12% for M3G at each level.
Morphine stability
A small stability study was conducted to investigate the
stability of morphine in the infusion devices used. Brie¯y,
morphine was made up to 0.5 mg mlx 1 in saline, and
drawn up into a 10 ml syringe, which was connected to a
butter¯y needle (Terumo 25G, 9 cm tube). At regular
intervals, 0.5 ml of solution were dispensed from the
syringe, immediately diluted down to a concentration of
200 ng mlx 1 and morphine concentration quanti®ed by
h.p.l.c. This experiment was repeated in quadruplicate.
Pharmacokinetic analysis
Pharmacokinetic parameters were determined using
PHARMKIT, an interactive pharmacokinetic analysis
program [14]. The absortion half-life of morphine or the
appearance half-life of M3G and M6G was determined
from the initial slope. The area under the concentration-
time curve (AUC) was determined by the trapezoidal
method, and extrapolated out to in®nity using the
concentration at Ct and the elimination rate constant
(lz). Half-life (tK,z) was calculated as 0.693 divided by lz .
The apparent volume of distribution (Vd) was calculated as
dose divided by the product of AUC(0,?) and lz and
apparent clearance (CL) as dose divided by AUC(0,?).
Pharmacokinetic parameters were standardized to a dose of
10 mg/70 kg, to facilitate comparison with published data.
Statistical analysis
All statistical analyses were performed using Minitab for
Windows (version 10, Minitab Inc, State College, PA,
USA). Comparison of pharmacokinetic parameters
between treatments was made by analysis of variance,
controlling for subjects. For data that were not normally
distributed (determined using the Shapiro-Wilk test on the
analysis of variance residuals), a nonparametric analysis of
variance (Friedman's test) was used. Where these analyses
indicated signi®cant differences (P<0.05) between treat-
ments, individual comparisons were made using the paired
t-test or Wilcoxon Signed-Ranks test for parametric and
nonparametric data, respectively.
The bioavailabilities of morphine, M6G and M3G after
s.c. administration were analysed according to recom-
mendations for bioequivalence studies [15]. AUC values
were log transformed, and the ratio (and 90% con®dence
intervals [CI]) of s.c.b. to i.v., and s.c.i. to i.v. calculated.
Limits of acceptance for bioequivalence were 0.80±1.25.
This apparent asymmetry is because the data were log-
transformed.
Results
I.v. bolus injection of morphine
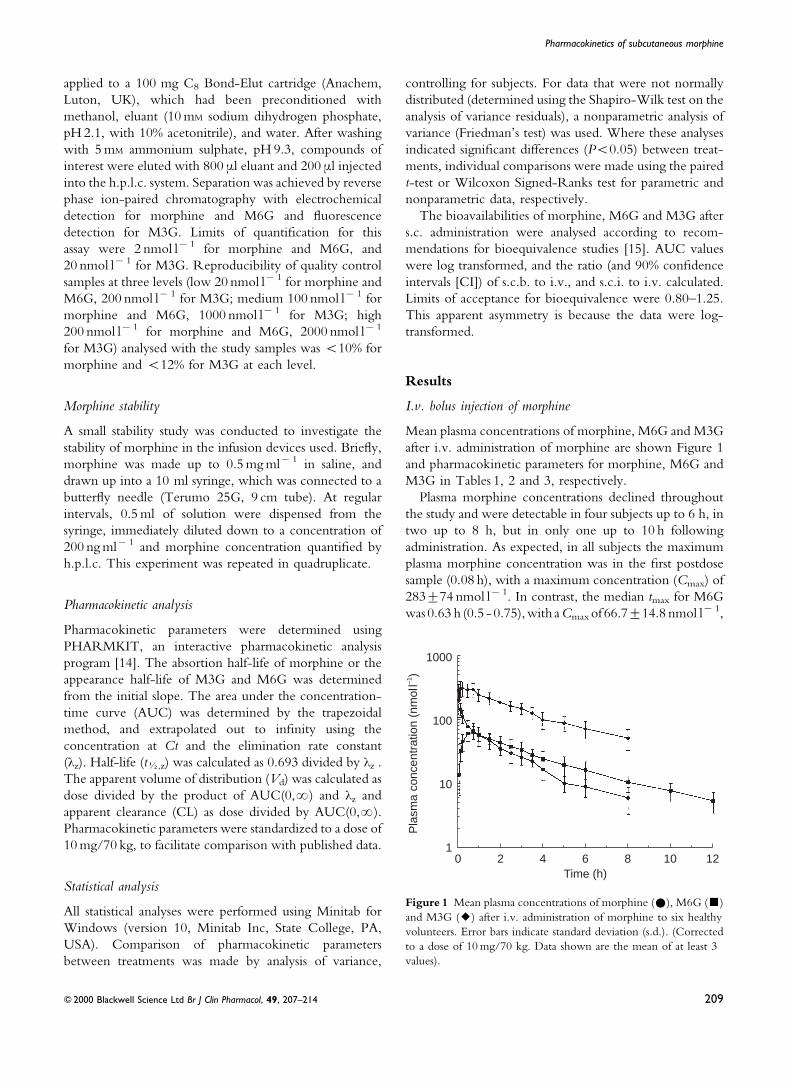
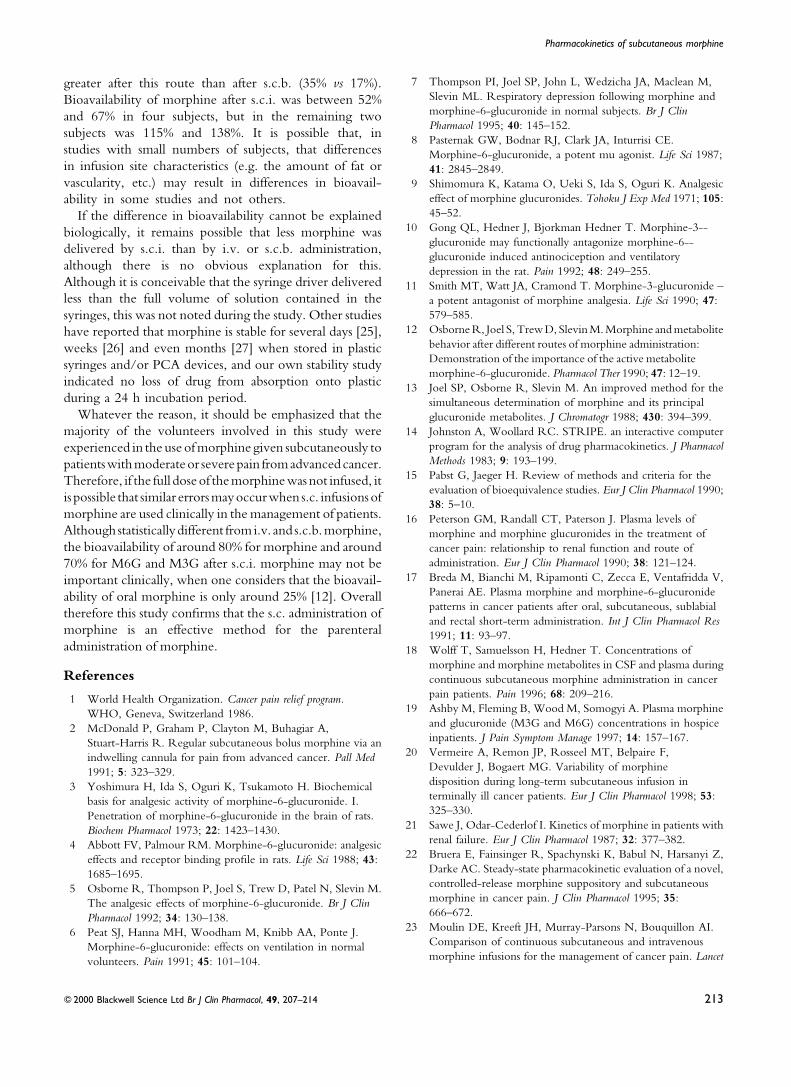
Mean plasma concentrations of morphine, M6G and M3G
after i.v. administration of morphine are shown Figure 1
and pharmacokinetic parameters for morphine, M6G and
M3G in Tables 1, 2 and 3, respectively.
Plasma morphine concentrations declined throughout
the study and were detectable in four subjects up to 6 h, in
two up to 8 h, but in only one up to 10 h following
administration. As expected, in all subjects the maximum
plasma morphine concentration was in the ®rst postdose
sample (0.08 h), with a maximum concentration (Cmax) of
283t74 nmol lx 1. In contrast, the median tmax for M6G
was0.63 h (0.5 - 0.75),with aCmax of 66.7t14.8 nmol lx 1,
Time (h)0 2 4 10
Pla
sma
conc
entr
atio
n (n
mol
l–1)
1000
100
10
16 8 12
Figure 1 Mean plasma concentrations of morphine (#), M6G (&)
and M3G (2) after i.v. administration of morphine to six healthy
volunteers. Error bars indicate standard deviation (s.d.). (Corrected
to a dose of 10 mg/70 kg. Data shown are the mean of at least 3
values).
Pharmacokinetics of subcutaneous morphine
f 2000 Blackwell Science Ltd Br J Clin Pharmacol, 49, 207±214 209
and for M3G was 0.25 h (0.17-0.25), with a Cmax of
334t75 nmol lx 1.
S.c. bolus s.c.b. injection of morphine
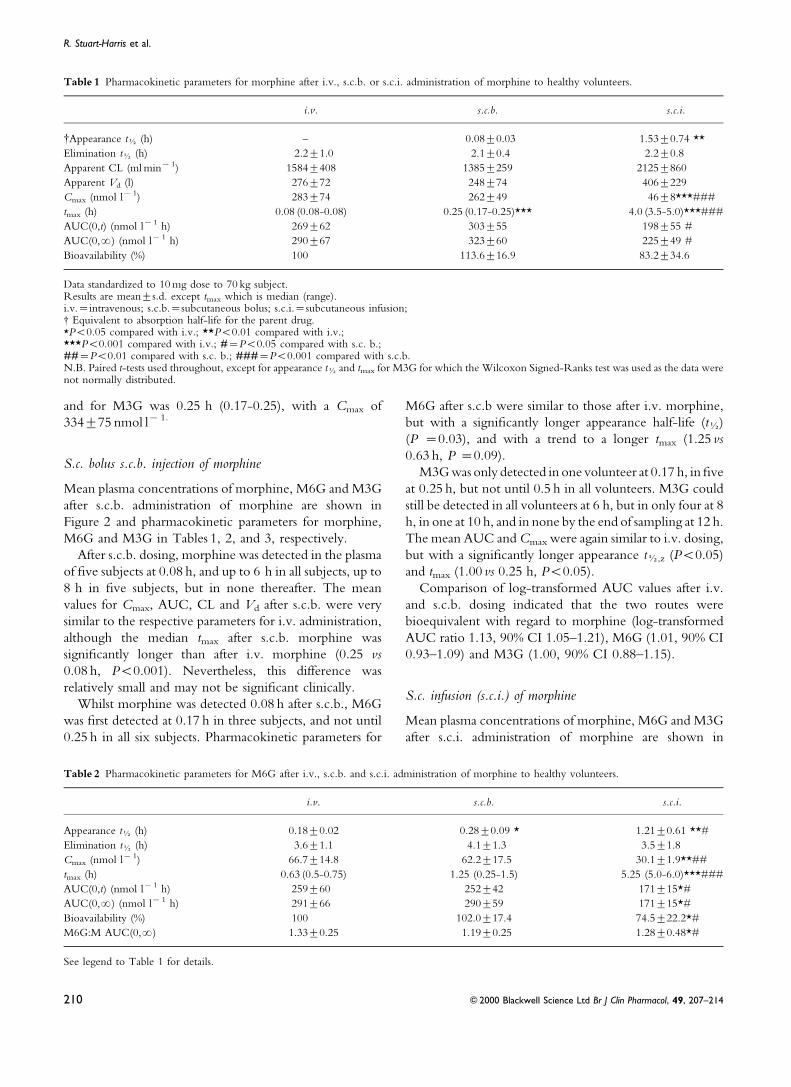
Mean plasma concentrations of morphine, M6G and M3G
after s.c.b. administration of morphine are shown in
Figure 2 and pharmacokinetic parameters for morphine,
M6G and M3G in Tables 1, 2, and 3, respectively.
After s.c.b. dosing, morphine was detected in the plasma
of ®ve subjects at 0.08 h, and up to 6 h in all subjects, up to
8 h in ®ve subjects, but in none thereafter. The mean
values for Cmax, AUC, CL and Vd after s.c.b. were very
similar to the respective parameters for i.v. administration,
although the median tmax after s.c.b. morphine was
signi®cantly longer than after i.v. morphine (0.25 vs
0.08 h, P<0.001). Nevertheless, this difference was
relatively small and may not be signi®cant clinically.
Whilst morphine was detected 0.08 h after s.c.b., M6G
was ®rst detected at 0.17 h in three subjects, and not until
0.25 h in all six subjects. Pharmacokinetic parameters for
M6G after s.c.b were similar to those after i.v. morphine,
but with a signi®cantly longer appearance half-life (tK)
(P =0.03), and with a trend to a longer tmax (1.25 vs
0.63 h, P =0.09).
M3G was only detected in one volunteer at 0.17 h, in ®ve
at 0.25 h, but not until 0.5 h in all volunteers. M3G could
still be detected in all volunteers at 6 h, but in only four at 8
h, in one at 10 h, and in none by the end of sampling at 12 h.
The mean AUC and Cmax were again similar to i.v. dosing,
but with a signi®cantly longer appearance tK,z (P<0.05)
and tmax (1.00 vs 0.25 h, P<0.05).
Comparison of log-transformed AUC values after i.v.
and s.c.b. dosing indicated that the two routes were
bioequivalent with regard to morphine (log-transformed
AUC ratio 1.13, 90% CI 1.05±1.21), M6G (1.01, 90% CI
0.93±1.09) and M3G (1.00, 90% CI 0.88±1.15).
S.c. infusion (s.c.i.) of morphine
Mean plasma concentrations of morphine, M6G and M3G
after s.c.i. administration of morphine are shown in
Table 1 Pharmacokinetic parameters for morphine after i.v., s.c.b. or s.c.i. administration of morphine to healthy volunteers.
i.v. s.c.b. s.c.i.
{Appearance tK (h) ± 0.08t0.03 1.53t0.74 **
Elimination tK (h) 2.2t1.0 2.1t0.4 2.2t0.8
Apparent CL (ml minx 1) 1584t408 1385t259 2125t860
Apparent Vd (l) 276t72 248t74 406t229
Cmax (nmol lx 1) 283t74 262t49 46t8***###
tmax (h) 0.08 (0.08-0.08) 0.25 (0.17-0.25)*** 4.0 (3.5-5.0)***###
AUC(0,t) (nmol lx 1 h) 269t62 303t55 198t55 #
AUC(0,?) (nmol lx 1 h) 290t67 323t60 225t49 #
Bioavailability (%) 100 113.6t16.9 83.2t34.6
Data standardized to 10 mg dose to 70 kg subject.Results are meants.d. except tmax which is median (range).i.v.=intravenous; s.c.b.=subcutaneous bolus; s.c.i.=subcutaneous infusion;{ Equivalent to absorption half-life for the parent drug.*P<0.05 compared with i.v.; **P<0.01 compared with i.v.;***P<0.001 compared with i.v.; #=P<0.05 compared with s.c. b.;##=P<0.01 compared with s.c. b.; ###=P<0.001 compared with s.c.b.N.B. Paired t-tests used throughout, except for appearance tK and tmax for M3G for which the Wilcoxon Signed-Ranks test was used as the data werenot normally distributed.
Table 2 Pharmacokinetic parameters for M6G after i.v., s.c.b. and s.c.i. administration of morphine to healthy volunteers.
i.v. s.c.b. s.c.i.
Appearance tK (h) 0.18t0.02 0.28t0.09 * 1.21t0.61 **#
Elimination tK (h) 3.6t1.1 4.1t1.3 3.5t1.8
Cmax (nmol lx 1) 66.7t14.8 62.2t17.5 30.1t1.9**##
tmax (h) 0.63 (0.5-0.75) 1.25 (0.25-1.5) 5.25 (5.0-6.0)***###
AUC(0,t) (nmol lx 1 h) 259t60 252t42 171t15*#
AUC(0,?) (nmol lx 1 h) 291t66 290t59 171t15*#
Bioavailability (%) 100 102.0t17.4 74.5t22.2*#
M6G:M AUC(0,?) 1.33t0.25 1.19t0.25 1.28t0.48*#
See legend to Table 1 for details.
R. Stuart-Harris et al.
210 f 2000 Blackwell Science Ltd Br J Clin Pharmacol, 49, 207±214
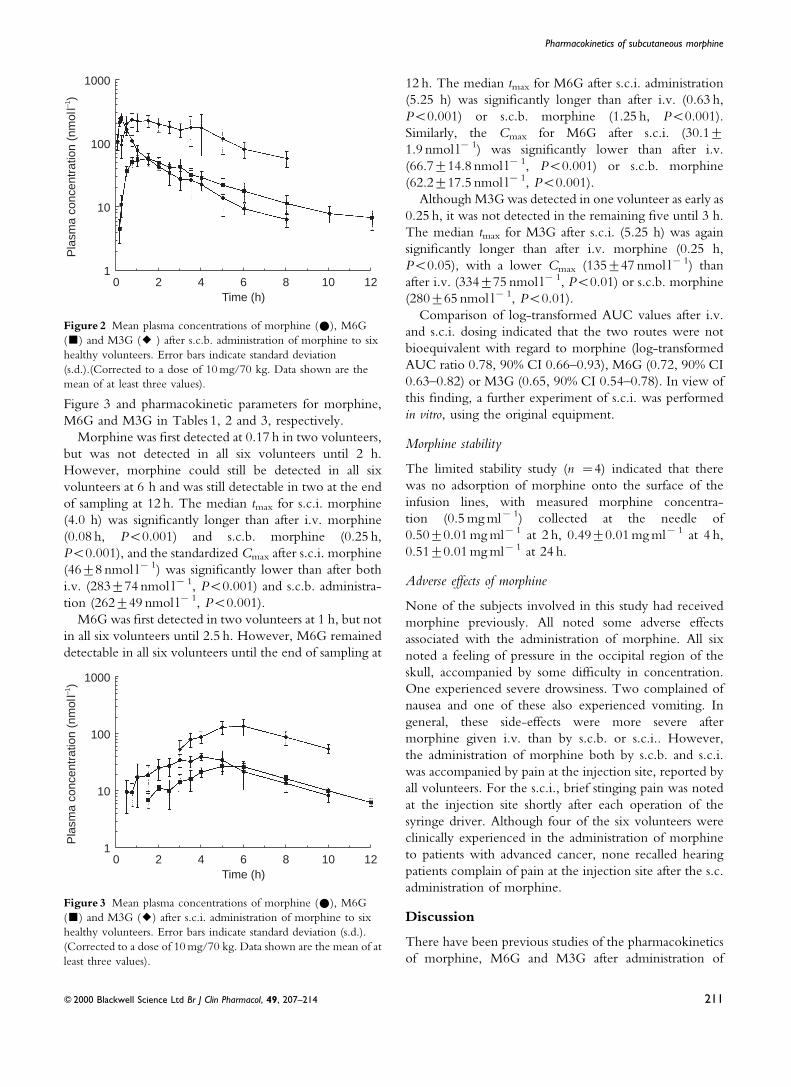
Figure 3 and pharmacokinetic parameters for morphine,
M6G and M3G in Tables 1, 2 and 3, respectively.
Morphine was ®rst detected at 0.17 h in two volunteers,
but was not detected in all six volunteers until 2 h.
However, morphine could still be detected in all six
volunteers at 6 h and was still detectable in two at the end
of sampling at 12 h. The median tmax for s.c.i. morphine
(4.0 h) was signi®cantly longer than after i.v. morphine
(0.08 h, P<0.001) and s.c.b. morphine (0.25 h,
P<0.001), and the standardized Cmax after s.c.i. morphine
(46t8 nmol lx 1) was signi®cantly lower than after both
i.v. (283t74 nmol lx 1, P<0.001) and s.c.b. administra-
tion (262t49 nmol lx 1, P<0.001).
M6G was ®rst detected in two volunteers at 1 h, but not
in all six volunteers until 2.5 h. However, M6G remained
detectable in all six volunteers until the end of sampling at
12 h. The median tmax for M6G after s.c.i. administration
(5.25 h) was signi®cantly longer than after i.v. (0.63 h,
P<0.001) or s.c.b. morphine (1.25 h, P<0.001).
Similarly, the Cmax for M6G after s.c.i. (30.1t1.9 nmol lx 1) was signi®cantly lower than after i.v.
(66.7t14.8 nmol lx 1, P<0.001) or s.c.b. morphine
(62.2t17.5 nmol lx 1, P<0.001).
Although M3G was detected in one volunteer as early as
0.25 h, it was not detected in the remaining ®ve until 3 h.
The median tmax for M3G after s.c.i. (5.25 h) was again
signi®cantly longer than after i.v. morphine (0.25 h,
P<0.05), with a lower Cmax (135t47 nmol lx 1) than
after i.v. (334t75 nmol lx 1, P<0.01) or s.c.b. morphine
(280t65 nmol lx 1, P<0.01).
Comparison of log-transformed AUC values after i.v.
and s.c.i. dosing indicated that the two routes were not
bioequivalent with regard to morphine (log-transformed
AUC ratio 0.78, 90% CI 0.66±0.93), M6G (0.72, 90% CI
0.63±0.82) or M3G (0.65, 90% CI 0.54±0.78). In view of
this ®nding, a further experiment of s.c.i. was performed
in vitro, using the original equipment.
Morphine stability
The limited stability study (n =4) indicated that there
was no adsorption of morphine onto the surface of the
infusion lines, with measured morphine concentra-
tion (0.5 mg mlx 1) collected at the needle of
0.50t0.01 mg mlx 1 at 2 h, 0.49t0.01 mg mlx 1 at 4 h,
0.51t0.01 mg mlx 1 at 24 h.
Adverse effects of morphine
None of the subjects involved in this study had received
morphine previously. All noted some adverse effects
associated with the administration of morphine. All six
noted a feeling of pressure in the occipital region of the
skull, accompanied by some dif®culty in concentration.
One experienced severe drowsiness. Two complained of
nausea and one of these also experienced vomiting. In
general, these side-effects were more severe after
morphine given i.v. than by s.c.b. or s.c.i.. However,
the administration of morphine both by s.c.b. and s.c.i.
was accompanied by pain at the injection site, reported by
all volunteers. For the s.c.i., brief stinging pain was noted
at the injection site shortly after each operation of the
syringe driver. Although four of the six volunteers were
clinically experienced in the administration of morphine
to patients with advanced cancer, none recalled hearing
patients complain of pain at the injection site after the s.c.
administration of morphine.
Discussion
There have been previous studies of the pharmacokinetics
of morphine, M6G and M3G after administration of
Time (h)0 2 4 10
Pla
sma
conc
entr
atio
n (n
mol
l–1) 1000
100
10
16 8 12
Figure 3 Mean plasma concentrations of morphine (#), M6G
(&) and M3G (2) after s.c.i. administration of morphine to six
healthy volunteers. Error bars indicate standard deviation (s.d.).
(Corrected to a dose of 10 mg/70 kg. Data shown are the mean of at
least three values).
Time (h)0 2 4 10
Pla
sma
conc
entr
atio
n (n
mol
l–1)
1000
100
10
16 8 12
Figure 2 Mean plasma concentrations of morphine (#), M6G
(&) and M3G (2 ) after s.c.b. administration of morphine to six
healthy volunteers. Error bars indicate standard deviation
(s.d.).(Corrected to a dose of 10 mg/70 kg. Data shown are the
mean of at least three values).
Pharmacokinetics of subcutaneous morphine
f 2000 Blackwell Science Ltd Br J Clin Pharmacol, 49, 207±214 211
morphine by various different routes, either in healthy
volunteers [12] or in patients [16±20]. However, despite
the widespread use of the s.c. route for the parenteral
administration of morphine, the current study is the ®rst
which has examined the concentrations of morphine and
its glucuronide metabolites and their pharmacokinetic
parameters after i.v., s.c.b. and short s.c.i. of morphine in
the same group of healthy volunteers. Although the
principal aim of this study was to investigate the
pharmacokinetics of morphine given either by s.c.b. or
short s.c.i., the i.v. route was included to enable
comparison with previous data, and to permit the
determination of absolute bioavailability.
The log-transformed data indicated that the s.c.b. route
of morphine administration was bioequivalent to the i.v.
route. The mean Cmax values for morphine (Table 1),
M6G and M3G, and the mean standardized AUCs for
each were similar to those achieved after i.v. morphine,
indicating that absorption from the administration site was
both rapid and complete, and that the parent drug was
metabolized in the same way as after i.v. dosing. As
anticipated, the median tmax values for morphine and M3G
were signi®cantly longer than after i.v. morphine (with a
trend to a longer tmax for M6G).
When comparing s.c.i. with i.v. administration, log-
transformed data indicated that the two routes were not
bioequivalent for morphine, M6G or M3G, although for
morphine this was not apparent from the measured,
untransformed AUC and bioavailability values. As would
be anticipated, the mean Cmax values for morphine, M6G
and M3G were signi®cantly lower and the median tmax
values for each signi®cantly longer than after i.v.
morphine, differences also apparent when comparing
s.c.i. and s.c.b.. For measured AUC, there was also a
signi®cant difference between s.c.i. and s.c.b..
The results obtained for i.v. morphine in the current
study (after conversion to nmol lx 1, for a 10 mg dose
administered to a 70 kg volunteer) are very similar to those
we have published previously [12], and are in agreement
with data from studies in cancer patients. In cancer patients
given i.v. morphine 1 week after abdominal surgery Sawe
et al. [21] reported values of 4.0t2.3 l kgx 1 for volume of
distribution, 28.0t5.6 ml minx 1 kgx 1 for total plasma
clearance and 1.7t0.8 h for elimination half-life. Res-
pective values in the current study after i.v. morphine
were 4.0t1.3 l kgx 1 for volume of distribution,
22.6t5.3 ml minx 1 kgx 1 for clearance and 2.1t1.0 h
for half-life. In a study investigating subcutaneous
morphine infusions in cancer pain, Bruera et al. [22]
reported a total plasma clearance of 1600t300 ml minx 1,
compared with 1383t257 ml minx 1 in the current study,
when corrected for bioavailability.
This is the ®rst formal demonstration of the bio-
equivalence of s.c.b. and i.v. morphine with regard
to morphine, M6G and M3G, in healthy subjects. The
data suggest that the two routes should be equivalent with
regard to their pharmacodynamic effects, although it is likely
that circulating morphine concentrations would have been
higher immediately after the i.v. boluswas completed thanat
the ®rst sampling point at 0.08 h, and these early high
concentrations may in¯uence penetration into the brain.
However, the data suggest that the bioavailability of
morphine after s.c.i. was less than after i.v. or s.c.b.
administration, and this was unexpected. This could be
due to failure to deliver the full dose, or reduced
absorption of administered morphine when given by
prolonged infusion. It is unlikely that these observations
were due to assay errors as the decrease in morphine
AUC was also apparent for M6G and M3G, again
suggesting that less morphine reached the systemic
circulation after s.c.i.. Although it is possible that the
4 h infusion may have resulted in protracted absorption
from the administration site, this was not apparent from
the morphine tmax which was 4.0 h. A previous study
which compared i.v. and s.c. infusions of hydromor-
phone reported an estimated bioavailability of 78% with
s.c. administration [23], but a similar study with
continuous i.v. and s.c. infusions of morphine found
no difference in serum morphine concentrations at 6,
12, 18, or 24 h [24]. Although bioavailability was
signi®cantly reduced after s.c.i. in the current study, it is
noteworthy that variability in bioavailability was much
i.v. s.c.b s.c.i
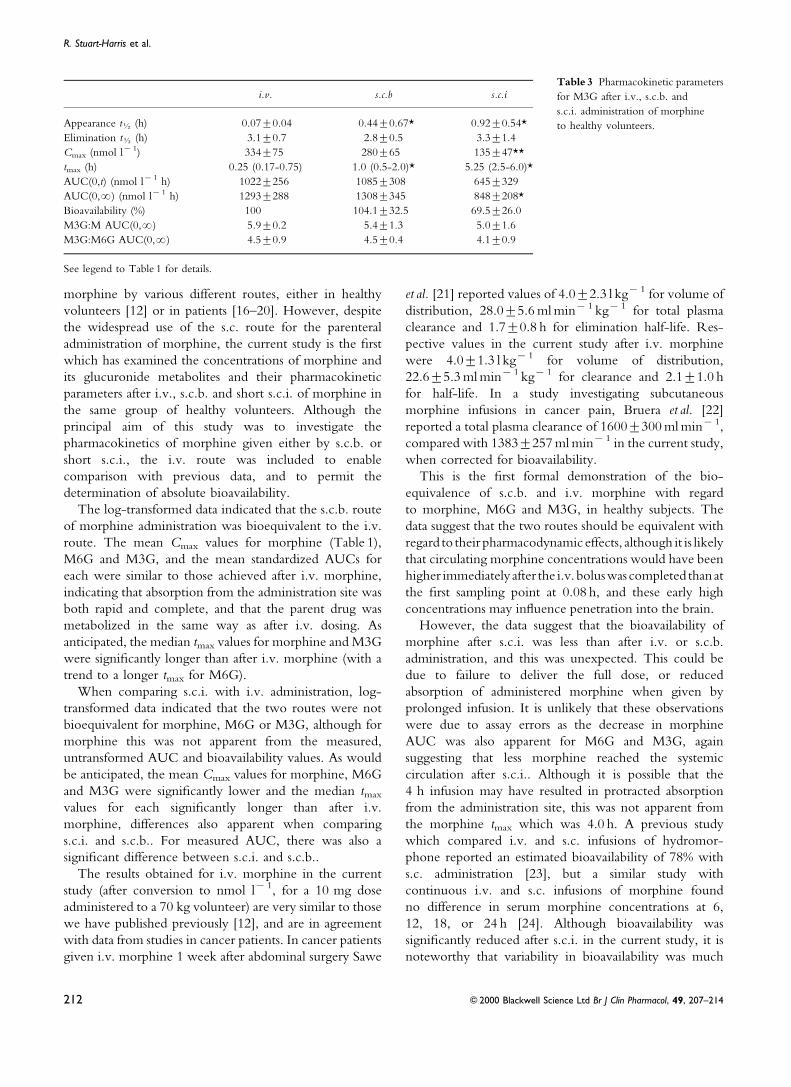
Appearance tK (h) 0.07t0.04 0.44t0.67* 0.92t0.54*
Elimination tK (h) 3.1t0.7 2.8t0.5 3.3t1.4
Cmax (nmol lx 1) 334t75 280t65 135t47**
tmax (h) 0.25 (0.17-0.75) 1.0 (0.5-2.0)* 5.25 (2.5-6.0)*
AUC(0,t) (nmol lx 1 h) 1022t256 1085t308 645t329
AUC(0,?) (nmol lx 1 h) 1293t288 1308t345 848t208*
Bioavailability (%) 100 104.1t32.5 69.5t26.0
M3G:M AUC(0,?) 5.9t0.2 5.4t1.3 5.0t1.6
M3G:M6G AUC(0,?) 4.5t0.9 4.5t0.4 4.1t0.9
See legend to Table 1 for details.
Table 3 Pharmacokinetic parameters
for M3G after i.v., s.c.b. and
s.c.i. administration of morphine
to healthy volunteers.
R. Stuart-Harris et al.
212 f 2000 Blackwell Science Ltd Br J Clin Pharmacol, 49, 207±214
greater after this route than after s.c.b. (35% vs 17%).
Bioavailability of morphine after s.c.i. was between 52%
and 67% in four subjects, but in the remaining two
subjects was 115% and 138%. It is possible that, in
studies with small numbers of subjects, that differences
in infusion site characteristics (e.g. the amount of fat or
vascularity, etc.) may result in differences in bioavail-
ability in some studies and not others.
If the difference in bioavailability cannot be explained
biologically, it remains possible that less morphine was
delivered by s.c.i. than by i.v. or s.c.b. administration,
although there is no obvious explanation for this.
Although it is conceivable that the syringe driver delivered
less than the full volume of solution contained in the
syringes, this was not noted during the study. Other studies
have reported that morphine is stable for several days [25],
weeks [26] and even months [27] when stored in plastic
syringes and/or PCA devices, and our own stability study
indicated no loss of drug from absorption onto plastic
during a 24 h incubation period.
Whatever the reason, it should be emphasized that the
majority of the volunteers involved in this study were
experienced in the use of morphine given subcutaneously to
patientswithmoderateor severepain fromadvancedcancer.
Therefore, if the full doseof themorphinewasnot infused, it
is possible that similar errorsmayoccurwhen s.c. infusionsof
morphine are used clinically in the management of patients.
Although statisticallydifferent fromi.v. and s.c.b.morphine,
the bioavailability of around 80% for morphine and around
70% for M6G and M3G after s.c.i. morphine may not be
important clinically, when one considers that the bioavail-
ability of oral morphine is only around 25% [12]. Overall
therefore this study con®rms that the s.c. administration of
morphine is an effective method for the parenteral
administration of morphine.
References
1 World Health Organization. Cancer pain relief program.
WHO, Geneva, Switzerland 1986.
2 McDonald P, Graham P, Clayton M, Buhagiar A,
Stuart-Harris R. Regular subcutaneous bolus morphine via an
indwelling cannula for pain from advanced cancer. Pall Med
1991; 5: 323±329.
3 Yoshimura H, Ida S, Oguri K, Tsukamoto H. Biochemical
basis for analgesic activity of morphine-6-glucuronide. I.
Penetration of morphine-6-glucuronide in the brain of rats.
Biochem Pharmacol 1973; 22: 1423±1430.
4 Abbott FV, Palmour RM. Morphine-6-glucuronide: analgesic
effects and receptor binding pro®le in rats. Life Sci 1988; 43:
1685±1695.
5 Osborne R, Thompson P, Joel S, Trew D, Patel N, Slevin M.
The analgesic effects of morphine-6-glucuronide. Br J Clin
Pharmacol 1992; 34: 130±138.
6 Peat SJ, Hanna MH, Woodham M, Knibb AA, Ponte J.
Morphine-6-glucuronide: effects on ventilation in normal
volunteers. Pain 1991; 45: 101±104.
7 Thompson PI, Joel SP, John L, Wedzicha JA, Maclean M,
Slevin ML. Respiratory depression following morphine and
morphine-6-glucuronide in normal subjects. Br J Clin
Pharmacol 1995; 40: 145±152.
8 Pasternak GW, Bodnar RJ, Clark JA, Inturrisi CE.
Morphine-6-glucuronide, a potent mu agonist. Life Sci 1987;
41: 2845±2849.
9 Shimomura K, Katama O, Ueki S, Ida S, Oguri K. Analgesic
effect of morphine glucuronides. Tohoku J Exp Med 1971; 105:
45±52.
10 Gong QL, Hedner J, Bjorkman Hedner T. Morphine-3--
glucuronide may functionally antagonize morphine-6--
glucuronide induced antinociception and ventilatory
depression in the rat. Pain 1992; 48: 249±255.
11 Smith MT, Watt JA, Cramond T. Morphine-3-glucuronide ±
a potent antagonist of morphine analgesia. Life Sci 1990; 47:
579±585.
12 Osborne R, Joel S, Trew D, Slevin M. Morphine and metabolite
behavior after different routes of morphine administration:
Demonstration of the importance of the active metabolite
morphine-6-glucuronide. Pharmacol Ther 1990; 47: 12±19.
13 Joel SP, Osborne R, Slevin M. An improved method for the
simultaneous determination of morphine and its principal
glucuronide metabolites. J Chromatogr 1988; 430: 394±399.
14 Johnston A, Woollard RC. STRIPE. an interactive computer
program for the analysis of drug pharmacokinetics. J Pharmacol
Methods 1983; 9: 193±199.
15 Pabst G, Jaeger H. Review of methods and criteria for the
evaluation of bioequivalence studies. Eur J Clin Pharmacol 1990;
38: 5±10.
16 Peterson GM, Randall CT, Paterson J. Plasma levels of
morphine and morphine glucuronides in the treatment of
cancer pain: relationship to renal function and route of
administration. Eur J Clin Pharmacol 1990; 38: 121±124.
17 Breda M, Bianchi M, Ripamonti C, Zecca E, Ventafridda V,
Panerai AE. Plasma morphine and morphine-6-glucuronide
patterns in cancer patients after oral, subcutaneous, sublabial
and rectal short-term administration. Int J Clin Pharmacol Res
1991; 11: 93±97.
18 Wolff T, Samuelsson H, Hedner T. Concentrations of
morphine and morphine metabolites in CSF and plasma during
continuous subcutaneous morphine administration in cancer
pain patients. Pain 1996; 68: 209±216.
19 Ashby M, Fleming B, Wood M, Somogyi A. Plasma morphine
and glucuronide (M3G and M6G) concentrations in hospice
inpatients. J Pain Symptom Manage 1997; 14: 157±167.
20 Vermeire A, Remon JP, Rosseel MT, Belpaire F,
Devulder J, Bogaert MG. Variability of morphine
disposition during long-term subcutaneous infusion in
terminally ill cancer patients. Eur J Clin Pharmacol 1998; 53:
325±330.
21 Sawe J, Odar-Cederlof I. Kinetics of morphine in patients with
renal failure. Eur J Clin Pharmacol 1987; 32: 377±382.
22 Bruera E, Fainsinger R, Spachynski K, Babul N, Harsanyi Z,
Darke AC. Steady-state pharmacokinetic evaluation of a novel,
controlled-release morphine suppository and subcutaneous
morphine in cancer pain. J Clin Pharmacol 1995; 35:
666±672.
23 Moulin DE, Kreeft JH, Murray-Parsons N, Bouquillon AI.
Comparison of continuous subcutaneous and intravenous
morphine infusions for the management of cancer pain. Lancet
Pharmacokinetics of subcutaneous morphine
f 2000 Blackwell Science Ltd Br J Clin Pharmacol, 49, 207±214 213
1991; 337: 465±468.
24 Waldmann CS, Eason JR, Rambohul E, Hanson GC. Serum
morphine levels. A comparison between continuous
subcutaneous and continuous intravenous infusion in
postoperative patients. Anaesthesia 1984; 39: 768±771.
25 Bray RJ, Davies PA, Seviour JA. The stability of
preservative-free morphine in plastic syringes. Anaesthesia
1986; 41: 294±295.
26 Strong ML, Scaaf LJ, Pankaskie MC, Robinson DH.
Shelf-lives and factors affecting the stability of morphine
sulphate and meperidine (pethidine) hydrochloride in plastic
syringes for use in patient- controlled analgesic devices. J Clin
Pharm Ther 1994; 19: 361±369.
27 Roos PJ, Glerum JH, Meilink JW. Stability of morphine
hydrochloride in a portable pump reservoir. Pharm Weekbl Sci
1992; 14: 23±26.
R. Stuart-Harris et al.
214 f 2000 Blackwell Science Ltd Br J Clin Pharmacol, 49, 207±214