Embed Size (px)
Citation preview

www.efpia.eu
The Pharmaceutical Industry in FiguresKey Data 2017
EFPIA Key Data | 2017
2
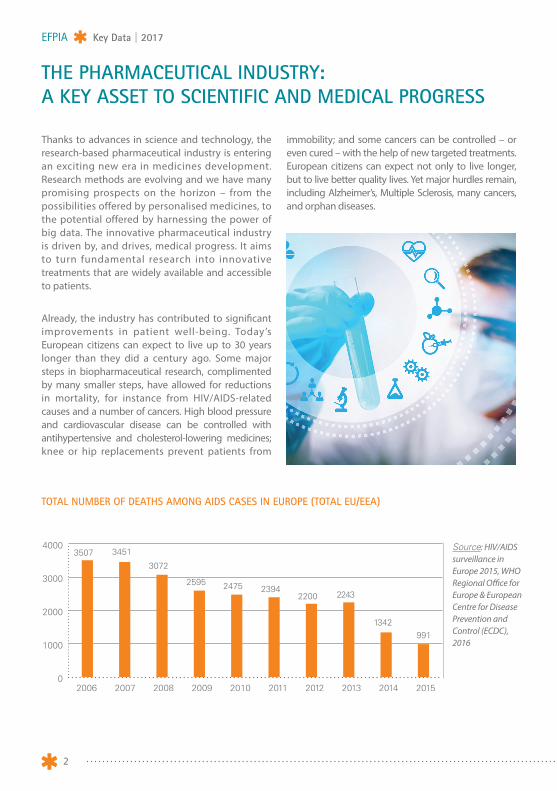
THE PHARMACEUTICAL INDUSTRY: A KEY ASSET TO SCIENTIFIC AND MEDICAL PROGRESS
Thanks to advances in science and technology, the research-based pharmaceutical industry is entering an exciting new era in medicines development. Research methods are evolving and we have many promising prospects on the horizon – from the possibilities offered by personalised medicines, to the potential offered by harnessing the power of big data. The innovative pharmaceutical industry is driven by, and drives, medical progress. It aims to turn fundamental research into innovative treatments that are widely available and accessible to patients.
Already, the industry has contributed to significant improvements in patient well-being. Today’s European citizens can expect to live up to 30 years longer than they did a century ago. Some major steps in biopharmaceutical research, complimented by many smaller steps, have allowed for reductions in mortality, for instance from HIV/AIDS-related causes and a number of cancers. High blood pressure and cardiovascular disease can be controlled with antihypertensive and cholesterol-lowering medicines; knee or hip replacements prevent patients from
immobility; and some cancers can be controlled – or even cured – with the help of new targeted treatments. European citizens can expect not only to live longer, but to live better quality lives. Yet major hurdles remain, including Alzheimer’s, Multiple Sclerosis, many cancers, and orphan diseases.
Source: HIV/AIDS surveillance in Europe 2015, WHO Regional Office for Europe & European Centre for Disease Prevention and Control (ECDC), 2016
TOTAL NUMBER OF DEATHS AMONG AIDS CASES IN EUROPE (TOTAL EU/EEA)
2006 2007 2008 2009 2010 2011 2012 2013 2014 20150
1000
2000
3000
40003507 3451
3072
2595 2475 23942200 2243
1342991

3
INDUSTRY (EFPIA total) 2000 2010 2015 2016
Production 127,504 199,400 238,437 250,000 (e)
Exports (1) (2) 90,935 276,357 365,303 375,000 (e)
Imports 68,841 204,824 269,012 275,000 (e)
Trade balance 22,094 71,533 96,291 100,000 (e)
R&D expenditure 17,849 27,920 33,557 35,000 (e)
Employment (units) 554,186 670,088 739,499 745,000 (e)
R&D employment (units) 88,397 117,035 113,713 115,000 (e)
Total pharmaceutical market value at ex–factory prices
89,449 153,685 193,742 202,000 (e)
Payment for pharmaceuticals by statutory health insurance systems (ambulatory care only)
76,909 129,464 131,685 134,000 (e)
THE PHARMACEUTICAL INDUSTRY: A KEY ASSET TO THE EUROPEAN ECONOMY
As well as driving medical progress by researching, developing and bringing new medicines that improve health and quality of life for patients around the world, the research-based pharmaceutical
industry is a key asset of the European economy. It is one of Europe’s top performing high-technology sectors.
Values in € million unless otherwise stated
(1) Data relate to EU–27, Norway and Switzerland since 2005 (EU–15 before 2005); Croatia and Serbia included since 2010; Turkey included since 2011; Russia included since 2013
(2) Data relating to total exports and total imports include EU–28 intra–trade (double counting in some cases)
Source: EFPIA member associations (official figures) – (e): EFPIA estimate; Eurostat (EU–28 trade data 2000-2016)

EFPIA Key Data | 2017
4
64.7%
9.4%
7.3%
17.5%
Pharmerging
Japan
Europe(Top 5)
Rest ofthe World
USA
1.1%
MAIN TRENDS
The research-based pharmaceutical industry can play a critical role in restoring Europe to growth and ensuring future competitiveness in an advancing global economy. In 2016 it invested an estimated € 35,000 million in R&D in Europe. It directly employs some 745,000 people and generates three to four times more employment indirectly – upstream and downstream – than it does directly. However, the sector faces real challenges. Besides the additional regulatory hurdles and escalating R&D costs, the sector has been severely hit by the impact of fi scal austerity measures introduced by governments across much of Europe since 2010.
There is rapid growth in the market and research environment in emerging economies such as Brazil, China and India, leading to a gradual migration of economic and research activities from Europe to these fast-growing markets. In 2016 the Brazilian and Chinese markets grew
by 10.0% and 6.9% respectively compared to an average market growth of 4.5% for the total European Union market and 6.3% for the US market (source: IMS Health, May 2017).
In 2016 North America accounted for 49.0% of world pharmaceutical sales compared with 21.5% for Europe. According to IMS Health data (MIDAS May 2017), 64.7% of sales of new medicines launched during the period 2011-2016 were on the US market, compared with 17.5% on the Eu-ropean market (top 5 markets).
The fragmentation of the EU pharmaceutical market has resulted in a lucrative parallel trade. This benefi ts neither social security nor patients and deprives the industry of additional resources to fund R&D. Parallel trade was estimated to amount to € 5,361 million (value at ex-factory prices) in 2015.
GEOGRAPHICAL BREAKDOWN (BY MAIN MARKETS) OF SALES OF NEW MEDICINES LAUNCHED DURING THE PERIOD 2011–2016
Note: New medicines cover all new active ingredients marketed
for the fi rst time on the world market during the period
2011-2016Europe (Top 5) comprises
Germany, France, Italy, Spain and United Kingdom
Pharmerging comprises 21 countries ranked by IMS
Health as high–growth pharmaceutical markets
(Algeria, Argentina, Bangladesh, Brazil, Colombia, Chile, China,
Egypt, India, Indonesia, Kazakhstan, Mexico, Nigeria, Pakistan, Philippines, Poland,
Russia, Saudi Arabia, South Africa, Turkey and Vietnam)
Source: IMS Health (MIDAS May 2017)

5
PHARMACEUTICAL R&D EXPENDITURE IN EUROPE, USA AND JAPAN (MILLION OF NATIONAL CURRENCY UNITS*), 1995-2015
* Note: Europe: € million; USA: $ million; Japan: ¥ million x 100 (e): estimate
Source: EFPIA member associations, PhRMA, JPMA
SHARE OF PARALLEL IMPORTS IN PHARMACY MARKET SALES (%) – 2015
Note: U.K.: in % of pharmacy market sales at consumer/retail prices
Source: EFPIA member associations (estimate)
0,000
10,000
20,000
30,000
40,000
50,000 Japan
USA
Europe
20152010200520001995
11,484 11,874
6,422
17,84921,988
30,969
10,477
33,557
47,051 (e)
21,364
7,462
27,920
40,688
12,76014,577
Europe USA Japan
0
2
4
6
8
10
12
14
16
18
20
22
24
26
U.K.SwedenPolandNetherlandsIrelandGermanyDenmarkBelgiumAustria
1,3 1,7
24,9
9,0
7,0 8,2
1,7
12,0
9,0
EFPIA Key Data | 2017
6
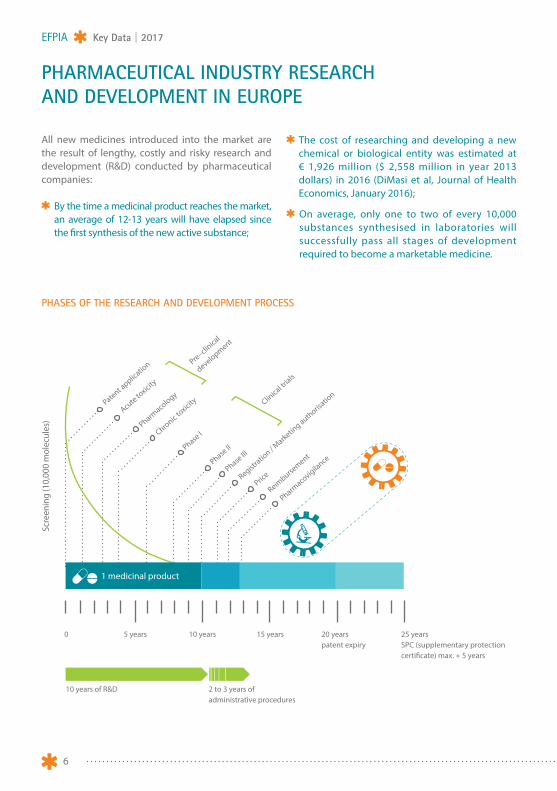
PHARMACEUTICAL INDUSTRY RESEARCH AND DEVELOPMENT IN EUROPE
All new medicines introduced into the market are the result of lengthy, costly and risky research and development (R&D) conducted by pharmaceutical companies:
By the time a medicinal product reaches the market, an average of 12-13 years will have elapsed since the first synthesis of the new active substance;
The cost of researching and developing a new chemical or biological entity was estimated at € 1,926 million ($ 2,558 million in year 2013 dollars) in 2016 (DiMasi et al, Journal of Health Economics, January 2016);
On average, only one to two of every 10,000 substances synthesised in laboratories will successfully pass all stages of development required to become a marketable medicine.
PHASES OF THE RESEARCH AND DEVELOPMENT PROCESS
Scre
enin
g (1
0,00
0 m
olec
ules
)
0 5 years
Patent applic
ation Pre–clin
ical
development
Clinical tr
ials
Acute toxicity
Pharmacology
Chronic toxicity
Phase I
Phase II
Phase III
Price
Reimburse
ment
Pharmacovigila
nce
Registratio
n / Marketin
g authorisatio
n
10 years
10 years of R&D 2 to 3 years of administrative procedures
15 years 20 years patent expiry
25 years SPC (supplementary protection certificate) max. + 5 years
1 medicinal product

7
PHARMACEUTICAL INDUSTRY RESEARCH AND DEVELOPMENT IN EUROPE
EFPIA 2015 € million € millionAustria 285
Belgium 2,589
Bulgaria n.a
Croatia 40
Cyprus 85
Czech Rep. 77
Denmark 1,497
Estonia n.a
Finland 172
France 4,564
Germany 6,216
Greece 80
Hungary 179
Iceland n.a
Ireland 305
Italy 1,415
Latvia n.a
Lithuania n.a
Malta n.a
Netherlands 642
Norway 126
Poland 308
Portugal 75
Romania 98
Russia 251
Slovakia n.a
Slovenia 183
Spain 908
Sweden 1,104
Switzerland 6,525
Turkey 77
U.K. 5,756
TOTAL 33,557
Note: The figures relate to the R&D carried out in each country.Portugal, France: 2014 data; Austria, Cyprus, Greece, Hungary, Ireland, Slovenia: 2013 data; Czech Republic: 2012 data; Croatia, Netherlands: 2011 dataBelgium, Croatia, Denmark, France, Germany, Greece, Ireland, Italy, Netherlands, Norway (LMI members), Poland, Romania, Slovenia, Sweden (LIF members), Switzerland (Interpharma members), Turkey: estimate
Source: EFPIA member associations (official figures)

EFPIA Key Data | 2017
8
Allocation of R&D investments by function (%)
21.2
48.3
5.1
16.6
8.9
Pre-human/Pre-clinical
Approval
Pharmacovigilance (Phase IV)
Uncategorized
8.9
10.7
28.7
Phase I
Phase II
Phase III
Clinical Trials
Europe USA Japan Others
0
20
40
60
80
100 Others
Japan
USA
Europe
2012-20162007-20112002-20061997-2001
79
46
67
2114
52
7588
3238
65
2012
84
29
4
Source: PhRMA, Annual Membership Survey 2016 (percentages calculated from 2014 data; total values may be affected by rounding)
Source: SCRIP – EFPIA calculations (according to nationality of mother company)
ALLOCATION OF R&D INVESTMENTS BY FUNCTION (%)
NUMBER OF NEW CHEMICAL OR BIOLOGICAL ENTITIES (1997-2016)

9
Pharmaceutical R&D expenditure - Annual growth rate (%)
Europe
USA
0
2
4
6
8
10
2012-20162007-20112002-2006
5.9
7.7
3.1
1.8
3.7
6.8
IMPORTANCE OF PHARMACEUTICAL R&D
In 2015 the pharmaceutical industry invested nearly € 33,600 million in R&D in Europe. A decade of strong US market dominance led to a shift of economic and research activity towards the US from 1995-2005. Additionally, Europe is now facing increasing competition from emerging economies: rapid growth in the market and research environments in countries such as Brazil and China are contributing to the move of economic and research activities to non-European markets. The geographical balance of the pharmaceutical market – and ultimately the R&D base – is likely to shift gradually towards emerging economies.
ESTIMATED FULL COST OF BRINGING A NEW CHEMICAL OR BIOLOGICAL ENTITY TO MARKET ($ MILLION - YEAR 2013 $)
Source: Joseph. A. DiMasi, Henry G. Grabowski, Ronald W.Hansen, Innovation in the pharmaceutical industry: New estimates of R&D costs, Journal of Health Economics, 47 (2016), 20–33
Note: USA: data relate to the period 2012-2015Source: : EFPIA, PhRMA
01970 -early 1980s
100
200
300
400
500
600
700
800
900
1,000
1,100
1,200
1,300
1,400
1,500
1980 -early 1990s
1990 -mid 2000s
2000s -mid 2010s
179
413
1,044
2,558
1,600
1,700
1,800
1,900
2,000
2,100
2,200
2,300
2,400
2,500
2,600
PHARMACEUTICAL R&D EXPENDITURE – ANNUAL GROWTH RATE (%)

EFPIA Key Data | 2017
10
RANKING OF INDUSTRIAL SECTORS BY OVERALL SECTOR R&D INTENSITY (R&D AS PERCENTAGE OF NET SALES – 2015)
According to EUROSTAT data, the pharmaceutical industry is the high technology sector with the highest added-value per person employed, significantly higher than the average value for high-tech and manufacturing industries. The pharmaceutical industry is also the sector with
the highest ratio of R&D investment to net sales. According to the 2016 EU Industrial R&D Investment Scoreboard the pharmaceutical and biotechnology sector amounts to 19.1% of total business R&D expenditure worldwide.
0 2 4 6 8 10 12 14 16
15.0%
10.6%
8.4%
5.9%
4.7%
4.3%
3.8%
3.6%
3.2%
2.9%
2.8%
Software & computer services
Pharmaceuticals & biotechnology
Technology hardware & equipment
Automobiles & parts
Electronic & electrical equipment
Healthcare equipment & services
4.3%General industrials
All industries
Industrial engineering
Leisure goods
Chemicals
Aerospace & defence
Note: Data relate to the top 2,500 companies with registered offi ces in the EU (590), Japan (356), the US (837), China (327) and the Rest of the World (390), ranked by total worldwide R&D investment (with investment in R&D above € 21 million).
Source: The 2016 EU Industrial R&D Investment Scoreboard, European Commission, JRC/DG RTD

11
PHARMACEUTICAL PRODUCTION
EFPIA 2015 € million € millionAustria 2,864
Belgium 11,232
Bulgaria 121
Croatia 434
Cyprus 180
Czech Rep. n.a
Denmark 13,080
Estonia n.a
Finland 1,598
France 20,554
Germany 29,536
Greece 929
Hungary 2,933
Iceland n.a
Ireland 19,305
Italy 29,326
Latvia 120
Lithuania n.a
Malta n.a
Netherlands 6,180
Norway 745
Poland 2,964
Portugal 1,490
Romania 655
Russia 5,092
Slovakia n.a
Slovenia 1,354
Spain 15,213
Sweden 7,809
Switzerland 42,479
Turkey 2,931
U.K. 19,313
TOTAL 238,437
Note: All data based on SITC 54Ireland: 2014 data; Latvia, Romania: 2013 data; Norway: 2012 data; Cyprus, Netherlands: 2010 dataCroatia, Czech Republic, Denmark, France, Ireland, Italy, Netherlands, Norway, Portugal, Slovenia, Spain, Sweden, Switzerland: estimateBulgaria, Croatia, Cyprus, France, Germany, Hungary, Ireland, Latvia, Norway, Poland, Portugal, Romania, Slovenia: veterinary products excluded
Source: EFPIA member associations (official figures) Graph 13 - à remplir
Austria
€ million
453
Belgium
Austria
Belgium2,493
€ million
453
2,493
216,928TOTAL
Efpia 2013
PHARMACEUTICAL PRODUCTION

EFPIA Key Data | 2017
12
EMPLOYMENT IN THE PHARMACEUTICAL INDUSTRY
The research-based pharmaceutical industry is one of Europe’s major high-technology industrial employers. Recent studies in some countries showed that the research-based pharmaceutical industry generates three to four times more employment indirectly - upstream and downstream - than it
does directly. Further, a significant proportion of these are valuable skilled jobs, for instance in the fields of academia or clinical science, which can help maintain a high-level knowledge base and prevent a European “brain drain”.
EFPIA 2015 units unitsAustria 14,140
Belgium 34,617
Bulgaria 10,500
Croatia 5,740
Cyprus 1,140
Czech Rep. 17,900
Denmark 26,963
Estonia 400
Finland 5,233
France 98,690
Germany 114,069
Greece 26,000
Hungary 23,000
Iceland n.a
Ireland 26,373
Italy 63,500
Latvia 1,971
Lithuania 1,220
Malta 445
Netherlands 12,000
Norway 3,800
Poland 29,700
Portugal 7,500
Romania 25,600
Russia n.a
Slovakia 3,000
Slovenia 8,961
Spain 38,677
Sweden 11,012
Switzerland 43,848
Turkey 22,000
U.K. 61,500
TOTAL 739,499
Note: Croatia, Czech Republic, Ireland, Netherlands, Spain, Sweden: 2014 data; Denmark, Lithuania: 2013 data; Latvia: 2012 data; Slovakia: 2011 data; Cyprus: 2007 data; Malta: 2004 dataAustria, Belgium, Bulgaria, Croatia, Estonia, France, Greece, Ireland, Italy, Malta, Netherlands, Norway, Poland, Romania, Slovenia, Sweden, Switzerland, Turkey, United Kingdom: estimate
Source: EFPIA member associations (official figures)

13
EMPLOYMENT IN THE PHARMACEUTICAL INDUSTRY
Note: Data includes Turkey (since 2011), Croatia and Lithuania (since 2010), Bulgaria, Estonia and Hungary (since 2009), Czech Republic (since 2008), Cyprus (since 2007), Latvia, Romania & Slovakia (since 2005), Malta, Poland and Slovenia (since 2004)
Source: EFPIA member associations (official figures) – (e): EFPIA estimate
Note: Data includes Greece & Lithuania (since 2013), Bulgaria and Turkey (since 2012), Poland (since 2010), Czech Republic, Estonia and Hungary (since 2009), Romania (since 2005) and Slovenia (since 2004) Croatia, Cyprus, Latvia, Malta, Serbia, Slovakia: data not available
Source: EFPIA member associations – (e): EFPIA estimate
EMPLOYMENT IN THE PHARMACEUTICAL INDUSTRY (1990-2016)
EMPLOYMENT IN PHARMACEUTICAL R&D (1990-2016)
2016
2015
2010
2005
2000
1995
1990
100,0000 200,000 300,000 400,000 500,000 600,000 700,000 800,000
500,879
500,699
554,186
636,763
670,088
739,499
745,000 (e)
2016
2015
2010
2005
2000
1995
1990
20,0000 40,000 60,000 80,000 100,000 120,000
76,126
82,618
88,397
100,726
117,035
113,713
115,000 (e)

EFPIA Key Data | 2017
14
PHARMACEUTICAL SALES
PRICE STRUCTURE
The world pharmaceutical market was worth an estimated € 763,101 million ($ 844,676 million) at ex-factory prices in 2016. The North American market (USA & Canada) remained the world’s largest market with a 49.0% share, well ahead of Europe and Japan.
Distribution margins, which are generally fixed by governments, and VAT rates differ significantly from country to country in Europe. On average, approximately one third of the retail price of a medicine reverts to distributors (pharmacists and wholesalers) and the State.
Note: Europe includes Turkey and Russia; percentages might not add up due to rounding
Source: IMS Health (MIDAS), May 2017 (data relate to the 2016 audited global retail and hospital pharmaceutical market at ex-factory prices)
Note: Non-weighted average for Europe (average estimate for 23 countries)
Source: EFPIA member associations
BREAKDOWN OF THE WORLD PHARMACEUTICAL MARKET – 2016 SALES
BREAKDOWN OF THE RETAIL PRICE OF A MEDICINE, 2015 (%)
66.0%Manufacturer
19.2%Pharmacist
4.8%Wholesaler
10.0%State (VAT and other taxes)
North America (USA, Canada)
Europe
49.0%21.5%
Japan8.3%
Africa, Asia*& Australia
* Excluding Japan
16.4%4.7%
AmericaLatin

15
PHARMACEUTICAL MARKET VALUE(at ex–factory prices)
Graph 17
Graph 18
Breakdown of the world pharmaceutical market – 2014 sales
Breakdown of the retail price of a medicine, 2013 (%)
North America (USA, Canada)
North America (USA, Canada)
Europe
44.5%25.3%
Japan8.9%
Latin America4.7%
66.1%Manufacturer
19.2%Pharmacist
4.9%Wholesaler
9.8%State (VAT and other taxes)
Africa, Asia &Australia
* Excluding Japan
16.6%
EFPIA 2015 € million € millionAustria 3,550
Belgium 4,708
Bulgaria 937
Croatia 659
Cyprus 180
Czech Rep. 2,290
Denmark 2,306
Estonia 265
Finland 2,246
France 27,645
Germany 30,038
Greece 4,058
Hungary 2,133
Iceland 108
Ireland 1,818
Italy 22,703
Latvia 238
Lithuania 373
Malta 77
Netherlands 4,821
Norway 1,624
Poland 5,587
Portugal 2,933
Romania 2,633
Russia 13,271
Serbia 564
Slovakia 1,184
Slovenia 562
Spain 15,625
Sweden 3,809
Switzerland 5,040
Turkey 7,383
U.K. 22,375
TOTAL 193,742
Note: Medicinal products as defi ned by Directive 2001/83/EECCyprus, Denmark, Finland, Iceland, Latvia, Lithuania, Norway, Russia, Slovenia, Sweden: pharmaceutical market value at pharmacy purchasing prices Iceland: 2013 data; Serbia: 2011 data; Malta: 2007 dataBelgium, France, Germany, Ireland, Italy, Malta, Norway, Spain, United Kingdom: estimate
Source: EFPIA member associations (offi cial fi gures) – Latvia, Lithuania, Norway: IMS Health The fi gures above are for pharmaceutical sales, at ex-factory prices, through all distribution channels (pharmacies, hospitals, dispensing doctors, supermarkets, etc.), whether dispensed on prescription or at the patient’s request. Sales of veterinary medicines are excluded.

EFPIA Key Data | 2017
16
VAT RATES APPLICABLE TO MEDICINESThe table below shows the VAT rates applied to medicines in European countries as of 1 January 2017.
Country Standard VAT rate (%) VAT rates applied to medicines Prescription (%) OTC (%)
Austria 20,0 10,0 10,0 Belgium 21,0 6,0 6,0 Bulgaria 20,0 20,0 20,0 Croatia 25,0 5,0 5,0 Cyprus 19,0 5,0 5,0 Czech Rep. 21,0 10,0 10,0
Denmark 25,0 25,0 25,0 Estonia 20,0 9,0 9,0 Finland 24,0 10,0 10,0 France (1) 20,0 2,1 10,0 Germany 19,0 19,0 19,0 Greece 24,0 6,0 6,0 Hungary 27,0 5,0 5,0 Iceland 24,0 24,0 24,0 Ireland (2) 23,0 0-23,0 0-23,0Italy 22,0 10,0 10,0 Latvia 21,0 12,0 12,0 Lithuania (3) 21,0 5,0 21,0 Luxembourg 17,0 3,0 3,0 Malta 18,0 0,0 0,0 Netherlands 21,0 6,0 6,0 Norway 25,0 25,0 25,0 Poland 23,0 8,0 8,0 Portugal 23,0 6,0 6,0 Romania 19,0 9,0 19,0 Russia 18,0 10,0 10,0 Serbia 20,0 10,0 10,0 Slovakia 20,0 10,0 10,0 Slovenia 22,0 9,5 9,5 Spain 21,0 4,0 4,0 Sweden 25,0 0,0 25,0 Switzerland 8,0 2,5 2,5 Turkey 18,0 8,0 8,0 U.K. 20,0 0,0 20,0
(1) France: reimbursable medicines 2.1%; non–reimbursable medicines 10.0% (2) Ireland: oral medication 0%; other medication 23% (3) Lithuania: reimbursable medicines 5.0%; non–reimbursable medicines 21.0%

17
GENERICS
The term ‘generic’ is widely used but its definition is not always consistent between countries. Generics are usually produced by a manufacturer who is not
the inventor of the original product, and are marketed when intellectual property protection rights are exhausted.
Note: Croatia, Denmark, Estonia, Finland, Greece, Hungary, United Kingdom: share of generics in pharmacy market salesAustria, Belgium, Bulgaria, France, Germany, Ireland, Italy, Netherlands, Portugal, Slovenia, Spain: share of generics in reimbursable pharmacy market salesCzech Republic, Poland, Romania, Russia, Slovakia, Sweden, Switzerland, Turkey: share of generics in total market salesCyprus, Iceland, Latvia, Lithuania, Malta, Norway, Serbia: 2015 data not available France: data relate only to those active substances listed on the official list of medicinesDefinition: ‘generic’ means a medicine based on an active substance that is out of patent and which is marketed under a different name from that of the original branded medicine.
Source: EFPIA member associations
SHARE (ESTIMATE – IN %) ACCOUNTED FOR BY GENERICS IN PHARMACEUTICAL MARKET SALES VALUE (AT EX–FACTORY PRICES), 2015
0% 10% 20% 30% 40% 50% 60%
37.0
16.0
33.0
42.0
20.0
25.1
21.2 25.0
18.7
30.9
17.5
21.0
54.2
16.7
61.8
21.7
28.1
55.8
22.0
27.2
18.0
13.6
38.1
31.0
Austria
Belgium
Bulgaria
Croatia
Czech Republic
Denmark
Estonia
Finland
France
Germany
Greece
38.0Hungary
Ireland
Italy
Netherlands
Poland
Portugal
Romania
Russia
Slovakia
Slovenia
Sweden
22.3Spain
Switzerland
Turkey
United Kingdom

EFPIA Key Data | 2017
18
PHARMACEUTICAL EXPORTS
EFPIA 2015 € million € millionAustria 8,472
Belgium 41,003
Bulgaria 819
Croatia 562
Cyprus 255
Czech Republic 2,148
Denmark 11,537
Estonia 64
Finland 852
France 27,857
Germany 68,706
Greece 1,018
Hungary 4,448
Ireland 30,231
Italy 19,052
Latvia 332
Lithuania 632
Luxembourg 300
Malta 241
Netherlands 27,434
Norway 705
Poland 2,841
Portugal 920
Romania 851
Russia 277
Slovakia 480
Slovenia 2,413
Spain 10,934
Sweden 7,600
Switzerland 58,127
Turkey 849
United Kingdom 33,343
TOTAL 365,303
Note: All data based on SITC 54 Norway: veterinary products excluded, 2014 data
Source: Eurostat (COMEXT database – May 2017) Norway: Statistics Norway; Switzerland: Swiss Federal Customs Administration
19
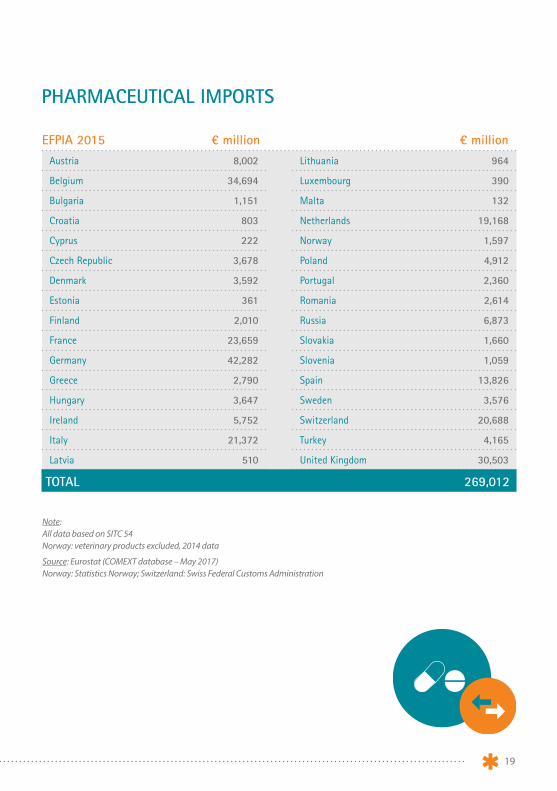
PHARMACEUTICAL IMPORTS
EFPIA 2015 € million € millionAustria 8,002
Belgium 34,694
Bulgaria 1,151
Croatia 803
Cyprus 222
Czech Republic 3,678
Denmark 3,592
Estonia 361
Finland 2,010
France 23,659
Germany 42,282
Greece 2,790
Hungary 3,647
Ireland 5,752
Italy 21,372
Latvia 510
Lithuania 964
Luxembourg 390
Malta 132
Netherlands 19,168
Norway 1,597
Poland 4,912
Portugal 2,360
Romania 2,614
Russia 6,873
Slovakia 1,660
Slovenia 1,059
Spain 13,826
Sweden 3,576
Switzerland 20,688
Turkey 4,165
United Kingdom 30,503
TOTAL 269,012
Note: All data based on SITC 54Norway: veterinary products excluded, 2014 data
Source: Eurostat (COMEXT database – May 2017)Norway: Statistics Norway; Switzerland: Swiss Federal Customs Administration

EFPIA Key Data | 2017
20
PHARMACEUTICAL TRADE BALANCE
EFPIA 2015 € million € millionAustria 470
Belgium 6,309
Bulgaria -332
Croatia -241
Cyprus 33
Czech Republic -1,530
Denmark 7,945
Estonia -297
Finland -1,158
France 4,198
Germany 26,424
Greece -1,772
Hungary 801
Ireland 24,479
Italy -2,320
Latvia -178
Lithuania -332
Luxembourg -90
Malta 109
Netherlands 8,266
Norway -892
Poland -2,071
Portugal -1,440
Romania -1,763
Russia -6,596
Slovakia -1,180
Slovenia 1,354
Spain -2,892
Sweden 4,024
Switzerland 37,439
Turkey -3,316
United Kingdom 2,840
TOTAL 96,291
Note: All data based on SITC 54 Norway: veterinary products excluded, 2014 data
Source: Eurostat (COMEXT database – May 2017)Norway: Statistics Norway; Switzerland: Swiss Federal Customs Administration
Graph 25
Graph 24
EU -28 trade balance - High technology sectors (€ million) - 2014
The European Union’s top 5 pharmaceutical trading partners - 2014
EU exports
10,000
20,000
30,000
40,000
50,000
60,000
0
55,337
33,611
-60,000
-50,000
-40,000
-30,000
-20,000
-10,000
-45,320-44,497
2,980
18,135
SITC 54 Pharmaceutical products
SITC 71 Power generating machinery and equipment
SITC 75 Office machines and computers
SITC 76 Telecommunication, sound, TV, video
SITC 77 Electrical machinery
SITC 87 Professional, scientific, controlling material
41.6%16.5%
Others
30.0%
USA
10.9%35.5
SWITZERLAND
5.6%JAPAN
5.4%
CHINA
6.5%RUSSIA
EU imports
37.8%
4.0%
SINGAPORE4.1%
INDIA2.1%

21
EU exports
42.0%
33.6%
USA Others
12.1%
38.9%
Switzerland
34.7%
11.4%
ChinaRussia
4.3%
-
Japan
6.1% 5.7%
- 3.9%
Israel
3.8%
-
Singapore
3.5%
-
EU imports
EU exportsEU imports EU exportsEU imports
68,662
26,504
-47,631
-63,963
-2,567
18,854
SITC 54 Pharmaceutical products
SITC 71 Power generating machinery and equipment
SITC 75 Office machines and computers
SITC 76 Telecommunication, sound, TV, video
SITC 77 Electrical machinery
SITC 87 Professional, scientific, controlling material
-70,000
-60,000
-50,000
-40,000
-30,000
-20,000
-10,000
0
10,000
20,000
30,000
40,000
50,000
60,000
70,000
80,000
Source: Eurostat, COMEXT database, May 2017
Source: Eurostat, COMEXT database, May 2017
EU-28 TRADE BALANCE - HIGH TECHNOLOGY SECTORS (€ MILLION) - 2016
THE EUROPEAN UNION’S TOP 5 PHARMACEUTICAL TRADING PARTNERS - 2016

EFPIA Key Data | 2017
22
TOTAL SPENDING (PUBLIC AND PRIVATE) ON HEALTHCAREAS A PERCENTAGE OF GDP AT MARKET PRICES
Country 1970 1980 1990 2000 2013 2014 Austria 4.9 7.0 7.7 9.2 10.1 10.3
Belgium 3.8 6.1 7.1 7.9 10.4 10.4
Czech Republic - - 3.8 5.7 7.8 7.7
Denmark - 8.4 8.0 8.1 10.3 10.6
Estonia - - - 5.2 6.0 6.1
Finland 5.0 5.9 7.2 6.9 9.5 9.5
France 5.2 6.7 8.0 9.5 10.9 11.1
Germany 5.7 8.1 8.0 9.8 10.9 11.0
Greece - - 6.1 7.2 8.7 8.3
Hungary - - - 6.8 7.3 7.2
Iceland 4.6 5.9 7.4 9.0 8.8 8.9
Ireland 4.9 7.5 5.6 5.9 10.5 10.1
Italy - - 7.0 7.6 8.8 9.1
Luxembourg - - - 5.9 6.5 6.3
Netherlands - 6.6 7.1 7.1 10.9 10.9
Norway 4.0 5.4 7.1 7.7 8.9 9.3
Poland - - 4.3 5.3 6.5 6.4
Portugal 2.3 4.8 5.5 8.4 9.1 9.0
Slovakia - - - 5.3 7.6 7.0
Slovenia - - - 8.1 8.8 8.5
Spain 3.1 5.0 6.1 6.8 9.0 9.1
Sweden 5.5 - 7.3 7.4 11.1 11.2
Switzerland 4.9 6.6 7.4 9.3 11.2 11.4
Turkey - 2.4 2.5 4.7 5.1 5.1
United Kingdom 4.0 5.1 5.1 6.3 9.9 9.9
Europe 4.4 6.1 6.4 7.2 8.7 8.8
USA 6.2 8.2 11.3 12.5 16.4 16.6
Japan 4.4 6.4 5.8 7.4 11.3 11.4
Note: Europe: non-weighted average (25 countries) – EFPIA calculations
Source: OECD Health Data 2015, May 2017

23
PAYMENT FOR PHARMACEUTICALS BY COMPULSORY HEALTH INSURANCE SYSTEMS AND NATIONAL HEALTH SERVICES (ambulatory care only)
EFPIA 2015 € million € millionAustria 2,628
Belgium 3,867
Bulgaria 330
Croatia 373
Cyprus 93
Czech Rep. 550
Denmark 772
Estonia 113
Finland 1,378
France 23,353
Germany 34,836
Greece 2,000
Hungary 1,001
Iceland 92
Ireland 1,501
Italy 8,477
Latvia 126
Lithuania 194
Malta n.a.
Netherlands 4,466
Norway 1,289
Poland 1,909
Portugal 1,183
Romania 1,153
Russia 1,694
Serbia 218
Slovakia 1,089
Slovenia 278
Spain 9,535
Sweden 2,013
Switzerland 4,985
Turkey 5,982
U.K. 14,217
TOTAL 131,685
Note: Russia: 2014 data; Iceland, Lithuania: 2013 data;France, Ireland, Netherlands, Norway, Sweden, United Kingdom: estimate
Source: EFPIA member associations (official figures)

EFPIA Key Data | 2017
24
CAUSES OF DEATH BY MAJOR DISEASE AREAS IN EUROPE (EU–28)
Data Source: Eurostat, data relate to year 2014 (non-disease directly related causes of deaths: EFPIA calculations), May 2017
Diseases of the circulatory system
Malignant neoplasms
Diseases of the respiratory system
Diseases of the digestive system
37.2%
9.6%
26.1%
7.8%
4.3%
3.8%
2.9%
3.8%
1.9%1.6%
0.5%0.3%
0.2%
Mental and behavioural disorders
Diseases of the genitourinary system
Certain infectious and parasitic diseases
Diseases of the blood(-forming organs) and immune mechanism disorders
Diseases of the skin and subcutaneous tissue
Others
Diseases of the musculoskeletal system and connective tissues
Diseases of the nervous system and the sense organs
Endocrine, nutritional and metabolic diseases

25
THE ADDED VALUE OF MEDICINES IN HEALTHCARE
Medicines constitute only a small part of healthcare costs with, on average, 15.8% of total health expenditure in Europe being spent on pharmaceuticals and other medical non-durables. In costly diseases such as cancer and rheumatoid arthritis, medicines account for even less than 10% of the total disease costs. Medicines can also generate additional savings, for example by substantially reducing costs in other areas of healthcare, including hospital stays and long-term care costs.
Source: OECD Health Statistics 2016, May 2017 – EFPIA calculations (non-weighted average for 25 EU & EFTA countries)
Source: Lichtenberg, F: Pharmaceutical innovation and longevity growth in 30 developing OECD and high–income countries, 2000 – 2009 (2012)
Life Expectancy (years)
BREAKDOWN OF TOTAL HEALTH EXPENDITURE IN EUROPE – 2014
CONTRIBUTION OF INNOVATIVE MEDICINES TO INCREASE IN LIFE EXPECTANCY (2000–2009)
15.8%35.9%48.3%
Outpatient care & others
In-patient care (hospital)
Pharmaceuticals & other medical non-durables
Graph 29
Graph 30
Contribution of innovative medicines to increase in life expectancy (2000-2009)
Breakdown of total health expenditure in Europe – 2012
16.9%36.6%46.5%
Outpatient care & others
In-patient care (hospital)
Pharmaceuticals & other medical non-durables
2000 Other Contribution of InnovativeMedicines
2009
77.0
76.5
76.0
75.5
75.0
74.5
74.0
73.5
73.0
72.5
0
27%
73%
+ 1.74 years
From 2000–2009, an improvement in population weighted mean life expectancy at birth of 1.74 years was seen across 30 OECD countries.
Innovative medicines are estimated to have contributed to 73% of this improvement once other factors are taken into account (e.g. income, education, immunisation, reduction in risk factors, health system access).

26
EFPIA Key Data | 2017
EFPIA MEMBER ASSOCIATIONS
ASSOCIATIONS WITH LIAISON STATUS
Austria Fachverband der Chemischen Industrie Österreichs (FCIO)
Belgium Association Générale de l’Industrie du Médicament (pharma.be)
Denmark Laegemiddelindustriforeningen The Danish Association of the Pharmaceutical Industry (Lif )
Finland Lääketeollisuus ry Pharma Industry Finland (PIF)
France Les Entreprises du Médicament (LEEM)
Germany Verband Forschender Arzneimittelhersteller (VfA)
Greece Hellenic Association of Pharmaceutical Companies (SFEE)
Ireland Irish Pharmaceutical Healthcare Association (IPHA)
Italy Associazione delle Imprese del Farmaco (Farmindustria)
Netherlands Vereniging Innovatieve Geneesmiddelen
Norway Legemiddelindustrien (LMI)
Poland Employers Union of Innovative Pharmaceutical Companies (Infarma)
Portugal Associação Portuguesa da Indústria Farmacêutica (Apifarma)
Russia Association of International Pharmaceutical Manufacturers (AIPM)
Spain Asociación Nacional Empresarial de la Industria Farmacéutica (Farmaindustria)
Sweden Läkemedelsindustriföreningen The Swedish Association of the Pharmaceutical Industry (LIF)
Switzerland Verband der forschender pharmazeutischen Firmen der Schweiz (Interpharma)
Turkey Arastirmaci Ilac Firmalari Dernegi (AIFD)
United Kingdom The Association of the British Pharmaceutical Industry (ABPI)
Bulgaria: Association of Research-based Pharmaceutical Manufacturers in Bulgaria (ARPharM)
Croatia: Innovative Pharmaceutical Initiative (IF!)
Cyprus: Cyprus Association of Pharmaceutical Companies (KEFEA)
Czech Republic: Association of Innovative Pharmaceutical Industry (AIFP)
Estonia: Association of Pharmaceutical Manufacturers in Estonia (APME)
Hungary: Association of Innovative Pharmaceutical Manufacturers (AIPM)
Latvia: Association of International Research-based Pharmaceutical Manufacturers (SIFFA)
Lithuania: The Innovative Pharmaceutical Industry Association (IFPA)
Malta: Maltese Pharmaceutical Association (PRIMA)
Romania: Association of International Medicines Manufacturers (ARPIM)
Serbia: Innovative Drug Manufacturers’ Association (INOVIA)
Slovakia: Association of Innovative Pharmaceutical Industry (AIFP)
Slovenia: Forum of International Research and Development Pharmaceutical Industries (EIG)
Ukraine: Association of Pharmaceutical Research and Development (APRaD)

27
MEMBER COMPANIES
Full Members
AbbVie
Almirall
Amgen
Astellas
AstraZeneca
Bayer
Biogen
Boehringer Ingelheim
Bristol-Myers Squibb
Celgene
Chiesi Farmaceutici
Eli Lilly
GlaxoSmithKline
Grünenthal
Ipsen
Johnson & Johnson
LEO Pharma
Menarini
Merck
Merck Sharp & Dohme (MSD)
Novartis
Novo Nordisk
Pfizer
Pierre Fabre
Roche
Sanofi
Servier
Shire
Takeda
Teva
UCB
Affiliate Members
Bial
Daiichi-Sankyo
Eisai
Esteve
Lundbeck
Orion Pharma
Otsuka
The Medicines Company
Vifor Pharma

EFPIA (The European Federation of Pharmaceutical Industries and Associations) represents the research-based pharmaceutical industry operating in Europe.
Founded in 1978, its members comprise 33 national pharmaceutical industry associations and 40 leading pharmaceutical companies undertaking research, development and
manufacturing of medicinal products in Europe for human use.
Its mission is to promote pharmaceutical research and development and the best conditions in Europe for companies to bring to market medicines that improve human health and
the quality of life around the world.
Through its membership, EFPIA represents the common views of more than 1,900 large, medium and small companies including the entire European research-based pharmaceutical sector whose interests
also include a significant part of the generics and biosimilars segments. Two specialised groups have been created within EFPIA to address specific issues relating to vaccines (Vaccines Europe) and the needs of
biopharmaceutical companies (EBE - European Biopharmaceutical Enterprises).
EFPIALeopold Plaza Building Rue du Trône 108
B–1050 Brussels BelgiumTel.: +32.(0)2.626.25.55
www.efpia.eu [email protected]
Further details about the Federation and its activities can be obtained from: