Embed Size (px)
Citation preview
The Performance of Hedge Funds:Risk, Return, and Incentives
CARL ACKERMANN, RICHARD McENALLY,and DAVID RAVENSCRAFT*
ABSTRACT
Hedge funds display several interesting characteristics that may inf luence perfor-mance, including: f lexible investment strategies, strong managerial incentives, sub-stantial managerial investment, sophisticated investors, and limited governmentoversight. Using a large sample of hedge fund data from 1988–1995, we find thathedge funds consistently outperform mutual funds, but not standard market indi-ces. Hedge funds, however, are more volatile than both mutual funds and marketindices. Incentive fees explain some of the higher performance, but not the in-creased total risk. The impact of six data-conditioning biases is explored. We findevidence that positive and negative survival-related biases offset each other.
HEDGE FUNDS HAVE BEEN IN EXISTENCE for almost 50 years. However, their re-cent growth has increased their prominence in the financial markets andthe business press. Since the late 1980s, the number of hedge funds hasrisen by more than 25 percent per year. The rate of growth in hedge fundassets has been even more rapid. In 1997, there were more than 1200 hedgefunds managing a total of more than $200 billion. Though the number andsize of hedge funds are small relative to mutual funds, their growth ref lectsthe importance of this alternative investment vehicle for institutional inves-tors and wealthy individual investors.1
As the name implies, hedge funds began as investment partnerships thatcould take long and short positions. They have evolved into a multifacetedorganizational structure that defies simple definition. There are, however, a
*Ackermann is at the College of Business Administration, University of Notre Dame. McEnallyand Ravenscraft are at the Kenan-Flagler Business School, University of North Carolina, ChapelHill. We thank Brian Barrett, Ken French, Martin Gross, Lee Hennessee, Lois Peltz, IndiraPeters, Jacob Punnoose, Dick Oberuc, Richard Rendleman, Steve Slezak, René Stulz, threeanonymous referees, and seminar participants at the 1997 American Finance Association Meet-ings, the 1996 European Hedge Fund Conference, the 1996 Financial Management AssociationMeetings, and the University of North Carolina at Chapel Hill for helpful comments and sug-gestions. We also gratefully acknowledge UNC’s Center for Financial Accounting Research fordata funding and a Pipkin Faculty Development Award and Townsend Research Fellowship forsummer support.
1 Statistics on hedge fund growth appear in Hennessee Hedge Fund Review, June 1998; “Ahitchhiker’s guide to hedge funds,” Economist, June 13, 1998; “Gaining an edge with hedgefunds,” Business Week, July 29, 1996; and in Lederman and Klein ~1995!.
THE JOURNAL OF FINANCE • VOL. LIV, NO. 3 • JUNE 1999
833
number of features that characterize hedge funds. These features include alargely unregulated organizational structure, f lexible investment strategies,relatively sophisticated investors, substantial managerial investment, andstrong managerial incentives. Hedge funds may therefore yield insights intothe impact of regulation, alternative investment practices, and incentive align-ment on performance.
Domestic hedge funds are largely unregulated because they are typicallylimited partnerships with fewer than 100 investors, which exempts themfrom the Investment Company Act of 1940.2 Offshore hedge funds are non-U.S. corporations and are not subject to SEC regulation. This limited regu-lation allows hedge funds to be extremely f lexible in their investment options.Hedge funds can use short selling, leverage, derivatives, and highly concen-trated investment positions to enhance returns or reduce systematic risk.They can also attempt to time the market by moving quickly across diverseasset categories. Hedge funds attract mainly institutions and wealthy indi-vidual investors, with minimum investments typically ranging from $250,000to $1 million. Additionally, hedge funds often limit an investor’s liquiditywith lock-up periods of one year for initial investors and subsequent restric-tions on withdrawals to quarterly intervals. One cost of this f lexibility isthat hedge funds face strong advertising restrictions.
Hedge funds are also characterized by strong performance incentives. Onaverage, hedge fund managers receive a 1 percent annual management feeand 14 percent of the annual profits. For most funds this bonus incentive feeis paid only if the returns surpass some hurdle rate or “high-water mark”—meaning there is no incentive fee until the fund has recovered past losses.Although incentive fees and high-water marks could lead to excess risktaking under some conditions, there are countervailing forces that may dampenrisk. Hedge fund managers often invest a substantial amount of their ownmoney in the fund. Furthermore, the managers of U.S. hedge funds aregeneral partners, so they may incur substantial liability if the fund goesbankrupt.3
These structural aspects of hedge funds are in sharp contrast to the or-ganizational structure of the more common pooled investment mechanism,mutual funds. Mutual funds are regulated by the SEC. The regulations, to-gether with mutual fund prospectus disclosure requirements, are designedto carefully inform the investor and limit some potentially risky activities.These regulations and disclosure requirements generally limit the usage of
2 In June 1997, the 100 investor limit was lifted for hedge funds that impose a $5 millioninvestor net worth requirement. However, for the sample period used in this paper, the 100investor limit was in effect.
3 In some ways, the structure of hedge funds closely resembles that of venture capital funds.Venture capital funds tend to be limited partnerships with strong incentive fees. However,there seems to be less variation in incentive fees for venture capital funds. Gompers and Lerner~1999! document that 81 percent of the venture capital funds in their sample have incentivefees of 20 to 21 percent.
834 The Journal of Finance
short selling, leverage, concentrated investments, and derivatives.4 Smallminimum investments and daily withdrawals are also common for mutualfunds, and incentive fees for managers are extremely rare.5 Mutual fund feesare largely based on fund size; however, indirect performance incentives ex-ist if size and performance are strongly linked. Mutual funds have an ad-vantage in creating this link because they can advertise performance.
Marked differences also exist in the extent of academic research into mu-tual funds and hedge funds. There is a substantial mutual fund literature,but academic research into hedge funds is just emerging. Two recent hedgefund papers ref lect this trend. Using monthly data from TASS Managementand Paradigm LDC, Fung and Hsieh ~1997! show that time-series and cross-sectional differences in leverage and long and short positions make analyz-ing hedge fund strategies more complex. The static buy-and-hold strategiesthat Sharpe ~1992! found to work for mutual funds must be adapted to in-clude five new investment styles for hedge funds. Using annual data fromThe U.S. Offshore Funds Directory, Brown, Goetzmann, and Ibbotson ~1999!investigate the performance and survival of offshore hedge funds. They findthat these hedge funds display positive systematic risk-adjusted returns.The superior performance does not appear to stem from managerial skill, forthey find no evidence of performance persistence. However, some of the pos-itive hedge fund returns may result from survival-related conditioning bi-ases. Several practitioner papers using a large sample of hedge funds alsofind evidence of superior hedge fund performance ~see Hennessee ~1994! andOberuc ~1994!!.
This paper expands this emerging hedge fund literature in four directions.First, we analyze hedge fund performance using a larger sample that in-cludes both U.S. and offshore funds, monthly instead of annual return data,
4 The Investment Company Act of 1940 allows mutual funds to participate in these activitiesonly if they are spelled out in their prospectuses. Many mutual funds do place these investmentoptions in their prospectuses but they rarely use such options. For example, mutual funds areallowed leverage up to 50 percent of their net assets. Yet only 236 out of the 6,997 mutual fundsin the Morningstar database had a negative cash balance at the end of 1995 and only 12 had anegative cash balance greater than 225 percent. Thus, rarely do mutual funds approach theallowed limit of leverage. The conservative investment strategies of mutual funds might stemfrom the nature of mutual fund investors, notification requirements for using certain invest-ment options, larger cash f luctuations due to limited withdrawal restrictions, or additionalregulatory restrictions. For instance, mutual funds must borrow from a bank when buyingsecurities on margin, and diversified mutual funds get preferential tax treatment ~CDA0Wiesenberger!.
5 The dearth of incentive fees for mutual funds can be directly tied to regulation. A 1972 SECstudy shows that performance fee arrangements were becoming common before 1970. In 1968and 1969, approximately 40 percent of all new investment companies proposed performance-related fees. In 1970, Congress amended The Investment Company Act of 1940, requiring thatall performance fees be symmetrical—that is, managers had to pay a fee if fund performancefell short of performance goals equal to the amount they received if fund performance exceededthe goals. By 1972, performance fee plans were employed in only 10 percent of funds. By 1995,only 117 of the 6,997 mutual funds in the Morningstar database employed incentive fees.
The Performance of Hedge Funds 835
and a broader set of metrics than Brown et al. ~1999!. Second, we performseveral new data-conditioning bias analyses including following defunct fundsthrough liquidation, exploring a multiperiod sampling bias, and document-ing a regulatory-related, self-selection bias that offsets survival-related bi-ases, especially for U.S. hedge funds. Third, we provide a potential explanationfor the superior performance of hedge funds by linking one of the key hedgefund characteristics—incentive fee—to performance. Fourth, we show thathedge funds are significantly riskier than their mutual fund counterpartsand we explore the determinants of this increased volatility.
The structure of this article is as follows. Section I explores the link be-tween hedge fund characteristics and performance using a principal-agentframework. A description of the hedge fund database, variables, and hypoth-eses is given in Section II. Section III presents the main empirical resultsconcerning the risk and return performance of hedge funds relative to stan-dard indices and mutual funds. This section also demonstrates the stronglink between incentive fees and hedge fund performance. The impact of nu-merous data-conditioning biases is assessed in Section IV. Section V con-cludes the paper with a summary and discussion of caveats that reveal futureresearch opportunities.
I. Hedge Fund Structure and Performance
The relationship between investors and fund managers can be character-ized by principal-agent models ~Ross ~1973!, Holmstrom ~1979!!.6 The idealfund structure aligns investors’ goals with fund managers’ incentives. Other-wise, managers may consume perks, reduce effort, or incur risks that lowerreturns to investors. Four basic mechanisms mitigate principal-agent prob-lems: incentive contracts, ownership structure, market forces, and govern-ment regulation. Hedge funds generally emphasize the first two solutions.In contrast, mutual funds tend to rely more heavily on the latter two.
Using a principal-agent model, Starks ~1987! analyzes the impact of in-centive contracts on portfolio managers’ investment decisions. Her modelallows managers to choose the portfolio risk level and the level of resourcesallocated to improving portfolio returns. She compares two types of incentivecontracts, symmetric and bonus plans. Both plans pay managers a fee ifthey exceed some benchmark return. Symmetric plans also penalize man-agers if they fall short of that benchmark. Starks finds that symmetric con-tracts align risk preferences of investors and fund managers, but they lead
6 Jensen and Meckling ~1976! employ the principal-agent model to explain the relationshipbetween shareholders and corporate managers. Their article has spawned a vast literature onthe relationship between senior management compensation, ownership, and corporate perfor-mance. Our paper focuses on similar issues, but in the context of the investor-fund managerrelationship.
836 The Journal of Finance
to a less than optimal investment in resources. Bonus plans are inferior tosymmetric plans because managers select more risk and less resource in-vestment than is optimal for investors.7
Hedge fund incentive plans are primarily bonus plans. Thus, we cannotdirectly test Starks’ hypothesized difference between symmetric and bonusplans. Starks’ model does imply that bonus plans enhance managerial effortrelative to no incentives. This increased effort should translate into higherperformance for funds with bonus incentive plans, but possibly with thetrade-off of inducing greater risk. More recently, Carpenter ~1998! exploresthe link between risk and bonus incentive fees using a general utility functionand benchmark portfolio model. Her model shows that increases in incentivefees decrease managerial risk taking. Thus, evaluating the impact of incentiveplans on investors’ wealth requires an evaluation of both risk and return.
A second solution to the principal-agent problem links agents and princi-pals through joint ownership. For investment funds, joint ownership re-quires managers to invest a significant amount of their own wealth in thefund. Starks ~1987! notes that the findings of her model might change whenthe manager’s undiversifiable capital is considered. Intuitively, managerialinvestment should increase effort, but it may make managers risk averserelative to investors’ preferred risk level. Thus, the combination of manage-rial investment and incentive bonus plans may move managerial effort closerto the optimal level, counteracting the nonoptimal risk taking of these ap-proaches taken individually. Hedge funds are noted for combining consider-able managerial investment with strong incentive bonus fees.
Market forces provide a third potential solution to the principal-agent prob-lem. If investors are well informed and willing to act on that information,then investors will exit funds in which managerial effort is too low or risktaking too high in favor of funds with more optimal efforts and risks. Ip-polito ~1992! and Sirri and Tufano ~1998! both find some support for theimportance of this mechanism in the mutual fund industry. These papersfind that exceptionally high fund performance leads to a significant inf lowof new money. They reach different conclusions for exceptionally poorly per-forming funds. In particular, Sirri and Tufano ~1998! find that poorly per-forming mutual funds are not penalized in terms of a significant loss ofinvestor dollars. A different market mechanism may come into play for poorperformers. Khorana ~1996! shows that up to two years of below averageperformance significantly increases the probability that a mutual fund man-ager will be replaced. These market mechanisms may also be at work in thehedge fund industry, although their impact may be weaker. Information on
7 Golec ~1992! also applies a principal-agent model to fund management. His model specifiesmanagerial effort as information production. Incentive contracts impact both return and riskthrough this information production. His empirical analysis of 27 mutual funds with incentivefees offers some support for his model. However, his model focuses more on determining incen-tive fee parameters than on how incentives affect risk and return.
The Performance of Hedge Funds 837
mutual fund performance is much more prevalent, given the advertisingrestrictions on hedge funds. The managerial ownership stake in hedge fundsmay also lessen managerial replacement.
A fourth mechanism for resolving principal-agent problems is regulation.Regulation can restrict the agent’s ability to take advantage of the principal.However, these restrictions may constrain profit-maximizing opportunities.For example, in 1970 Congress required incentive plans to be symmetrical,to prevent potential risk-taking abuses from bonus incentive plans. Thisregulation has had potentially negative consequences. Mutual fund manag-ers appear to prefer no incentive plan to symmetric incentive plans. Conse-quently, symmetric incentive fees are very rare in the mutual fund industry,and bonus incentive fees are common in the hedge fund industry where theincentive plan regulations do not apply.
A similar regulatory trade-off may exist for mutual fund restrictions onlockup periods, leverage, short selling, concentrated investments, and deriv-atives. These restrictions are in place to prevent managers from takingon what are perceived to be inappropriate risks, but they may also limit someappropriate applications of these tools. In particular, these may be importanttechniques for laying off systematic risk. Similar regulatory restrictions areplaced on pension funds. Since mutual funds and pension funds comprise a sub-stantial portion of investment assets, these regulatory restrictions may allowhedge funds to earn excess risk-adjusted returns by focusing on arbitrage op-portunities through the use of less commonly employed investment strat-egies. Ackermann and Ravenscraft ~1998! demonstrate that these regulatoryrestrictions lead to dramatic differences between hedge funds and mutual fundswith respect to the use of lockup periods, illiquid securities, short selling,derivatives, leverage, and concentration. These investment differences alsoappear to handicap mutual fund performance relative to hedge funds.
II. Data, Variables, and Hypotheses
Reporting of data on hedge funds is voluntary, therefore no one source iscomprehensive. To develop a large database on both existing and defuncthedge funds, we combine two of the leading publicly available hedge funddatabases. The two databases are Managed Account Reports, Inc. ~MAR!,which is distributed through LaPorte Asset Allocation System, and HedgeFund Research, Inc. ~HFR!. At the end of 1995, the combined data sets con-tain 1272 funds with at least one monthly net return observation. However,the number of unique funds is 923 because 349 funds are reported in bothdata sources.8 The sample is further reduced to 906 by the elimination of 5
8 It is reassuring to find that data from the duplicate funds are identical in almost all cases.In those few instances where a significant disagreement exists, we reconcile these differencesby calling the fund, referring to additional sources ~Nelson’s Directory of Investment Managersand The US Offshore Funds Directory! or consulting with the data suppliers. Similar researchis employed to fill in missing auxiliary data items for 22 funds.
838 The Journal of Finance
Natural Resource funds, 11 funds that combine multiple funds, and 1 poten-tial performance outlier.9 The combined data contain the largest collection ofcomplete, cross-checked, monthly hedge fund returns currently available.Both databases perform a number of due diligence checks to verify the ac-curacy of the data.
Returns are defined as the change in net asset value during the month~assuming the reinvestment of any distributions on the reinvestment dateused by the fund! divided by the net asset value at the beginning of themonth. Returns are net of management fees, incentive fees, and other fundexpenses. As in the case of U.S. open-end mutual funds, this is the basisfor actual returns received by investors. In practice, actual investor returnsdiffer from reported returns due to factors such as sales and redemptionfees, and differences between bid and ask prices offered by the fund. Thevast majority of funds report returns in U.S. dollars. We convert the fewforeign currency returns to U.S. dollars using appropriate spot exchangerates available in the International Monetary Fund’s International Finan-cial Statistics.10
The use of monthly data has some strong advantages over annual returnsused by Brown et al. ~1999!. Monthly returns greatly enhance the accuracyof our standard deviation measure of risk. For our two- to eight-year sam-ples, our standard deviation estimates are based on 24 to 96 observations,rather than 2 to 8 for annual data. Annual returns also smooth large vari-ations in returns caused by external market forces and dynamic hedge fundstrategies. Given the importance of risk-adjusted returns and our direct analy-sis of hedge fund risks, this accuracy is critical. Monthly data are also crit-ical for some aspects of survival bias analyses. With monthly data we canstudy funds that survive less than one year and we can track our defunctfunds through the month of liquidation.
The disadvantages of monthly data are twofold. First, The U.S. OffshoreFunds Directory contains a historical list of funds that can be used to directlyanalyze backfilling. Using these data, Brown et al. ~1999! shows the poten-tial importance of backfilling bias. The trade-off is they use annual data onoffshore funds only. We find some weak evidence that U.S. funds outperformoffshore funds and some strong evidence that U.S. and offshore funds exhibitdifferent levels of risk and are subject to different conditioning biases.
A second problem with monthly returns stems from estimating returns netof incentive fees. Incentive fees are typically based on performance over a
9 The Natural Resource funds category is a relatively new one and does not have sufficienttime series to be consistently reported in this study. We cannot identify a closely related cat-egory into which the data can be combined. Including these five observations in the total sam-ple has no effect. The potential outlier is a fund with almost no performance variance over a2-year period. This fund transforms a below-average 7.7 percent annual return into a very largeSharpe ratio ~Sharpe ~1966!!.
10 Additionally, a very small number of funds trade on overseas exchanges. In these cases,the actual return received by the investor depends directly on the market price of the fund,rather than on its net asset value. These funds still report net asset value returns.
The Performance of Hedge Funds 839
quarter or year. Net monthly returns can only be estimated after the incen-tive period is over and even then the allocation to the months within theincentive fee period is somewhat arbitrary. However, net monthly return isa calculation hedge funds and their investors take seriously. The auditedreports that hedge funds send to investors generally include monthly re-turns and these are the same returns the funds supply to the databases. Sub-scription and redemption opportunities typically do not correspond to theincentive fee period. Many incentive fee periods are annual, whereas more than85 percent of the hedge funds allow multiple redemption opportunities eachyear. The incentive fee is prorated to these entering and exiting investors usinga variety of allocation mechanisms. Hedge funds handle monthly reporting ina similar manner. Monthly returns are estimated during the incentive fee pe-riod, then within several months after the period is over, hedge funds ~who re-port net monthly returns! send corrected monthly net return data to the datavendors. These updated data allocate the ex post incentive fee across months,again using a variety of allocation methods. Therefore, in doing hedge fund re-search with monthly data it is important to wait until midyear to obtain datafor the prior year so that the corrected data can be entered.11
Ex post data, however, are still inaccurate. The correct value of the netreturn can be obtained by viewing the incentive fee from an option perspec-tive. For a fund with a 20 percent incentive fee, the investor’s position iscomparable to having a portfolio of assets and being short 20 percent of acall with a strike price at the high-water mark. The option value of the callis a measure of the incentive fee that the investor expects to pay at the endof the period. With this perspective, any biases in the reported ex post netreturns could be assessed through simulation. Using a mean return of 13.5percent and a standard deviation of 20 percent, we compare an ex post al-location rule of equally distributing the actual end-of-year incentive fee acrossall 12 months, with the option perspective incentive fee allocation. The equaldistribution rule would result in an ex post reported Sharpe ratio below theoption-based mean and a variance that is higher than the option-based vari-ance. This would bias monthly return hedge fund studies against finding apositive relationship between incentive fee and Sharpe ratio and toward find-ing a positive relationship between incentive fee and risk.12 Unfortunately,hedge funds use many different methods to allocate incentive fees across
11 This description of the monthly return calculation is based on discussions with the datasources, industry experts, hedge fund accounting firms, and hedge fund managers. The incen-tive fee issue is made more complicated by high-water marks and hurdle rates. If high-watermarks are the same for all investors, then high-water marks accentuate the measurementproblem, making ex post adjustments even more important. If new investors have differenthigh-water marks, then returns are not the same for all investors in the fund. This problemexists for both monthly and annual data. Typically, hedge funds report the returns for theinitial investor, although sometimes it is for the average investor.
12 We thank Stephen Brown and an anonymous referee for suggesting this option perspec-tive. The anonymous referee provided the simulation results discussed above using a log-normal distribution and 20,000 simulations of 5-year returns. Dick Rendleman helped us confirmthese findings using the same parameters and a binomial distribution.
840 The Journal of Finance
months. Existing data do not even fully identify the set of methods used, letalone their frequency. Therefore the equal distribution rule illustrates thepotential for a bias, but it cannot be used to accurately assess the directionand magnitude of the potential mismeasurement. Given the importance of thisissue, additional research to identify these methods and their impact on monthlyreturn estimates is needed. These fundamental trade-offs between annual andmonthly data suggest that performance studies using both data frequenciesare warranted to capture the strengths and weaknesses of each approach.
To ensure a sufficient number of observations for measuring risk and risk-adjusted returns, we restrict our sample to funds with a minimum of 24months of current data. The combined data set contains 547 funds withmonthly returns from January 1, 1994 through December 31, 1995 ~the mostrecent year available at the start of this study!. In addition to the two-yearsample, we report findings on 4-, 6-, and 8-year periods, all ending Decem-ber 31, 1995. The number of hedge funds with data covering these periods is272, 150, and 79, respectively. The decision to overlap the sample periodsworks against hedge funds. As the results will show, 1994–1995 is the worstperiod for hedge fund returns.
As with almost any database, our hedge fund data may contain variousforms of conditioning bias. For mutual funds, Brown and Goetzmann ~1995!,Elton, Gruber, and Blake ~1996!, and Malkiel ~1995! estimate that the in-clusion of discontinued funds reduces the average annual mutual fund returnby between 0.2 and 1.4 percentage points. Brown et al. ~1999! find that the sur-vivorship bias is about 3 percentage points per year for offshore hedge funds.
In December 1992, HFR began keeping data on funds that stop reporting.MAR began this practice in December 1993. In the combined data set, 146unique funds cease reporting during the 1993 through 1995 period. Five ofthese funds are dropped because they report for three months or less. Thesefive funds have above average return performance, but extreme Sharpe val-ues. The database also notes the reason that reporting ends: discontinuationand self-selection. Only 37 of the 141 funds report that they are discontin-ued ~liquidate, restructure, or merge into another fund!. The remaining 104funds stop reporting because of self-selection. Specifically, they simply stopvoluntary reporting.13 In Section IV, we analyze a variety of survival-relatedbiases that could affect the performance findings.
13 We cannot verify that funds which stop voluntary reporting continue to operate. Thus,some of these funds may belong in the terminated category. Several factors inf luence the de-cision to voluntarily report. Generally, funds find it advantageous to join the databases becauseof the exposure they receive. The decision to list, however, has an important potential drawbackbecause activities associated with reporting may be interpreted as illegal advertising by theSEC. In February 1995, Barron’s published a list of individual hedge fund statistics from theMAR database ~Barron’s, July 10, 1995, p. 15!. The SEC investigated and warned that furthersuch releases of information might lead to regulation of participating funds. A number of fundsterminated reporting to the MAR database after this warning, specifically citing this threat.This climate suggests that withdrawing funds consist of underperformers that do not wish topublicize their performance, plus larger, successful funds that do not wish to ~or need to! chanceSEC intervention.
The Performance of Hedge Funds 841
The databases provide auxiliary data on a number of hedge fund charac-teristics that can be used to test some of the theories discussed in Section I.The broad type of investment style used by the hedge fund is specified. MARdescribes the investment style through a classification system in which hedgefunds are assigned to one of seven categories. These categories include eventdriven, global, global macro, market neutral, short sales, U.S. opportunistic,and fund of funds. The MAR definition of each of these categories is given inFigure 1. HFR contains a detailed description of the investment strategythat allows us to place their funds into the MAR system. If there is sometrade-off between return and systematic risk, then market neutral and shortselling funds should earn lower raw returns.
Both databases report management and incentive fees. The incentive feeis the percentage of annual profits ~over some benchmark or high-water mark!captured by fund management. Table I shows basic descriptive statistics formanagement fee, incentive fee and several other hedge fund characteristics.The mean and median values for incentive fee are 14 and 20 percent, re-spectively. Hedge funds give managers strong incentives, and, consistent withthe diversity of hedge funds, this incentive varies substantially across fundswith a range of zero to 50 percent. However, much of the distribution isconcentrated at two points, zero and 20 percent. As discussed in the preced-ing section, principal-agent theory predicts that incentive fees—which aligninvestor and fund manager interests—should improve returns. If global stock,currency, and bond markets are strongly efficient, however, hedge funds willnot be able to recover their fees, which could lead to an inferior net return.Incentive fees may also impact the risk, although incentive fee models yielddifferent predictions regarding the direction of this impact.
In addition to the incentive fee, most hedge funds charge an annual man-agement fee. According to Table I, the mean and median annual manage-ment fees are approximately 1 percent of assets with a range between zeroand 6 percent. We expect that management fees either only recover theircosts if the hedge fund market is competitive ~Grossman and Stiglitz ~1980!,Ippolito ~1989!! or may result in losses if agency problems exist ~Jensen~1968!, Elton et al. ~1993!!.
We define the age of a fund as the number of months since its inception.Given that age is truncated at 24 months, the mean and median ages are 63and 49 months. A positive coefficient on age may indicate that experiencehelps fund managers identify and exploit mispriced assets. Alternatively,age may ref lect a potential survival bias. Because the databases we usebackfill much of the older data, the older funds may contain a dispropor-tionate number of surviving funds.
The databases classify hedge funds into two domiciles, U.S. and offshore:U.S. hedge funds are generally limited partnerships with ~until very re-cently! fewer than 100 investors and offshore hedge funds are typically cor-porations. The main advantage of offshore hedge funds is that the number ornet worth of investors is not limited. Thus, offshore funds tend to be larger.Offshore funds can accept U.S. investors, but there are limitations on how
842 The Journal of Finance

Event Driven:Distressed Securities - Manager focuses on securities of companies in reorga-nization and bankruptcy, ranging from senior secured debt to the common stockof the company.Risk Arbitrage - Manager simultaneously buys stock in a company being ac-quired and sells stock in its acquirers.
Global:International - Manager pays attention to economic change around the world~except the United States! but more bottom-up oriented in that managers tendto be stock-pickers in markets they like. Uses index derivatives to a muchlesser extent than macro managers.Emerging - Manager invests in less mature financial markets of the world, e.g.Hong Kong, Singapore, Pakistan, India. Because shorting is not permitted inmany emerging markets, managers must go to cash or other markets whenvaluations make being long unattractive.Regional - Manager focuses on specific regions of the world, e.g. Latin America,Asia, Europe.
Global Macro:Opportunistic trading manager that profits from changes in global economies,typically based on major interest rate shifts. Uses leverage and derivatives.
Market Neutral:Long/short stocks - Half long0half short. Manager attempts to lock-out or neu-tralize market risk. In theory, market risk is greatly reduced but it is very dif-ficult to make a profit on a large diversified portfolio so stock picking is critical.Convertible arbitrage - Manager goes long convertible securities and short the un-derlying equities.Stock index arbitrage - Manager buys a basket of stocks and sells short stock in-dex futures, or the reverse.Fixed income arbitrage - Manager buys T-bonds and sells short other T-bonds thatreplicate the bond purchased in terms of rate and maturity.
Short Sales:Manager takes a position that stock prices will go down. Used as a hedge for long-only portfolios and by those who feel market is approaching a bearish trend.
U.S. Opportunistic:Value - Manager focuses on assets, cash f low, book value, out-of-favor stocks.Growth - Manager invests in growth stocks; revenues, earnings, and growth po-tential are key.Short term - Manager holds positions for a short time frame.
Fund of Funds:Capital is allocated among a number of hedge funds, providing investors with ac-cess to managers they might not be able to discover or evaluate on their own. Usu-ally has a lower minimum than a hedge fund.
Figure 1. Definitions of Managed Account Reports (MAR) categories. MAR definitionsof hedge fund types and subtypes are listed above. The MAR database classifies funds at thetype level.
The Performance of Hedge Funds 843
they can solicit U.S. investors, and the number and wealth of U.S. investorsis still restricted. Table I shows that these two types are almost equallyrepresented in our sample. U.S. funds might be expected to have somewhathigher risk-adjusted returns because their managers take on added liabilityas general partners.14
The correlation matrix of hedge fund characteristics, shown in Table II,reveals several statistically significant differences between fund features.15
Incentive fees tend to be significantly higher in the United States, and inevent driven, global macro, and market neutral categories. Incentives aresignificantly lower in the fund of funds and global categories. Global macroand event driven funds are significantly larger than average, while shortsales, U.S. opportunistic, and U.S. hedge funds tend to be significantly smallerthan average. The only significant correlations among the noncategorical
14 Another control variable that is commonly used in many finance studies is size. Fundsmay exhibit economies or diseconomies of scale. The diseconomies could arise from difficulty inreplicating strategies for a large fund, especially if the strategy involves profiting from smallarbitrage opportunities. The sample contains an impressive range in fund size from $100 thou-sand to $4.3 billion, with mean and median fund sizes of $108 million and $27 million, respec-tively. Unfortunately, estimating size in our regression framework suffers from a serious causationproblem. This problem is made worse by the fact that we do not have a complete time series onsize. All funds report the dollar value of assets at the end of our sample period ~1995!. As wemove back in time, the number of size observations drops. Using end-of-period size creates aproblem if fund growth is tied to superior fund performance. End-of-period size is positively andgenerally significantly correlated with fund performance. However, given the causation prob-lem, we omit size from the analysis. The regression results presented in Tables VIII and IX arevery similar to those with size included in the regression equation.
15 Unless otherwise specified, statistical significance in this paper is defined at the 5 percentlevel for a two-tailed test.
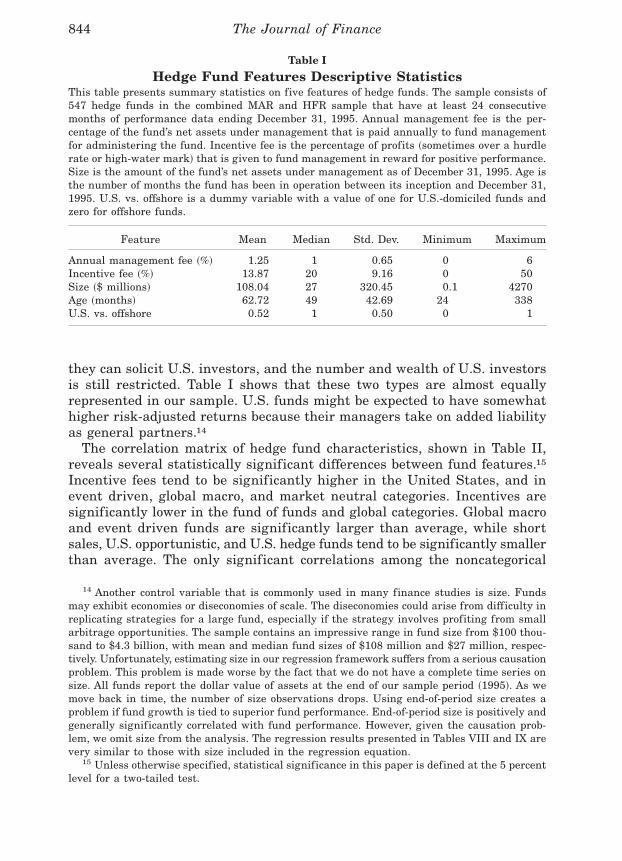
Table I
Hedge Fund Features Descriptive StatisticsThis table presents summary statistics on five features of hedge funds. The sample consists of547 hedge funds in the combined MAR and HFR sample that have at least 24 consecutivemonths of performance data ending December 31, 1995. Annual management fee is the per-centage of the fund’s net assets under management that is paid annually to fund managementfor administering the fund. Incentive fee is the percentage of profits ~sometimes over a hurdlerate or high-water mark! that is given to fund management in reward for positive performance.Size is the amount of the fund’s net assets under management as of December 31, 1995. Age isthe number of months the fund has been in operation between its inception and December 31,1995. U.S. vs. offshore is a dummy variable with a value of one for U.S.-domiciled funds andzero for offshore funds.
Feature Mean Median Std. Dev. Minimum Maximum
Annual management fee ~%! 1.25 1 0.65 0 6Incentive fee ~%! 13.87 20 9.16 0 50Size ~$ millions! 108.04 27 320.45 0.1 4270Age ~months! 62.72 49 42.69 24 338U.S. vs. offshore 0.52 1 0.50 0 1
844 The Journal of Finance

Table II
Estimated Correlations of Hedge Fund FeaturesThis table presents Pearson correlations for five features of hedge funds and seven investment style classifications of hedge funds. The sampleconsists of 547 hedge funds in the combined MAR and HFR sample that have at least 24 consecutive months of performance data endingDecember 31, 1995. Annual management fee ~MGT! is the percentage of the fund’s net assets under management that is paid annually to fundmanagement for administering the fund. Incentive fee ~INCENT! is the percentage of profits ~sometimes over a hurdle rate or high-water mark!that is given to fund management in reward for positive performance. SIZE is the natural logarithm of the amount of the fund’s net assets undermanagement ~in millions! as of December 31, 1995. AGE is the number of months the fund has been in operation between its inception andDecember 31, 1995. U.S. vs. offshore ~US! is a dummy variable with a value of one for U.S.-domiciled funds and zero for offshore funds. EVENT,FOF, GLOBAL, GLMAC, NEUT, SHORT, and USOP are abbreviations for Event Driven, Fund of Funds, Global, Global Macro, Market Neutral,Short Sales, and U.S. Opportunistic, respectively. These are dummy variables that have a value of one if a fund is in the specified category andzero otherwise. p-values are given in parentheses.
Feature MGT INCENT SIZE AGE US EVENT FOF GLOBAL GLMAC NEUT SHORT USOP
MGT 1.00~0.00!
INCENT 20.06 1.00~0.18! ~0.00!
SIZE 20.02 0.08 1.00~0.71! ~0.08! ~0.00!
AGE 20.02 20.12 0.33 1.00~0.64! ~0.00! ~0.00! ~0.00!
US 20.19 0.09 20.09 20.05 1.00~0.00! ~0.03! ~0.04! ~0.28! ~0.00!
EVENT 0.05 0.24 0.09 0.09 0.09 1.00~0.29! ~0.00! ~0.05! ~0.04! ~0.03! ~0.00!
FOF 0.07 20.34 20.07 20.08 20.03 20.18 1.00~0.09! ~0.00! ~0.11! ~0.07! ~0.44! ~0.00! ~0.00!
GLOBAL 20.00 20.11 0.04 20.06 20.18 20.16 20.25 1.00~0.96! ~0.01! ~0.33! ~0.15! ~0.00! ~0.00! ~0.00! ~0.00!
GLMAC 0.05 0.14 0.16 0.07 20.09 20.12 20.19 20.17 1.00~0.20! ~0.00! ~0.00! ~0.12! ~0.03! ~0.01! ~0.00! ~0.00! ~0.00!
NEUT 20.00 0.12 20.01 20.05 0.04 20.13 20.20 20.19 20.14 1.00~1.00! ~0.00! ~0.79! ~0.22! ~0.40! ~0.00! ~0.00! ~0.00! ~0.00! ~0.00!
SHORT 20.07 0.05 20.09 20.01 0.01 20.04 20.06 20.06 20.04 20.04 1.00~0.12! ~0.25! ~0.03! ~0.76! ~0.79! ~0.37! ~0.16! ~0.20! ~0.35! ~0.30! ~0.00!
USOP 20.12 0.05 20.12 0.07 0.17 20.19 20.29 20.27 20.20 20.22 20.06 1.00~0.00! ~0.29! ~0.00! ~0.13! ~0.00! ~0.00! ~0.00! ~0.00! ~0.00! ~0.00! ~0.14! ~0.00!
Th
eP
erforman
ceof
Hed
geF
un
ds
845
variables are the expected positive relationship between age and size and anegative relation between age and incentive fee. Newer hedge funds seem tobe imposing higher incentive fees. These simple correlations demonstratethe need to evaluate hedge fund categories and hedge fund characteristics ina multiple regression framework. However, none of the simple correlationsare so large that they raise serious multicollinearity concerns.
In the next section, we compare hedge fund performance to a number ofgeneral market indices and to similarly classified mutual funds. The mutualfund return data and classifications are obtained from Morningstar. FrankRussell Company provided data on the Russell 2000 index. All other indicesare obtained from MAR. Index and mutual fund returns are also total returnfigures in U.S. dollars.
III. Results
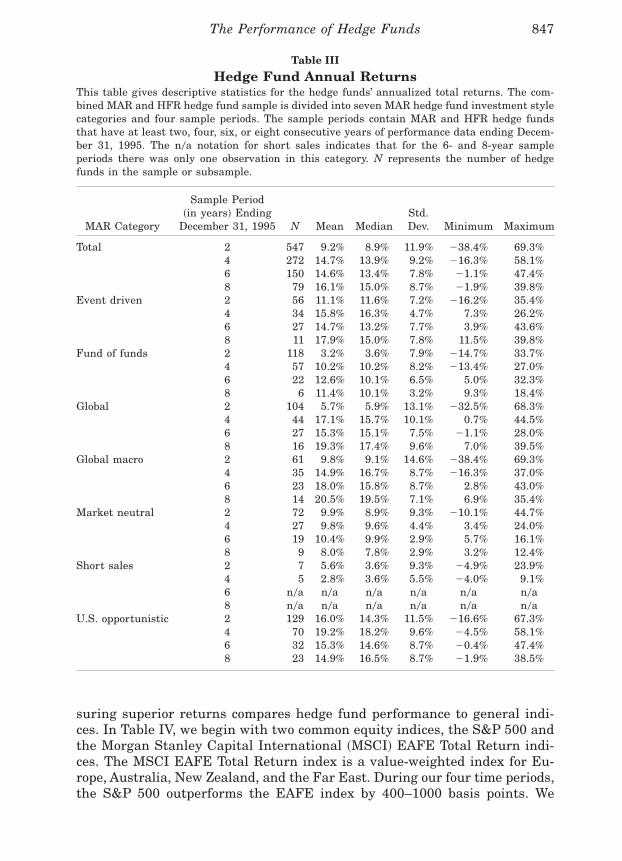
Table III reports mean and median annualized total returns for the sevenMAR categories.16 Returns are net of fees and expenses, but in this tablethey are not adjusted for risk nor compared to any general index. As with allthe tables, we report findings for the 2-, 4-, 6-, and 8-year sample periodsending December 31, 1995. Except for the short sales category, we have aminimum of 56 observations for each category in the 2-year sample. Thatminimum drops to six observations for the 8-year sample. The 2- and 4-yearshort sales findings should be interpreted with caution because we only haveseven and five observations. Results for the 6- and 8-year short sales sampleare not reported because we only have one observation.
On average, hedge funds earn a mean annualized return of between 9.2and 16.1 percent over the 8-year observation period. There is, however, sub-stantial variation across fund classifications. In the more recent periods,event driven and U.S. opportunistic funds earn superior returns. In the lon-ger period samples, global and global macro funds excel. Market neutral,short sales, and funds of funds tend to earn returns below the sample av-erage; however, these funds are designed to reduce risk and they do consis-tently display the smallest standard deviations in individual fund returns.Global, global macro, and U.S. opportunistic tend to display some of thehighest variation in returns ~as measured by both the standard deviationand range!. The only category that shows above-average returns and below-average variance is event driven. With this one exception, the risk and re-turn profile of the hedge fund categories is consistent with the standardrisk-return trade-off and the general definitions of the fund classifications.
A. Absolute Returns Relative to Standard Indices
The first formal statistical tests are presented in Table IV where we beginto address the general question of whether the structural advantages of hedgefunds are sufficient to generate superior returns. Our first effort at mea-
16 The performance measures used in this paper assume an annual holding period.
846 The Journal of Finance
suring superior returns compares hedge fund performance to general indi-ces. In Table IV, we begin with two common equity indices, the S&P 500 andthe Morgan Stanley Capital International ~MSCI! EAFE Total Return indi-ces. The MSCI EAFE Total Return index is a value-weighted index for Eu-rope, Australia, New Zealand, and the Far East. During our four time periods,the S&P 500 outperforms the EAFE index by 400–1000 basis points. We
Table III
Hedge Fund Annual ReturnsThis table gives descriptive statistics for the hedge funds’ annualized total returns. The com-bined MAR and HFR hedge fund sample is divided into seven MAR hedge fund investment stylecategories and four sample periods. The sample periods contain MAR and HFR hedge fundsthat have at least two, four, six, or eight consecutive years of performance data ending Decem-ber 31, 1995. The n0a notation for short sales indicates that for the 6- and 8-year sampleperiods there was only one observation in this category. N represents the number of hedgefunds in the sample or subsample.
MAR Category
Sample Period~in years! Ending
December 31, 1995 N Mean MedianStd.Dev. Minimum Maximum
Total 2 547 9.2% 8.9% 11.9% 238.4% 69.3%4 272 14.7% 13.9% 9.2% 216.3% 58.1%6 150 14.6% 13.4% 7.8% 21.1% 47.4%8 79 16.1% 15.0% 8.7% 21.9% 39.8%
Event driven 2 56 11.1% 11.6% 7.2% 216.2% 35.4%4 34 15.8% 16.3% 4.7% 7.3% 26.2%6 27 14.7% 13.2% 7.7% 3.9% 43.6%8 11 17.9% 15.0% 7.8% 11.5% 39.8%
Fund of funds 2 118 3.2% 3.6% 7.9% 214.7% 33.7%4 57 10.2% 10.2% 8.2% 213.4% 27.0%6 22 12.6% 10.1% 6.5% 5.0% 32.3%8 6 11.4% 10.1% 3.2% 9.3% 18.4%
Global 2 104 5.7% 5.9% 13.1% 232.5% 68.3%4 44 17.1% 15.7% 10.1% 0.7% 44.5%6 27 15.3% 15.1% 7.5% 21.1% 28.0%8 16 19.3% 17.4% 9.6% 7.0% 39.5%
Global macro 2 61 9.8% 9.1% 14.6% 238.4% 69.3%4 35 14.9% 16.7% 8.7% 216.3% 37.0%6 23 18.0% 15.8% 8.7% 2.8% 43.0%8 14 20.5% 19.5% 7.1% 6.9% 35.4%
Market neutral 2 72 9.9% 8.9% 9.3% 210.1% 44.7%4 27 9.8% 9.6% 4.4% 3.4% 24.0%6 19 10.4% 9.9% 2.9% 5.7% 16.1%8 9 8.0% 7.8% 2.9% 3.2% 12.4%
Short sales 2 7 5.6% 3.6% 9.3% 24.9% 23.9%4 5 2.8% 3.6% 5.5% 24.0% 9.1%6 n0a n0a n0a n0a n0a n0a8 n0a n0a n0a n0a n0a n0a
U.S. opportunistic 2 129 16.0% 14.3% 11.5% 216.6% 67.3%4 70 19.2% 18.2% 9.6% 24.5% 58.1%6 32 15.3% 14.6% 8.7% 20.4% 47.4%8 23 14.9% 16.5% 8.7% 21.9% 38.5%
The Performance of Hedge Funds 847
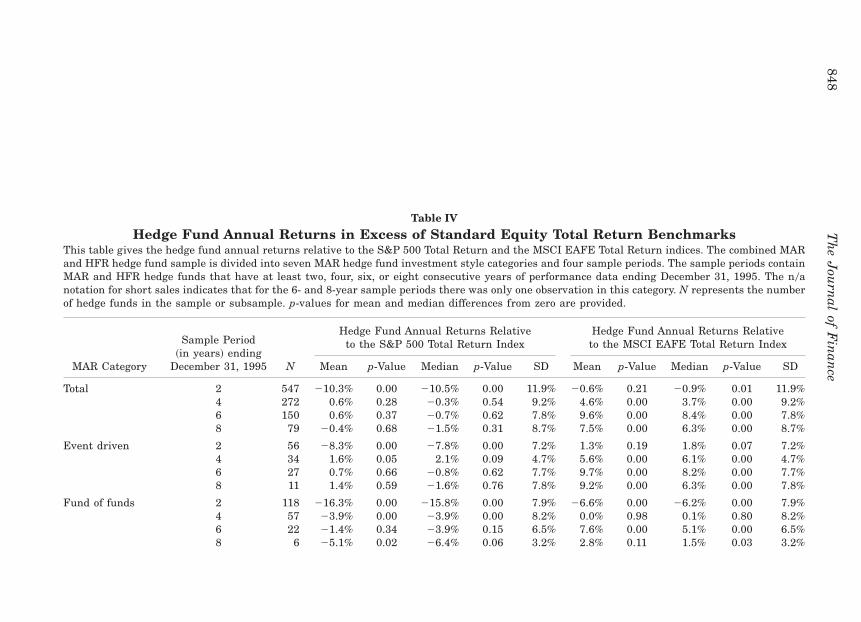
Table IV
Hedge Fund Annual Returns in Excess of Standard Equity Total Return BenchmarksThis table gives the hedge fund annual returns relative to the S&P 500 Total Return and the MSCI EAFE Total Return indices. The combined MARand HFR hedge fund sample is divided into seven MAR hedge fund investment style categories and four sample periods. The sample periods containMAR and HFR hedge funds that have at least two, four, six, or eight consecutive years of performance data ending December 31, 1995. The n0anotation for short sales indicates that for the 6- and 8-year sample periods there was only one observation in this category. N represents the numberof hedge funds in the sample or subsample. p-values for mean and median differences from zero are provided.
Hedge Fund Annual Returns Relativeto the S&P 500 Total Return Index
Hedge Fund Annual Returns Relativeto the MSCI EAFE Total Return Index
MAR Category
Sample Period~in years! ending
December 31, 1995 N Mean p-Value Median p-Value SD Mean p-Value Median p-Value SD
Total 2 547 210.3% 0.00 210.5% 0.00 11.9% 20.6% 0.21 20.9% 0.01 11.9%4 272 0.6% 0.28 20.3% 0.54 9.2% 4.6% 0.00 3.7% 0.00 9.2%6 150 0.6% 0.37 20.7% 0.62 7.8% 9.6% 0.00 8.4% 0.00 7.8%8 79 20.4% 0.68 21.5% 0.31 8.7% 7.5% 0.00 6.3% 0.00 8.7%
Event driven 2 56 28.3% 0.00 27.8% 0.00 7.2% 1.3% 0.19 1.8% 0.07 7.2%4 34 1.6% 0.05 2.1% 0.09 4.7% 5.6% 0.00 6.1% 0.00 4.7%6 27 0.7% 0.66 20.8% 0.62 7.7% 9.7% 0.00 8.2% 0.00 7.7%8 11 1.4% 0.59 21.6% 0.76 7.8% 9.2% 0.00 6.3% 0.00 7.8%
Fund of funds 2 118 216.3% 0.00 215.8% 0.00 7.9% 26.6% 0.00 26.2% 0.00 7.9%4 57 23.9% 0.00 23.9% 0.00 8.2% 0.0% 0.98 0.1% 0.80 8.2%6 22 21.4% 0.34 23.9% 0.15 6.5% 7.6% 0.00 5.1% 0.00 6.5%8 6 25.1% 0.02 26.4% 0.06 3.2% 2.8% 0.11 1.5% 0.03 3.2%
848T
he
Jou
rnal
ofF
inan
ce
Global 2 104 213.7% 0.00 213.5% 0.00 13.1% 24.1% 0.00 23.9% 0.00 13.1%4 44 2.9% 0.06 1.6% 0.14 10.1% 6.9% 0.00 5.6% 0.00 10.1%6 27 1.3% 0.40 1.1% 0.45 7.5% 10.3% 0.00 10.1% 0.00 7.5%8 16 2.7% 0.29 0.8% 0.29 9.6% 10.6% 0.00 8.7% 0.00 9.6%
Global macro 2 61 29.6% 0.00 210.3% 0.00 14.6% 0.0% 0.99 20.7% 0.95 14.6%4 35 0.7% 0.62 2.5% 0.23 8.7% 4.7% 0.00 6.5% 0.00 8.7%6 23 4.0% 0.04 1.8% 0.03 8.7% 13.0% 0.00 10.9% 0.00 8.7%8 14 4.0% 0.06 2.9% 0.06 7.1% 11.8% 0.00 10.8% 0.00 7.1%
Market neutral 2 72 29.6% 0.00 210.5% 0.00 9.3% 0.1% 0.96 20.9% 0.56 9.3%4 27 24.4% 0.00 24.6% 0.00 4.4% 20.4% 0.65 20.6% 0.36 4.4%6 19 23.6% 0.00 24.2% 0.00 2.9% 5.5% 0.00 4.9% 0.00 2.9%8 9 28.6% 0.00 28.7% 0.00 2.9% 20.7% 0.52 20.8% 0.57 2.9%
Short sales 2 7 213.8% 0.01 215.8% 0.03 9.3% 24.2% 0.31 26.2% 0.30 9.3%4 5 211.3% 0.01 210.5% 0.06 5.5% 27.3% 0.06 26.5% 0.06 5.5%6 n0a n0a n0a n0a n0a n0a n0a n0a n0a n0a n0a8 n0a n0a n0a n0a n0a n0a n0a n0a n0a n0a n0a
U.S. opportunistic 2 129 23.4% 0.00 25.1% 0.00 11.5% 6.3% 0.00 4.5% 0.00 11.5%4 70 5.0% 0.00 4.0% 0.00 9.6% 9.0% 0.00 8.0% 0.00 9.6%6 32 1.3% 0.42 0.6% 0.60 8.7% 10.3% 0.00 9.6% 0.00 8.7%8 23 21.7% 0.38 0.0% 0.42 8.7% 6.2% 0.00 7.8% 0.00 8.7%
Th
eP
erforman
ceof
Hed
geF
un
ds
849
focus on equity indices because there are few pure bond hedge funds. For the391 hedge funds that provide regional composition information, 27 percenthold primarily international assets and 34 percent hold a balance of U.S.and international assets. The EAFE index is used instead of the MSCI Worldindex, because the World index gives heavy weight to the S&P and wouldtherefore yield results between the EAFE and the S&P.17
If we look at the full hedge fund sample versus both indices, the resultssuggest a draw. Of the 16 mean and median values in the full sample sectionof Table IV, eight are positive and eight are negative. In three cases thehedge fund returns are significantly below the index and in six cases thehedge funds significantly outperform the index.
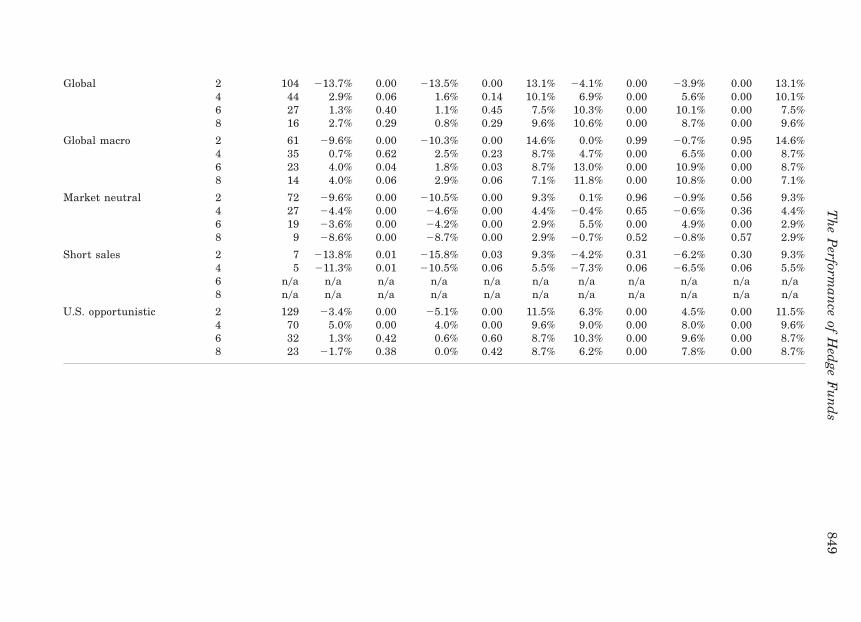
Hedge funds’ ability to outperform the market clearly depends on the timeperiod, the market index, and the hedge fund category. Hedge funds tend tounderperform the market in 1994 and 1995. During this period, 21 of the 32values for individual hedge fund categories in Table IV are significantlynegative and only two are significantly positive. Because the S&P 500 indexoutperforms the EAFE index in all sample periods, hedge funds look muchbetter relative to EAFE. Using the EAFE index, 37 of the 60 means andmedians are significantly positive, and only five are significantly negative.Using the S&P 500 index, only five are significantly positive and 26 aresignificantly negative. However, 16 of these 26 occur in the 1994–1995 periodand all of the remainder occur in the three categories designed to reducerisk: fund of funds, market neutral, and short sales. In fact, the market-adjusted returns in these three categories are always negative. If there isany form of risk return trade-off, then it is not surprising that these catego-ries underperform the market. Excluding the 1994–1995 sample, the fourremaining categories display returns above the S&P 500 index in 21 of the24 cases considered in Table IV.
B. Risk and Return
The preceding analysis ignores differences in risk between hedge fundsand the various indices. Hedge funds may be enhancing returns by takingon extra risk. Alternatively, some hedge funds are designed to reduce risk.
17 During our four time periods, most of the other common indices ~Wilshire 5000, Russell2000, Lehman Government0Corporate Bond, Lehman Aggregate Bond, and Balanced ~60 per-cent S&P and 40 percent Lehman Aggregate Bond!! also display annual returns between theS&P and the EAFE. The exceptions on the negative side are the two bond indices, which areroughly 200 basis points below the EAFE index during 1994–1995 and 1992–1995. An exceptionon the positive side is the Russell 2000 index, which is 100 to 200 basis points above the S&Pduring the 1992–1995 and the 1990–1995 periods. Excess returns based on the S&P 500 mightbe biased upward, to the extent that hedge funds hold small firm stocks. Unfortunately, we donot have detailed information on the percentage of small stock holdings for most hedge funds.For the 2-, 4-, 6-, and 8-year periods, twenty-two, nine, four, and three hedge funds state thatthey primarily invest in U.S. small stocks. Their mean annual excess returns relative to theRussell 2000 ~with p-values in parentheses! are 8.4 percent ~0.00!, 7.1 percent ~0.03!, 9.7 per-cent ~0.02!, and 5.9 percent ~0.09!. The median excess returns are similar.
850 The Journal of Finance
In Table V we account for total risk using the traditional Sharpe ratio,~Rh 2 Rf!0sh, where Rh is the hedge fund return, Rf is the riskless rate ofreturn ~90-day T-bills!, and sh is the standard deviation of the individualhedge fund return over the period considered ~Sharpe ~1966!!. In this table,we use only the full sample hedge fund category so that hedge funds can becompared to eight standard indices.
Overall, the conclusions are similar to those in Table IV. Hedge funds donot consistently outperform market aggregates. In fact, on a total risk-adjusted basis, the market has a slight edge with 35 of the 64 mean andmedian comparisons in favor of the market indices. The 1994–1995 sampleperiod is again the worst for hedge funds. During this period, the only indexthe hedge funds beat is EAFE. However, over the 6-year period from 1990through 1995, hedge funds significantly outperform all but the bond-basedindices. Although hedge funds do not consistently beat the market, they doappear to be earning enough of a superior return to cover their costs giventhat the hedge fund returns in Tables IV and V are net of fees and expenses.
Portfolio theory offers an alternative approach to viewing the value ofhedge funds. Elton, Gruber, and Rentzler ~1987! develop a methodology forassessing the contribution of an alternative investment portfolio to an ex-isting portfolio. For a new asset group to be a valuable addition to the port-folio, the Sharpe ratio of the new asset group must exceed the product of theSharpe ratio of the existing portfolio and the correlation of the asset groupand the current portfolio.18 The correlations between the hedge fund returnsand the eight indices for our four time periods range from 0.136 to 0.323.Applying even the maximum correlation to the Sharpe ratios in Table V re-veals that hedge funds augment all of these indices for all of our time periods.
Many hedge funds use tools designed to reduce systematic rather thantotal risk. Though this is obviously true for short sellers and market neutralfunds, techniques such as short sales are employed by most hedge funds. Ifthere is a trade-off between systematic risk and return, the above results donot fully capture a potentially important hedge fund advantage. We do findthat hedge funds have small b’s with a mean and median value of 0.28 and0.23 for the S&P 500. Market neutral and short sales funds have the ex-pected zero and negative values for b. Furthermore, Jensen’s a ~Jensen ~1968!!is significantly positive for hedge funds in all samples except the 2-yearperiod and typically ranges from 6 to 8 percent. This fundamental finding oflow b’s and positive a’s holds for the other indices used in Table V. Brownet al. ~1999! find similar a’s and b’s for their 1989–1995 sample period de-spite dramatic differences with regard to sample frequency and composition.Unfortunately, empirically verifying the low systematic risk claims of hedgefunds is problematic. Fung and Hsieh ~1997! reveal some of the difficultiesin measuring hedge fund performance, especially these simple measures ofsystematic risk.
18 Edwards and Park ~1996! and Irwin, Krukemyer, and Zulauf ~1993! use this approach toevaluate managed futures and public commodity pools.
The Performance of Hedge Funds 851
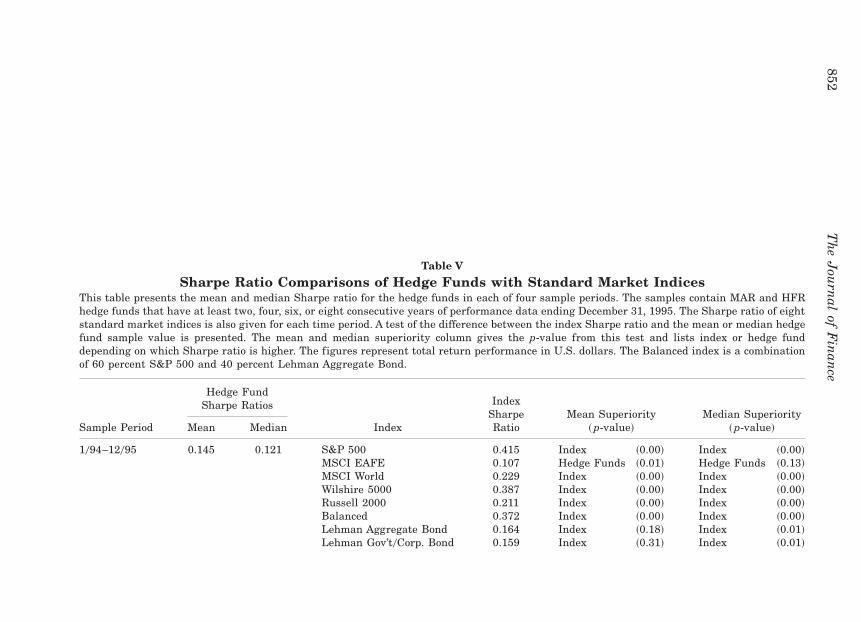
Table V
Sharpe Ratio Comparisons of Hedge Funds with Standard Market IndicesThis table presents the mean and median Sharpe ratio for the hedge funds in each of four sample periods. The samples contain MAR and HFRhedge funds that have at least two, four, six, or eight consecutive years of performance data ending December 31, 1995. The Sharpe ratio of eightstandard market indices is also given for each time period. A test of the difference between the index Sharpe ratio and the mean or median hedgefund sample value is presented. The mean and median superiority column gives the p-value from this test and lists index or hedge funddepending on which Sharpe ratio is higher. The figures represent total return performance in U.S. dollars. The Balanced index is a combinationof 60 percent S&P 500 and 40 percent Lehman Aggregate Bond.
Hedge FundSharpe Ratios
Sample Period Mean Median Index
IndexSharpeRatio
Mean Superiority~ p-value!
Median Superiority~ p-value!
1094–12095 0.145 0.121 S&P 500 0.415 Index ~0.00! Index ~0.00!MSCI EAFE 0.107 Hedge Funds ~0.01! Hedge Funds ~0.13!MSCI World 0.229 Index ~0.00! Index ~0.00!Wilshire 5000 0.387 Index ~0.00! Index ~0.00!Russell 2000 0.211 Index ~0.00! Index ~0.00!Balanced 0.372 Index ~0.00! Index ~0.00!Lehman Aggregate Bond 0.164 Index ~0.18! Index ~0.01!Lehman Gov’t0Corp. Bond 0.159 Index ~0.31! Index ~0.01!
852T
he
Jou
rnal
ofF
inan
ce
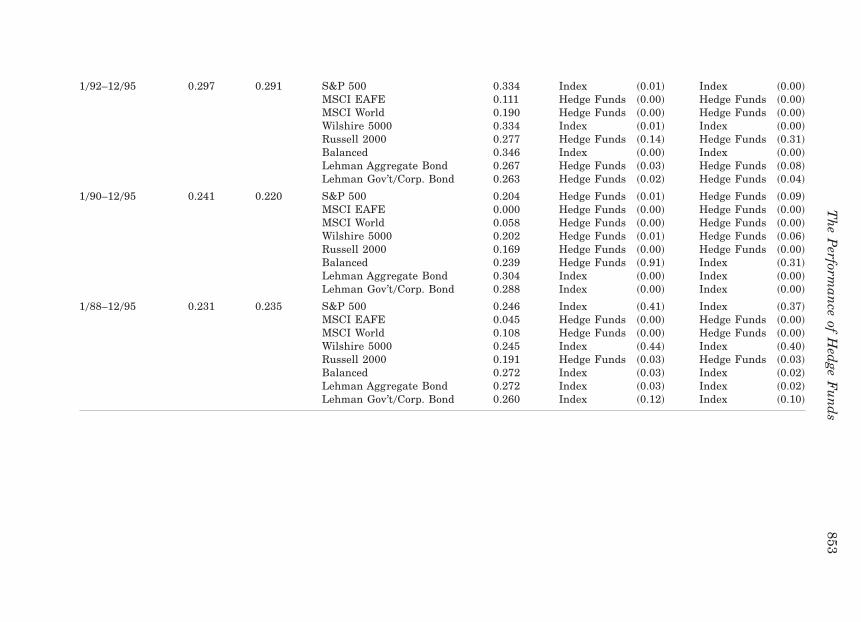
1092–12095 0.297 0.291 S&P 500 0.334 Index ~0.01! Index ~0.00!MSCI EAFE 0.111 Hedge Funds ~0.00! Hedge Funds ~0.00!MSCI World 0.190 Hedge Funds ~0.00! Hedge Funds ~0.00!Wilshire 5000 0.334 Index ~0.01! Index ~0.00!Russell 2000 0.277 Hedge Funds ~0.14! Hedge Funds ~0.31!Balanced 0.346 Index ~0.00! Index ~0.00!Lehman Aggregate Bond 0.267 Hedge Funds ~0.03! Hedge Funds ~0.08!Lehman Gov’t0Corp. Bond 0.263 Hedge Funds ~0.02! Hedge Funds ~0.04!
1090–12095 0.241 0.220 S&P 500 0.204 Hedge Funds ~0.01! Hedge Funds ~0.09!MSCI EAFE 0.000 Hedge Funds ~0.00! Hedge Funds ~0.00!MSCI World 0.058 Hedge Funds ~0.00! Hedge Funds ~0.00!Wilshire 5000 0.202 Hedge Funds ~0.01! Hedge Funds ~0.06!Russell 2000 0.169 Hedge Funds ~0.00! Hedge Funds ~0.00!Balanced 0.239 Hedge Funds ~0.91! Index ~0.31!Lehman Aggregate Bond 0.304 Index ~0.00! Index ~0.00!Lehman Gov’t0Corp. Bond 0.288 Index ~0.00! Index ~0.00!
1088–12095 0.231 0.235 S&P 500 0.246 Index ~0.41! Index ~0.37!MSCI EAFE 0.045 Hedge Funds ~0.00! Hedge Funds ~0.00!MSCI World 0.108 Hedge Funds ~0.00! Hedge Funds ~0.00!Wilshire 5000 0.245 Index ~0.44! Index ~0.40!Russell 2000 0.191 Hedge Funds ~0.03! Hedge Funds ~0.03!Balanced 0.272 Index ~0.03! Index ~0.02!Lehman Aggregate Bond 0.272 Index ~0.03! Index ~0.02!Lehman Gov’t0Corp. Bond 0.260 Index ~0.12! Index ~0.10!
Th
eP
erforman
ceof
Hed
geF
un
ds
853
C. Hedge Funds versus Mutual Funds
An alternative approach to assessing hedge fund performance is to com-pare hedge funds to mutual funds. This comparison offers several advan-tages over indices. As discussed in the introduction, mutual funds and hedgefunds are closely related managed funds that differ on a number of poten-tially important characteristics. Performance differences between these twogroups may ref lect the advantages and disadvantages of these characteris-tics. For many investors, mutual funds are one of the most common forms ofalternative investment mechanisms to hedge funds. Furthermore, hedge fundsand mutual funds can often be matched more carefully, avoiding problems ofselecting the right indices.
Since some MAR categories ~market neutral, short sales! do not have mu-tual fund equivalents, new category definitions are required. We define twosets of mutually exclusive categories. The first set is stock, bond, or bal-anced. Funds are assigned to the stock or bond category if the fund primar-ily invests in one of these two types of assets. Funds with significant holdingsof both stocks and bonds are assigned to the balanced category. The secondset is United States, international, and global. Funds with primarily non-U.S. investments are labeled as international. Funds with a balance of U.S.and foreign investments are classified as global.19 To further sharpen com-parisons, we also report results for the four subcategories for which we havesufficient data, U.S. stock, U.S. balanced, global stock, and global balanced.Mutual funds are assigned to these classifications based on Morningstarcategory descriptions.20 For hedge funds, the data sources generally statewhether the fund contains stocks or bonds and the regional focus of the fund.
The results of the hedge fund and mutual fund Sharpe ratio comparisonare given in Table VI. The first category contains the full sample of hedgefunds and mutual funds with returns for the 2-, 4-, 6-, and 8-year periods.For the full sample, hedge funds always outperform mutual funds except forthe median return in the 2-year period. In the 4-, 6-, and 8-year periods,either the mean or median difference is statistically significant.
The individual category results show that this hedge fund advantage isfairly pervasive across categories, although the statistical significance of the8-year sample often wanes because of the sharply reduced sample size. Themean or median hedge fund return is significantly greater than the corre-sponding mutual fund value in 36 of the 80 individual category comparisons.The reverse is true in only three cases. These three cases are for the 2-yearsample of stock and balanced funds. Hedge funds hold substantially moreinternational assets in these categories. As Table VI shows, international
19 These definitions of international and global are common in the mutual fund industry, andare adopted here. Although MAR classifies international as a subcategory of global, MAR providesinvestment region information that permits a distinction between international and global funds.
20 We exclude municipal bond funds from the mutual fund sample because we expect a fun-damental difference between the Sharpe ratios of municipal and taxable bonds. There are nomunicipal bond hedge funds in our sample.
854 The Journal of Finance
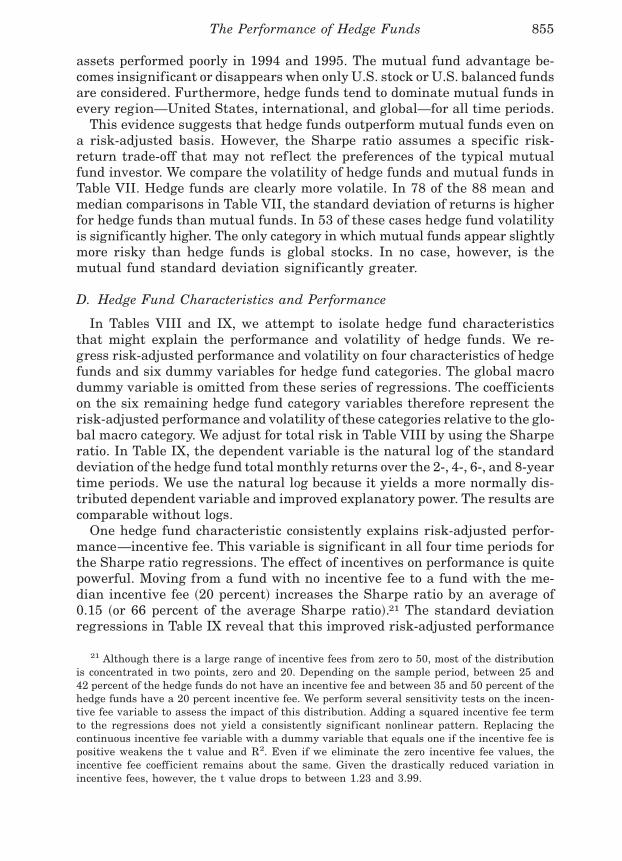
assets performed poorly in 1994 and 1995. The mutual fund advantage be-comes insignificant or disappears when only U.S. stock or U.S. balanced fundsare considered. Furthermore, hedge funds tend to dominate mutual funds inevery region—United States, international, and global—for all time periods.
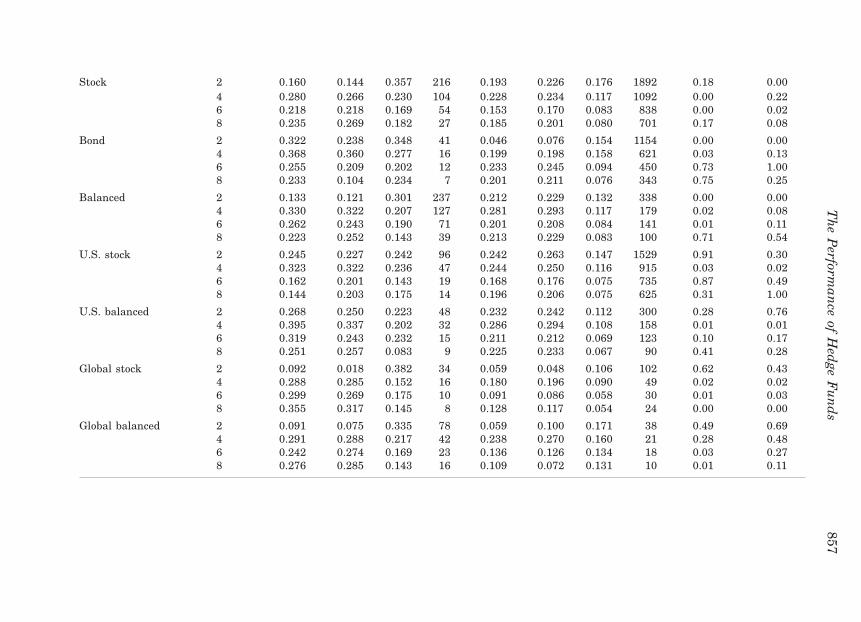
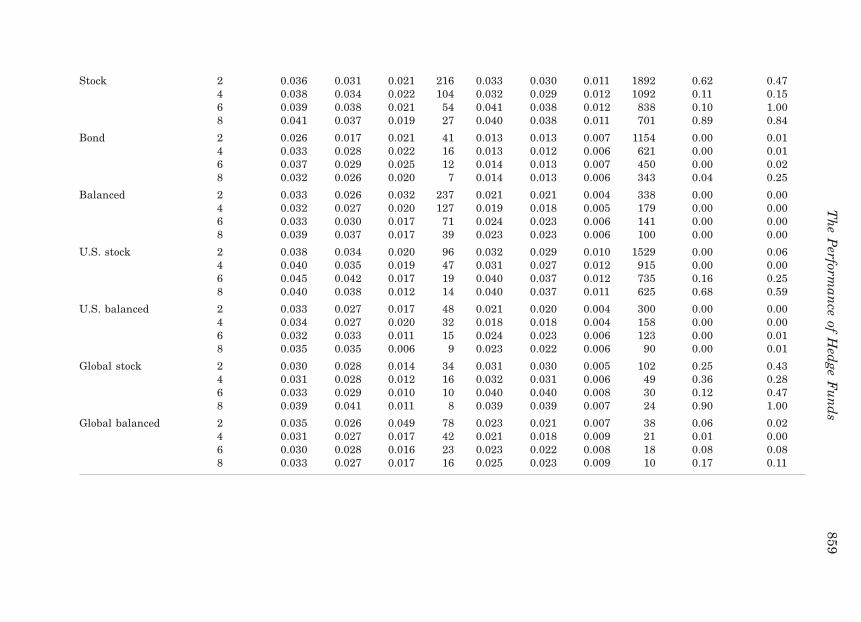
This evidence suggests that hedge funds outperform mutual funds even ona risk-adjusted basis. However, the Sharpe ratio assumes a specific risk-return trade-off that may not ref lect the preferences of the typical mutualfund investor. We compare the volatility of hedge funds and mutual funds inTable VII. Hedge funds are clearly more volatile. In 78 of the 88 mean andmedian comparisons in Table VII, the standard deviation of returns is higherfor hedge funds than mutual funds. In 53 of these cases hedge fund volatilityis significantly higher. The only category in which mutual funds appear slightlymore risky than hedge funds is global stocks. In no case, however, is themutual fund standard deviation significantly greater.
D. Hedge Fund Characteristics and Performance
In Tables VIII and IX, we attempt to isolate hedge fund characteristicsthat might explain the performance and volatility of hedge funds. We re-gress risk-adjusted performance and volatility on four characteristics of hedgefunds and six dummy variables for hedge fund categories. The global macrodummy variable is omitted from these series of regressions. The coefficientson the six remaining hedge fund category variables therefore represent therisk-adjusted performance and volatility of these categories relative to the glo-bal macro category. We adjust for total risk in Table VIII by using the Sharperatio. In Table IX, the dependent variable is the natural log of the standarddeviation of the hedge fund total monthly returns over the 2-, 4-, 6-, and 8-yeartime periods. We use the natural log because it yields a more normally dis-tributed dependent variable and improved explanatory power. The results arecomparable without logs.
One hedge fund characteristic consistently explains risk-adjusted perfor-mance—incentive fee. This variable is significant in all four time periods forthe Sharpe ratio regressions. The effect of incentives on performance is quitepowerful. Moving from a fund with no incentive fee to a fund with the me-dian incentive fee ~20 percent! increases the Sharpe ratio by an average of0.15 ~or 66 percent of the average Sharpe ratio!.21 The standard deviationregressions in Table IX reveal that this improved risk-adjusted performance
21 Although there is a large range of incentive fees from zero to 50, most of the distributionis concentrated in two points, zero and 20. Depending on the sample period, between 25 and42 percent of the hedge funds do not have an incentive fee and between 35 and 50 percent of thehedge funds have a 20 percent incentive fee. We perform several sensitivity tests on the incen-tive fee variable to assess the impact of this distribution. Adding a squared incentive fee termto the regressions does not yield a consistently significant nonlinear pattern. Replacing thecontinuous incentive fee variable with a dummy variable that equals one if the incentive fee ispositive weakens the t value and R2. Even if we eliminate the zero incentive fee values, theincentive fee coefficient remains about the same. Given the drastically reduced variation inincentive fees, however, the t value drops to between 1.23 and 3.99.
The Performance of Hedge Funds 855
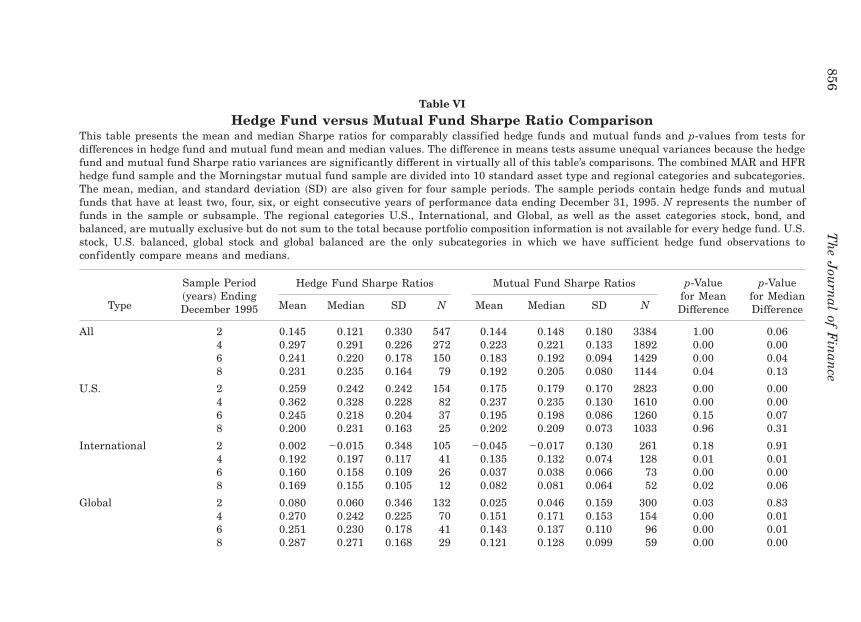
Table VI
Hedge Fund versus Mutual Fund Sharpe Ratio ComparisonThis table presents the mean and median Sharpe ratios for comparably classified hedge funds and mutual funds and p-values from tests fordifferences in hedge fund and mutual fund mean and median values. The difference in means tests assume unequal variances because the hedgefund and mutual fund Sharpe ratio variances are significantly different in virtually all of this table’s comparisons. The combined MAR and HFRhedge fund sample and the Morningstar mutual fund sample are divided into 10 standard asset type and regional categories and subcategories.The mean, median, and standard deviation ~SD! are also given for four sample periods. The sample periods contain hedge funds and mutualfunds that have at least two, four, six, or eight consecutive years of performance data ending December 31, 1995. N represents the number offunds in the sample or subsample. The regional categories U.S., International, and Global, as well as the asset categories stock, bond, andbalanced, are mutually exclusive but do not sum to the total because portfolio composition information is not available for every hedge fund. U.S.stock, U.S. balanced, global stock and global balanced are the only subcategories in which we have sufficient hedge fund observations toconfidently compare means and medians.
Hedge Fund Sharpe Ratios Mutual Fund Sharpe Ratios
Type
Sample Period~years! EndingDecember 1995 Mean Median SD N Mean Median SD N
p-Valuefor MeanDifference
p-Valuefor MedianDifference
All 2 0.145 0.121 0.330 547 0.144 0.148 0.180 3384 1.00 0.064 0.297 0.291 0.226 272 0.223 0.221 0.133 1892 0.00 0.006 0.241 0.220 0.178 150 0.183 0.192 0.094 1429 0.00 0.048 0.231 0.235 0.164 79 0.192 0.205 0.080 1144 0.04 0.13
U.S. 2 0.259 0.242 0.242 154 0.175 0.179 0.170 2823 0.00 0.004 0.362 0.328 0.228 82 0.237 0.235 0.130 1610 0.00 0.006 0.245 0.218 0.204 37 0.195 0.198 0.086 1260 0.15 0.078 0.200 0.231 0.163 25 0.202 0.209 0.073 1033 0.96 0.31
International 2 0.002 20.015 0.348 105 20.045 20.017 0.130 261 0.18 0.914 0.192 0.197 0.117 41 0.135 0.132 0.074 128 0.01 0.016 0.160 0.158 0.109 26 0.037 0.038 0.066 73 0.00 0.008 0.169 0.155 0.105 12 0.082 0.081 0.064 52 0.02 0.06
Global 2 0.080 0.060 0.346 132 0.025 0.046 0.159 300 0.03 0.834 0.270 0.242 0.225 70 0.151 0.171 0.153 154 0.00 0.016 0.251 0.230 0.178 41 0.143 0.137 0.110 96 0.00 0.018 0.287 0.271 0.168 29 0.121 0.128 0.099 59 0.00 0.00
856T
he
Jou
rnal
ofF
inan
ce
Stock 2 0.160 0.144 0.357 216 0.193 0.226 0.176 1892 0.18 0.004 0.280 0.266 0.230 104 0.228 0.234 0.117 1092 0.00 0.226 0.218 0.218 0.169 54 0.153 0.170 0.083 838 0.00 0.028 0.235 0.269 0.182 27 0.185 0.201 0.080 701 0.17 0.08
Bond 2 0.322 0.238 0.348 41 0.046 0.076 0.154 1154 0.00 0.004 0.368 0.360 0.277 16 0.199 0.198 0.158 621 0.03 0.136 0.255 0.209 0.202 12 0.233 0.245 0.094 450 0.73 1.008 0.233 0.104 0.234 7 0.201 0.211 0.076 343 0.75 0.25
Balanced 2 0.133 0.121 0.301 237 0.212 0.229 0.132 338 0.00 0.004 0.330 0.322 0.207 127 0.281 0.293 0.117 179 0.02 0.086 0.262 0.243 0.190 71 0.201 0.208 0.084 141 0.01 0.118 0.223 0.252 0.143 39 0.213 0.229 0.083 100 0.71 0.54
U.S. stock 2 0.245 0.227 0.242 96 0.242 0.263 0.147 1529 0.91 0.304 0.323 0.322 0.236 47 0.244 0.250 0.116 915 0.03 0.026 0.162 0.201 0.143 19 0.168 0.176 0.075 735 0.87 0.498 0.144 0.203 0.175 14 0.196 0.206 0.075 625 0.31 1.00
U.S. balanced 2 0.268 0.250 0.223 48 0.232 0.242 0.112 300 0.28 0.764 0.395 0.337 0.202 32 0.286 0.294 0.108 158 0.01 0.016 0.319 0.243 0.232 15 0.211 0.212 0.069 123 0.10 0.178 0.251 0.257 0.083 9 0.225 0.233 0.067 90 0.41 0.28
Global stock 2 0.092 0.018 0.382 34 0.059 0.048 0.106 102 0.62 0.434 0.288 0.285 0.152 16 0.180 0.196 0.090 49 0.02 0.026 0.299 0.269 0.175 10 0.091 0.086 0.058 30 0.01 0.038 0.355 0.317 0.145 8 0.128 0.117 0.054 24 0.00 0.00
Global balanced 2 0.091 0.075 0.335 78 0.059 0.100 0.171 38 0.49 0.694 0.291 0.288 0.217 42 0.238 0.270 0.160 21 0.28 0.486 0.242 0.274 0.169 23 0.136 0.126 0.134 18 0.03 0.278 0.276 0.285 0.143 16 0.109 0.072 0.131 10 0.01 0.11
Th
eP
erforman
ceof
Hed
geF
un
ds
857

Table VII
Hedge Fund versus Mutual Fund Volatility ComparisonThis table presents the mean and median volatility ~measured as the standard deviation of monthly total returns! for comparably classifiedhedge funds and mutual funds. p-values from tests for differences in hedge fund and mutual fund mean and median values are also given. Thenonparametric Wilcoxon-Mann-Whitney mean test is used since the distributions of the standard deviations are bounded by zero. t-test resultsare very similar. The combined MAR and HFR hedge fund sample and the Morningstar mutual fund sample are divided into 10 standard assettype and regional categories and subcategories. The mean, median and standard deviation ~SD! is also given for four sample periods. The sampleperiods contain hedge funds and mutual funds that have at least two, four, six or eight consecutive years of performance data ending December31, 1995. N represents the number of funds in the sample or subsample. The regional categories U.S., International and Global, as well as theasset categories Stock, Bond and Balanced, are mutually exclusive but do not sum to the total because portfolio composition information is notavailable for every hedge fund. U.S. Stock, U.S. Balanced, Global Stock and Global Balanced are the only subcategories in which we havesufficient hedge fund observations to confidently compare means and medians.
Standard Deviation of Monthly Total Returns
Hedge Funds Mutual Funds
Type
Sample Period~years! EndingDecember 1995 Mean Median SD N Mean Median SD N
p-Valuefor MeanDifference
p-Valuefor MedianDifference
All 2 0.034 0.027 0.027 547 0.025 0.025 0.013 3384 0.00 0.004 0.034 0.029 0.022 272 0.024 0.023 0.013 1892 0.00 0.006 0.035 0.032 0.020 150 0.031 0.031 0.016 1429 0.01 0.868 0.037 0.036 0.018 79 0.031 0.032 0.015 1144 0.00 0.05
U.S. 2 0.035 0.030 0.019 154 0.024 0.024 0.012 2823 0.00 0.004 0.037 0.032 0.020 82 0.023 0.022 0.013 1610 0.00 0.006 0.038 0.037 0.017 37 0.030 0.031 0.016 1260 0.01 0.018 0.036 0.036 0.012 25 0.030 0.031 0.015 1033 0.02 0.01
International 2 0.045 0.037 0.024 105 0.040 0.035 0.013 261 0.25 0.204 0.054 0.045 0.027 41 0.041 0.037 0.010 128 0.04 0.106 0.054 0.047 0.023 26 0.045 0.043 0.010 73 0.38 0.618 0.056 0.051 0.023 12 0.044 0.043 0.009 52 0.04 0.06
Global 2 0.036 0.028 0.041 132 0.023 0.022 0.011 300 0.00 0.004 0.034 0.029 0.019 70 0.022 0.019 0.010 154 0.00 0.006 0.034 0.029 0.017 41 0.027 0.022 0.012 96 0.01 0.008 0.036 0.036 0.016 29 0.028 0.024 0.012 59 0.01 0.11
858T
he
Jou
rnal
ofF
inan
ce
Stock 2 0.036 0.031 0.021 216 0.033 0.030 0.011 1892 0.62 0.474 0.038 0.034 0.022 104 0.032 0.029 0.012 1092 0.11 0.156 0.039 0.038 0.021 54 0.041 0.038 0.012 838 0.10 1.008 0.041 0.037 0.019 27 0.040 0.038 0.011 701 0.89 0.84
Bond 2 0.026 0.017 0.021 41 0.013 0.013 0.007 1154 0.00 0.014 0.033 0.028 0.022 16 0.013 0.012 0.006 621 0.00 0.016 0.037 0.029 0.025 12 0.014 0.013 0.007 450 0.00 0.028 0.032 0.026 0.020 7 0.014 0.013 0.006 343 0.04 0.25
Balanced 2 0.033 0.026 0.032 237 0.021 0.021 0.004 338 0.00 0.004 0.032 0.027 0.020 127 0.019 0.018 0.005 179 0.00 0.006 0.033 0.030 0.017 71 0.024 0.023 0.006 141 0.00 0.008 0.039 0.037 0.017 39 0.023 0.023 0.006 100 0.00 0.00
U.S. stock 2 0.038 0.034 0.020 96 0.032 0.029 0.010 1529 0.00 0.064 0.040 0.035 0.019 47 0.031 0.027 0.012 915 0.00 0.006 0.045 0.042 0.017 19 0.040 0.037 0.012 735 0.16 0.258 0.040 0.038 0.012 14 0.040 0.037 0.011 625 0.68 0.59
U.S. balanced 2 0.033 0.027 0.017 48 0.021 0.020 0.004 300 0.00 0.004 0.034 0.027 0.020 32 0.018 0.018 0.004 158 0.00 0.006 0.032 0.033 0.011 15 0.024 0.023 0.006 123 0.00 0.018 0.035 0.035 0.006 9 0.023 0.022 0.006 90 0.00 0.01
Global stock 2 0.030 0.028 0.014 34 0.031 0.030 0.005 102 0.25 0.434 0.031 0.028 0.012 16 0.032 0.031 0.006 49 0.36 0.286 0.033 0.029 0.010 10 0.040 0.040 0.008 30 0.12 0.478 0.039 0.041 0.011 8 0.039 0.039 0.007 24 0.90 1.00
Global balanced 2 0.035 0.026 0.049 78 0.023 0.021 0.007 38 0.06 0.024 0.031 0.027 0.017 42 0.021 0.018 0.009 21 0.01 0.006 0.030 0.028 0.016 23 0.023 0.022 0.008 18 0.08 0.088 0.033 0.027 0.017 16 0.025 0.023 0.009 10 0.17 0.11
Th
eP
erforman
ceof
Hed
geF
un
ds
859
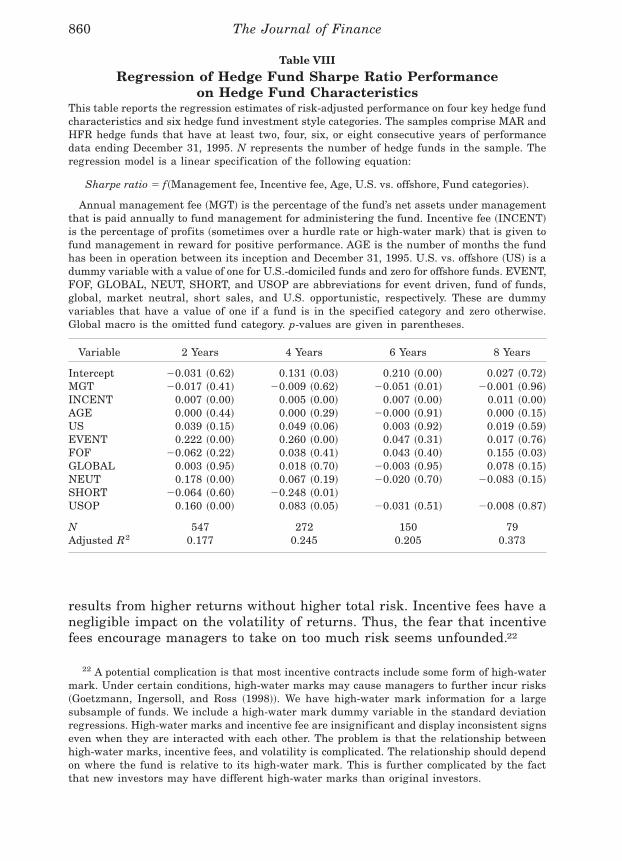
results from higher returns without higher total risk. Incentive fees have anegligible impact on the volatility of returns. Thus, the fear that incentivefees encourage managers to take on too much risk seems unfounded.22
22 A potential complication is that most incentive contracts include some form of high-watermark. Under certain conditions, high-water marks may cause managers to further incur risks~Goetzmann, Ingersoll, and Ross ~1998!!. We have high-water mark information for a largesubsample of funds. We include a high-water mark dummy variable in the standard deviationregressions. High-water marks and incentive fee are insignificant and display inconsistent signseven when they are interacted with each other. The problem is that the relationship betweenhigh-water marks, incentive fees, and volatility is complicated. The relationship should dependon where the fund is relative to its high-water mark. This is further complicated by the factthat new investors may have different high-water marks than original investors.
Table VIII
Regression of Hedge Fund Sharpe Ratio Performanceon Hedge Fund Characteristics
This table reports the regression estimates of risk-adjusted performance on four key hedge fundcharacteristics and six hedge fund investment style categories. The samples comprise MAR andHFR hedge funds that have at least two, four, six, or eight consecutive years of performancedata ending December 31, 1995. N represents the number of hedge funds in the sample. Theregression model is a linear specification of the following equation:
Sharpe ratio 5 f~Management fee, Incentive fee, Age, U.S. vs. offshore, Fund categories!.
Annual management fee ~MGT! is the percentage of the fund’s net assets under managementthat is paid annually to fund management for administering the fund. Incentive fee ~INCENT!is the percentage of profits ~sometimes over a hurdle rate or high-water mark! that is given tofund management in reward for positive performance. AGE is the number of months the fundhas been in operation between its inception and December 31, 1995. U.S. vs. offshore ~US! is adummy variable with a value of one for U.S.-domiciled funds and zero for offshore funds. EVENT,FOF, GLOBAL, NEUT, SHORT, and USOP are abbreviations for event driven, fund of funds,global, market neutral, short sales, and U.S. opportunistic, respectively. These are dummyvariables that have a value of one if a fund is in the specified category and zero otherwise.Global macro is the omitted fund category. p-values are given in parentheses.
Variable 2 Years 4 Years 6 Years 8 Years
Intercept 20.031 ~0.62! 0.131 ~0.03! 0.210 ~0.00! 0.027 ~0.72!MGT 20.017 ~0.41! 20.009 ~0.62! 20.051 ~0.01! 20.001 ~0.96!INCENT 0.007 ~0.00! 0.005 ~0.00! 0.007 ~0.00! 0.011 ~0.00!AGE 0.000 ~0.44! 0.000 ~0.29! 20.000 ~0.91! 0.000 ~0.15!US 0.039 ~0.15! 0.049 ~0.06! 0.003 ~0.92! 0.019 ~0.59!EVENT 0.222 ~0.00! 0.260 ~0.00! 0.047 ~0.31! 0.017 ~0.76!FOF 20.062 ~0.22! 0.038 ~0.41! 0.043 ~0.40! 0.155 ~0.03!GLOBAL 0.003 ~0.95! 0.018 ~0.70! 20.003 ~0.95! 0.078 ~0.15!NEUT 0.178 ~0.00! 0.067 ~0.19! 20.020 ~0.70! 20.083 ~0.15!SHORT 20.064 ~0.60! 20.248 ~0.01!USOP 0.160 ~0.00! 0.083 ~0.05! 20.031 ~0.51! 20.008 ~0.87!
N 547 272 150 79Adjusted R2 0.177 0.245 0.205 0.373
860 The Journal of Finance
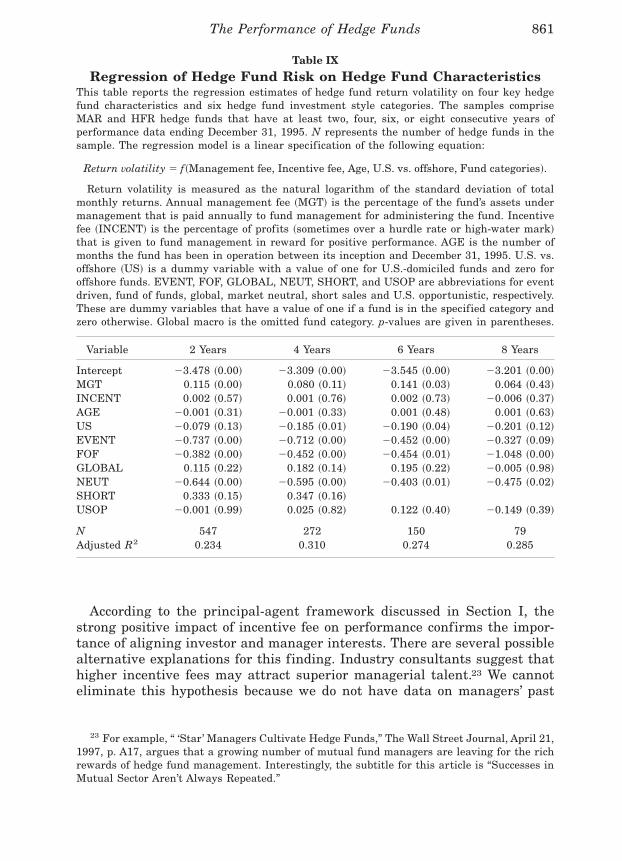
According to the principal-agent framework discussed in Section I, thestrong positive impact of incentive fee on performance confirms the impor-tance of aligning investor and manager interests. There are several possiblealternative explanations for this finding. Industry consultants suggest thathigher incentive fees may attract superior managerial talent.23 We cannoteliminate this hypothesis because we do not have data on managers’ past
23 For example, “ ‘Star’ Managers Cultivate Hedge Funds,” The Wall Street Journal, April 21,1997, p. A17, argues that a growing number of mutual fund managers are leaving for the richrewards of hedge fund management. Interestingly, the subtitle for this article is “Successes inMutual Sector Aren’t Always Repeated.”
Table IX
Regression of Hedge Fund Risk on Hedge Fund CharacteristicsThis table reports the regression estimates of hedge fund return volatility on four key hedgefund characteristics and six hedge fund investment style categories. The samples compriseMAR and HFR hedge funds that have at least two, four, six, or eight consecutive years ofperformance data ending December 31, 1995. N represents the number of hedge funds in thesample. The regression model is a linear specification of the following equation:
Return volatility 5 f~Management fee, Incentive fee, Age, U.S. vs. offshore, Fund categories!.
Return volatility is measured as the natural logarithm of the standard deviation of totalmonthly returns. Annual management fee ~MGT! is the percentage of the fund’s assets undermanagement that is paid annually to fund management for administering the fund. Incentivefee ~INCENT! is the percentage of profits ~sometimes over a hurdle rate or high-water mark!that is given to fund management in reward for positive performance. AGE is the number ofmonths the fund has been in operation between its inception and December 31, 1995. U.S. vs.offshore ~US! is a dummy variable with a value of one for U.S.-domiciled funds and zero foroffshore funds. EVENT, FOF, GLOBAL, NEUT, SHORT, and USOP are abbreviations for eventdriven, fund of funds, global, market neutral, short sales and U.S. opportunistic, respectively.These are dummy variables that have a value of one if a fund is in the specified category andzero otherwise. Global macro is the omitted fund category. p-values are given in parentheses.
Variable 2 Years 4 Years 6 Years 8 Years
Intercept 23.478 ~0.00! 23.309 ~0.00! 23.545 ~0.00! 23.201 ~0.00!MGT 0.115 ~0.00! 0.080 ~0.11! 0.141 ~0.03! 0.064 ~0.43!INCENT 0.002 ~0.57! 0.001 ~0.76! 0.002 ~0.73! 20.006 ~0.37!AGE 20.001 ~0.31! 20.001 ~0.33! 0.001 ~0.48! 0.001 ~0.63!US 20.079 ~0.13! 20.185 ~0.01! 20.190 ~0.04! 20.201 ~0.12!EVENT 20.737 ~0.00! 20.712 ~0.00! 20.452 ~0.00! 20.327 ~0.09!FOF 20.382 ~0.00! 20.452 ~0.00! 20.454 ~0.01! 21.048 ~0.00!GLOBAL 0.115 ~0.22! 0.182 ~0.14! 0.195 ~0.22! 20.005 ~0.98!NEUT 20.644 ~0.00! 20.595 ~0.00! 20.403 ~0.01! 20.475 ~0.02!SHORT 0.333 ~0.15! 0.347 ~0.16!USOP 20.001 ~0.99! 0.025 ~0.82! 0.122 ~0.40! 20.149 ~0.39!
N 547 272 150 79Adjusted R2 0.234 0.310 0.274 0.285
The Performance of Hedge Funds 861
employment and performance. This alternative explanation, however, doessuggest that managerial talent explains hedge fund returns. Brown et al.~1999! test and reject the managerial talent hypothesis.
It is also possible that the causation is from performance to incentive fee.Superior performance may allow a manager to negotiate a higher incentivefee. We can clearly reject this causation explanation because incentive feesrarely change. Incentive fees are fixed in the offer documents; they can bechanged by a vote of interested parties but this almost never occurs. Asevidence, we examine every case in which MAR or Nelson’s Directory of In-vestment Managers reports incentive fee for two or more years during theperiod 1994–1996. We perform a similar exercise on the HFR data for 1996and 1997. Out of 1651 consecutive year comparisons, only 11 changes inincentive fees were found. The data vendors contacted six of these 11 fundsand in all six cases the change was a correction of inaccurate data, not anactual change in incentive fees. As an added check, HFR agreed to call 25randomly selected funds with at least four years of performance data. Noneof these funds had changed their incentive fee during their existence.
With respect to the other three hedge fund characteristics, there is someweak evidence that management fees reduce risk-adjusted returns and U.S.funds outperform offshore funds. In Table VIII, the coefficient on manage-ment fee is always negative, but it is significant in only one of the fourregressions. The U.S. hedge fund dummy is always positive, but is only sig-nificant in one regression and only at the 10 percent level. As we show in thenext section, the U.S. hedge fund dummy understates the true differencebetween U.S. and offshore funds because offshore funds suffer from a stron-ger survival bias. The coefficient on hedge fund age is never significant.
The volatility regressions in Table IX give added insight into the potentialsource of the management fee and U.S. fund risk-adjusted performance find-ings. U.S. funds gain a risk-adjusted performance advantage by loweringrisk. The coefficient on the U.S. dummy in Table IX is always negative andsignificant in two of the four regressions. This reduced risk may stem fromthe additional liabilities that U.S. managers incur from organizing as a lim-ited partnership. Management fees increase the volatility of hedge funds.The coefficient on management fee is always positive and significantly so inhalf the regressions in Table IX. This is consistent with research that findsmanagement fees create an agency problem.
Table VIII reveals that no one hedge fund category dominates. Event drivenfunds come the closest with all positive and two significant coefficients. Shortsales appear to display the worst performance, but we can only measure theimpact of short sales for the 2- and 4-year samples. All of the other catego-ries display inconsistent signs across the four samples. In general, successin hedge funds is more complicated than simply picking the right category.
It is clear that hedge fund categories display dramatically different totalrisk profiles. In Table IX, the event driven, fund of funds, and market neu-tral categories display significantly lower return variances than the omittedcategory of global macro funds. Thus, one of the sources of the risk-adjusted
862 The Journal of Finance
return advantage for event driven funds is their lower risk. The added di-versification of fund of funds does work to lower volatility. Market neutralfunds not only reduce systematic risk, but also total risk. In contrast, shortsellers’ drive for negative systematic risk increases the standard deviation offund returns.24
Ex post variance measures may fail to capture the likelihood of extremedraws on the distribution that can cause serious problems for a highly le-veraged hedge fund with illiquid securities. These problems are illustratedby the dramatic collapse of Long-Term Capital Management L.P. in 1998.Though our sample period ~1988–1995! covers a complete business cycle andseveral global crises, the magnitude of these events do not match the depthof 1998 global crises. Therefore, some of the Sharpe ratio advantage for hedgefunds may ref lect compensation for the risk of these extreme events. How-ever, several factors limit these risks for our sample. First, Long-Term Cap-ital had leverage ratios as high as 100 to 1. The maximum leverage ratioreported in our sample is 20 to 1 for a disappearing fund and 12 to 1 for anextant fund. Only six other funds report leverage ratios of 5 to 1 or more.25
Second, Long-Term Capital and the other defunct hedge funds mentioned inthe press during 1998 were global or global macro funds.26 The global cat-egories are more likely to experience dramatic changes in their environ-ment. This is true even during the 1988–1995 period. Of the 688 funds inour sample ~both extant and disappearing!, 38 have a monthly return greaterthan 25 percent in absolute value. Two-thirds of these are global or globalmacro funds. The hedge fund category performance results given in many ofthe tables demonstrate that our findings are not driven by the global cat-egories. Third, hedge funds may be the 1990s equivalent of leveraged buy-outs. Using agency theory based arguments, numerous academic studies findleveraged buyouts generated above-average returns ~e.g., Kaplan ~1989!!. Inthe late 1980s, however, the combination of dramatic increases in competi-tion, excesses in the debt markets, and a weakening economy demonstratedthat there are limits to the level of debt. Similarly, the combination of dra-matic growth in the size and number of hedge funds, lack of controls in the debtmarket, and a severe global crisis reveals limits to the leverage of hedge funds.
IV. Data-Conditioning Biases
The above findings are based on funds that report performance data for atleast 24 consecutive months ending December 31, 1995. Performance studiesof existing funds with a required return history may be artificially inf lated
24 The regressions reported in Tables VIII and IX are also subjected to standard outlier andheteroskedasticity tests without much effect on the results.
25 Leverage is defined as the average leverage for the life of the fund. Leverage is reportedfor approximately half of the funds in our sample.
26 We could find reference to extreme losses for Niederhoffer Funds, High Risk Opportuni-ties Funds, Russia Value Fund, McGinnis Funds, and Croesus-UFG Russia Fund. All thesefunds are in the global categories.
The Performance of Hedge Funds 863
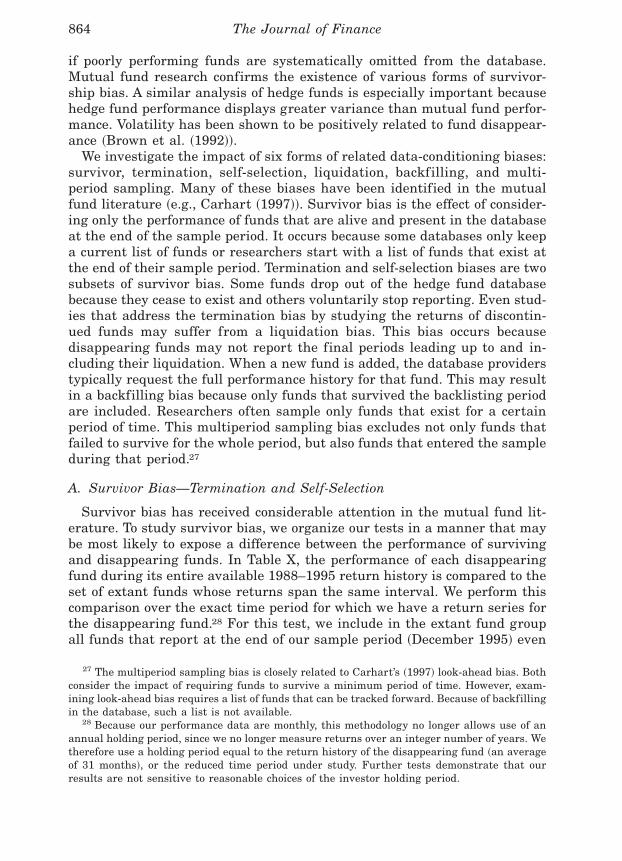
if poorly performing funds are systematically omitted from the database.Mutual fund research confirms the existence of various forms of survivor-ship bias. A similar analysis of hedge funds is especially important becausehedge fund performance displays greater variance than mutual fund perfor-mance. Volatility has been shown to be positively related to fund disappear-ance ~Brown et al. ~1992!!.
We investigate the impact of six forms of related data-conditioning biases:survivor, termination, self-selection, liquidation, backfilling, and multi-period sampling. Many of these biases have been identified in the mutualfund literature ~e.g., Carhart ~1997!!. Survivor bias is the effect of consider-ing only the performance of funds that are alive and present in the databaseat the end of the sample period. It occurs because some databases only keepa current list of funds or researchers start with a list of funds that exist atthe end of their sample period. Termination and self-selection biases are twosubsets of survivor bias. Some funds drop out of the hedge fund databasebecause they cease to exist and others voluntarily stop reporting. Even stud-ies that address the termination bias by studying the returns of discontin-ued funds may suffer from a liquidation bias. This bias occurs becausedisappearing funds may not report the final periods leading up to and in-cluding their liquidation. When a new fund is added, the database providerstypically request the full performance history for that fund. This may resultin a backfilling bias because only funds that survived the backlisting periodare included. Researchers often sample only funds that exist for a certainperiod of time. This multiperiod sampling bias excludes not only funds thatfailed to survive for the whole period, but also funds that entered the sampleduring that period.27
A. Survivor Bias—Termination and Self-Selection
Survivor bias has received considerable attention in the mutual fund lit-erature. To study survivor bias, we organize our tests in a manner that maybe most likely to expose a difference between the performance of survivingand disappearing funds. In Table X, the performance of each disappearingfund during its entire available 1988–1995 return history is compared to theset of extant funds whose returns span the same interval. We perform thiscomparison over the exact time period for which we have a return series forthe disappearing fund.28 For this test, we include in the extant fund groupall funds that report at the end of our sample period ~December 1995! even
27 The multiperiod sampling bias is closely related to Carhart’s ~1997! look-ahead bias. Bothconsider the impact of requiring funds to survive a minimum period of time. However, exam-ining look-ahead bias requires a list of funds that can be tracked forward. Because of backfillingin the database, such a list is not available.
28 Because our performance data are monthly, this methodology no longer allows use of anannual holding period, since we no longer measure returns over an integer number of years. Wetherefore use a holding period equal to the return history of the disappearing fund ~an averageof 31 months!, or the reduced time period under study. Further tests demonstrate that ourresults are not sensitive to reasonable choices of the investor holding period.
864 The Journal of Finance
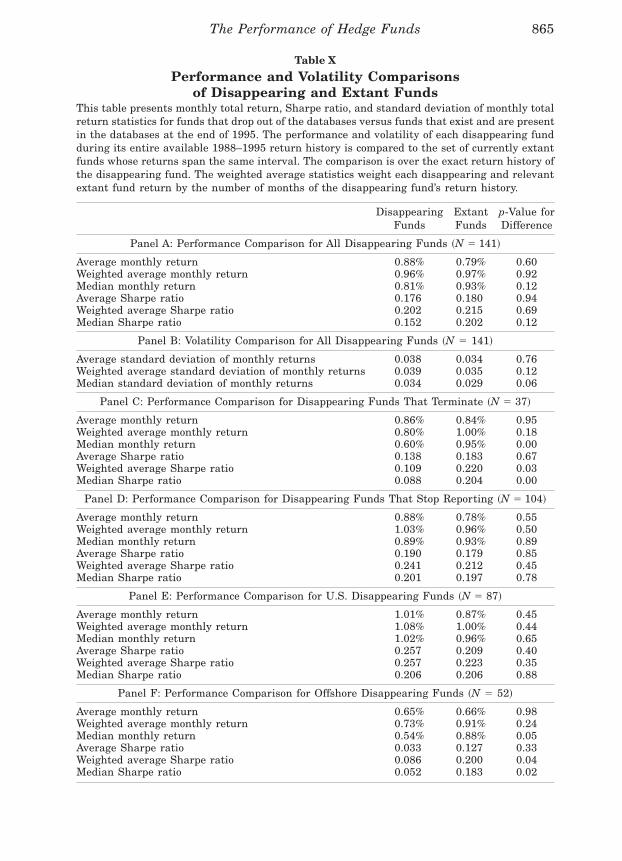
Table X
Performance and Volatility Comparisonsof Disappearing and Extant Funds
This table presents monthly total return, Sharpe ratio, and standard deviation of monthly totalreturn statistics for funds that drop out of the databases versus funds that exist and are presentin the databases at the end of 1995. The performance and volatility of each disappearing fundduring its entire available 1988–1995 return history is compared to the set of currently extantfunds whose returns span the same interval. The comparison is over the exact return history ofthe disappearing fund. The weighted average statistics weight each disappearing and relevantextant fund return by the number of months of the disappearing fund’s return history.
DisappearingFunds
ExtantFunds
p-Value forDifference
Panel A: Performance Comparison for All Disappearing Funds ~N 5 141!
Average monthly return 0.88% 0.79% 0.60Weighted average monthly return 0.96% 0.97% 0.92Median monthly return 0.81% 0.93% 0.12Average Sharpe ratio 0.176 0.180 0.94Weighted average Sharpe ratio 0.202 0.215 0.69Median Sharpe ratio 0.152 0.202 0.12
Panel B: Volatility Comparison for All Disappearing Funds ~N 5 141!
Average standard deviation of monthly returns 0.038 0.034 0.76Weighted average standard deviation of monthly returns 0.039 0.035 0.12Median standard deviation of monthly returns 0.034 0.029 0.06
Panel C: Performance Comparison for Disappearing Funds That Terminate ~N 5 37!
Average monthly return 0.86% 0.84% 0.95Weighted average monthly return 0.80% 1.00% 0.18Median monthly return 0.60% 0.95% 0.00Average Sharpe ratio 0.138 0.183 0.67Weighted average Sharpe ratio 0.109 0.220 0.03Median Sharpe ratio 0.088 0.204 0.00
Panel D: Performance Comparison for Disappearing Funds That Stop Reporting ~N 5 104!
Average monthly return 0.88% 0.78% 0.55Weighted average monthly return 1.03% 0.96% 0.50Median monthly return 0.89% 0.93% 0.89Average Sharpe ratio 0.190 0.179 0.85Weighted average Sharpe ratio 0.241 0.212 0.45Median Sharpe ratio 0.201 0.197 0.78
Panel E: Performance Comparison for U.S. Disappearing Funds ~N 5 87!
Average monthly return 1.01% 0.87% 0.45Weighted average monthly return 1.08% 1.00% 0.44Median monthly return 1.02% 0.96% 0.65Average Sharpe ratio 0.257 0.209 0.40Weighted average Sharpe ratio 0.257 0.223 0.35Median Sharpe ratio 0.206 0.206 0.88
Panel F: Performance Comparison for Offshore Disappearing Funds ~N 5 52!
Average monthly return 0.65% 0.66% 0.98Weighted average monthly return 0.73% 0.91% 0.24Median monthly return 0.54% 0.88% 0.05Average Sharpe ratio 0.033 0.127 0.33Weighted average Sharpe ratio 0.086 0.200 0.04Median Sharpe ratio 0.052 0.183 0.02
The Performance of Hedge Funds 865
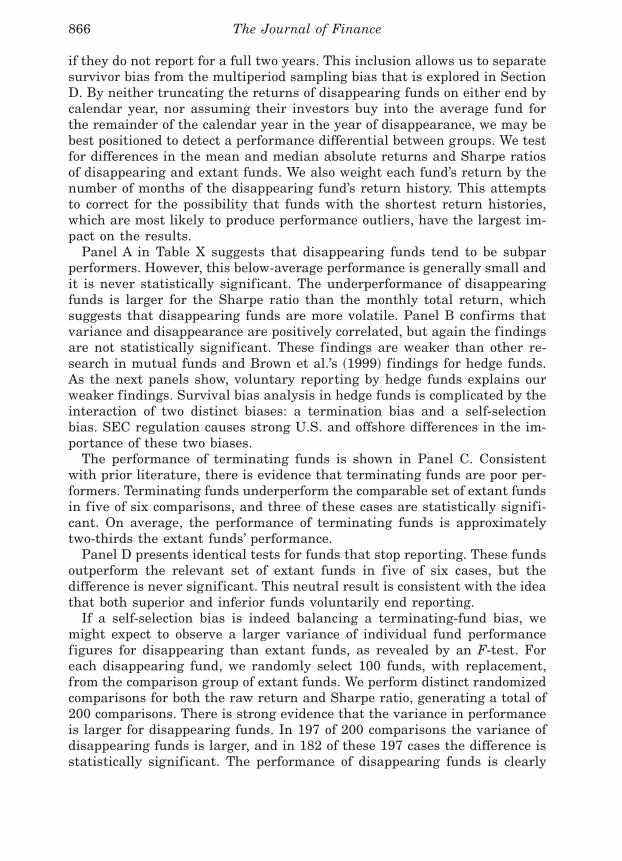
if they do not report for a full two years. This inclusion allows us to separatesurvivor bias from the multiperiod sampling bias that is explored in SectionD. By neither truncating the returns of disappearing funds on either end bycalendar year, nor assuming their investors buy into the average fund forthe remainder of the calendar year in the year of disappearance, we may bebest positioned to detect a performance differential between groups. We testfor differences in the mean and median absolute returns and Sharpe ratiosof disappearing and extant funds. We also weight each fund’s return by thenumber of months of the disappearing fund’s return history. This attemptsto correct for the possibility that funds with the shortest return histories,which are most likely to produce performance outliers, have the largest im-pact on the results.
Panel A in Table X suggests that disappearing funds tend to be subparperformers. However, this below-average performance is generally small andit is never statistically significant. The underperformance of disappearingfunds is larger for the Sharpe ratio than the monthly total return, whichsuggests that disappearing funds are more volatile. Panel B confirms thatvariance and disappearance are positively correlated, but again the findingsare not statistically significant. These findings are weaker than other re-search in mutual funds and Brown et al.’s ~1999! findings for hedge funds.As the next panels show, voluntary reporting by hedge funds explains ourweaker findings. Survival bias analysis in hedge funds is complicated by theinteraction of two distinct biases: a termination bias and a self-selectionbias. SEC regulation causes strong U.S. and offshore differences in the im-portance of these two biases.
The performance of terminating funds is shown in Panel C. Consistentwith prior literature, there is evidence that terminating funds are poor per-formers. Terminating funds underperform the comparable set of extant fundsin five of six comparisons, and three of these cases are statistically signifi-cant. On average, the performance of terminating funds is approximatelytwo-thirds the extant funds’ performance.
Panel D presents identical tests for funds that stop reporting. These fundsoutperform the relevant set of extant funds in five of six cases, but thedifference is never significant. This neutral result is consistent with the ideathat both superior and inferior funds voluntarily end reporting.
If a self-selection bias is indeed balancing a terminating-fund bias, wemight expect to observe a larger variance of individual fund performancefigures for disappearing than extant funds, as revealed by an F-test. Foreach disappearing fund, we randomly select 100 funds, with replacement,from the comparison group of extant funds. We perform distinct randomizedcomparisons for both the raw return and Sharpe ratio, generating a total of200 comparisons. There is strong evidence that the variance in performanceis larger for disappearing funds. In 197 of 200 comparisons the variance ofdisappearing funds is larger, and in 182 of these 197 cases the difference isstatistically significant. The performance of disappearing funds is clearly
866 The Journal of Finance

more extreme, which is also consistent with the interpretation that a self-selection bias is balancing a terminating-fund bias.
United States and offshore funds provide further evidence into the bal-ance between self-selecting and terminating funds. Superior U.S. funds havetwo reasons to withdraw from the databases: they are within arm’s length ofpotential SEC regulation and they may no longer desire exposure if theyhave reached the 100 investor limit. We therefore expect a larger percentageof U.S. funds to self-select. The information in Panels E and F of Table X isconsistent with this hypothesis. Though U.S. and offshore funds are roughlyequally represented in our overall sample, 87 disappearing funds are U.S.funds. Only 52 disappearing funds are offshore funds. Of the 87 U.S. fundsthat drop out, only 14 give termination as their reason for departure. Twenty-three of the 52 disappearing offshore funds confirm that they terminate.
Panel E in Table X reveals that disappearing U.S. funds outperform thecontrol group of extant funds in all six tests, though the difference is neverstatistically significant. Offshore funds always underperform the control group,and three of the tests are significant. This latter finding is consistent withthe Brown et al. ~1999! survival analysis of offshore hedge funds.
In sum, survivor analysis of U.S. and offshore hedge funds must recognizetwo counteracting biases, termination and self-selection. For our sample, thenet impact of these two effects is small. One rough way to measure theimpact of net survivor bias is to average the performance differences be-tween disappearing and extant funds in Panel A of Table X. Across the threeraw return measures, this average is 0.013 percent. Excluding disappearingfunds has virtually no impact on our assessment of overall performance.This self-selection bias has two interesting implications for hedge fund re-search. First, some hedge funds may not actively seek new money, becausethere may be diminishing returns to their arbitrage strategies. Second, someof the best hedge fund managers may be opting out of the databases.
B. Liquidation Bias
For some of the terminated funds additional return activity may follow thefinal monthly performance figure recorded in the database. While the data-base providers make painstaking efforts ~including multiple follow-up phonecalls and faxes for approximately one year after disappearance! to minimizethis effect, it is conceivable that funds lose substantial value in the periodsubsequent to reporting. Investors in terminating funds may experience dis-counts in value due to liquidation of underlying fund holdings, and a delayin redemption of proceeds.
At our request, HFR agreed to poll each of their terminating funds toexamine whether the information recorded in their database ref lects thetiming and the amount of money returned to investors. HFR was able torecover all returns through the instant of redemption for all of their termi-nating funds. It turns out that they already track a majority of terminating
The Performance of Hedge Funds 867
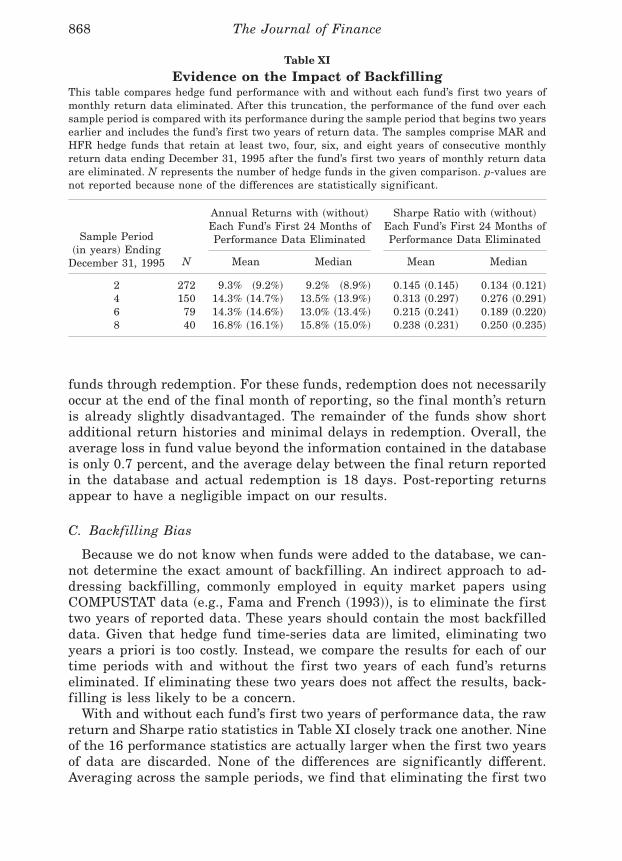
funds through redemption. For these funds, redemption does not necessarilyoccur at the end of the final month of reporting, so the final month’s returnis already slightly disadvantaged. The remainder of the funds show shortadditional return histories and minimal delays in redemption. Overall, theaverage loss in fund value beyond the information contained in the databaseis only 0.7 percent, and the average delay between the final return reportedin the database and actual redemption is 18 days. Post-reporting returnsappear to have a negligible impact on our results.
C. Backfilling Bias
Because we do not know when funds were added to the database, we can-not determine the exact amount of backfilling. An indirect approach to ad-dressing backfilling, commonly employed in equity market papers usingCOMPUSTAT data ~e.g., Fama and French ~1993!!, is to eliminate the firsttwo years of reported data. These years should contain the most backfilleddata. Given that hedge fund time-series data are limited, eliminating twoyears a priori is too costly. Instead, we compare the results for each of ourtime periods with and without the first two years of each fund’s returnseliminated. If eliminating these two years does not affect the results, back-filling is less likely to be a concern.
With and without each fund’s first two years of performance data, the rawreturn and Sharpe ratio statistics in Table XI closely track one another. Nineof the 16 performance statistics are actually larger when the first two yearsof data are discarded. None of the differences are significantly different.Averaging across the sample periods, we find that eliminating the first two
Table XI
Evidence on the Impact of BackfillingThis table compares hedge fund performance with and without each fund’s first two years ofmonthly return data eliminated. After this truncation, the performance of the fund over eachsample period is compared with its performance during the sample period that begins two yearsearlier and includes the fund’s first two years of return data. The samples comprise MAR andHFR hedge funds that retain at least two, four, six, and eight years of consecutive monthlyreturn data ending December 31, 1995 after the fund’s first two years of monthly return dataare eliminated. N represents the number of hedge funds in the given comparison. p-values arenot reported because none of the differences are statistically significant.
Annual Returns with ~without!Each Fund’s First 24 Months ofPerformance Data Eliminated
Sharpe Ratio with ~without!Each Fund’s First 24 Months ofPerformance Data EliminatedSample Period
~in years! EndingDecember 31, 1995 N Mean Median Mean Median
2 272 9.3% ~9.2%! 9.2% ~8.9%! 0.145 ~0.145! 0.134 ~0.121!4 150 14.3% ~14.7%! 13.5% ~13.9%! 0.313 ~0.297! 0.276 ~0.291!6 79 14.3% ~14.6%! 13.0% ~13.4%! 0.215 ~0.241! 0.189 ~0.220!8 40 16.8% ~16.1%! 15.8% ~15.0%! 0.238 ~0.231! 0.250 ~0.235!
868 The Journal of Finance
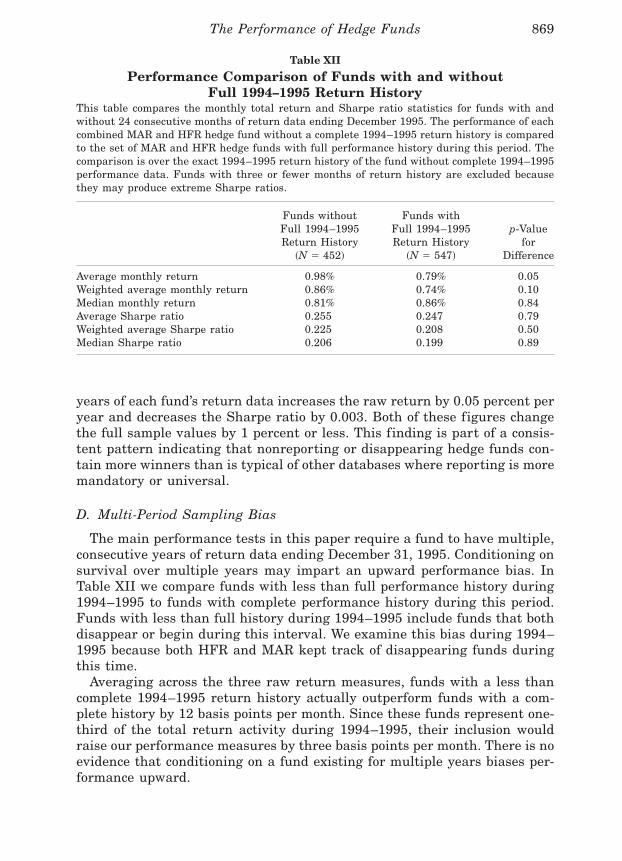
years of each fund’s return data increases the raw return by 0.05 percent peryear and decreases the Sharpe ratio by 0.003. Both of these figures changethe full sample values by 1 percent or less. This finding is part of a consis-tent pattern indicating that nonreporting or disappearing hedge funds con-tain more winners than is typical of other databases where reporting is moremandatory or universal.
D. Multi-Period Sampling Bias
The main performance tests in this paper require a fund to have multiple,consecutive years of return data ending December 31, 1995. Conditioning onsurvival over multiple years may impart an upward performance bias. InTable XII we compare funds with less than full performance history during1994–1995 to funds with complete performance history during this period.Funds with less than full history during 1994–1995 include funds that bothdisappear or begin during this interval. We examine this bias during 1994–1995 because both HFR and MAR kept track of disappearing funds duringthis time.
Averaging across the three raw return measures, funds with a less thancomplete 1994–1995 return history actually outperform funds with a com-plete history by 12 basis points per month. Since these funds represent one-third of the total return activity during 1994–1995, their inclusion wouldraise our performance measures by three basis points per month. There is noevidence that conditioning on a fund existing for multiple years biases per-formance upward.
Table XII
Performance Comparison of Funds with and withoutFull 1994–1995 Return History
This table compares the monthly total return and Sharpe ratio statistics for funds with andwithout 24 consecutive months of return data ending December 1995. The performance of eachcombined MAR and HFR hedge fund without a complete 1994–1995 return history is comparedto the set of MAR and HFR hedge funds with full performance history during this period. Thecomparison is over the exact 1994–1995 return history of the fund without complete 1994–1995performance data. Funds with three or fewer months of return history are excluded becausethey may produce extreme Sharpe ratios.
Funds withoutFull 1994–1995Return History
~N 5 452!
Funds withFull 1994–1995Return History
~N 5 547!
p-Valuefor
Difference
Average monthly return 0.98% 0.79% 0.05Weighted average monthly return 0.86% 0.74% 0.10Median monthly return 0.81% 0.86% 0.84Average Sharpe ratio 0.255 0.247 0.79Weighted average Sharpe ratio 0.225 0.208 0.50Median Sharpe ratio 0.206 0.199 0.89
The Performance of Hedge Funds 869

In sum, we find that basing our performance results on extant funds witha required return history does not introduce a systematic bias. Consistentwith the mutual fund literature, we find direct evidence that hedge fundsthat cease to exist perform poorly. However, this terminating fund bias iscountered by a self-selection bias, which has no clear counterpart in mutualfunds. Superior performing funds may voluntarily withdraw from the data-bases because they are able to raise sufficient funds on their own, and there-fore derive little benefit from the exposure provided by the database.Economically and statistically, these terminating fund and self-selection bi-ases appear to offset. We also do not find evidence that other conditioningbiases inf luence our conclusions from using only extant funds.29 Because theconditioning biases for hedge funds are weaker than those found in mutualfunds, our comparisons with mutual funds in Table VI are biased againsthedge funds.
V. Conclusion
Hedge funds display many attractive organizational features that shouldhelp align the interests of hedge fund managers and investors. Hedge fundmanagers tend to invest heavily in their own fund; most receive a substan-tial portion of their pay in the form of incentive fees; and many are generalpartners with liability for extreme losses. Hedge fund managers also have asubstantial amount of latitude and f lexibility with respect to investmentstrategies because they are largely unregulated and because they attractlarger, more sophisticated investors. By contrast, most mutual fund manag-ers do not receive incentive-based compensation and they are much moreconservative in employing investment options such as leverage, derivatives,concentrated investments, and short selling.
This combination of incentive alignment and investment f lexibility giveshedge funds a clear performance advantage over mutual funds. Using 2-, 4-,6-, and 8-year samples all ending in December 1995 with 547, 272, 150, and79 hedge fund observations, we find that the average ~median! hedge fundSharpe ratio is 21 ~11! percent higher than comparable mutual fund Sharperatios, and this performance advantage increases when we match funds byregion ~United States, international, and global!. Hedge funds achieve this
29 Another common indirect approach to assessing potential data-conditioning biases is theappraisal ratio ~Treynor and Black ~1972!!. This ratio is defined as Jensen’s a divided by theresidual standard deviation. The appraisal ratio lowers the value of Jensen’s a for funds thatare riskier and therefore less likely to survive. Like our Jensen’s a results, the appraisal ratiois positive and significant for all time periods, except the 2-year sample. A related approach isto take the weighted average of Jensen’s a, using the residual standard deviations as weights.This measure is directly comparable to Jensen’s a. The weighted average is 16 percent lowerthan the unweighted average, but very close to the median Jensen’s a. These findings suggestthat fund risk does play some role in explaining high hedge fund returns, but this role is aminor one.
870 The Journal of Finance
Sharpe ratio superiority despite their higher total risk. The average ~medi-an! total risk is 27 ~12! percent higher for hedge funds. Thus, some of thecharacteristics that enhance hedge fund performance may not be appropri-ate for mutual funds that attract undiversified, risk-averse clients.
Despite their advantage over mutual funds, hedge funds are unable toconsistently beat the market when absolute or total risk-adjusted returnsare used. We compare hedge funds to eight standard market indices withmixed results. The winner in this comparison depends on the time period,the index, and the hedge fund category. This overall neutral result does sug-gest that hedge funds are able to outperform the market on a gross returnbasis. On average, their ability to earn superior gross returns is about equalto the incentive and administrative fee. This is consistent with an efficientmarket for researching and exploiting information on mispriced securities.Hedge funds may play an important role in improving market efficiency,especially given their ability to use concentrated investments, take an activerole in corporate governance, and invest in illiquid securities. Because mu-tual funds are often limited in their ability to employ similar strategies,they may not be able to earn back their fees. This conclusion is more con-sistent with the literature that finds mutual funds earn subpar net returns~e.g., Jensen ~1968! and Elton et al. ~1993!! than those papers that find theyrecover their fees ~e.g., Ippolito ~1989!!.
Although our results suggest that hedge funds offer little advantage overindexing, the low beta values on hedge funds make them a potentially valu-able addition to many investors’ portfolios. An Elton et al. ~1987! test indi-cates that hedge funds always enhance a portfolio containing any of theeight indices considered.
We have some success in linking these superior returns to the organiza-tional features of hedge funds. Incentive fees are the most important andsignificant determinants of risk-adjusted return. An increase in the incen-tive fee from zero to the median value of 20 percent leads to an averageincrease in the Sharpe ratio of 66 percent. Incentives are effective at align-ing manager and investor interests or attracting top managers. Contrary totheoretical arguments, a higher incentive fee does not increase managers’proclivity to take on risks. The coefficient on incentive fee in a total riskregression is always insignificant and does not even display a consistentsign. We also find some potentially interesting differences between U.S. andoffshore hedge funds. United States hedge funds display consistently signif-icantly lower total risk than offshore funds, even after controlling for differ-ences in hedge fund categories. This lower risk consistently translates into aSharpe ratio advantage for U.S. hedge funds, but this advantage is onlymarginally significant in one of four regressions. These findings may ref lectthe additional liability that U.S. managers face because U.S. funds tend tobe limited partnerships instead of corporations. Management fees consis-tently raise total risk and reduce Sharpe ratios, although the risk effects arestatistically more powerful. Fund age never significantly inf luences risk or
The Performance of Hedge Funds 871
return in our sample. Finally, we find some significant differences in thetotal risk profiles of specific hedge fund categories, but these risk differ-ences do not translate into consistently significant risk-adjusted perfor-mance advantages.
We investigate six related data-conditioning biases. Of these, the termi-nation and self-selection biases are most powerful. Funds that terminatehave significantly lower median ~but not mean! performance measures thanextant funds. However, funds that cease voluntary reporting contain a mixof over- and underperformers with a slight edge to the overperformers. Thisself-selection problem arises mainly from U.S. regulations on advertisingand limits on the number of investors.30 The survivor bias is a combinationof the termination and self-selection biases. For the whole sample and theU.S. hedge fund subset, the self-selection bias dominates, leading to no sig-nificant difference between extant and disappearing funds. For offshore fundsthe termination bias dominates. Following terminating funds through liqui-dation ~liquidation bias! does exacerbate the termination bias, but the im-pact is minimal. Our indirect tests for backfilling and multiyear samplingbiases suggest that these effects are generally small.
These hedge fund conclusions warrant several caveats. First, we have onlya limited time period to evaluate hedge funds, and many findings in financehave been sensitive to the time period studied. Second, the diverse and f lex-ible investment options employed by hedge funds make it difficult to classifyhedge funds, identify the correct benchmark, and thus measure relative per-formance. We attempt to compensate for this potential problem by usingnumerous market indices, by using the Sharpe ratio that does not rely onindex benchmarks, and by comparing carefully matched hedge funds andmutual funds. However, none of these solutions allow us to estimate system-atic risk with any confidence. Thus, we are unable to account for one of thepotential advantages of hedge funds, low systematic risk. On the other hand,our standard deviation of return measure of total risk may not fully capturethe complex risk taking from hedge funds’ dynamic, highly leveraged strat-egies. Though our time period of 1988 through 1995 covers almost a com-plete macroeconomic cycle, there are states of nature that have not occurredover this period that might expose some unique hedge fund risks. The sub-stantial losses for several hedge funds in reaction to the global crises of 1998demonstrate the impact of these extreme events. The most dramatic nega-tive returns have occurred in highly leveraged global hedge fund categories.Global and global macro hedge funds demonstrate the most extreme obser-vations even during our sample period. Eliminating these categories fromour analysis would not change our hedge fund performance conclusions. Fur-ther, the extent of leverage observed in the most prominent 1998 hedge fundcollapse is five times the maximum observed in our 1988–1995 sample. Still,the apparent superiority of hedge funds over mutual funds may ref lect an
30 Since the limit on the number of investors was eased in 1996 and 1997, the self-selectionbias may become less pronounced in post-1997 data.
872 The Journal of Finance
underestimation of true hedge fund risk. Fourth, varying policies on high-water marks, fee allocation mechanisms, the treatment of new and existinginvestors, and hurdle rates complicate the incentive fee analysis. Our mea-sure of incentive fees does not control for these complications. Monthly in-centive fees, therefore, contain an unknown reporting bias that may be asimportant as depreciation rates, common cost allocation, and transfer pric-ing issues in accounting profits. Additionally, we have no data on other im-portant incentive alignment features such as the amount of money thatmanagers invest in their own fund. Fifth, some of our data-conditioning biasconclusions, especially backfilling, depend on indirect tests. Unfortunately,our data sources do not have any information on when a fund entered thedatabase to directly address the backfilling bias. Such a list exists for off-shore funds, but as we show the conditioning biases may be different forU.S. and offshore funds. These caveats pose opportunities for future re-search. These opportunities combined with the wealth of other fund-relatedissues should make hedge funds a fruitful area for extensive research.
REFERENCES
Ackermann, Carl, and David Ravenscraft, 1998, The impact of regulatory restrictions on fundperformance: A comparative study of hedge funds and mutual funds, Working paper, Uni-versity of Notre Dame.
Brown, Stephen J., and William N. Goetzmann, 1995, Performance persistence, Journal of Finance50, 679–698.
Brown, Stephen J., William N. Goetzmann, and Roger G. Ibbotson, 1999, Offshore hedge funds:Survival & performance 1989–1995, Journal of Business 72, 91–118.
Brown, Stephen J., William N. Goetzmann, Roger G. Ibbotson, and Stephen A. Ross, 1992,Survivorship bias in performance studies, Review of Financial Studies 5, 553–580.
Carhart, Mark M., 1997, Mutual fund survivorship, Working paper, University of SouthernCalifornia.
Carpenter, Jennifer N., 1998, The optimal dynamic investment policy for a fund manager withan incentive fee, Working paper, New York University.
CDA0Wiesenberger, 1997, Investment Companies Yearbook ~CDA0Wiesenberger, Rockville, MD!.Edwards, Franklin R., and James M. Park, 1996, Do managed futures make good investments?,
Journal of Futures Markets 16, 475–517.Elton, Edwin J., Martin J. Gruber, and Christopher R. Blake, 1996, Survivorship bias and
mutual fund performance, Review of Financial Studies 9, 1097–1120.Elton, Edwin J., Martin J. Gruber, Sanjiv Das, and Matthew Hlavka, 1993, Efficiency with
costly information: A re-interpretation of evidence from managed portfolios, Review of Fi-nancial Studies 6, 1–21.
Elton, Edwin J., Martin J. Gruber, and Joel Rentzler, 1987, Professionally managed, publiclytraded commodity funds, Journal of Business 60, 175–199.
Fama, Eugene F., and Kenneth R. French, 1993, Common risk factors in the returns on stocksand bonds, Journal of Financial Economics 33, 3–56.
Fung, William, and David A. Hsieh, 1997, Empirical characteristics of dynamic trading strat-egies: The case of hedge funds, Review of Financial Studies 10, 275–302.
Goetzmann, William N., Jonathan E. Ingersoll Jr., and Stephen A. Ross, 1998, High watermarks, Working paper, Yale University.
Golec, Joseph H., 1992, Empirical tests of a principal-agent model of the investor-investmentadvisor relationship, Journal of Financial and Quantitative Analysis 27, 81–95.
The Performance of Hedge Funds 873
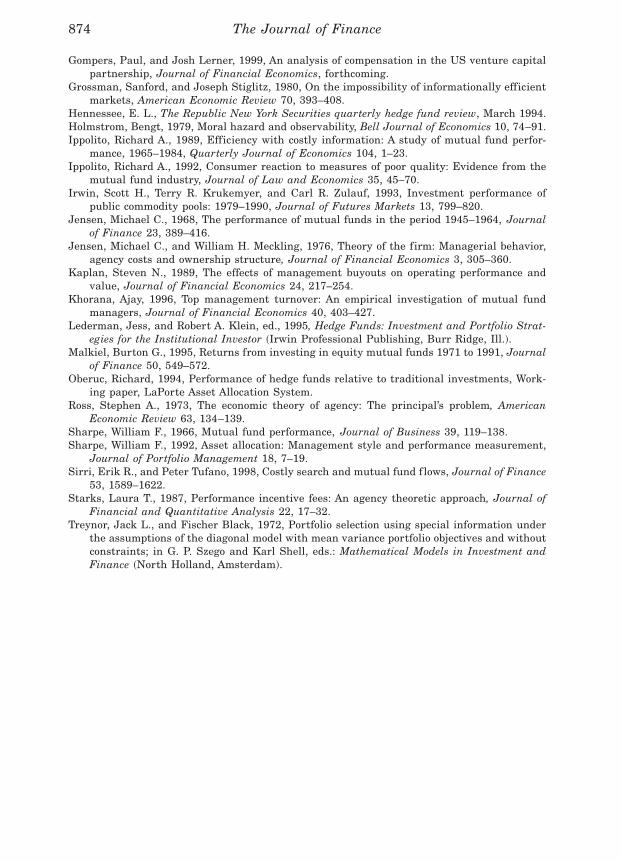
Gompers, Paul, and Josh Lerner, 1999, An analysis of compensation in the US venture capitalpartnership, Journal of Financial Economics, forthcoming.
Grossman, Sanford, and Joseph Stiglitz, 1980, On the impossibility of informationally efficientmarkets, American Economic Review 70, 393–408.
Hennessee, E. L., The Republic New York Securities quarterly hedge fund review, March 1994.Holmstrom, Bengt, 1979, Moral hazard and observability, Bell Journal of Economics 10, 74–91.Ippolito, Richard A., 1989, Efficiency with costly information: A study of mutual fund perfor-
mance, 1965–1984, Quarterly Journal of Economics 104, 1–23.Ippolito, Richard A., 1992, Consumer reaction to measures of poor quality: Evidence from the
mutual fund industry, Journal of Law and Economics 35, 45–70.Irwin, Scott H., Terry R. Krukemyer, and Carl R. Zulauf, 1993, Investment performance of
public commodity pools: 1979–1990, Journal of Futures Markets 13, 799–820.Jensen, Michael C., 1968, The performance of mutual funds in the period 1945–1964, Journal
of Finance 23, 389–416.Jensen, Michael C., and William H. Meckling, 1976, Theory of the firm: Managerial behavior,
agency costs and ownership structure, Journal of Financial Economics 3, 305–360.Kaplan, Steven N., 1989, The effects of management buyouts on operating performance and
value, Journal of Financial Economics 24, 217–254.Khorana, Ajay, 1996, Top management turnover: An empirical investigation of mutual fund
managers, Journal of Financial Economics 40, 403–427.Lederman, Jess, and Robert A. Klein, ed., 1995, Hedge Funds: Investment and Portfolio Strat-
egies for the Institutional Investor ~Irwin Professional Publishing, Burr Ridge, Ill.!.Malkiel, Burton G., 1995, Returns from investing in equity mutual funds 1971 to 1991, Journal
of Finance 50, 549–572.Oberuc, Richard, 1994, Performance of hedge funds relative to traditional investments, Work-
ing paper, LaPorte Asset Allocation System.Ross, Stephen A., 1973, The economic theory of agency: The principal’s problem, American
Economic Review 63, 134–139.Sharpe, William F., 1966, Mutual fund performance, Journal of Business 39, 119–138.Sharpe, William F., 1992, Asset allocation: Management style and performance measurement,
Journal of Portfolio Management 18, 7–19.Sirri, Erik R., and Peter Tufano, 1998, Costly search and mutual fund f lows, Journal of Finance
53, 1589–1622.Starks, Laura T., 1987, Performance incentive fees: An agency theoretic approach, Journal of
Financial and Quantitative Analysis 22, 17–32.Treynor, Jack L., and Fischer Black, 1972, Portfolio selection using special information under
the assumptions of the diagonal model with mean variance portfolio objectives and withoutconstraints; in G. P. Szego and Karl Shell, eds.: Mathematical Models in Investment andFinance ~North Holland, Amsterdam!.
874 The Journal of Finance