Embed Size (px)
Citation preview
The Performance and Energy Consumption ofEmbedded Real-Time Operating Systems
Kathleen Baynes, Chris Collins, Eric Fiterman, Member, IEEE, Brinda Ganesh,
Paul Kohout, Member, IEEE, Christine Smit, Student Member, IEEE,
Tiebing Zhang, and Bruce Jacob, Member, IEEE
Abstract—This paper presents the modeling of embedded systems with SimBed, an execution-driven simulation testbed that
measures the execution behavior and power consumption of embedded applications and RTOSs by executing them on an accurate
architectural model of a microcontroller with simulated real-time stimuli. We briefly describe the simulation environment and present a
study that compares three RTOSs: �C/OS-II, a popular public-domain embedded real-time operating system; Echidna, a
sophisticated, industrial-strength (commercial) RTOS; and NOS, a bare-bones multirate task scheduler reminiscent of typical
“roll-your-own” RTOSs found in many commercial embedded systems. The microcontroller simulated in this study is the Motorola
M-CORE processor: a low-power, 32-bit CPU core with 16-bit instructions, running at 20MHz. Our simulations show what happens
when RTOSs are pushed beyond their limits and they depict situations in which unexpected interrupts or unaccounted-for task
invocations disrupt timing, even when the CPU is lightly loaded. In general, there appears no clear winner in timing accuracy between
preemptive systems and cooperative systems. The power-consumption measurements show that RTOS overhead is a factor of two to
four higher than it needs to be, compared to the energy consumption of the minimal scheduler. In addition, poorly designed idle loops
can cause the system to double its energy consumption—energy that could be saved by a simple hardware sleep mechanism.
Index Terms—Embedded systems, real-time operating systems (RTOS), power and energy modeling, performance modeling,
Motorola M-CORE, �C/OS-II, Echidna, Chimera.
�
1 INTRODUCTION
THIS paper motivates the use of simulated embeddedmicrocontrollers for system design and presents a
simulation-based experimental study comparing the per-formance and energy characteristics of three real-timeoperating systems (RTOSs)—1) the public-domain em-bedded kernel �C/OS-II [24], 2) the commercial real-timekernel Echidna [12], and 3) a “roll-your-own” style systemthat has an organization common in today’s embeddedsystems [15], [16].
1.1 Motivation
With embedded systems moving toward faster and smallerprocessors and systems on a chip, it becomes increasinglydifficult to accurately quantify embedded-system behavior.Probing a piece of silicon or accurately measuring timingvalues down to a nanosecond or less become moreexpensive and more difficult—in some cases, impossible.
Only a handful of years ago, it was easy enough to hook aprobe to the memory and I/O buses, but, with the advent ofsystems on a chip and application-specific integratedcircuits, it is no longer possible to obtain those signals forthey never leave the silicon [27], [35]. The only way todebug these systems is to either probe the silicon itself (a bitunrealistic) or to add logic to the chip to bring the desiredsignal off the chip; the latter option is limited by the numberof physical pins that can be put on a chip and spared forsimple debug and evaluation purposes. Also, with thespeeds at which some of today’s embedded processors arerunning, it becomes difficult to find a logic analyzer that cankeep up with the processors and not cost something beyondthe reach of most academic research groups and smallembedded-systems design houses. If there were anothermethod to evaluate these systems early on, both time andmoney could be saved.
There are three recent trends that are relevant to thisobservation. First is the increasing popularity of hardware/software cosimulation or codesign [21], [1]. One of thefundamental aspects of this methodology is that, early on inthe process, software is developed for and executed onmodels of the hardware that are implemented in some high-level language. As opposed to the traditional method ofdeveloping the hardware and software for a system sepa-rately, the hardware/software codesign methodology rea-lizes the advantages of designing the two together. Doing soprovides benefits in performance, reliability, and time tomarket, due to the observation that, when hardware andsoftware designers communicate during the design process,there is less chance of problems arising due to ignorance [9].
Another trend gaining in popularity is the use of real-time operating systems [26], [11], [42]. RTOSs are increas-ingly used in the development and deployment of real-time
1454 IEEE TRANSACTIONS ON COMPUTERS, VOL. 52, NO. 11, NOVEMBER 2003
. K. Baynes is with Verizon, Reston, VA.E-mail: [email protected].
. C. Collins is with Intel Corp., Mail stop HD2-141, 77 Reed Rd., Hudson,MA 01749-2895. E-mail: [email protected].
. E. Fiterman is with Salar, Inc., 5569 Gloucester Ave., Churchton, MD20733. E-mail: [email protected].
. B. Ganesh, C. Smit, and B. Jacob are with the Department of Electrical andComputer Engineering, University of Maryland, College Park, MD 20742.E-mail: {brinda, blj}@eng.umd.edu, [email protected].
. P. Kohout is with EVI Technology, LLC, 7138 Columbia Gateway Dr.,Columbia, MD 21046. E-mail: [email protected].
. T. Zhang is with 3e Technologies Inc., 19117 Willow Spring Dr.,Germantown, MD 20874. E-mail: [email protected].
Manuscript received 2 May 2001; revised 9 May 2002; accepted 17 Sept. 2002.For information on obtaining reprints of this article, please send e-mail to:[email protected], and reference IEEECS Log Number 114089.
0018-9340/03/$17.00 � 2003 IEEE Published by the IEEE Computer Society
embedded systems. Their benefits are well-known: Theyprovide numerous helpful facilities, including cooperativeand preemptive multitasking, multithreading, support forboth periodic and aperiodic tasks, fixed-priority/dynamic-priority scheduling, semaphores, interprocess communica-tion, shared memory, and memory management; in doingso, they can dramatically reduce the time to design,develop, and test a product [17], [3], [18].
The third trend is the increasing importance of low-energy systems. There is rapidly growing consumerdemand for computing devices that are both compute-intensive and battery operated, including PDAs, cellphones, wearable computers, handhelds, and laptops [6],[33]. Like many things, it is difficult to retro-fit a low-energyphilosophy into an existing system architecture; as theStrongARM has shown, energy consumption must beconsidered from the beginning of the design phase if thesystem is to be both high-performance and low-power.
These three trends meet at a simple, clear conclusion: It isprudent to have a simulation-based experimental environ-ment for real-time embedded systems, but, if the model is tobe truly useful for developing modern embedded systems,it must be accurate enough to run unmodified real-timeoperating systems and it must accurately characterize theenergy consumption of the system. High-level languagemodeling of applications and their operating systems hasbeen performed by the SimOS group [34] and there hasbeen a large number of recent studies modeling the powerconsumption of microprocessors and applications [22], [19],[20], [14], [7], [43], [38], [39], [31], [32], [13], but ours is one ofthe few experimental environments that performs both (theonly other one of which we are aware is described in [10]).
1.2 SimBed
Our group has developed SimBed, a high-level languagemodel of an embedded hardware system that is accurateenough to run unmodified real-time operating systems (i.e.,the binary that runs on the simulator is the same binary thatruns on real hardware). In this study, we present aprocessor model written in C that emulates the MotorolaM-CORE microcontroller, a low-power, 32-bit CPU corewith 16-bit instructions [40], [41]. All on-chip timers,interrupts, and interrupt handlers used by the operatingsystems and applications are precisely and accuratelysimulated. This is essential to the simulation of a systemrunning an operating systems because it will be accessingthese components very frequently. The model has beenverified as cycle-accurate to within 100 cycles per millioncompared to actual hardware (the difference is due to ahandful of variable-latency hardware instructions such asmultiplication that, for simplicity, we model as havingconstant latencies). The hardware used include two ofMotorola’s M-CORE evaluation boards: one for the genericISA, another for the MMC2001. The numbers presented inthis paper correspond to the first evaluation board, whichclocks the processor at 20MHz.
We have also instrumented the processor simulator tomeasure energy consumption, using existing instruction-based techniques [38]. We have verified the simulator’soutput to measurements of actual hardware and our resultsare within 10-15 percent of real measurements. This level ofaccuracy for modeling power at the processor level is aboutwhere most current research stands (e.g., [7], [38]).
This paper presents an experimental study using SimBedin which the real-time performance and energy consump-tion of three different RTOSs are compared: a public-domain preemptive multitasking kernel, an industrial-strength cooperative multitasking kernel, and a bare-bonestask scheduler (which represents the limiting case of alightweight cooperatively-scheduled RTOS). We also pre-sent the theoretical maximum throughput of the applicationcode sans RTOS.
An interesting side note is that some of SimBed’smeasurements represent quantities that cannot be obtainedvia traditional means (e.g., probes and logic analyzers) oncurrent M-CORE chips without perturbing the observedsystem, as M-CORE offerings all use on-chip memories. Forexample, the division of time and energy into kernel, user,idle, and interrupt-handler components could be obtainedby either instrumenting code or using off-chip memory anda logic analyzer, but both schemes would change thesystem’s execution time and energy consumption.
1.3 Energy Consumption Model
Unlike instruction set simulation, which can be done byusing some simple computation statements, there is noobvious way to determine the power and energy consumedby the system. Instead, we need to find out all the relevantfactors and construct a mathematical model which willapproximately reflect the power and energy consumptionof the system.
The way in which the power estimation function wasadded to the instruction level emulator was first publishedby a Princeton group [39]. Instead of running simulations,this method is based on experiment data. The powerconsumption of each instruction is measured by using aninfinite loop with only this instruction inside. Because it isan infinite loop, a jump instruction has to be used. In orderto minimize the influence of this instruction, severalhundred of the tested instructions are included inside theloop. The power number will be the base power consump-tion number of this specific instruction. This numbermultiplied by the execution time of the instruction willserve as the basic energy consumption of the instruction.
When a piece of code is running, all of the instructions’energy consumption numbers are simply added together toestimate the total energy consumption. However, accordingto another paper [7], this number will always be smallerthan the real measured number. One explanation is that,during the single instruction test, the state of all themodules inside the processor will not change as much aswhen the next instruction is different from the previous one.This extra power consumption is called interinstructionoverhead, which is different for different pairs of instruc-tions, and this accounts for a big part of the processor’soverall power consumption. Measuring all the instructionpairs’ overhead power consumption is nearly impossibledue to the large number of pairs. It was found that thisnumber stays at a similar level for most instruction pairs.Therefore, a simple alternative method is to add a constantvalue to all the executed instruction pairs to compensate forthis overhead value. With this added, the simulated powerconsumption number is close to the measured number andthe error is within the acceptable region.
Another factor that influences the accuracy of thismethod is the changing of the operators of each instruction.
BAYNES ET AL.: THE PERFORMANCE AND ENERGY CONSUMPTION OF EMBEDDED REAL-TIME OPERATING SYSTEMS 1455

Moving an all zero constant and moving an all one constantwill result in different circuit state changes and, therefore,different power consumptions. However, because theparameter of an instruction is random, we can use anaverage number to represent this fluctuation. Test resultsshow that this method is a good approximation.
We verified the accuracy of our power model by runninga small program in an infinite loop, then using a digitalmultimeter to measure the current that the chip consumes.Because the multimeter gives out an average current valueand the program only needs several millisecond to run eachiteration, the reading number will give out the averagecurrent consumption. With a simple multiplication with thepower supply voltage, the average power consumption isfound. After several such tests and comparing the resultswith the simulation results, the error is within 15 percent.This is an acceptable error considering that this is anarchitecture level tool.
1.4 Experiments
This study looks at the behavior of embedded real-timesystems, particularly those that use embedded RTOSs. Ourinitial focus is on systems that use online scheduling (thechoices are made at runtime as opposed to compile-time), asthey tend to be less amenable to analytical verification thansystems with offline scheduling (those in which thescheduling decisions are made at compile-time). All RTOSsstudied handle the simultaneous execution of multipleapplications. The RTOSs are also compared to the theore-tical maximum throughput values calculated for the bench-mark applications. Briefly, these are the execution modelsstudied in this paper:
uC/OS-II: A preemptive multitasking RTOS that is in thepublic domain [24]. It is ROMable and scalable (onlymodules that are needed are compiled into the execu-table). Execution times of all kernel functions andservices are deterministic. Despite its small size(1,700 lines of code), it offers such services as mailboxes,queues, semaphores, time-related functions, etc. It ischosen to represent sophisticated preemptive multi-tasking RTOSs with footprints small enough for micro-controller systems.
ECHIDNA: A cooperative multitasking RTOS based onChimera [36] that swaps Chimera’s POSIX-like threads inthe microkernel for port-based objects [37]; it supportsreconfigurable component-based software for microcon-trollers and digital signal processors [12]. This is chosen tobe representative of sophisticated dynamic-priority co-operative RTOSs with footprints small enough for micro-controller systems (Echidna has a footprint of ~6KB).
NOS: A bare-bones, fixed-priority, multirate executivebased on descriptions of “roll-your-own” RTOSs givenby embedded-systems designers in industry [16].Though it is just a task scheduler and not a full OS, werefer to it in this paper as an “RTOS” for convenience. Itis chosen to represent the attainable energy andperformance limit of nonpreemptive RTOSs.
LIMIT: The theoretical performance limit of each applica-tion, based solely on the computational requirements ofits implementation. This represents the (unattainable)energy and performance limit of a zero-overhead RTOS.
For the realistic performance limit (NOS), we chose amultirate executive rather than something simpler, such asa cyclic scheduler, because the behavior of a cyclic scheduler
is very sensitive to the execution profile of the applicationprogram, while the multirate executive is much less so [23].
On each of these execution models, we execute severaldifferent applications. Following Liu’s terminology [28], weuse the term “job” to mean an independently scheduled block ofcode and the term “task” to mean a collection of logicallyrelated jobs that together perform some function. Theembedded applications studied exploit multitasking to theextent possible in the given OS (�C/OS provides preemp-tive multitasking, Echidna provides cooperative multitask-ing, and NOS schedules work on function boundaries) anduse for all data transfer whatever interprocess communica-tion mechanism is supplied by the RTOS. Within a task, westress the RTOS’s communication mechanism by havingdifferent independently scheduled jobs read the input andwrite the output, i.e., the same job does not perform bothreads and writes to the I/O system. Therefore, theminimum workload for any application is a task of twoindependently scheduled jobs.
The application kernels differ primarily in the amount ofcomputation and include raw IPC (both periodic andaperiodic), up-sampling, down-sampling, and a 128-tap FIRfilter. The applications are chosen to be simple so that theycan be sped up and/or layered atop each other to graduallyincrease the total system workload. Additionally, we alsouse some applications from the Mediabench suite g721-encode, decode and Adpcm-encode, decode. Backgroundload in the form of aperiodic interrupt-driven tasks and acontrol loop performing administrative work makes thesystem less predictable and thus makes life more difficultfor each scheduler. The same application code is executedon all three operating systems (with minor RTOS-specificmodifications) and is used to determine the theoreticalcomputational limit as well. The experiments keep track ofreal-time jitter, response-time delay, and total CPU energyconsumption divided into user, kernel, handler, semaphore,and idle components.
1.5 Results
The performance measurements yield both predictable andsurprising results. Predictably, as system load is increased,the RTOSs studied hit their job deadlines consistently untila critical system load is reached, beyond which point theRTOSs miss deadlines with increasing frequency and byincreasing amounts of time. Also predictably, the fixedpriority scheduler in NOS leads to complete denial ofservice for lower-priority jobs when the critical system loadis reached. The surprising results include situations wherethe industrial RTOSs miss deadlines with predictableregularity and with probability 1, even when the systemis under light load. This is due to unexpected interrupts andunaccounted-for task invocations that cause individual jobtiming to be thrown off, but only occasionally. In general, toensure on-time task invocations in the face of unpredictableevents (e.g., external device interrupts), an RTOS mustmaintain significant CPU head-room: 10-20 percent idleCPU cycles is not too much.
The energy-consumption measurements show someinteresting results. RTOS energy overheads can be extre-mely high when running low-overhead tasks; if the taskrequires very little computation time for each job invoca-tion, the RTOS can easily account for 90 percent of theprocessor’s energy consumption and poorly considered idleloops can double the system’s energy requirements. As aperiodic task’s complexity and CPU requirements grow, theproportion of the energy spent in the RTOS diminishes
1456 IEEE TRANSACTIONS ON COMPUTERS, VOL. 52, NO. 11, NOVEMBER 2003

significantly and the effect of the idle loop is alsodiminished. There is also an interesting trade off that themore complex RTOSs seem to have taken: While the bare-bones scheduler has the lowest energy consumption, thatconsumption scales with the workload. The more complexRTOSs have a higher initial energy consumption, but thisconsumption does not increase as quickly as the simplerRTOS when the user-level computational load grows.Therefore, the energy consumption and CPU requirementsof these more complex RTOSs are likely to be much morepredictable than a simpler RTOS.
2 EXPERIMENTAL SET-UP
We use an execution-driven simulation of the MotorolaM-CORE processor that can run unmodified RTOSs. On thissimulator, we run three different software configurations:�C/OS-II, Echidna, and NOS—the public-domain kernel,the industrial RTOS, and the simple multirate executive,respectively. We run several benchmarks atop each of these,increasing the workload to the point where the system failsto meet deadlines. We also ran the benchmarks without anyRTOS support, to obtain performance and energy-con-sumption limits.
2.1 Motorola M-CORE Processor
The M-CORE is a low-power, compiler-friendly coredesigned specifically for the embedded market [29], [30],[40], [41]. It is a RISC-based design that uses 16-bitinstructions and operates on 32-bit data. It has a simplefour-stage single-issue pipeline, memory-mapped I/O, anorthogonal general-purpose register file with 16 registers,and a duplicate “shadow” register file that privilegedsoftware can enable instead of the regular register file. Forthis study, we simulate the processor at 20MHz, the sameclock frequency as the evaluation hardware. The timingmechanism on the M-CORE evaluation board is simple andoffers precision on the order of 1�s. It is a 2-byte counter inI/O space that increments every 1.6�s. Every 100ms (every62,500 ticks of the counter), the counter wraps around andraises a timer interrupt to the CPU.
2.2 Application Code
The following describe the range of user-level code run inthe experiments.
Periodic Interprocess Communication. Periodic interpro-cess communication (IPC) is the simplest of the bench-marks that was used to evaluate performance. Asmentioned above, the first job grabs data off of the inputI/O port and use RTOS-provided IPC (e.g., sharedmemory). The second job receives that value memoryand writes it to the output I/O port. There is nocomputation, only the movement of data. This taskrepresents the simplest possible two-job task possible.
Up/Down Sampling. With up sampling (UP), the second jobruns at a higher frequency than that of the first job. Only afraction of times that the second job has run will there beany new information. Therefore, the second job carries outa basic form of interpolation. In down sampling (DOWN),the first job runs at a higher frequency than the second job.The second job takes all of the values that have beenbrought inby the read job since the last time that second jobwas run, averages them, and then outputs that average tothe output I/O port.
Finite Impulse Response Filter. The finite impulseresponse (FIR) filter is a computation intensive bench-mark. The second job runs a 128-tap filter on the datathat has been collected by the first task. For each run ofthe second job, the last 128 values to be input by the firstjob are used to compute an inner product and that valueis output to the I/O port.
G721 Decode. G721 is an application in the Mediabenchsuite. It decodes a G.721 voice compressed sample. Thefirst job reads in a previously compressed sample whichthe second job decodes 4 bits at a time.
ADPCM Encode. Adpcm is an application in the Media-bench suite. It performs a conversion from a linear 16 bitPCM sample to a 4 bit ADPCM sample. The first jobreads in a single sample which the second job encodesand writes to an I/O port. This is the most computationintensive of the benchmarks used.
Background Load. To add some nondeterminism to theevaluation of these two operating systems and to offermore realistic simulations indicative of real-worldsystems, two different additional tasks were created.These tasks can be run concurrently with the above listedbenchmarks to provide a background load. These twotasks are a periodic control loop and an aperiodicinterprocess communication process.
Control Loop. This task runs in the background at a periodof 32ms to simulate the background load that manyembedded systems have running while they are per-forming other tasks, such as a cell phone that has a taskthat runs periodically to refresh its LCD display. Thiscontrol loop performs several memory lookups with anindex that is randomly generated.
Aperiodic Interprocess Communication. This task is runwhen a simulated I/O interrupt is generated by thehardware. It schedules a high-priority user-level job inresponse that writes to the I/O space. This is themechanism used to determine system response timeunder load. The interrupt interarrival times obey ageometric distribution: The emulator generates an inter-rupt every 100�s with a probability of 0.01, giving anaverage of 100 interrupts a second.
Note that the same application code is executed on all threeoperating systems (with minor RTOS-specific modifica-tions). The experiments keep track of real-time jitter,response-time delay, and total CPU energy consumptiondivided into user, kernel, handler, semaphore, and idlecomponents.
2.3 Characterization of Real-Time Behavior
As mentioned earlier, we take three measurements: jitter,delay, and cycle-by-cycle energy consumption.
Jitter. Jitter is measured by keeping track of interarrivaltimes of periodic output. For example, if a task isscheduled to generate an output value every 10 milli-seconds, its average interarrival time should be 10 milli-seconds. Any variation in the interarrival time representsoutput that fails to arrive on time.
Note that this differs slightly from the traditionaldefinition which is based on the RTOS’s knowledge of amissed deadline because, if a scheduler happens to
BAYNES ET AL.: THE PERFORMANCE AND ENERGY CONSUMPTION OF EMBEDDED REAL-TIME OPERATING SYSTEMS 1457

execute a task consistently late, it will nonetheless appearon-time to the external world.
Delay. Delay is measured by keeping track of the timebetween actions in aperiodic stimulus-response pairs. Inthe aperiodic-IPC workload, we keep track of the delaybetween the I/O interrupt that signals the input and thetime that the application output is received at theI/O system (as opposed to the time that the handler isinvoked or the moment that the output to I/O system isinitiated). This represents the response time of thesystem as a function of system load.
Note that this differs significantly from traditionaldefinitions of interrupt latency, which characterize asystem by the time interval from raising the interrupt toexecuting the handler for that interrupt. Moreover,traditional measurements of delay give a single number,whereas we present a distribution.
Energy consumption. Energy consumed is tagged with thecurrently executing instruction’s program counter, indi-cating what function in the system is being executed. Theexecution time for NOS and Echidna is divided into user,kernel, handler, semaphore, and idle components. Theexecution time for �C/OS is divided more finely, includ-ing idle, user, event handling, semaphore management,time management, context switching, interrupt handling,interrupt disabling and enabling, thread scheduling, taskmanagement (creation/deletion/etc.), and initialization.Wealso study theeffect ofusing thedoze instructionon theenergy consumption of the RTOS.
More detail on the MCORE processor, SimBed’s internals,applications, and RTOS models can be found elsewhere [4],[5], [8], [44].
2.4 Real-Time Kernels
2.4.1 The uC/OS-II Kernel
The �C/OS-II real-time kernel is a full-featured preemptivemultitasking RTOS [24]. It is portable, targeted at bothmicrocontrollers and DSPs, and it currently runs on over50 different instruction-set architectures. It is designed tohave a small footprint: There are roughly 1,700 lines of codein the OS (including comments) and modules are onlycompiled into the executable if used by the application.Multitasking is preemptive and the kernel can preemptitself. The system can run up to 64 tasks, with eight of thosetasks reserved for the kernel’s use. It provides traditionalOS services such as IPC, semaphores, and memorymanagement and it also provides time-related featuressuch as the ability to sleep until a specified time and calloutfunctions in which an application can specify code toexecute on task creation, task deletion, context switch, andsystem timer tick.
Because �C/OS-II has no concept of a periodic task, weused two facilities within the kernel to implement periodicjob invocations. Each job sleeps on a unique semaphore anda user-level task is attached to the clock interrupt (�C/OS-IIallows user-level code to be attached to arbitrary events).This user-level task keeps track of the job invocation timesand generates wake up messages when the job periods arereached. The interprocess communication method is mes-sage-passing.
2.4.2 The Echidna RTOS
Echidna is a scaled down version of the Chimera RTOS [36]that replaces Chimera’s concept of a process (which isnotionally similar to that of POSIX threads) with port-basedobjects [37]. It is designed to support dynamically reconfi-gurable real-time software and is targeted for 8-bit to 32-bitmicrocontrollers as well as DSPs, whereas Chimera wasintended for 32-bit multiprocessor systems due to itsrelatively high overhead. Echidna, like Chimera, providescooperative multitasking. It offers a good deal of function-ality in a small footprint—as little as 6KB, depending on theconfiguration. The design concepts embodied in the RTOSare described in more detail in [12].
Echidna is designed to support only periodicallyscheduled tasks and its periods are defined in terms ofmilliseconds (no finer granularity is supported by the OS).The interprocess communication method used is sharedmemory. To calculate delay times, we create a process withthe smallest period possible (1ms) that checks to see if anAP-IPC interrupt has occurred. If such is the case, then theAP-IPC code will run. It is important to note that, since aninterrupt is possible (though not likely) every 100�s and theinterrupt is checked only every 1ms, it is possible for two ormore interrupts to happen before any of them are serviced.This is an expected behavior of nonpreemptive systems.
2.4.3 The NOS Multirate Executive
NOS represents the type of “roll-your-own” RTOS oftenproduced in the embedded-systems industry—it wasdesigned in-house and is based entirely on descriptions ofhome-grown embedded system software given by practi-cing engineers in the embedded-systems industry [16]. NOSis a fixed-priority multirate executive for periodic tasks [23]and handles interrupt-driven stimuli via masking interruptsand polling the interrupt status registers when idle. Its maincontrol loop is shown in Fig. 1.
NOS’s callout queue is taken from the callout table inUnix [2]; events to happen in the future are placed in thequeue keyed by the time at which they are expected toexecute and the delta field in the event structure representsthe time difference between the event in question and theone before it in the queue. The delta field of the first eventrepresents the invocation time relative to now. If the value isnegative, the deadline for the first task (and perhapsfollowing tasks as well) has been missed; if the value iszero, it is time to execute the first task; if the value ispositive, the first event is to happen at some point in thefuture. One nice feature of this organization is that aperiodic task can easily be created by having a functionplace itself back on the queue at the end of its execution.
NOS only handles a job or interrupt if there are no jobs orinterrupts waiting at higher priority levels. Therefore, atlevels beneath priority 1 (HARD jobs that have reachedtheir time to execute), only one job is executed beforejumping back to the top of the control loop—e.g., only oneinterrupt is handled before checking the callout queue tosee if any more HARD jobs are ready to run. It is a simplefixed-priority scheduler with the expected weakness thatlow priority jobs will be ignored indefinitely if there isenough work to do at a higher priority.
2.5 Simulation Support for Real-Time OperatingSystems
For a real-time operating system to succesfully run on amicroprocessor, the processor must provide the RTOS with
1458 IEEE TRANSACTIONS ON COMPUTERS, VOL. 52, NO. 11, NOVEMBER 2003

several features. First, the processor must allow the RTOS to
accurately determine the current time and how this relates
to the external clock time. Second, if interrupts are not
polled, the hardware must be able to preempt the current
instruction stream upon arrival of an interrupt, save the
relevant system state, and start executing a predetermined
interrupt service routine. These are the only essential
functions that the processor needs to run an RTOS.The simulator must accurately model all of the proces-
sor’s functionality that is used by the real-time operating
system. In addition to being cycle-accurate, the simulator
must correctly support the above-mentioned essential
functions of a processor. For the MCORE processor, this
includes interrupts, exceptions, and hardware timers, all of
which have been implemented and validated.
3 EXPERIMENTAL RESULTS
For these studies, we execute the following benchmarks:periodic IPC (P-IPC), up-sampling (UP), down-sampling(DOWN), a 128-tap FIR filter (FIR, ADPCM encode andg721 decode. We also have a periodic control-type admin-istrative loop (CL) and interrupt-driven aperiodic IPC (AP-IPC) that can be run concurrently with the benchmarks toprovide background load. The CL background task runs at32Hz and the AP-IPC interarrival times obey a geometricdistribution (we generate an interrupt every 100�s withprobability 0.01, resulting in an average of 100 AP-IPCinterrupts per second). We varied the following parameters:
. RTOSs: {�C/OS-II, Echidna, NOS}
. Periodic tasks: {P-IPC, UP, DOWN, FIR, ADPCMEncode, G721 Decode}
. Workload: {1, 2, 4, 8 tasks}
BAYNES ET AL.: THE PERFORMANCE AND ENERGY CONSUMPTION OF EMBEDDED REAL-TIME OPERATING SYSTEMS 1459
Fig. 1. NOS main loop—simple multirate executive with fixed priority scheme. Design based on descriptions of RTOSs built by designers in industry
[16], e.g., “The dispatch mechanism is a while(1) loop that does the highest priority thing, then the next highest, then the next highest, etc., in each
case repeating the loop without touching lower priority tasks if there is more to do on that priority ... This can be interrupt-based or completely polled
depending upon hardware.” In this case, all I/O is polled.

. Periods: {16, 8, 4, 2, 1, 0.5, 0.25, 0.125, 0.064 msec}
. UP/DOWN Sampling ratios: {2:1, 4:1, 8:1}
. Background load: {AP-IPC, AP-IPC+CL, CL}
The studies represent the effective cross-product of thesevariations, minus those configurations that lie beyond thepoint where the system in question failed to meet deadlines.Also, Echidna will not schedule periodic tasks with periodsless than 1ms; therefore, we do not have results for periodsat 500�s or below for Echidna. Remember that, by design,no job performs both reads and writes to I/O; therefore,each task is actually two separately scheduled jobs.
3.1 Real-Time Jitter
As described above, jitter measurements represent the timedeltas between successive output seen at the I/O device fora given executing task. When multiple tasks are executingsimultaneously, each writes to a different I/O port,enabling the distinction between tasks, and each taskcontributes equally to the data in the graphs.
The graphs shown are probability density graphs,centered on the expected period. Data points at positivex-coordinates indicate late execution; data at negativex-coordinates indicate early execution. To keep the graphsreadable, only nonzero y-values are shown and values havebeen gathered into 100 �s intervals.1
Fig. 2 presents the jitter measurements for the periodicIPC, with background load and without. The periodic IPCtask represents the simplest possible case of two interactingjobs: The input job reads input from I/O space and usesRTOS-supplied interprocess communication to send thedata to the output job and the output job sends the receiveddatum to another I/O port. There is no computationperformed other than moving data; this therefore representsthe smallest workload that a realistic application wouldschedule on an RTOS. It is thus likely to exhibit the highestpossible RTOS overhead.
The graphs show spikes of data points, usually centeredat zero (indicating an on-time arrival of output I/O), withany number of data points on either side of the spike. Theheight of a data point indicates the probability of seeing thattime delta—for instance, Fig. 2d shows that, when Echidnais running eight tasks with 16ms periods (16 jobs), roughly20 percent of the jobs will execute exactly on-time,40 percent of the jobs will execute a little early, and40 percent of the jobs will execute a little late; roughly1 percent of the time the job executions will be 50�s off, ineither direction. When the system load is four tasks (eightjobs), job executions are on-time roughly 85 percent of thetime and missed deadlines are either too early or too latewith roughly equal probability and absolute value. Whenexecuting one or two tasks, job execution is always on time.
There are some obvious RTOS behaviors shown in thefigure: There is a workload level at which point the RTOSfails to meet deadlines. Once this line is crossed, most if notall of the output arrives late every time (e.g., 8-task outputin Fig. 2c, Fig. 2h, etc.). For Echidna, this point is around500Hz with eight IPC tasks running; for �C/OS and NOS,the point is above 1MHz, even for eight tasks running.
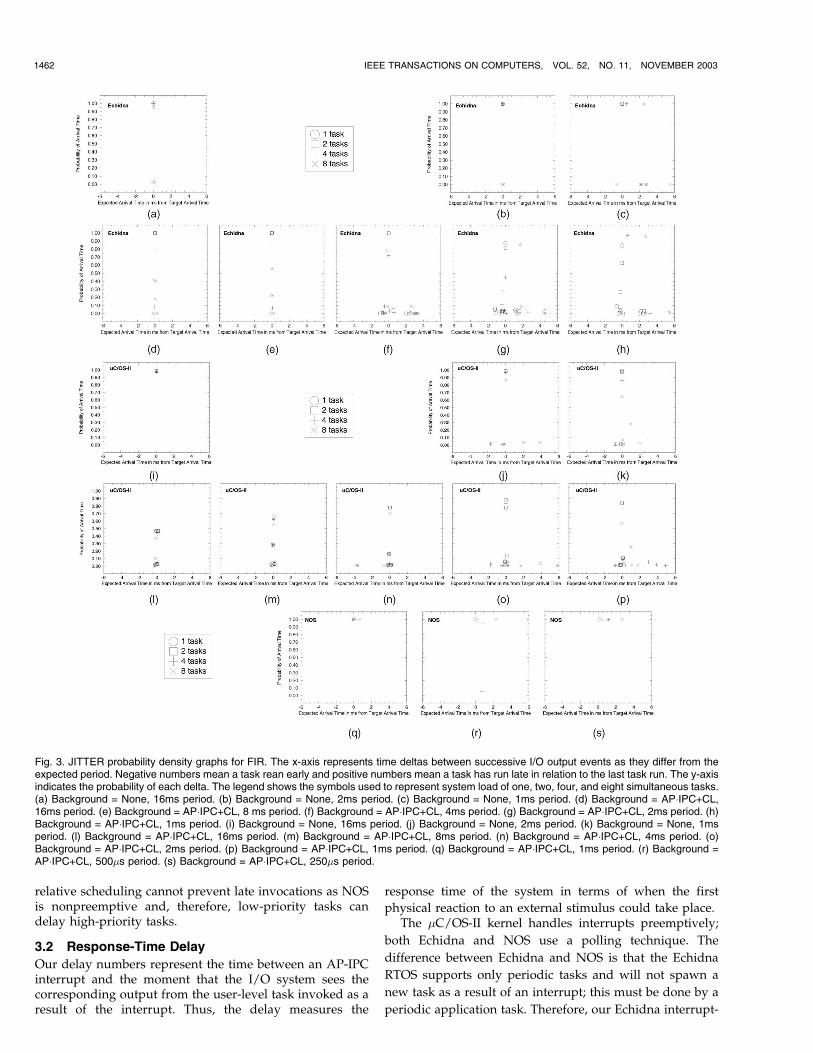
Fig. 3 presents the jitter measurements for the FIR filter.This benchmark represents the largest computational over-head per job invocation; as expected, it shows the samebehavior as the IPC benchmark, only at different periods—the system is overloaded sooner, compared to IPC. Theresults are very similar to the IPC results, except that theydisplay slightly more variation in the timing.
An interesting result seen in the graphs is that, even atlight workloads (e.g., tasks running with 16ms periods),Echidna and �C/OS execute a number of tasks toolate—and an equal number of tasks too early. Moreover,the number of early/late job invocations does not seem toscale with workload (for example, �C/OS at task periods of16ms cannot get more than 50 percent of the tasks to executeon-time when the system is perturbed by occasionalinterrupts (see Fig. 3l). This behavior is caused in bothRTOSs by task self-interference. This is specific to tasks withjobs that run with different periods; when the periods arenot relatively prime, job invocations coincide in time everyNth invocation. If the RTOS fails to distribute the workloadappropriately, the system experiences a traffic jam everyNth invocation, resulting in late executions for many of thejobs. Thus, we see that the larger the ratio between the twoperiods, the fewer instances of traffic jams, even if the totalworkload increases. This also means that, when differentjobs periodically all want the same invocation time, thetraffic jams will happen with probability 1, even if theworkload is light.
This type of early/late behavior is not confined to self-interference, however. We saw the behavior in all applica-tions studied; the presence of background load thatoccasionally (but not always) intrudes on execution timealso causes regular traffic jams. In Echidna, the backgroundcontrol loop is a periodic task with period 32ms. The controlloop is executed every other job invocation when runagainst 16ms tasks, every fourth job invocation when runagainst the 8ms tasks, etc. Whenever the control loop runs,it pushes the actual invocation times of other jobs outslightly so that they run late and then early on the nextinvocation. Therefore, 16ms tasks are upset by the dis-turbance more than 1ms tasks, even though they represent ahigher system workload.
The disturbance in �C/OS is the aperiodic IPC interruptthat happens on average every 10ms. Because �C/OS ispreemptive, the task invoked by the interrupt handler has ahigher priority than any of the periodic application tasks, soit preempts application threads whenever it runs. The 16mstasks are upset most by this (see Fig. 3l) because theinterrupt displaces a user thread on roughly every other jobinvocation (thus, only 50 percent of the job invocations areon-time). As the user threads execute more frequently, theinterrupt preempts user threads with decreasing frequencyand we see that more job invocations are on-time, eventhough the system load has increased.
Timing disturbances in real-time schedulers do notrequire unpredictable background load, however. The UPand DOWN benchmarks exhibit this interference evenwithout any background load. The simulation results forup-sampling are shown in Fig. 4. The top row representsEchidna without any background load. The second row ofgraphs is Echidna with background load. The third row is�C/OS without background load and the last row is �C/OSwith background load. We see that both RTOSs allow
1460 IEEE TRANSACTIONS ON COMPUTERS, VOL. 52, NO. 11, NOVEMBER 2003
1. Note that the probability density graphs do not smooth out as moredata is collected—for example, there are only minimal differences in graphsgenerated from 50 million data points as compared to graphs generatedfrom 1 billion data points.

applications to interfere with themselves, even when tasksare scheduled with relatively low frequencies. This isbecause the periods are not the same, but they are notrelatively prime (they are multiples of each other in thisinstance), so task invocations will coincide in time everyNth invocation. Neither operating system manages tospread the tasks out in time.
The systems would clearly benefit from better loaddistribution. For example, if the future job invocations were
scheduled relative to the actual job invocation time ratherthan the intended invocation time, the system wouldnaturally spread out the jobs and it would only have lateinvocations during the first round of invocations. Neither�C/OS nor Echidna manages to spread the tasks out intime. In contrast, NOS schedules tasks relative to theiractual invocation time. Thus, even if a task runs late the firsttime, the following invoations will be on time. However,this is not a panacea: As the workload increases, this
BAYNES ET AL.: THE PERFORMANCE AND ENERGY CONSUMPTION OF EMBEDDED REAL-TIME OPERATING SYSTEMS 1461
Fig. 2. JITTER probability density graphs for P-IPC. The x-axis represents time deltas btween successive I/O output events as they differ from theexpected period. Negative numbers mean a task ran early and positive numbers mean a task has run late in relation to the last task run. The y-axisindicates the probability of each delta. The legend shows the symbols used to represent system load of one, two, four, and eight simultaneous tasks.(a) Background = None, 16ms period. (b) Background = None, 2ms period. (c) Background = None, 1ms period. (d) Background = AP�IPC+CL,16ms period. (e) Background = AP�IPC+CL, 8ms period. (f) Background = AP�IPC+CL, 4ms period. (g) Background = AP�IPC+CL, 2ms period. (h)Background = AP�IPC+CL, 1ms period. (i) Background = None, 16ms period. (j) Background = None, 2ms period. (k) Background = None, 1msperiod. (l) Background = AP�IPC+CL, 16ms period. (m) Background = AP�IPC+CL, 8 ms period. (n) Background = AP�IPC+CL, 4ms period. (o)Background = AP�IPC+CL, 2ms period. (p) Background = AP�IPC+CL, 1ms period. (q) Background = AP�IPC+CL, 1ms period. (r) Background =AP�IPC+CL, 250�s period. (s) Background = AP�IPC+CL, 64�s period.
relative scheduling cannot prevent late invocations as NOSis nonpreemptive and, therefore, low-priority tasks candelay high-priority tasks.
3.2 Response-Time Delay
Our delay numbers represent the time between an AP-IPCinterrupt and the moment that the I/O system sees thecorresponding output from the user-level task invoked as aresult of the interrupt. Thus, the delay measures the
response time of the system in terms of when the first
physical reaction to an external stimulus could take place.The �C/OS-II kernel handles interrupts preemptively;
both Echidna and NOS use a polling technique. The
difference between Echidna and NOS is that the Echidna
RTOS supports only periodic tasks and will not spawn a
new task as a result of an interrupt; this must be done by a
periodic application task. Therefore, our Echidna interrupt-
1462 IEEE TRANSACTIONS ON COMPUTERS, VOL. 52, NO. 11, NOVEMBER 2003
Fig. 3. JITTER probability density graphs for FIR. The x-axis represents time deltas between successive I/O output events as they differ from theexpected period. Negative numbers mean a task rean early and positive numbers mean a task has run late in relation to the last task run. The y-axisindicates the probability of each delta. The legend shows the symbols used to represent system load of one, two, four, and eight simultaneous tasks.(a) Background = None, 16ms period. (b) Background = None, 2ms period. (c) Background = None, 1ms period. (d) Background = AP�IPC+CL,16ms period. (e) Background = AP�IPC+CL, 8 ms period. (f) Background = AP�IPC+CL, 4ms period. (g) Background = AP�IPC+CL, 2ms period. (h)Background = AP�IPC+CL, 1ms period. (i) Background = None, 16ms period. (j) Background = None, 2ms period. (k) Background = None, 1msperiod. (l) Background = AP�IPC+CL, 16ms period. (m) Background = AP�IPC+CL, 8ms period. (n) Background = AP�IPC+CL, 4ms period. (o)Background = AP�IPC+CL, 2ms period. (p) Background = AP�IPC+CL, 1ms period. (q) Background = AP�IPC+CL, 1ms period. (r) Background =AP�IPC+CL, 500�s period. (s) Background = AP�IPC+CL, 250�s period.

handler task is periodic with the shortest period supported
by Echidna, 1ms, and it simply checks for IPC-related
interrupts whenever it executes, sending output to an I/O
port whenever it finds that such an interrupt has happened.
NOS treats interrupts as tasks with a fixed priority (LOW).
When an interrupt occurs, NOS first finishes the currently
active task, if any, and then looks at the ready queue. If
there are no ready tasks with higher priority than the
interrupt handler, NOS services the interrupt. Thus, at light
workloads, an interrupt gets serviced almost at once. With a
heavier workload, this response time can vary from very
low to very high depending on what the instantaneous
workload is when the interrupt occurs.The delay times are shown in Fig. 5. These represent the
range of CPU load from very light (1 G721 Decode task,16ms period) to very heavy (8 Adpcm Encode tasks, 80 ms
period). As expected of a cooperatively multitasked RTOS,Echidna’s response time is more-or-less evenly distributedover a 1ms interval until the system becomes heavilyloaded, at which point the execution time of the periodicinterrupt-handler task can vary by a significant amount (upto several milliseconds). Also as expected, the preemptive�C/OS-II kernel handles interrupts with absolute precisionthat is independent of application load. The NOS systemhas the simplest mechanism of all because its cooperativelyscheduled nature means no state needs to be saved on taskswitch, so we should expect to see zero response time atlight workloads. But, using the “idle” mode affects thisresponse time adversely, as we see in Fig. 5g. When thesystem idles in NOS, the kernel executes the “doze”instruction. The system will awake from doze mode atevery timer interrupt. As a result, the response time at lightworkloads is distributed uniformly in a time interval of one
BAYNES ET AL.: THE PERFORMANCE AND ENERGY CONSUMPTION OF EMBEDDED REAL-TIME OPERATING SYSTEMS 1463
Fig. 4. JITTER probability density graphs for UP. The x-axis represents time deltas between successive I/O output events as they differ from theexpected period—negative numbers indicate the output happened early. The y-axis indicates the probability of each delta. The legend shows thesymbols used to represent system load of one, two, four, and eight simultaneously executing tasks. (a) Background = None, 8/4ms period. (b)Background = None, 8/2ms period. (c) Background = None, 8/1ms period. (d) Background = 1, 4/2ms period. (e) Background = None, 4/1ms period.(f) Background = None, 2/1ms period. (g) Background = AP�IPC+CL, 8/4ms period. (h) Background = AP�IPC+CL, 8/2ms period. (i) Background =AP�IPC+CL, 8/1ms period. (j) Background = AP�IPC+CL, 4/2ms period. (k) Background = AP�IPC+CL, 4/1ms period. (l) Background = AP�IPC+CL,2/1ms period. (m) Background = None, 8/4ms period, (n) Background = None, 8/2ms period. (o) Background = None, 8/1ms period. (p) Background= None, 4/2ms period. (q) Background = None, 4/1ms period. (r) Background = None, 2/1ms period. (s) Background = AP�IPC+CL, 8/4ms period. (t)Background = AP�IPC+CL, 8/2ms period. (u) Background = AP�IPC+CL, 8/1ms period. (v) Background = AP�IPC+CL, 4/2ms period. (w) Background= AP�IPC+CL, 4/1ms period. (x) Background = AP�IPC+CL, 2/1 ms period.
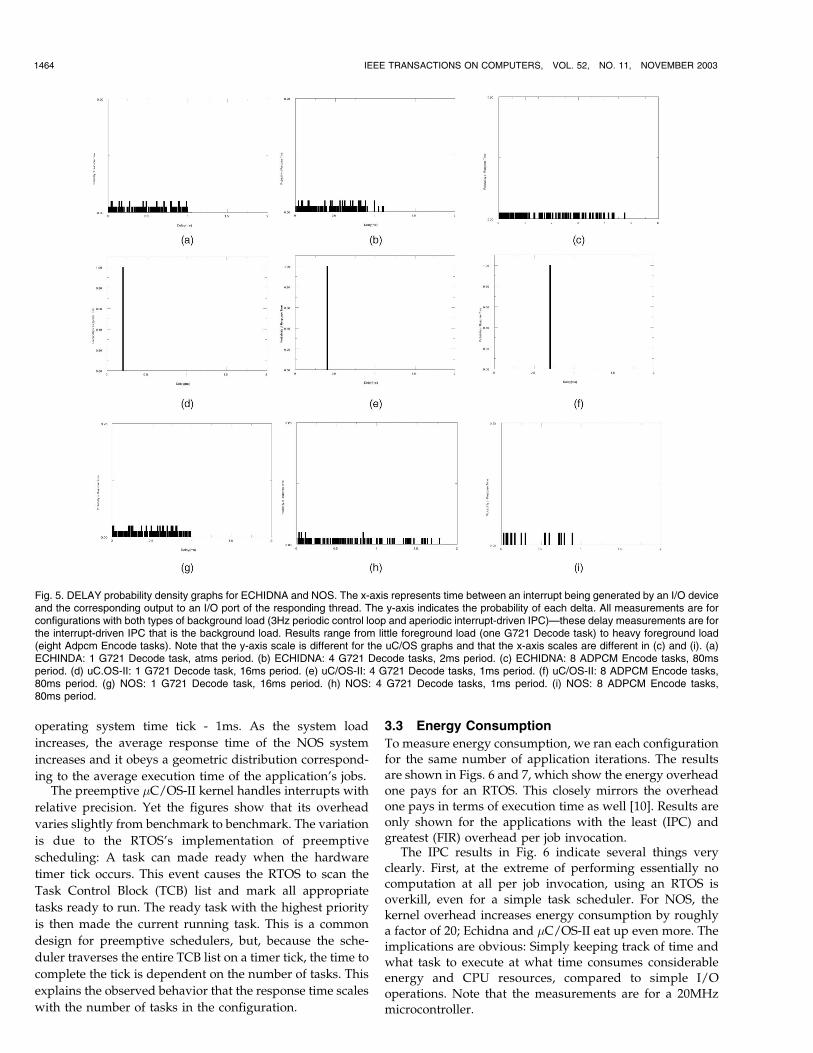
operating system time tick - 1ms. As the system load
increases, the average response time of the NOS system
increases and it obeys a geometric distribution correspond-
ing to the average execution time of the application’s jobs.The preemptive �C/OS-II kernel handles interrupts with
relative precision. Yet the figures show that its overhead
varies slightly from benchmark to benchmark. The variation
is due to the RTOS’s implementation of preemptive
scheduling: A task can made ready when the hardware
timer tick occurs. This event causes the RTOS to scan the
Task Control Block (TCB) list and mark all appropriate
tasks ready to run. The ready task with the highest priority
is then made the current running task. This is a common
design for preemptive schedulers, but, because the sche-
duler traverses the entire TCB list on a timer tick, the time to
complete the tick is dependent on the number of tasks. This
explains the observed behavior that the response time scales
with the number of tasks in the configuration.
3.3 Energy Consumption
To measure energy consumption, we ran each configurationfor the same number of application iterations. The resultsare shown in Figs. 6 and 7, which show the energy overheadone pays for an RTOS. This closely mirrors the overheadone pays in terms of execution time as well [10]. Results areonly shown for the applications with the least (IPC) andgreatest (FIR) overhead per job invocation.
The IPC results in Fig. 6 indicate several things veryclearly. First, at the extreme of performing essentially nocomputation at all per job invocation, using an RTOS isoverkill, even for a simple task scheduler. For NOS, thekernel overhead increases energy consumption by roughlya factor of 20; Echidna and �C/OS-II eat up even more. Theimplications are obvious: Simply keeping track of time andwhat task to execute at what time consumes considerableenergy and CPU resources, compared to simple I/Ooperations. Note that the measurements are for a 20MHzmicrocontroller.
1464 IEEE TRANSACTIONS ON COMPUTERS, VOL. 52, NO. 11, NOVEMBER 2003
Fig. 5. DELAY probability density graphs for ECHIDNA and NOS. The x-axis represents time between an interrupt being generated by an I/O deviceand the corresponding output to an I/O port of the responding thread. The y-axis indicates the probability of each delta. All measurements are forconfigurations with both types of background load (3Hz periodic control loop and aperiodic interrupt-driven IPC)—these delay measurements are forthe interrupt-driven IPC that is the background load. Results range from little foreground load (one G721 Decode task) to heavy foreground load(eight Adpcm Encode tasks). Note that the y-axis scale is different for the uC/OS graphs and that the x-axis scales are different in (c) and (i). (a)ECHINDA: 1 G721 Decode task, atms period. (b) ECHIDNA: 4 G721 Decode tasks, 2ms period. (c) ECHIDNA: 8 ADPCM Encode tasks, 80msperiod. (d) uC.OS-II: 1 G721 Decode task, 16ms period. (e) uC/OS-II: 4 G721 Decode tasks, 1ms period. (f) uC/OS-II: 8 ADPCM Encode tasks,80ms period. (g) NOS: 1 G721 Decode task, 16ms period. (h) NOS: 4 G721 Decode tasks, 1ms period. (i) NOS: 8 ADPCM Encode tasks,80ms period.

The FIR results in Fig. 7 show that, for more realistic
applications (bear in mind that FIR is still relatively light in
computation time at ~233�s per invocation), RTOS kernel
overhead is more reasonable. The use of the NOS scheduler
increases energy consumption by less than a factor of two
and the Echidna and �C/OS-II kernels increase energy
consumption by less than a factor of three.Several behaviors can be seen in the data, from the
obvious to the not-so-obvious:
. Interrupt handling overhead is significant in systemsthat are interrupt-driven and insignificant in thecooperative systems. The latter makes sense because,in the polled systems, no state is saved or restoredduring interrupt handling. The former is interesting;the �C/OS-II kernel demonstrates that, in heavilyloaded systems, it can use interrupts to off-loadsome of Echidna’s overhead.
. The user components for the more sophisticatedRTOSs (Echidna and �C/OS-II) tend to be less thantheuser components forNOS—and less than the limit,as well! This simply represents the trade off of beingable to move some of the functionality from theapplication into the kernel. However, in the IPCgraphs, the user components are higher—the lowcomputation requirements of IPC expose the user-level component of the clock-tick interrupt handler in�C/OS-II that runs every clock tick and wakes upsleeping threadswhen it determines that their periodshave expired. This is present in all applications.
. The systems all consume an enormous amount ofenergy doing nothing, as represented by the idlecomponents. This is because none of the systemshave an intelligent sleep mechanism that can use lesspower when there is nothing to do; though theMcORE has such a facility (a doze mode that can beawakened by a watch-dog timer interrupt), nosystem uses it. If implemented, this would saveconsiderable energy resources. Note, however, thatthere is very little idle time as the system is pushedup to but not beyond its limits, which is whereembedded-system engineers would like their
systems to be as this makes most effective use ofthe CPU resources.
. The kernel overhead in NOS scales with theapplication workload, while the kernel componentsin the other RTOSs are more constant. The moresophisticated RTOSs do a better job of ensuring thatall computations are deterministic in the time andenergy it takes to perform them, which gives morepredictable system behavior. The cost is obviously ahigher starting point for energy consumption.
. It is cheaper to run tasks faster than to add tasks tothe system. For instance, in the FIR graphs, compareNOS:8 in Fig. 7a, NOS:4 in Fig. 7b, NOS:2 in Fig. 7c,and NOS:1 in Fig. 7d, which represent differenttrade offs of speed and number of tasks. The usercomponents are the same for these configurations asthe configurations all represent the same amount ofwork: 2,000 job invocations per second, broken downas (respectively) 16 jobs, each scheduled every 8ms,eight jobs, each scheduled every 4ms, four jobs, eachscheduled every 2ms, and two jobs, each scheduledevery millisecond. Though the work is the same, thekernel energy is not; this is seen in other configura-tions as well as in NOS. The reason is simple: TheRTOSs maintain queues of tasks, typically as linkedlists, which grow with the number of tasks.
Please note that “idle” time is both time spent sleeping andtime in certain inactive loops. Just because Echidna still hasidle time after the system is overloaded with work does notmean that any more useful work can be done.
We study the effect of using the doze mode provided bythe processor on the energy consumption of two operatingsystems—NOS and UCOS. The graphs in Fig. 8 are for thetwo operating systems using the idle instruction.
The idle mode on the Mcore can be reached by executing
a simple doze instruction. This reduces the current drawnby the processor by nearly 50 percent. The processor leavesthis mode only when an interrupt arrives.The two operatingsystems—NOS and �COS can use this mode very easily.
These operating systems maintain a system clock whosegranularity is determined by the rate of the timer interrupt.
BAYNES ET AL.: THE PERFORMANCE AND ENERGY CONSUMPTION OF EMBEDDED REAL-TIME OPERATING SYSTEMS 1465
Fig. 6. Energy consumption graphs for IPC. The x-axis represents increasing workloads as a result of increasing the number of executing tasks or.
The y-axis represents the total CPU energy consumption and breakdowns for how much energy is consumed by executing kernel code, executing
user application code, handling interrupts, performing semaphore handling, and sitting idle. Note that “idle” includes both time sleeping as well as
some loop overhead in the main loop—and parts of the timekeeping code for Echnidna. (a) Task period: 16ms. (b) Task period: 1ms.

We peg this to 1 kHz or a system clock granularity in theorder of milliseconds. When the system executes the idletask, it implies that there are no tasks on the task queuewhich need to be executed in that particular timer tick. Theoperating system can thus safely execute the doze instruc-tion at this juncture. The system will stay in low powermode till the next interrupt—when it will update its clockand timeout queue. As the systems sense of time is tieddirectly with the timer interrupt, one can safely use the dozeinstruction without losing time.
By contrast, Echidna’s system clock is updated by aregular timer interrupt every 1/5th of a second. The time inbetween is computed by interpolation using the value of thetimer interrupt counter. When the system is idle, thescheduler polls the system clock continuosly in order todetermine when the first waiting task can be released. Sincethe order of the delays is finer than that of the timerinterrupt, invoking the doze mode may cause tasks in thequeue to miss their deadlines. This prevents us from usingthe doze instruction for Echidna.
. The graphs represent data for the adpcm encodebenchmark from the media bench suite. Utilization ofthe doze mode yields great energy savings. When thesystem is lightly loaded, as in the case of one instanceof the application running at the different rates, the
energy consumed by the system is in the order of1200mJ. This can be contrasted with a fully loadedsystem which has eight adpcm encode tasks runningwithperiods of 80ms eachwhen the systemconsumesroughly three times the energy.
. We also have a break up of the energy consumed bythe kernel in the case of �COS. The overhead of thekernel scales with workload. The bulk of the RTOSoverhead is seen in the timer interrupt. This isbecause every timer tick the RTOS walks through thetask queue and this operation scales linearly with thenumber of tasks in the system. Thus, the timerinterrupt energy is the same across all configurationsfor a given number of tasks, as can be seen for thevarious instances in the graphs a, b, c, d.
4 FUTURE WORK
This paper characterizes the performance of a few sample
applications, running with various realistic RTOSs, on a
low-power embedded processor. Future papers will be
focused on updating, validating, and extending this
research.Because the Motorola Mcore processor is being phased
out, a more modern processor is being modeled—the
Texas Instruments TMS320C6201 digital signal processor.
1466 IEEE TRANSACTIONS ON COMPUTERS, VOL. 52, NO. 11, NOVEMBER 2003
Fig. 7. Energy consumption graphs for FIR. The x-axis represents increasing workloads as a result of increasing the number of executing tasks or.The y-axis represents the total CPU energy consumption and breakdowns for how much energy is consumed by executing kernel code, executinguser application code, handling interrupts, performing semaphore handling, and sitting idle. Note that “idle” includes both time sleeping as well assome loop overhead in the main loop—and parts of the timekeeping code for Echidna. (a) Task period: 8ms. (b) Task period: 4ms. (c) Task period:2ms. (d) Task period: 1ms.

This common DSP appears in several modern products,including devices for wireless communication, broadbandcommunication, audio/video processing, and encryption.Not only is this processor newer, it is also quite different.The processor is a high performance 8-way VLIW 32-bitfixed-point DSP, operating at up to 1,600 MIPS.
The sample applications used in this paper are realistic,however, more widely used benchmarks would allow theresults to be related to existing research more easily.Therefore, standard benchmarks, including the MediaBenchbenchmark suite [25], are being utilized.
Another goal of future research is to propose newhardware components intended to improve the perfor-mance of RTOSs running on embedded microprocessorsand digital signal processors. Such hardware componentsare often found on desktop computer processors, but rarelyin the embedded market. Detailed analyses of the effect ofthese components will be performed on various RTOSs thatfairly represent those used in industry.
This research will significantly contribute to the devel-opment of embedded microprocessors, as well as real-timeoperating systems.
5 CONCLUSION
We have described SimBed, a simulation-based environmentfor evaluating the performance and energy consumption of
embedded real-time operating systems. The simulationenvironment was built to study hardware mechanisms thathelp facilitate low-power real-time processing, as well as toquantify differences between design and implementation inexisting RTOSs. The simulator’s performance measurementis accurate to within 100 cycles per million compared toidentical software executing on reference hardware. Itsenergy measurement is accurate to within 10-15 percent.
We presented a study of preemptive and nonpreemptivereal-time operating systems, focusing on two industrial-strength RTOSs aimed at microcontrollers as well as DSPs.We compared these to a raw scheduler that shouldrepresent the realistic performance and energy-consump-tion limit for nonpreemptive RTOSs since it has none of theoverhead that would be found in a real RTOS, such assupport for semaphores, message-passing, etc. We find thatRTOS overheads for lightweight applications are veryhigh—95 percent or more—but that the overhead di-minishes significantly for more compute-intensive applica-tions (down to 50 percent for Echidna and �C/OS-II,30 percent for the limit). There is also an interesting tradeoff that the more complex RTOSs seem to have taken: Whilethe bare-bones scheduler has the lowest energy consump-tion, that consumption scales with the workload. The morecomplex RTOSs have a higher initial energy consumption,but this consumption does not increase quickly as the user-level computational load grows Therefore, the energy
BAYNES ET AL.: THE PERFORMANCE AND ENERGY CONSUMPTION OF EMBEDDED REAL-TIME OPERATING SYSTEMS 1467
Fig. 8. Energy consumption graphs for ADPCM ENCODE. The x-axis represents increasing workloads as a result of increasing the number of
execting tasks or. The y-axis represents the total CPU energy consumption and breakdowns for how much energy is consumed by executing kernel
code, executing user application code, handling interrupts, performing semaphore handling, and sitting idle for NOS. For uCOS, the kernel
breakdown is further divided. (a) Task period: 80ms. (b) Task period: 160ms. (c) Task period: 320ms. (d) Task period: 640ms.

consumption and CPU requirements of these systems arelikely to be much more predictable than a simpler RTOS.
We also saw that utilization of the idle mode caneffectively lower the energy consumption in the system,but may come at the cost of worse response to polledinterrupts as seen in the case of NOS.
ACKNOWLEDGMENTS
The work of Kathleen Baynes and Christine Smit wassupported in part by the US National Science Foundation’s(NSF) sponsorship of undergraduate research throughgrant NSF-9912218. The work of Chris Collins, BrindaGanesh, Paul Kohout, and Tiebing Zhang was supported inpart by NSF grant EIA-9806645 and NSF grant EIA-0000439.The work of Bruce Jacob was supported in part by NSFCAREER Award CCR-9983618, NSF grant EIA-9806645,NSF grant EIA-0000439, DOD award AFOSR-F496200110374, and by Compaq and IBM. Kathleen Baynes,Chris Collins, Eric Fiterman, Brinda Ganesh, Paul Kohout,Christine Smit, and Tiebing Zhang were students at theUniversity of Maryland while working on the researchpresented in this paper.
REFERENCES
[1] A. Allara, C. Brandolese, W. Fornaciari, F. Salice, and D. Sciuto,“System-Level Performance Estimation Strategy for SW and HW,”Proc. Int’l Conf. Computer Design, Oct. 1998.
[2] M.J. Bach, The Design of the UNIX Operating System. EnglewoodCliffs, N.J.: Prentice Hall, 1986.
[3] S.R. Ball, Embedded Microprocessor Systems: Real World Design.Boston: Newnes, Butterworth–Heinemann, 1996.
[4] K. Baynes, C. Collins, E. Fiterman, B. Ganesh, P. Kohout, C. Smit,T. Zhang, and B. Jacob, “The Performance and Energy Consump-tion of Three Embedded Real-Time Operating Systems,” Proc.Fourth Workshop Compiler and Architecture Support for EmbeddedSystems (CASES ’01), pp. 203-210, Nov. 2001.
[5] K. Baynes, C. Collins, E. Fiterman, C. Smit, T. Zhang, and B. Jacob,“The Performance and Energy Consumption of Embedded Real-Time Operating Systems,” Technical Report UMD-SCA-TR-2000-04, Univ. of Maryland Systems & Computer Architecture Group,Nov. 2000.
[6] L. Benini and G.D. Micheli, “System-Level Power Optimization:Techniques and Tools,” Proc. Int’l Symp. Low Power Electronics andDesign, pp. 288-293, Aug. 1998.
[7] D. Brooks, V. Tiwari, and M. Martonosi, “Wattch: A Frameworkfor Architectural-Level Power Analysis and Optimizations,” Proc.27th Ann. Int’l Symp. Computer Architecture (ISCA ’00), pp. 83-94,June 2000.
[8] C.M. Collins, “An Evaluation of Embedded System BehaviorUsing Full-System Software Emulation,” Master’s thesis, Univ. ofMaryland at College Park, May 2000.
[9] Design & Test Roundtable, “Hardware-Software Codesign,” IEEEDesign and Test of Computers, vol. 14, no. 1, pp. 75-83, Jan.-Mar.1997.
[10] R.P. Dick, G. Lakshminarayana, A. Raghunathan, and N.K. Jha,“Power Analysis of Embedded Operating Systems,” Proc. 37thDesign Automation Conf., pp. 312- 315, June 2000.
[11] C. Ellis, “The Case for Higher-Level Power Management,” Proc.Workshop Hot Topics in Operating Systems, 1999.
[12] Embedded Research Solutions, Embedded Zone—Publications,http://www.embedded-zone.com, 2000.
[13] J. Flinn and M. Satyanarayanan, “Powerscope: A Tool for Profilingthe Energy Usage of Mobile Applications,” Proc. Workshop MobileComputing Systems and Applications, pp. 2-10, Feb. 1999.
[14] R. Fromm, S. Perissakis, N. Cardwell, C. Kozyrakis, B. McGaughy,D. Patterson, T. Anderson, and K. Yelick, “The Energy Efficiencyof IRAM Architectures,” Proc. 24th Ann. Int’l Symp. ComputerArchitecture (ISCA ’97), pp. 327-337, June 1997.
[15] J. Ganssle, “Conspiracy Theory,” The EmbeddedMuse, no. 46, 3 Mar.2000.
[16] J. Ganssle, “Conspiracy Theory, Take 2,” The Embedded Muse,no. 47, 22 Mar. 2000.
[17] J.G. Ganssle, “An OS in a Can,” Embedded Systems Programming,Jan. 1994.
[18] J.G. Ganssle, “The Challenges of Real-Time Programming,”Embedded Systems Programming, vol. 11, no. 7, pp. 20-26, July 1997.
[19] R. Gonzalez and M. Horowitz, “Energy Dissipation in GeneralPurpose Microprocessors,” IEEE J. Solid-State Circuits, vol. 31,no. 9, pp. 1277-1284, Sept. 1996.
[20] J.K.M. Gupta and W. Mangione-Smith, “The Filter Cache: AnEnergy Efficient Memory Structure,” Proc. 30th Ann. Int’l Symp.Microarchitecture (MICRO ’97), pp. 184-193, Dec. 1997.
[21] J. Hennessy and M. Heinrich, “Hardware/Software Codesign ofProcessors: Concepts and Examples,” Hardware/Software Co-De-sign, G. De Micheli and M. Sami, eds., pp. 29-44, KluwerAcademic, 1996.
[22] M. Horowitz, T. Indermaur, and R. Gonzalez, “Low-Power DigitalDesign,” Proc. IEEE Symp. Low Power Electronics, pp. 8-11, Oct.1994.
[23] D. Kalinsky, “A Survey of Task Schedulers,” Proc. EmbeddedSystems Conf., Sept. 1999.
[24] J.J. Labrosse, MicroC/OS-II: The Real-Time Kernel. Lawrence, Kans.:R&D Books (Miller Freeman, Inc.), 1999.
[25] C. Lee, M. Potkonjak, and W. Mangione-Smith, “MediaBench: ATool for Evaluating and Synthesizing Multimedia and Commu-nications Systems,” Proc. 30th Ann. Int’l Symp. Microarchitecture(MICRO ’97), pp. 330-335, Dec. 1997.
[26] Y. Li, M. Potkonjak, and W. Wolf, “Real-Time Operating Systemsfor Embedded Computing,” Proc. Int’l Conf. Computer Design, Oct.1997.
[27] C. Liema, F. Nacabal, C. Valderrama, P. Paulin, and A. Jerraya,“System-on-a-Chip Cosimulation and Compilation,” IEEE Designand Test of Computers, vol. 14, no. 2, pp. 16-25, Apr.-June 1997.
[28] J.W.S. Liu, Real-Time Systems. Upper Saddle River N.J.: PrenticeHall, 2000.
[29] Mcore, M-CORE Reference Manual. Denver, Colo.: MotorolaLiterature Distribution, 1997.
[30] Mcore, M-CORE MMC2001 Reference Manual. Denver, Colo.:Motorola Literature Distribution, 1998.
[31] K. Roy and M.C. Johnson, “Software Design for Low Power,”NATO Advanced Study Inst. on Low Power Design in Deep SubmicronElectronics, Aug. 1996.
[32] J. Russell and M. Jacome, “Software Power Estimation andOptimization for High Performance, 32-Bit Embedded Proces-sors,” Proc. Int’l Conf. Computer Design, Oct. 1998.
[33] J. Scott, L. Lee, A. Chin, J. Arends, and B. Moyer, “Designing theM.CORE M3 CPU Architecture,” Proc. Int’l Conf. Computer Design,Oct. 1999.
[34] SimOS, SimOS: The Complete Machine Simulator, Stanford Univ.,http://simos.stanford.edu/, 1998.
[35] M.J. Smith, Application-Specific Integrated Circuits. Reading Mass.:Addison-Wesley, 1997.
[36] D.B. Stewart, D.E. Schmitz, and P.K. Khosla, “The Chimera IIReal-Time Operating System for Advanced Sensor-Based Appli-cations,” IEEE Trans. Systems, Man, and Cybernetics, vol. 22, no. 6,pp. 1282-1295, Nov./Dec. 1992.
[37] D.B. Stewart, R.A. Volpe, and P.K. Khosla, “Design of Dynami-cally Reconfigurable Real-Time Software Using Port-Based Ob-jects,” IEEE Trans. Software Eng., vol. 23, no. 12, pp. 759-776, Dec.1997.
[38] V. Tiwari and M.T.-C. Lee, “Power Analysis of a 32-bit EmbeddedMicrocontroller,” VLSI Design J., vol. 7, no. 3, 1998.
[39] V. Tiwari, S. Malik, and A. Wolfe, “Power Analysis of EmbeddedSoftware: A First Step towards Software Power Minimization,”IEEE Trans. VLSI Systems, vol. 2, no. 4, pp. 1277-1284, Dec. 1994.
[40] J. Turley, “M.Core Shrinks Code, Power Budgets,” MicroprocessorReport, vol. 11, no. 14, pp. 12-15, Oct. 1997.
[41] J. Turley, “M.Core for the Portable Millenium,” MicroprocessorReport, vol. 12, no. 2, pp. 15-18, Feb. 1998.
[42] A. Vahdat, A. Lebeck, and C. Ellis, “Every Joule Is Precious: TheCase for Revisiting Operating System Design for Energy Effi-ciency,” Proc. SIGOPS European Workshop, Sept. 2000.
[43] N. Vijaykrishnan, M. Kandemir, M. Irwin, H. Kim, and W. Ye,“Energy-Driven Integrated Hardware-Software OptimizationsUsing Simplepower,” Proc. 27th Ann. Int’l Symp. ComputerArchitecture (ISCA ’00), pp. 95-106, June 2000.
1468 IEEE TRANSACTIONS ON COMPUTERS, VOL. 52, NO. 11, NOVEMBER 2003

[44] T. Zhang, “RTOS Performance and Energy Consumption AnalysisBased on an Embedded System Testbed,” Master’s thesis, Univ. ofMaryland at College Park, May 2001.
Kathleen Baynes received the Bachelor ofScience degree in computer engineering fromthe University of Maryland in May of 2001.She is currently doing consulting work invol-ving systems integration at Verizon in Reston,Virginia.
Chris Collins received the BS degree withhonors in electrical engineering from theUniversity of Virginia in 1998 and the MSdegree in electrical engineering from theUniversity of Maryland, College Park in2000. He is currently a senior architecturemodeling engineer at Intel Corporation inHudson, Massachusetts, and is working onthe Intel IXP2800 Network Processor.
Eric Fiterman received the BS degree incomputer science from the University of Mary-land, College Park in 2000, and the BS degree inelectrical engineering from the University ofMaryland, College Park in 2000. He has workedas an embedded software engineer and proto-cols engineer for Ericsson IP Infrastructure,developing unicast routing and tunnel protocols.He presently works for Salar, Inc., a successfulstartup company, developing enterprise data-
base applications and wireless/mobile software for the healthcareindustry. He is a member of the IEEE.
Brinda Ganesh received the BE degree inelectronics and communication from the Karna-taka Regional Engineering College, Suratkal,India, in 1999 and the MS degree in computerengineering from the University of Maryland,College Park in 2002. She is currently pursuingthe PhD degree in the Department of Electricaland Computer Engineering at the University ofMaryland, College Park. Her research interestsinclude hardware and software for embeddedand real-time systems.
Paul Kohout received the BS and MS degree inelectrical engineering from the University ofMaryland in 2000 and 2002, respectively. Whileat Maryland, he studied computer architectureand embedded systems and he wrote his thesison hardware support for real-time operatingsystems. He recently started working as anelectrical engineer for EVI Technology in Co-lumbia, Maryland. EVI specializes in designingand manufacturing digital and RF devices for the
government. At EVI, Paul is responsible for designing embeddedhardware and software. He is a member of the IEEE and the IEEEComputer Society.
Christine Smit is a senior computer engineeringand vocal performance double major at theUniversity of Maryland, College Park. She hasdone research internships at the University ofCincinnati and NASA Goddard in addition to theUniversity of Maryland. She plans to attendgraduate school in electrical engineering onceshe has finished her undergraduate degrees.She is a student member of the IEEE.
Tiebing Zhang received the MS degree inelectrical engineering from the University ofMaryland, College Park in 2001, the MS degreein automation from Tsinghua University, Peo-ple’s Republic of China in 1999, and the BSdegree in automation from China Textile Uni-versity (now East China University), People’sRepublic of China, in 1996. He is currentlyworking as a senior software engineer at 3eTechnologies Inc. His interests include em-
bedded Linux, RTOSs, and security of wireless communications.
Bruce Jacob received the AB degree cum laudein mathematics from Harvard University in 1988and the MS and PhD degrees in computerscience and engineering from the University ofMichigan, Ann Arbor, in 1995 and 1997, respec-tively. At the University of Michigan, he was partof a design team building high-performance,high-clock-rate microprocessors. He has alsoworked as a software engineer for two success-ful startup companies: Boston Technology and
Priority Call Management. At Boston Technology, he worked as adistributed systems developer and, at Priority Call Management, he wasthe initial system architect and chief engineer. He is currently on thefaculty of the University of Maryland, College Park, where he is anassociate professor of electrical and computer engineering. His presentresearch covers memory-system design, DRAM architectures, virtualmemory systems, and microarchitectural support for real-time em-bedded systems. He is a recipient of a US National Science FoundationCAREER award for his work on DRAM architectures and systems. He isa member of the IEEE, the IEEE Computer Society, and the ACM.
. For more information on this or any computing topic, please visitour Digital Library at http://computer.org/publications/dlib.
BAYNES ET AL.: THE PERFORMANCE AND ENERGY CONSUMPTION OF EMBEDDED REAL-TIME OPERATING SYSTEMS 1469


![Fuel consumption improvement of vehicle with cvt …performance curves of vehicle engine. Fuel consumption is calculated using specific fuel consumption (SFC [g/(PS*h)]) which is expressed](https://img.pdfslide.us/doc/110x75/5e7f06b7ce1b45666d12bbe3/fuel-consumption-improvement-of-vehicle-with-cvt-performance-curves-of-vehicle-engine.jpg)