Embed Size (px)
Citation preview

THE PENNSYVANIA STATE UNIVERSITY SCHREYER HONORS COLLEGE
DEPARTMENT OF FOOD SCIENCE
COCOA BUTTER & STARCH INCLUSION COMPLEXES
KATHERINE J. GAWEL
Spring 2010
A thesis submitted in partial fulfillment
of the requirements for a baccalaureate degree
in Chemical Engineering with honors in Food Science
Reviewed and approved* by the following:
Gregory Ziegler Professor of Food Science
Thesis Supervisor & Honors Advisor
Donald Thompson Professor of Food Science
Faculty Reader
*Signatures on File in the Schreyer Honors College.

i
Abstract
The effectiveness of reducing the free fatty acid level of cocoa butter through the formation of
starch inclusion complexes was evaluated in this study. The selectivity of the formation of starch
inclusion complexes with the lipids in cocoa butter was also studied. Two groups of experiments were
conducted in this experiment. In the first set of experiments, 5% high amylose starch solution was
reacted with cocoa butter at 90°C for 30 minutes. The amount of 5% starch solution varied as a multiple
of the weight of the free fatty acids in the cocoa butter throughout the experiments. The free fatty acid
content of these reacted cocoa butter samples was tested and the starch underwent x-ray
crystallography. The results showed that while starch inclusion complexes were formed, the free fatty
acid content of the cocoa butter was not decreased. In the second experiment, a single cocoa butter
sample was reacted with three 5% starch solutions at 90°C for 30 minutes. After each reaction a sample
of cocoa butter was taken and analyzed using thin layer chromatography. A free fatty acid analysis was
performed on the final cocoa butter sample. The starch from the reaction underwent x-ray
crystallography, thin layer chromatography, 1H NMR spectroscopy, and FTIR spectroscopy. The results
showed that while starch inclusion molecules were preferentially formed with free fatty acids, the cocoa
butter free fatty acid content was not reduced. It was determined that hydrolysis of lipids due to the
temperature and presence of water caused the formation of additional free fatty acids during the
reaction. This resulted in no significant change in free fatty acids despite the preferential inclusion of
free fatty acids in the starch inclusion complexes.

ii
Table of Contents Chapter 1 - Introduction 1 1.1 Problem Statement 1 1.2 Hypotheses 1 1.3 Objectives 1 Chapter 2 – Review of Literature 3 2.1 The Cacao Bean History 3 2.2 Modern Cacao Beans 3 2.3 Definitions 4 2.3.1 Cocoa Butter 4 2.3.2 Free Fatty Acids 4 2.3.3 Monoglycerides, Diglycerides, and Triglycerides 4 2.4 Composition 5 2.4.1 Composition of Cacao Bean 5 2.4.2 Composition of Cocoa Butter 6 2.5 Cacao Bean Processing 6 2.5.1 Fermentation and Drying 7 2.5.2 Roasting, Winnowing, and Alkalizing 7 2.5.3 Grinding and Pressing of Cacao Beans 8 2.5.4 Deodorization and Other Refining Processes 8 2.6 Free Fatty Acids in Cocoa Butter 9 2.7 Starch Inclusion Complexes 9 Chapter 3 – Reducing Free Fatty Acids by Forming Starch Inclusion Complexes 11 3.1 Materials and Methods 11 3.1.1 Cocoa Butter Sample Selection` 11 3.1.2 Preparation of Starch Solution 11 3.1.3 Reaction of Cocoa Butter and Starch Solution 12 3.1.4 Free Fatty Acid Analysis 13 3.1.5 X-Ray Crystallography 14 3.2 Results 14 3.3 Discussion 17 Chapter 4 – Analysis of Starch Inclusion Complexes 18 4.1 Materials and Methods 18 4.1.1 Sample Preparation 18

iii
4.1.2 TLC 18 4.1.3 FTIR 20 4.1.4 1 H NMR 20 4.1.5 X-Ray Crystallography 21 4.1.6 Free Fatty Acid Analysis 21 4.2 Results 22 4.3 Discussion 28 Chapter 5 – Conclusions and Future Research 30 5.1 Conclusions 30 5.2 Future Research 30 Chapter 6 – References 32

iv
List of Figures
Figure Page 1 Monoglyceride 4 2 Diglyceride 5 3 Trigylceride 5 4 Starch Inclusion Molecule Diagram 10 5 Starch Inclusion Molecule with Fatty Acid 10 6 TLC Plate Set-up 19 7 Schematic TLC Separation of Lipid Fraction on Silica Gel G 22 8 TLC of Cocoa Butter Standard and Samples #1, #2, and #3 23 9 TLC of DMSo and Samples 7-1-1, 7-2-1, 7-3-1 in DMSO 23
List of Graphs
Graph Page 1 Sample 1 X-ray Crystallography 15 2 Sample 2 X-ray Crystallography 16 3 Sample 3-1 X-ray Crystallography 16 4 Sample 4-1 X-ray Crystallography 16 5 Sample 5-1 X-ray Crystallography 17 6 Sample 7-1-1 FTIR Absorbance v. Wavenumber 24 7 Sample 7-2-1 FTIR Absorbance v. Wavenumber 24 8 Sample 7-3-1 FTIR Absorbance v. Wavenumber 25 9 Sample 7-3-1 1H NMR at 60°C 26 10 Sample 7-1-1 X-Ray Crystallography 27 11 Sample 7-2-1 X-Ray Crystallography 27 12 Sample 7-3-1 X-Ray Crystallography 28
List of Tables
Table Page 1 Composition of Dried Fermented Cacao Beans 6 2 Composition of Cocoa Butter 6 3 Blommer Chocolate Company Cocoa Butter Samples 11 4 Starch Solution Experimental Data 12 5 Free Fatty Acid Percentage using AOAC Offical Method 940.28 14 6 Results of Cocoa Butter-Starch Reaction 15 7 Starch Inclusion Complex 1H NMR Alkane Peak Integral 25

1
CHAPTER 1 – Introduction
1.1 Problem Statement
Cocoa butter quality is highly dependent on the quality of the beans and early stages of processing.
Therefore, cocoa processors must depend on the local farmers in cacao growing countries to follow
processing procedures in order to ensure high quality final products. If proper methods are not used,
the beans may develop unpleasant flavors or increased concentration of free fatty acids due to moldy or
broken beans.
Due to political instability, depressed cocoa prices, and poor infrastructure in many major cacao
producing countries, such as the Ivory Coast, the quality of cacao beans has become very unpredictable.
Approximately 17% of the beans exported from the Ivory Coast are considered inferior, spurring funding
for programs to help improve cacao bean quality.1 Until these programs begin to work, however,
processing companies must find ways to process poor quality beans to remove undesirable attributes.
This includes removal of free fatty acids which can affect end product quality.
1.2 Hypotheses
Undesired free fatty acids can be removed from cocoa butter by reacting cocoa butter with starch
capable of forming inclusion complexes. This will result in two desired products: cocoa butter with
correct FFA concentration and starch inclusion complexes. Alternatively, if free fatty acid content is not
reduced, starch inclusion complexes may preferentially be formed from monogylcerides and
digylcerides.
1.3 Objectives
- To determine which compounds among phospholipids, monoacylglycerols, diacylglycerols and
free fatty acids found in pressed cocoa butter preferentially form starch-lipid inclusion
complexes

2
- To deacidify cocoa butter through the formation of fatty acid-starch inclusion complexes
- To degum cocoa butter in a more environmentally friendly way through the formation of fatty
acid-starch inclusion complexes instead of using caustic chemicals

3
CHAPTER 2 – Review of Literature
2.1 The Cacao Bean History
Theobroma cacao is native to the Americas, specifically the valleys of the Amazon and Orinoco
rivers where high ambient temperatures exist. The cacao tree has been cultivated for more than 3,000
years. While Columbus was the first European to come into contact with the cocoa bean, it was Cortez
who found that the Aztecs used the beans as a form of currency and for a beverage drunk at court and
religious ceremonies. At the time cocoa beans were consumed in a drink called chocolatl which is where
the term chocolate originates. The cocoa bean first spread to Spain who then promoted the cultivation
of the cacao tree in all of its territories. Despite the tree’s susceptibility to disease, the tree has been
planted throughout much of the Caribbean and other continents between 10°North and South of the
Equator. Cocoa remained a Spanish secret for almost 140 years after it was first brought back by Cortez.
After which it spread to Italy and then to Austria, France and northern Europe. The Dutch began to
encourage and eventually dominate the trade of cocoa beans. Theobroma cacao or the Food of the gods
became extremely popular in Europe by the end of the 17th century. 2
2.2 Modern Cacao Beans
Today the top producers of cocoa are the Ivory Coast, Brazil, Malaysia, Ghana, Indonesia,
Nigeria, Cameroon, Ecuador, Colombia, Dominican Republic and Mexico. The climate between the
Tropics of Cancer and Capricorn is the most suitable to the cacao tree. The fruit of the cacao tree grows
directly on the trunk and large branches of the tree and takes approximately 6 months to grow from a
fertilized flower. While many flowers may be on the cacao tree only a few produce fruit or pods. Each
pod contains approximately 40 cocoa beans each weighing approximately 1g. 2
While there are two major types of cocoa bean, Criollo and Forastero, Forastero due to its
hardiness makes up a majority of the world’s crop. Criollo, however, is known for its flavor

4
characteristics, is lighter in color, and milder in flavor than the Forastero, which is slightly bitter and has
a higher fat content. 2
2.3 Definitions
2.3.1 Cocoa Butter
Cocoa butter or theobroma oil is defined by the Encyclopedia Britannica as “a pale-yellow,
edible vegetable fat obtained from cocoa beans, having a mild chocolate flavor and aroma, and used in
the manufacture of chocolate confections, pharmaceutical ointments, and toiletries.”3 The U.S. Food
and Drug Administration defines cocoa butter as “the edible fat obtained from sound cocoa beans
before or after roasting”.4 According to Harold McGee, author of “On Food and Cooking: the Science
and Lore of the Kitchen”, cocoa butter contains a majority of the cocoa fat molecules from the cocoa
bean and is able to solidify into six different kinds of fat crystal patterns. 5
2.3.2 Free Fatty Acids
Free fatty acids are fatty acids which have been released from mono-, di-, or triglcyerides.6 In
cocoa butter free fatty acids are usually oleic, palmitic, or stearic acid.7
2.3.3 Monoglycerides, Diglycerides, and Triglycerides
A monoglyceride or monoacylglycerol is made up of a glycerol molecule and one fatty acid.8
Figure 1: Monoglyceride *Source: Indiana University8
Diglycerides or diacylglycerols are made up of a glycerol molecule and two fatty acids.8

5
Figure 2: Diglceride *Source: Indiana University8
Triglycerides are made up of a glycerol molecule with three fatty acids. Triglycerides are how fat is
stored. 8
Figure 3: Triglyceride *Source: Indiana Universitya
In cocoa butter, the fatty acids which make up mono-, di-, and triglycerides are oleic acid, palmitic acid,
and stearic acid.7
2.4 Composition
2.4.1 Composition of Cacao Bean
The cacao bean is composed of two basic parts, the nib and the shell. Table 1 shows the
composition of dried and fermented cacao beans.5
6
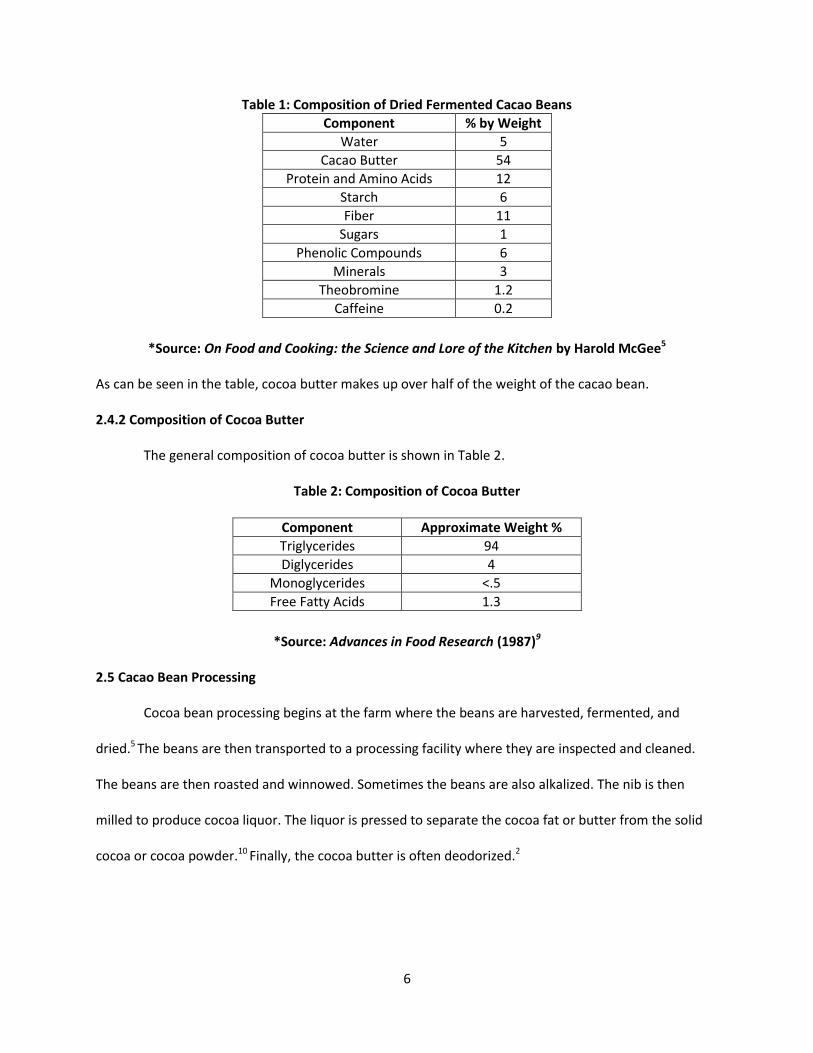
Table 1: Composition of Dried Fermented Cacao Beans
Component % by Weight
Water 5
Cacao Butter 54
Protein and Amino Acids 12
Starch 6
Fiber 11
Sugars 1
Phenolic Compounds 6
Minerals 3
Theobromine 1.2
Caffeine 0.2
*Source: On Food and Cooking: the Science and Lore of the Kitchen by Harold McGee5
As can be seen in the table, cocoa butter makes up over half of the weight of the cacao bean.
2.4.2 Composition of Cocoa Butter
The general composition of cocoa butter is shown in Table 2.
Table 2: Composition of Cocoa Butter
Component Approximate Weight %
Triglycerides 94
Diglycerides 4
Monoglycerides <.5
Free Fatty Acids 1.3
*Source: Advances in Food Research (1987)9
2.5 Cacao Bean Processing
Cocoa bean processing begins at the farm where the beans are harvested, fermented, and
dried.5 The beans are then transported to a processing facility where they are inspected and cleaned.
The beans are then roasted and winnowed. Sometimes the beans are also alkalized. The nib is then
milled to produce cocoa liquor. The liquor is pressed to separate the cocoa fat or butter from the solid
cocoa or cocoa powder.10 Finally, the cocoa butter is often deodorized.2

7
2.5.1 Fermentation and Drying
After the cacao pods are harvested they are broken open and the contents put into a pile. The
cacao pod is composed of an outer shell, pulp, and the cacao beans. Due to the tropical temperatures
and high sugar content of the pulp, microbes begin growing in the pile, fermenting the pulp. While the
beans themselves are not fermented, the fermentation of the pulp does affect the beans. The process
allows the cell walls within the cocoa bean to begin to break down. This allows the contents of each cell
to mix and react with each other. An important effect of this process is the mixing of the digestive
enzymes of the beans with the storage proteins and sugars. The enzymes can break down the storage
molecules into their building blocks, amino acids and simple sugars, which can form aromatic molecules
during the roasting process. The beans also pick up some of the flavor complexes from the pulp.
Fermentation lasts 2-8 days. The beans are then dried by spreading them out in the sun. This
process also takes several days. Care must be taken in this process to make sure that beans dry
completely so that undesirable molds and bacteria do not grow on or within the beans. These molds and
bacteria can cause unwanted flavors to form. Lipase from molds and bacteria may hydrolyze the cocoa
butter producing mono- and diacylglycerols and free fatty acids, which are detrimental to cocoa quality.
In order to be resistant to these molds and bacteria, the moisture content must be below 7%. After they
are dry the beans are cleaned, packaged, and shipped to processing facilities.5
2.5.2 Roasting, Winnowing, and Alkalizing
Cacao beans are roasted to develop their flavor and to reduce microbial levels. Prior to roasting
the flavors can be unbalanced, underdeveloped, and dominated by acetic acid. Beans can be roasted
whole or the nibs alone can be roasted whole or ground. The time and temperature depends on which
of these three options is roasted. The roasting of cacao beans is much gentler than that of coffee beans
to protect the amino acids and simple sugars which were made during fermenting. These molecules can

8
participate in the Maillard browning reaction which produces flavor. Gentle roasting also preserves
some of the natural flavors as well as those formed during fermentation.2
Winnowing is the process of removing the shell from the nib.10 After the nib and shell have been
separated, the nib undergoes further processing. In some cases the nib is alkalized. Alkalization is a
process developed by the Dutch which modifies flavor and color. In this process, the nib is treated with
an alkali solution, usually potassium carbonate, at a given temperature and pressure for a set amount of
time. This affects both the flavor and color and allows a wider variety of cocoa powders to be produced.2
Free fatty acids, if present during alkalization, may become soaps.
2.5.3 Grinding and Pressing of Cacao Beans
The nibs are then ground into a thick, dark fluid known as cocoa liquor. This process allows the
cocoa butter to be released from the cells of the cacao bean. After the cocoa liquor is ground to the
correct particle size, the cocoa liquor can be separated into cocoa powder and butter. The cocoa liquor
is passed through a fine filter which allows the butter to move through, leaving a cake of cocoa particles
which is used to make cocoa powder. This process is called pressing.5
2.5.4 Deodorization and Other Refining Processes
Some cocoa butter is deodorized. This removes some of the flavor complexes of the cocoa
butter. This bland cocoa butter is often used for milk chocolate because it allows manufacturers to
achieve flavor consistency. Deodorization is achieved using vacuum steam distillation. Unlike in the
deodorization of other fats, only this steam deodorization step is used for cocoa butter. Deodorization
removes small amounts of esters, aromatics, pyrazines, pyrroles, carbonyls, aldehydes, and ketones. It
can also reduce amounts of free fatty acids from 0.5 to 0.1%. While free fatty acids do not typically
affect flavor their removal is proportional to that of undesirable flavors. Deodorization can be a batch,
semi-batch, or continuous process.11

9
Other refining processes used in addition to deodorization are bleaching, degumming, caustic
neutralization, fractionation, hydrogenation, and interesterfication. These processes reduce the amount
of free fatty acids and remove polar components such as glycolipids, phosphatides, proteinaceous, and
mucilaginous substances. 12 The degumming process can remove phosphatides, waxes, free fatty acids,
and other impurities by mixing cocoa butter with water, salt solution, dilute acids, or alkalis.13
2.6 Free Fatty Acids in Cocoa Butter
Free fatty acids are carboxylic acids. They are released from triglycerides through either lipase or
oxidation. Therefore, for each free fatty acid molecule there will be monoglycerides or diglycerides
created also. Free fatty acids are naturally present in small amounts in cocoa butter. High free fatty acid
content could be the result of rotten pods, germinated beans, and some molds. It affects the hardness
of cocoa butter and reduces the value of the cocoa butter. High free fatty acid contents also make
processing more difficult because it can cause gumming in machines like deodorizers. The directive
73/241/EEC was created in order to set a maximum limit of free fatty acid content to 1.75% oleic acid
equivalent.14 Some free fatty acids can be removed by deodorization and degumming but in cocoa
butter with a high free fatty acid content other processing techniques are needed to reduce free fatty
acids.
2.7 Starch Inclusion Complexes
Starch is made up of two components: amylopectin and amylose. Amylopectin is a highly
branched polymer of glucose and amylose is a linear polymer of glucose. While amylopectin can only
form weak complexes with other molecules such as alcohols and lipids, amylose can form stable
complexes.15 Starch alone can be in any one of three polymorphs: A-, B-, and V-forms. A- and B- forms
are made up of double helixes which are packed in parallel. B-forms have high levels of water in
between the helixes while A-forms have low levels of water. V-form amylose is formed by a single
amylose chain which forms a helix with a cavity. The V-form is the only form of amylose which can form

10
complex inclusion molecules.16 Starch inclusion complexes can be formed with molecules such as free
fatty acids which have hydrophilic and hydrophobic parts. When these inclusion complexes are formed
the hydrophobic part of the inclusion molecule is encapsulated in the starch’s hydrophobic core leaving
the hydrophilic end outside.
Figure 4: Starch Inclusion Molecule Diagram *Source: Ursula Vanesa Lay Ma17
Figure 5: Starch Inclusion Molecule with Fatty Acid *Source: Ursula Vanesa Lay Ma17
Starch inclusion complexes formed between amylose and monoglycerides, fatty acids, or linear alcohols
are in the shape of a helix and have six glucose molecules per turn, known as the V-form.18
Starch inclusion complexes can be used to aid in the delivery of nutrients into the body. The
outer starch layer protects molecules that would normally be broken down in the stomach and allows
them to travel to the small intestine where they can be absorbed. Starch inclusion complexes can also
be used to encapsulate flavor molecules to allow for a longer lasting flavor in products such as chewing
gum.17 Inclusion complexes with monoglycerides and fatty acids can also be used for anti-staling agents
in bread and biscuits.15

11
CHAPTER 3 – Reducing Free Fatty Acids by forming Starch Inclusion Complexes
3.1 Materials and Methods
3.1.1 Cocoa Butter Sample Selection
Table 3 shows the four cocoa butter samples provided by the Blommer Chocolate Company.
The free fatty acid content of each sample was found using AOAC Official Method 940.28 which is a
titration method for crude oils used to determine the percent free fatty acids expressed as oleic acid. In
this method neutralized ethanol was made by adding 1% phenolphthalein solution (Fisher Scientific, Lot
#910282-24) to ethanol (Pharmco-Apper) in a 50 to 2 volume ratio and then titrating with 0.1M NaOH
(.98289g Electrolytic NaOH Pellets (Fisher Scientific) dissolved in 243.2mL distilled water) until a
permanent faint pink was seen. Approximately 7.05 g of the cocoa butter sample was then weighed and
added to 50mL of the neutralized ethanol solution. This solution was then titrated until a faint pink
lasted more than one minute with 0.25M NaOH (4.97156g Electrolytic NaOH Pellets (Fisher Scientific)
dissolved in 497mL distilled water). The volume of 0.25M NaOH needed to titrate the sample is equal to
the % free fatty acids in the cocoa butter sample.
Table 3: Blommer Chocolate Company Cocoa Butter Samples
Sample Number Description Provided FFA %
1 Cocoa Butter Low FFA Lot# B38
10/29/08 0.21
2 Raw Alkalized Cocoa Butter
10/23/08 3.62
3 Deodorized Alkalized Cocoa
Butter 10/23/08 1.14
4 Standard Cocoa Butter B16
10/20/08 2.4
3.1.2 Preparation of Starch Solution
A starch solution was created using distilled water and a high amylose starch, Gelose 80 ( Lot L6
182 10, Prepared: November 27, 2007). The amount of starch in each solution was dependent on a

12
multiple of the weight of free fatty acids in 10g sample #4 of cocoa butter. The multiples were 5x, 7x,
10x, 15x, and 20x the weight of free fatty acids present. A sixth sample was prepared at 15x the weight
of free fatty acid. Distilled water was then added to the starch in order to create a final solution of 5%
starch. The starch solution was heated in a 50mL Parr Pressure Reactor (Model 4592) to 140°C and held
there for 30 minutes until being cooled to 90°C. In samples with larger amounts of starch only part of
the distilled water was added before heating due to reactor size contraints. The water not added was
heated to 90°C and added to the heated starch solution. Table 4 shows the six starch solutions that were
created for this experiment.
Table 4: Starch Solution Experimental Data
Reaction Starch Weight (g) Water Added to
Reactor (mL) Water Added after
Reactor (mL)
1 1.6268 32 0
2 2.1370 43 0
3 3.0503 31 30
4 4.5759 30 62
5 6.1265 40 82
6 4.5755 41 50
3.1.3 Reaction of Cocoa Butter and Starch Solution
For each reaction, approximately 10g of cocoa butter sample #4 at 40°C was weighed using a
OHAUS Galaxy 200 scale into a 250mL flask. The starch solution held at 90°C was then added to the flask
with the cocoa butter (40°C). A magnetic stir bar was placed into the flask and it was capped with a flask
stopper. The flask was then placed into a water bath heated to a rolling boil using a Corning
Stirrer/Hotplate. The stirrer was set to high and the sample reacted for 30 minutes. In cases when the
stir bar did not create an emulsion the flask was shaken by hand every 5 minutes to ensure mixing. After
thirty minutes the sample was removed from the water bath and poured into labeled centrifuge tubes.
The sample was then centrifuged at 3500rpm for 10 minutes using an Allegra 6 Centrifuge. After
centrifugation, the cocoa butter layer was poured off into a pre-weighed 125mL flask. Ethanol (5mL)

13
was then added to the remaining starch and the samples were allowed to sit overnight. The samples
were then centrifuged at 3500rpm for 10 minutes and the resulting liquid fraction was poured off. The
samples were washed with ethanol (20mL) and centrifuged at 3500rpm for 10 minutes. The resulting
liquid fraction was poured off. This process was repeated two more times. The starch was then put onto
Petri dishes and allowed to dry in the incubator (40°C) overnight.
In the sixth run of this experiment, an alteration to the above procedure was made. In order to
ensure that the sample was well mixed, it was mixed in a blender for 5 minutes (starting at 90°C). The
sample was then poured back into the 250mL flask to be reacted following the procedure above.
3.1.4 Free Fatty Acid Analysis
Percentage of free fatty acid in the reacted cocoa butter was determined using the AOAC
Official Method 940.28 and correcting the value obtained to reflect the cocoa butter sample weight. This
method uses titration to determine the percentage free fatty acids expressed as oleic acid. The cocoa
butter sample is weighed and mixed with 50 mL neutralized ethanol. The ethanol (Pharmco-Apper) is
neutralized by adding 1% phenolphthalein solution (Fisher Scientific) and enough 0.1M NaOH to
produce a permanent faint pink. The cocoa butter/ethanol solution is then titrated with 0.25M NaOH
until a faint permanent pink is produced for 1 minute or longer. A 10mL burette was used for all
titrations. In order to account for changes in sodium hydroxide solutions and neutralized ethanol,
unreacted sample 4 cocoa butter sample’s free fatty acid content was analyzed at the same time as each
sample. The free fatty acid weight was found by multiplying the volume in liters of 0.25M NaOH needed
to produce a faint pink by the moles of NaOH in solution (0.25) and the molecular weight of oleic acid
(282.4514g). The weight of free fatty acid was then divided by the weight of the cocoa butter sample
taken before the analysis to give the free fatty acid percentage.
14
3.1.5 X-Ray Crystallography
Samples were first placed in desiccator above a saturated KCl solution (aw=0.85) to become
partially rehydrated overnight. This step ensured that the peaks seen in x-ray crystallography were from
inclusion complexes and not ethanol residue remaining from the washing process. The sample was then
ground into a fine powder using a mortar and pestle. The powder was pressed into a 10 mm disk using
an Econo-press die (Spectra Tech Econo-press kit, Thermo Scientific). The disk was removed from the
die, placed onto a microscope slide, and analyzed using a MiniFlex II Desktop X-ray Diffractometer.
Counter control axis was set to HV (646V). The measurement method was continuous starting at 4.0
degrees and stopping at 30.0 degrees with a counting unit of counts and a sampling width of 0.020
degrees and a speed of 1.0 degree/minute.
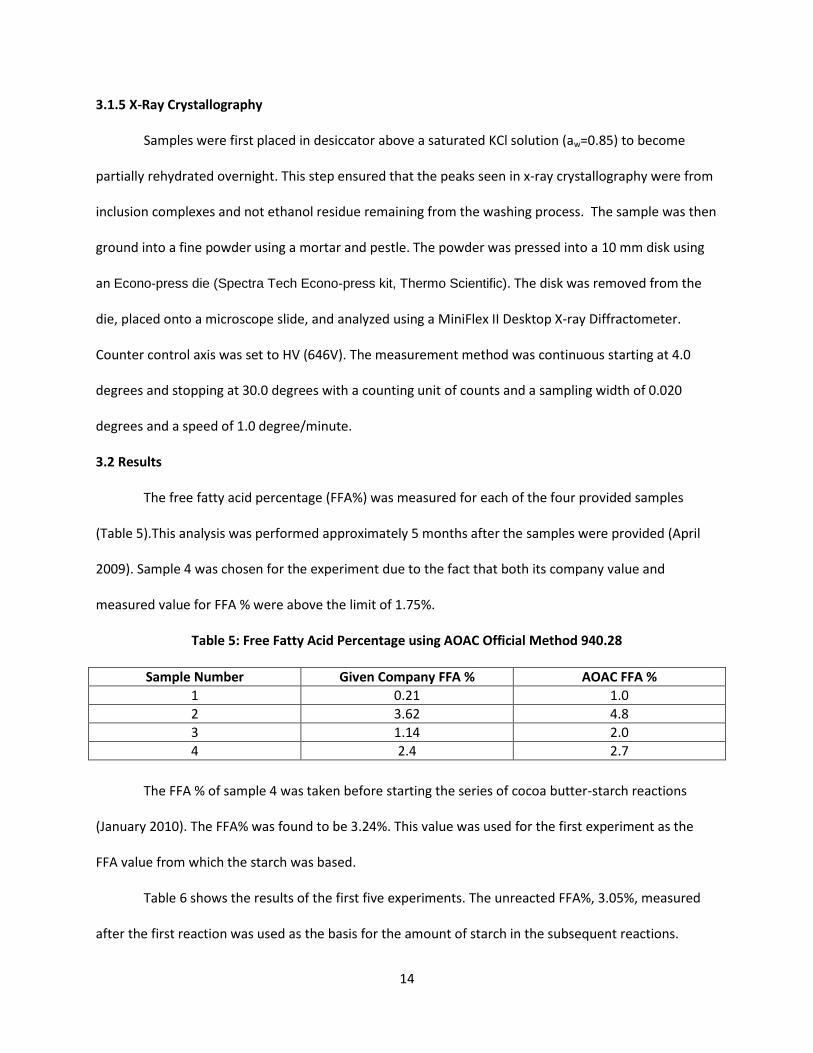
3.2 Results
The free fatty acid percentage (FFA%) was measured for each of the four provided samples
(Table 5).This analysis was performed approximately 5 months after the samples were provided (April
2009). Sample 4 was chosen for the experiment due to the fact that both its company value and
measured value for FFA % were above the limit of 1.75%.
Table 5: Free Fatty Acid Percentage using AOAC Official Method 940.28
Sample Number Given Company FFA % AOAC FFA %
1 0.21 1.0
2 3.62 4.8
3 1.14 2.0
4 2.4 2.7
The FFA % of sample 4 was taken before starting the series of cocoa butter-starch reactions
(January 2010). The FFA% was found to be 3.24%. This value was used for the first experiment as the
FFA value from which the starch was based.
Table 6 shows the results of the first five experiments. The unreacted FFA%, 3.05%, measured
after the first reaction was used as the basis for the amount of starch in the subsequent reactions.

15
Table 6: Results of Cocoa Butter-Starch Reactions
Reaction Cocoa Butter
weight (g) Starch Multiple Unreacted FFA% Reacted FFA%
1 10.3529 5 3.05 3.06
2 9.8832 7 3.09 3.06
3 9.8159 10 3.05 3.06
4 10.0269 15 3.05 3.18
5 10.2581 20 3.05 3.58
As the table shows, the samples’ FFA% was not reduced by reaction with the starch.
The X-ray crystallography was performed on each of the samples. Some samples required more
than one centrifuge tube which resulted in having multiple samples for one run (i. e. sample 3-1 and 3-
2). Starch inclusion molecules which are in the V-form are represented by peaks at approximately 7, 14,
and 20 degrees 2θ. V-form peaks are also formed by crystalline free fatty acids which are not in inclusion
complexes. Starch in the B-form that did not form complexes is represented by peaks at 17, 22, and 24
degrees 2θ. X-ray crystallography was performed on all samples (graphs 1-5). Graphs 1, 2, and 3 show
all of the V-form peaks. Graphs 4 and 5 show B-form amylose peaks in addition to the three V-form
peaks. The sharp V-form peaks in these samples may indicate crystalline free fatty acids which were not
thoroughly washed during the ethanol rinse.
Graph 1: Sample 1 X-ray Crystallography

16
Graph 2: Sample 2 X-ray Crystallography
Graph 3: Sample 3-1 X-ray Crystallography
Graph 4: Sample 4-1 X-ray Crystallography

17
Graph 5: Sample 5-1 X-ray Crystallography
A sixth reaction was performed with improved mixing. In this reaction, 11.1279g of cocoa butter
(sample 4) was reacted with a 5% solution of starch with a 15x starch multiple. The FFA% for the reacted
cocoa butter was 3.30% while the unreacted FFA% was 2.92%.
3.3 Discussion
The free fatty acid percentage in cocoa butter sample 4 was not reduced by reacting with starch.
The results show that at higher starch multiples, the free fatty acid may have percentage increased, but
the experiment would need to be repeated to see if this increase was statistically significant. Starch
inclusion complexes, however, were formed. It is unclear, however, which lipid molecules formed these
inclusion complexes. As can be seen in the X-ray crystallography graphs, starch inclusion complexes
were formed in the first five samples. Samples 4 and 5, however, also had uncomplexed starch peaks.
This is due to an excess of starch. B-form crystals were formed due to the excess of starch present
during the reaction. The increase in free fatty acid in higher starch multiple samples may also be due to
the increased amount of water. This is because at high temperatures and in the presence of moisture
triglycerides can hydrolyze. In hydrolysis, triglycerides to react with water and form more free fatty
acids.19

18
CHAPTER 4 – Analysis of Starch Inclusion Complexes
4.1 Materials and Methods
4.1.1 Sample Preparation
A 5% starch solution was heated in a 50mL Parr Pressure Reactor (Model 4592) to 140°C and
held there for 30 minutes until being cooled 90°C. The 5% starch solution was prepared by with a starch
multiple of 10x and reacted with 20 g of cocoa butter sample 4 for 30 minutes in a hot water bath to
maintain a temperature of 90°C. The solution was then centrifuged for 20 minutes at 3500rpm using an
Allegra 6 Centrifuge. The cocoa butter fraction (sample 1) was poured off. A small portion of this sample
was weighed and set aside for further testing. The remaining sample was poured into a 250mL flask and
weighed. Ethanol was added to the remaining starch solution and allowed to sit overnight.
Using the remaining cocoa butter a second 10x multiple 5% starch solution was prepared. The
cocoa butter and starch were reacted in the same matter as the first reaction resulting in cocoa butter
sample 2. This process was repeated a third time and resulted in cocoa butter (sample 3) which had
been reacted with three different starch solutions. The cocoa butter samples taken at each step were
kept for further testing. The starch samples were washed with ethanol and centrifuged twice before
allowing them to dry in the incubator.
4.1.2 TLC
Two different thin layer chromatography (TLC) analyses were performed. The first was on the
three cocoa butter samples. Each of the three cocoa butter samples was prepared by mixing 200μL of
the sample with 200μL of hexanes (OMNISOLV, HX0296-1). The second TLC was on the three starch
samples 7-1-1, 7-2-1, and 7-3-1. To prepare these samples approximately 50mg of each sample was
dissolved in 1mL of DMSO (Spectrum, D1258). Both of the TLCs used followed the procedure from Food
Analysis by S. Suzanne Nielson and used the same adsorbent and solvent.20 A silica gel plate (Whatman,
HPK Silica Gel 60 A, 10cm x 10cm, width 200μm) was used as the adsorbent. The eluting solvent system

19
was 25.5mL hexanes (OmniSolv, HX0296-1)-diethyl ether (JT Baker, 0244-03)-formic acid (SIgmaAldrich,
15402DH) (80:20:2, by vol/vol/vol). The plates were marked with a pencil to show the origin, desired
solvent front, and denote the different samples according to figure 6.
Figure 6: TLC Plate Set-up
After the plates were set up, the samples were spotted in their respective locations with a
capillary tube. The spot was allowed to dry and then the process was repeated. The solvent was poured
into a TLC tank which was then covered and allowed to sit for 5 minutes to equilibrate. Each plate was
then carefully placed into the tank to ensure that the solvent was below the origin and samples. The
tank was recovered and the solvent was allowed to elute up the plate to the solvent front.
Once the solvent front was reached, each plate was removed from the tank and placed into an I2
(solid I2, Sigma, I0358) desiccator. After 10 minutes, the sample was visible, but the sample was allowed
to sit for 40 minutes before documenting the spotting.
4.1.3 FTIR

20
Fourier transform infrared (FTIR) spectroscopy was performed on all of the starch samples. A
blank of pure KBr (Spectra-Tech Inc., 718 B983432) which had been stored in a desiccator was made by
placing approximately 100mg of KBr (Spectra-Tech Inc., 718 B983432) into the Econo-press die (Spectra
Tech Econo-press kit, Thermo Scientific) and tightening as much as possible. The die was allowed to sit
for one minute before removing the screws. The die as then placed into the FTIR spectrometer (Mattson
Research Series FTIR). The FTIR spectrometer was run using the WINFIRST software. The scan
method was set so that there would be 400 scans of the background at a Resolution of 4.0 and a signal
gain of 1. The IR data type was transmittance. The control panel was set to background and the blank
was scanned.
The samples were prepared by grinding each sample to a fine powder using a mortar and pestle.
Approximately 5mg of the sample was then weighed. To each sample approximately 95mg of KBr
(Spectra-Tech Inc., 718 B983432) was added and the sample was mixed using a spatula. The sample was
then pressed into a disk using the Econo-press die (Spectra Tech Econo-press kit, Thermo Scientific) in
the same manner as the blank. The die was placed into the FTIR spectrometer(Mattson Research Series
FTIR). The sample was run in the same manner as the blank with 400 sample scans, a resolution of 4.0,
a signal gain of 1, and IR data type set to transmittance. The control panel was set to sample and the
sample was scanned. The software automatically subtracts the baseline. Between each sample the die
was cleaned with ethanol (Pharmco-Apper) and distilled water and then thoroughly dried using lab wipes.
4.1.4 1H NMR
Hydrogen nuclear magnetic resonance (H NMR) was performed on each of the starch samples.
The starch samples were prepared by measuring approximately 25mg of sample into a 4mL screw top
vial. Then, approximately 1.2mL of (Methyl Sulfoxide)-d6 (Aldrich, 151874-10G) was added to each of the
vials. The vials were closed tightly and vortexed using a Thermolyne Maxi Mix II. The samples were then
placed into a 60°C water bath (Brookfield EX-200) for 60 minutes, and vortexed (Thermolyne Maxi Mix
II) every 8 minutes to completely dissolve the starch.

21
The samples were kept in a desiccator until the H NMR could be performed. Before performing
the H NMR the samples were reheated to 60°C in the water bath. They were transported and stored in a
Styrofoam cooler until the testing could take place. The 1H spectra was obtained at 300.13 MHz using a
Bruker DRX-300 NMR spectrometer operating in the quadrature mode at 60°C using 30 degree pulses
and 1 second between scans. The spectra were referenced to the residual 1H signal of d6-DMSO
(d=2.49ppm).
4.1.5 X-Ray Crystallography
Samples were first placed in desiccator above a saturated KCl solution (aw=0.85) to become
partially rehydrated overnight. This step ensured that the peaks seen in x-ray crystallography were from
inclusion complexes with fatty acids, and not ethanol precipitation from the washing process. The
sample was then ground into a fine powder using a mortar and pestle. The powder was pressed into a
10mm disk using an Econo-press die (Spectra Tech Econo-press kit, Thermo Scientific). The disk was
removed from the die, placed onto a microscope slide, and analyzed using a MiniFlex II Desktop X-ray
Diffractometer. Counter control axis was set to HV (646V). The measurement method was continuous
starting at 4.0 degrees and stopping at 30.0 degrees with a counting unit of counts and a sampling width
of 0.020 degrees and a speed of 1.0 degree/minute.
4.1.6 Free Fatty Acid Analysis
Percentage of free fatty acid in the reacted cocoa butter was determined using the AOAC
Official Method 940.28 and correcting the value obtained to reflect the cocoa butter sample weight. This
method uses titration to determine the percentage free fatty acids expressed as oleic acid. The cocoa
butter sample is weighed and mixed with 50 mL neutralized ethanol. The ethanol (Pharmco-Apper) is
neutralized by adding 1% phenolphthalein solution (Fisher Scientific) and enough 0.1M NaOH to
produce a permanent faint pink. The cocoa butter/ethanol solution is then titrated with 0.25M NaOH
until a faint permanent pink is produced for 1 minute or longer. A 10mL burette was used for all

22
titrations. In order to account for changes in sodium hydroxide solutions and neutralized ethanol,
unreacted sample 4 cocoa butter sample’s free fatty acid content was analyzed at the same time as each
sample. The free fatty acid weight was found by multiplying the volume in liters of 0.25M NaOH needed
to produce a faint pink by the moles of NaOH in solution (0.25) and the molecular weight of oleic acid
(282.4514g). The weight of free fatty acid was then divided by the weight of the cocoa butter sample
taken before the analysis to give the free fatty acid percentage.
4.2 Results
The experiment resulted in three cocoa butter samples ( #1, #2, and #3) and seven starch
samples ( 7-1-1, 7-1-2, 7-1-3, 7-2-1, 7-2-2, 7-3-1, and 7-3-2). TLC was performed on the cocoa butter
samples. Using the procedure above for the separation of lipid fractions, cholesterol esters,
triglycerides, free fatty acids, cholesterol, diglycerides, monoglycerides, and phospholipids all should
have been visible as seen in figure 7.
Figure 7: Schematic TLC Separation of Lipid Fraction on Silica Gel G *Source: Food Analysis by S. Suzanne Neilsen20
Figure 8 shows the TLC plate for the cocoa butter standard and samples #1, #2, and #3. The bands seen
in order from top to bottom are triglycerides, free fatty acids, diglycerides, monoglycerides, and
phospholipids.

23
Figure 8: TLC of Cocoa Butter Standard and Samples #1, #2, #3 (Samples in order from Left to Right)
Figure 9 shows the TLC plate of starch inclusion complex samples 7-1-1, 7-2-1, and 7-3-1 dissolved in
DMSO and a standard of pure DMSO. This plate shows three spots that moved triglycerides, free fatty
acids, and monoglycerides (from top to bottom). At the origin DMSO and starch can be seen.
Figure 9: TLC of DMSO and Samples 7-1-1, 7-2-1, 7-3-1 in DMSO (In order from Left to Right)
24
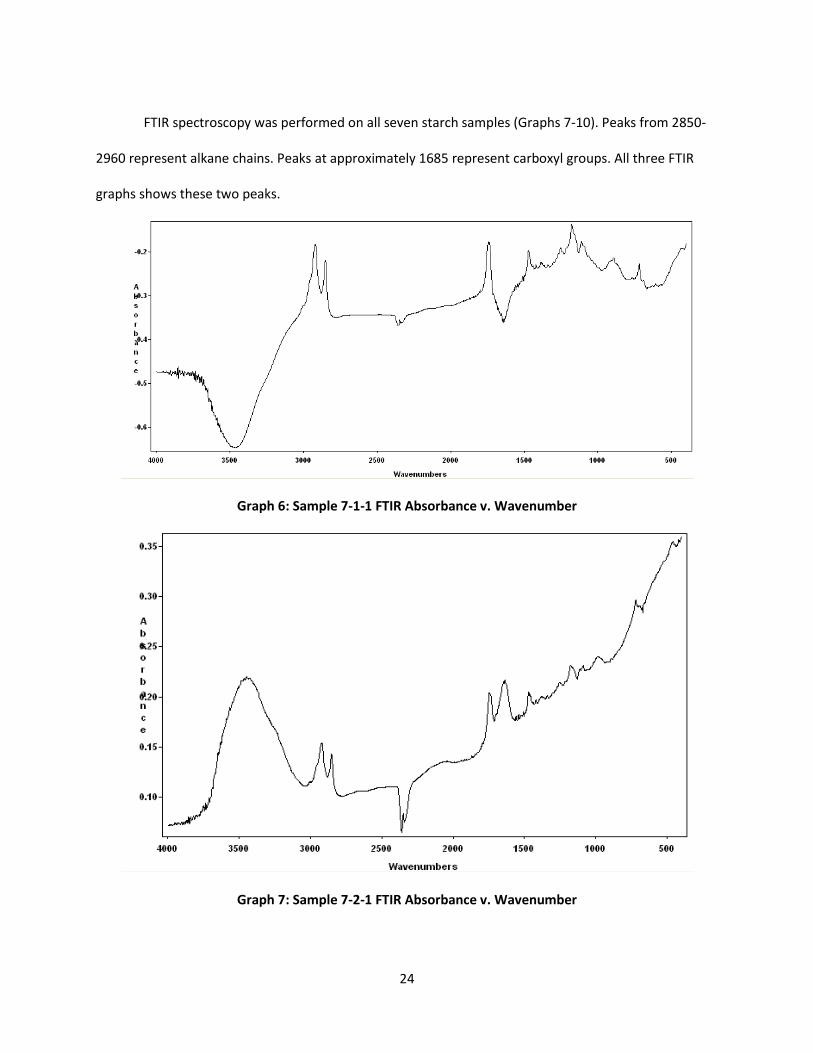
FTIR spectroscopy was performed on all seven starch samples (Graphs 7-10). Peaks from 2850-
2960 represent alkane chains. Peaks at approximately 1685 represent carboxyl groups. All three FTIR
graphs shows these two peaks.
Graph 6: Sample 7-1-1 FTIR Absorbance v. Wavenumber
Graph 7: Sample 7-2-1 FTIR Absorbance v. Wavenumber

25
Graph 8: Sample 7-3-1 FTIR Absorbance v. Wavenumber
1H NMR was performed on all seven starch samples. Table 7 shows the integral of the alkane
chain peak found between 1.0 and 1.3 ppm as well as a normalized integral for the peak. The normalized
integral was found by dividing the integral by the weight of the sample dissolved into the DMSO. The
final column shows duplicates of each sample averaged.
Table 7: Starch Inclusion Complex 1H NMR Alkane Peak Integral
Sample Name
Peak Integral Sample Weight
(mg) Normalized
Integral
Averaged Normalized
Integral
7-1-1 0.2734 25.6 0.0107
0.0035 7-1-2 0.1383 24.0 0.0058
7-1-3 0.1565 26.2 0.0060
7-2-1 0.2072 25.9 0.0080 0.0091
7-2-2 0.2537 24.8 0.0102
7-3-1 0.4770 25.5 0.0187 0.0190
7-3-2 0.4659 24.3 0.0192
All of the 1H NMR graphs show the same peaks. Graph 10 shows the 1H NMR for sample 7-3-1 which is
representative of all of the graphs.

26
Graph 9: Sample 7-3-1 1H NMR at 60°C
X-ray crystallography was performed on samples 7-1-1, 7-2-1, and 7-3-1. V-form starch inclusion
complexes can be seen on x-ray crystallography as peaks at approximately 7, 14, and 20 degrees. B-form
starch complexes can be seen on x-ray crystallography as peaks at approximately 17, 22, and 24 degrees.
As can be seen in graphs 10-12, there is a peak at 20 degrees in all three samples but only sample 7-3-1
(graph 12) has a peak at approximately 7 and 14 degrees also. All three graphs also show that B-form
starch was present.
SpinWorks 2.5: sample #6
PPM 5.6 5.2 4.8 4.4 4.0 3.6 3.2 2.8 2.4 2.0 1.6 1.2 0.8 0.4
file: E:\Kate NMR\Sample 6\6\fid expt: <zg30>
transmitter freq.: 300.131173 MHz
time domain size: 65536 points
width: 6172.84 Hz = 20.567139 ppm = 0.094190 Hz/pt
number of scans: 16
freq. of 0 ppm: 300.130000 MHz
processed size: 32768 complex points
LB: 0.000 GB: 0.0000

27
Graph 10: Sample 7-1-1 X-Ray Crystallography
Graph 11: Sample 7-2-1 X-Ray Crystallography

28
Graph 12: Sample 7-3-1 X-Ray Crystallography
A free fatty acid analysis was performed on the final cocoa butter fraction from the experiment
and a standard (Cocoa Butter Sample #4). The standard had a free fatty acid content of 3.15%. Cocoa
butter fraction 3 had a free fatty acid value of 4.16%.
4.3 Discussion
The TLC of the cocoa butter samples shows that the TLC method can be used to distinguish the
lipid fractions of the cocoa butter. Five fractions were visible: triglycerides, free fatty acids, diglycerides,
monoglycerides, and phospholipids. The free fatty acid band appeared to decrease between the
standard and each of the subsequent cocoa butter fractions. This study, however, is not quantitative
because the original spotting of the plate was not measured.
The TLC of the starch samples dissolved in DMSO shows three bands. The standard DMSO did
not move off of the origin and therefore all bands seen in the starch samples can be attributed to the
starch inclusion complexes. Each of the starch samples also had a dark spot which is due to the starch in
the sample. The three bands can be attributed to triglycerides, free fatty acids, and monoglycerides. The
free fatty acid band increases in size between the 7-1-1 sample and the 7-3-1 sample. This study is not
quantitative however due to the fact that the original spots were not necessarily the same size. Even

29
though this is not proof that there were more fatty acids in the final starch sample, it does show that
free fatty acids were present in the starch inclusion complexes.
FTIR spectroscopy was performed on samples 7-1-1, 7-2-1, and 7-3-1. The three samples show
that alkane chains and carboxyl groups were present in the starch samples. While the exact complex or
quantity cannot be determined in FTIR, this does support the presence conclusion that free fatty acids
were present in the starch inclusion complexes.
1H NMR was performed on all seven samples. All of the graphs showed two peaks between 1.0
and 1.3ppm. These peaks represent alkane chains. A trend is seen when the averaged normalized
integral of samples 7-1, 7-2, and 7-3 is calculated. This trend is an increasing in integral size and signifies
an increase in the number of protons present. This shows that more protons and therefore more or
longer alkane chains are present in sample 7-3 than sample 7-1 or 7-2.
The x-ray crystallography graphs of the three samples (7-1-1, 7-2-1, and 7-3-1) show that free
fatty acids are present indicated by the peak at 20 degrees. It is unclear, however, due to the small or
missing peaks at 7 and 14 degrees whether or not the free fatty acids are contained in inclusion
complexes or simply trapped between molecules of starch. All three graphs also show the presence of B-
form amylose which suggests that an excess of starch was present. The starch is in the B-form and not
the A-form due to the large excess of water.
The free fatty acid content increased during this experiment. This increase was greater than
those seen in just a single starch solution reaction. This is most likely due to the hydrolysis of lipids also
known as lipolysis which forms free fatty acids. Lipolysis can be caused by high temperatures and the
presence of water. This explains why the free fatty acid value does not decrease even though starch
inclusion complexes with free fatty acids are formed.19

30
CHAPTER 5 – Conclusions and Future Research
5.1 Summary and Conclusions
The first set of experiments performed show that starch inclusion complexes are formed when a
5% starch solution is reacted with cocoa butter at varying ratios of starch solution to cocoa butter. The
free fatty acid percentages of the reacted cocoa butter were not lowered. A second set of experiments
were developed to determine what lipid molecules formed the starch inclusion complexes. It was found
that starch inclusion complexes are preferentially formed with free fatty acids in cocoa butter. These
complexes were formed by reacting a 5% starch solution with the cocoa butter sample at 90°C for 30
minutes with mixing. Although starch inclusion molecules were formed, the free fatty acid and therefore
acidity of the cocoa butter sample was not lowered and in some cases was increased. The increase in
free fatty acid content was most likely caused by lipolysis of the triglycerides. Lipolysis would cause
more free fatty acids to form and therefore would explain how the free fatty acid percentage could
remain the same or when free fatty acids were removed from the cocoa butter through the formation of
starch inclusion complexes. Due to the fact that the free fatty acid content was not changed, the
formation of inclusion complexes with free fatty acids from the cocoa butter is not expected to aid in
the degumming of the cocoa butter.
5.2 Future Research
Further research is needs to be conducted to determine whether or not it is possible to remove
free fatty acids by forming inclusion complexes without forming more free fatty acids in the process. In
order to do this, the hydrolysis of lipids must be prevented. The results show that a high starch to free
fatty acid ratio is not needed in order to form inclusion complexes. If the concentration of the starch
solution was increased with a lower starch to free fatty acid ratio, it would be possible to greatly reduce
the amount of water present during the reaction. Lowering temperatures and shorter reaction times
may also reduce the amount of lipid hydrolysis during the reaction.

31
One possibility is using a caustic solution such as sodium hydroxide to form a starch solution
instead of water. A method for forming starch inclusion in a continuous process has been found by Uri
Lesmes, J. Barchechath, and Eyal Shimoni and outlined in the paper “Continuous dual feed
homogenization for the production of starch inclusion complexes for controlled release of nutrients”.
This process involves dissolving starch in caustic solution in order to open it up and mixed with the
desired inclusion molecule. The solution is then simultaneously pressurized and neutralized. The
resulting solution is then centrifuged to separate the starch from the neutralized solution. This process
has proven effective for the formation of V-type inclusion complexes with stearic acid.21 The process
must undergo testing to see if it would be effective for the removal of free fatty acids from cocoa butter.
Another possibility would involve heating the starch and water to form a starch solution and
then cooling it to 40°C and mixing it with cocoa butter which is also at 40°C. After mixing the samples
would be centrifuged and washed. If this method was effective on the laboratory scale, it could be easily
be scaled up and turned into a continuous process.

32
CHAPTER 6 – References
1 COM-WATCH: The West African Commodities Report. Rep. CMA CGM Group, Sept. 2009. Web. 10 Mar.
2010. <http://www.otal.com/images/OTAL%20Services/CommodityReport/Com-Watch-September-
2009.pdf>.
2 The cocoa manual: A guide to De Zaan’s cocoa products. Holland: De Zaan, 1993.
3 "cocoa butter." Encyclopædia Britannica. 2010. Encyclopædia Britannica Online. 10 Mar. 2010
<http://www.britannica.com/EBchecked/topic/123766/cocoa-butter>.
4 Minifie, Bernard W. Chocolate, Cocoa, and Confectionery: Science and Technology. 3rd ed. New York:
Van Nostrand Reinhold, 1989.
5 McGee, Harold. On Food and Cooking: the Science and Lore of the Kitchen. New York: Scribner, 2004.
6 "Glossary Of Terms." Oleofats Inc. Web. 29 Mar. 2010.
<http://www.oleofats.com/glossaryofterms.htm>.
7 Buchgraber, Manuela, and Elke Anklam. "Method Description for Quantification of Cocoa Butter
Equivalents in Cocoa Butter and Plain Chocolate." European Commission Joint Research
Centre (2003).
8 "Fat and Why It Matters." Indiana University. Web. 29 Mar. 2010.
<http://www.indiana.edu/~oso/Fat/Definitions.html>.
9 Chichester, C. O., Emil M. Mrak, and B. S. Schweigert. Advances in Food Research. Vol. 31. San Diego:
Academic, 1987.
10 International Cocoa Organization. Web. 10 Mar. 2010.
<http://www.icco.org/about/processing.aspx>.
11 Chichester, C. O., E. M. Mrak, and B. S. Schweigert. "Chocolate." Advances in Food Research.Vol. 31.
San Diego: Academic, 1987. 251-53.
12 Widlak, Neil. Physical Properties of Fats, Oils, and Emulsifiers. Champaign, Ill.:AOCS, 1999.

33
13 "Oil Processing." Innvista Home. Web. 10 Mar. 2010.
<http://www.innvista.com/health/nutrition/fats/process.htm>.
14 Guehi, Simplice T., MIchael Dingkuhn, Emile Cros, Gerard Fourny, Robert Ratomahenina, Guy
Moulin, and Anne Clement Vidal. "Impact of Cocoa Processing Technologies in Free Fatty Acids
Formation in Stored Raw Cocoa Beans." African Journal of Agricultural Research3 (2008): 174-79.
15 Godet, M. C., H. Bizot, and A. Buleon. "Crystallization of Amylose-fatty Acid Complexes Prepared
with Different Amylose Chain Lengths." Carbohydrate Polymers 27 (1996): 47-52.
16 Snape, Colin E., William R. Morrison, M. M. Maroto-Valer, John Karkalas, and Richard A. Pethrick.
"Solid State 13C NMR Investigation of Lipid Ligands in V-amylose Inclusion
Complexes." Carbohydrate Polymers 36 (1998): 225-37.
17 Lay Ma UV. 2010. Encapsulating Fatty Acid Esters of Bioactive Compounds in Starch
[Dissertation]. University Park: The Pennsylvania State University. 232 p.
18 Tufvesson, F., and A. C. Eliasson. "Formation and Crystallization of Amylose-monoglyceride Complex
in a Starch Matrix." Carbohydrate Polymers 43 (2000): 359-65.
19 "Lipid Chemistry and Biochemistry." Handbook of Food Science, Technology, and Engineering. Vol. 1.
Boca Raton: Crc, 2006. 8-6.
20 Nielsen, S. Suzanne. Food Analysis. New York: Kluwer Academic/Plenum, 2003.
21 Lesmes, Uri, J. Barchechath, and Eyal Shimoni. "Continuous Dual Feed Homogenization for the
Production Fo Starch Inclusion Complexes for Controlled Release of Nutrients." Innovative Food
Science & Emerging Technologies 9 (2008): 507-15.

ACADEMIC VITA of Katherine J. Gawel Katherine J. Gawel 1043 Charter Oaks Dr. Lansdale, PA 19446 [email protected] Education: Bachelor of Science Degree in Chemical Engineering, Penn State University, Spring 2010 Minor in Engineering Entrepreneurship Honors in Food Science Thesis Title: Cocoa Butter and Starch Inclusion Complexes Thesis Supervisor: Gregory Ziegler Related Experience: Project Engineering Internship with Kraft Foods Supervisor: Adam Subsinksy Summer 2009 Quality Project Coordinator Internship with Tech Tube, Inc. Supervisor: Chris Yonkers Summer 2007 Alloy Recycle Manager Internship with Tube Methods, Inc. Supervisor: Brian Johnson Summer 2006 Activities/Leadership: President, American Institute of Chemical Engineers (2009-2010) Vice President, Americana Institute of Chemical Engineers (2008-2009) THON Chair, American Institute of Chemical Engineers (2007-2008) ENGR 411: Business for Engineers, Teaching Assistant (Fall 2008) ENGR 310: Entrepreneurial Leadership, Teaching Assistant (Spring 2009) Member, Tau Beta Pi Engineering Honors Society (2008-Present) Research Experience: Honors Thesis Research in Food Science, Dr. Ziegler (2008-2010) Research Fellowship in Chemical Engineering, Dr. Curtis (Summer 2008) Awards: Dean’s List Fall 2006, Spring 2007, Fall 2007, Fall 2008, Spring 2009, Fall 2009 Presidential Freshman Award Penn State Engineering Society Endowed Scholarship First Runner Up, 2010 Joelle Award for Women in Engineering Leadership