Embed Size (px)
Citation preview

The Pennsylvania State University
The Graduate School
College of Earth and Mineral Sciences
DEFORMATION STUDIES ON DIRECTIONALLY SOLIDIFIED EUTECTIC
LaB6-ZrB2
A Thesis in
Materials Science and Engineering
by
Calista I. Phillips
Submitted in Partial Fulfillment of the Requirements
for the Degree of
Master of Science
December 2009

ii
The thesis of Calista Irene Phillips was reviewed and approved* by the following: Elizabeth C. Dickey Professor of Materials Science and Engineering Thesis Advisor John R. Hellmann Professor of Materials Science and Engineering David J. Green Professor of Ceramic Science and Engineering Joan M. Redwing Professor of Materials Science and Engineering Program Chair *Signatures are on file in the Graduate School
iii
Abstract
Directionally solidified eutectic LaB6-ZrB2 samples were studied for potential use as
ultra-high-temperature materials. Novel ultra-high-temperature materials are needed to
improve the efficiency of flight vehicles, turbine engines and rocket engines. In
evaluation of LaB6-ZrB2’s viability for high-temperature applications, room-temperature
indentation and high-temperature creep studies were performed.
A Vickers indenter was used to initiate room-temperature deformation at a 19.6 N
load. The area directly under the indent was analyzed by TEM. Fracture and debonding
at the interfaces was observed and samples showed numerous dislocations in both phases.
Dislocations were observed to initiate and end in the bulk. Dislocations were not
observed to initiate or end at the interfaces. Two beam conditions were performed in g200
LaB6 and g010 LaB6 orientations. Dislocations that were evident in the g200 LaB6 were not
seen in the g010 LaB6 TEM studies. These results are consistent with the
110/}100{ slip system being satisfied. Other dislocations appeared in both the g200
LaB6 and g010 LaB6 orientations. These results indicate that more than one slip system is
operable at room-temperature in the LaB6 phase of the directionally solidified eutectic.
An impression creep instrument was modified for controlled-atmospheric testing
under high temperatures. Standard samples of SiAlON material were tested for
validation of instrument performance. Standard samples yielded comparable results as
samples run by a previous researcher. Samples of LaB6-ZrB2 DSE were run for 100hrs at
temperatures between 1400-1600°C and stresses of -300, -400, and -420 MPa.
Deformation did not occur at these temperatures and stresses. Oxidation occurred during
creep testing and additional sample preparations and furnace modifications were
performed to try to eliminate oxidation of the LaB6-ZrB2 DSE. Despite extra efforts to
prevent oxidation of the surface, oxidation was still observed. This oxidation will limit
LaB6-ZrB2 DSEs use as an ultra-high-temperature material in oxygen-containing
environments.
iv
Table of Contents
List of Figures................................................................................................................... vi
List of Tables .................................................................................................................... xi
1 Introduction............................................................................................................... 1
1.1 Applications and Material requirements............................................................. 1 1.1.1 Turbine and Rocket Engines....................................................................... 2 1.1.2 Flight Vehicle Surface Materials ................................................................ 3
1.2 Directionally Solidified Eutectics ....................................................................... 4
1.3 DSE Processing................................................................................................... 7 1.3.1 Growth Rate ................................................................................................ 9 1.3.2 Phase Morphology .................................................................................... 11
1.4 LaB6-ZrB2 Eutectic ........................................................................................... 11
1.5 Creep and Impression Creep Background ........................................................ 15 1.5.1 History of Creep........................................................................................ 15 1.5.2 Impression creep method .......................................................................... 16 1.5.3 Stages of Creep ......................................................................................... 17 1.5.4 Known Oxide DSE Creep Data ................................................................ 19 1.5.5 Creep in Single-Crystal ZrB2 and LaB6 .................................................... 24
1.6 Deformation Mechanisms................................................................................. 26
1.7 Conclusion ........................................................................................................ 32
2 Hypothesis and Objectives ..................................................................................... 34
3 Room-Temperature Deformation Study............................................................... 35
3.1 LaB6-ZrB2 Microstructure ................................................................................ 35
3.2 Method .............................................................................................................. 37
3.3 Results............................................................................................................... 40 3.3.1 As-Grown Orientation and Deformation .................................................. 40 3.3.2 Hardness.................................................................................................... 45 3.3.3 Deformation .............................................................................................. 46
3.4 Conclusions....................................................................................................... 50
4 High-Temperature Impression Creep................................................................... 52
4.1 Method .............................................................................................................. 52 4.1.1 Instrument Modification ........................................................................... 52 4.1.2 Instrument Calibration .............................................................................. 54 4.1.3 Sample Preparation ................................................................................... 55
v
4.2 Results............................................................................................................... 56 4.2.1 1st Creep Run............................................................................................. 56 4.2.2 2nd Creep Run............................................................................................ 58 4.2.3 3rd Creep Run ............................................................................................ 64 4.2.4 4th Creep Run ............................................................................................ 67 4.2.5 5th Creep Run ............................................................................................ 73 4.2.6 6th Creep Run ............................................................................................ 75
4.3 Summary and Discussion.................................................................................. 80
5 Conclusions.............................................................................................................. 83
6 Future Work............................................................................................................ 84
Appendix ......................................................................................................................... 86
References........................................................................................................................ 87
vi
List of Figures Figure 1.1 Diagram of a solidification furnace from ref.40 ............................................. 8 Figure 1.2 LaB6-ZrB2 eutectic composite fiber spacing as a function of growth rate
(from ref 43) ................................................................................................. 10 Figure 1.3 LaB6-ZrB2 Phase diagram.31........................................................................ 12 Figure 1.4 LaB6 and ZrB2 models modified from ref.26 ............................................... 13 Figure 1.5 Structural relation between LaB6 and ZrB2 phases during co-crystallization
B-B’ is a common boron pair common to both phases43 ............................. 14
Figure 1.6 Diffraction diagram with the typical observation of alignment of )101( LaB6
parallel to )101( of ZrB2 in LaB6-ZrB2 DSE from references 43,26 ............... 15 Figure 1.7 A solid punch of cross-section A is impressed onto the surface of a sample
material under load L. L/A= punching stress. h is the depth of the impression. dh/dt= creep rate during steady state. (from ref. 58 ) ............... 17
Figure 1.8 The stages of creep from Callister65 ............................................................ 19 Figure 1.9 Comparison of creep rate vs. reciprocal temperature (normalized at 100
MPa) for several single crystal oxides and eutectics. YAE refers to an alumina YAG eutectic. YAG refers to yttrium-aluminum-garnet, YSZ refers to yttria-stabilized-zirconia, YSZ20- refers to 20% Al203., SAP – Saphikon, Inc., USE- USE, Inc.66 ................................................................ 20
Figure 1.10 Longitudinal cross-sections and creep data for a) 0.1 in/min Alumina/YAG
eutectic (AYE) grown by USE, Inc. b) 0.5 in/min AYE-USE and c) 1in/min AYE grown by Saphikon, Inc. The best creep resistance at 1600°C is observed in the faster 1in/min growth rate. Note the fiber rim is a different morphology than the fiber core.63 ................................................................ 22
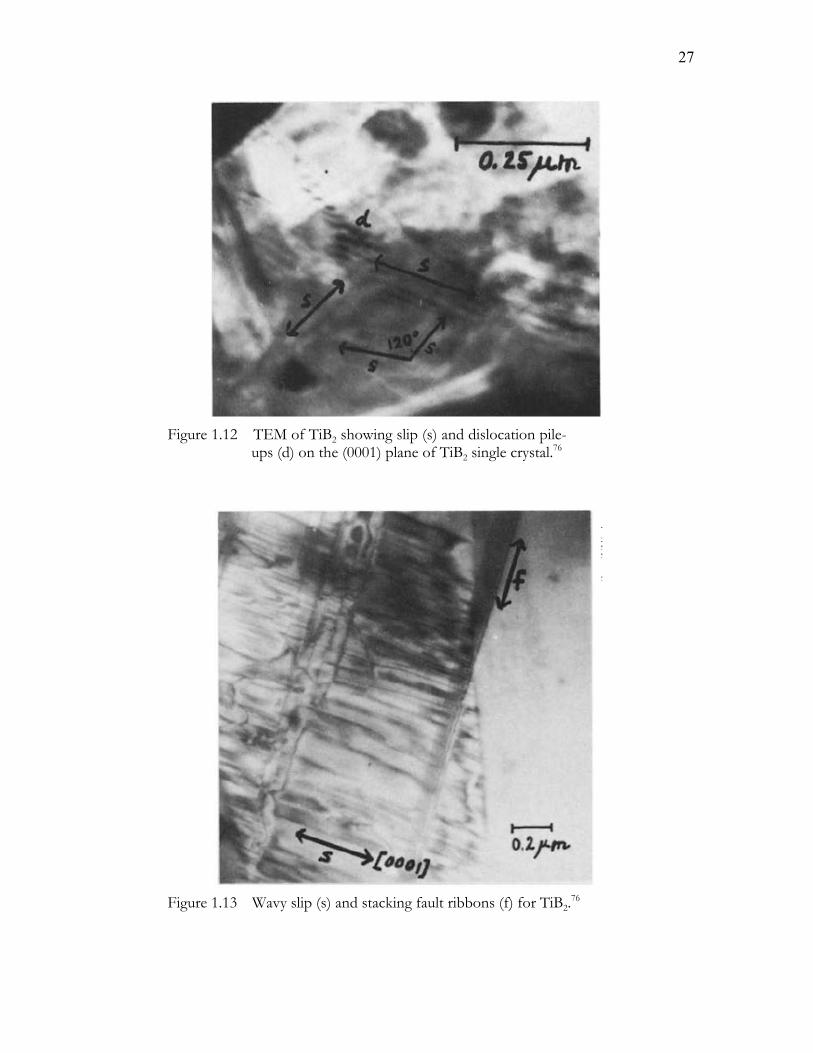
Figure 1.11 Chen et al. 200373 Hardness vs. loading time at various temperatures. ...... 25 Figure 1.12 TEM of TiB2 showing slip (s) and dislocation pile-ups (d) on the (0001)
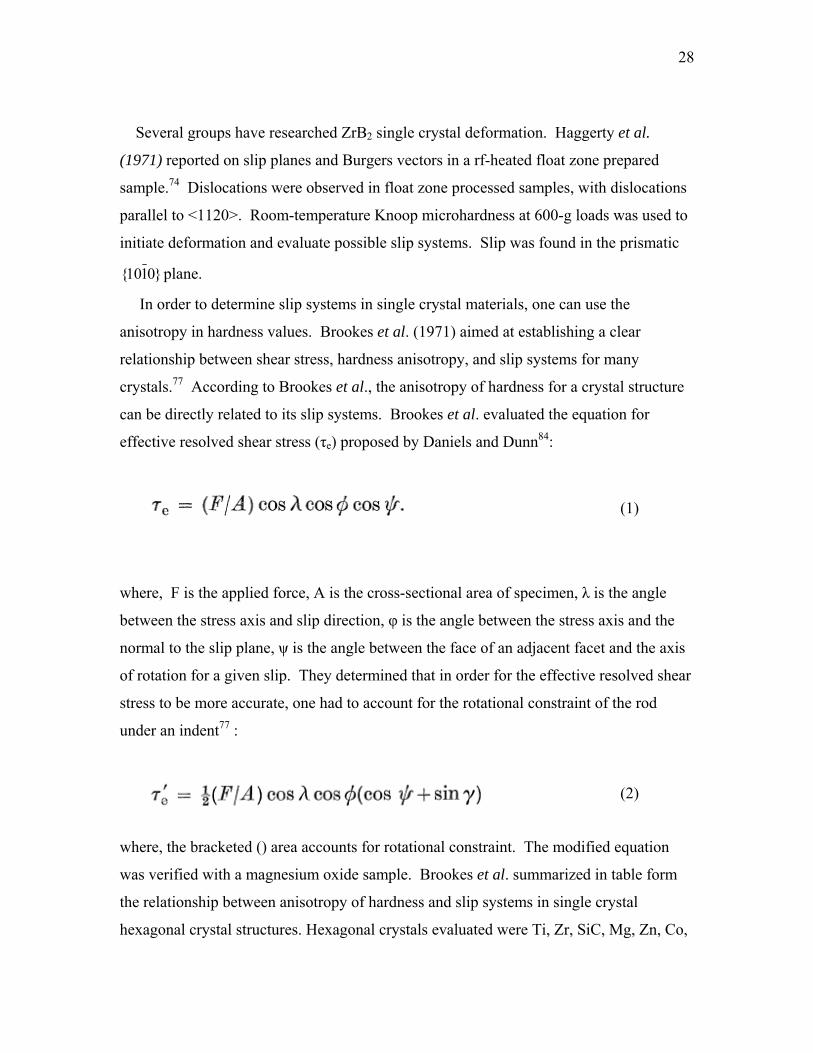
plane of TiB2 single crystal.76 ...................................................................... 27 Figure 1.13 Wavy slip (s) and stacking fault ribbons (f) for TiB2.
76 .............................. 27 Figure 3.1 As received LaB6-ZrB2 rod showing banding and ripples. ......................... 35
vii
Figure 3.2 Microstructure of as received LaB6-ZrB2 DSE rod. a) region showing cellular growth b) rod cross-section c) region showing homogeneous microstructure .............................................................................................. 36
Figure 3.3 TEM specimen preparation sequence. a) 20µm x 2µm x 10µm W deposit
on 19.6 N indent (b) Plucking a sample (c) Attaching the sample to the Omniprobe grid (d) Thinning sample (e) Final thinned electron transparent sample .......................................................................................................... 38
Figure 3.4 Typical indent area where hardness values were taken, depicting the
homogenous microstructure consisting of ~18% volume fraction of ZrB2 fibers. ........................................................................................................... 39
Figure 3.4 TEM sample from an as-grown LaB6-ZrB2 DSE parallel to growth axis
thinned to transparency. ............................................................................... 40 Figure 3.5 TEM sample from an as-grown LaB6-ZrB2 DSE perpendicular to growth
axis thinned to electron transparency........................................................... 41 Figure 3.6 TEM micrographs of an as-grown LaB6-ZrB2 DSE with no dislocations
observed, contrast is due to bend contours. a) Parallel to growth axis. b) Perpendicular to growth axis ....................................................................... 42
Figure 3.7 As-processed LaB6-ZrB2 DSE sample prepared by Deng26 in unpublished
work. Dislocations are observed in the LaB6 matrix as well as the ZrB2 fibers. ........................................................................................................... 43
Figure 3.8 Observed LaB6-ZrB2 DSE “as is” orientation relationship ......................... 43 Figure 3.9 Deng et al. observed LaB6-ZrB2 orientation relationship96.......................... 44 Figure 3.11 Illustration of c axis and longitudinal orientations of theLaB6-ZrB2 DSE
sample used for hardness evaluation............................................................ 45 Figure 3.12 Stress graphs based on v=0.26, α = 68°.100................................................... 47 Figure 3.13 Multibeam TEM image of LaB6-ZrB2 DSE deformed under 19.6 N load
perpendicular to the growth direction. ......................................................... 48 Figure 3.14 TEM perpendicular to the growth axis. One can see numerous dislocation
arrays. The dislocation arrays appear to initiate or end in the matrix and do not appear to initiate or end at the fibers. Two beam conditions g 200 LaB6 and g 010 LaB6. Stripes satisfy slip plane and direction 110/}100{ . Circled areas are dislocations that did not satisfy the invisibility criterion. 49
viii
Figure 3.15 TEM micrographs of LaB6-ZrB2 DSE from under a 19.6 N Vickers indent (parallel to the growth axis. a) High magnification showing numerous dislocations in the ZrB2 fiber and a crack starting on the outside. Some dislocation arrays are evident in the LaB6 matrix as well. b) Low magnification of same sample with crack path more obvious..................... 50
Figure 4.1 Impression creep schematic and photo.102................................................... 53 Figure 4.2 Aluminum jig encases and ensures alignment of the upper ram, SiC
punch/indenter, specimen, upper and lower tabs, and bottom ram.............. 54 Figure 4.3 a) Optical micrograph of the side of the LaB6-ZrB2 sample after creep test #
1 showing severe deformation, b) sacrificial SiC Tab from creep test #1 showing severe reaction product.................................................................. 56
Figure 4.4 SEM/EDS results on outer surface of LaB6ZrB2 sample after creep test #1.
Zr and La were the only elements detected. These elements are expected therefore nothing unusual was detected by SEM/EDS. ............................... 57
Figure 4.5 SEM/EDS Analysis from creep test # 1 tablet Residue. Zr, La and Si were
detected. La and Zr are from the sample and Si would be expected from the SiC tablet...................................................................................................... 57
Figure 4.6 a) Top outer surface of Creep Test # 2 sample and tablet. A glassy residue
was observed after two hours @ 1400°C with no load. b) SEM/EDS taken from the surface of the LaB6-ZrB2 DSE sample (circled) detected La, Si, C, O, Zr............................................................................................................. 58
Figure 4.7 XRD 2nd outer surface of creep sample confirming oxidation of the sample
in the form of lanthanum borate................................................................... 59 Figure 4.8 XRD 2nd creep sample area of tab on which sample was sitting tested to
ensure no contamination was responsible for reaction. Again, lanthanum borate was detected. ..................................................................................... 60
Figure 4.9 XRD of 2nd creep sample reaction product found on the SiC tablet. XRD is
comparing glassy residue to white center ring where LaB6-ZrB2 sample was sitting............................................................................................................ 61
Figure 4.10 Phase diagram for the system La2O3-B2O3.
104............................................. 61 Figure 4.11 SEM photographs of the surface morphology of oxidized LaB6-ZrB2 at
oxygen partial pressure of 39 kPa (a)-912°C; (b)1016°C; (c)1094°C; (d) 1223°C.105 .................................................................................................... 62

ix
Figure 4.12 Parabolic plot of specific weight change of the LaB6-ZrB2 composites vs. time at various oxidation temperatures in an oxygen partial pressure of 39 kPa.105........................................................................................................ 63
Figure 4.13 Creep test # 3 sample as is- after one hour under a stress of -300MPa @
1400°C- the LaB6-ZrB2 DSE sample is melted. ....................................... 64 Figure 4.14 Creep test # 3 reaction product on underside of top tab SEM/EDS results
detected La and Si. .................................................................................... 65 Figure 4.15 XRD 3rd creep sample post test cross-sectioned in half longitudinally.
Three areas were analyzed. In the outer area lanthanum borate and ZrO2
were detected. The Center area was not oxidized and pure LaB6-ZrB2 was detected. The scale around the sample didn’t yield an identifiable pattern but O, Zr, Al, B, La were detected by EDS. Al was assumed to be from the insulation in the furnace...................................................................... 66
Figure 4.16 SEM micrograph of 3rd creep sample post test cross-sectioned in half
longitudinally after creep, outer later shows a high level of porosity indicating B203 evaporation. ..................................................................... 66
Figure 4.17 a) Back scattered electron image of a LaB6-ZrB2 eutectic b) EMP boron X-
ray image of the same area B2O3 showing lack of boron at the surface indicating boron evaporation. 105 .............................................................. 67
Figure 4.18 Inside of creep furnace before the start of a creep run. *Notice the seven
graphite getters.......................................................................................... 68 Figure 4.19 LaB6-ZrB2 DSE creep #4 sample after 100 hrs at 1400°C -300 MPa in
forming gas. The load was applied normal to the impression region shown. ....................................................................................................... 69
Figure 4.20 Inside of furnace after creep test 4, depicting white Si coating due to
reaction of fiberfrax fibrous insulation with the forming gas. .................. 69 Figure 4.21 LaB6-ZrB2 DSE creep #4 deformation over time for 100 hrs at 1400°C, -
300MPa in forming gas............................................................................. 70 Figure 4.22 SEM micrograph of LaB6-ZrB2 DSE cross-section after 4th creep sample
reveals several cracks underneath impression/indentor area. ................... 71 Figure 4.23 High magnification SEM cross-section of 4th creep sample under the
indent showing an unchanged microstructure compared to the as-processed sample. Fiber diameter and spacing are 0.65 ± 0.09 µm and 0.7 ± 0.2 µm respectively................................................................................ 72
x
Figure 4.24 Typical TEM of creep # 4 sample @1400°C, -300MPa, 100 hrs crept
ZrB2-LaB6 DSE sample. No dislocations were observed in any orientation. The contrast between the fibers is associated with bend contours and not crystalline defects...................................................................................... 72
Figure 4.25 LaB6-ZrB2 DSE sample #5 deformation over time 74 hrs, 1500°C, -
400MPa in UHP argon.............................................................................. 74 Figure 4.26 Low magnification SEM micrograph of top view and longitudinal cross-
section LaB6-ZrB2 sample after 5th creep run. .......................................... 74 Figure 4.27 SEM micrograph of LaB6-ZrB2 cross-section after the 5th creep run
showing fracture on the cross-section area under the impression and oxidation on the surface of the sample impression area. .......................... 75
Figure 4.28 LaB6-ZrB2 DSE creep sample #6 deformation over time for 100 hrs at
1600°C, -420MPa in UHP argon. ............................................................. 76 Figure 4.29 Top view of LaB6-ZrB2 DSE sample #6 after 25 hrs, 1600°C, -420MPa in
UHP argon. The load was applied normal to the indenter area shown. Oxidation is observed on the surface of the sample. ................................ 76
Figure 4.30 High magnification SEM of LaB6-ZrB2 DSE after 1600°C -420MPa creep
test. Surface oxidation outside of the indent area is observed with ~40um surface depth reduction. ............................................................................ 77
Figure 4.31 Cross-section of 6th creep run of DSE LaB6-ZrB2. Cracks were observed
under the indent area and a raised area (reaction product) determined to be SiC and LaB2C2 by XRD. ......................................................................... 78
Figure 4.32 TEM micrograph of 6th LaB6-ZrB2 creep sample. .................................... 79 Figure 4.33 TEM micrograph and interface diffraction pattern for the 6th creep run of
LaB6-ZrB2 DSE......................................................................................... 79 Figure 4.34 Stress graphs for a cylindrical flat punch. A polar coordinate system is
used to describe the stress beneath a cylindrical flat punch. The stress graph distances r and z are normalized to the contact radius a and stresses are expressed in terms of the mean contact pressure pm
100 ....................... 81 Figure 4.35 Plot of the magnitude of stress acting normal to the sample surface below a
cylindrical flat punch. a is the radius, r is the distance from the center of the punch and Pm is the load/ contact area. A singularity exists in the stress field at the edge contact (r/a =1).102 ................................................ 82

xi
List of Tables
Table 1.1 Room-temperature mechanical properties of oxide and non-oxide eutectics.6 Table 1.2 Al2O3-YAG microstructure, growth rates, and interphase spacing compared
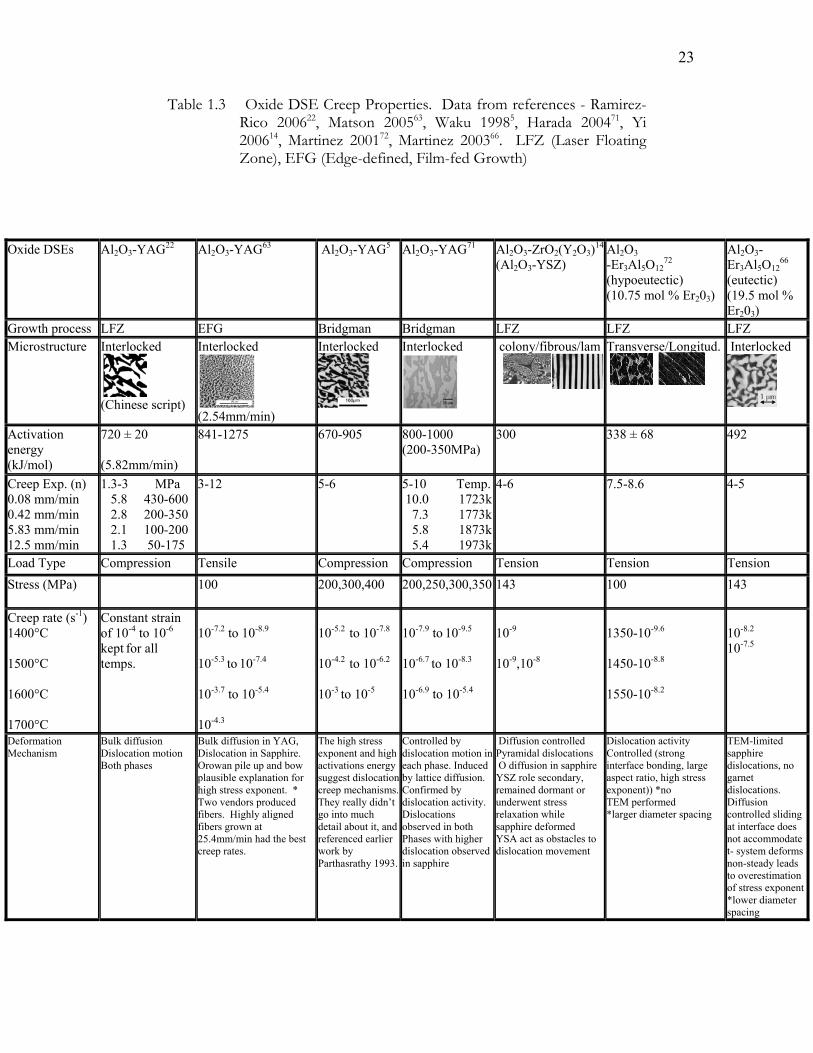
from ref. 22...................................................................................................... 9 Table 1.3 Oxide DSE Creep Properties. Data from references - Ramirez-Rico 200622,
Matson 200565, Waku 19985, Harada 200473, Yi 200614, Martinez 200174, Martinez 200368. LFZ (Laser Floating Zone), EFG (Edge-defined, Film-fed Growth) ........................................................................................................ 23
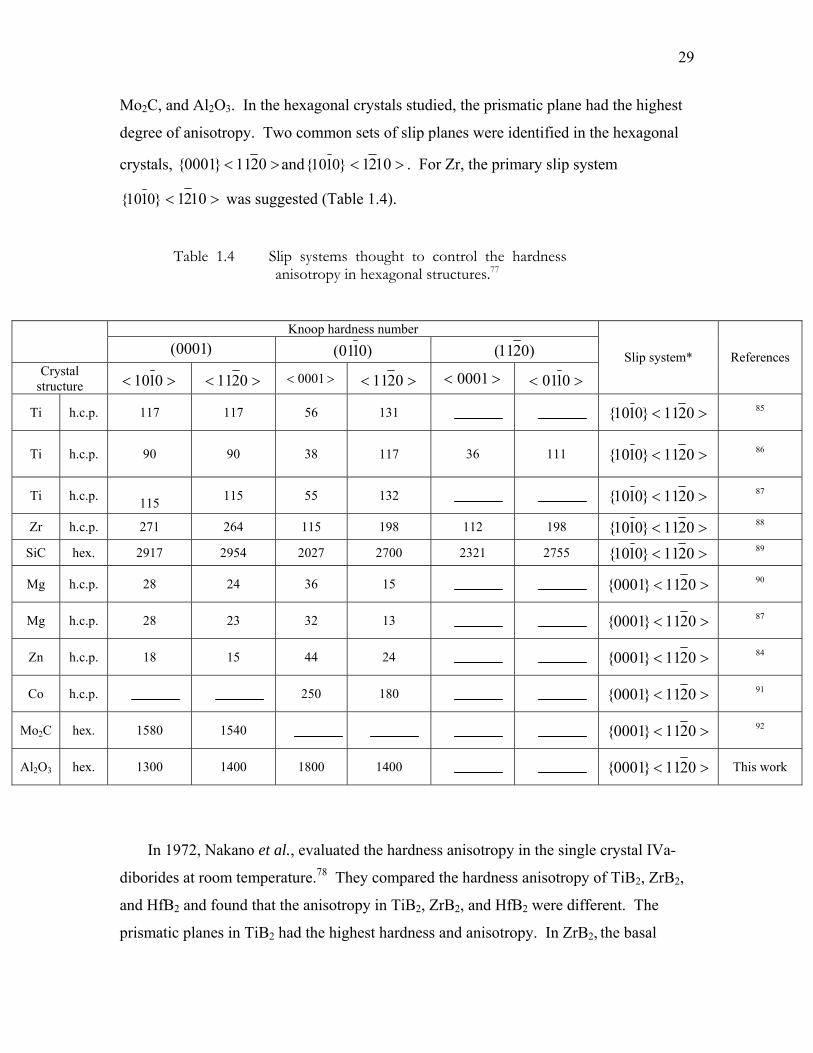
Table 1.4 Slip systems thought to control the hardness anisotropy in hexagonal
structures.79 .................................................................................................. 29 Table 1.5 Single crystal ZrB2 and LaB6 suggested slip systems.................................. 32 Table 3.1 Vickers hardness values for LaB6-ZrB2 DSE .............................................. 45 Table 4.1 Calibration results for Creep Test Instrument and small diameter specimens.
Highlighted columns are calibration runs performed in this study. Non-highlighted are previous runs performed on the same instrument. ab581 = 35.4%Si, 6.9%Al, 5.8% O, 51% N, 0.7%Yb104........................................... 55
Table 4.2 Summary of Indentation Creep of LaB6-ZrB2 DSEs ................................... 80
1
1 Introduction
1.1 Applications and Material requirements
New and advanced ultra-high-temperature materials are needed for turbine and rocket
engines, wing leading edges, engine cowl inlets, nose caps, and thermal barriers for
hypersonic vehicles, because current temperature limitations reduce optimum
performance.1 Current materials are unable to withstand the high temperatures and
therefore, not only limit overall efficiency in turbine and rocket engines but also damage
the structural integrity of protective surface materials in flight vehicles.1 Although this
equipment requires materials able to withstand temperatures that range from 1400°C for
turbine engines to 3000°C for thermal protection systems, current materials are limited to
1315°C for turbine engines and 1650°C for thermal protection systems. 1,2,3 An
improvement in the high-temperature stability of these materials would have far-reaching
economic implications. Power produced by turbine engines is utilized to run jets, ships,
locomotives, helicopters, tanks, satellites, and small power plants. With a little
improvement in the efficiency of turbine engines, a huge improvement in cost can be
realized. Even small improvements in thermal efficiency would mean big savings. For
example, the Department of Defense is the largest consumer of energy in the United
States. The department spent 10 billion dollars on combat fuel alone in 2006.4 Cost to
refuel vehicles in-flight have been estimated to be about $42/gal.4 According to a report
by the Defense Science Board Task Force, this estimated value is low, and does not take
into account all the cost of transporting the fuel.4 Increasing efficiency would in many
cases eliminate the need for refueling in-flight and would eliminate the costly refueling
expenses. In addition, in 1998, a 1% improvement in the thermal efficiency of gas
turbines would have meant a world-wide annual savings in energy costs of around one
trillion dollars.5 According to a rough calculation based on the consumer price index, in
2009 that would equal an annual savings of around 1.3 trillion dollars.6 This
introduction serves to provide information and background in order to establish that
research on boride based, low-density, high-melting point, directionally solidified
eutectics (DSEs) may resolve current temperature limitations. In order to make this

2
claim, this introduction reviews turbine and rocket engines, surface materials for flight
vehicles, current materials and limits, and how new materials would improve efficiency.
Second, it provides an overview of new advances in directionally solidified eutectics in
order to establish rationale for researching new composite materials as a solution to
current temperature limitations in materials. Third, it discusses what researchers
currently know about LaB6-ZrB2 DSEs. Fourth, it provides an overview of creep testing
which is important for evaluating a materials performance under high temperature and
stress. Finally, it introduces the overall project objectives.
1.1.1 Turbine and Rocket Engines Currently, materials used for turbine engines have high-temperature limitations.
Turbine blades, which are composed of nickel-based super alloys, are the majority of
blades in use today, but unfortunately, although the combustion gas environment is
~1370ºC, Ni-based super alloys have poor strength at 1000°C and low melting points in
the range of 1230-1315° C.2 To enable operation of the combustion engine at 1370ºC
and to protect the Ni based super alloys from damage due to oxidation, creep, melting,
and thermal fatigue, engines are air cooled and low thermal conductivity coatings are
applied to the blades. In order to improve the efficiency of gas turbine engines, one must
increase the operating temperature.7
Rocket engines power space shuttles and missiles and have similar material
operational limitations as turbine engines. A niobium alloy with a disilicide coating is
currently the material of choice for rocket engines. The combustion chamber has an
operational limit of ~ 2900°C which is double the operational limit of the niobium alloy
(1450°C ) used currently.3 Presently, cooling of the chamber is performed with the use of
fuel-film and regenerative cooling. Fuel-film refers to fuel that does not burn
completely.8 This un-burnt fuel coats the combustion chamber walls acting as a coolant.
Improving the combustion chamber material operating temperatures in these applications
would minimize or eliminate the need for fuel-film and regenerative cooling. In addition,
the un-burnt fuel film is a source of contaminants and adversely affects internal controls
of the chamber.8 Eliminating this would result in a cleaner burning rocket engine that
would ultimately result in better fuel efficiency, cost reduction, and farther travel.3

3
1.1.2 Flight Vehicle Surface Materials
In addition to turbine and rocket engines, new ultra-high-temperature materials
designed as surface materials for flight vehicles must be able to handle extremely high
temperatures and diverse atmospheric conditions. More specifically, these materials need
to be operable and reusable in typical air composition as well as monatomic oxygen and
nitrogen. For example, upon atmospheric reentry, the space shuttle encounters
temperatures of 2000°C and above, as well as monatomic oxygen and nitrogen. The
wing leading edges, engine cowl inlets and nose caps of vehicles need materials operable
in maximum temperatures between 2000 to 3000ºC.1 To reduce the extreme surface
temperatures encountered by the space shuttle and hypersonic vehicles, current designs
involve the use of blunt edges. Removing blunt edges and streamlining flight vehicles
with leading edges made of ultra-high-temperature materials, would result in improved
maneuverability and fuel efficiency, and thus result in the ability to travel further,
increase ease of landing on return, and reduce cost.9,10
Some surface materials are reusable thermal protection systems and thus must meet
multiple use requirements. Reusable thermal protection systems in hypersonic flight
vehicles used today have maximum operation temperatures near 1650ºC.3 Structural
materials used presently are predominantly based on SiO2, SiC, Si3N4, and oxide
ceramics or composites of these materials.11 Because SiO2-and SiC-based materials are
excellent oxidation barriers, they are found on various surfaces on the space shuttle. The
tile and blanket material, the carbon-carbon leading edges and nose cap material use SiO2
and SiC-based materials.3 Monoliths of these materials are not used due to brittle failure
during extreme temperature changes.11 Instead, ceramic-matrix materials are utilized.
For example, the HRSI (high-temperature-reusable-surface-insulation) tiles are made up
of silica fiber.12 In hypersonic environments, SiC-based materials have limited thermal
cycling lifetimes due to CTE mismatch induced matrix cracking.1 Deformation of the
material decreases the oxidation resistance by allowing a method of direct oxidation of
fibers.1 Therefore, both SiO2- and -SiC based thermal protective systems are limited in
their temperature capability to ~1600° C in an oxidizing atmosphere.3 Low-pressure and

4
high-temperature environments are detrimental to the service life of the current silicide-
based thermal protection materials used on flight vehicles.1 Currently, few if any
material options meet the future thermal protection systems desired. Even today’s best
ultra-high-temperature materials consist of carbon-carbon composites and silicon carbide
composites such as C-SiC and SiC-SiC , but these composites are not sufficiently
oxidation-resistant.1 Potential materials that oxidize and form pure scales of SiO2, Al2O3,
Cr2O3, or BeO, cannot be utilized at temperatures of 1800ºC and above in hypersonic
flight conditions due to high vapor pressures which arise at the interface of the base
material and the scale.1
In order to get beyond our present material limitations of ~ 1600ºC and to meet
operation needs of 3000°C we need to evaluate other possible material candidates. Due
to processing difficulties borides have historically been overlooked and under-researched,
but their refractory nature, high hardness and tensile strengths make these promising
materials candidates.13,14 More specifically, refractory borides have melting temperatures
above 3000ºC, high thermal conductivity, elastic modulus, good strength at high
temperatures, modest thermal expansion, good thermal shock resistance and they have
the ability to form refractory oxide scales and can be modified with additives to promote
oxidation resistance.15 Until recently, the major limitation to their use has been a lack of
an affordable, reproducible manufacturing process because the strong covalent bonding
gives them high melting temperatures, but makes them difficult to densify.9 As a result,
ultra-high-temperature ceramics are usually consolidated by hot pressing. However, this
process can cause impurities to concentrate in the grain boundaries, which decreases the
high-temperature strength.16 Now, however, as discussed in the next section, improved
processing methods for directionally solidified eutectics have garnered increased interest
in these materials.
1.2 Directionally Solidified Eutectics Eutectics, first named by Guthrie in 1884, are composites with a minimum
temperature of melting,.17 A directionally solidified eutectic (DSE) is a composite
formed by the simultaneous crystallization of two or more phases from one melt with a
5
well defined solid-liquid interface.13 These composites have a homogeneous but complex
microstructure that can best be described as a reinforcing phase within a higher volume
matrix phase.18 This type of microstructure produces composites with excellent
mechanical properties that are very stable up to temperatures close to their melting
points.19 This stability up to the melting point can be attributed to the composites being
crystallized from the molten state and therefore being in thermodynamic equilibrium.19
One benefit of DSE growth is the ability to control morphology and mechanical
properties because phase morphology (size, shape, interface, and distribution) of the
eutectic directly relates to the mechanical properties of composites. For example, one
can utilize the differences in thermal expansion coefficients and Young’s Modulus
between phases to engineer a composite that would create compressive stresses in the
matrix.19 Growing a DSE material with a reinforcing fiber phase and matrix of different
thermal expansion and moduli creates an environment of residual stress that promotes
crack path deviation around the reinforcing phase thus contributing to increased fracture
toughness.20 By controlling growth conditions such as the molten zone height, pull rate,
wetting angle and laser power distribution, one can engineer a material with smaller
reinforcing fiber phase diameter and spacing, thus improving strength. Much work has
been done to understand growth conditions and how they affect the microstructure of the
DSE material (processing will be discussed in detail in section 1.3).
Among eutectics, oxide eutectics have received the most attention due to their
inherent oxidation resistance.5,7,13,18,19,21,22,23 Research on oxide eutectics dates back to
1967 when Galasso et al. grew a directional solidified eutectic BaFe12O19-BaFe2O4 in
order to determine how DSE growth would effect its magnetic properties.24 With
improvements in the processing and characterization of oxide DSEs, there is renewed
interest in DSEs. In the 1970’s the Bridgman growth process was restricted to thermal
gradients below 102 K/cm.18 Now, higher thermal gradients are achievable of 104 K/cm
with the floating zone process which results in improved control over microstructure and
understanding of processing parameters.18 Within the last two decades there has been
development of several new DSE ceramic oxides, including Al2O3-YAG, Al2O3-YSZ,
and Al2O3-Er3Al5O12. These Al2O3-based oxides are known for having some of the best
6
creep resistance in oxide DSEs18 (these oxides will be discussed in detail in section
1.5.1).
Even though, boride eutectics have promising material properties that oxide eutectics
do not they have been studied to a much lesser degree. Processing difficulties associated
with the high melting temperature make it difficult to produce low porosity borides.
Although the advantages of oxide DSEs are that they are easily manufactured, have good
oxidation resistance, good strength-to-weight ratios, and high hardness, boride eutectics
also have good strength-to-weight ratios, and higher hardness and melting temperatures
than oxide eutectics. LaB6-ZrB2 DSE stands out above other DSEs with a very high
fracture toughness.25 Fracture toughness values from 8.7 to 27.8 MPa·m1/2 have been
reported. The validity of such high fracture toughness values should be questioned. The
loading conditions and crack geometry was not given with the higher values.25 However,
the high fracture toughness as compared to oxide DSEs has been reported by several
groups and thus warrants attention. The differences between oxides and non-oxide
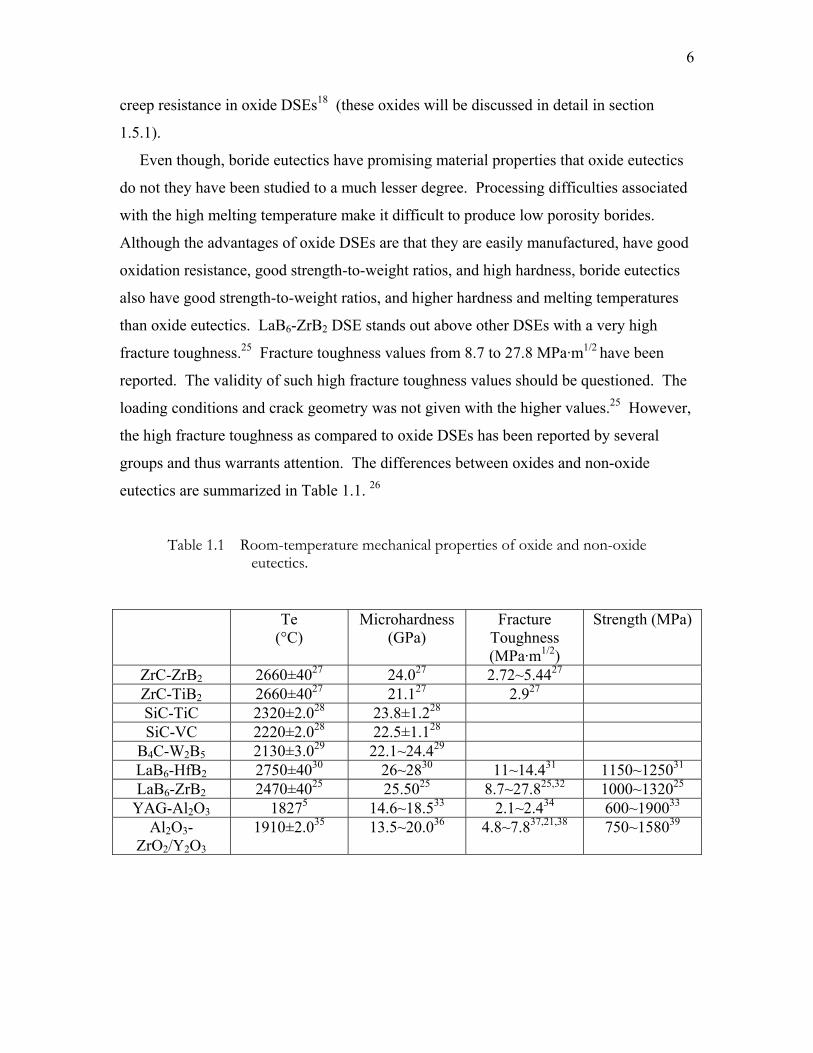
eutectics are summarized in Table 1.1. 26
Table 1.1 Room-temperature mechanical properties of oxide and non-oxide eutectics.
Te (°C)
Microhardness (GPa)
Fracture Toughness (MPa·m1/2)
Strength (MPa)
ZrC-ZrB2 2660±4027 24.027 2.72~5.4427 ZrC-TiB2 2660±4027 21.127 2.927 SiC-TiC 2320±2.028 23.8±1.228 SiC-VC 2220±2.028 22.5±1.128
B4C-W2B5 2130±3.029 22.1~24.429 LaB6-HfB2 2750±4030 26~2830 11~14.431 1150~125031 LaB6-ZrB2 2470±4025 25.5025 8.7~27.825,32 1000~132025
YAG-Al2O3 18275 14.6~18.533 2.1~2.434 600~190033 Al2O3-
ZrO2/Y2O3 1910±2.035 13.5~20.036 4.8~7.837,21,38 750~158039
7
1.3 DSE Processing
Several methods exist for processing directionally solidified eutectics. These methods
can be separated into two main types, unidirectional growth in a container and growth
from a melt which may use dies or be totally container-less. Two main types of container
growth methods are the Bridgman method and the Czocharalski method.18 Melting zone
methods include: floating zone, edge-defined film-fed growth, and micro pulling down
methods.18 In the float zone method, there are also several different methods of heating
the melt, which can affect material properties. Each method has advantages and
disadvantages. The DSE material studied in this thesis was processed using a floating
zone method, as described below, with induction heating by collaborators at the Institute
for Problems of Materials Sciences, Academy of Sciences of Ukraine, Ukraine.31
The first step in the floating zone method, as used in this study, is creating a molten
zone in a polycrystalline rod. The molten zone can be created with the use of lasers, an
electron beam, resistance heaters, or radio frequency induction. Second, a single crystal
seed rod of a certain orientation can be used to initiate controlled growth in the
orientation desired. Finally, the polycrystalline rod is pulled through the molten zone at a
predetermined rate. In Figure 1.1, Sorrell et al. have depicted a layout of a solidification
furnace used in the floating zone method.40

8
Figure 1.1 Diagram of a solidification furnace from ref.40
There are several advantages to choosing the floating zone processing method. First, is
the lack of crucible contamination. Second, is the ability to view the growth process “in-
situ”. Viewing the growth process can be done by using a laser shadow technique to
monitor the diameter of the molten zone41 or one can use a video camera to monitor the
crystal growth. The advantage of viewing the growth process “in-situ” is this information
can be used to measure the wetting angle41, which is important for insuring uniform crystal
growth. When the wetting angle is kept constant then uniform crystal growth is achieved.
A third advantage to the floating zone process is the ability to grow the eutectics with high-
temperature gradients; this enables higher growth rates that yield smaller interface
spacings.22,42 A final advantage is that many aspects of the growth process, including the
molten zone height (length is limited for stable growth to 2πR for the floating zone
method), pull rate (effects fiber diameter and spacing), wetting angle (effects uniformity of
rod growth diameter), and laser power distribution (important for thermal gradient) are
9
controllable.18,41 The main disadvantage of the floating zone method is size limitations of
the produced rod as a result of the relationship between thermal stresses and the large
thermal gradients that are necessary to produce the small interface spacing desired.18
Eutectics grown from a float zone process can have submicron microstructures, few if no
grain boundaries, reduced defects, and strong interface bonding, all of which contribute to
improved mechanical properties compared to other material compositions and growth
processes.21
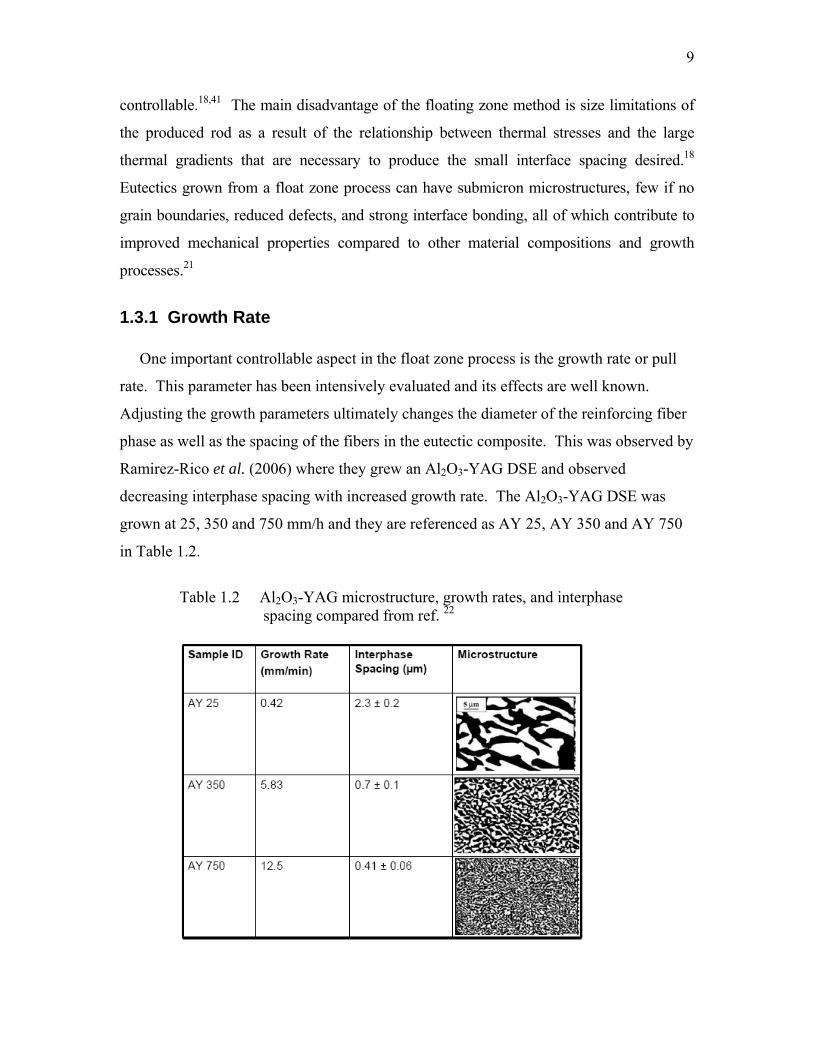
1.3.1 Growth Rate One important controllable aspect in the float zone process is the growth rate or pull
rate. This parameter has been intensively evaluated and its effects are well known.
Adjusting the growth parameters ultimately changes the diameter of the reinforcing fiber
phase as well as the spacing of the fibers in the eutectic composite. This was observed by
Ramirez-Rico et al. (2006) where they grew an Al2O3-YAG DSE and observed
decreasing interphase spacing with increased growth rate. The Al2O3-YAG DSE was
grown at 25, 350 and 750 mm/h and they are referenced as AY 25, AY 350 and AY 750
in Table 1.2.
Table 1.2 Al2O3-YAG microstructure, growth rates, and interphase
spacing compared from ref. 22
10
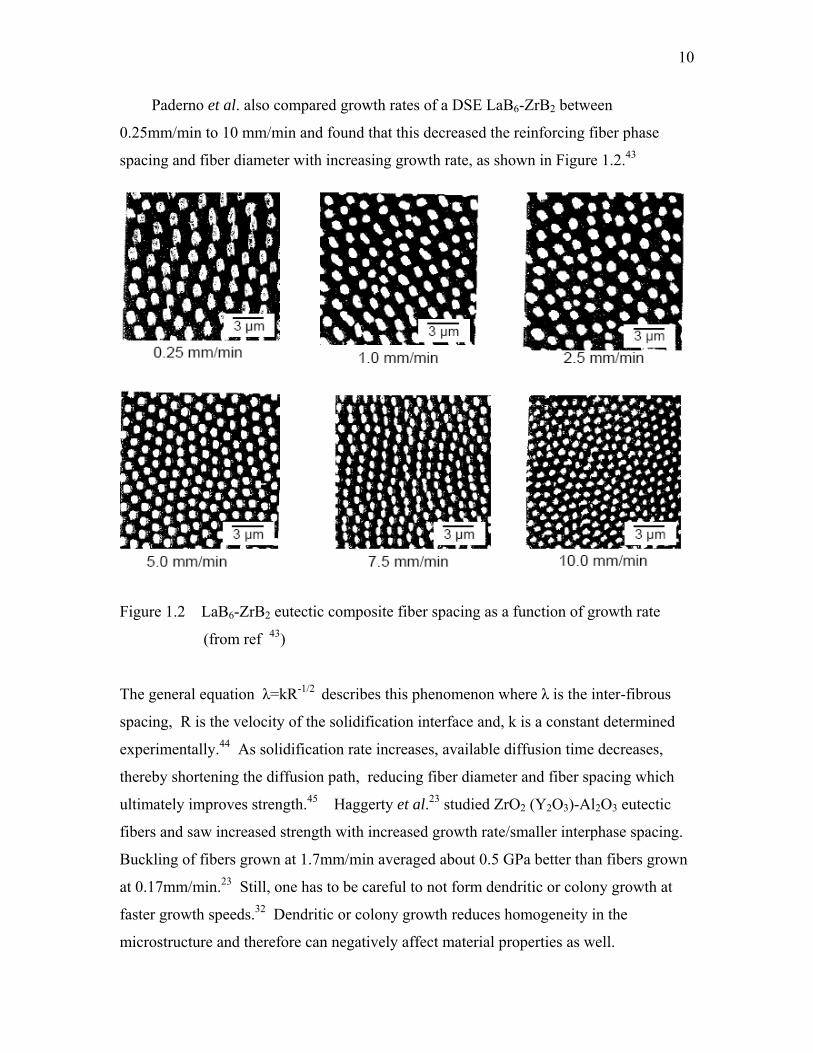
Paderno et al. also compared growth rates of a DSE LaB6-ZrB2 between
0.25mm/min to 10 mm/min and found that this decreased the reinforcing fiber phase
spacing and fiber diameter with increasing growth rate, as shown in Figure 1.2.43
Figure 1.2 LaB6-ZrB2 eutectic composite fiber spacing as a function of growth rate
(from ref 43)
The general equation λ=kR-1/2 describes this phenomenon where λ is the inter-fibrous
spacing, R is the velocity of the solidification interface and, k is a constant determined
experimentally.44 As solidification rate increases, available diffusion time decreases,
thereby shortening the diffusion path, reducing fiber diameter and fiber spacing which
ultimately improves strength.45 Haggerty et al.23 studied ZrO2 (Y2O3)-Al2O3 eutectic
fibers and saw increased strength with increased growth rate/smaller interphase spacing.
Buckling of fibers grown at 1.7mm/min averaged about 0.5 GPa better than fibers grown
at 0.17mm/min.23 Still, one has to be careful to not form dendritic or colony growth at
faster growth speeds.32 Dendritic or colony growth reduces homogeneity in the
microstructure and therefore can negatively affect material properties as well.

11
1.3.2 Phase Morphology In addition to the growth rate, the volume fraction of the constituent phases is another
parameter that has been intensively evaluated and the results of which are well known.
Whether or not the strengthening/minor phase is fibrous or lamellar depends
predominantly on the volume fraction of that phase. In 1964, Cooksey et al.46 established
a relationship between minimum interfacial energy and the morphology of the minor
eutectic phase. According to Cooksey et al. 46, if the interfacial energy per unit area is
equivalent for the fibrous/lamellar phases, then a fibrous minor phase is preferred at less
than 0.28 volume fraction, and for greater than 0.28 volume fraction lamellar
macrostructures are preferred. In 1966, Jackson and Hunt47 expanded on this relationship
by taking into account the anisotropy of the surface energy and undercooling.
Undercooling occurs during the solidification of two phases. When one phase is rejected
by another, the concentration of that phase ahead of the solidification then causes
undercooling in the liquid. This undercooling is controlled by eutectic concentration,
volume fraction of the minor phase, inter-lamellar and inter-fiber spacing, and growth
rate.26 According to the Jackson and Hunt model, for isotropic interfacial free energies, a
rod (fiber) structure is preferred at volume fractions below 0.32. However if the surface
energy is more than 25% anisotropic then lamellar structures are preferred regardless of
volume fraction.47 In 1981, Stubican and Bradt13 evaluated both the Cooksey and
Jackson and Hunt models and determined that most eutectics obey the trends however;
there are some exceptions. The minor phase volume fraction of ZrB2 in the LaB6-ZrB2
eutectic is about 20% and a reinforcing ZrB2 fibrous phase is observed.43
1.4 LaB6-ZrB2 Eutectic
The LaB6-ZrB2 eutectic grown from the float zone process is a candidate for the high-
temperature applications discussed in section 1.1. The LaB6-ZrB2 eutectic studied is a
directionally solidified material grown with the floating zone method and, as covered in
sections 1.2 and 1.3, the growth rate and volume fraction were controlled to give a
12
material with the desired microstructure. The resulting LaB6-ZrB2 eutectic has a
composition of nominally 80 wt% LaB6 and 20 wt% ZrB2. The microstructure is
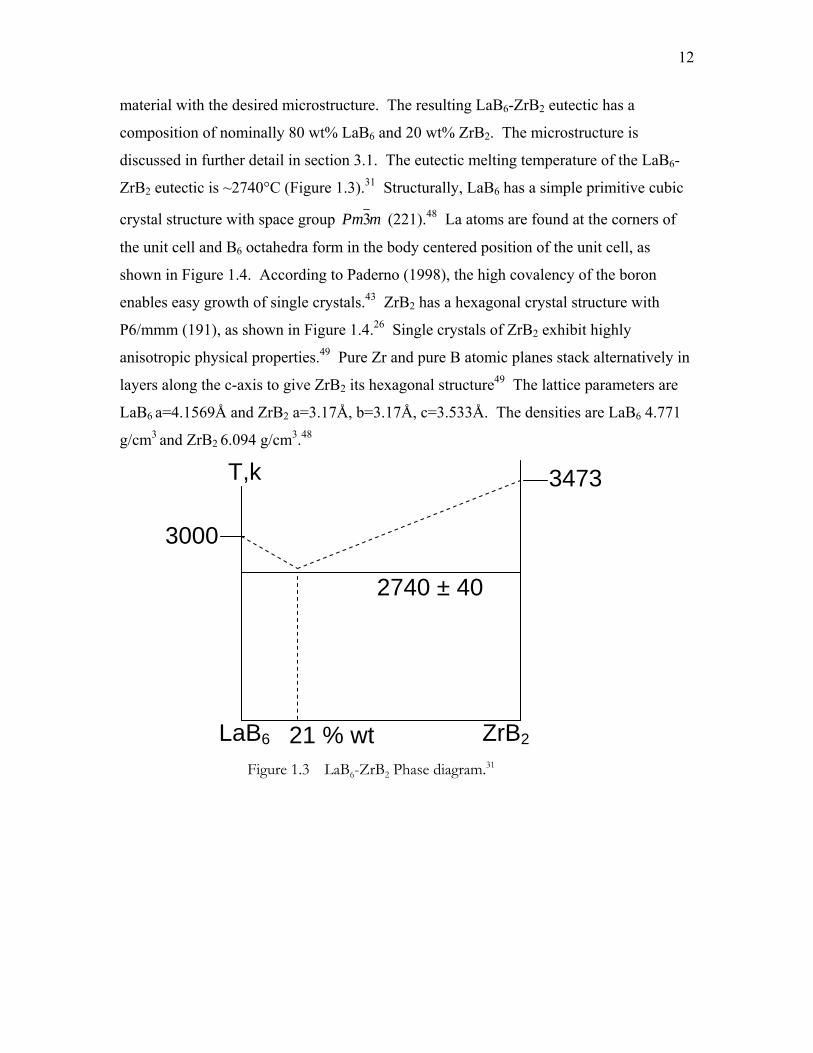
discussed in further detail in section 3.1. The eutectic melting temperature of the LaB6-
ZrB2 eutectic is ~2740°C (Figure 1.3).31 Structurally, LaB6 has a simple primitive cubic
crystal structure with space group mPm3 (221).48 La atoms are found at the corners of
the unit cell and B6 octahedra form in the body centered position of the unit cell, as
shown in Figure 1.4. According to Paderno (1998), the high covalency of the boron
enables easy growth of single crystals.43 ZrB2 has a hexagonal crystal structure with
P6/mmm (191), as shown in Figure 1.4.26 Single crystals of ZrB2 exhibit highly
anisotropic physical properties.49 Pure Zr and pure B atomic planes stack alternatively in
layers along the c-axis to give ZrB2 its hexagonal structure49 The lattice parameters are
LaB6 a=4.1569Å and ZrB2 a=3.17Å, b=3.17Å, c=3.533Å. The densities are LaB6 4.771
g/cm3 and ZrB2 6.094 g/cm3.48
Figure 1.3 LaB6-ZrB2 Phase diagram.31
LaB6 ZrB2
T,k
2740 ± 40
21 % wt
3000
3473

13
Figure 1.4 LaB6 and ZrB2 models modified from ref.26
Previous research supports our choice of DSE and helps establish its potential as an
ultra-high-temperature material. For example, Paderno et al.31 processed directionally
solidified LaB6-ZrB2 by the RF floating zone process. They chose this particular
composite for several reasons. 1) The MeB6 phase is one of the most thermodynamically
stable phases formed that rare earth or f- transition metals make; 2) for the d-transition
metals MeB2 is the most thermodynamically stable phase; 3) the boron sublattices in
both structures have similar values of atomic spacing, leading them to believe that their
association is possible during the process of combined solidification in the eutectic31 The
boride phases are not markedly mutually soluble due to differences in the electronic
shells of the d- (Zr) and f-(La) transition metals, which results in different chemical
bonding and crystal symmetry of the boride phases.31 The boron bond lengths in the
LaB6 (intra-octahedral) and ZrB2 are very close, 0.1765nm, and 0.1829nm respectively;
4) a final factor was the attractive thermo-emissive properties of LaB6. In conclusion
LaB6-ZrB2 was chosen because it should be thermodynamically and mechanically stable
and has attractive thermo-emissive properties.43 Paderno observed that during the
directional solidification of the composite in the <001> direction, the boron pairs in the
(110) LaB6 and (120) ZrB2 planes mutually join as shown in Figure 1.5.43 Paderno also
observed the )101( LaB6 was always parallel to )101( of ZrB2 regardless of the growth
14
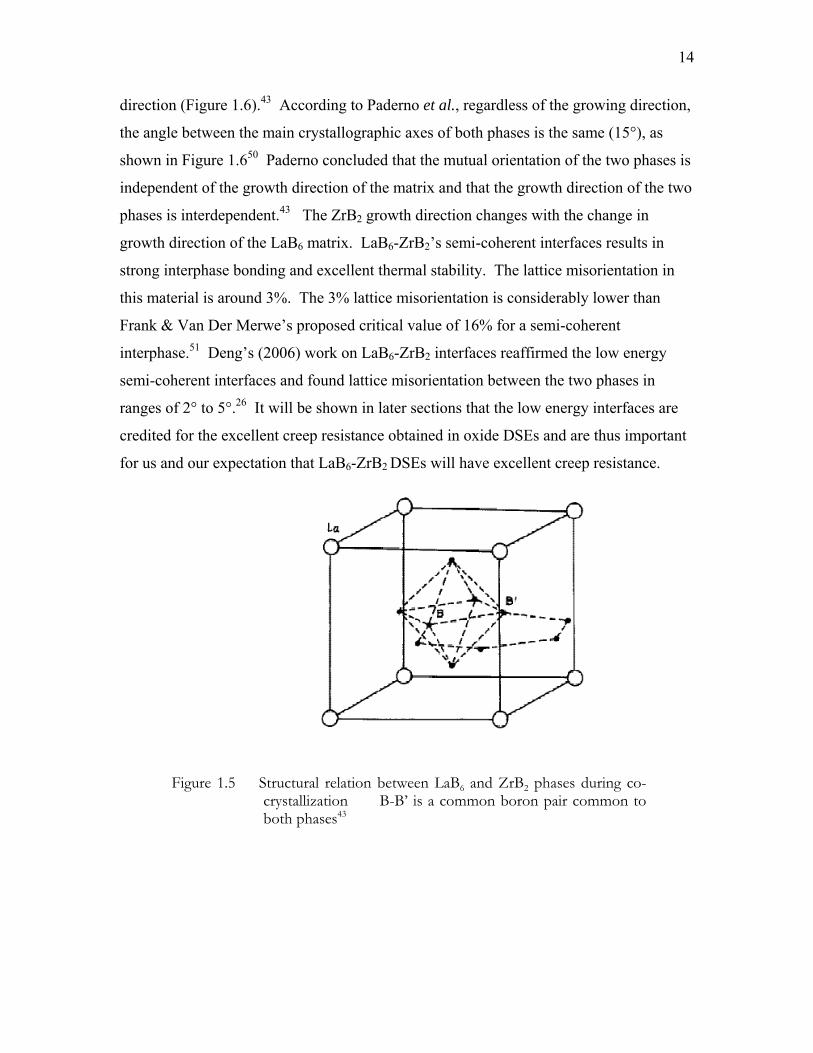
direction (Figure 1.6).43 According to Paderno et al., regardless of the growing direction,
the angle between the main crystallographic axes of both phases is the same (15°), as
shown in Figure 1.650 Paderno concluded that the mutual orientation of the two phases is
independent of the growth direction of the matrix and that the growth direction of the two
phases is interdependent.43 The ZrB2 growth direction changes with the change in
growth direction of the LaB6 matrix. LaB6-ZrB2’s semi-coherent interfaces results in
strong interphase bonding and excellent thermal stability. The lattice misorientation in
this material is around 3%. The 3% lattice misorientation is considerably lower than
Frank & Van Der Merwe’s proposed critical value of 16% for a semi-coherent
interphase.51 Deng’s (2006) work on LaB6-ZrB2 interfaces reaffirmed the low energy
semi-coherent interfaces and found lattice misorientation between the two phases in
ranges of 2° to 5°.26 It will be shown in later sections that the low energy interfaces are
credited for the excellent creep resistance obtained in oxide DSEs and are thus important
for us and our expectation that LaB6-ZrB2 DSEs will have excellent creep resistance.
Figure 1.5 Structural relation between LaB6 and ZrB2 phases during co-crystallization B-B’ is a common boron pair common to both phases43

15
Figure 1.6 Diffraction diagram with the typical observation of alignment of
)101( LaB6 parallel to )101( of ZrB2 in LaB6-ZrB2 DSE from references 43,26
1.5 Creep and Impression Creep Background
1.5.1 History of Creep One main criterion used in this study to evaluate materials and their stability in high-
temperature applications over time is creep. Creep is the study of the time-dependent
deformation under constant loading and is currently used by engineers to establish
whether or not a material is suitable for an application.
The first studies in creep were in metallic systems. The earliest testing of creep in
materials seems to be work performed in 1830 by Vicat.52 Vicat tested tensile creep of
iron wire for a time of 33 months. In 1903, Phillips reported on room temperature tensile
creep of glass, rubber and various metal wires (Copper, Platinum, Silver, and Gold). 53 In
1910, Andrade reported on the creep of lead in tension.54 Extensive creep data is
available on the creep of metals.
Creep studies in ceramics were slow to evolve as ceramics were thought of as
having thermal shock issues and of being brittle.55 Most researchers felt ceramics were

16
not viable options for high-temperature applications. The earliest ceramics were
investigated in 1957, when Wachtman et al. studied high-temperature slip systems and
creep rates in single crystal sapphire, rutile, quartz, and periclase up to 1100°C by three
point bending.56 Then, in the late seventies to early eighties creep interests in ceramics
increased due to the realization that ceramics had some unique and desirable properties.55
In 1977, Chu et al. were the first to perform impression creep testing.57 They chose to
study polycrystalline succinonitrile (C2H4(CN)2) due to its low melting temperature
(57°C) and atmospheric stability. Impression creep has been used to study various
materials such as glasses, ceramics, ionic crystals, polymers, metals and alloys that
exhibit super plasticity, including Pb-Sn and Zn-Al eutectic alloys, and welds of
aluminum, Ti alloys, and various types of steel.58
1.5.2 Impression creep method
Impression creep utilizes a small indenter under load to penetrate the surface of a
specimen. A flat-ended indenter with a constant load is used so that steady state data is
more easily interpreted (Figure 1.7). There are several important parameters that should
be controlled when running impression creep tests. First, Chen and Li investigated
specimen size effects on impression creep data and determined that the required specimen
thickness to reduce size effects on creep is 5x the diameter of the punch.59 Second, one
must ensure that the specimen, ram and punch are aligned evenly to avoid failure of the
punch and to ensure that stress remains constant. Finally, one must have the ability to
heat the samples high enough to initiate creep but also ensure that temperature fluctuation
and variation is minimal.
Impression creep has several distinct advantages as compared to conventional
compression creep testing. First, the sample is simple to prepare. The main parameters
controlled prior to testing are ensuring that samples are flat and parallel, and have a
uniform polished surface finish. The sample should be surface ground square and then
polished to at least 1µm to reduce any surface effects. Secondly, a small area can be
investigated, which is advantageous for studying material where sample size is limited.
This also enables multiple creep tests on a single specimen for applications where the

17
sample number is limited. A third benefit is localized testing of specific areas of the
sample. Finally due to the constant applied stress of the flat indenter, the data is easy to
analyze.
Figure 1.7 A solid punch of cross-section A is impressed onto the surface of a sample material under load L. L/A= punching stress. h is the depth of the impression. dh/dt= creep rate during steady state. (from ref. 58 )
LaB6-ZrB2 DSEs have potentially very good high-temperature properties based on
what is known of the room-temperature properties. LaB6-ZrB2 DSEs yield excellent
fracture toughness values, melting temperatures above 3000 ºC , high thermal
conductivity, high strength at high temperatures, modest thermal expansion, and good
thermal shock resistance.15 Obtaining impression creep data would provide high-
temperature deformation data that is lacking in refractory borides. Transmission Electron
Microscope (TEM) evaluation under the impression can yield information on dislocation
densities, interface structure and defects, and dominant slip systems as a function of load
and orientation.
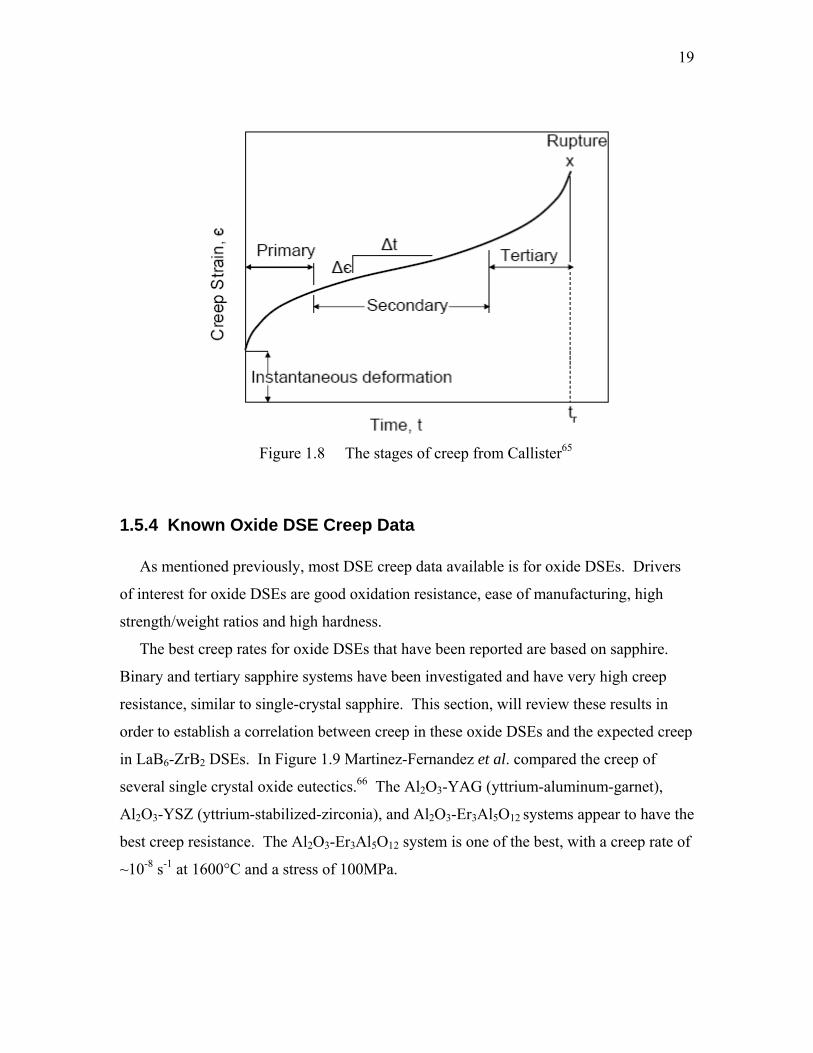
1.5.3 Stages of Creep Most materials have three distinct stages of creep (Figure 1.8). In primary creep, the
material goes through strain hardening which increases the material’s resistance to creep.
This primary stage is depicted by a decreasing creep rate. At some point there is a
mixture of strain hardening and recovery which is depicted as a steady-state region in the
curve. This secondary creep stage is typically the longest stage and the one of most

18
interest. The creep rate at this stage is often considered when an engineer decides
whether or not a material is suitable for an application. The third stage is characterized
by a sudden increase in creep rate and often happens just before final fracture of the
material. However, not all materials exhibit tertiary creep. The secondary steady-state
stage of creep is used in this study to evaluate a LaB6-ZrB2 DSE material for uses in
high-temperature applications.
The steady-state creep rate is usually characterized by the Norton equation60:
έ = Aσn exp(-Q/RT) (4)
In the Norton equation where έ is the steady state creep (strain) rate, A is an empirical
constant (dependent on temperature), σ is the applied creep stress, n is a dimensionless
stress exponent, Q is the activation energy for creep, R is the gas constant, and T is
absolute temperature. From a plot of strain versus time for various temperatures and
pressures one can determine the stress exponent n, the activation energy Q, creep
constant k, as well as determine strain rates.61
When characterizing deformation mechanisms and creep in materials most engineers
refer to the activation energy and the stress exponent to characterize the material. Stress
exponents of 1 are indicative of Nabarro-Herring or Coble creep.62 Nabarro- Herring and
Coble creep refer to pure diffusion-type deformation. Polycrystalline materials typically
have stress exponent around 1 due to diffusion along grain boundaries. Stress exponents
from about 2-3 are indicative of a mixed mode type deformation that includes
contributions from diffusion and dislocation creep.62 The best creep rates for oxide DSEs
that have been reported are based on sapphire. Al2O3-YAG DSE has been reported to
have stress exponents in the mixed mode range.22,63 Sapphire-based oxide DSEs will be
discussed further in the next section. Stress exponents above 3 are indicative of pure
dislocation type creep mechanisms.62 A stress exponent above three is typical for single
crystals.64
19
Figure 1.8 The stages of creep from Callister65
1.5.4 Known Oxide DSE Creep Data As mentioned previously, most DSE creep data available is for oxide DSEs. Drivers
of interest for oxide DSEs are good oxidation resistance, ease of manufacturing, high
strength/weight ratios and high hardness.
The best creep rates for oxide DSEs that have been reported are based on sapphire.
Binary and tertiary sapphire systems have been investigated and have very high creep
resistance, similar to single-crystal sapphire. This section, will review these results in
order to establish a correlation between creep in these oxide DSEs and the expected creep
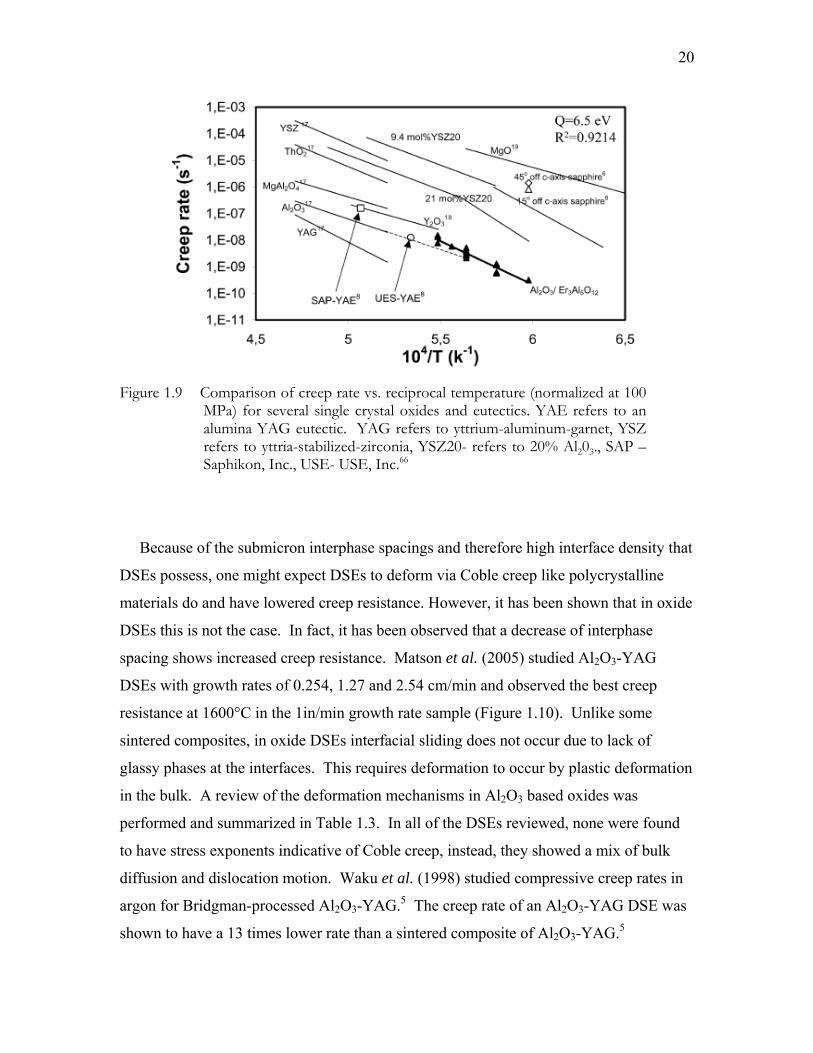
in LaB6-ZrB2 DSEs. In Figure 1.9 Martinez-Fernandez et al. compared the creep of
several single crystal oxide eutectics.66 The Al2O3-YAG (yttrium-aluminum-garnet),
Al2O3-YSZ (yttrium-stabilized-zirconia), and Al2O3-Er3Al5O12 systems appear to have the
best creep resistance. The Al2O3-Er3Al5O12 system is one of the best, with a creep rate of
~10-8 s-1 at 1600°C and a stress of 100MPa.
20
Figure 1.9 Comparison of creep rate vs. reciprocal temperature (normalized at 100 MPa) for several single crystal oxides and eutectics. YAE refers to an alumina YAG eutectic. YAG refers to yttrium-aluminum-garnet, YSZ refers to yttria-stabilized-zirconia, YSZ20- refers to 20% Al203., SAP – Saphikon, Inc., USE- USE, Inc.66
Because of the submicron interphase spacings and therefore high interface density that
DSEs possess, one might expect DSEs to deform via Coble creep like polycrystalline
materials do and have lowered creep resistance. However, it has been shown that in oxide
DSEs this is not the case. In fact, it has been observed that a decrease of interphase
spacing shows increased creep resistance. Matson et al. (2005) studied Al2O3-YAG
DSEs with growth rates of 0.254, 1.27 and 2.54 cm/min and observed the best creep
resistance at 1600°C in the 1in/min growth rate sample (Figure 1.10). Unlike some
sintered composites, in oxide DSEs interfacial sliding does not occur due to lack of
glassy phases at the interfaces. This requires deformation to occur by plastic deformation
in the bulk. A review of the deformation mechanisms in Al2O3 based oxides was
performed and summarized in Table 1.3. In all of the DSEs reviewed, none were found
to have stress exponents indicative of Coble creep, instead, they showed a mix of bulk
diffusion and dislocation motion. Waku et al. (1998) studied compressive creep rates in
argon for Bridgman-processed Al2O3-YAG.5 The creep rate of an Al2O3-YAG DSE was
shown to have a 13 times lower rate than a sintered composite of Al2O3-YAG.5
21
Activation energies of 670-905 kJ/mol and stress exponents around 5-6 were ascertained.
Waku et al. did not go into detail about deformation mechanisms and referred to an
earlier work by Parthasarathy,67 who in 1993 studied the deformation of a Bridgman-
processed Al2O3-YAG material versus single crystal sapphire and YAG. Parthasarthy
discussed in some detail the possible deformation mechanisms and determined based on
the high stress exponents and activation energies that dislocation creep was the main
mechanism for deformation in the composite eutectic. Again, in another example of
improved creep resistance in Al2O3-based composite DSEs, Martinez et al. showed that
an Al2O3/Er3Al5O12 DSE had better creep resistance than c-axis sapphire up to 1550°C
and 3 to 4 orders of magnitude better creep resistance as compared to 15° off-axis
sapphire (Figure 1.9).66 Another example of the improved mechanical properties of two
phase composite oxide DSEs vs single phase DSEs can be credited to clean and strong
low energy interfaces. Single crystal sapphire shows a reduction in strength at high
temperatures (above 600°C) where as Al2O3-YAG DSE systems retain their high-
temperature strength up to 1700°C.18 Improved creep resistance in composite oxide
DSEs was also shown by Sayir and Farmer (2002) in a creep study performed on
Al2O3/ZrO2(Y2O3) DSEs. They compared Al2O3/ZrO2(Y2O3) DSEs to an off-axis
sapphire and found the DSE composite to have superior creep resistance68. This
improved creep resistance in oxide DSE composites was credited to the low energy and
strong interface bonding in these materials.27,69,70
Deng26 (2006) characterized the interfaces in three LaB6-ZrB2 DSEs grown at different
growth rates by the float zone method by utilizing the TEM in conjunction with some
geometric modeling analysis. This study concluded that the interfaces in these LaB6-ZrB2
DSEs were relaxed and in low energy semi-coherent configurations. The excellent creep
resistance in oxide DSE composites has been attributed to low energy semi-coherent
interfaces so it is hypothesized that since the LaB6-ZrB2 DSEs have semi-coherent
interfaces that they will have excellent creep resistance, comparable to the properties of the
single crystal constituents.

22
Figure 1.10 Longitudinal cross-sections and creep data for a) 0.1 in/min Alumina/YAG
eutectic (AYE) grown by USE, Inc. b) 0.5 in/min AYE-USE and c) 1in/min AYE grown by Saphikon, Inc. The best creep resistance at 1600°C is observed in the faster 1in/min growth rate. Note the fiber rim is a different morphology than the fiber core.63
23
Table 1.3 Oxide DSE Creep Properties. Data from references - Ramirez-Rico 200622, Matson 200563, Waku 19985, Harada 200471, Yi 200614, Martinez 200172, Martinez 200366. LFZ (Laser Floating Zone), EFG (Edge-defined, Film-fed Growth)
Oxide DSEs Al2O3-YAG22 Al2O3-YAG63 Al2O3-YAG5 Al2O3-YAG71 Al2O3-ZrO2(Y2O3)14
(Al2O3-YSZ) Al2O3 -Er3Al5O12
72 (hypoeutectic) (10.75 mol % Er203)
Al2O3-Er3Al5O12
66 (eutectic) (19.5 mol % Er203)
Growth process LFZ EFG Bridgman Bridgman LFZ LFZ LFZ Microstructure Interlocked
(Chinese script)
Interlocked
(2.54mm/min)
Interlocked
Interlocked
colony/fibrous/lam
Transverse/Longitud.
Interlocked
Activation energy (kJ/mol)
720 ± 20 (5.82mm/min)
841-1275
670-905 800-1000 (200-350MPa)
300 338 ± 68 492
Creep Exp. (n) 0.08 mm/min 0.42 mm/min 5.83 mm/min 12.5 mm/min
1.3-3 MPa 5.8 430-600 2.8 200-350 2.1 100-200 1.3 50-175
3-12 5-6 5-10 Temp. 10.0 1723k 7.3 1773k 5.8 1873k 5.4 1973k
4-6 7.5-8.6 4-5
Load Type Compression Tensile Compression Compression Tension Tension Tension
Stress (MPa) 100
200,300,400 200,250,300,350 143 100 143
Creep rate (s-1) 1400°C 1500°C 1600°C 1700°C
Constant strain of 10-4 to 10-6
kept for all temps.
10-7.2 to 10-8.9 10-5.3 to 10-7.4 10-3.7 to 10-5.4 10-4.3
10-5.2 to 10-7.8 10-4.2 to 10-6.2 10-3 to 10-5
10-7.9 to 10-9.5 10-6.7 to 10-8.3
10-6.9 to 10-5.4
10-9 10-9,10-8
1350-10-9.6 1450-10-8.8 1550-10-8.2
10-8.2
10-7.5
Deformation Mechanism
Bulk diffusion Dislocation motion Both phases
Bulk diffusion in YAG, Dislocation in Sapphire. Orowan pile up and bow plausible explanation for high stress exponent. * Two vendors produced fibers. Highly aligned fibers grown at 25.4mm/min had the best creep rates.
The high stress exponent and high activations energy suggest dislocation creep mechanisms. They really didn’t go into much detail about it, and referenced earlier work by Parthasrathy 1993.
Controlled by dislocation motion in each phase. Induced by lattice diffusion. Confirmed by dislocation activity. Dislocations observed in both Phases with higher dislocation observed in sapphire
Diffusion controlled Pyramidal dislocations O diffusion in sapphire YSZ role secondary, remained dormant or underwent stress relaxation while sapphire deformed YSA act as obstacles to dislocation movement
Dislocation activity Controlled (strong interface bonding, large aspect ratio, high stress exponent)) *no TEM performed *larger diameter spacing
TEM-limited sapphire dislocations, no garnet dislocations. Diffusion controlled sliding at interface does not accommodate t- system deforms non-steady leads to overestimation of stress exponent *lower diameter spacing

24
1.5.5 Creep in Single-Crystal ZrB2 and LaB6
Creep in boride eutectics has not been examined as intensively due to the difficulties
with processing low porosity materials. The creep behavior of LaB6-ZrB2 DSEs has not
been published. In fact, very limited data exist on the creep of single crystal ZrB2 and
single crystal LaB6. No literature concerning compression creep, impression creep or
tensile creep of single crystal LaB6 was found. However, it is still important for this
study to understand what is known about deformation in the constituent phases of the
eutectic. One such study by Chen et al. in 2003 correlating the temperature and loading
time dependence of micro hardness to creep of single crystal LaB6 prepared by the
floating zone method was found. In this study, Vickers hardness was performed from
25ºC to 1000ºC. At 700ºC an inflection point was observed. Below 700ºC cracking was
observed which lead to a decrease in the accuracy of the hardness measurements. Above
700ºC no cracking was observed and Chen et al. reported decreased hardness with an
increase of loading time. According to Chen et al., this loading time dependence of
hardness indicates the occurrence of creep above 700ºC (Figure 1.11).73 As stated
previously, changes observed in the hardness data below 700ºC are not attributed to creep
and are discounted due to the unreliability of the hardness numbers because of cracking
of the indentations. The activation energy for creep was calculated to be about 343
kJ/mol from the following equation:
H-m = Ae-Q/RTt (5)
Where H is hardness, Q is the activation energy, R is the gas constant, T is temperature, t
is the loading time, and m and A are constants. This is the only study found on creep in
LaB6 single crystal and due to the cracking observed the occurrence of creep at these
temperatures is questionable.

25
Figure 1.11 Chen et al. 200373 Hardness vs. loading time at various temperatures.
Creep studies have been performed on ZrB2 single crystal and will be discussed in this
section. In 1971, Haggerty et al. reported on the plastic deformation of single crystal
ZrB2 grown by rf floating zone method.74 Plastic deformation was initiated by
compression creep at temperatures of 1490°, 2000°, and 2125° C. At temperatures of
1490°C and 2000°C failure occurred by brittle fracture. Slip on the basal plane was
achieved at 2125° C.74
In 2002, Melendez-Martinez et al. reported on the compression creep behavior of a
pressed polycrystalline ZrB2 (86.5% dense).75 Below 1400°C no deformation could be
measured. At 1400°C, a strain rate of ~6x10⁻⁸s-1 was measured under a stress of 298MPa.
At 1500°C, strain rates close to 10-7s-1 were obtained under stresses between 298 and
408MPa; finally, at 1600°C, a strain rate close to 2x10⁻⁷s-1 was obtained under
σ=220MPa. n=1.7 at 1500°C, n=0.6 at 1600°C. As stated previously stress exponents
around one are indicative of Nabarro-Herring or Coble creep diffusion-type deformation.
In summary, creep data are not available on LaB6-ZrB2 DSEs and limited data are
available on the single crystal monophases. Compression creep has been performed on
single crystal and polycrystalline ZrB2. With the polycrystalline ZrB2 sample, a strain
rate close to 2x10⁻⁷s-1 was obtained at 1600°C under σ=220MPa and a stress exponent of

26
n=0.6 was determined. In the single crystal ZrB2 sample deformation without fracture
could not be produced by compression creep until a temperature of 2125°C. These
results along with the creep data from oxide DSE studies again, give an indication that
LaB6-ZrB2 DSEs should exhibit very good creep resistance up to high temperatures.
1.6 Deformation Mechanisms
In addition to creep, examining deformation areas using TEM can give valuable
information with regards to dislocation types, and slip systems. Although deformation
and slip system studies have not been studied in LaB6-ZrB2 DSEs, indentation studies
have been performed on some similar diborides including single crystal ZrB2 as well as
single crystal LaB6.76,74,77,78,79,80,81,82 This thesis uses Vickers indentations to induce
deformation along with TEM for analysis. Some of the suggested slip systems found in
literature for these materials were not based on this type of deformation study, but rather
used anisotropy of hardness to determine the slip systems. In order to determine the slip
system in the material for this study and how it might deform, it is essential to review
these previous studies.
Vahldiek et al. (1977) reported on slip systems in the diborides, TiB2 and HfB2, that
were initiated by Knoop and Vickers indentations.76 These are relevant to ZrB2 slip
systems because Ti, Hf and Zr are all IVB metals and TiB2, HfB2 and ZrB2 all have AlB2-
crystal type lattices. Vahldiek et al. used transmission electron microscopy (TEM) to
evaluate dislocations under TiB2 indents. Dislocation pile-ups, stacking fault ribbons,
and wavy slip were observed (Figure 1.12, Figure 1.13). Wavy slip is defined as slip that
is curved, branched, broad and diffuse.83 Based on these results, it is probable that
dislocation pile-ups, stacking fault ribbons, and wavy slip will be observed in the LaB6-
ZrB2 DSE.
27
Figure 1.12 TEM of TiB2 showing slip (s) and dislocation pile-ups (d) on the (0001) plane of TiB2 single crystal.76
Figure 1.13 Wavy slip (s) and stacking fault ribbons (f) for TiB2.
76
28
Several groups have researched ZrB2 single crystal deformation. Haggerty et al.
(1971) reported on slip planes and Burgers vectors in a rf-heated float zone prepared
sample.74 Dislocations were observed in float zone processed samples, with dislocations
parallel to <1120>. Room-temperature Knoop microhardness at 600-g loads was used to
initiate deformation and evaluate possible slip systems. Slip was found in the prismatic
}0110{ plane.
In order to determine slip systems in single crystal materials, one can use the
anisotropy in hardness values. Brookes et al. (1971) aimed at establishing a clear
relationship between shear stress, hardness anisotropy, and slip systems for many
crystals.77 According to Brookes et al., the anisotropy of hardness for a crystal structure
can be directly related to its slip systems. Brookes et al. evaluated the equation for
effective resolved shear stress (τe) proposed by Daniels and Dunn84:
(1)
where, F is the applied force, A is the cross-sectional area of specimen, λ is the angle
between the stress axis and slip direction, φ is the angle between the stress axis and the
normal to the slip plane, ψ is the angle between the face of an adjacent facet and the axis
of rotation for a given slip. They determined that in order for the effective resolved shear
stress to be more accurate, one had to account for the rotational constraint of the rod
under an indent77 :
(2)
where, the bracketed () area accounts for rotational constraint. The modified equation
was verified with a magnesium oxide sample. Brookes et al. summarized in table form
the relationship between anisotropy of hardness and slip systems in single crystal
hexagonal crystal structures. Hexagonal crystals evaluated were Ti, Zr, SiC, Mg, Zn, Co,
29
Mo2C, and Al2O3. In the hexagonal crystals studied, the prismatic plane had the highest
degree of anisotropy. Two common sets of slip planes were identified in the hexagonal
crystals, 0211}0001{ and }0110{ 1021 . For Zr, the primary slip system
}0110{ 1021 was suggested (Table 1.4).
Table 1.4 Slip systems thought to control the hardness anisotropy in hexagonal structures.77
Knoop hardness number
)0001( )0101( )0211(
Crystal structure 0110 0211 0001 0211 0001 0101
Slip system* References
Ti h.c.p. 117 117 56 131
0211}0110{ 85
Ti h.c.p. 90 90 38
117
36 111 0211}0110{ 86
Ti h.c.p.
115 115 55 132
0211}0110{
87
Zr h.c.p. 271 264 115 198 112 198 0211}0110{ 88
SiC hex. 2917 2954 2027 2700 2321 2755 0211}0110{ 89
Mg h.c.p. 28 24 36 15
0211}0001{ 90
Mg h.c.p. 28 23 32 13
0211}0001{ 87
Zn h.c.p. 18 15 44 24
0211}0001{ 84
Co h.c.p.
250 180
0211}0001{ 91
Mo2C hex. 1580 1540
0211}0001{ 92
Al2O3 hex. 1300 1400 1800 1400
0211}0001{ This work
In 1972, Nakano et al., evaluated the hardness anisotropy in the single crystal IVa-
diborides at room temperature.78 They compared the hardness anisotropy of TiB2, ZrB2,
and HfB2 and found that the anisotropy in TiB2, ZrB2, and HfB2 were different. The
prismatic planes in TiB2 had the highest hardness and anisotropy. In ZrB2, the basal

30
plane had the highest hardness and anisotropy. However, the anisotropy between the
basal and prismatic planes was not big and was not as pronounced as it was for TiB2.
Also, the hardness anisotropy observed due to indenter direction was the opposite of
TiB2. HfB2 was the least anisotropic of the borides studied and the prismatic planes were
slightly higher in hardness than the basal. Nakano et al. used the modified Brookes et al.
effective shear stress equation to determine an anisotropy hardness number for each slip
system possible. Based on the calculated anisotropy factor, 1021}0110{ was
determined to be the major slip system for ZrB2. This suggested slip system is consistent
with the previously cited research.
In 1976, Nakano et al. calculated the major slip system operative in single crystal
ZrB2.79 The calculations were based on Knoop hardness anisotropy values between
temperatures of 20° to 1100° C. The major slip system based on these calculations was
believed to be 1021}0110{ . In 2002, Xuan et al. examined the high-temperature
hardness of a single crystal ZrB2 prepared by the floating zone method.80 Based on
inflection points of 400°C (0.19Tm) and 700°C (0.28Tm) Xuan et al. believe a single slip
system for ZrB2 as suggested by Nakano does not accurately reflect the inflection points
(sudden change in hardness) observed.80
In 1986, Aida et al. reported on slip systems and dislocation densities in single crystal
LaB6.81
Aida et al. grew different diameter rods (2.5, 3, 5mm) using a float zone process
heated by a xenon arc furnace. Due to the good emittance properties of the (100) plane,
rods were grown with no rotation, at a rate of 0.17mm/min in the <100> direction.81
Samples were mechanically cleaved perpendicular to the <100> growth direction, and
dislocation type and densities were studied by first etching the rods with a 1:1 HNO3:HCl
solution for 30 sec. Aida et al. observed that the larger the crystal diameter, the higher
the dislocation density. Another trend observed by Aida et al. was that dislocations were
highest in the core and decreased at the edge of the rods. A 5mm rod had dislocation
densities a magnitude higher in the core vs. the periphery. According to Aida et al.
higher dislocations in the core vs. the periphery could be explained by a much steeper
temperature gradient in the core vs. the periphery of the rod. Dislocation densities
between 106 and 105.4 cm-2 were observed in the 5 mm rod. An electrolytic technique was
used to analyze the dislocation directions. Based on the dislocation directions, it was
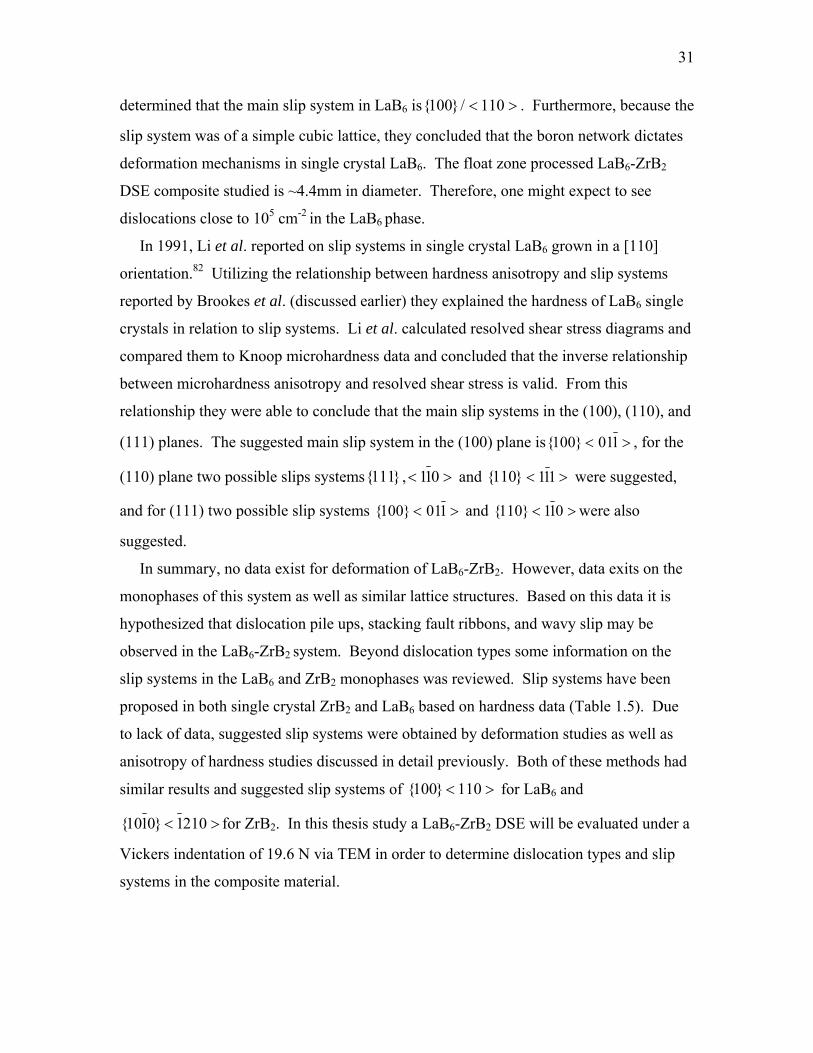
31
determined that the main slip system in LaB6 is 110/}100{ . Furthermore, because the
slip system was of a simple cubic lattice, they concluded that the boron network dictates
deformation mechanisms in single crystal LaB6. The float zone processed LaB6-ZrB2
DSE composite studied is ~4.4mm in diameter. Therefore, one might expect to see
dislocations close to 105 cm-2 in the LaB6 phase.
In 1991, Li et al. reported on slip systems in single crystal LaB6 grown in a [110]
orientation.82 Utilizing the relationship between hardness anisotropy and slip systems
reported by Brookes et al. (discussed earlier) they explained the hardness of LaB6 single
crystals in relation to slip systems. Li et al. calculated resolved shear stress diagrams and
compared them to Knoop microhardness data and concluded that the inverse relationship
between microhardness anisotropy and resolved shear stress is valid. From this
relationship they were able to conclude that the main slip systems in the (100), (110), and
(111) planes. The suggested main slip system in the (100) plane is 101}100{ , for the
(110) plane two possible slips systems }111{ , 011 and }110{ 111 were suggested,
and for (111) two possible slip systems 101}100{ and 011}110{ were also
suggested.
In summary, no data exist for deformation of LaB6-ZrB2. However, data exits on the
monophases of this system as well as similar lattice structures. Based on this data it is
hypothesized that dislocation pile ups, stacking fault ribbons, and wavy slip may be
observed in the LaB6-ZrB2 system. Beyond dislocation types some information on the
slip systems in the LaB6 and ZrB2 monophases was reviewed. Slip systems have been
proposed in both single crystal ZrB2 and LaB6 based on hardness data (Table 1.5). Due
to lack of data, suggested slip systems were obtained by deformation studies as well as
anisotropy of hardness studies discussed in detail previously. Both of these methods had
similar results and suggested slip systems of 110}100{ for LaB6 and
2101}0110{ for ZrB2. In this thesis study a LaB6-ZrB2 DSE will be evaluated under a
Vickers indentation of 19.6 N via TEM in order to determine dislocation types and slip
systems in the composite material.
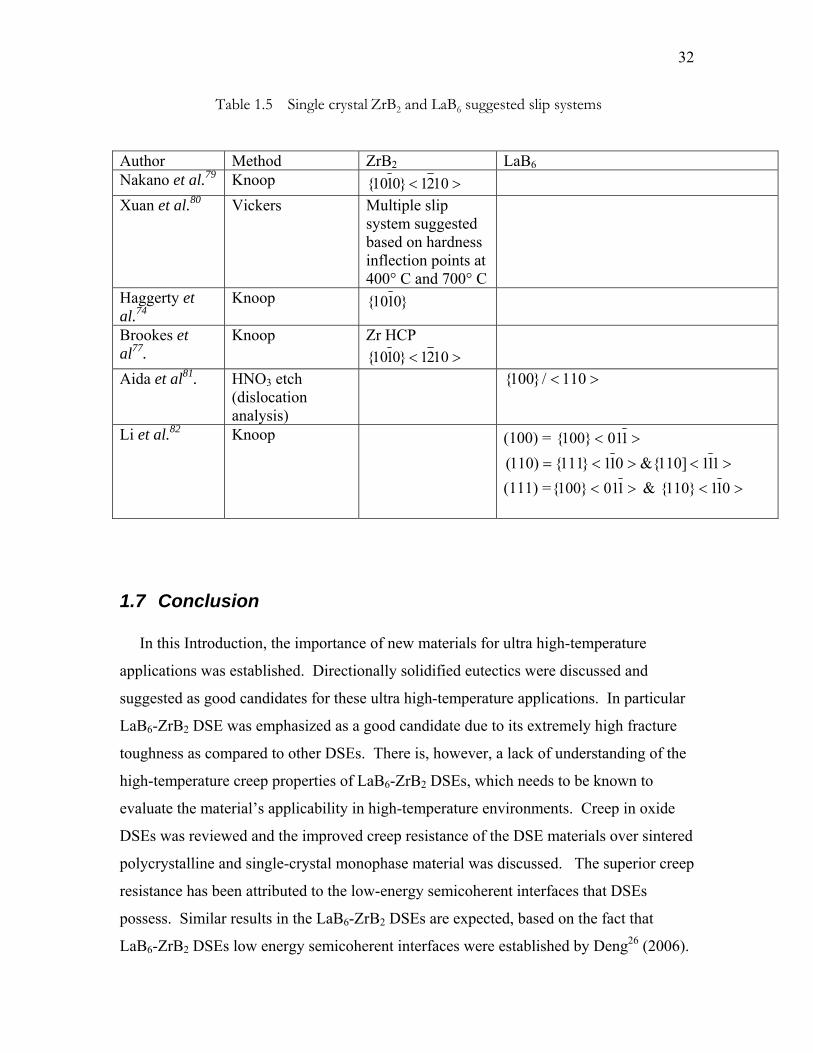
32
Table 1.5 Single crystal ZrB2 and LaB6 suggested slip systems
Author Method ZrB2 LaB6 Nakano et al.79 Knoop 1021}0110{
Xuan et al.80 Vickers Multiple slip system suggested based on hardness inflection points at 400° C and 700° C
Haggerty et al.74
Knoop }0110{
Brookes et al77.
Knoop Zr HCP 1021}0110{
Aida et al81. HNO3 etch (dislocation analysis)
110/}100{
Li et al.82 Knoop (100) = 101}100{
111]110&{011}111{)110(
(111) = 101}100{ & 011}110{
1.7 Conclusion In this Introduction, the importance of new materials for ultra high-temperature
applications was established. Directionally solidified eutectics were discussed and
suggested as good candidates for these ultra high-temperature applications. In particular
LaB6-ZrB2 DSE was emphasized as a good candidate due to its extremely high fracture
toughness as compared to other DSEs. There is, however, a lack of understanding of the
high-temperature creep properties of LaB6-ZrB2 DSEs, which needs to be known to
evaluate the material’s applicability in high-temperature environments. Creep in oxide
DSEs was reviewed and the improved creep resistance of the DSE materials over sintered
polycrystalline and single-crystal monophase material was discussed. The superior creep
resistance has been attributed to the low-energy semicoherent interfaces that DSEs
possess. Similar results in the LaB6-ZrB2 DSEs are expected, based on the fact that
LaB6-ZrB2 DSEs low energy semicoherent interfaces were established by Deng26 (2006).

33
More specifically, the best DSE oxide has a creep rate around 10-8 s-1 at 1600°C and
under a 100MPa stress.72 Based on the higher melting temperature and therefore stronger
bonding in the LaB6-ZrB2 DSEs (2467°C) vs. the oxide DSEs (1900°C) (Table 1.1), the
creep rate is expected to be greater than 10-8 s-1 at 1600°C and a 100MPa stress. In
research performed by Matson et al.63 in 2005, the best creep rate obtained was from an
oxide eutectic with an aligned microstructure similar to LaB6-ZrB2 DSE. According to
Matson et al., an aligned microstructure yields a larger diffusion path that makes
diffusion movement more difficult.63 Similar high activation energies, as were seen in
the oxide DSEs, indicative of dislocation mechanisms, are expected. For the stress
exponent, a stress exponent between 2 and 3 is expected.
34
2 Hypothesis and Objectives
Known room-temperature mechanical properties as well as high-temperature melting-
points, identify LaB6-ZrB2 directionally solidified eutectics as promising candidates for
ultra-high-temperature applications. Directionally solidified eutectic single-crystal LaB6-
ZrB2 eutectics are unique in that fracture toughness (>8.7 MPa·m1/2) 25, melting
temperature (2470 ± 40 Te)25 and micro-hardness (25.5 GPa)25 are extremely high.
Because of the excellent room-temperature properties of LaB6-ZrB2 eutectics, along with
strong covalent bonding and previous studies on oxide DSEs, it is expected that LaB6-
ZrB2 possesses excellent creep resistance. It is the objective of this thesis to measure the
creep behavior of LaB6-ZrB2 DSEs up to 1600°C. It is hypothesized that the semi-
coherent interfaces26 between the two phases will lead to a very creep resistant material,
better than its polycrystalline counterparts. In addition, the deformation mechanisms at
both room-temperature and high-temperature will be studied.
Room-temperature deformation will be initiated using Vickers indentation.
Deformation under the indent will be evaluated using FIB/SEM/TEM (Focused Ion
Beam/ Scanning Electron Microscope/Transmission Electron Microscope) techniques in
order to analyze dislocations and primary slip systems in the individual LaB6 and ZrB2
phases. Dislocation interaction between interphases will be evaluated by TEM.
Specifically, assessment will be done to determine whether or not dislocations originate
or end in the bulk matrix, and or originate at the interface of the fiber and matrix. High-
temperature creep will be performed using impression creep testing. Close monitoring of
deformation over time will be performed in order to determine creep rates at high-
temperature. Deformation mechanisms, dislocations, and slip systems will be evaluated
using FIB/SEM/TEM techniques. The results of this study should provide information
on the deformation mechanisms in composite directionally solidified boride eutectics and
help determine its applicability for ultra-high-temperature applications.

35
3 Room-Temperature Deformation Study
3.1 LaB6-ZrB2 Microstructure
A LaB6-ZrB2 DSE rod grown via a floating zone method was received from
collaborators at the Institute for Problems of Materials Sciences, Academy of Sciences of
Ukraine, Ukraine31. The Lab6-ZrB2 DSE rod “as received” was 152.4mm long and had a
diameter of 4.9mm. The outside of the rod had periodic striations and another periodic
defect referred to as “ripples” (Figure 3.1).41 It is believed that the ripples are damaged
areas resulting from overheating during growth.41 This is of some concern because
fracture has been linked back to these damaged areas.41 The second type of surface
periodicity referred to as “striations” are about 508 µm’s apart. Sayir et al. 1998
discussed the possible mechanisms and concluded that more research into the
mechanisms of the striations needed to be done.41 However, they proposed that the
striations could be a result of molten zone mechanical oscillations induced by processing
related disruptions.41
.
Figure 3.1 “As Received” LaB6-ZrB2 rod showing banding and ripples.

36
The microstructure can be characterized as having uniform areas of distributed ZrB2
fibers along with areas of significant banding (Figure 3.2).
Banded areas
20 um
ZrB2 fibers between banding
Diameter: 4.9 mm
10 uma)
b)
c)
Figure 3.2 Microstructure of as received LaB6-ZrB2 DSE rod. a) region showing cellular growth b) rod cross-section c) region showing homogeneous microstructure
Banding is a typical phenomenon observed in DSEs. Some other examples of where
banding has been observed, is in directionally solidified alumina-zirconia and alumina-
YAG.93 The banding observed in the LaB6-ZrB2 DSE has areas where the LaB6 matrix
phase occurs with little if any of the ZrB2 fibrous phase, as shown in Figure 3.2a. The
ZrB2 phase observed in this banding is of various diameters, widths and lengths. The
reason for this banding is not well understood. However, it does seem to be a general
consensus that the banding is related to temperature fluctuations during growth of the
rod.94,95,93,96 Deng et al. proposed that the source of LaB6-ZrB2 banding could be thermal
instabilities due to variation in the position of the induction coil.96
The size and volume fraction of ZrB2 fibers in the homogenous region was analyzed
utilizing Image J software. In the homogeneous areas (Figure 3.2 c) the average inter-
fiber distance is 1.1 ±0.4 µm, and the average fiber diameter is 0.7 ± 0.1 µm. The
volume fraction of the minor phase (ZrB2) in the homogenous region is ~18% which is
consistent with the suggested LaB6-ZrB2 phase diagram and a 17vol% for ZrB2 (Figure
1.3). The fiber diameter, volume fraction, and inter-fiber distance are all typical for a
LaB6-ZrB2 DSE.
37
In summary, the LaB6-ZrB2 DSE reviewed has a typical microstructure that has been
observed in previous LaB6-ZrB2 DSE samples.26,31 To further characterize the sample
prior to deformation studies, the as-processed sample defects, the orientation at the LaB6-
ZrB2 interface, and hardness are analyzed below.
3.2 Method
The LaB6-ZrB2 DSE samples were cut from the “as-received” rod with a low-speed
Buehler, Isomet diamond wafering saw parallel to the growth direction. Samples 7.6 mm
in length were cut from the rod using a low speed diamond saw. Two types of samples
were then prepared using a Grizzly Surface Grinder (Model 60567). In order to analyze
samples parallel and perpendicular to the growth direction samples were surface ground
parallel and perpendicular to the growth direction using a 150 grit diamond embedded
grinding wheel to ensure the sample ends were flat and parallel. Prior to analysis, the
surface ground LaB6-ZrB2 DSE samples were polished using a tripod holder and diamond
abrasive film. Samples were glued to the tripod holder using crystal bond adhesive. The
tripod holder consisted of three leveling feet which were used to level the sample prior to
polishing. Samples were successively polished with 30µm, 15µm, 9µm, 6µm, 3µm, and
1µm diamond embedded film purchased from Buehler. Between each step of polish,
samples were checked by optical microscopy for uniformity and also in the final step for
a smooth finish without scratches.
Samples were locally extracted from homogeneous areas of as-processed rods using a
FEI Quanta 200 3D, which combines a scanning electron microscope (SEM) with a
focused ion beam (FIB). In the first step prior to extracting a sample from the as-
processed rod, a protective tungsten deposit was applied in order to prevent damage to
the specimen from the beam. A 20µm x 2µm x10µm area of tungsten was deposited at a
beam current of 30keV and an ion current of 0.3 nA (Figure 3.3a).
After application of the protective layer, milling of a sample wedge was performed. A
wedge was used in order to protect the sides of the sample and also as an aid in
dislodging the sample. Once the wedge was cut free from the bulk of the sample by the
FIB, a tungsten probe with a tip radius of 0.5µm and a 13° taper angle was deposited to
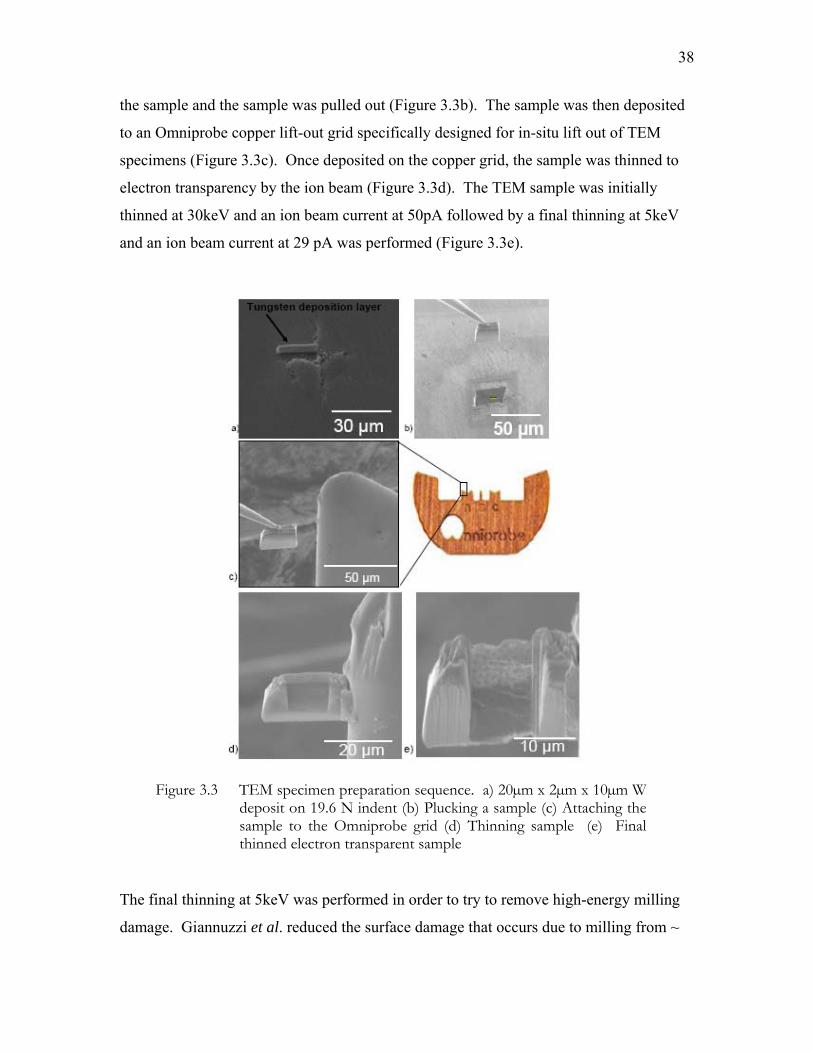
38
the sample and the sample was pulled out (Figure 3.3b). The sample was then deposited
to an Omniprobe copper lift-out grid specifically designed for in-situ lift out of TEM
specimens (Figure 3.3c). Once deposited on the copper grid, the sample was thinned to
electron transparency by the ion beam (Figure 3.3d). The TEM sample was initially
thinned at 30keV and an ion beam current at 50pA followed by a final thinning at 5keV
and an ion beam current at 29 pA was performed (Figure 3.3e).
Figure 3.3 TEM specimen preparation sequence. a) 20µm x 2µm x 10µm W deposit on 19.6 N indent (b) Plucking a sample (c) Attaching the sample to the Omniprobe grid (d) Thinning sample (e) Final thinned electron transparent sample
The final thinning at 5keV was performed in order to try to remove high-energy milling
damage. Giannuzzi et al. reduced the surface damage that occurs due to milling from ~
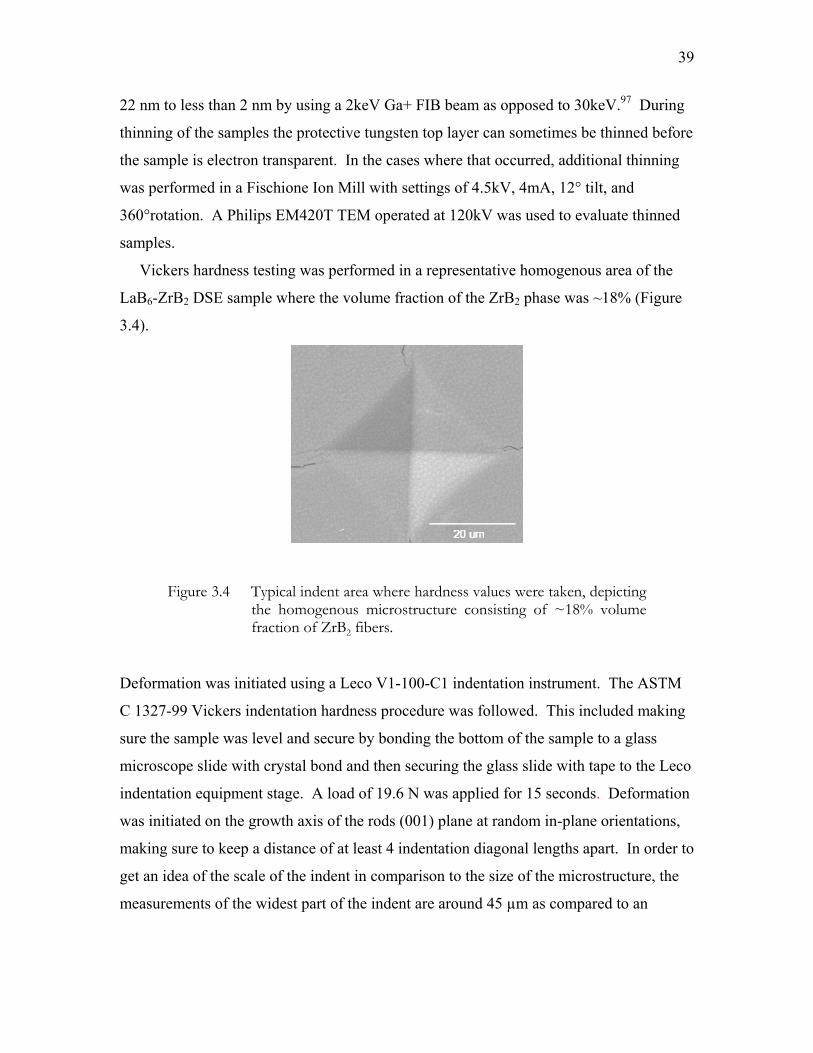
39
22 nm to less than 2 nm by using a 2keV Ga+ FIB beam as opposed to 30keV.97 During
thinning of the samples the protective tungsten top layer can sometimes be thinned before
the sample is electron transparent. In the cases where that occurred, additional thinning
was performed in a Fischione Ion Mill with settings of 4.5kV, 4mA, 12° tilt, and
360°rotation. A Philips EM420T TEM operated at 120kV was used to evaluate thinned
samples.
Vickers hardness testing was performed in a representative homogenous area of the
LaB6-ZrB2 DSE sample where the volume fraction of the ZrB2 phase was ~18% (Figure
3.4).
Figure 3.4 Typical indent area where hardness values were taken, depicting the homogenous microstructure consisting of ~18% volume fraction of ZrB2 fibers.
Deformation was initiated using a Leco V1-100-C1 indentation instrument. The ASTM
C 1327-99 Vickers indentation hardness procedure was followed. This included making
sure the sample was level and secure by bonding the bottom of the sample to a glass
microscope slide with crystal bond and then securing the glass slide with tape to the Leco
indentation equipment stage. A load of 19.6 N was applied for 15 seconds. Deformation
was initiated on the growth axis of the rods (001) plane at random in-plane orientations,
making sure to keep a distance of at least 4 indentation diagonal lengths apart. In order to
get an idea of the scale of the indent in comparison to the size of the microstructure, the
measurements of the widest part of the indent are around 45 µm as compared to an
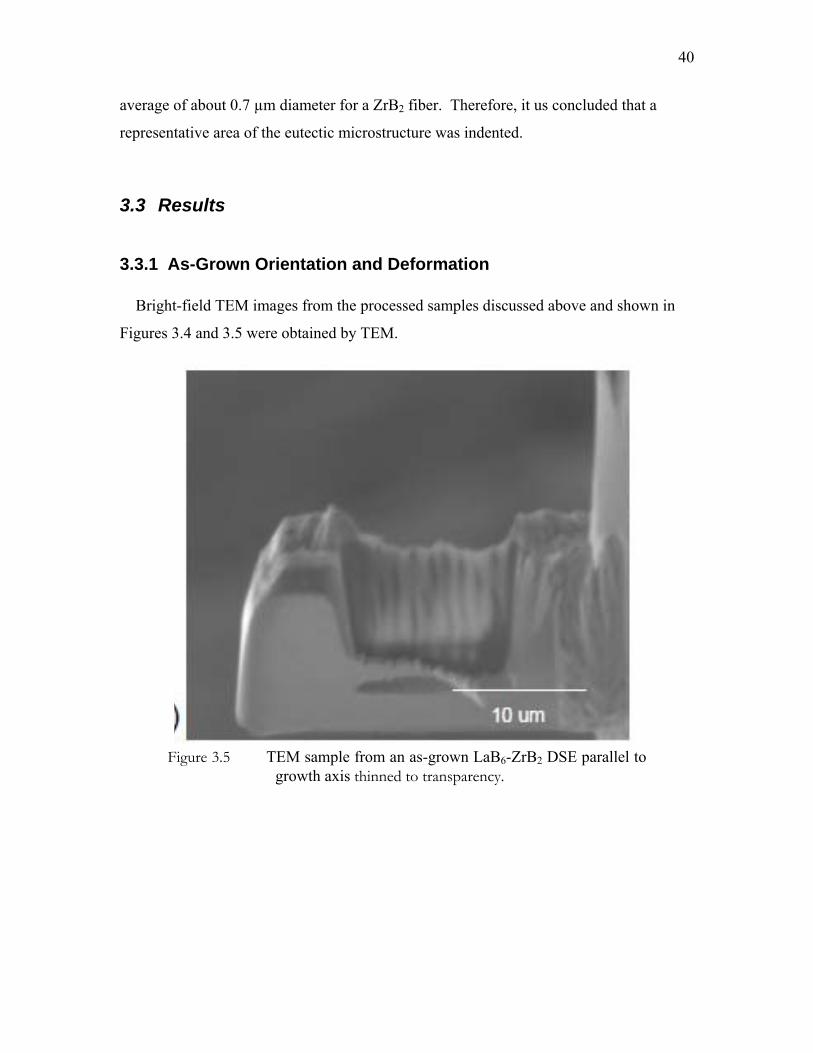
40
average of about 0.7 µm diameter for a ZrB2 fiber. Therefore, it us concluded that a
representative area of the eutectic microstructure was indented.
3.3 Results
3.3.1 As-Grown Orientation and Deformation Bright-field TEM images from the processed samples discussed above and shown in
Figures 3.4 and 3.5 were obtained by TEM.
Figure 3.5 TEM sample from an as-grown LaB6-ZrB2 DSE parallel to
growth axis thinned to transparency.
500 nm

41
Figure 3.6 TEM sample from an as-grown LaB6-ZrB2 DSE perpendicular to growth axis thinned to electron transparency.
Samples parallel and perpendicular to the growth orientation were tilted over a wide
angular range to find dislocations; however, none were observed (Figure 3.7). This is
surprising because directionally solidified samples prepared by the floating zone process
typically have some as-processed dislocations.26,74,81 One such example of as-processed
float zone grown LaB6-ZrB2 DSE rods with dislocations can be seen in observations
made by Deng26 in unpublished data where dislocations were observed in an as received
LaB6-ZrB2 DSE rod (Figure 3.8). Dislocations are observed in the ZrB2 fibers as well as
the LaB6 matrix. Reasons for this difference can be attributed to possible differences in
growth conditions, growth rate, and temperature gradient and therefore related to the
flatness of the solid/liquid interface.

42
Figure 3.7 TEM micrographs of an as-grown LaB6-ZrB2 DSE with no dislocations observed, contrast is due to bend contours. a) Parallel to growth axis. b) Perpendicular to growth axis
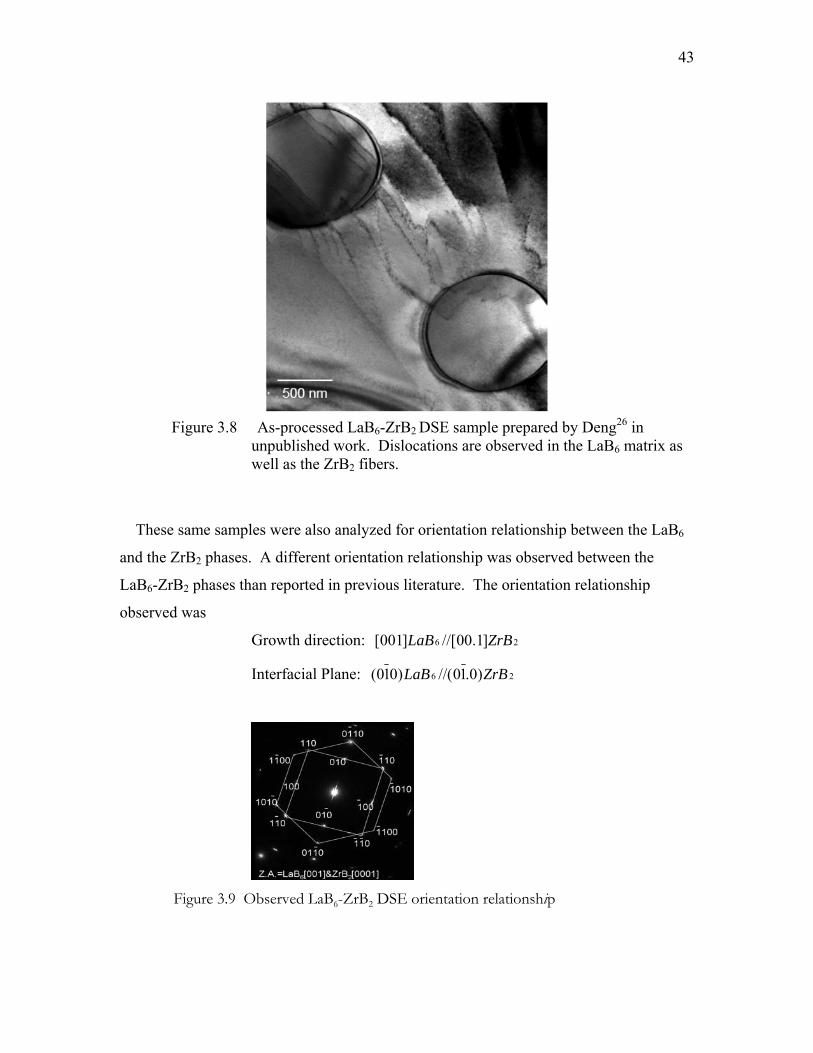
43
Figure 3.8 As-processed LaB6-ZrB2 DSE sample prepared by Deng26 in
unpublished work. Dislocations are observed in the LaB6 matrix as well as the ZrB2 fibers.
These same samples were also analyzed for orientation relationship between the LaB6
and the ZrB2 phases. A different orientation relationship was observed between the
LaB6-ZrB2 phases than reported in previous literature. The orientation relationship
observed was
Growth direction: 26 ]1.00//[]001[ ZrBLaB
Interfacial Plane: 26 )0.10//()010( ZrBLaB
Figure 3.9 Observed LaB6-ZrB2 DSE orientation relationship

44
In 1995 Paderno et al. reported on a LaB6-ZrB2 grown by induction zone melting. In
1998 Chen et al. grew a LaB6-ZrB2 eutectic using an electron beam zone heating
technique. In 2004 Deng et al. investigated a LaB6-ZrB2 grown by the Paderno group
using induction zone melting. The orientation relationship observed in all cases was
Growth direction: 26 ]1.00//[]001[ ZrBLaB
Interfacial Plane: 26 )0.11//()110( ZrBLaB
Figure 3.10 Deng et al. observed LaB6-ZrB2 orientation relationship96
In both cases, the growth axis is the same, but the in-plane orientation varies by 15 degrees.
The orientation relationship difference observed between this DSE LaB6-ZrB2 and previous
DSE LaB6-ZrB2 samples discussed in literature could, in principle, result in different
deformation mechanisms between the ZrB2 fibers and the LaB6 matrix as compared to the
samples discussed in the literature due to slip systems being aligned differently. This is not
discussed in detail in this thesis.

45
3.3.2 Hardness The average Vickers hardness values obtained for 8 randomly applied loads of
19.6 N for 15s was 20.2 GPa in the longitudinal section (perpendicular to growth axis
Figure 3.11) and 18.0 GPa in the transverse section (Figure 3.11). This is lower than
values obtained from literature (Table 3.1).
Figure 3.11 Illustration of c axis and longitudinal orientations of theLaB6-ZrB2 DSE sample used for hardness evaluation.
Table 3.1 Vickers hardness values for LaB6-ZrB2 DSE. Vm equals volume fraction of the LaB6 matrix phase and FD equals the ZrB2 fiber diameter.
Hardness (GPa) Sample ID Transverse section
Longitudinal section
Load Microstructure
This Work LaB6-ZrB2
DSE 18.0 ± 0.75 20.2 ± 1.8 19.6 N FD=0.7µm ± 0.1
Vm= 0.18
Deng98 LaB6-ZrB2
DSE 22.6 ± 0.7 21.7 ± 0.6 9.8 N FD=0.6µm
Vm= 0.18 Chen et al.20 LaB6-ZrB2
DSE 31.4 28.8 19.6 N FD=0.2 to 1.2µm
Vm= 0.2 Paderno et al.25 LaB6-ZrB2
DSE 25.5 (orientation unknown) Unknown Vm= 0.2
Monteverde et al.99 Melendez et al.75
ZrB2 (poly) 8.7±0.4 9.8 N NA
Ordanyan et al.30 LaB6 Single Crystal
26±0.6 NA unknown unknown
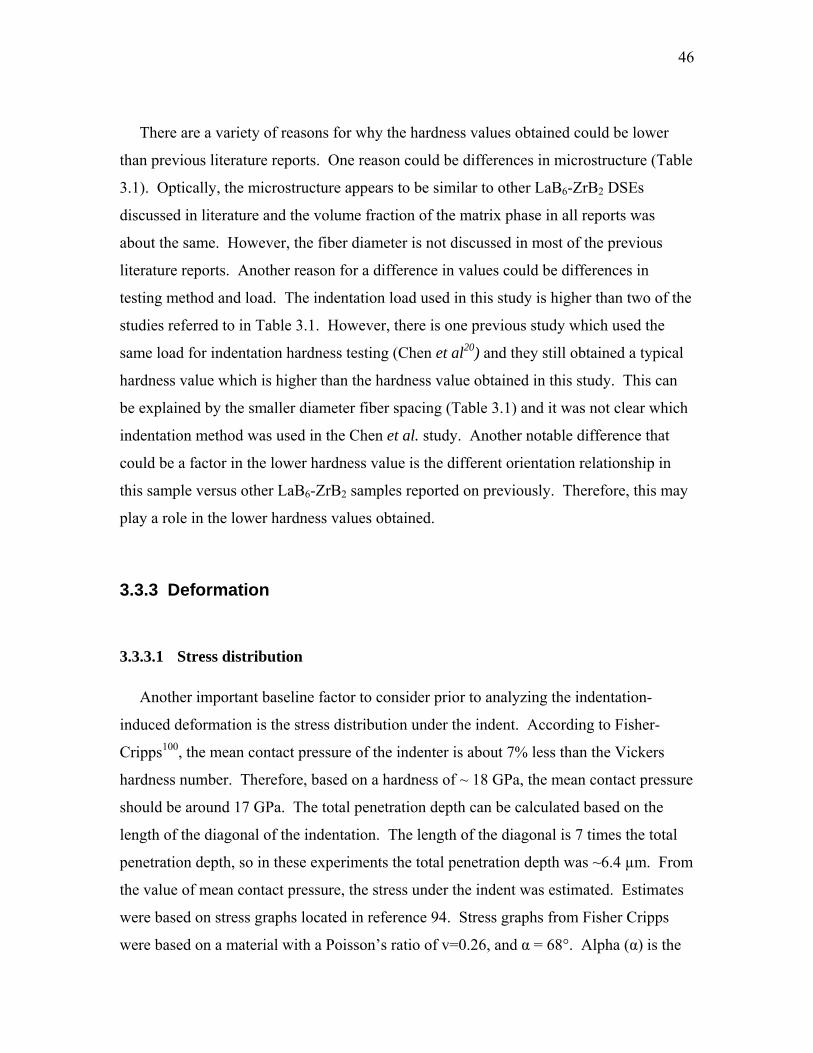
46
There are a variety of reasons for why the hardness values obtained could be lower
than previous literature reports. One reason could be differences in microstructure (Table
3.1). Optically, the microstructure appears to be similar to other LaB6-ZrB2 DSEs
discussed in literature and the volume fraction of the matrix phase in all reports was
about the same. However, the fiber diameter is not discussed in most of the previous
literature reports. Another reason for a difference in values could be differences in
testing method and load. The indentation load used in this study is higher than two of the
studies referred to in Table 3.1. However, there is one previous study which used the
same load for indentation hardness testing (Chen et al20) and they still obtained a typical
hardness value which is higher than the hardness value obtained in this study. This can
be explained by the smaller diameter fiber spacing (Table 3.1) and it was not clear which
indentation method was used in the Chen et al. study. Another notable difference that
could be a factor in the lower hardness value is the different orientation relationship in
this sample versus other LaB6-ZrB2 samples reported on previously. Therefore, this may
play a role in the lower hardness values obtained.
3.3.3 Deformation
3.3.3.1 Stress distribution
Another important baseline factor to consider prior to analyzing the indentation-
induced deformation is the stress distribution under the indent. According to Fisher-
Cripps100, the mean contact pressure of the indenter is about 7% less than the Vickers
hardness number. Therefore, based on a hardness of ~ 18 GPa, the mean contact pressure
should be around 17 GPa. The total penetration depth can be calculated based on the
length of the diagonal of the indentation. The length of the diagonal is 7 times the total
penetration depth, so in these experiments the total penetration depth was ~6.4 µm. From
the value of mean contact pressure, the stress under the indent was estimated. Estimates
were based on stress graphs located in reference 94. Stress graphs from Fisher Cripps
were based on a material with a Poisson’s ratio of v=0.26, and α = 68°. Alpha (α) is the
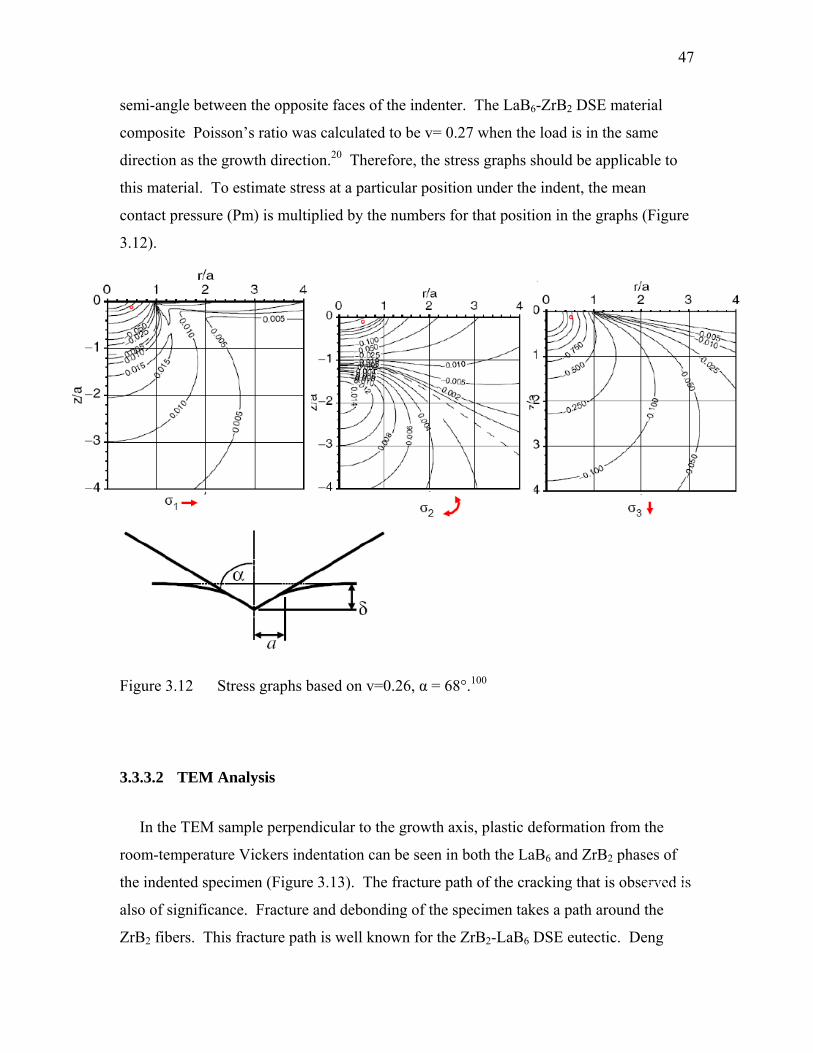
47
semi-angle between the opposite faces of the indenter. The LaB6-ZrB2 DSE material
composite Poisson’s ratio was calculated to be v= 0.27 when the load is in the same
direction as the growth direction.20 Therefore, the stress graphs should be applicable to
this material. To estimate stress at a particular position under the indent, the mean
contact pressure (Pm) is multiplied by the numbers for that position in the graphs (Figure
3.12).
Figure 3.12 Stress graphs based on v=0.26, α = 68°.100
3.3.3.2 TEM Analysis
In the TEM sample perpendicular to the growth axis, plastic deformation from the
room-temperature Vickers indentation can be seen in both the LaB6 and ZrB2 phases of
the indented specimen (Figure 3.13). The fracture path of the cracking that is observed is
also of significance. Fracture and debonding of the specimen takes a path around the
ZrB2 fibers. This fracture path is well known for the ZrB2-LaB6 DSE eutectic. Deng
500 nm

48
discusses this fracture path in detail in her 2006 PhD thesis.26 The tortuous path of
fracture is a major reason the fracture toughness of this material is very good.
Figure 3.13 Multibeam TEM image of LaB6-ZrB2 DSE deformed under
19.6 N load perpendicular to the growth direction.
Numerous dislocation arrays were also observed. The dislocations seem to
originate/end in the matrix and don’t appear to originate or end at the fibers (Figure 3.14).
Two beam conditions g200 LaB6 and g010 LaB6 were performed in order to evaluate slip
systems in the eutectic. It is well known that when 0. bg , pure edge-component
dislocations can not be seen, where g is the diffraction vector and b is the Burgers
vector. This is referred to as the invisibility criterion. Some of the dislocations appear to
satisfy the invisibility criterion for slip plane and direction 110/}100{ (Figure 3.14).
Dislocation arrays are observed in the g 200 LaB6 two beam condition and are indicated in
Figure 3.14 by striped lines. These same dislocations are not observed in the g 010 LaB6
two beam condition. Dislocations that did not satisfy the invisibility criterion for the slip
system 110}100{ , were also observed and are indicated by oval markers.
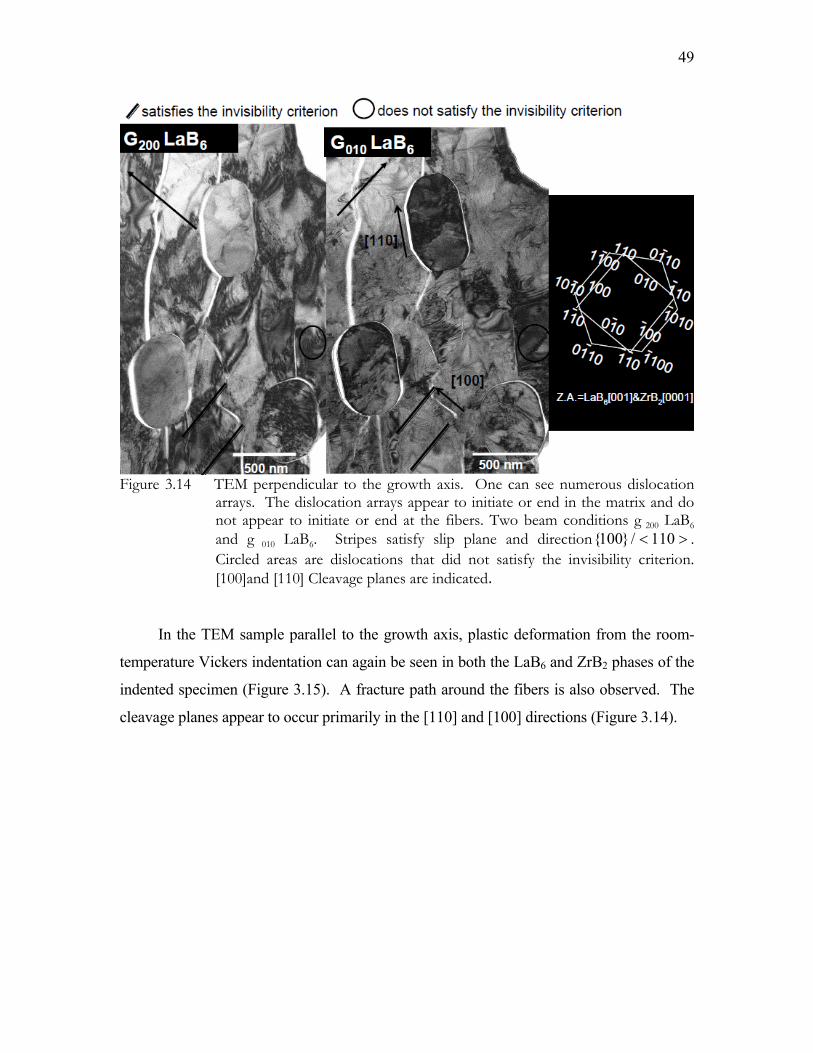
49
Figure 3.14 TEM perpendicular to the growth axis. One can see numerous dislocation
arrays. The dislocation arrays appear to initiate or end in the matrix and do not appear to initiate or end at the fibers. Two beam conditions g 200 LaB6 and g 010 LaB6. Stripes satisfy slip plane and direction 110/}100{ . Circled areas are dislocations that did not satisfy the invisibility criterion. [100]and [110] Cleavage planes are indicated.
In the TEM sample parallel to the growth axis, plastic deformation from the room-
temperature Vickers indentation can again be seen in both the LaB6 and ZrB2 phases of the
indented specimen (Figure 3.15). A fracture path around the fibers is also observed. The
cleavage planes appear to occur primarily in the [110] and [100] directions (Figure 3.14).

50
a) b)
Figure 3.15 TEM micrographs of LaB6-ZrB2 DSE from under a 19.6 N Vickers indent (parallel to the growth axis. a) High magnification showing numerous dislocations in the ZrB2 fiber and a crack starting on the outside. Some dislocation arrays are evident in the LaB6 matrix as well. b) Low magnification of same sample with crack path more obvious.
3.4 Conclusions Vickers indentation at room-temperature was used to initiate deformation in LaB6-
ZrB2 DSE. Crack progression, dislocation types, and slip systems were evaluated.
Fracture and debonding at the interfaces was observed. Crack propagation navigated
around ZrB2 fibers. Unlike observations made in previous studies of single crystal LaB6,
ZrB2, and LaB6-ZrB2 DSE, dislocations were not observed in as received DSE rods. As
discussed previously, dislocation density is believed to be a function of the melt solid
interface. The flatter the melt solid interface the fewer the dislocations101. Other factors
that could affect dislocation density are growth and rotation rates. After Vickers
indentation under a 19.6 N load, dislocations were observed in both phases. Dislocations
appear to initiate and end in the matrix and do not appear to initiate nor end near the fiber

51
interfaces. Some dislocations in the LaB6 phase of ZrB2-LaB6 DSE appear to satisfy the
slip system 110}100{ . Other dislocations observed do not appear to satisfy the
invisibility criterion for this slip system. Further evaluation of 2 beam TEM conditions
should be performed. Dislocations in ZrB2 need to be evaluated in the TEM by two beam
conditions in order to verify the same slip systems observed in previous single crystal
studies.
52
4 High-Temperature Impression Creep
4.1 Method
4.1.1 Instrument Modification High-temperature deformation of the LaB6-ZrB2 DSE was examined by high-
temperature impression creep. Due to the complexity of the testing equipment, a
standard operating procedure (SOP) was written and followed for each sample (see
appendix I). A diagram of the impression creep instrument is shown in Figure 4.1. The
sample and punch were held between two alpha SiC tabs inside a high-temperature
furnace with an open area of 14x14x16.5cm. An internal layer of 1” KVS 1704
insulation and an external 1” BR Fractilin board insulation lined the inside walls. Cooled
water was run through pipes around the exterior of the furnace and specifically around
the transducers to keep the furnace cooled and reduce fluctuations in the transducers.
The cooled water was maintained at a constant temperature of 16°C with the use of a
chiller. The temperature was monitored with type B thermocouples (Platinum-30%
Rhodium, Platinium-6% Rhodium) encapsulated in an alumina protection tube.

53
Figure 4.1 Impression creep schematic and photo.102
Prior to creep testing, the creep instrument was modified for controlled atmosphere.
This entailed enclosing and making airtight the furnace and all tubing running in and out
of the furnace. The bellows that was installed had some slight air leaks that could not be
fixed. Attempts were made to patch the holes, however due to the very small size and
difficulty in getting in between the grooves of the bellows these attempts were
unsuccessful. In order to ensure that the external oxygen atmosphere could not enter the
furnace during testing, the exhaust tubing was bubbled into a 6 foot tube filled with
dibutyl phthalate to ensure backpressure while testing. UHP argon was used and the
atmosphere in the furnace was monitored with a DS-400 probe from Australian Oxytrol
Systems.
The most critical parameter for a successful creep test is aligning the indenter
properly. An aluminum jig was designed and utilized to ensure proper alignment
between the SiC rams, SiC plates, indenter (punch) and sample (Figure 4.2).
Upper alignment fixture
Water cooled SiC ram
2 mm dia.SiCpunch
Specimen
MoSi2 furnace
Load cell Lower alignment fixture
Weights
Lower SiCram
SiCrod (1 of 2)
Capacitive transducer(1 of 2)
Constant temperature chamber

54
Figure 4.2 Aluminum jig encases and ensures alignment of the upper ram, SiC punch/indenter, specimen, upper and lower tabs, and bottom ram.
4.1.2 Instrument Calibration The first step prior to running creep tests on the LaB6-ZrB2 DSE was to run calibration
samples possessing known creep rates. The initial calibration of the instrument was
performed by Fox who measured creep of Si3N4 NT154 samples for comparison with
published data.103 The results obtained were within the expected published creep data
range for Si3N4 NT154. A 2nd calibration was performed just prior to LaB6-ZrB2 DSE
testing to verify the instrument was still in alignment. SiAlON samples used for
calibration were tested on the instrument previously by Fox and run again under the same
conditions to verify instrument calibration. Test sample sizes were 13.5 x 13.5 x 8mm
samples of SiAlON. The LaB6-ZrB2 DSE rod tested was 4.9mm in diameter. Due to the
size variance in the tested samples and to eliminate concerns regarding a possibility of
changing creep rates with sample size and alignment, 4.9mm rods were bored from
standard samples of 13.5 x 13.5 SiAlON. The 13.5mm SiAlON and the 4.9mm SiAlON
rods were tested for comparison. Sample test conditions were -300MPa, 1400°C, and
100hrs. As shown in Table 4.1 all samples had strain rates of ~10-7 verifying that the
smaller diameter specimens did not affect the indentation creep results.

55
Table 4.1 Calibration results for Creep Test Instrument and small diameter specimens. Highlighted columns are calibration runs performed in this study. Non-highlighted are previous runs performed on the same instrument. ab581 = 35.4%Si, 6.9%Al, 5.8% O, 51% N, 0.7%Yb102
Sample ID Size Temp. Stress Strain Rate (s-1)
Run 41 ab581 13.5x13.5.8mm 1400°C -300MPa 4.02 E-7 (s-1) ± 6.04 E-9
Run 57 ab581 13.5x13.5.8mm 1400°C -300MPa 6.88 E-7 (s-1) ± 1.03 E-8
Run 58 ab581 13.5x13.5.8mm 1400°C -300MPa 8.38 E-7 (s-1) ± 1.27 E-8
Run *39 ab581 13.5x13.5.8mm 1400°C -300MPa 4.65 E-7 (s-1) ± 6.89 E-9
Run 2 ab581 4.9x7.4mm 1400°C -300MPa 6.22 E-7 (s-1) ± 9.34 E-9
4.1.3 Sample Preparation Samples prior to deformation testing were surface ground on a Grizzly Surface
Grinder (model 60567) using a 150 grit diamond embedded wheel to ensure the samples
were flat and parallel. Squared samples were then polished using a tripod holder and
diamond abrasive film. Samples were successively polished with 30µm, 15µm, 9µm,
6µm, 3µm, and 1µm film. After final polishing, the surface finish of the samples was
evaluated using an optical microscope. Samples were evaluated to make sure no cracks
were visible and that there was a homogenously smooth surface. A carbon sputter
coating was then applied to both ends of the sample to act as a protective getter.

56
4.2 Results
4.2.1 1st Creep Run Several creep runs were attempted before optimization of the furnace and creep
method was obtained. The first LaB6-ZrB2 DSE creep test was performed at 1400°C in
UHP argon for 22 hrs and under a stress of -300MPa. The sample was under load for 22
hrs before the transducer reading was unattainable. Upon examination of the sample,
severe deformation of the sample was observed. The sacrificial tab that the sample rested
on was cracked and had a white reaction product covering the surface (Figure 4.3b).
a) b)
Figure 4.3 a) Optical micrograph of the side of the LaB6-ZrB2 sample after creep test #
1 showing severe deformation, b) sacrificial SiC Tab from creep test #1
showing severe reaction product.
To check for any reaction products, the sample and tablet were analyzed by SEM.
Analysis via SEM/EDS found Zr and La on the surface of the sample and did not reveal
any elements out of the ordinary. Analysis of the SiC tablet found Zr and La from the
sample and Si from the SiC tablet and therefore no elements out of the ordinary were
detected (Figure 4.4, Figure 4.5) It was concluded based on these results along with the
visual deformation of the sample that severe oxidation caused the sample to deform at a
rapid rate thus preventing us from obtaining creep data.
3 mm

57
Figure 4.4 SEM/EDS results on outer surface of LaB6ZrB2 sample after creep test #1. Zr and La were the only elements detected. These elements are expected therefore nothing unusual was detected by SEM/EDS.
Figure 4.5 SEM/EDS Analysis from creep test # 1 tablet Residue. Zr, La and Si were detected. La and Zr are from the sample and Si would be expected from the SiC tablet.

58
4.2.2 2nd Creep Run
A second sample was run under the same conditions as the first, but with more
attention being paid to making sure as much oxygen as possible was purged from the
furnace. As mentioned previously, as part of the SOP, the sample was exposed for two
hours to an atmosphere of UHP argon at 1400°C, this is performed to stabilize the
temperature. Once stabilization was completed the load was placed on the sample.
However, the alpha silicon carbide indenter broke on application of the load. Post testing
optical inspection revealed a glassy residue on the surface of the sample and sacrificial
alpha silicon carbide tab (Figure 4.6a). SEM/EDS analysis detected La, Si, C, O, and Zr
on the sample (Figure 4.6b).
a)
b)
Figure 4.6 a) Top outer surface of Creep Test # 2 sample and tablet. A glassy residue was observed after two hours @ 1400°C with no load. b) SEM/EDS taken from the surface of the LaB6-ZrB2 DSE sample (circled) detected La, Si, C, O, Zr.

59
The sample was also analyzed by XRD to confirm suspicions of oxidation, LaBO3 and
La3BO6 lanthanum borate were observed on the sample (Figure 4.7). A second XRD
was performed on the tab area where the sample was sitting. This was done in order to
try to determine if contamination was a factor in the reaction observed. However, again
only a lanthanum borate pattern was observed (Figure 4.8). A third XRD was performed
on the glassy looking residue seen on the tablet (Figure 4.9). A broad amorphous peak
was observed. An amorphous peak is a typical XRD pattern for an amorphous specimen
like glass. The glassy phase can be explained by the La2O3-B2O3 phase diagram which
shows liquid immiscibility at 1136°C and extends from pure B2O3 to 21.5 mol%
La2O3.104 Therefore, at 1400°C the formation of liquid B2O3 and La2O3 is expected.
Figure 4.7 XRD 2nd outer surface of creep sample confirming oxidation of the sample in the form of lanthanum borate
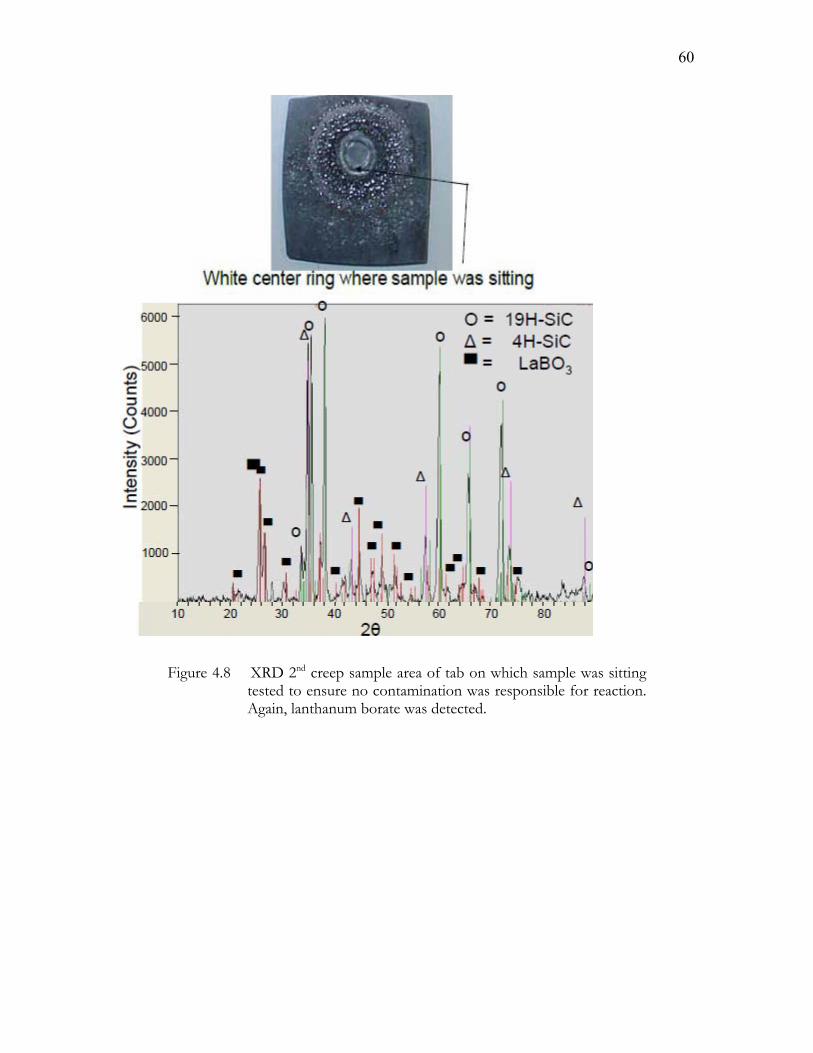
60
Figure 4.8 XRD 2nd creep sample area of tab on which sample was sitting tested to ensure no contamination was responsible for reaction. Again, lanthanum borate was detected.
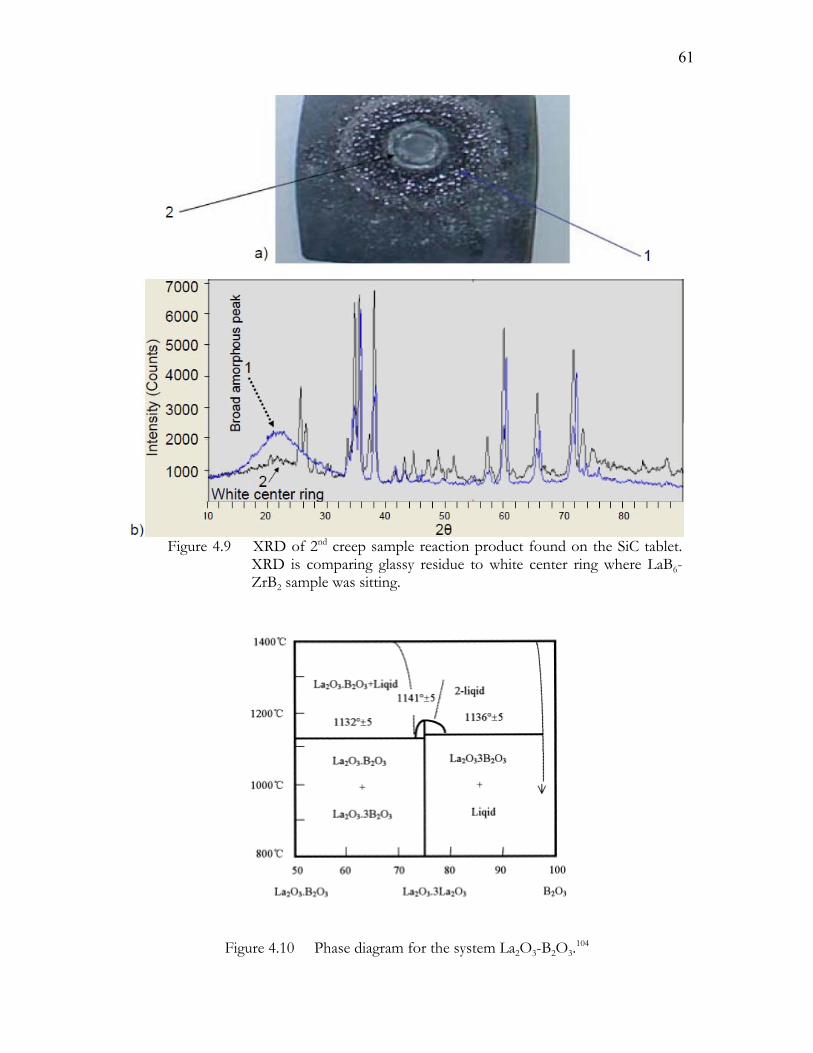
61
Figure 4.9 XRD of 2nd creep sample reaction product found on the SiC tablet.
XRD is comparing glassy residue to white center ring where LaB6-ZrB2 sample was sitting.
Figure 4.10 Phase diagram for the system La2O3-B2O3.104
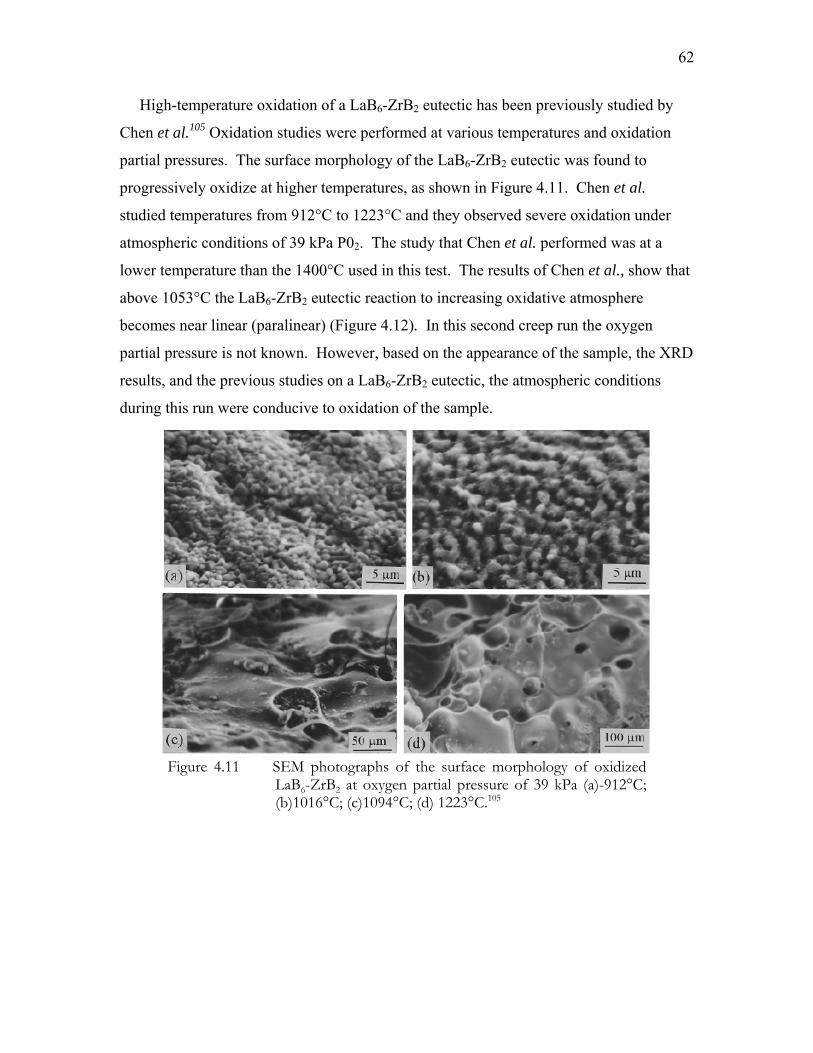
62
High-temperature oxidation of a LaB6-ZrB2 eutectic has been previously studied by
Chen et al.105 Oxidation studies were performed at various temperatures and oxidation
partial pressures. The surface morphology of the LaB6-ZrB2 eutectic was found to
progressively oxidize at higher temperatures, as shown in Figure 4.11. Chen et al.
studied temperatures from 912°C to 1223°C and they observed severe oxidation under
atmospheric conditions of 39 kPa P02. The study that Chen et al. performed was at a
lower temperature than the 1400°C used in this test. The results of Chen et al., show that
above 1053°C the LaB6-ZrB2 eutectic reaction to increasing oxidative atmosphere
becomes near linear (paralinear) (Figure 4.12). In this second creep run the oxygen
partial pressure is not known. However, based on the appearance of the sample, the XRD
results, and the previous studies on a LaB6-ZrB2 eutectic, the atmospheric conditions
during this run were conducive to oxidation of the sample.
Figure 4.11 SEM photographs of the surface morphology of oxidized
LaB6-ZrB2 at oxygen partial pressure of 39 kPa (a)-912°C; (b)1016°C; (c)1094°C; (d) 1223°C.105
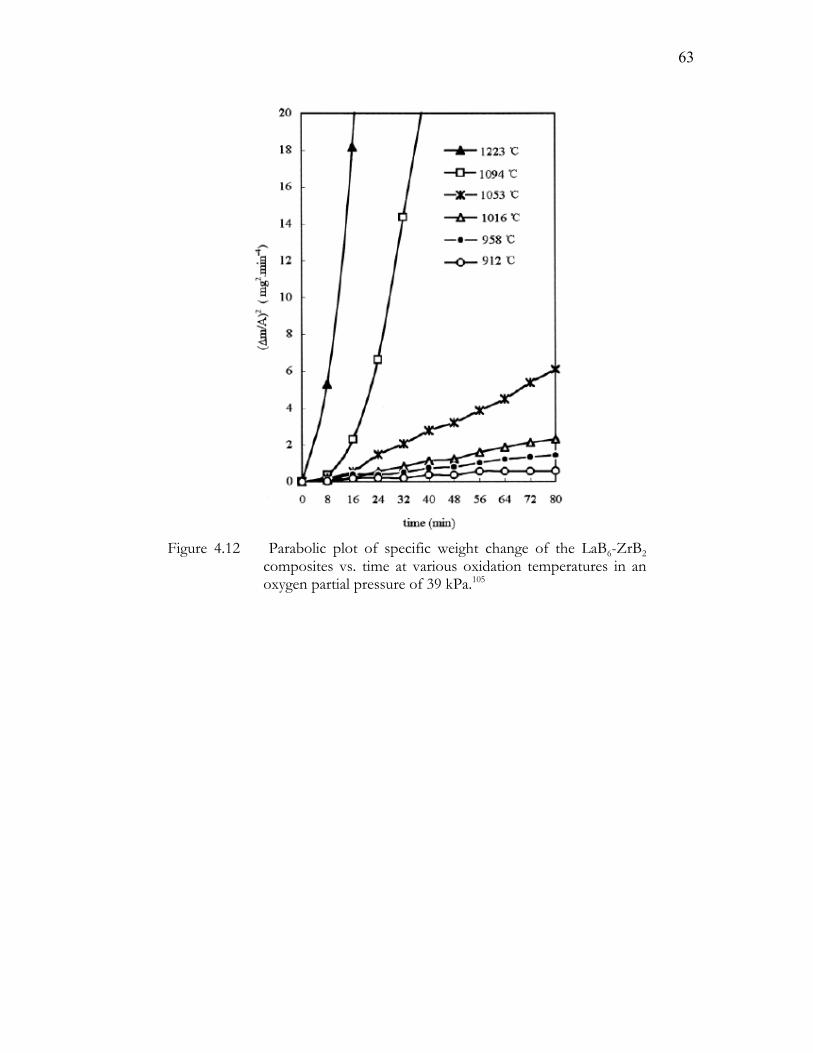
63
Figure 4.12 Parabolic plot of specific weight change of the LaB6-ZrB2
composites vs. time at various oxidation temperatures in an oxygen partial pressure of 39 kPa.105
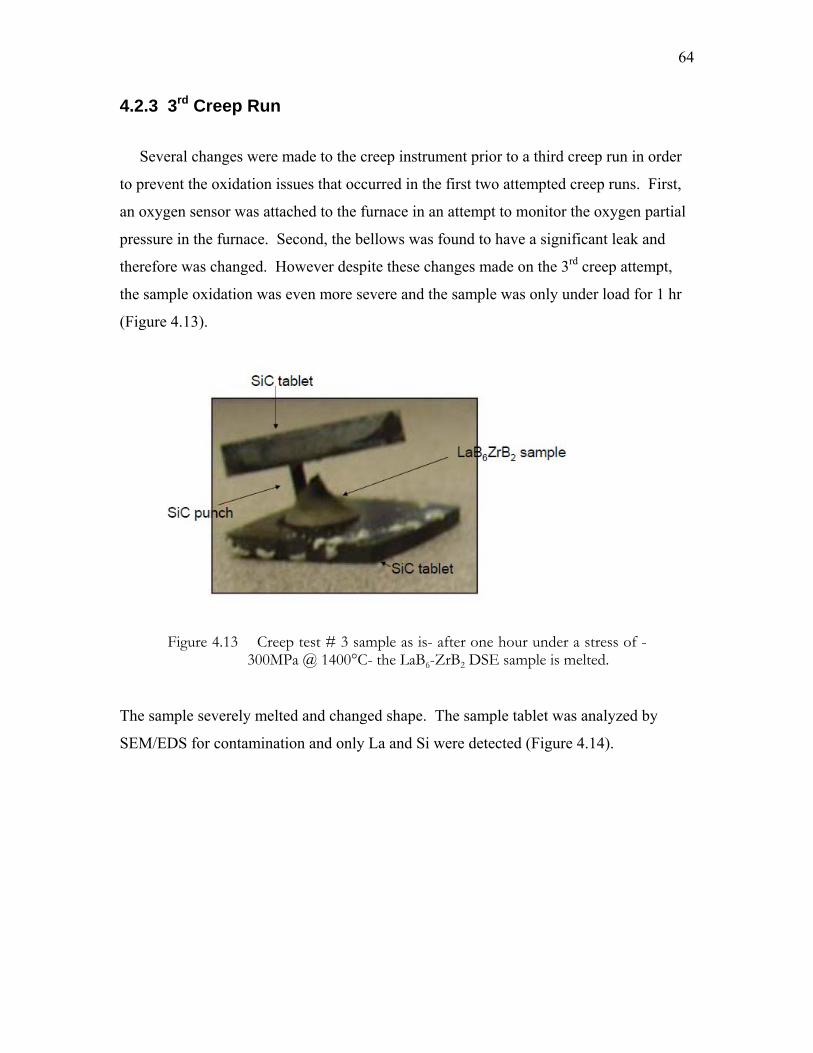
64
4.2.3 3rd Creep Run
Several changes were made to the creep instrument prior to a third creep run in order
to prevent the oxidation issues that occurred in the first two attempted creep runs. First,
an oxygen sensor was attached to the furnace in an attempt to monitor the oxygen partial
pressure in the furnace. Second, the bellows was found to have a significant leak and
therefore was changed. However despite these changes made on the 3rd creep attempt,
the sample oxidation was even more severe and the sample was only under load for 1 hr
(Figure 4.13).
Figure 4.13 Creep test # 3 sample as is- after one hour under a stress of -
300MPa @ 1400°C- the LaB6-ZrB2 DSE sample is melted.
The sample severely melted and changed shape. The sample tablet was analyzed by
SEM/EDS for contamination and only La and Si were detected (Figure 4.14).

65
Figure 4.14 Creep test # 3 reaction product on underside of top tab SEM/EDS results detected La and Si.
A gray scale was observed on the cross-section of the 3rd creep sample. In this area, an
unidentifiable pattern was observed by XRD analysis. Peaks observed in this
unidentifiable pattern were analyzed by EDS and included O, Zr, Al, B and La (Figure
4.15). Aluminum is an element that is contained in the insulation found in the furnace.
The insulation used in the furnace is an alumino-silicate refractory ceramic fiber referred
to as Fiberfrax. Therefore, the aluminum was assumed to come from the insulation.
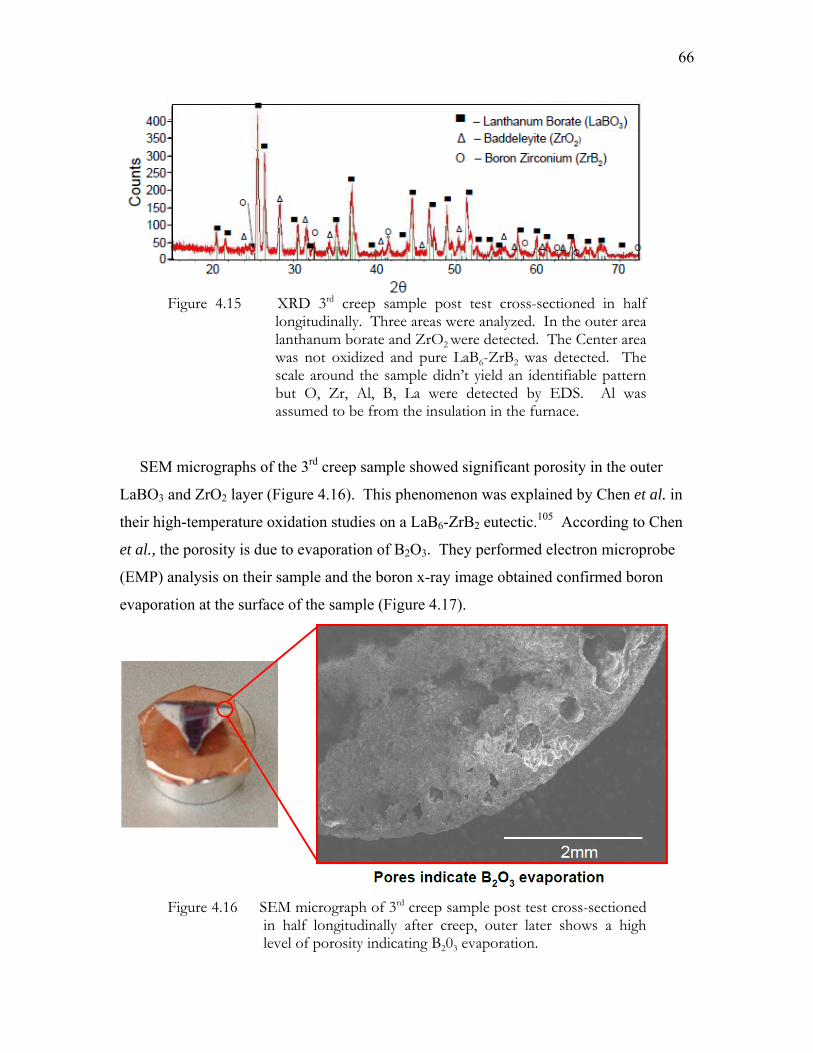
66
Figure 4.15 XRD 3rd creep sample post test cross-sectioned in half
longitudinally. Three areas were analyzed. In the outer area lanthanum borate and ZrO2 were detected. The Center area was not oxidized and pure LaB6-ZrB2 was detected. The scale around the sample didn’t yield an identifiable pattern but O, Zr, Al, B, La were detected by EDS. Al was assumed to be from the insulation in the furnace.
SEM micrographs of the 3rd creep sample showed significant porosity in the outer
LaBO3 and ZrO2 layer (Figure 4.16). This phenomenon was explained by Chen et al. in
their high-temperature oxidation studies on a LaB6-ZrB2 eutectic.105 According to Chen
et al., the porosity is due to evaporation of B2O3. They performed electron microprobe
(EMP) analysis on their sample and the boron x-ray image obtained confirmed boron
evaporation at the surface of the sample (Figure 4.17).
Figure 4.16 SEM micrograph of 3rd creep sample post test cross-sectioned in half longitudinally after creep, outer later shows a high level of porosity indicating B203 evaporation.
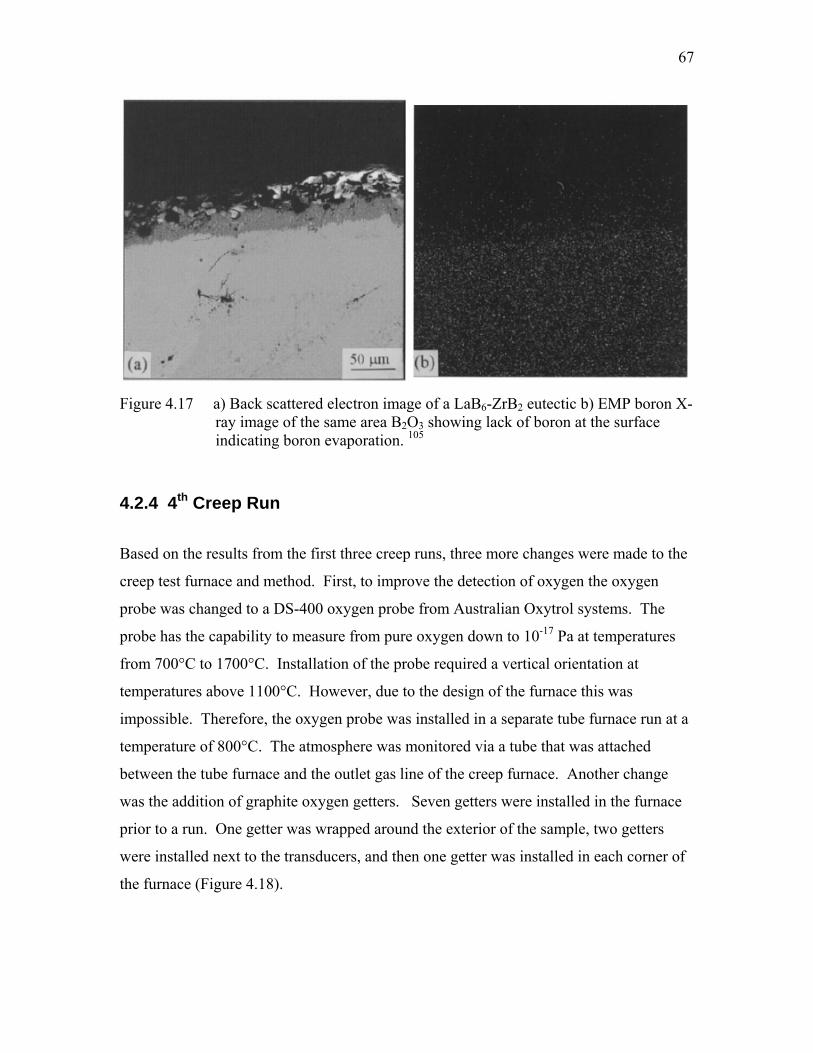
67
Figure 4.17 a) Back scattered electron image of a LaB6-ZrB2 eutectic b) EMP boron X-ray image of the same area B2O3 showing lack of boron at the surface indicating boron evaporation. 105
4.2.4 4th Creep Run
Based on the results from the first three creep runs, three more changes were made to the
creep test furnace and method. First, to improve the detection of oxygen the oxygen
probe was changed to a DS-400 oxygen probe from Australian Oxytrol systems. The
probe has the capability to measure from pure oxygen down to 10-17 Pa at temperatures
from 700°C to 1700°C. Installation of the probe required a vertical orientation at
temperatures above 1100°C. However, due to the design of the furnace this was
impossible. Therefore, the oxygen probe was installed in a separate tube furnace run at a
temperature of 800°C. The atmosphere was monitored via a tube that was attached
between the tube furnace and the outlet gas line of the creep furnace. Another change
was the addition of graphite oxygen getters. Seven getters were installed in the furnace
prior to a run. One getter was wrapped around the exterior of the sample, two getters
were installed next to the transducers, and then one getter was installed in each corner of
the furnace (Figure 4.18).
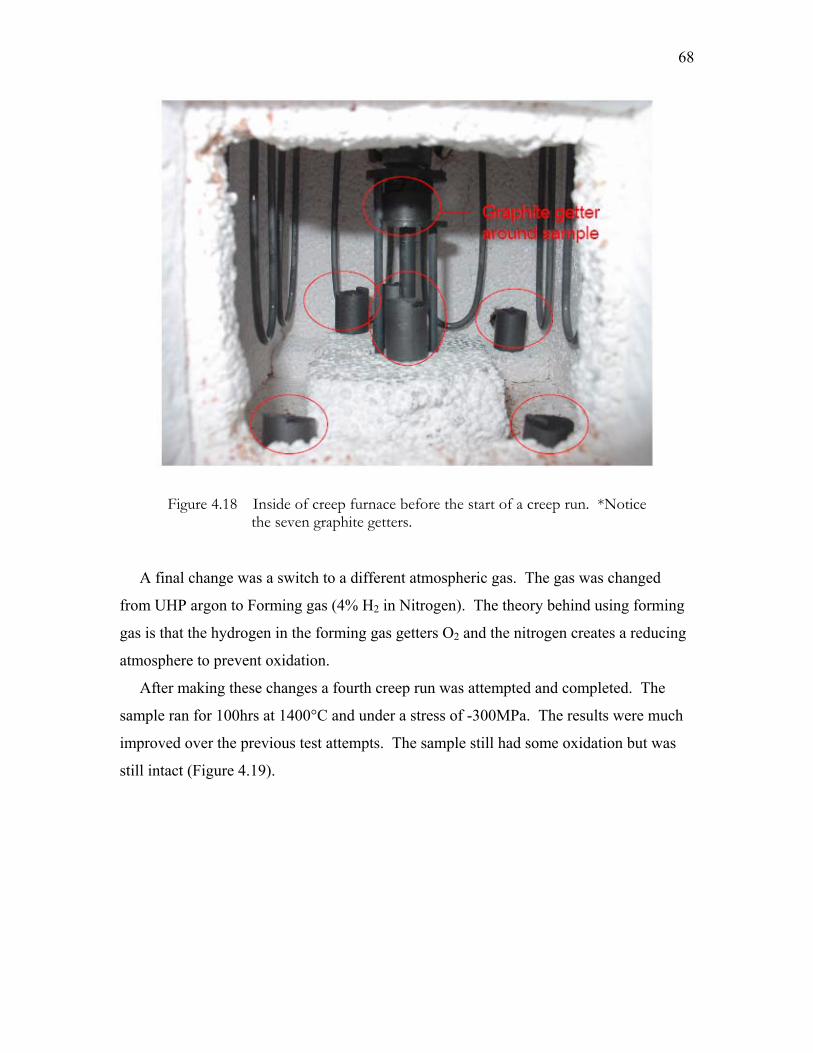
68
Figure 4.18 Inside of creep furnace before the start of a creep run. *Notice
the seven graphite getters.
A final change was a switch to a different atmospheric gas. The gas was changed
from UHP argon to Forming gas (4% H2 in Nitrogen). The theory behind using forming
gas is that the hydrogen in the forming gas getters O2 and the nitrogen creates a reducing
atmosphere to prevent oxidation.
After making these changes a fourth creep run was attempted and completed. The
sample ran for 100hrs at 1400°C and under a stress of -300MPa. The results were much
improved over the previous test attempts. The sample still had some oxidation but was
still intact (Figure 4.19).
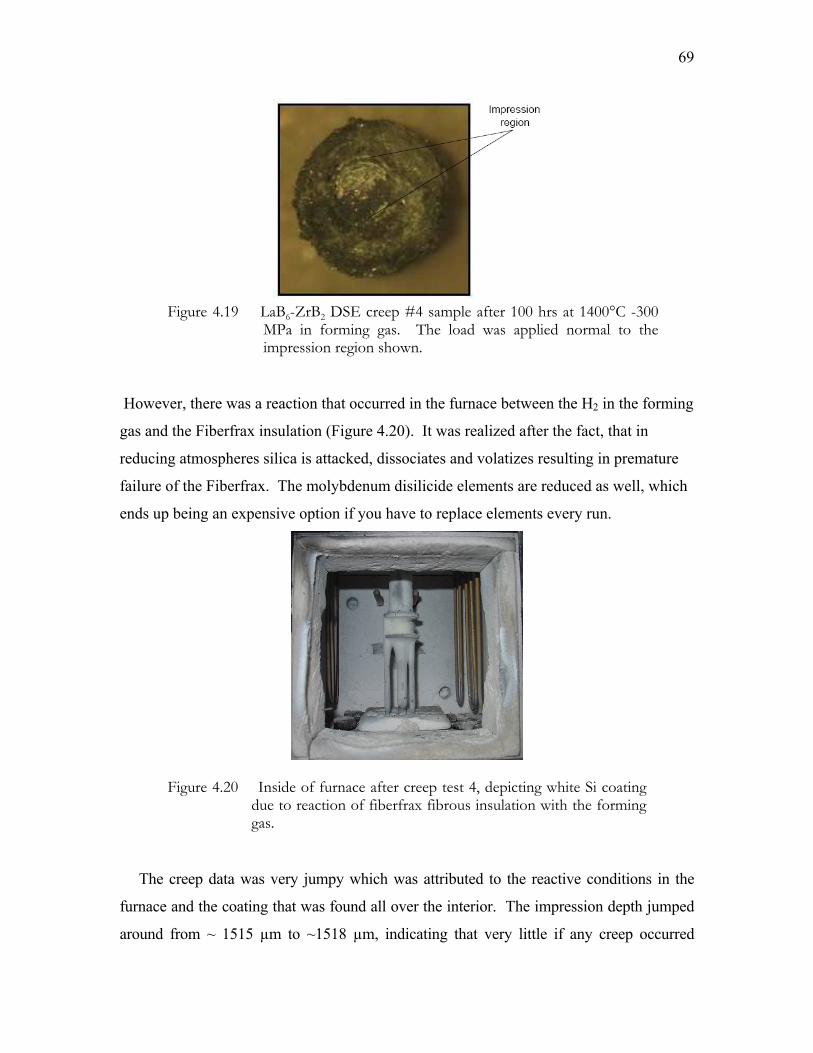
69
Figure 4.19 LaB6-ZrB2 DSE creep #4 sample after 100 hrs at 1400°C -300
MPa in forming gas. The load was applied normal to the impression region shown.
However, there was a reaction that occurred in the furnace between the H2 in the forming
gas and the Fiberfrax insulation (Figure 4.20). It was realized after the fact, that in
reducing atmospheres silica is attacked, dissociates and volatizes resulting in premature
failure of the Fiberfrax. The molybdenum disilicide elements are reduced as well, which
ends up being an expensive option if you have to replace elements every run.
Figure 4.20 Inside of furnace after creep test 4, depicting white Si coating due to reaction of fiberfrax fibrous insulation with the forming gas.
The creep data was very jumpy which was attributed to the reactive conditions in the
furnace and the coating that was found all over the interior. The impression depth jumped
around from ~ 1515 µm to ~1518 µm, indicating that very little if any creep occurred

70
(Figure 4.21). From this creep data a creep rate of -3.3 x 10⁻¹¹ s-1 ± -5.8 x 10⁻¹¹ was
calculated. The steady state creep rate was calculated using a linear regression fit of the
strain versus time data. The fitting error is the standard error calculated from the regression
fit.
Figure 4.21 LaB6-ZrB2 DSE creep #4 deformation over time for 100 hrs at 1400°C, -300MPa in forming gas.
SEM analysis of the sample showed numerous cracks under the indent (Figure 4.22).
Crack locations appeared to be randomly distributed under the indent with some observed
on the edges, in the middle and in areas in-between. Cracks were observed travelling
normal from the indent. The longest crack length observed was 944 µm in length with
the average length being 220 µm with a standard deviation of 250 µm. It is not surprising
to find cracks under the indent at 1400°C. As discussed previously in the introduction,
during compression testing at temperatures below 2000°C failure in a single crystal ZrB2
occurred by brittle fracture.74

71
Figure 4.22 SEM micrograph of LaB6-ZrB2 DSE cross-section after 4th creep sample reveals several cracks underneath impression/indentor area.
High magnification evaluation by SEM showed a microstructure that was essentially
unchanged. The average fiber diameter was 0.65 ± 0.09 µm as compared to as-processed
fiber diameter in the sample which was 0.7 ± 0.1 µm. The average inter-fiber distance in
the crept sample was determined to be 0.7 ± 0.2 µm compared to1.1 ± 0.4 µm in the as-
processed sample (Figure 4.23). Stability of the microstructure of DSEs has been
referenced in previous literature and was discussed previously in the introduction. This
stability is attributed to the composites being crystallized from the molten state and
therefore being in equilibrium.19
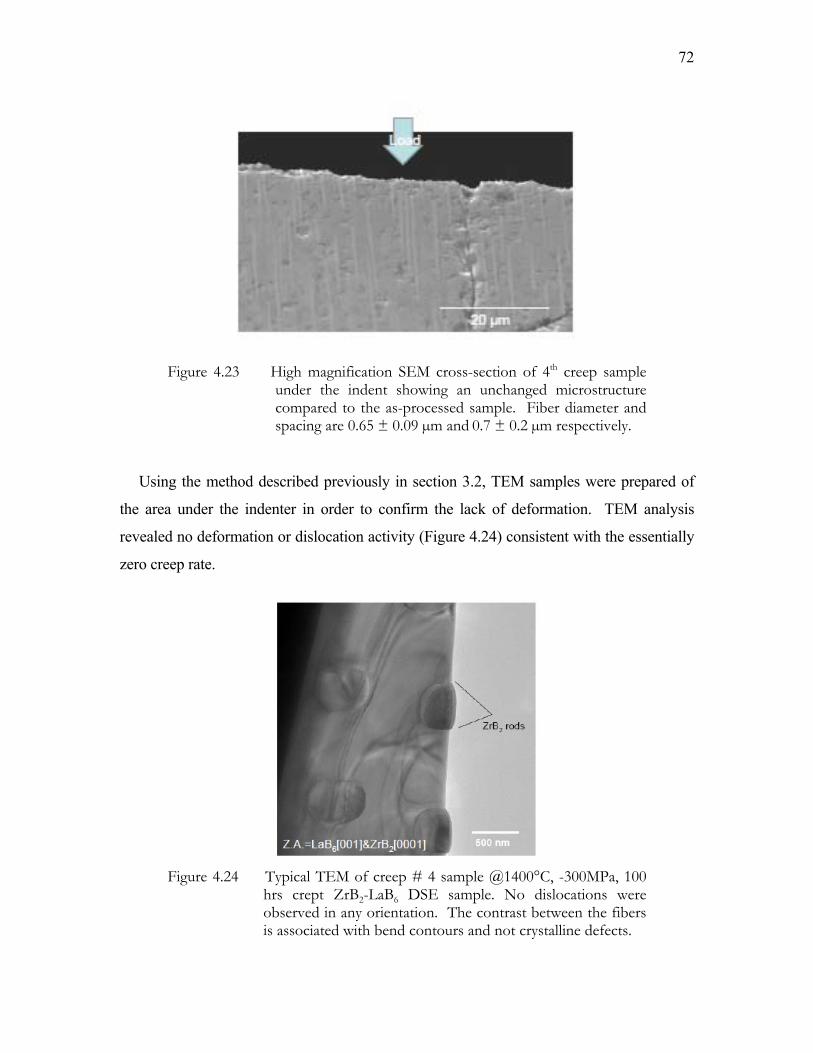
72
Figure 4.23 High magnification SEM cross-section of 4th creep sample under the indent showing an unchanged microstructure compared to the as-processed sample. Fiber diameter and spacing are 0.65 ± 0.09 µm and 0.7 ± 0.2 µm respectively.
Using the method described previously in section 3.2, TEM samples were prepared of
the area under the indenter in order to confirm the lack of deformation. TEM analysis
revealed no deformation or dislocation activity (Figure 4.24) consistent with the essentially
zero creep rate.
Figure 4.24 Typical TEM of creep # 4 sample @1400°C, -300MPa, 100 hrs crept ZrB2-LaB6 DSE sample. No dislocations were observed in any orientation. The contrast between the fibers is associated with bend contours and not crystalline defects.
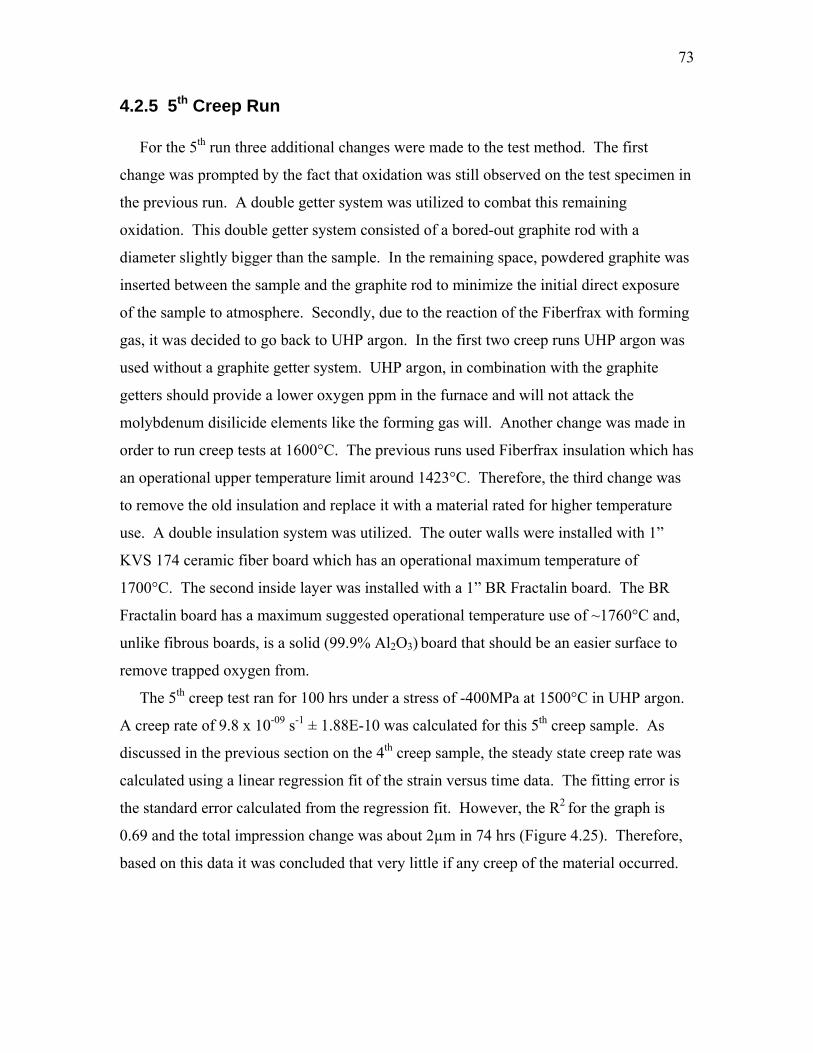
73
4.2.5 5th Creep Run For the 5th run three additional changes were made to the test method. The first
change was prompted by the fact that oxidation was still observed on the test specimen in
the previous run. A double getter system was utilized to combat this remaining
oxidation. This double getter system consisted of a bored-out graphite rod with a
diameter slightly bigger than the sample. In the remaining space, powdered graphite was
inserted between the sample and the graphite rod to minimize the initial direct exposure
of the sample to atmosphere. Secondly, due to the reaction of the Fiberfrax with forming
gas, it was decided to go back to UHP argon. In the first two creep runs UHP argon was
used without a graphite getter system. UHP argon, in combination with the graphite
getters should provide a lower oxygen ppm in the furnace and will not attack the
molybdenum disilicide elements like the forming gas will. Another change was made in
order to run creep tests at 1600°C. The previous runs used Fiberfrax insulation which has
an operational upper temperature limit around 1423°C. Therefore, the third change was
to remove the old insulation and replace it with a material rated for higher temperature
use. A double insulation system was utilized. The outer walls were installed with 1”
KVS 174 ceramic fiber board which has an operational maximum temperature of
1700°C. The second inside layer was installed with a 1” BR Fractalin board. The BR
Fractalin board has a maximum suggested operational temperature use of ~1760°C and,
unlike fibrous boards, is a solid (99.9% Al2O3) board that should be an easier surface to
remove trapped oxygen from.
The 5th creep test ran for 100 hrs under a stress of -400MPa at 1500°C in UHP argon.
A creep rate of 9.8 x 10-09 s-1 ± 1.88E-10 was calculated for this 5th creep sample. As
discussed in the previous section on the 4th creep sample, the steady state creep rate was
calculated using a linear regression fit of the strain versus time data. The fitting error is
the standard error calculated from the regression fit. However, the R2 for the graph is
0.69 and the total impression change was about 2µm in 74 hrs (Figure 4.25). Therefore,
based on this data it was concluded that very little if any creep of the material occurred.

74
This was confirmed by SEM and TEM analysis where no deformation was observed.
Figure 4.25 LaB6-ZrB2 DSE sample #5 deformation over time 74 hrs, 1500°C, -400MPa in UHP argon.
The changes made to the test procedure resulted in less oxidation of the sample
(Figure 4.26).
Figure 4.26 Low magnification SEM micrograph of top view and longitudinal cross-section LaB6-ZrB2 sample after 5th creep run.

75
High magnification SEM micrographs reveal oxidation still on the surface of the sample
and cracking (Figure 4.27). Like the previous run cracking was observed under the
impression area. Two main areas of chipping were observed under the impression area
(Figure 4.26). Chipped out areas dimensions were 72µm deep by 160 µm wide and 90
µm deep by 180 µm wide. A third area of cracking with a crack of a depth of 19µm
connected to another crack coming diagonally down from the surface 13 µm long was
observed (Figure 4.27). The scale of microstructure was measured and the average fiber
diameter and interfiber distance in the homogenous region was 0.71 ± 0.1 µm and 0.90 ±
0.09 µm respectively (Figure 4.27). This is consistent with observations in the previous
creep run and previous research on DSEs.
Figure 4.27 SEM micrograph of LaB6-ZrB2 cross-section after the 5th creep run showing fracture on the cross-section area under the impression and oxidation on the surface of the sample impression area.
4.2.6 6th Creep Run
A sixth and final creep run was performed for 25 hrs at 1600°C under a stress of -
420MPa in UHP argon. A creep rate of 1.7 x 10⁻⁷ s-1 ± 2.8 x 10⁻⁹ was calculated for this
6th creep sample (Figure 4.28). As discussed in the previous sections on the 4th and 5th

76
creep samples, the steady state creep rate was calculated using a linear regression fit of
the strain versus time data. The fitting error is the standard error calculated from the
regression fit.
Figure 4.28 LaB6-ZrB2 DSE creep sample #6 deformation over time for 100 hrs at 1600°C, -420MPa in UHP argon.
Based on the creep curve it appeared that creep in the material occurred with an overall
impression depth change of around 30 µm. However careful SEM analysis showed no
deformation under the indent other than fracture in the material. A little more oxidation
was observed on the surface of the sample vs. the 1500°C test but this is expected for an
increase in temperature of 100°C (Figure 4.29).
Figure 4.29 Top view of LaB6-ZrB2 DSE sample #6 after 25 hrs, 1600°C, -420MPa in UHP argon. The load was applied normal to the indenter area shown. Oxidation is observed on the surface of the sample.

77
The increased oxidation was observed outside the indentation area and corresponded to a
decrease in surface depth of around 40 µm (Figure 4.30).
Figure 4.30 High magnification SEM of LaB6-ZrB2 DSE after 1600°C -420MPa creep test. Surface oxidation outside of the indent area is observed with ~40um surface depth reduction.
Crack locations appeared to be randomly distributed under the indent with some observed
on the edges, in the middle and in areas in-between. The longest cracks were observed in
high stress areas near the edges of the indent (Figure 4.31). Compressive stresses are
concentrated at the contact edge of the punch therefore; it is not unexpected to see larger
cracks in this area (Figure 4.34). This will be discussed further in section 4.3. The cracks
observed traveled normal to the impression surface and were about 1.2 mm in length. The
average depths of the rest of the cracks were 170 µm in length. Also observed was a raised
area under the indent. SiC was the main reaction product. Analysis by XRD found SiC
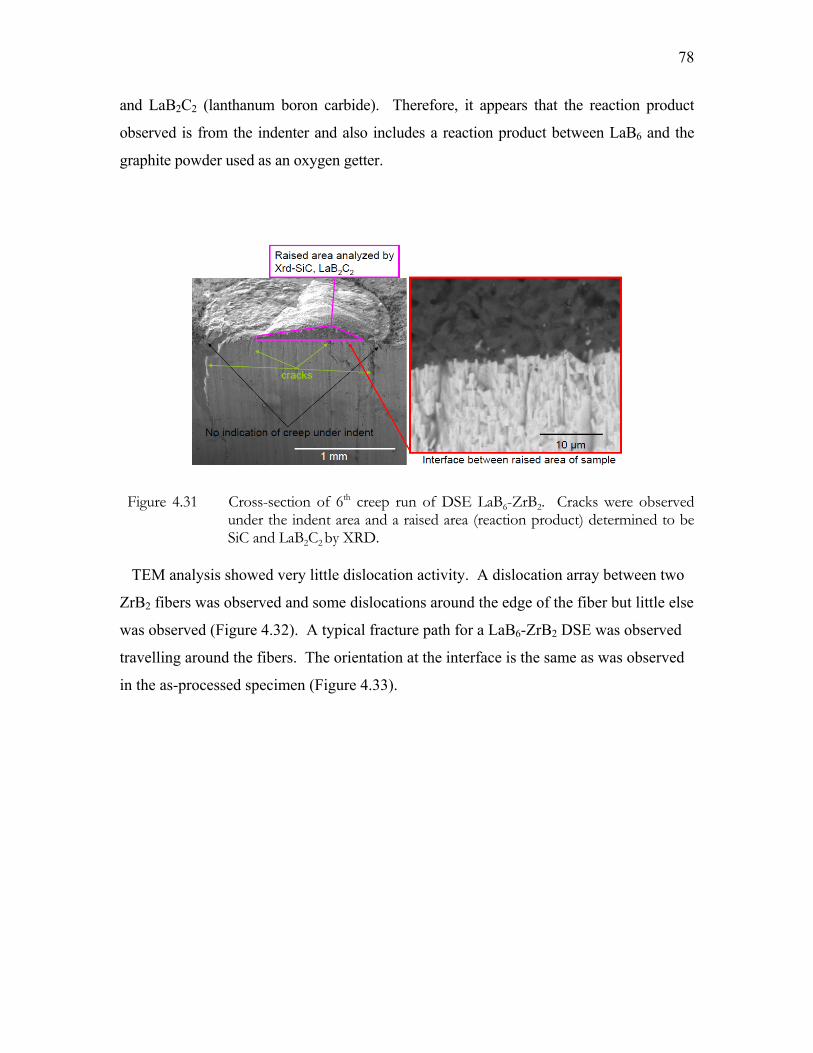
78
and LaB2C2 (lanthanum boron carbide). Therefore, it appears that the reaction product
observed is from the indenter and also includes a reaction product between LaB6 and the
graphite powder used as an oxygen getter.
Figure 4.31 Cross-section of 6th creep run of DSE LaB6-ZrB2. Cracks were observed under the indent area and a raised area (reaction product) determined to be SiC and LaB2C2 by XRD.
TEM analysis showed very little dislocation activity. A dislocation array between two
ZrB2 fibers was observed and some dislocations around the edge of the fiber but little else
was observed (Figure 4.32). A typical fracture path for a LaB6-ZrB2 DSE was observed
travelling around the fibers. The orientation at the interface is the same as was observed
in the as-processed specimen (Figure 4.33).

79
Figure 4.32 TEM micrograph of 6th LaB6-ZrB2 creep sample.
Figure 4.33 TEM micrograph and interface diffraction pattern for the 6th
creep run of LaB6-ZrB2 DSE.
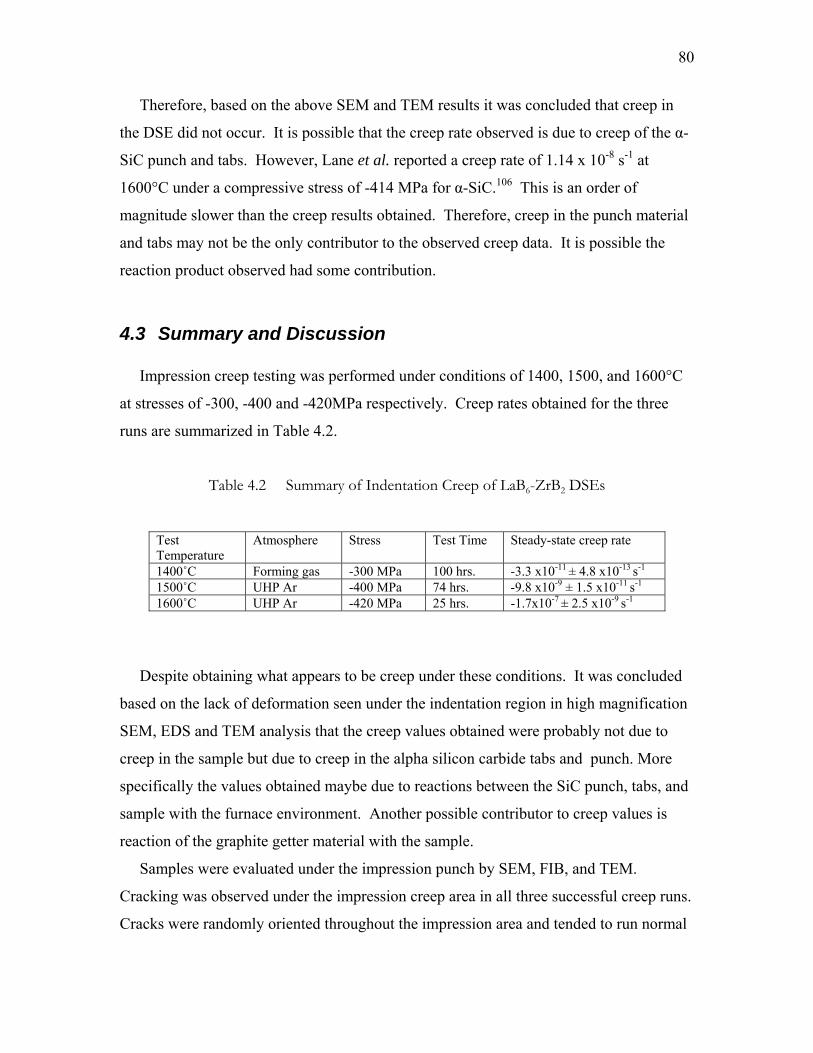
80
Therefore, based on the above SEM and TEM results it was concluded that creep in
the DSE did not occur. It is possible that the creep rate observed is due to creep of the α-
SiC punch and tabs. However, Lane et al. reported a creep rate of 1.14 x 10⁻⁸ s-1 at
1600°C under a compressive stress of -414 MPa for α-SiC.106 This is an order of
magnitude slower than the creep results obtained. Therefore, creep in the punch material
and tabs may not be the only contributor to the observed creep data. It is possible the
reaction product observed had some contribution.
4.3 Summary and Discussion Impression creep testing was performed under conditions of 1400, 1500, and 1600°C
at stresses of -300, -400 and -420MPa respectively. Creep rates obtained for the three
runs are summarized in Table 4.2.
Table 4.2 Summary of Indentation Creep of LaB6-ZrB2 DSEs
Test Temperature
Atmosphere Stress Test Time Steady-state creep rate
1400˚C Forming gas -300 MPa 100 hrs. -3.3 x10⁻¹¹ ± 4.8 x10⁻¹³ s-1 1500˚C UHP Ar -400 MPa 74 hrs. -9.8 x10⁻⁹ ± 1.5 x10⁻¹¹ s-1 1600˚C UHP Ar -420 MPa 25 hrs. -1.7x10⁻⁷ ± 2.5 x10⁻⁹ s-1
Despite obtaining what appears to be creep under these conditions. It was concluded
based on the lack of deformation seen under the indentation region in high magnification
SEM, EDS and TEM analysis that the creep values obtained were probably not due to
creep in the sample but due to creep in the alpha silicon carbide tabs and punch. More
specifically the values obtained maybe due to reactions between the SiC punch, tabs, and
sample with the furnace environment. Another possible contributor to creep values is
reaction of the graphite getter material with the sample.
Samples were evaluated under the impression punch by SEM, FIB, and TEM.
Cracking was observed under the impression creep area in all three successful creep runs.
Cracks were randomly oriented throughout the impression area and tended to run normal
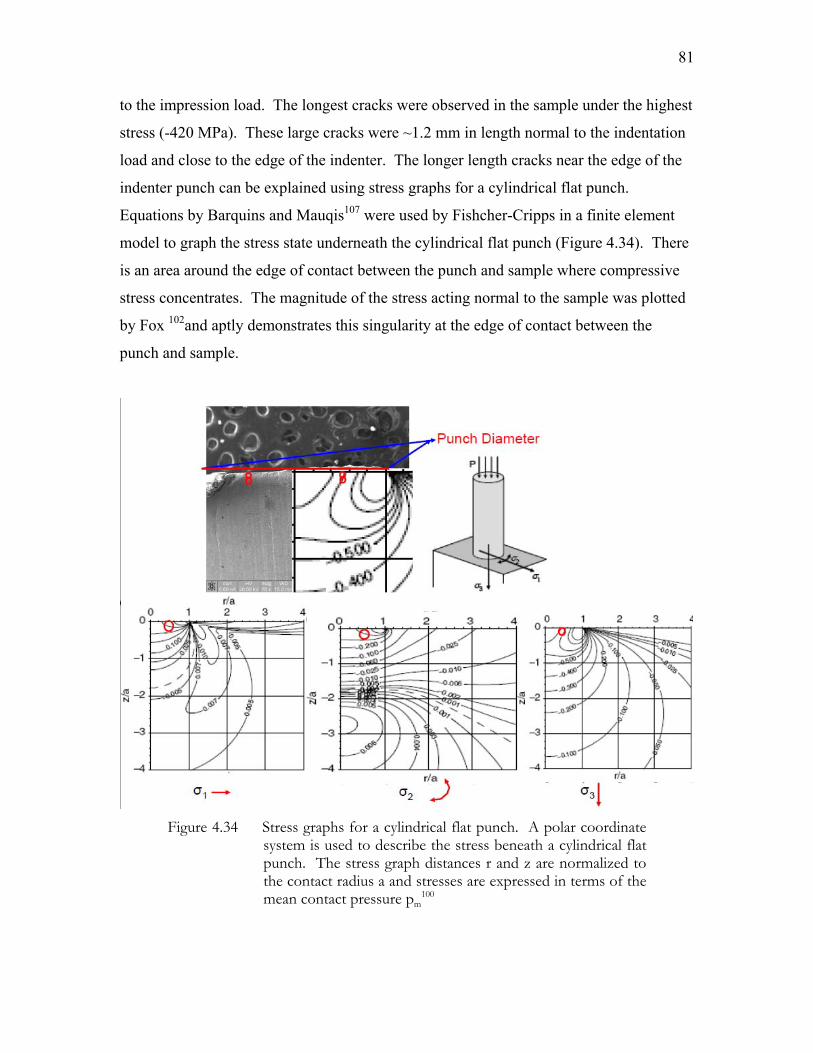
81
to the impression load. The longest cracks were observed in the sample under the highest
stress (-420 MPa). These large cracks were ~1.2 mm in length normal to the indentation
load and close to the edge of the indenter. The longer length cracks near the edge of the
indenter punch can be explained using stress graphs for a cylindrical flat punch.
Equations by Barquins and Mauqis107 were used by Fishcher-Cripps in a finite element
model to graph the stress state underneath the cylindrical flat punch (Figure 4.34). There
is an area around the edge of contact between the punch and sample where compressive
stress concentrates. The magnitude of the stress acting normal to the sample was plotted
by Fox 102and aptly demonstrates this singularity at the edge of contact between the
punch and sample.
Figure 4.34 Stress graphs for a cylindrical flat punch. A polar coordinate system is used to describe the stress beneath a cylindrical flat punch. The stress graph distances r and z are normalized to the contact radius a and stresses are expressed in terms of the mean contact pressure pm
100
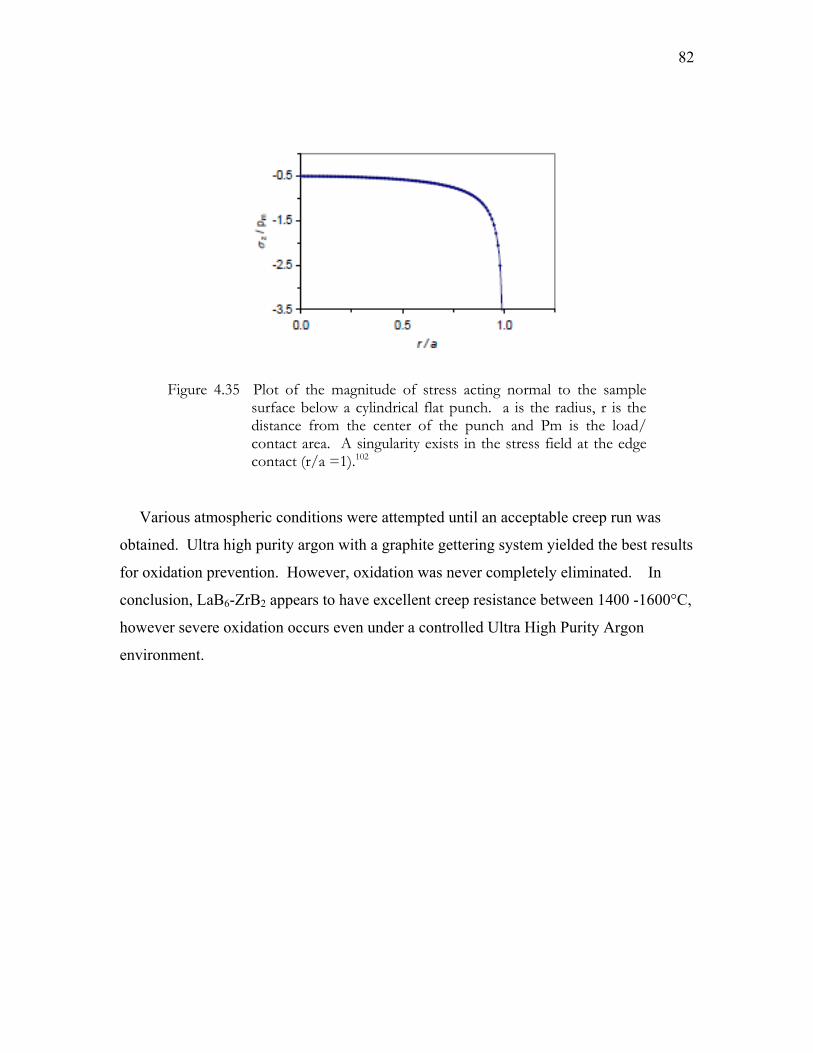
82
Figure 4.35 Plot of the magnitude of stress acting normal to the sample surface below a cylindrical flat punch. a is the radius, r is the distance from the center of the punch and Pm is the load/ contact area. A singularity exists in the stress field at the edge contact (r/a =1).102
Various atmospheric conditions were attempted until an acceptable creep run was
obtained. Ultra high purity argon with a graphite gettering system yielded the best results
for oxidation prevention. However, oxidation was never completely eliminated. In
conclusion, LaB6-ZrB2 appears to have excellent creep resistance between 1400 -1600°C,
however severe oxidation occurs even under a controlled Ultra High Purity Argon
environment.
83
5 Conclusions New materials are needed for ultra-high-temperature applications. Directionally
solidified eutectics possess some desirable mechanical properties for ultra-high-
temperature applications. The majority of directionally solidified eutectic knowledge is
on oxide eutectics, while knowledge of boride eutectics is minimal. However, they
possess desirable mechanical properties that oxide eutectics do not. Directionally
solidified eutectics can be processed by a variety of methods. The float zone method
produces microstructures in the sub micron range. The known room-temperature
mechanical properties of the LaB6-ZrB2 eutectic identify it as a promising ultra-high-
temperature material. Deformation of a floating zone processed directionally solidified
LaB6-ZrB2 eutectic was analyzed at room-temperature as well as high-temperature. After
Vickers indentation dislocations were observed in both phases. Dislocations appeared to
initiate and end in the matrix and do not appear to initiate nor end near the fiber
interfaces. Some dislocations in the LaB6 phase appear to satisfy the slip
system 110}100{ . Other dislocations observed did not appear to satisfy the
invisibility criterion for this slip system. Impression creep testing at 1400, 1500 and
1600°C under stresses of -300,-400 and -420MPa did not deform the LaB6-ZrB2 DSE
sample. Oxidation was an issue in all high-temperature testing conditions. The LaB6-
ZrB2 appears to have excellent creep properties. However, LaB6-ZrB2 does not appear to
be a viable candidate for ultra-high-temperature applications in air because of the poor
resistance to oxidation.
84
6 Future Work LaB6-ZrB2 DSE is not a viable candidate for ultra-high-temperature applications in air
because of its poor oxidation resistance. However, because LaB6-ZrB2 does have
excellent creep resistance, knowledge of deformation mechanisms has the potential to
help with the identification and fabrication of other materials that are viable candidates.
Current creep testing at temperatures up to 1600ºC did not reveal deformation by SEM
and TEM analysis of the material. Performing higher temperature and higher load creep
tests are necessary to induce deformation in the DSE. This would also give deformation
data at temperatures closer to application conditions. Based on the known creep data for
ZrB2 presented earlier, in conjunction with the known mechanical improvements realized
for DSE composites, a significant increase in testing temperature may be necessary.
Modification of the furnace with refractory metal elements and heat shields in order to
achieve a higher temperature and prevent oxidation should be performed. Another way
of guarantying deformation of the substrate at high-temperature would be to use a
different type of indentation mechanism for higher loads. Using a controlled atmospheric
Vickers indentation at high-temperature is a possible way of getting high-temperature
deformation results. Creep testing so far on the LaB6-ZrB2 DSE was only performed
normal to the [001] growth direction, turning the sample 90° and performing creep
testing should be done to evaluate creep in a different fiber orientation and would give us
information on how the ZrB2 fiber reinforcing phase influences creep. Finally for
complete creep analysis of the LaB6-ZrB2 DSE system and its components, impression
creep testing on the LaB6 and ZrB2 DSE single crystal monophases should be performed.
As stated previously no known creep testing has been performed on single crystal LaB6
and very limited compression creep testing has been performed on single crystal ZrB2.
To complete the slip system studies at room-temperature, more two-beam TEM
conditions should be performed on the Vickers indented LaB6 and ZrB2 phases. Two
beam conditions were performed in the g200 LaB6 and g010 LaB6 orientations. Because
other dislocations did not meet the invisibility criterion for the 110}100{ slip system
other two beam conditions should be performed. Two beam conditions for the suggested
slip systems )1021}1010{,0211}0001({ and of ZrB2 should be investigated in the

85
DSE. Finally, looking at slip systems in terms of Brooks et al. and the hardness
anisotropy in the LaB6ZrB2 DSE would give a more complete study of the slip system.
Unfortunately this study confirms that this LaB6-ZrB2 DSE sample is not capable of
meeting the requirements necessary for use in an ultra-high-temperature environment. In
conclusion, none of the current available composite materials has all the properties
needed for high-temperature use. DSEs with better oxidation resistance should be
investigated further. New and unique ultra-high-temperature materials need to be
researched. The use of complex materials consisting of more than a binary composite
should be investigated further.

86
Appendix

87
References 1 Opeka, M.M., Talmy, I.G., and Zaykoski, J.A., "Oxidation-Based Materials
Selection for 2000deg. C+ Hypersonic Aerosurfaces: Theoretical Considerations and Historical Experience." Journal of Materials Science 29, 5887-5904 (2004).
2 Singh, J., Sutaria, M., and Ferber, M., "Use of Indentation Technique to Measure
Elastic Modulus of Plasma-Sprayed Zirconia Thermal Barrier Coating." Ceramic Engineering & Science Proceedings 18 (4), 191-200 (1997).
3 Upadhya, K, Yang, J.M., and Hoffman, W.P., "Materials for Ultrahigh
Temperature Structural Applications." American Ceramic Society Bulletin 76 (12), 51-56 (1997).
4 The Defense Science Board, “More Fight-Less Fuel,” Report of the Defense
Science Board Task Force on DoD Energy Strategy, 1-135, (2008) . 5 Waku, Y., Nakagawa, N., Wakamoto, T., Ohtsubo, H., Shimizo, K., and Kohtoku,
Y., "The Creep and Thermal Stability Characteristics of A Unidirectionally Solidified Al2O3/YAG Eutectic Composite," Journal of Materials Science 33, 4943-4951 (1998).
6 Williamson, S.H., "Six Ways to Compute the Relative Value of a U.S. Dollar
Amount, 1774 to Present," Available at ohttp://www.measuringworth.com/uscompare/, (2008).
7 Waku, Y., and Sakuma, T., "Dislocation Mechanism of Deformation and Strength
of Al2O3-YAG Single Crystal Composites at High Temperatures Above 1500 Degrees C," Journal of the European Ceramic Society 20 (10), 1453-1458 (2000).
8 Schoenman, L., Rosenberg, S.D., and Jassowski, D.M., "Test Experience, 490-N
High-Performance [321-s Specific Impulse] Engine," Journal of Propulsion and Power 11 (5), 992-997 (1995).
9 Fahrenholtz, W.G., and Hilmas, G.E., "Workshop Report," NSF-AFOSR Joint
Workshop on Future Ultra-high Temperature Materials, Arlington VA (2004). 10 Talmy, I.G., Zaykoski, J.A., Opeka, M.M., and Smith, A.H., "Properties of
Ceramics in The System ZrB2-Ta5Si3," Journal of Materials Research 21 (10), 2593-2599 (2006).
11 Wuchina, E., Opeka, M., Gutierrez-Mora, F., Koritala, R.E., Goreta, K.C., and
Routbort, J.L., "Processing and Mechanical Properties of Materials, in the Hf-N System," Journal of the European Ceramic Society 22, 2571-2576 (2002).
88
12 Available at http://www.nationmaster.com/encyclopedia/space-shuttle-thermal-protection-system.
13 Stubican, V.S. and Bradt, R.C., "Eutectic Solidification in Ceramic Systems,"
Annual Review of Materials Science 11, 267-297 (1981). 14 Yi, J., Argon, A.S., and Sayir, A., "Internal Stresses and The Creep Resistance of
The Directionally Solidified Ceramic Eutectics," Materials Science and Engineering 421, 86-102 (2006).
15 Monteverde, F., and Bellosi, A., "Microstructure and Properties of an HfB2-SiC
Composite for Ultra High Temperature Applications," Advanced Engineering Materials 6 (5), 331-336 (2004).
16 Chamberlain, F.W., Hilmas, G., and Ellerby, D., "High-Strength Zirconium
Diboride-based Ceramics," Journal of the American Ceramic Society 87, 1170-1172 (2004).
17 Kurz, W., "A Brief History of The Science of Dendritic and Eutectic Growth
Until 1980," In Solidification and Gravity IV, Vol. 508, pp. 313-323 (2006) 18 LLorca, J., and Orera, V., "Directionally Solidified Eutectic Ceramic Oxides,"
Progress in Materials Science 51, 711-809 (2006). 19 Hulse, C.O., "Mechanical Properties of Al203-HfO2 Eutectic Microstructures,"
edited by F. F. Lange D.P.H. Hasselman,. Plenum Press, New York, 4, 903-912 (1978)
20 Chen, C.M., Zhang, L.T., Zhou, W.C., Hao, Z.Z., Jiang, Y.J., and Yang, S.L.,
"Microstructure, Mechanical Performance and Oxidation Mechanism of Boride In-Situ Composites," Composites Science and Technology 61, 971-975 (2001).
21 Pastor, J.Y., Poza, P., LLorca, J., Pena, J.I., Merino, R.I., and Orera, V.M.,
"Mechanical Properties of Directionally Solidified Al2O3-ZrO2(Y2O3) Eutectics," Materials Science and Engineering A308, 241-249 (2001).
22 Ramirez-Rico, J., Pinto-Gomez, A.R., Martinez-Fernandez, J., Arellano-Lopez,
A.R., Oliete, P.B., Pena, J.I., and Orera, V.M., "High-Temperature Plastic Behavior of Al2O3-Y3Al5O12 Directionally Solidified Eutectics," Acta Materialia 54 (11), 3107-3116 (2006).
23 Haggerty, J.S., Sigalovsky, J., and Courtright, E.L., "Processing and Properties of
Unidirectionally Solidified ZrO2(Y2O3)-Al2O3 Eutectic Reinforcement Fibers," In the Symposium on Processing and Fabrication of Advanced Materials, Pittsburgh PA, (1993).

89
24 Galasso, F.S., Darby, W.L., Douglas, F.C., and Batt, J.A., "Unidirectional Solidification of BaFe12O19-BaFe2O4 Eutectic," Journal of the American Ceramic Society 50 (6), 333-334 (1967).
25 Ordanyan, S., and Paderno, Y., "Interaction in the LaB6-ZrB2 System," Soviet
Powder Metallurgy and Metal Ceramics 22 (251), 946-948 (1983). 26 Deng, H., “Study of The Interface Behavior In Directionally Solidified LaB6-ZrB2
Eutectics,” In College of Earth and Mineral Sceinces, Doctor of Philosophy. The Pennsylvania State University, University Park (2006).
27 Sorrell, C.C., Stubican, V.S., and Bradt, R.C., "Mechanical Properties of ZrC-
ZrB2 and ZrC -TiB2 Directionally Solidified Eutectics," Journal of the American Ceramic Society 69 (4), 317-321 (1986).
28 Ordan'yan, S.S., Vikhman, S.V., and Unrod, V.I., "On the Interaction in SiC-
MIV-VC systems," Russian Journal of Applied Chemistry 73 (12), 2009-2012 (2000).
29 Ordan'yan, S.S., Boldin, A.A., and Prilutskii, E.V., "Interaction in The B4C-W2B5
System," Russian Journal of Applied Chemistry 73 (12), 2128-2130 (2000). 30 Ordan'yan, S.S., Paderno, Y.B., Khoroshilova, I.K., and Nikolaeva, E.E.,
"Interaction in The LaB6-HfB2 System," Soviet Powder Metallurgy and Metal Ceramics (English translation of Poroshkovaya Metallurgiya) 23 (2), 157-159 (1984).
31 Paderno, Y.B., Paderno, V., Filippov, V.B., Mil'man, V.Y., and Marynenko A.N.,
"Structure Features of The Eutectic Alloys of Borides with The d- and f- Transition Metals," Poroshkovaya Metallurgiya 8 (356), 73-80 (1993).
32 Chen, C.M., Zhang, L.T., Zhou, W.C., "Characterization of LaB6-ZrB2 eutectic
composite grown by the floating zone method," Journal of Crystal Growth 191, 873-878 (1998).
33 Pastor, J.Y., Poza, P., LLorca, J., and Salazar, A., "Mechanical Properties of Melt-
Grown Alumina-Yttrium Aluminum Garnet Eutectics up to 1900K," Journal of the American Ceramic Society 88 (6), 1488-1495 (2005).
34 Yang, J.M., Jeng, S.M., and Chang, S., "Fracture Behavior of Directionally
Solidified Y3Al5O12/Al2O3 Eutectic Fiber," Journal of the American Ceramic Society 79 (5), 1218-1222 (1996).
35 Yang, J.M. and Zhu, X.Q., "Thermo-Mechanical Stability of Directionally
Solidified Al2O3ZrO2(Y2O3) Eutectic Fibers," Scripta Materialia 36 (9), 961-966 (1997).

90
36 Lee, J. H., Yoshikawa, A., Kaiden, H., Lebbou, K., Fukuda, T., Yoon, D.H., and
Waku, Y., "Microstructure of Y2O3 Doped Al2O3/ZrO2 Eutectic Fibers Grown By The Micro-pulling-down Method," Journal of Crystal Growth 231 (1-2), 179-185 (2001).
37 Echigoya, J., Takabayashi, Y., and Suto, H., "Hardness and Fracture Toughness
of Directionally Solidified Al2O3-ZrO2(Y2O3) Eutectics," Journal of Materials Science Letters 5 (2), 153-154 (1986).
38 Larrea, A., Orera, V. M., Merino, R. I., and Pena, J. I., "Microstructure and
Mechanical Properties of Al2O3-YSZ and Al2O3-YAG Directionally Solidified Eutectic Plates," Journal of the European Ceramic Society 25 (8), 1419-1429 (2005).
39 Pastor J.Y., LLorca J., and Poza P., "Mechanical Properties of Melt-Grown Al203-
ZrO2(Y2O3) Eutectics with Different Microstructure," Journal of the European Ceramic Society 25 (8), 1215-1223 (2005).
40 Sorrell, C.C., Beratan, H.R., Bradt, R.C., and Stubican, V.S., "Directional
Solidification of (Ti,Zr) Carbide-(Ti,Zr) Diboride Eutectics," Journal of the American Ceramic Society 67 (3), 190-194 (1984).
41 Sayir, A., Farmer, S.C., Dickerson, P., and Chait, A., "Laser Heated Oxide Fiber
Growth Using Melt Modulation Technique," In the Proceedings of the RTO Applied Vehicle Technology Panel, Brussels, Belgium 1-17 (1998).
42 Courtright, E.L., Haggerty, J. S., and Sigalovsky, J., "Controlling Microstructures
in ZrO2(Y2O3)-Al2O3 Eutectic Fibers," In Proceedings of the 17th Annual Conference on Compounds and Advanced Ceramic Materials, Part 1 of 2: Ceramic Engineering and Science Proceedings, 14 7/8 671-681 (2008).
43 Paderno, Y.B., "A New Class of "In-Situ" Fiber Reinforced Boride Composite
Ceramic Materials," in Advanced Multilayered and Fibre-Reinforced Composites, edited by Y.M. Haddad Kluwer Academic Pulishers, Netherlands, 353-369 (1998)
44 Tiller, W.A., "Polyphase Solidification," in Liquid Metas and Solidification,
edited by D. J. S. Day M.G. Cooksey, ASM, Cleveland, OH, 276-318 (1958) 45 Ashbrook, R.L., "Directionally Solidified Ceramic Eutectics," Journal of the
American Ceramic Society 60 (9), 428-435 (1977). 46 Cooksey, D.J.S., Munson, D., Wilkinson, M.P., and Hellawell, A., "Freezing of
Some Continuous Binary Eutectic Mixtures," Philosophical Magazine 10 (107), 745-769 (1964).

91
47 Jackson, K.A. and Hunt, J.D., "Lamellar and Rod Eutectic Growth," Transactions
of the Metallurgical Society of Aime 236 (8), 1129-1142 (1966). 48 PowderDiffraction, International Centre for Diffraction Data JCPDS--
International Centre for Diffraction Data, (1992).
49 Okamoto N., Kusakari M., Tanaka K., Inui H., and Yamaguchi M., "Temperature
Dependence of Thermal Expansion and Elastic Constants of Single Crystals of ZrB2 and The Suitability of ZrB2 As A Substrate for GaN Film," Journal of Applied Physics 93 (1), 88 (2003).
50 Paderno Y.B., Paderno V., and Filippov V.B., "Some Crystal Chemistry
Relationships in Eutectic Cocrystallization of d and f Transition Metal Borides," Journal of Alloys and Compounds 219 116-118 (1995).
51 Chen, C.M., Zhou, W.C., and Zhang, L.T., "Structure Characteristics and
Crystallography of LaB6-ZrB2 In-Situ Composite," Progress in Natural Science 8 (1), 74-78 (1998).
52 Srinivas, S., Satyanarayana, D.V.V., and Pandey, M.C., "Creep testing,"
Transactions of the Indian Institute of Metals 49 (5), 625-640 (1996).
53 Phillips, P., "The Slow Stretch in Indiarubber, Glass, and Metal Wires When Subjected To A Constant Pull," Proceedings of the Physical Society of London 19, 491-511 (1903).
54 Andrade, E. N. da C., "On the Viscous Flow in Metals, and Allied Phenomena," Proceedings of the Royal Society of London. Series A, Containing Papers of a Mathematical and Physical Character 84 (567), 1-12 (1910).
55 Cannon, W. R. and Langdon, T. G., "Creep of Ceramics Part 1. Mechanical Characteristics," Journal of Materials Science 18 (1), 1-50 (1983).
56 Wachtman Jr, J.B., and Maxwell, L.H., "Plastic Deformation of Ceramic-Oxide Single Crystals, II," Journal of the American Ceramic Society 40 (11), 377-385 (1957).
57 Chu, S. N. G. and Li, J. C. M., "Impression Creep - New Creep Test," Journal of Materials Science 12 (11), 2200-2208 (1977).
58 Li, J.C.M., "Impression Creep and Other Localized Tests," Materials Science and Engineering A322, 23-42 (2002).

92
59 Chen, H. and Li, C. M., "Viscosity of an ABS Polymer Measured by Impression Creep Tests," in Micromechanics of Advanced Materials. Edited by Chu, S.N.G. TMS, Warrendale, PA 367-371 (1995).
60 Norton, F.H., The Creep of Steel at High Temperatures. McGraw-Hill Book Company Inc., McGraw HIll, New York (1929).
61 Miyazaki, N., Ikeda, T., and Komura, T., "Estimation of Steady-State Creep Behavior of Al2O3/YAG Eutectic Composite by Image-Based Finite Element Analysis," Journal of Engineering Materials and Technology-Transactions of the ASME 125 (3), 277-282 (2003).
62 Cannon, W. R. and Langdon, T. G., "Creep Ceramics Part 2. An Examination of Flow Mechanisms," Journal of Materials Science 23 (1), 1-20 (1988).
63 Matson, L.E., and Hecht, N., "Creep of Directionally Solidified Alumina/YAG Eutectic Monofilaments," Journal of the European Ceramic Society 25, 1225-1239 (2005).
64 Poirier, J., Creep of Crystals. (Cambridge University Press, Cambridge, 1985);
Gunjishima, I., Akashi, T., and Goto, T., "Characterization of Directionally Solidified B4C-SiC Composites Prepared by a Floating Zone Method," Materials Transactions 43 (9), 2309 (2002).
65 Callister, W.D., Materials Science and Engineering: An Introduction, 6th ed. John Wiley & Sons, (2003).
66 Martinez-Fernandez J.M., Sayir A., and Farmer S.C., "High Temperature Creep Deformation of Directionally Solidified Al2O3/Er3Al5O12," Acta Materialia 51, 1705-1720 (2003).
67 Parthasarathy, T.A., Mah, T.I., and Matson, L.E., "Deformation Behavior of an Al2O3-Y3Al5O12 Eutectic Composite in Comparison with Sapphire and YAG," Journal of the American Ceramic Society 76 (1), 29-32 (1993).
68 Farmer S.C., Sayir A., "Tensile Strength and Microstructure of Al2O3-ZrO2 Hypo-Eutectic Fibers," Engineering Fracture Mechanics 69, 1015-1024 (2002).
69 Sayir A., and Farmer S.C., "The Effect of the Microstructure on Mechanical Properties of Directionally Solidified Al2O3/ZrO2(Y2O3) Eutectic," Acta Materialia. 48, 4691-4697 (2000).
70 Sayir A, and Farmer SC, "Fracture Characteristics of Single Crystal and Eutectic Fibers," In Fiber Fracture, edited by Llorca ,J., Elices, M., Elsevier Science Ltd., (2002)
93
71 Harada, Y., Suzuki, T., Hirano, K., and Waku, Y., "Ultra-High Temperature Compressive Creep Behavior of an In-Situ Al2O3 Single-Crystal/YAG Eutectic Composite," Journal of the European Ceramic Society 24 (8), 2215-2222 (2004).
72 Martinez-Fernandez, J. and Sayir, A., "Creep of Directionally Solidified A12O3/Er3Al5O12 Fibers with Hypo-Eutectic Composiition," Ceramic Engineering and Science Proceedings 22 (3) 421-428.(2001)
73 Chen, C. H., Xuan, Y., and Otani, S., "Temperature and Loading Time Dependence of Hardness of LaB6, YB6 and TiC Single Crystals," Journal of Alloys and Compounds 350 (1-2), L4-L6 (2003).
74 Haggerty, J.S., and Lee, D.W., "Plastic Deformation of ZrB2 Single Crystals," Journal of the American Ceramic Society 54 (11), 572-576 (1971).
75 Melendez-Martinex J.J., Dominquez-Rodriguez A., Monteverde F., Melandri C., and DePortu G., "Characterisation and High-Temperature Mechanical Properties of Zirconium Boride Based Materials," Journal of the European Ceramic Society 22, 2543-2549 (2002).
76 Vahldiek, F.W., and Mersol, S.A., "Slip and Microhardness of IVa to VIa Refractory Materials," Journal of the Less Common Metals 55 (2), 265-278 (1977).
77 Brookes, C.A., O'Neill, J.B., and Redfern, B.A.W., "Anisotropy in Hardness of
Single Crystals," In Proceedings of The Royal Society of London, Series A 322, 73-88, (1971).
78 Nakano, K., "Hardness Anisotropy of Single Crystals of IVa-Diborides," Japanese Journal of Applied Physics 12 (2), 186-189 (1973).
79 Nakano, K., Matsubara, H., and Imura, T., "High-Temperature Hardness of IVA-Diborides Single Crystals," Journal of the Less Common Metals 47, 259-264 (1976).
80 Xuan Y, Chen C.H., and Otani S., "High-Temperature Microhardness of ZrB2 Single Crystals," Journal of Physics 35, L98-L100 (2002).
81 Aida T., and Fukazawa T., "Dislocations in LaB6 Crystals Grown with A Xenon Arc Image Furnace," Journal of Crystal Growth 78, 263-273 (1986).
82 Li, H., and Bradt, R.C., "Knoop Microhardness Anisotropy of Single-Crystal LaB6," Materials Science and Engineering A 142 (1), 51-61 (1991).

94
83 Williams, J.C., Thompson, A.W., and Baggerly, R.G., "Accurate Description of Slip Character," Scripta Metallurgica 8 (6), 625-630 (1974).
84 Daniels, F.W., and Dunn, C.G. "The Effect of Orientation on Knoop Hardness of Single Crystals of Zinc and Silicon Ferrite," Transactions of the American Society for Metals 41, 419-442 (1949).
85 Feng, C., and Elbaum, C., "Effect of Crystallographic Orientation and Oxygen Content on Knoop Hardness Values of Iodide Titanium," Transactions of the American Institute of Mining and Metallurgical Engineers 212, 47-50 (1958).
86 Garfinkle, M., and Garlick, R.G., "Stereographic Representation of Knoop Hardness Anisotropy," Metallurgical Society of American Institute of Mining, Metallurgical and Petroleum Engineers -- Transactions 242 (5), 809-814 (1968).
87 Schwartz, M., Nash, S.K., and Zeman, R., "Hardness Anisotropy In Single Crystal
and Polycrystalline Magnesium," Metallurgical Society of American Institute of Mining, Metallurgical and Petroleum Engineers -- Transactions 221 (3), 554-560 (1961).
88 Rittenhouse, P.L. and Picklesimer, M.L., "Microhardness Anisotropy In Zirconium + Zircalloy-2 Single Crystals," Journal of Metals 16 (1), 129 (1964).
89 Shaffer, P.T.B., "Effect of Crystal Orientation On Hardness of Silicon Carbide.," Journal of the American Ceramic Society 47 (9), 466 (1964).
90 Partridge, P.G. and Roberts, E., "Microhardness Anisotropy of Magnesium and
Zinc Single-Crystals," Journal of the Institute of Metals 92 (2), 50 (1963).
91 Morral, F.R. Journal of Metals 10, 662 (1958).
92 Vahldiek, F.W., and Mersol, S.A., "Anisotropy in Single-Crystal Refractory Compounds," In the Proceedings of the Symposium of Anisotropy in Refractory Compound Single Crystals, (1968)
93 Frazer, C.S., Dickey, E.C., and Sayir, A., "Crystallographic Texture and Orientation Variants in Al203-Y3Al5O12 Directionally Solidified Eutectic Crystals," Journal of Crystal Growth 233, 187-195 (2001).
94 Carrard, M., Gremaud, M., Zimmermann, M., and Kurz, W., "About the Banded Structure in Rapidly Solidified Dendritic and Eutectic Alloys," Acta Materialia 40 (5), 983-996 (1992).
95 Farmer, S.C., Sayir, A., and Dickerson, P.O., "Mechanical and Microstructural Characterization of Directionally Solidified Alumina-Zirconia Eutectic Fibers," In the Sympossium Proceedings In-Situ Composites, Warrendale, Pa, (1993)
95
96 Deng H., Dickey E.C., Paderno Y., Paderno V., Filippov V., and Sayir A., "Crystallographic Characterization and Indentation Mechanical Properties of LaB6-ZrB2 Directionally Solidified Eutectics," Journal of Materials Science 39, 5987-5994 (2004).
97 Giannuzzi L.A., Geurts R., and Ringnalda J., "2 keV Ga+ FIB Milling for Reducing Amorphous Damage in Silicon," Microscopy and Microanalysis 11, 828-829 (2005).
98 Deng, H., Dickey E.C., Paderno Y., and Filippov V., "Interface Crystallography and Structure in LaB6-ZrB2 Directionally Solidified Eutectics," Journal of the American Ceramic Society 90 (8), 2603-2609 (2007).
99 Monteverde F., and Bellosi A., "Beneficial Effects of AlN as Sintering Aid on Microstructure and Mechanical Properties of Hot-Pressed ZrB2," Advanced Engineering Materials 5 (7), 508-512 (2003).
100 Fisher-Cripps, A.C., "Introduction to Contact Mechanics," New York: Springer. (2000).
101 Kitamura, K., Ii, N., Shindo, I., and Kimura, S., "Interface shape and horizontal variations of Al and Ga contents in substituted YIG single crystals grown by the floating zone method," Journal of Crystal Growth 46 (2), 277 (1979).
102 Fox, K.M., "Characterization and Impression Creep Testing of SiAlON Ceramics," In College of Earth and Mineral Sciences, Doctor of Philosophy, The Pennsylvania State University, University Park (2005).
103 Fox K.M., Hellmann J.R., Dickey E.C., Green D.J., Shelleman D.L., and Yeckley R.L., "Impression and Compression Creep of SiALON Ceramics," Journal of the American Ceramic Society 89 (8), 2555-2563 (2006).
104 Levin, E. M., Robbins, C. R., and Waring, J. L., "Immiscibility and The System Lanathanum Oxide-Boride Oxide," Journal of the American Ceramic Society 44 (2), 87-91 (1961).
105 Chen C.M., Zhang L.T., Zhou W.C., and LI M.Q., "High Temperature Oxidation of LaB6-ZrB2 Eutectic In-Situ Composite," Acta Materialia. 47 (6), 1945-1952 (1999).
106 Lane, J. E., Carter, C. H., and Davis, R. F., "Kinetics and Mechanisms of High-
Temperature Creep in Silicon-Carbide .3. Sintered Alpha-Silicon Carbide," Journal of the American Ceramic Society 71 (4), 281-295 (1988).

96
107 Barquins M.,and Mauqis D., "Adhesive Contact of Axisymmetric Punches on an Elastic Half-Space: The Modified Hertz-Huber's Stress Tensor for Contacting Spheres," Journal of Theoretical and Applied Mechanics 1 (2), 331-357 (1982).