Embed Size (px)
Citation preview

EPTD DISCUSSION PAPER NO. 87
Environment and Production Technology Division
International Food Policy Research Institute 2033 K Street, N.W.
Washington, D.C. 20006 U.S.A.
January 2002 EPTD Discussion Papers contain preliminary material and research results, and are circulated prior to a full peer review in order to stimulate discussion and critical comment. It is expected that most Discussion Papers will eventually be published in some other form, and that their content may also be revised.
THE PAYOFFS TO AGRICULTURAL BIOTECHNOLOGY:
AN ASSESSMENT OF THE EVIDENCE
Michele C. Marra, Philip G. Pardey, and Julian M. Alston

EPTD DISCUSSION PAPER NO. 87
Environment and Production Technology Division
International Food Policy Research Institute 2033 K Street, N.W.
Washington, D.C. 20006 U.S.A.
January 2002 EPTD Discussion Papers contain preliminary material and research results, and are circulated prior to a full peer review in order to stimulate discussion and critical comment. It is expected that most Discussion Papers will eventually be published in some other form, and t hat their content may also be revised.
THE PAYOFFS TO AGRICULTURAL BIOTECHNOLOGY:
AN ASSESSMENT OF THE EVIDENCE
Michele C. Marra, Philip G. Pardey, and Julian M. Alston

i
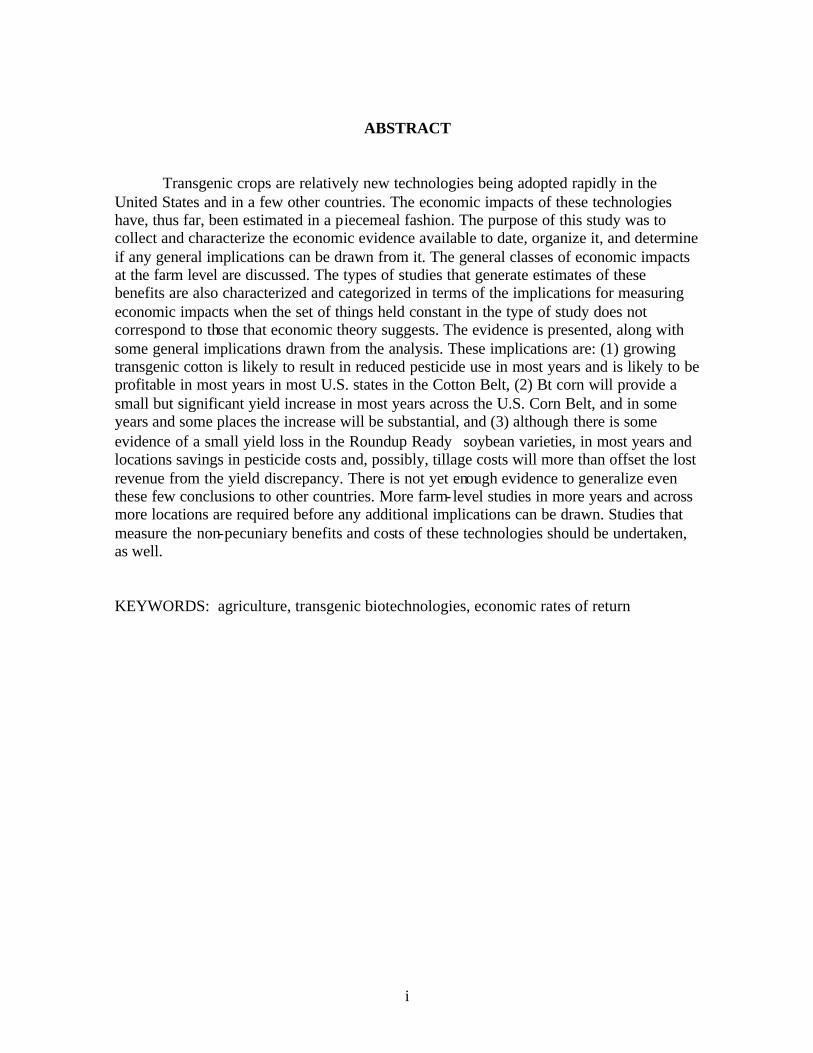
ABSTRACT
Transgenic crops are relatively new technologies being adopted rapidly in the United States and in a few other countries. The economic impacts of these technologies have, thus far, been estimated in a piecemeal fashion. The purpose of this study was to collect and characterize the economic evidence available to date, organize it, and determine if any general implications can be drawn from it. The general classes of economic impacts at the farm level are discussed. The types of studies that generate estimates of these benefits are also characterized and categorized in terms of the implications for measuring economic impacts when the set of things held constant in the type of study does not correspond to those that economic theory suggests. The evidence is presented, along with some general implications drawn from the analysis. These implications are: (1) growing transgenic cotton is likely to result in reduced pesticide use in most years and is likely to be profitable in most years in most U.S. states in the Cotton Belt, (2) Bt corn will provide a small but significant yield increase in most years across the U.S. Corn Belt, and in some years and some places the increase will be substantial, and (3) although there is some evidence of a small yield loss in the Roundup Ready soybean varieties, in most years and locations savings in pesticide costs and, possibly, tillage costs will more than offset the lost revenue from the yield discrepancy. There is not yet enough evidence to generalize even these few conclusions to other countries. More farm-level studies in more years and across more locations are required before any additional implications can be drawn. Studies that measure the non-pecuniary benefits and costs of these technologies should be undertaken, as well. KEYWORDS: agriculture, transgenic biotechnologies, economic rates of return


ii
ACKNOWLEDGMENTS
The authors thank Alice Kassens, Bailey Norwood, and Patricia Zambrano for their very able research assistance, and the Swedish International Development Agency (Sida) and the NSF Center for Integrated Pest Management for providing the funds to carry out this research.

iii
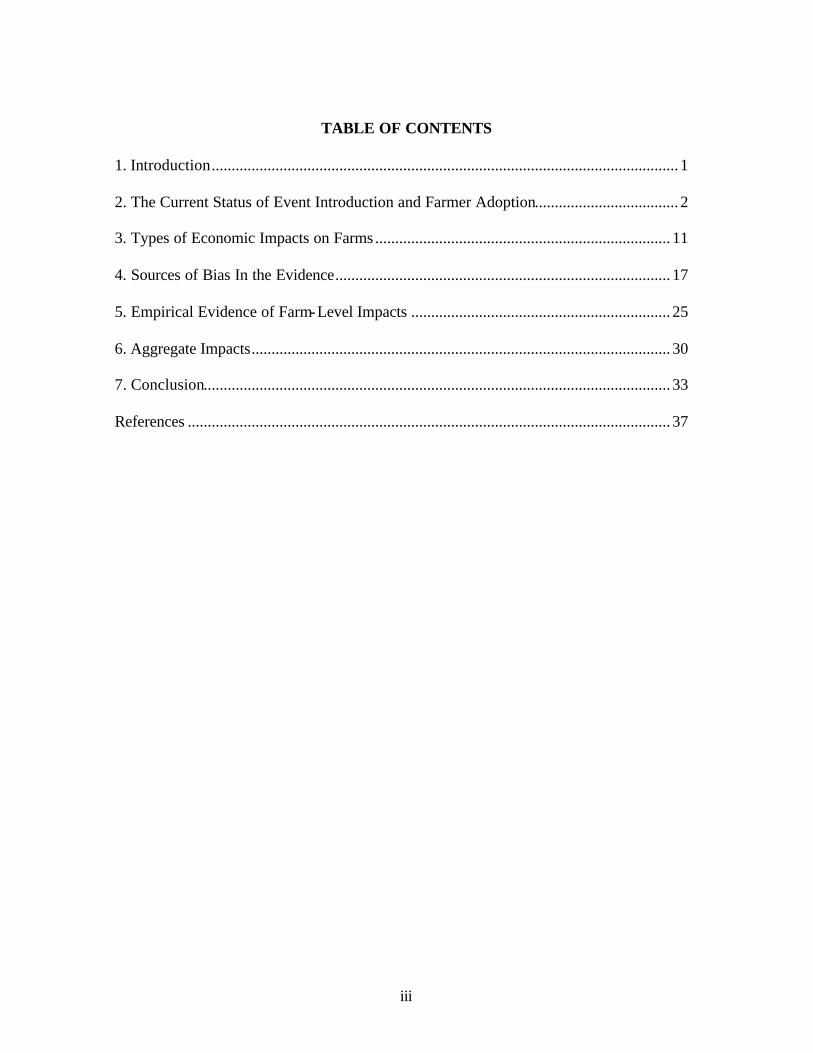
TABLE OF CONTENTS
1. Introduction..................................................................................................................... 1 2. The Current Status of Event Introduction and Farmer Adoption.................................... 2 3. Types of Economic Impacts on Farms .......................................................................... 11 4. Sources of Bias In the Evidence.................................................................................... 17 5. Empirical Evidence of Farm-Level Impacts ................................................................. 25 6. Aggregate Impacts......................................................................................................... 30 7. Conclusion..................................................................................................................... 33 References ......................................................................................................................... 37


THE PAYOFFS TO AGRICULTURAL BIOTECHNOLOGY: AN ASSESSMENT OF THE EVIDENCE
Michele C. Marra,1 Philip G. Pardey, 2 and Julian M. Alston3
1. INTRODUCTION
The first transgenic crop was approved for commercial release less than 10 years
ago. The Flavr-Savr tomato, genetically engineered to delay softening so the tomato
could ripen on the vine and retain its "fresh picked" flavor, was introduced commercially
in the United States in 1994. It was a scientific success, but a colossal business failure.
Although the tomatoes achieved the delayed-softening and taste-retention objectives of
their developers, yields were poor, mechanical handling equipment turned most of them
into mush before they got to market, and consumers weren't willing to pay enough of a
premium over conventional fresh tomatoes to cover costs. The seeds of the biotechnology
protests started with the Flavr-Savr, too, when Jeremy Rifkin managed to persuade the
Campbell's Soup Company not to use biotech tomatoes in its products (Kasler and Lau
2000).
Nevertheless, seven years later farmers in several countries where the transgenic
crops have been approved for planting are devoting significant portions of acreage to them.
Their costs and benefits at the farm level have been documented in ex ante economic
studies, farmer testimonials in the farm press, and reports issued by national departments
1 Michele Marra is a Professor in the Department of Agricultural and Resource Economics at North Carolina State University, 2 Philip Pardey is a Senior Research Fellow at the International Food Policy Research Institute. 3Julian Alston is a Professor in the Department of Agricultural and Resource Economics at the University of California, Davis.

2
of agriculture. In addition, few studies have attempted to measure the impacts among
producers and consumers and other participants in the marketing chain by aggregating up
from the farm-level studies. Nevertheless, specific information is still sketchy for many of
the events,4 and the reported economic impacts vary widely in both size and magnitude,
even within the same location and for the same event in some cases.
Most of the studies so far have been conducted in the United States, and the
impacts have been measured under U.S. conditions. This is a natural consequence of the
fact that transgenic crops were first developed in the United States, and subsequently first
approved for adoption and adopted in the United States. With increasing adoption in other
countries, especially in less-developed countries, in future there will be more potential to
present a more-balanced global picture. This study critically examines evidence of
economic impacts reported to date, to categorize the types of evidence by potential biases
and provide a range of values for some of the impacts based on the available results from
public research.
2. THE CURRENT STATUS OF EVENT INTRODUCTION AND FARMER ADOPTION
EVENT INTRODUCTION
By early 2001, more than 187 crop events involving nine basic phenotypic
(physical) characteristics have been deregulated or approved for planting, feed, or food use
in at least one of 13 individual countries plus the countries of the European Union (E.U.).
4 An event is a specific gene insertion in a particular crop that results in a desired expressed trait in the crop. For example, insertion of the Bt cry1A(c) protein into various cotton varieties is considered to be one event.

3
Successfully modified traits important for the major agricultural crops include delayed
ripening, herbicide tolerance, insect resistance, modified color or oil, controllable male
fertility, and virus resistance (AGBIOS Inc. 2001). Table 1 lists the major agricultural
crops by modified trait, country approving at least one event within the trait, and type of
approval as of February 2001. The majority of the approved events have been for food uses
and over a fifth involved approvals for food or livestock feed uses without planting
approval, implying that livestock and feed producers in the relevant country must import
the feed. Most of the approvals have been issued in Canada and the United States, with
very few issued so far in developing countries.
Table 1Major transgenic crops by trait, country, and approval type
Approval type
Crop Trait Country Unconfined
planting Feed use
Food use
Canola Herbicide-tolerant Australia ü Canada ü ü ü European Union Japan ü ü ü United States ü ü ü Herbicide-tolerant and Canada ü ü ü controllable male fertility European Union Japan ü ü ü United States ü ü ü Oil content Canada ü ü ü United States ü ü ü
Carnations Delayed ripening Australia ü European Union ü Flower color Australia ü European Union
Chicory Herbicide-tolerant and controllable male fertility
European Union ü
Corn Herbicide-tolerant Argentina ü ü ü Australia ü Canada ü ü ü European Union ü ü Japan ü ü ü United States ü ü ü

4
Herbicide-tolerant and Canada ü ü ü controllable male fertility United States ü ü ü Insect-resistant Argentina ü ü ü Australia ü Canada ü ü ü European Union ü ü ü
Table 1Major transgenic crops by trait, country, and approval type (continued)
Approval type
Crop Trait Country Unconfined
planting Feed use
Food use
Japan ü ü ü South Africa ü ü ü Switzerland ü ü United States ü ü ü Insect-resistant and Argentina ü ü ü
herbicide-tolerant Canada ü ü ü Denmark ü European Union ü ü ü Japan ü ü ü The Netherlands ü ü
Switzerland ü ü United Kingdom ü ü United States ü ü ü
Cotton Herbicide-tolerant Argentina ü Australia ü ü Canada ü ü ü Japan ü ü ü United States ü ü ü Herbicide-tolerant Japan ü ü ü and insect-resistant United States ü ü ü Insect-resistant Argentina ü ü ü Australia ü ü ü Canada ü ü China ü ü ü Japan ü ü ü Mexico ü ü ü South Africa ü ü ü United States ü ü ü
Melon Delayed ripening United States ü ü Papaya Viral-resistant United States ü ü Potato Insect-resistant Canada ü ü ü
Japan ü United States ü ü ü Insect-resistant Canada ü ü ü

5
and viral-resistant United States ü ü ü
Rice Herbicide-tolerant United States ü ü ü Soybeans Herbicide-tolerant Argentina ü ü ü
Australia ü Brazil ü ü ü Canada ü ü ü

6
Table 1Major transgenic crops by trait, country, and approval type (continued)
Approval type
Crop Trait Country Unconfined
planting Feed use
Food use
European Union Japan ü ü ü Korea ü
Mexico ü ü ü The Netherlands ü ü Russia ü Switzerland ü ü United States ü ü ü
Soybeans (continued) Uruguay ü ü ü Oil content Australia ü Canada ü ü ü Japan ü ü United States ü ü ü
Squash Viral-resistant Canada ü United States ü ü
Sugar Beets Herbicide-tolerant Canada ü Japan ü ü United States ü ü ü
Tobacco Herbicide-tolerant European Union Tomatoes Delayed ripening Canada ü
Japan ü ü Mexico ü ü ü United States ü ü
Wheat Herbicide-tolerant Canada ü ü ü
Total 66 64 81
Source: Adapted from AGBIOS Inc. (2001), using data from "Crops and Traits," "Genetic Elements," and "Regulatory Approvals."
Note: United States data presented here as “Food use” and "Feed use” correspond with the AGBIOS “Food/Feed” entries, with the exception of tomatoes, papayas, and squash, which are listed here only under “Food use” because the Food and Drug Administration (2001) has approved these technologies and crops as “Human Food" only.
Approval processes and intellectual property rights (IPR) laws vary across
jurisdictions and, in many instances, are still being developed for these unique products, so
it is not surprising that only a handful of countries have issued approvals to date. The lists
7
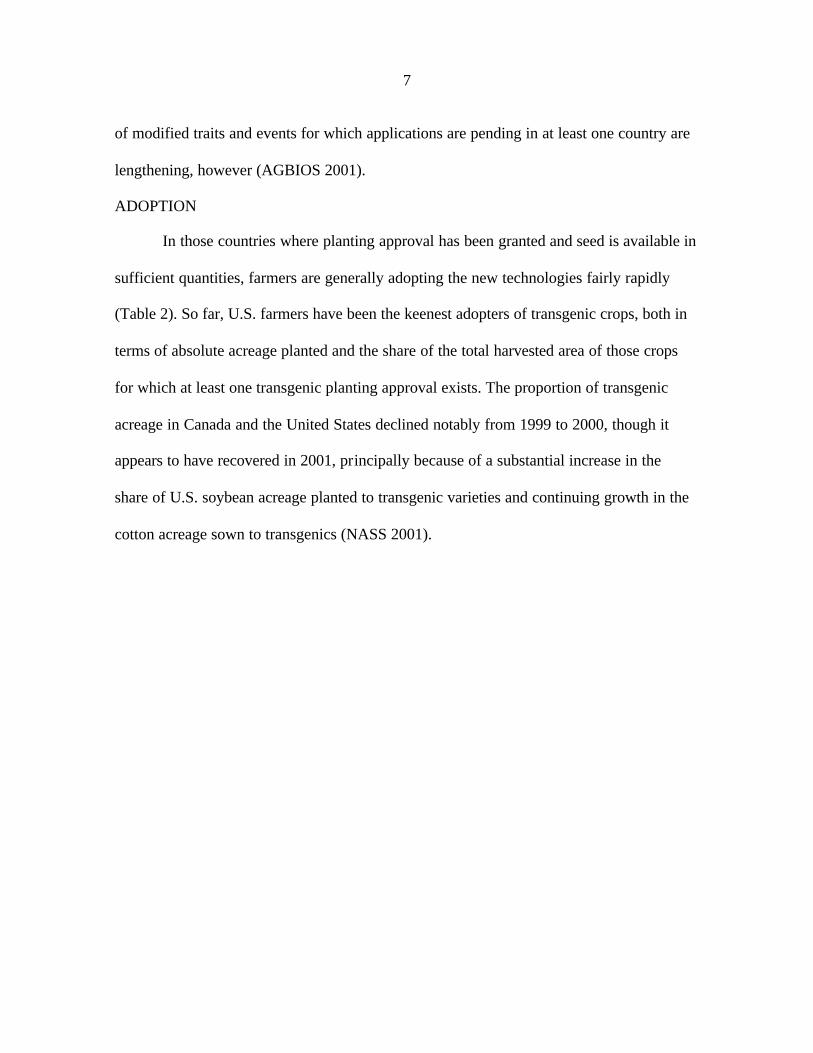
of modified traits and events for which applications are pending in at least one country are
lengthening, however (AGBIOS 2001).
ADOPTION
In those countries where planting approval has been granted and seed is available in
sufficient quantities, farmers are generally adopting the new technologies fairly rapidly
(Table 2). So far, U.S. farmers have been the keenest adopters of transgenic crops, both in
terms of absolute acreage planted and the share of the total harvested area of those crops
for which at least one transgenic planting approval exists. The proportion of transgenic
acreage in Canada and the United States declined notably from 1999 to 2000, though it
appears to have recovered in 2001, principally because of a substantial increase in the
share of U.S. soybean acreage planted to transgenic varieties and continuing growth in the
cotton acreage sown to transgenics (NASS 2001).

8
Table 2Transgenic acreage
Country Year Total
transgenic acres
Total harvested area of crops with at least one
approved event
Share
(million acres) (percentage)
Argentina 1996 0.3 23.4 1.3
1997 3.5 26.4 13.1
1998 10.6 27.2 39.0
1999 16.6 28.2 58.7
2000 24.7 29.4 84.1
Australia 1996 <0.2 0.8 —
1997 0.2 0.9 26.5
1998 0.2 0.9 26.2
1999 0.2 1.1 22.4
2000 0.5 1.2 41.1
Canada 1996 0.2 41.3 0.6
1997 3.2 43.2 7.4
1998 6.9 42.6 16.2
1999 9.9 42.2 23.4
2000 7.4 42.0 17.6
China 1998 0.5 11.0 4.5
1999 0.7 9.2 8.1
2000 1.2 10.0 12.4
United States 1996 10.7 158.1 6.7
1997 25.2 165.1 15.2
1998 60.4 166.4 36.3
1999 78.5 166.1 47.3
2000 69.6 169.6 41.0
2001 82.3 167.8 49.0
Sources: For Australia, Argentina, Canada, and China, “Total transgenic acres” are from James (1997, 1998, 1999, and 2000b) and “Total area of crops” is from FAO (2000). For United States the share of acreage sown to transgenic crops for 1996−99 is from ERS (2001), and for 2000 and 2001 from NASS (2001). Corresponding total crop acreages were obtained from NASS (2001).
Note: Data represent transgenic acreages of crops with at least one approved event. For Australia and China, the data represent area under cotton; for Argentina, the area under soybeans, maize, and cotton; for Canada, the area under canola, maize, potatoes, soybeans, and wheat; and for the United States, the area planted to cotton, maize, and soybeans .
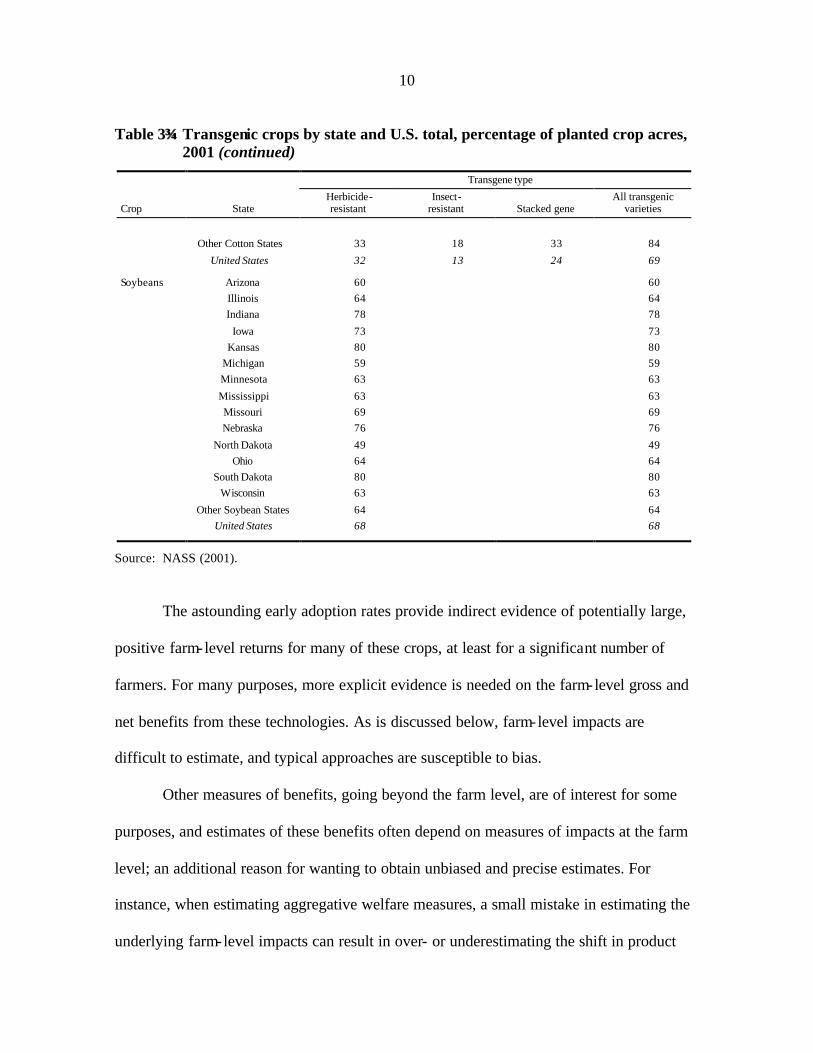
Table 3 lists the percentage of crop acreage planted to transgenic crops by U.S.
state in 2001. Herbicide-tolerant soybeansmostly Roundup Ready (RR)are now

9
planted on about two-thirds of the soybean acreage throughout the United States. About
one-quarter of the corn acreage in the United States was planted to transgenic varieties in
2001, of which most were insect resistant with a small percentage (6 percent) being
herbicide-tolerant or combining herbicide tolerance with insect resistance. Transgenic
cotton was adopted on a majority of cotton acreage in most southeastern U.S. states in
2001 and over one-quarter of California's cotton acreage. An important reason for different
adoption rates across geographic regions has been the lag in getting the genetic trait into
varieties appropriate for the different regions. This is especially true for cotton in Texas.
The cotton variety laws in California have hindered adoption in that state, but some
transgenic varieties are now becoming available there.
Table 3Transgenic crops by state and U.S. total, percentage of planted crop acres, 2001
Transgene type
Crop State Herbicide- resistant
Insect- resistant Stacked gene
All transgenic varieties
(percent)
Corn Illinois 3 12 1 16
Indiana 6 6 12
Iowa 6 25 1 32
Kansas 11 26 1 38
Michigan 7 8 2 17
Minnesota 7 25 4 36
Missouri 8 23 1 32
Nebraska 8 24 2 34
Ohio 4 7 11
South Dakota 14 30 3 47
Wisconsin 6 11 1 18
Other Corn States 8 11 1 20
United States 7 18 1 26
Cotton Arizona 29 21 28 78
California 27 11 2 40
Georgia 43 13 29 85
Louisiana 14 30 47 91
Mississippi 15 10 61 86
North Carolina 37 9 38 84
Texas 35 8 6 49
10
Table 3Transgenic crops by state and U.S. total, percentage of planted crop acres,
2001 (continued)
Transgene type
Crop State Herbicide- resistant
Insect- resistant Stacked gene
All transgenic varieties
Other Cotton States 33 18 33 84
United States 32 13 24 69
Soybeans Arizona 60 60
Illinois 64 64
Indiana 78 78
Iowa 73 73
Kansas 80 80
Michigan 59 59
Minnesota 63 63
Mississippi 63 63
Missouri 69 69
Nebraska 76 76
North Dakota 49 49
Ohio 64 64
South Dakota 80 80
Wisconsin 63 63
Other Soybean States 64 64
United States 68 68
Source: NASS (2001).
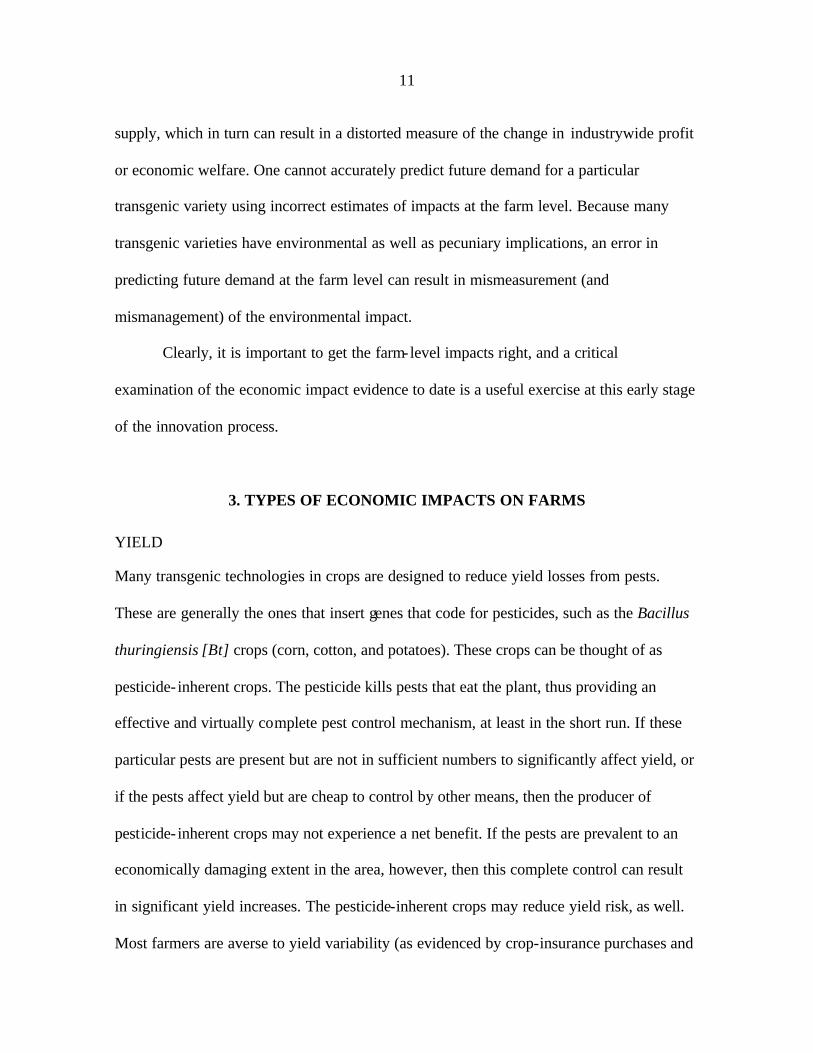
The astounding early adoption rates provide indirect evidence of potentially large,
positive farm-level returns for many of these crops, at least for a significant number of
farmers. For many purposes, more explicit evidence is needed on the farm-level gross and
net benefits from these technologies. As is discussed below, farm-level impacts are
difficult to estimate, and typical approaches are susceptible to bias.
Other measures of benefits, going beyond the farm level, are of interest for some
purposes, and estimates of these benefits often depend on measures of impacts at the farm
level; an additional reason for wanting to obtain unbiased and precise estimates. For
instance, when estimating aggregative welfare measures, a small mistake in estimating the
underlying farm-level impacts can result in over- or underestimating the shift in product
11
supply, which in turn can result in a distorted measure of the change in industrywide profit
or economic welfare. One cannot accurately predict future demand for a particular
transgenic variety using incorrect estimates of impacts at the farm level. Because many
transgenic varieties have environmental as well as pecuniary implications, an error in
predicting future demand at the farm level can result in mismeasurement (and
mismanagement) of the environmental impact.
Clearly, it is important to get the farm-level impacts right, and a critical
examination of the economic impact evidence to date is a useful exercise at this early stage
of the innovation process.
3. TYPES OF ECONOMIC IMPACTS ON FARMS
YIELD
Many transgenic technologies in crops are designed to reduce yield losses from pests.
These are generally the ones that insert genes that code for pesticides, such as the Bacillus
thuringiensis [Bt] crops (corn, cotton, and potatoes). These crops can be thought of as
pesticide- inherent crops. The pesticide kills pests that eat the plant, thus providing an
effective and virtually complete pest control mechanism, at least in the short run. If these
particular pests are present but are not in sufficient numbers to significantly affect yield, or
if the pests affect yield but are cheap to control by other means, then the producer of
pesticide- inherent crops may not experience a net benefit. If the pests are prevalent to an
economically damaging extent in the area, however, then this complete control can result
in significant yield increases. The pesticide-inherent crops may reduce yield risk, as well.
Most farmers are averse to yield variability (as evidenced by crop-insurance purchases and

12
by researcher measures of farmers' past attitudes toward risk). Those farmers would be
willing to pay a little extra for seed in exchange for reduced yield variability.
PEST-CONTROL COSTS
Direct cost reduction. Many studies show that pesticide-inherent crops reduce the
number of sprays required to control pests. If reduced pest-control costs outweigh the
additional cost of the seed, then farmers gain. Herbicide-tolerant crops also can
significantly reduce savings in weed-control costs. RR cotton is a good example. Before
the introduction of this herbicide-tolerant crop, there were no cotton herbicides that could
be sprayed over the top of the cotton crop to control weeds (Carpenter and Gianessi 2001).
Now, post emergence, over-the-top sprays are substituted for more expensive preplant
incorporated applications of herbicides and mechanical cultivation to control weeds. Also,
fewer weed-control field operations may be needed, which can result in significant
savings.
Indirect effects. Three indirect economic effects can result from the adoption of
transgenic crops. First, as farmers widely adopt these crops the demand for conventional
counterparts and competing pesticides and herbicides may decrease, which may, in turn,
reduce prices for the transgenic systems (Gianessi and Carpenter 2000). All farmers,
including nonadopters of the transgenic varieties, will benefit from reduced pesticide and
herbicide prices. Second, field operations are saved with many of the transgenic crops;
releasing resources for other crops at crucial times during the growing season, allowing
farmers to better manage those crops. For instance, the timing of soybean planting can
have a major effect on weed control. If planting is delayed, weeds can begin to compete
before the soybean canopy closes, causing lower soybean yields, higher weed-control
13
costs, or both. Growers that plant herbicide-tolerant cotton on part of the farm have more
time to plant their soybeans in a timely manner during the planting period.
Farmers may also benefit from increased flexibility. Many chemical alternatives to
the herbicide-tolerant crops (for example, conventional cotton treated with a weed-control
system that includes the relatively new herbicide, Staple) present carry-over problems so
that farmers cannot plant certain crops in the next growing season. Herbicide-tolerant
crops, used in conjunction with short-lived herbicides, eliminate this constraint in many
cases. Farmers may also be able to strip-crop or practice conservation tillage more easily
with transgenic crops (Fernandez-Cornejo et al. 1999).
PEST SUSCEPTIBILITY TO SUBSTITUTE PESTICIDES
Conventional farming operations. For a particular pesticide, whether inherent in
the plant or not, pest resistance can develop with use over time, reducing pest control and,
therefore, the comparative yield gains or cost savings. This has been a concern of scientists
and policymakers and has resulted in rules to help slow the development of resistance. Bt
cotton farmers in the United States are required to plant either 20 percent of their cotton
land to a conventional variety using conventional pest control or approximately 4 percent
to a conventional variety with no pest control. 5 Also, in order to preserve pest
susceptibility to Bt in cotton, restrictions limit how much Bt corn can be planted in a
county with significant cotton acreage. Because the transgenic crop is more profitable, or
presumably would not have been planted, these requirements reduce farmers' net benefits
5 For the 2001 season, some “embedded refuge” (where the refuge is embedded as a contiguous block within a Bollgard cotton field) or “community refuge” options were also allowed. With pesticide -inherent crops, some pests with resistance may survive. Providing a portion of the field where susceptible pests can survive and mate with the resistant pests is intended to slow the rate of resistance buildup.
14
in the short run. Cross-commodity refuge requirements of this type are imposed by the
U.S. Environmental Protection Agency (triggered by a minimum acreage of cotton at the
county level). Compliance with these and other refuge requirements is monitored by seed
companies, but the monitoring is expensive and compliance is incomplete, in some regions
more than others (EPA 2000).
On the other hand, a major group of conventional insecticides for southeastern U.S.
cotton, the pyrethroids, has been developing serious resistance problems in the
bollworm/budworm complex of insects in some areas of the Deep South, and adoption of
the Bt varieties is slowing development of the insects' resistance to these and other
conventional pesticides. This preserves pesticide choices for farmers for a longer period, a
farm-level and regional benefit from adoption of the transgenic varieties (Marra, Hubbell,
and Carlson 1997).
Organic farming operations. Bt is an approved foliar insecticide for organic
farming operations in the United States. Assuming refuge requirements do not completely
halt resistance development to a particular Bt protein, adoption of transgenic Bt crops in a
particular area increases the chances that foliar Bt will become a less effective insecticide
for organic producers. Because organic producers have fewer pesticide options, the
development of resistance will be costly for them in terms of lower yields and, perhaps,
lower prices from decreases in quality.
ENVIRONMENTAL EFFECTS
The use of chemical pesticides by farmers can involve risks to human health and to
wildlife. Some of these effectssuch as occupational health and safety risks for farmers
and their families, as well as farm workerscan be thought of as “on-site” effects,

15
confined to the farm and in relation to which farmers might be expected to have
appropriate incentives. Farmers also might take into consideration some impacts on plant
and animal populations on the farm, but other members of society might also attach a value
to some on-site impacts (e.g., effects on an endangered species), and this could mean that
the farmer and national incentives do not coincide.
Other environmental effects of chemical pesticides are “off-site,” through pesticide
drift or pollution of ground water, and it is less clear that farmers will have appropriate
incentives in relation to these impacts on other humans or plant and wildlife populations.
The value attached to off-site effects by the farmers using the technology in many cases
will be small relative to the values for others who are affected, including farm and non-
farm neighbors as well as environmentalists. Transgenic technologies have the potential to
reduce some of the negative on-site and off-site environmental impacts of chemical pest-
control technologies. At the same time, however, concerns have been raised about the
potential “environmental” impacts of the transgenic technologies themselves.
Farmer and worker health. So far, the pesticide- inherent varieties have contained
biological insecticides, which are safer for humans and wildlife than their conventional
counterparts (Gianessi and Carpenter 1999). Also, the pesticide- inherent crops involve no
spray drift problems, special handling requirements, or reentry intervals, which can
increase farmer and worker welfare in two ways. First, health concerns are reduced. These
crops eliminate the inconvenience of complying with spray drift rules, purchasing and
donning special safety clothing, and waiting to reenter the field after conventional
application. Second, restricting pesticide applications to days and times when drift will not

16
occur is costly, and pest control may not be timely or as effective. With pesticide- inherent
crops, control is continuous throughout the growing season.
Most of the herbicide-tolerant crops are tolerant of glyphosate, one of the safest in
the arsenal of currently available herbicides.
Glyphosate has a half- life in the environment of 47 days, compared with 60−90 days for the herbicides it commonly replaces. The herbicides that glyphosate replaces are 3.4 to 16.8 times more toxic, according to a chronic risk indicator based on the EPA [Environmental Protection Agency] reference dose for humans (Economic Research Service 2000, 17). Therefore, farmers and workers may experience fewer herbicide-related health
effects when using this type of compound. Pesticide- inherent crops kill only pests that feed
on the crop, and hence beneficial insectsthose that feed on crop pestsare not harmed
by this mode of pesticide delivery. This can enhance indirectly the effectiveness of the
pesticide.
Wildlife and water-quality effects. As well as caring about their own and their
workers' health and safety, farmers also care about the environment (Beach and Carlson
1993). Since transgenic crops are more environmentally benign than conventional
crop/pesticide systems, farmer welfare should benefit from the favorable environmental
impact of these crops compared with other crops that require conventional chemical
pesticides. Glyphosate, for instance, binds to the soil and does not leach into groundwater
or run off into surface water. Pesticide- inherent crops prevent any external effects
associated with respraying, and the runoff and leaching of insecticides. In addition, other
members of society who care about the environmental impacts will place a value on the
on-site and off-site benefits from reducing the use of chemical pesticides.

17
A caveat. Concern about the gene insertion process itself still looms large, particularly in
Europe at this writing, and this health concern could have a dampening effect on demand
for transgenic crops, thus affecting the returns to farmers through lower prices, higher costs
of identity preservation in the supply cha in, or both. The recent recall by Frito-Lay, Inc. of
consumer products potentially containing transgenic (Starlink®) corn is an example of the
potential consequences of this concern. The proportion of U.S. corn acreage planted to
transgenic varieties in 2000 fell by about a quarter from its 1999 level, but stabilized at this
lower level in 2001.
4. SOURCES OF BIAS IN THE EVIDENCE
In this section we discuss various potential sources of bias in the evidence reported
in the literature on impacts of transgenic technologies. Many of the issues raised here are
not specific to the comparison of transgenic and conventional technologies; rather, they are
general issues in evaluating technological alternatives, although the importance of
particular issues may vary depending on the nature of the alternatives being compared.
FIELD TRIALS
Through to December 2000, a reported 11,523 field trials of transgenic crops were
conducted in 39 countries (Pardey and Beintema 2001). Most of the technology testing
took place in developed countries: they accounted for about 84 percent of the trials, the
United States alone, 55 percent. The traditional objective of field trials has been to
quantify differences among the experimental treatmentsvery often different varieties (in
variety trials) and, less often, different pest-control regimes or different cultural practices
(fertilizer rates, tillage, irrigation, and so on). The effects measured almost always include

18
yield and, in the case of trials of pest control or cultural practices, differences in input use.
Sometimes economic comparisons (complete or not) accompany the physical evidence.
Most of the transgenic crop field trials have been variety trials reporting yield only,
although some also provide some information on differences in pesticide use.
Biases can be introduced into the resulting measures of farm-level impacts of the
transgenic varieties in several ways (Table 4). Yield differences measured by variety trials
typically hold everything else constant. The choice of varieties to be compared may also
mean that the measured yield differences would be biased if used to represent the expected
farm-level yield impacts. One class of variety trials compares the transgenic variety to its
conventional parent, which generally is no t among the set of conventional varieties farmers
have chosen to grow in the area (because other varieties provide higher yields and/or
greater net benefits). So, although this yield difference directly measures the change in
yield provided by the transgene, it will overestimate the farm-level impact of adopting the
transgenic variety.
Table 4Potential bias in measured economic impact by field trial type and transgene trait
Transgene trait
Type of field trial Herbicide-tolerant Pesticide-inherent
Direction of potential bias in the measured economic impact
Simple variety trials
Currently used conventional versus transgenic
downward
downward
Conventional transgenic parent versus transgenic upward upward
Pesticide use trials uncertain downward
On-farm, side-by-side comparisons None if farmer-chosen inputs, otherwise downward none
Source: Developed by authors.

19
Economic impacts calculated from side-by-side variety trials of pesticide-inherent
transgenic and conventional varieties (for example, Bt crops) can be biased by the halo
effect. The insect suppression of the Bt crop may spill over onto the conventional
treatment, providing another source of pest control, which may increase the yield relative
to what it would be if the conventional crop were grown in isolation. The measured yield
difference between the conventional and transgenic variety may be biased downward as a
result.
Biases can be introduced into the measures of economic impact by the type of field
trials that measure differences in pesticide use, as well. Agricultural scientists typically
manage pests in field trials to maximize yield, not profit. Therefore, the pest-control
regimes tested in the field trials may not reflect what a profit-maximizing farmer would
use. The direction of this bias is difficult to predict if the transgenic crops tested are
herbicide-tolerant. In the case of pesticide- inherent crops, the measured difference in
pesticide use, thus the economic impact, may be underestimated.
Alston, Norton, and Pardey (1998) discuss the importance of defining the relevant
counterfactual when evaluating the impact of a particular technology. The correct
comparison, to ensure that farm-level impacts are measured accurately, is one where the
set of practices and input mixes that would minimize costs (or maximize profits) is
employed under each technology. The current conventional crop/pesticide system is the
relevant counterfactual to compare with the new technology. This comparison is made
most directly on farms where partial adoption has occurred. Although experiments set up
on farms where farmers control the cultural practices for both technologies can be used to

20
measure the impact, biases may still be introduced if some of the decisions are left to the
researchers, and these decisions differ from those farmers would make.
A remaining source of potential bias arises when farmers alone make all the
decisions. If farmers assign fields other than randomly between the technologies (that is,
taking into account the recent cropping history, the natural fertility, or pest incidence, or
other factors that determine the relative profitability of the alternatives), the comparison
may be distorted. For instance, farmers might plant herbicide-tolerant varieties on heavily
weed- infested fields to “clean them up,” and traditional varieties on cleaner fields. The
advantage of the herbicide-tolerant variety in weed- infested conditions would be masked in
a simple comparison that would implicitly assume the fields were identical. Furthermore,
the dynamic benefits from the cleanup would be left out of a simple assessment. So, too, a
downward bias in measuring economic impact could result if pesticide- inherent crops are
grown in remote fields where pest control is generally more difficult, or if they are grown
primarily in fields with heavier infestations of both target and nontarget pests.
FARMER SURVEYS
Two general types of farmer surveying methods are used to gather evidence on the
economic impact of transgenic crops: area-frame surveys by the U.S. Department of
Agriculture (USDA), and whole-farm surveys by individual researchers or by marketing
research firms. Each method has advantages and disadvantages.
Field-level surveys. The USDA and other national departments of agriculture
acquire data about production practices, costs, and returns periodically using a combination
of area-frame and list- frame sampling techniques. The area-frame sampling technique uses
various types of geographic representations of land area to divide it into small segments

21
(about one square mile). Then a random sample of these segments is chosen for further
study. Usually, field investigators personally interview the operator of the land in a chosen
segment (NASS no date). During the personal interview, a further randomization takes
place to choose one field about which to ask detailed questions about production practices,
costs, returns, or other desired information. For example, on the 1999 Agricultural
Resource Management Study (ARMS) Upland Cotton Production Practices Report, the
only farm-level questions about production practices, costs, or returns are “How many
acres of cotton did this operation plant this year?” and “What is the total number of upland
cotton fields that were planted this year?” (NASS 1999, 2). The rest of the production
questions pertain to the randomly selected field.
One survey question asks the type of seed used in the field (genetically modified,
herbicide-resistant Bt variety for insect resistance, variety with both insect and herbicide
resistance, or other). If the farmer reported “other,” there is no way to tell whether the field
is part of a farm where transgenic technology has not been adopted at all or if it just
happens to be a field on a farm where there is partial adoption (either true partial adoption
or a required refuge field where conventional cotton is grown). Since there have been
demonstrated differences between adopters and nonadopters of almost all new agricultural
technologies or techniques that can also influence yield, production practices, production
costs, or returns, the economic impact due solely to the technology cannot be known from
this type of survey. For example, the difference in yield between the transgenic crop and
the conventional crop cannot be calculated on each farm under the same management and
general growing conditions. It can only be calculated as an average of all selected fields

22
planted with the transgenic crop against the average of all fields not planted with the
transgenic crop.
USDA National Agricultural Statistics Service (NASS) surveys have a large
sample size, are conducted in person (producing a high response rate), and are generally
conducted over a number of years with largely the same questions asked each time, so they
are the only source of long-term, national, public information about these technologies.
Several marketing firms have conducted surveys for the companies producing the
technologies, but this information is not available in the public domain.
Farm-level surveys. The only way to hold constant the other factors that can
influence the difference between the two technologies is to ask adopting farmers about the
transgenic acres and the nontransgenic acres on their farm. They are the optimizers, both in
their choice of whether or not to adopt and in the input choices and production method for
each technology. As noted above, this also means that optimizing farmers will choose to
allocate their transgenic and nontransgenic acres according to the relative advantages of
the alternatives within their farm, which means that each variety will do better on average
than if the varieties had been assigned at random among acres. Hence, a comparison of
commercial performance of varietal technologies, even within a farm, would tend to
understate the impact of adoption of the new technology, which presumably has been
applied where it does comparatively better.
Table 5 illustrates the role of optimizing behavior. These data are taken from a
1996 farm-level survey by North Carolina State University and the University of Georgia.
A total of 1,000 cotton farmers from the four southeastern states (Alabama, Georgia, North
Carolina, and South Carolina) were surveyed by mail, with a follow-up mailing and some

23
telephone follow-up. The proportion of regional cotton acreage in each state was used to
stratify the sample. The usable response rate was 36 percent (Marra, Hubbell, and Carlson
1997).
Table 5Comparing means of different groups of respondent farmers and farms: The case of Bt cotton impacts in the southeast, 1996
Group comparison
Indicator/state
Adopters who planted both:
Bt versus conventional acres
Adopters’ Bt acres versus
nonadopters' conventional acres
All farms: All Bt acres versus all
conventional acres
Yield difference (pounds lint per acre)
Alabama 166 230 206
Georgia 84 216 158
North Carolina –3.2 –11 –14
South Carolina 119 113 109
Insecticide cost difference (dollars per acre)
Alabama 3.10 –2.34 –0.87
Georgia –29.67 –34.81 –28.07
North Carolina –27.49 –16.95 –17.68
South Carolina –31.12 –20.51 –23.93
Spray number difference (number of insecticide applications per acre)
Alabama 0.31 –0.06 1.81
Georgia –2.68 –1.26 1.70
North Carolina –2.38 –2.11 2.51
South Carolina –2.46 –2.47 0.46
Source: Marra, Hubbell, and Carlson (1997).
Economic impacts of transgenic crops, in terms of differences in yield, insecticide
cost and pesticide use differences, are calculated three ways in Table 5. The first column of
numbers represents differences between the two technologies (Bt cotton and conventional
cotton) calculated within an adopting farmer's farm. The last column represents differences
calculated as if the data came from a field-level survey, similar to the NASS surveys

24
described above. Notice the disparity between the two estimates in every category. There
are two contributing factors. Farmers who do not adopt the technology are either: (a) less
educated with smaller farms and generally lower yields (which would make the difference
in yields larger in the “all farms” column and the pesticide use differences smaller), or (b)
operating farms with higher yields and less pest pressure to begin with (which would make
the difference in yields smaller in the “all farms” column and the pesticide use differences
larger) (Marra, Hubbell, Carlson 2001 and Ervin et al. 2000). Therefore, although we
cannot assign any particular bias to the numbers calculated from field- level surveys, we
can say they are likely to be different compared with the impacts calculated from within-
farm comparisons.
Comparing the difference in the number of insecticide applications per acre across
the columns highlights this point. In the within-farm comparison, there is either a very
slight increase or a significant decrease in insecticide sprays on the transgenic acres, while
the “all farms” column shows a consistent increase in insecticide sprays. The estimates in
the middle column also illustrate the degree to which grouping of observations or survey
methods can change the estimates. Given that these types of comparisons are quoted in the
popular press and used by other researchers and interest groups, errors of this magnitude
can cause grave concern (Wolfenbarger and Phifer 2000). It is important to get these
numbers right.
The calculations in Table 5 are examples of the great differences one can encounter
when the underlying survey methodology differs. These comparisons should be made over
a number of crop years before confidence can be placed in any systematic biases found in
the estimates. Estimates over time from the same source are not available, but in some

25
cases for some transgenic crops, we can begin to make the first, tentative estimates of some
of the economic impacts at the farm level based on information from a combination of
field trials that mimic farmer production practices; on-farm, side-by-side comparisons; and
farmer or consultant surveys. This empirical evidence is the subject of the next section.
5. EMPIRICAL EVIDENCE OF FARM-LEVEL IMPACTS
A search of the relevant academic journals, Internet searches, and inquir ies of
researchers who work in this area produced a number of estimates of several measures of
farm-level impacts associated with commercially available transgenic crops.6 Some ex ante
estimates were discovered, as well. Estimates of yield differences, revenue differences,
pesticide cost differences, pesticide use differences, and net returns to transgenic crops
were collected directly where available or, where possible, imputed from the reported
information. Sources examined fall into one of the following categories: the various types
of field trials listed in Table 4, farmer and consultant surveys, studies reporting ex ante
estimates of economic impacts, or field-level surveys.7
The estimates from 6 studies (out of the total of 75 studies) were eliminated from
consideration at the outset on the grounds that they would be misleading. Specifically, we
excluded estimates if it was not possible to say whether they referred to (a) a within-farm
comparison for an adopting farmer, which is what is desired, rather than (b) a comparison
6 Several studies, including York and Culpepper (1999) and Wilcut et al. (1999) report only percentage changes, which cannot be compared directly with measures from the studies presented here. 7All of the data collected are presented in Appendix Table 1. Though the estimates in the appendix are not an exhaustive list (particularly in light of the large number of unpublished field trials and market surveys that are not accessible in the public domain), they should be sufficient to begin to make some inferences about farm-level impacts.

26
between adopting and non-adopting farmers, which does not hold the right things constant.
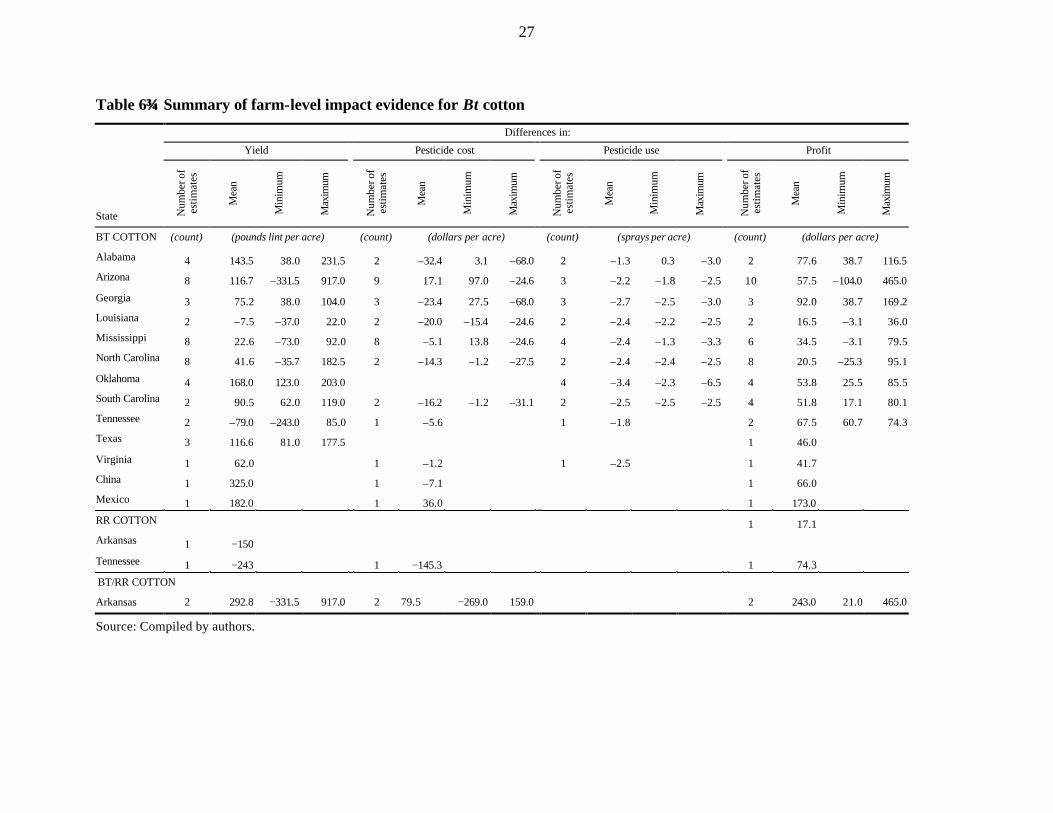
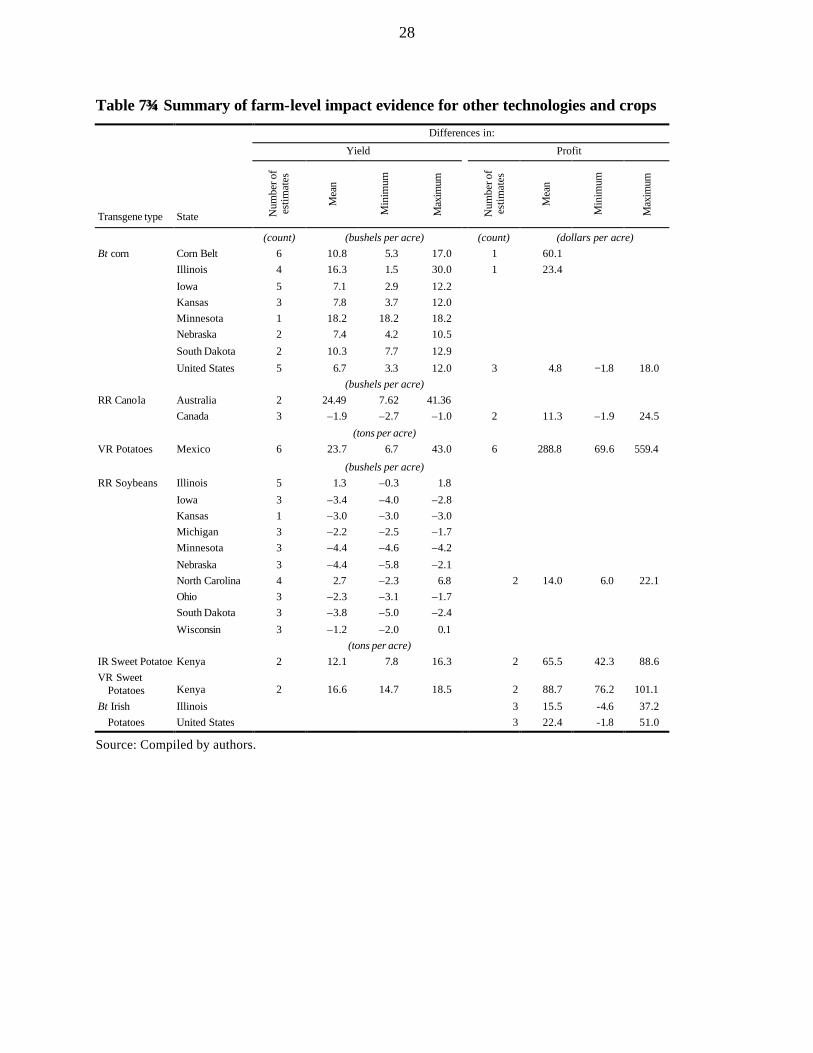
Then, for groups of studies in which enough estimates remained for a particular
combination of impact measure, location, and transgene type, the mean and a range of the
estimates are reported in Tables 6 and 7, by crop and event.
27
Table 6Summary of farm-level impact evidence for Bt cotton
Differences in:
Yield Pesticide cost Pesticide use Profit
State Num
ber o
f es
timat
es
Mea
n
Min
imum
Max
imum
Num
ber o
f es
timat
es
Mea
n
Min
imum
Max
imum
Num
ber o
f es
timat
es
Mea
n
Min
imum
Max
imum
Num
ber o
f es
timat
es
Mea
n
Min
imum
Max
imum
BT COTTON (count) (pounds lint per acre) (count) (dollars per acre) (count) (sprays per acre) (count) (dollars per acre)
Alabama 4 143.5 38.0 231.5 2 –32.4 3.1 –68.0 2 –1.3 0.3 –3.0 2 77.6 38.7 116.5
Arizona 8 116.7 –331.5 917.0 9 17.1 97.0 –24.6 3 –2.2 –1.8 –2.5 10 57.5 –104.0 465.0
Georgia 3 75.2 38.0 104.0 3 –23.4 27.5 –68.0 3 –2.7 –2.5 –3.0 3 92.0 38.7 169.2
Louisiana 2 –7.5 –37.0 22.0 2 –20.0 –15.4 –24.6 2 –2.4 –2.2 –2.5 2 16.5 –3.1 36.0
Mississippi 8 22.6 –73.0 92.0 8 –5.1 13.8 –24.6 4 –2.4 –1.3 –3.3 6 34.5 –3.1 79.5
North Carolina 8 41.6 –35.7 182.5 2 –14.3 –1.2 –27.5 2 –2.4 –2.4 –2.5 8 20.5 –25.3 95.1
Oklahoma 4 168.0 123.0 203.0 4 –3.4 –2.3 –6.5 4 53.8 25.5 85.5
South Carolina 2 90.5 62.0 119.0 2 –16.2 –1.2 –31.1 2 –2.5 –2.5 –2.5 4 51.8 17.1 80.1
Tennessee 2 –79.0 –243.0 85.0 1 –5.6 1 –1.8 2 67.5 60.7 74.3
Texas 3 116.6 81.0 177.5 1 46.0
Virginia 1 62.0 1 –1.2 1 –2.5 1 41.7
China 1 325.0 1 –7.1 1 66.0
Mexico 1 182.0 1 36.0 1 173.0
RR COTTON 1 17.1
Arkansas 1 −150
Tennessee 1 −243 1 −145.3 1 74.3
BT/RR COTTON
Arkansas 2 292.8 −331.5 917.0 2 79.5 −269.0 159.0 2 243.0 21.0 465.0
Source: Compiled by authors.
28
Table 7Summary of farm-level impact evidence for other technologies and crops
Differences in:
Yield Profit
Transgene type State Num
ber o
f es
timat
es
Mea
n
Min
imum
Max
imum
Num
ber o
f es
timat
es
Mea
n
Min
imum
Max
imum
(count) (bushels per acre) (count) (dollars per acre)
Bt corn Corn Belt 6 10.8 5.3 17.0 1 60.1
Illinois 4 16.3 1.5 30.0 1 23.4
Iowa 5 7.1 2.9 12.2
Kansas 3 7.8 3.7 12.0
Minnesota 1 18.2 18.2 18.2
Nebraska 2 7.4 4.2 10.5
South Dakota 2 10.3 7.7 12.9
United States 5 6.7 3.3 12.0 3 4.8 −1.8 18.0
(bushels per acre)
RR Canola Australia 2 24.49 7.62 41.36
Canada 3 –1.9 –2.7 –1.0 2 11.3 –1.9 24.5
(tons per acre)
VR Potatoes Mexico 6 23.7 6.7 43.0 6 288.8 69.6 559.4
(bushels per acre)
RR Soybeans Illinois 5 1.3 –0.3 1.8
Iowa 3 –3.4 –4.0 –2.8
Kansas 1 –3.0 –3.0 –3.0
Michigan 3 –2.2 –2.5 –1.7
Minnesota 3 –4.4 –4.6 –4.2
Nebraska 3 –4.4 –5.8 –2.1
North Carolina 4 2.7 –2.3 6.8 2 14.0 6.0 22.1
Ohio 3 –2.3 –3.1 –1.7
South Dakota 3 –3.8 –5.0 –2.4
Wisconsin 3 –1.2 –2.0 0.1
(tons per acre)
IR Sweet PotatoesKenya 2 12.1 7.8 16.3 2 65.5 42.3 88.6
VR Sweet Potatoes Kenya 2 16.6 14.7 18.5 2 88.7 76.2 101.1
Illinois 3 15.5 -4.6 37.2 Bt Irish
Potatoes United States 3 22.4 -1.8 51.0
Source: Compiled by authors.

29
Most of the impact measures to date have been for Bt cotton, Bt corn, and RR
soybeans. The range of yield differences between Bt and conventional cotton appears quite
large, mostly because of the wide range of pest incidence in the years since the commercial
introduction of Bt cotton. Across the U.S. Cotton Belt, a much higher incidence of the
bollworm/budworm complex that Bt cotton is designed to control occurred in 1997 than in
1996, for example. Even so, in 9 of the 11 states, average yields for Bt cotton exceeded
those of conventional cotton. There is also evidence of reduced pesticide use with Bt
cottonon average, a reduction of between 1.3 and 3 pesticide sprays per season. Nine of
10 states report a reduction in average pesticide costs (Arkansas is the exception), while in
all states where the data permit comparisons, Bt cotton was more profitable than its
conventional counterpart. The mean profit advantage ranges from about $20 to almost
$100 per acre, including the costs of the technology fee.
The most prevalent impact measure so far for Bt corn is the yield difference.8 In
most locations and years, however, the incidence of European corn borer is not thought to
be significant enough to control with pesticides, so the yield difference is sufficient to
calculate total additional monetary benefits. In the states where a range could be reported,
all show an unambiguous yield increase with Bt corn, although one estimate (Illinois 1998)
is below the break-even yield increase to cover the additional technology cost (assuming
US$2.00 per bushel for the corn and an US$8.00 per acre technology fee). Studies
estimating the impact of Bt corn across the Corn Belt give yield increases ranging from 5.3
8 An interesting and well-done study by Hyde et al. (2000) of the potential value of Bt corn in the Corn Belt gives ranges of values under various probabilities of European corn borer infestation (presumably corresponding to different sections of the Corn Belt) and risk attitudes, but they are not specific enough for the purposes of this discussion.
30
to 14.9 bushels per acre. The mean yield increases are all in the profitable range, with
results for some states (Illinois and Minnesota) indicating substantial profitability from
early adoption of Bt corn. If identity preservation does not become an issue, or if the costs
of segregation are comparatively minor, then Bt corn should continue to be profitable.
Studies from Illinois and North Carolina show positive mean yield differences for
RR soybeans, with yield gains of up to 6.83 bushels per acre in North Carolina in 1997.
However, most of the available evidence for RR soybeans shows a slight drop in yields,
the greatest of which is a loss of 5.7 bushels per acre in Nebraska in 1997. The only profit
estimates available so far indicate a net return averaging $14 per acre to using RR
soybeans in North Carolina. The results for RR soybeans are a good example of where the
results from variety trials are insufficient to draw conclusions about the profitability of
using transgenic versus conventional crop varieties. Although more research is required to
be definitive, the widespread adoption of this technology clearly indicates that the
production costs are sufficiently lower to make RR soybeans profitable for the vast
majority of growing conditions and farm types throughout the United States.
6. AGGREGATE IMPACTS
A few studies have attempted to estimate the aggregate economic impact of a
particular transgenic crop (or group of crops) and the distribution of the impact on the
different sectors involved. Each of these has had to employ some measure of farm-level
effects. Most of the studies present their results in terms of total welfare effects and the
distribution of those effects under various scenarios, or assumptions, regarding parameters
they view important.

31
Falck-Zepeda, Traxler, and Nelson (1999) model the change in welfare effects from
adoption of Bt cotton and RR soybeans using a basic two-region framework (United States
and ROW), based on the approach in Alston, Norton, and Pardey (1998), in which the
farm-level benefit is allowed to vary among U.S. states creating several subregions. Falck-
Zepeda, Traxler, and Nelson (FTN) use confidential market survey data, as well as
published agronomic and farmer survey data to estimate their supply shifts in the United
States and assume that the ROW either experiences the same or half of the efficiency gains
as the United States. They find that, for the 1996 and 1997 crop, Bt cotton adoption
generated large increases in global social surplus and significant increases in U.S. producer
surplus at the expense of ROW producers. For RR soybeans in 1997, FTN find again, large
global surplus increases and large U.S. producer surplus increases with relatively small
decreases in producer surplus in ROW.
Moschini, Lapan, and Sobolevsky (1999) model the global welfare effects of RR
soybeans. They develop a three-region world model that includes a monopolist technology
seller as well as consumers and producers. They assume the technology results in a US$20
per hectare increase in profit at the farm level, based on conditions in Iowa in 1997−98.
They estimate changes in consumer, producer, and total surplus for the United States,
South America, and the rest of the world (ROW), and the surplus accruing to the
monopolist. Moschini, Lapan, and Sobolevsky (MLS) generally find large increases in
total social welfare from the technology, but mostly negative producer surplus changes in
all regions. They examine the sensitivity of the results to the supply shift assumptions and
find that halving or doubling of the profit change for any region can have a large impact on
the size and distribution of the welfare changes.

32
Pray et al. (1999) consider the impact of Bt cotton in China. They collected farm-
level data on the net benefits of the Bt varieties (Appendix Table 1) and, using the same
basic modeling approach as MLS and FTN, estimate the distribution of benefits among
farmers, seed companies, and research institutes/companies. They find significant
aggregate net benefits to farmers and much smaller benefits to the seed companies and
research institutes/companies. Pray et al. also present the only quantified farm-level
nonpecuniary benefits we have found. They report that only 4 percent of farmers planting
the Bt varieties suffered any effects of pesticide poisoning, compared with 33 percent of
those who did not plant Bt cotton.
Some ex ante studies of the potential for transgenic crops in developing countries
have been undertaken. One is a study of virus- and weevil-resistant sweet potatoes in
Kenya (Qaim 1999) and another is a study of virus-resistant potatoes in Mexico (Qaim
1998). The farm-level benefits used in both studies are based on a consensus of expert
opinion. The aggregate net benefits are calculated as changes in regional producer surplus
and consumer surplus resulting from technical change. Qaim finds that central and eastern
Kenyan producers would benefit much less than western producers and that the benefits
accruing to all groups are greater for the weevil- resistance technology compared with the
virus- resistance technology. In the Mexican case study, producers were divided into small,
medium, and large farmers, and the benefits were measured with and without the potential
for trade. Qaim reports that trade reduced the benefits to this small-country producer and
that some trait and distribution assumption combinations favored small farms, while others
favored the larger farms. In all cases, Qaim estimates a large net gain to all sectors and
farm sizes.

33
All of the above studies of the aggregated effects of transgenic crop adoption were
completed before the controversy over the safety of GM food grew to the point that
identity preservation became an issue. Fulton and Keyowski (2000), in a theoretical
modeling exercise, point to the importance of farmer heterogeneity in modeling the
distribution of benefits when the transgenic and traditional markets are segregated.
Burton et al. (2000), using the same methodology as most of the other aggregate
studies, considered the effects of various identity preservation schemes on the total and
distributional aspects of the benefits from adoption of GM canola. Based on Fulton and
Keyowski, they assume that adoption of GM canola decreased marginal costs at the farm
level by 8.5 percent. They divide the world into consumers and producers of GM and non-
GM canola and estimate the distribution of total surplus accruing to each group under
various assumptions about the form of technical change, the incidence of identity
preservation costs, and the impact of a technology fee. They find that, under most
scenarios, consumers of the non-GM canola lose, while consumers of GM canola gain.
Changes in producer surplus vary widely, depending on the assumptions listed above, but
producers of the non-GM canola seem to fare better in most cases than the producers of the
GM canola.
7. CONCLUSION
It is worth emphasizing again that estimates of farm-level impact summarized in
Tables 6 and 7 are for a small number of locations and years. As more useful data become
available for economic comparisonsboth in the United States and more particularly in
34
the rest of the world, estimates of this type can be viewed with more confidence. It is
fair to say only three things at this point with much confidence, and these apply only in the
context of the United States (although they might be expected to have parallels in other
countries).
• Growing transgenic cotton is likely to result in reduced pesticide use in most years
in most states, and it is more likely than not to be a relatively profitable enterprise
in most of the U.S. Cotton Belt.
• Bt corn will provide a small but significant yield increase in most years across the
Corn Belt, and in some years and some places the increase will be substantial.
• Although there is some evidence of a small yield loss in the RR soybean varieties,
in most years and locations savings in pesticide costs and, possibly, tillage costs
will more than offset the lost revenue from the yield discrepancy.
There are still many farm-level impacts, the value of which no one has attempted to
measure thus far. An important aspect is the “convenience factor” for the RR crops:
farmers report that even if there is a slight “yield drag” with RR soybeans, the reduced
herbicide costs and the extra time available to attend to their higher-value crops are more
than sufficient compensation. The impressive rates of adoption for many of these
transgenic crops are strong evidence of their perceived value to farmers. Only time will tell
if consumer concerns will slow this pace significantly and permanently, but if these
concerns can be addressed satisfactorily, then many of the first-generation transgenic crops
are a win-win situation for farmers. They can expect higher profits and environmentally
safer growing conditions. If identity preservation becomes a fact of life, then these farm-
level benefits are much more open to question to the extent that either adopting farmers
35
have to pay the costs of segregation or transgenic varieties incur significant price
discounts.
Policymakers and consumers will benefit from better estimates of the farm-level
benefits because they are part of the cost of regulation. Additional studies are warranted to
estimate the potential pecuniary benefits more precisely by using on-farm results based on
farmer decisions, especially in light of new developments at the final product level for
some crops. It is time also for an initial attempt to quantify the nonpecuniary benefits.

37
REFERENCES
AGBIOS Inc. (Agricultural and Biotechnology Strategies [Canada] Inc.). 2001. Global status of approved genetically modified plants. (June). <http://www.agbios.com/_Synopsis.asp>. Accessed July, 2001.
Alston, J. M., G. Norton, and P. G. Pardey. 1998. Science under scarcity: Principles and practice for agricultural research evaluation and priority setting. Wallingford, U.K.: CAB International.
Bacheler, J. S., D. W. Mott, and D. E. Morrison. 1998. Large scale evaluation of Bollgard resistance to multiple pests in North Carolina under grower conditions. In Proceedings of the Beltwide Cotton Conference, Vol. 2, 961−64. Memphis, Tenn., U.S.A.: National Cotton Council.
Beach, E., and G. Carlson. 1993. A hedonic analysis of herbicides: Do user safety and water quality matter? American Journal of Agricultural Economics 75: 612−23.
Benson, M. A., and W. H. Hendrix III. 1999. Economics of a tracer/karate Z conventional cotton program vs. Bt cotton. In Proceedings of the Beltwide Cotton Conference, Vol. 2, 1143−45. Memphis, Tenn., U.S.A.: National Cotton Council.
Bryant, K., C. T. Allen, F. M. Bourland, and L. D. Earnest. 1999. Cost and return comparisons of RR and Bollgard cotton varieties. In Proceedings of the Beltwide Cotton Conference, Vol. 1, 236−38. Memphis, Tenn., U.S.A.: National Cotton Council.
Bryant, K. J., W. C. Robertson, and G. M. Lorenz III. 1998. Economic evaluation of Bollgard Cotton in Arkansas: 1997. In Proceedings of the Beltwide Cotton Conference, Vol. 1, 388−89. Memphis, Tenn., U.S.A.: National Cotton Council.
________. 1999. Economic evaluation of Bollgard cotton in Arkansas. In Proceedings of the Beltwide Cotton Conference, Vol. 1, 349−50. Memphis, Tenn., U.S.A.: National Cotton Council.
Burton, M., S. James, B. Lindner, and J. Pluske. 2000. A way forward for Frankenstein foods. Paper presented at The Economics of Agricultural Biotechnology, Fourth Conference of the International Consortium on Agricultural Biotechnology Research, Ravello, Italy, August 24–28.
Capps, C. D., C. Allen, L. Earnest, P. Tugwell, and M. Kharbouti. 1999. Performance of Bollgard cotton with and without insecticides. In Proceedings of the Beltwide Cotton Conference, Vol. 2, 1239−41. Memphis, Tenn., U.S.A.: National Cotton Council.

38
Carpenter, J. E., and L.P. Gianessi. 2001. Agricultural biotechnology: Updated benefit estimates. Washington, D.C.: National Center for Food and Agricultural Policy.
Coble, H. 1997. Unpublished field trials, North Carolina State University, Raleigh, N.C., U.S.A. Mimeo.
Cooke, F. T., and T. B. Freeland. 1998. Some economic considerations for Bt cotton planting in the Yazoo-Mississippi Delta. In Proceedings of the Beltwide Cotton Conference, Vol. 1, 383−84. Memphis, Tenn., U.S.A.: National Cotton Council.
Couvillion, W., F. Kari, D. Hudson, and A. Allen. 2000. A preliminary economic assessment of Roundup Ready soybeans in Mississippi. Mississippi State University Research Report 2000−005, Mississippi State.
Dunphy, J., and A. York. 2000. Progress report to North Carolina Soybean Producers' Association Inc. Raleigh. Available at <http://www.ncsoy.org/Research/1999/99-06/99-06.htm>. Accessed September 25, 2001.
Dunphy, J., R. Heiniger, and A. York. 2000. Progress report to North Carolina Soybean Producers' Association Inc. Raleigh. Available at <http://www.ncsoy.org/Research_/2000_Annual_Reports/2000_annual_reports.htm>. Accessed September 25, 2001.
EPA (Environmental Protection Agency). Report of the FIFRA (Federal Insecticide, Fungicide and Rodenticide Act) Advisory Panel Meeting. December 8-9, 1999 Sheraton Crystal City Hotel, Arington Viginia at http://www.epa.gov/scipoly/sap/1999/december/report.pdf. Accessed November 2001.
ERS (Economic Research Service of the U.S. Department of Agriculture). 2000. Genetically engineered crops: Has adoption reduced pesticide use? Agricultural Outlook, Washington, D.C.
________. 2001. Agricultural biotechnology: Adoption of biotechnology and its production. <http://www.ers.usda.gov/Briefing/biotechnology/chapter1.htm> linked to “Excel spreadsheet” at http://www.ers.usda.gov/Briefing/biotechnology/data/gmoacres1.xls. Accessed August, 2001 (May 31).
Ervin, D. E., S. Batie, R. Welsh, C. Carpentier, J. I. Fern, N. J. Richman, and M. A. Schulz. 2000. Transgenic crops: An environmental assessment. Policy Studies Report No. 15. Arlington, Va., U.S.A.: Henry A. Wallace Center for Agricultural and Environmental Policy, Winrock International.

39
European Commission. 2000. Economic impacts of genetically modified crops on the agri-food sector. <http://europa.eu.int/comm/ dgo61/publi/gmo/fullrep>. Accessed December 26, 2000.
Falck -Zepeda, J., G. Traxler, and R. Nelson. 1999. Rent creation and distribution from biotechnology innovations: The case of Bt cotton and herbicide-tolerant soybeans. Paper presented at Transitions in Agbiotech: Economics of Strategy and Policy, NE−165 Conference, June 24−25, Washington, D.C.
FAO (Food and Agriculture Organization of the United Nations). 2000. FAOSTAT Agriculture Data. <http://www.apps.fao.org/page/collections>. Accessed November 28, 2000.
FDA (Food and Drug Administration). 2001. List of completed consultations on bioengineered foods. <http://www.cfsan.fda.gov/~lrd/biocon.html>. Accessed June 2001.
Fernandez-Cornejo, J., C. Klotz-Ingram, and S. Sans. 1999. Farm-level effects of adopting genetically engineered crops in the U.S.A. Selected paper presented at Transitions in Agbiotech: Economics of Strategy and Policy NE−165 Conference, June 24−25, Washington, D.C.
Fulton, M., and L. Keyowski. 2000. The impact of technological innovation on producer returns: The case of genetically modified canola. Storrs, Conn., U.S.A.: Food Marketing Policy Center, University of Connecticut.
Gianessi, L., and J. Carpenter. 1999. Agricultural biotechnology: Insect control benefits. Washington, D.C.: National Center for Food and Agricultural Policy.
________. 2000. Agricultural biotechnology: Benefits of transgenic soybeans. Washington, D.C.: National Center for Food and Agricultural Policy.
Gibson, J. W., D. Laughlin, R. Luttrell, D. Parker, J. Reed, and A. Harris. 1997. Comparison of costs and returns associated with Heliothis resistant Bt cotton to nonresistant varieties. In Proceedings of the Beltwide Cotton Conference, Vol. 1, 244−47. Memphis, Tenn., U.S.A.: National Cotton Council.
Harley, K. 1999. Unpublished survey data. North Carolina State University, Raleigh, N.C., U.S.A.
Hart, K., 1999. Biotech crops do not improve yield or cut pesticide costs, USDA Finds. Pesticide and Toxic Chemical News, July 1, 11−13.
Hyde, J., M. Martin, P. Preckel, C. R. Edwards. 2000. The economics of Bt corn: Valuing protection from the European corn borer. Review of Agricultural Economics 21 (2): 442−54.

40
James, C. 1996. Global review of the field testing and commercialization of transgenic plants. International Service for the Acquisition of Agri-Biotech Application Brief No. 1. Ithaca, N.Y., U.S.A.
________. 1997. Global status of transgenic crops in 1997. International Service for the Acquisition of Agri-Biotech Application Brief No. 5. Ithaca, N.Y., U.S.A.
________. 1998. Global review of commercialized transgenic crops: 1998. International Service for the Acquisition of Agri-biotech Applications Brief No. 8. Ithaca, N.Y., U.S.A.
________. 1999. Global review of commercialized transgenic crops. International Service for the Acquisition of Agri-Biotech Applications Brief No. 12. Ithaca, N.Y., U.S.A.
________. 2000a. Global status of commercialized transgenic crops, 1999. International Service for the Acquisition of Agri-Biotech Applications Brief No. 17. Ithaca, N.Y., U.S.A.
________. 2000b. Preview: Global review of commercialized transgenic crops, 2000. International Service for the Acquisition of Agri-Biotech Applications Brief No. 21. Ithaca, N.Y., U.S.A.
James, C., and A. F. Krattiger. 1996. Global review of field testing and commercialization of transgenic plants, 1986 to 1995: The first decade of crop biotechnology. International Service for the Acquisition of Agri-Biotech Applications Brief No. 1. Ithaca, N.Y., U.S.A.
Jones, K, T. Kerby, H. Collins, T. Wofford, M. Bates, J. Presley, J. Burgess, B. Bueler, and R. Deaton. 1996. Performance of NuCOTN with Bollgard. In Proceedings of the Beltwide Cotton Conference, Vol. 1, 46−48. Memphis, Tenn., U.S.A.: National Cotton Council.
Karner, M, J. Goodson, A. Hutson. 2000. Bt Cotton technology in Oklahoma: An overview. OSU Current Report No. 7465. Stillwater: Oklahoma State University.
Kasler, D., and E. Lau. 2000. At Calgene, a harvest of uncertainty. Promise and peril: The Future of biotechnology. The Sacramento Bee, May 7, 2000. <http://www.sacbee.com/news/projects/biotechnology/>. Accessed November 13, 2000.
Layton, M. B., S. D. Stewart, M. R. Williams, and J. S. Long. 1999. Performance of Bt cotton in Mississippi, 1998. Proceedings of the Beltwide Cotton Conference, Vol. 2, 942−45. Memphis, Tenn., U.S.A.: National Cotton Council.

41
________. 1998. Performance of Bt cotton in Mississippi, 1997. In Proceedings of the Beltwide Cotton Conference, Vol. 2, 970−75. Memphis, Tenn., U.S.A.: National Cotton Council.
Magana-Magana, J. E., J. G. Garcia, A. J. O. Rodriguez, and J. M. O. Garcia. 1999. Comparative analysis of producing transgenic cotton varieties versus no transgenic variety in Delicias, Chihuahua, Mexico. In Proceedings of the Beltwide Cotton Conference, Vol. 1, 255−56. Memphis, Tenn., U.S.A.: National Cotton Council.
Marra, M. C., B. Hubbell, and G. A. Carlson. 1997. Unpublished survey data. North Carolina State University, Raleigh, N.C., U.S.A.
________. 2001. Information quality, technology depreciation, and Bt cotton adoption in the Southeast. Journal of Agricultural and Resource Economics 26 (1): 158−75.
McVey, M., G. Pautsch, and P. Baumel. 1995. Estimated domestic producer and end user benefits from genetically modifying U.S. soybeans. Journal of Production Agriculture. Vol. 8(2): 209−14.
Moschini, G., H. Lapan, and A. Sobolevsky. 1999. Trading technology as well as final products: Roundup Ready soybeans and welfare effects in the soybean complex. The shape of the coming agricultural biotechnology transformation: Strategic investment and policy approaches from an economic perspective. Rome, Italy.
Mullins, J. W., and J. M. Mills. 1999. Economics of Bollgard versus non-Bollgard cotton in 1998. In Proceedings of the Beltwide Cotton Conference, Vol. 2, 958−61. Memphis, Tenn., U.S.A.: National Cotton Council.
NASS (National Agricultural Statistics Service of the United States Department of Agriculture). 1999. Agricultural resource management study: Upland cotton production practices report for 1999 (survey instrument). Washington, D.C.: U.S. Government Printing Office.
________. 2001. Crop production—acreage—supplement (PCP-BB). (Acreage, June 1996–2001, text and pdf files). <http://www.usda.mannlib.cornell.edu/reports/nassr/field/pcp-bba/> Accessed July, 2001.
________. No date. NASS surveys: The foundation of estimates. <http://www/usda.gov/nass/nassinfo/estimate.htm>.
Pardey, P.G. and N. M. Beintema. 2001. Slow magic: Agricultural R&D a century after Mendel. IFPRI Food Policy Report. Washington, D.C.: International Food Policy Research Institute.
42
Pioneer Hybrid International, Inc. 2000. Products and info: Canola. <http://www.pioneer.com/australia/canola/44c71results>.
Pray, C. E., D. Ma, J. Huang, and F. Qiao. 1999. Impact of Bt cotton in China. Draft manuscript. Rutgers University, New Brunswick, N.J., U.S.A. Mimeo.
Qaim, M. 1998. Transgenic virus resistant potatoes in Mexico: Potential social implications of North-South biotechnology transfer. International Service for the Acquisition of Agri-Biotech Applications Brief No. 7. Ithaca, N.Y., U.S.A.
________. 1999. The effects of genetically modified orphan commodities: Projections for sweet potato production in Kenya. International Service for the Acquisition of Agri-Biotech Applications Brief No. 13. Ithaca, N.Y., U.S.A. and Zentrum fur Entwicklungsforschung (ZEF) [Centre for Development Research], Bonn, Germany.
ReJesus, R. M., J. K. Greene, M. D. Hammig and C. Curtis. 1997. Economic analysis of insect management strategies for transgenic Bt cotton production in South Carolina. In Proceedings of the Beltwide Cotton Conference, Vol. 1, 247−51. Memphis, Tenn., U.S.A.: National Cotton Council.
Rice, M., and C. D. Pilcher. 1998. Potential benefits and limitations of transgenic Bt corn for management of the European corn borer (Lepidoptera crambidae). American Entomologist 44 (1): 75−78.
Slinsky, S. P., E. R. Edens, J. A. Larson, and R. M. Hayes. 1998. Evaluation of cost and returns for Roundup Ready cotton. In Proceedings of the Beltwide Cotton Conference, Vol. 1, 340−43. Memphis, Tenn., U.S.A.: National Cotton Council.
Sloderbeck, P., L. Buschman, T. Dumler, and R. Higgins. 1999. Bt corn and Non-Bt corn refuges: How do the economics pencil out? Report, Kansas State University, Manhattan Kans., U.S.A. Mimeo.
Speed, T. R., and K. L. Ferreira. 1998. Performance of PM 2326RR and PM 2200RR on the Texas High Plains: A two-year summary. In Proceedings of the Beltwide Cotton Conference, Vol. 1, 565−66. Memphis, Tenn., U.S.A.: National Cotton Council.
Stark, Jr. C. R.1997. Economics of transgenic cotton: Some indications based on Georgia producers. In Proceedings of the Beltwide Cotton Conference, Vol. 1, 251−53. Memphis, Tenn., U.S.A.: National Cotton Council.
The Economist. 2000. Genetically modified crops: To plant or not to plant. January 14. <http://www.thecampaign.org/newsupdates/_januaryj.htm>. Accessed October 21, 2000.

43
Wier, A.T., J. W. Mullins and J. M. Mills. 1998. Bollgard cotton: Update and economic comparisons including new varieties. In Proceedings of the Beltwide Cotton Conference, Vol. 2, National Cotton Council, Memphis, TN, 1039−40.
Wilcut, J., S. Askew, B. Brecke, D. Bridges, S. Brown, J. Chand ler, R. Hayes, J. Kendig, D. Miller, R. Nichols, and C. Snipes. 1999. A beltwide evaluation of weed management in transgenic and non-transgenic cotton. In Proceedings of the Beltwide Cotton Conference, Vol. 1, 746−47. Memphis, Tenn., U.S.A.: National Cotton Council.
Wolfenbarger, L., and P. Phifer. 2000. The ecological risks and benefits of genetically engineered plants. Science 290 (5499): 2088−93.
York, A., and A. Culpepper. 1999. Economics of weed management systems in BXN, Roundup Ready, and conventional cotton. In Proceedings of the Beltwide Cotton Conference, Vol. 1, 744−45. Memphis, Tenn., U.S.A.: National Cotton Council.


45
Appendix Table 1--Ranges of benefits by crop, geographic area, and study
Evidence (Transgenic − Conventional) per acre
Event State/
Region/ Countrya Reference Study typeb Period Yield
Herbicide cost
Number of herbicide
sprays Insecticide cost
Number of insecticide
sprays Profit
CORN (bushels) (U.S. dollars) (count) (U.S. dollars) (count) (U.S. dollars)
Bt Iowa Rice and Pilcher 1998 A 1997 7.6
Gianessi and Carpenter 1999 A 1997−98 2.9−12.2
Illinois Gianessi and Carpenter 1999 A 1997−98 1.5−17.4
European Commission 2000 A 1998 16.33 23.37
The Economist 2000 B 1998 30
Kansas Gianessi and Carpenter 1999 A 1997−98 3.7−12
Sloderbeck, Buschman, Dumler, and Higgins 1999 A
1997−98
average 7.7
Minnesota Rice and Pilcher 1998 A 1997 18.2
Nebraska Gianessi and Carpenter 1999 A 1997−98 4.2−10.5
South Dakota Gianessi and Carpenter 1999 A 1997−98 7.7−12.9
U.S. Heartland Hart 1999 Fa 1997 0.06
U.S. Corn Belt European Commission 2000 A 1997 14.9
United States Gianessi and Carpenter 1999 A 1997−98 4.6−9.4
U.S. Corn Belt A 1997 10.8−17
A 1998 7
RR U.S. Heartland Hart 1999 Fa 1997 0.3
COTTON (pounds lint) Bt Alabama Jones et al. 1996 A 1994−95 138.5−231.5
Marra, Hubbell, and Carlson 1997 B 1996 165.9 3.1 0.31 116.48
Mullins and Mills 1999 A 1998 38 −67.99 −3 38.74
Arkansas Bryant, Robertson and Lorenz 1999 A 1996−97 4.38−11.29 −26.95−86.74
Bryant, Robertson, and Lorenz 1998
A 1997 −24 −25
Mullins, and Mills 1999 C 1998 22 −15.43 −2.2 36.03

46
Appendix Table 1Ranges of benefits by crop, geographic area, and study (continued)
Evidence (Transgenic − Conventional) per acre
Event State/
Region/ Countrya Reference Study typeb Period Yield
Herbicide cost
Number of herbicide
sprays Insecticide cost
Number of insecticide
sprays Profit
COTTON (continued) (pounds lint) (U.S.dollars) (count) (U.S.dollars) (count) (U.S.dollars)
Benson and Hendrix 1999 A 1998 −37 −24.63 −2.54 −3.12
Bt/RR Bryant, Allen, Bourland, and Earnest 1999
A 1998 917 62 97 465
Bryant, Allen, Bourland and Earnest 1999 A 1998 −331.5 −366 97 21
Bt/RR Bryant, Allen, Bourland, and Earnest 1999
A
1998
917
62
97
465
Bt Bryant, Robertson, and Lorenz 1999 A 1998 −10.22 64.52
Capps, Allen, Earnest, Tugwell, Kharbouti 1999 A 1998 452
Mullins, and Mills 1999 C 1998 85 −5.57 −1.8 60.7
China Pray, Ma, Huang, and Qiao 1999
B
1999
325
−71
66.3
Georgia Marra, Hubbell, and Carlson 1997 B 1996 83.55 −29.67 −2.68 169.24
Stark 1997 C 1996 104 27.5 −2.5 68
Mullins and Mills 1999 A 1998 38 −67.99 −3 38.74
Louisiana Mullins and Mills 1999 C 1998 22 −15.43 −2.2 36.03
Benson and Hendrix 1999 C 1998 −37 −24.63 −2.54 −3.12
Mexico Magana et al. 1999 A 1998 182 36 173 Mississippi Wier, Mullins, and Mills 1998 A 1995 92 −22.7 79.5
Cooke and Freeland 1998 A 1996 −73 to 0 0−0.67
Wier, Mullins, and Mills 1998 A 1996−97 46−84 1.87−5.19 24.71−50.73
Gibson et al. 1997 A 1996 47 13.84 16.23
Layton, Stewart, Williams, and Long 1998 A
1997−98
−3.34 to −1.34
Mullins and Mills 1999 C 1998 22 −15.43 −2.2 36.03
Benson and Hendrix 1999 C 1998 −37 −24.63 −2.54 −3.12
North Central Jones et al. 1996 A 1994−95 63.5−182.5

47
Appendix Table 1--Ranges of benefits by crop, geographic area, and study (continued)
Evidence (Transgenic − Conventional) per acre
Event State/
Region/ Countrya Reference Study typeb Period Yield
Herbicide cost
Number of herbicide
sprays Insecticide cost
Number of insecticide
sprays Profit
COTTON (contin ued) (pounds lint) (U.S. dollars) (count) (U.S. dollars) (count) (U.S. dollars)
North Central Bacheler, Mott, and Morrison 1998 D 1996 7.49−8.96
Marra, Hubbell, and Carlson 1997 B 1996 −3.21 −27.48 −2.38 3.54
Mullins, and Mills 1999 C 1998 62 −1.19 −2.5 41.71
Oklahoma Karner, Goodson, and Hutson 2000 E 1996−99 120−203 −6.5 to −2.3 25.46−85.53
South Carolina Marra, Hubbell, and Carlson 1997 B 1996 119 −31.12 −2.47 80.06
ReJesus, Greene, Hammig and Curtis 1997 A 1996 68.44
Mullins, and Mills 1999 A 1998 62−85 −5.57 to −1.19 −2.5 to −1.8 41.71−60.7
Texas Jones et al. 1996 A 1994−95 91.4−177.5
Speed and Ferreira 1998 A 1996−97 80.6−81 2.11−9.09 45.99−52.72
Virginia Mullins and Mills 1999 A 1998 62 −1.19 −2.5 41.71
Cotton Belt Hart 1999 Fa 1997 −0.92 to −3.03
RR Mississippi Portal Hart 1999 Fa 1997 −1.32
Bt South Carolina ReJesus Greene, Hammig, and Curtis 1997 A 1996 17.12
RR Arkansas Bryant, Allen, Bourlan, and Earnest 1999 A 1998 −150 2 0 −104
Tenessee Slinsky, Edens, Larson, and Hayes 1998 A 1996 −243 −145.3 74.26
Bt/Rr Arkansas Bryant, Allen, Bourland and Earnest 1999 A 1998 −331.5 −366 97 21

48
Appendix Table 1Ranges of benefits by crop, geographic area, and study (continued)
Evidence (Transgenic − Conventional) per acre
Event State/
Region/ Countrya Reference Study typeb Period Yield
Herbicide cost
Number of herbicide
sprays Insecticide
cost
Number of insecticide
sprays Profit
SOYBEANS (bushels) (U.S.dollars) (count) (U.S.dollars) (count) (U.S.dollars)
Ht U.S. Heartland Bryant, Allen, Bourland and Earnest 1999
F 1997 −0.54
Mississippi Portal F 1997 −0.53
North Carolina F 1997 0.07
Ht Pacific Garden Hart 1999 Fa 1997 −1.1
QE United States McVey, Pautsch, and Baumel 1995 F ex ante
0.49/bu− 0.11/bu
RR Illinois European Commission 2000 A 1997 1.71
Iowa A 1997 −3.42
Kansas A 1997 −2.96
Minnesota A 1997 −4.16
Mississippi Couvillion, Kari, Hudson, and Allen 2000 Fa 1997−98 −6.69−4.24 −4.24−6.69
North Central Harley 1999 B 1996−97 3.24−6.83
Dunphy and York 2000 A 1999 −2.3
Coble 1997 A 1994−96 average
6
Dunphy, Heiniger, and York 2000
A 1996−98 average
22
South Dakota European Commission 2000 A 1997 −4.16 22
Wisconsin A 1997 −1.59
United States Moschini, Lapan, and Sobolevsky 1999 E ex ante 2.25 20
Michigan European Commission 2000 A 1997 −1.71
Nebraska A 1997 −5.75
Ohio A 1997 −1.71

49
Appendix Table 1Ranges of benefits by crop, geographic area, and study (continued)
Evidence (Transgenic − Conventional) per acre
Event
State/ Region/ Country Reference
Study type Period Yield
Herbicide cost
Number of herbicide
sprays Insecticide cost
Number of insecticide
sprays Profit
CANOLA (bushels) (U.S. dollars) (count) (U.S. dollars) (count) (U.S. dollars)
RR Australia Pioneer Hybrid 2000 A 1999 7.82− 41.36
Alberta,
Canada
European Commission 2000
A 1998 −2 to −1 −84.97 to 95.51
Saskatchewon, Canada A 1999 −2.7 −10 −16.83
IRISH POTATOES (hundredweight)
Bt United States Gianessi and Carpenter 1999 F 1997−98 −1.81 to 18
Illinois F 1996−98 −4.63 to 37.24
North West United States F 1998 51
Virus-resistant PVX-PVY
Mexico Qaim 1998 E ex ante 6.68−10.72 69.6−139.84
Virus-resistant PVX-PVY-PLRV E ex ante 34.98−42.98 390.9−559.38
SWEET POTATOES Virus Resistant Sweet Potatoes
Kenya Qaim 1998 E ex-ante 7.8−16.33
42.31−101.12
Source: Compiled by authors. Note: Under "study type," A denotes field trial-conventional versus transgenic varieties; B denotes farmer survey-side-by-side comparisons; C denotes field trial-side-by-side, on-farm comparisons; D denotes p aired field comparisons; E denotes expert opinion; F denotes other means of comparison. Superscript “a” denotes the 6 studies that were omitted from the analysis, as discussed in the beginning of section 5.


EPTD DISCUSSION PAPERS
LIST OF EPTD DISCUSSION PAPERS
01 Sustainable Agricultural Development Strategies in Fragile Lands, by Sara J. Scherr and Peter B.R. Hazell, June 1994.
02 Confronting the Environmental Consequences of the Green Revolution in Asia, by Prabhu L. Pingali and Mark W. Rosegrant, August 1994.
03 Infrastructure and Technology Constraints to Agricultural Development in the Humid and Subhumid Tropics of Africa, by Dunstan S.C. Spencer, August 1994.
04 Water Markets in Pakistan: Participation and Productivity, by Ruth Meinzen-Dick and Martha Sullins, September 1994.
05 The Impact of Technical Change in Agriculture on Human Fertility: District-level Evidence From India, by Stephen A. Vosti, Julie Witcover, and Michael Lipton, October 1994.
06 Reforming Water Allocation Policy Through Markets in Tradable Water Rights: Lessons from Chile, Mexico, and California, by Mark W. Rosegrant and Renato Gazri S, October 1994.
07 Total Factor Productivity and Sources of Long-Term Growth in Indian Agriculture, by Mark W. Rosegrant and Robert E. Evenson, April 1995.
08 Farm-Nonfarm Growth Linkages in Zambia, by Peter B.R. Hazell and Behjat Hoijati, April 1995.
09 Livestock and Deforestation in Central America in the 1980s and 1990s: A Policy Perspective, by David Kaimowitz (Interamerican Institute for Cooperation on Agriculture), June 1995.
10 Effects of the Structural Adjustment Program on Agricultural Production and Resource Use in Egypt, by Peter B.R. Hazell, Nicostrato Perez, Gamal Siam, and Ibrahim Soliman, August 1995.
11 Local Organizations for Natural Resource Management: Lessons from Theoretical and Empirical Literature, by Lise Nordvig Rasmussen and Ruth Meinzen-Dick, August 1995.

EPTD DISCUSSION PAPERS
12 Quality-Equivalent and Cost-Adjusted Measurement of International Competitiveness in Japanese Rice Markets, by Shoichi Ito, Mark W. Rosegrant, and Mercedita C. Agcaoili-Sombilla, August 1995.
13 Role of Inputs, Institutions, and Technical Innovations in Stimulating Growth in Chinese Agriculture, by Shenggen Fan and Philip G. Pardey, September 1995.
14 Investments in African Agricultural Research, by Philip G. Pardey, Johannes Roseboom, and Nienke Beintema, October 1995.
15 Role of Terms of Trade in Indian Agricultural Growth: A National and State Level Analysis, by Peter B.R. Hazell, V.N. Misra, and Behjat Hoijati, December 1995.
16 Policies and Markets for Non-Timber Tree Products, by Peter A. Dewees and Sara J. Scherr, March 1996.
17 Determinants of Farmers’ Indigenous Soil and Water Conservation Investments in -Arid Tropics, by John Pender and John Kerr, August 1996.
18 Summary of a Productive Partnership: The Benefits from U.S. Participation in the CGIAR, by Philip G. Pardey, Julian M. Alston, Jason E. Christian, and Shenggen Fan, October 1996.
19 Crop Genetic Resource Policy: Towards a Research Agenda, by Brian D. Wright, October 1996.
20 Sustainable Development of Rainfed Agriculture in India, by John M. Kerr, November 1996.
21 Impact of Market and Population Pressure on Production, Incomes and Natural Resources in the Dryland Savannas of West Africa: Bioeconomic Modeling at the Village Level, by Bruno Barbier, November 1996.
22 Why Do Projections on China’s Future Food Supply and Demand Differ? by Shenggen Fan and Mercedita Agcaoili-Sombilla, March 1997.
23 Agroecological Aspects of Evaluating Agricultural R&D, by Stanley Wood and Philip G. Pardey, March 1997.

EPTD DISCUSSION PAPERS
24 Population Pressure, Land Tenure, and Tree Resource Management in Uganda, by Frank Place and Keijiro Otsuka, March 1997.
25 Should India Invest More in Less-favored Areas? by Shenggen Fan and Peter Hazell, April 1997.
26 Population Pressure and the Microeconomy of Land Management in Hills and Mountains of Developing Countries, by Scott R. Templeton and Sara J. Scherr, April 1997.
27 Population Land Tenure and Natural Resource Management: The Case of Customary Land Area in Malawi, by Frank Place and Keijiro Otsuka, April 1997.
28 Water Resources Development in Africa: A Review and Synthesis of Issues, Potentials, and Strategies for the Future, by Mark W. Rosegrant and Nicostrato D. Perez, September 1997.
29 Financing Agricultural R&D in Rich Countries: What’s Happening and Why? by Julian M. Alston, Philip G. Pardey, and Vincent H. Smith, September 1997.
30 How Fast Have China’s Agricultural Production and Productivity Really Been Growing? by Shenggen Fan, September 1997.
31 Does Land Tenure Insecurity Discourage Tree Planting? Evolution of Customary Land Tenure and Agroforestry management in Sumatra, by Keijiro Otsuka, S. Suyanto, and Thomas P. Tomich, December 1997.
32 Natural Resource Management in the Hillsides of Honduras: Bioeconomic Modeling at the Micro-Watershed Level, by Bruno Barbier and Gilles Bergeron, January 1998.
33 Government Spending, Growth, and Poverty: An Analysis of Interlinkages in Rural India, by Shenggen Fan, Peter Hazell, and Sukhadeo Thorat, March 1998. Revised December 1998.
34 Coalitions and the Organization of Multiple-Stakeholder Action: A Case Study of Agricultural Research and Extension in Rajasthan, India, by Ruth Alsop, April 1998.
EPTD DISCUSSION PAPERS
35 Dynamics in the Creation and Depreciation of Knowledge and the Returns to Research, by Julian Alston, Barbara Craig, and Philip Pardey, July, 1998.
36 Educating Agricultural Researchers: A Review of the Role of African Universities, by Nienke M. Beintema, Philip G. Pardey, and Johannes Roseboom, August 1998.
37 The Changing Organizational Basis of African Agricultural Research, by Johannes Roseboom, Philip G. Pardey, and Nienke M. Beintema, November 1998.
38 Research Returns Redux: A Meta-Analysis of the Returns to Agricultural R&D, by Julian M. Alston, Michele C. Marra, Philip G. Pardey, and T.J. Wyatt, November 1998.
39 Technological Change, Technical and Allocative Efficiency in Chinese Agriculture: The Case of Rice Production in Jiangsu, by Shenggen Fan, January 1999.
40 The Substance of Interaction: Design and Policy Implications of NGO-Government Projects in India, by Ruth Alsop with Ved Arya, January 1999.
41 Strategies for Sustainable Agricultural Development in the East African Highlands, by John Pender, Frank Place, and Simeon Ehui, April 1999.
42 Cost Aspects of African Agricultural Research, by Philip G. Pardey, Johannes Roseboom, Nienke M. Beintema, and Connie Chan-Kang, April 1999.
43 Are Returns to Public Investment Lower in Less-favored Rural Areas? An Empirical Analysis of India, by Shenggen Fan and Peter Hazell, May 1999.
44 Spatial Aspects of the Design and Targeting of Agricultural Development Strategies, by Stanley Wood, Kate Sebastian, Freddy Nachtergaele, Daniel Nielsen, and Aiguo Dai, May 1999.
45 Pathways of Development in the Hillsides of Honduras: Causes and Implications for Agricultural Production, Poverty, and Sustainable Resource Use, by John Pender, Sara J. Scherr, and Guadalupe Durón, May 1999.
46 Determinants of Land Use Change: Evidence from a Community Study in Honduras, by Gilles Bergeron and John Pender, July 1999.

EPTD DISCUSSION PAPERS
47 Impact on Food Security and Rural Development of Reallocating Water from Agriculture, by Mark W. Rosegrant and Claudia Ringler, August 1999.
48 Rural Population Growth, Agricultural Change and Natural Resource Management in Developing Countries: A Review of Hypotheses and Some Evidence from Honduras, by John Pender, August 1999.
49 Organizational Development and Natural Resource Management: Evidence from Central Honduras, by John Pender and Sara J. Scherr, November 1999.
50 Estimating Crop-Specific Production Technologies in Chinese Agriculture: A Generalized Maximum Entropy Approach, by Xiaobo Zhang and Shenggen Fan, September 1999.
51 Dynamic Implications of Patenting for Crop Genetic Resources, by Bonwoo Koo and Brian D. Wright, October 1999.
52 Costing the Ex Situ Conservation of Genetic Resources: Maize and Wheat at CIMMYT, by Philip G. Pardey, Bonwoo Koo, Brian D. Wright, M. Eric van Dusen, Bent Skovmand, and Suketoshi Taba, October 1999.
53 Past and Future Sources of Growth for China, by Shenggen Fan, Xiaobo Zhang, and Sherman Robinson, October 1999.
54 The Timing of Evaluation of Genebank Accessions and the Effects of Biotechnology, by Bonwoo Koo and Brian D. Wright, October 1999.
55 New Approaches to Crop Yield Insurance in Developing Countries, by Jerry Skees, Peter Hazell, and Mario Miranda, November 1999.
56 Impact of Agricultural Research on Poverty Alleviation: Conceptual Framework with Illustrations from the Literature, by John Kerr and Shashi Kolavalli, December 1999.
57 Could Futures Markets Help Growers Better Manage Coffee Price Risks in Costa Rica? by Peter Hazell, January 2000.
58 Industrialization, Urbanization, and Land Use in China, by Xiaobo Zhang, Tim Mount, and Richard Boisvert, January 2000.
EPTD DISCUSSION PAPERS
59 Water Rights and Multiple Water Uses: Framework and Application to Kirindi Oya Irrigation System, Sri Lanka, by Ruth Meinzen-Dick and Margaretha Bakker, March 2000.
60 Community natural Resource Management: The Case of Woodlots in Northern Ethiopia, by Berhanu Gebremedhin, John Pender and Girmay Tesfaye, April 2000.
61 What Affects Organization and Collective Action for Managing Resources? Evidence from Canal Irrigation Systems in India, by Ruth Meinzen-Dick, K.V. Raju, and Ashok Gulati, June 2000.
62 The Effects of the U.S. Plant Variety Protection Act on Wheat Genetic Improvement , by Julian M. Alston and Raymond J. Venner, May 2000.
63 Integrated Economic-Hydrologic Water Modeling at the Basin Scale: The Maipo River Basin, by M. W. Rosegrant, C. Ringler, D.C. McKinney, X. Cai, A. Keller, and G. Donoso, May 2000.
64 Irrigation and Water Resources in Latin America and he Caribbean: Challenges and Strategies, by Claudia Ringler, Mark W. Rosegrant, and Michael S. Paisner, June 2000.
65 The Role of Trees for Sustainable Management of Less-favored Lands: The Case of Eucalyptus in Ethiopia, by Pamela Jagger & John Pender, June 2000.
66 Growth and Poverty in Rural China: The Role of Public Investments, by Shenggen Fan, Linxiu Zhang, and Xiaobo Zhang, June 2000.
67 Small-Scale Farms in the Western Brazilian Amazon: Can They Benefit from Carbon Trade? by Chantal Carpentier, Steve Vosti, and Julie Witcover, September 2000.
68 An Evaluation of Dryland Watershed Development Projects in India, by John Kerr, Ganesh Pangare, Vasudha Lokur Pangare, and P.J. George, October 2000.
69 Consumption Effects of Genetic Modification: What If Consumers Are Right? by Konstantinos Giannakas and Murray Fulton, November 2000.
EPTD DISCUSSION PAPERS
70 South-North Trade, Intellectual Property Jurisdictions, and Freedom to Operate in Agricultural Research on Staple Crops, by Eran Binenbaum, Carol Nottenburg, Philip G. Pardey, Brian D. Wright, and Patricia Zambrano, December 2000.
71 Public Investment and Regional Inequality in Rural China, by Xiaobo Zhang and Shenggen Fan, December 2000.
72 Does Efficient Water Management Matter? Physical and Economic Efficiency of Water Use in the River Basin, by Ximing Cai, Claudia Ringler, and Mark W. Rosegrant, March 2001.
73 Monitoring Systems for Managing Natural Resources: Economics, Indicators and Environmental Externalities in a Costa Rican Watershed, by Peter Hazell, Ujjayant Chakravorty, John Dixon, and Rafael Celis, March 2001.
74 Does Quanxi Matter to NonFarm Employment? by Xiaobo Zhang and Guo Li, June 2001.
75 The Effect of Environmental Variability on Livestock and Land-Use Management: The Borana Plateau, Southern Ethiopia, by Nancy McCarthy, Abdul Kamara, and Michael Kirk, June 2001.
76 Market Imperfections and Land Productivity in the Ethiopian Highlands, by Stein Holden, Bekele Shiferaw, and John Pender, August 2001.
77 Strategies for Sustainable Agricultural Development in the Ethiopian Highlands, by John Pender, Berhanu Gebremedhin, Samuel Benin, and Simeon Ehui, August 2001.
78 Managing Droughts in the Low-Rainfall Areas of the Middle East and North Africa: Policy Issues, by Peter Hazell, Peter Oram, Nabil Chaherli, September 2001.
79 Accessing Other People’s Technology: Do Non-Profit Agencies Need It? How To Obtain It, by Carol Nottenburg, Philip G. Pardey, and Brian D. Wright, September 2001.
80 The Economics of Intellectual Property Rights Under Imperfect Enforcement: Developing Countries, Biotechnology, and the TRIPS Agreement, by Konstantinos Giannakas, September 2001.
EPTD DISCUSSION PAPERS
81 Land Lease Markets and Agricultural Efficiency: Theory and Evidence from Ethiopia, by John Pender and Marcel Fafchamps, October 2001.
82 The Demand for Crop Genetic Resources: International Use of the U.S. National Plant Germplasm System, by M. Smale, K. Day-Rubenstein, A. Zohrabian, and T. Hodgkin, October 2001.
83 How Agricultural Research Affects Urban Poverty in Developing Countries: The Case of China, by Shenggen Fan, Cheng Fang, and Xiaobo Zhang, October 2001.
84 Does Infrastructure Matter: Approach and Evidence from Rural India, by Xiaobo Zhang and Shenggen Fan, October 2001.
85 Development Pathways and Land Management in Uganda: Causes and Implications, by John Pender, Pamela Jagger, Ephraim Nkonya, Dick Sserunkuumba, December 2001.
86 Sustainability Analysis for Irrigation Water Management: Concepts, Methodology, and Application to the Aral Sea Region, by Ximing Cai, Daene C. McKinney, and Mark W. Rosegrant, December 2001.