Embed Size (px)
Citation preview

Eur Respir J 1990, 3, 521-526
The pattern of resting breathing in patients with upper airway obstruction
J. Sanchis, J.L. Dfez-Betoret, P. Casan, J . Milic-EmiW'
The pattern of resting breathing in palienls with upper airway obstr~~etion. J. Sanchis, J L. Dfez-Beroret, P. Casan, J. Milic-Emili.
Unitat de Funci6 Pulmonar, Hospiw de la Santa Creu i de Sant Pau, Departament de Medicina, Universitat Autonoma de Barcelona, Barcelona, Spain. ABSTRACT: The now-time cur ve of resting breathing was recorded in 14
patients (aged 36±16 yrs) with mild to moderate symptoms of upper airway obstruction (UawO) and compared to that of 28 matched, healthy controls (HC) In order to characterize the breathing pattern of such patients. The Inspiratory time over total time (fllftot) was higher in the patients (0.42; so 0.04) than In HC (0.37; so 0.04) (pc:O.OOl), and tidal volume (VT) over TI was lower In patients (0.37; SD 0.07 Z.S·•) than fn HC (0.43; so 0.09 Z.S·•) (pc:O.Ol). Inspiratory and expiratory peak nows at rest were also lower In the patients (p<O.OOl). In these, the mean to peak now ratio of Inspiration (0.74; so 0.07) was higher than In HC (0.66; so 0.04) (p<O.OOOS). This Indicates a more rec:t.angular wave of Inspiration In the patients. All of these changes may be due to the increased Inspiratory load. However, since the patients were breathing at rest with VT and nows far below their values on the maximal now volume loop, the changes can also be Interpreted as adaptive rather than Imposed by absolute mechanical limitations.
• Meakim-Christie Laboratories, McGill University, Montreal. Canada.
Correspondence: Dr J. Sanchis, Unitat de Funci6 Pulmonar, H01pital de la Santa Creu i de Sant Pau, Avda. S.A.M. Oaret 167, 08025 Barcelona, Spain.
Keywords: Breathing pauem; flow limitation; loaded breathing; upper airway.
Received: May S, 1989; accepted after revision January 19, 1990.
Eur Respir J., 1990, 3, 521-526.
Obstructive lesions of the upper airway, from carina to epiglottis, are classified as ftxed or variable according to the dynamics of airflow limitation (AFL) [1). A fixed lesion produces AFL during inspiration and expiration. When the lesion renders the airway more compliant the obstruction is variable and depends on the effect of changes in pressure on the airway wall. Its location determines the phase of breathing, inspiration or expiration, in which AFL occurs [1]. Variable extrathoracic lesions mainly affect inspiration, whilst variable intrathoracic lesions principally limit expiratory flow.
An obstructive lesion of the upper airway increases turbulent flow, thus markedly raising airway resistance as flow increases in a mechanically intact respiratory system. Upper airway obstruction (UawO) can be characterized by two physiological abnormalities: the inspiratory flows are markedly reduced and the peak expiratory flow (PEF) is disproportionately low relative to the forced expiratory volume in one second (FEV
1) [2].
Attention has therefore been focused on the following ratios: maximum mid-expiratory flow to maximum mid-inspiratory flow (FEF,JF!Fso) [3]; forced expired volume in one second to the peak expiratory flow rate (FEVJPEF) [4); FEV1 to forced expired volume in 0.5 s (FEVJFEV0 J [5]; and maximal voluntary ventilation (MVV) to FEV1 [6, 7].
Apart from these indices, the overall shape of the maximal flow-volume loop (MFVL) is in itself informative as indicated by MILlER and HYATI in 1969 [1, 2]. Extensive study has since been done on the MFVL of patients with UawO. However, little attention has been focused on the pattern of resting breathing in UawO. In the present study, we sought to obtain new information on the breathing strategies these patients use in the face of increases in upper airway flow resistance, by comparing the patients' resting breathing pattern with that of healthy controls.
Patients
The studies were performed on 14 patients (9 women) with extrathoracic UawO as confirmed by direct endoscopy and pulmonary function tests. The patients' anthropometric and clinical data, together with individual values for selected pulmonary function indices of UawO, are presented in table 1. All patients reached at least two of the index values used as criteria for extrathoracic UawO. In addition, the contour of the maximal flow-volume loop in patients with fixed narrowing showed nearly equal degrees of flattening of the inspiratory and expiratory loops, whereas in patients with lesions of variable narrowing the MFVL showed
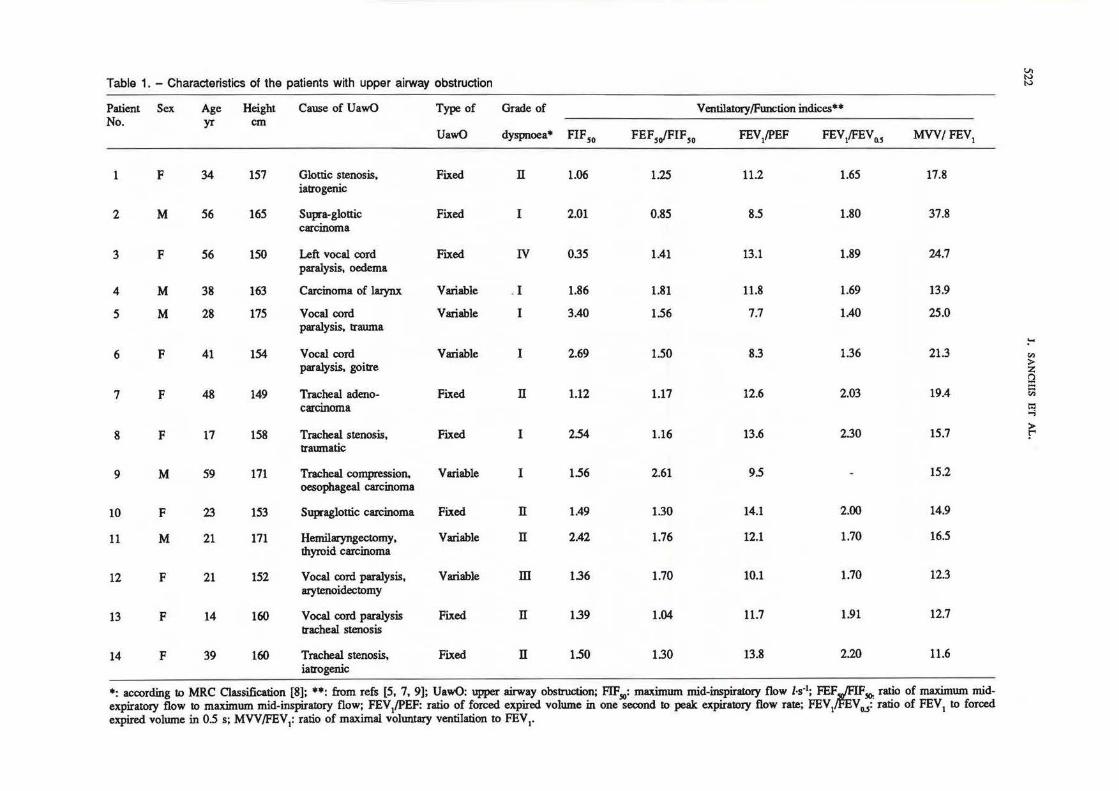
Table 1. - Characteristics of the patients with upper airway obstruction VI IV IV
Patient Sex Age Height Cause of UawO Type of Grade of Ventilatory/FWlCtion indices•• No. yr cm
UawO dyspnoea• FIFSO FEF5JFIF,0 FEV/PEF FEV1!FEVo.s MVV/FEV1
1 F 34 157 Glottic stenosis, Fixed n 1.06 1.25 11.2 1.65 17.8 iatrogenic
2 M 56 165 Supra-glottic Fixed I 2.01 0.85 8.5 1.80 37.8 carcinoma
3 F 56 150 Left vocal oord Fixed IV 0.35 1.41 13.1 1.89 24.7 paralysis, oedema
4 M 38 163 Carcinomaoflaiynx Variable . I 1.86 1.81 11.8 1.69 13.9
5 M 28 175 Vocal cord Variable I 3.40 1.56 7.7 1.40 25.0 paralysis, trauma
!-'
6 F 41 154 Vocal cord Variable I 2.69 1.50 8.3 1.36 21.3 en paralysis, goitre >
2: t"l :I:
7 F 48 149 Tracheal adeno- Fixed n 1.12 1.17 12.6 2.03 19.4 c;; carcinoma ~
8 F 17 158 Tracheal stenosis, Fixed I 2.54 1.16 13.6 2.30 15.7 ~ traumatic
9 M 59 171 Tracheal compression. Variable I 1.56 2.61 9.5 15.2 oesophageal carcinoma
10 F 23 153 Supraglottic carcinoma Fixed n 1.49 1.30 14.1 2.00 14.9
11 M 21 171 Hemilaryngectomy, Variable n 2.42 1.76 12.1 1.70 16.5 thyroid carcinoma
12 F 21 152 Vocal cord paralysis, Variable m 1.36 1.70 10.1 1.70 12.3 arytenoidectomy
13 F 14 160 V oca1 cord paralysis Fixed n 1.39 1.04 11.7 1.91 12.7 tracheal stenosis
14 F 39 160 Tracheal stenosis, Fixed n 1.50 1.30 13.8 2.20 11.6 iatrogenic
•: according to MRC Classification [8]; ••: from refs [5, 7, 9]; UawO: upper airway obstruction; FIF50: maximum mid-inspiratory flow J-s·1; FEFG.SO: ratio of maximum mid-expiratory flow to maximum mid-inspiratory flow; FEV/PEF: ratio of fotced expired volume in one second to peak expiratory flow rate; FEV1 V0.,: ratio of FEV1 to forced expired volume in 0.5 s; MVV!FEV1: ratio of maximal voluntary ventilation to FEV1•

BREATHING PATIBRN IN UPPER AIRWAY OBSTRUCTION 523
mainly a flattening of the inspiratory loop. Patients reported no respiratory symptoms prior to development of their UawO. Only patient No. 5 had been a smoker.
The control group consisted of 28 healthy subjects (19 women), selected solely on the basis of similarity to the patients' ages, heights and weights, and to provide a similar male/female ratio. The mean values of physical characteristics and pulmonary function data of both groups can be seen in table 2. The study was approved by the hospital's Ethics Committee. Informed consent was obtained from patients and healthy volunteers.
Table 2. - Physical characteristics and pulmonary function data
Controls UawO patients (n=28) (n=14)
Sex 9M/19F 5M/9F Age yr 33 (9) 36 (16) Height cm 162 (6) 160 (9) Weight kg 57 (8) 61 (13) FVC l 3.8 (0.7) 3.4 (1.1) FEVI/ 3.1 (0.6) • 2.3 (1.0) FEV/FVC% 82 (7) • 67 (11) FRC l 2.8 (0.6) 2.8 (0.7) TLC l 5.3 (0.9) 5.0 (1.4) RV{ILC% 27 (3) • 33 (7) MVV l·min-1 126 (32) • 43 (20) RaWJ hPa·J·1·s 1.8 (0.7) • 6.6 (5.4) RawB hPa·J·1·s 1.9 (0.7) • 7.9 (6.7) Pao2 kPa 12.1 (1.2) Paco2 kPa 5.2 (0.7)
Values are means with s.o in parentheses. *: p<0.005; M: male; F: female; FVC: forced vital capacity; FEY : forced expiratory volume in one second; FRC: functional residual capacity; TLC: total lung capacity; RV: residual volume; MVV: maximum voluntary ventilation; RaWI and Rawa: inspiratory and expiratory airway resistance, respectively; Pao2 and Paco2: arterial oxygen and carbon dioxide tension, respectively; UawO: upper airway obsttuction.
Methods
Using standard techniques [10], spirometry and 15s MVV were recorded with a Fleisch No. 3 pneumotachograph (Pulmonary System, Hewlett-Packard HP21072B, Palo Alto, Ca., USA) connected to a pressure transducer, analogue-to-digital converter (HP47310A) and desk-top computer (HP9825A) assembly. Apparatus deadspace was 130 ml. Functional residual capacity (FRC) was measured by heliumdilution (Mark V .P.K. Morgan, UK) and inspiratory and expiratory airway resistance (RaWI, RaWE) were determined with a body plethysmograph (Fenyves & Gut, Basel, Switzerland). All volumes were adjusted for body temperature, atmospheric pressure and saturation. Samples of arterial blood were drawn, in patients only, by puncture from the radial artery and immediately
analysed with a blood gas analyser (ABL 30 Radiometer, Copenhagen, Denmark).
Mouth occlusion pressure (P0
_1
) was measured according to the technique of WlnTELAw et al. [11) with a silent, hand-operated valve and a pressure transducer (Hewlett-Paekard HP270) and amplifier (HP8805C) whose signal was displayed graphically by an X-Y recorder (HP07041A). The result reported for each subject is the mean value of the three best of ten recordings as judged by the technician.
Airflow at rest was measured at the mouth by means of the same equipment used for spirometry and MVV; with the computer suitably programmed to record the flow signal at 50 ms intervals, up to a period of 5 min per sample, at least twice for each subject, and then stored on floppy disks for later analysis. Volume was obtained by electronic integration of the flow signal. The various breathing pattern indices were estimated cycle-by-cycle and then averaged for each 5 min sample in each subject. Because of their smaller variability, mean values of the second sample were used for analysis. Minute ventilation (YE), breathing frequency (f), tidal volume (yn, VTE), mean flows (Vn{fi, VTB/TE), peak flows (VImax, VEmax), inspiratory and expiratory times (TI, Th) and duty cycle (Tr/Ttot) were measured. If present, Ttot included the end-expiratory pause (eeP), i.e. a period with no flow at the end of expiration. Possible differences in the overall shape of the flow-time profile were assessed by measuring the ratio of the mean to peak flow in each phase of breathing ((Vn{fi)rVImax and (VTE/TE)/VEmax, respectively).
A frequency distribution analysis of data was performed by the Kolmogorov-Smimov test for each variable. The test showed no significant difference from the Gaussian distribution for all variables, with the exception of eeP (p<0.032). Therefore, t-test comparisons of variables from UawO patients and healthy controls were carried out. A correlation analysis was performed with variables of the resting breathing and the MFVL in the patients. Statistical significance was accepted at p<0.05.
Results
Comparison of physical and pulmonary function data of patients and healthy controls (table 2) showed statistically significant differences for FEV" FEV
1 as
percentage of forced vital capacity (FEV/FVC), residual volume as percentage of to~ lung capacity (RV /TLC), MVV, RaWI and RaWE. Thus, as a group, patients had a significant degree of AFL during forced expiration and inspiration. In the absence of previous lung disease, all these abnormalities of lung function can be attributed solely to UawO.
The means of the resting breathing pattern variables together with P o.1 of patients and controls are shown in table 3. P0_1 was significantly higher in the UawO patients. In contrast, their mean inspiratory flow was significantly lower due to lower VT and longer Tt. This was associated with a significantly higher TI{ftot and a shorter end-expiratory pause in the UawO patients. In

524 J. SANCHIS ET AL.
fact. an eeP >0.2 s was present in only two of the 14 UawO patients. whilst in the control group it was ob~ed in seven of the,28 healthy volunteers. The (VT/ TI)Nunax and (VT/TE)NBmax ratios were significantly higher in the UawO patients. This reflects the more rectangular shape of the patients' inspiratory and expiratory flow-time proftles as graphically illustrated by the comparison of the flow-time curve of two representative cases: a UawO patient and a healthy conttol (fig. 1).
Table 3. - Resting breathing pattern
Po.1 kPa VH l·min·1
VT l f min·l 'lis Ths 'Mtot eePs VTJ/fl l·s·1
Vunax /·s·1
VTB{fa l·s·1
V Bmax z.s-1
Vn{fl)/Vunax V TP/fB)/VI!JJlax
Controls
1.2 (0.5) 8.91 (1.7) 0.62 (0.10) 14.8 (3.2) 1.61 (0.40) 2.65 (0.63) 0.37 (0.04) 0.26 (0.26) 0.43 (0.09) 0.66 (0.12) 0.27 (0.06) 0.48 (0.12) 0.66 (0.04) 0.56 (0.06)
•
+ + • ++
+ ++ ++
UawO patients
2.2 (1.4) 8.81 (1.6) 0.57 (0.12) 15.8 (3.8) 1.70 (0.39) 2.37 (0.65) 0.42 (0.04) 0.05 (0.10) 0.37 (0.07) 0.50 (0.09) 0.26 (0.06) 0.37 (0.08) 0.74 (0.07) 0.69 (0.07)
Values are means with so in parentheses. • : p<O.Ol; ;+-: p<O.OOl; ++: p<0.0005; P0_
1: mouth occlusion pressure; Vs: minute
ventilation; VT: Ltdal volume; f: breathing frequency; T1: inspiratory time; Ts: expiratory tim.e; Tr/ftot: duty cycle; eeP: end-expiratory pause; Vn/Tl and VTI!/l'a: mean flows; V1max and VBmax: peak flows; (VTJ/fl)tYtmax and (VTP/fe)tVBmax: ratio of mean to peak inspiratory and expiratory flow, respectively; UawO: upper airway obstruction.
.60
.50
. 40
.30 j !
.20 l
.10
-.10
- .20
-.60
Flow ,..-1 ... ,
I • . \
.
I ,. / .. ·· .•·
Times
Fig. 1. - Mean flow/lime curve (re-drawn) of a patient with UawO (continuoiU trace) superimpoeed on that of a control (dolled line), to stress differences in flow and shape ............. : healthy cootrol;- - : upper airway obstruction.
The correlation analyses showed significant degrees of association between 1'1/Ttot and Rawr (r=0.66) and RaWE (r=0.61) in the UawO patients. In the analyses of variables of resting breathing and those of the MFVL, only the correlation between resting (VT/TE)tVBmax and FIFj() (r=0.70) was significant. The following correlations between resting breathing pattern variables were found to be significant: VT{n and V1max (r=0.87); VT{n and VEmax (r=-0.74); Vtmax and VEmax (r=-0.69); and, finally, (VT{n)/Yrmax and (VT/TE)rVEmax (r=0.84).
Discussion
The UawO patients of the present study exhibited the characteristic abnormalities in lung function previously reported (tables 1 and 2). Both inspiratory and expiratory Raw were significantly increased. Arterial oxygen tension (PoJ and carbon dioxide tension (PcoJ were within normal limits, except in patient No. 3 in whom Po1 was 9.4 kPa (71 mmHg), less than predicted, and Pco2 was 6.4 kPa (48 mmHg). Judging from the dyspnoea reported by our patients and from their pulmonary function data. we can say that different degrees of obsbUCtion were present in the group although there was a predominance of mild cases.
The use of noseclip, ~outhpiece and a sizeable deadspace may increase VE, VT, Tr and VT/TI, and decrease f, inducing a more regular breathing pattern [12, 13]. However, a direct recording of airflow is necessary when the objective is to analyse the flow-time profile of breathing. On the other hand, inductive plethysmography does not provide sufficiently accurate data on peak flow and is not devoid of some substantial sources of error [14, 15]. Nevertheless, any possible artefacts of breathing due to the system used for recording of flow at the mouth are not likely to explain the differences in breathing pattern observed in the present study. Our UawO patients showed a breathing pattern different from normal in that VT{n and Vtmax were significantly lower while 1'1/Ttot ~as significantly higher. The (VT{n)Nunax and (VT/TE)NEmax ratios were also significantly higher, whereas the end-expiratory pause was practically nil. The low VT{n was related to the increased inspiratory load caused by the increased inspiratory flow resistance (0.66 kPa·I-1·s in our patients), which was only partly compensated for by the increase in neuromuscular inspiratory drive as reflected in a significant increase in P a. t (table 3). The concomitant increase of TI{ftOL compensated for the decrease in VT(n to such an extent that minute ventilation was essentially the same in the UawO patients as in the normal controls. This increase in TtJ Ttot was mainly due to an increase in Tr, which might be attributable to the longer mechanical time constant of the respiratory system resulting from the increased flow resistance [16] . In fact, Tr/ftot was the only variable showing a significant correlation (r=0.66, p<().Ol) with plethysmographic airway resistance. The finding of a similar VT(fE in patients and HC can probably be explained in part by the shorter duration of the patients' end-expiratory pause, i.e. an increased expiratory flow

BREATIIING PATIERN IN UPPER AIRWAY OBSTRUCTION 525
resistance will reduce the rate of lung emptying but VT/ TB will remain unchanged, provided that the duration of expiration is sufficiently long [17]. A reduction in postinspiratory activity of the inspiratory muscles and/or recruitment of expiratory muscle activity may also play a role in maintaining a fixed VT/TE in the face of increased flow resistance [17].
Since Vrmax and VEmax were significan.tly lower in patients, both flow ratios, (VT/Tr)/Vrmax and (VT/TE)NEmax, were found to be higher in UawO (p<0.0005) (table 3) and this finding indicates that the shape of the pneumotachogram will be more "rectangular" (fig. 1). Empirically, we can say that for constant flow (i.e . rectangular shape of the pneumotachogram) the value of these ratios should be 1. For a sinusoidal shape the ratios should be 0.64, and for a triangular pattern, 0.50. The rectangular shape provides more volume of air for similar phase time and peak flow. Therefore, the differences in shape of the flow-time proftle of our patients with respect to the controls IJlay, again, be interpreted as an adaptation to maintain VE.
Thus far, the changes of resting breathing in our patients have been atttibuted directly to the increased inspiratory load. An alternative explanation, however, is suggested by the paucity of correlation between variables of resting breathing and MFVL, which implies that the two flow recordings convey independent information. The flow limitation observed in the MFVL was not evident in resting breathing. For example, on average, VT was 18% of FVC and Vimax reached only 28% of its value in the MFVL. Thus, one can speculate that changes in the resting pattern may represent an adaptive central response to minimize the increased turbulent flow characteristic of UawO.
The fmding of a high 1VI'tot is unusual in respiratory disease. BELLEMARE and GRASSINO (18) pointed out that an increase in 'IVI'tot brings the inspiratory muscles closer to their fatigue threshold. Thus, together with the low VT/Tr, a high Tr/Ttot could be regarded as disadvantageous in the event of concurrent respiratory disease in UawO patients.
Information about changes in the resting breathing pattern due to long-standing increased flow resistance comes almost exclusively from observation of patients with chronic obstructive pulmonary disease (COPD) [19-22]. At rest. sqch patients tend to breathe with a significantly higher VE than healthy people. Patients attain this mainly by increasing f, thus shortening both TI and TE, whilst leaving TI/Ttot unchanged [19, 21]. VT has been found to be either normal or slightly higher [19, 20], whereas VT/TI has consistently been found to be high in <;OPD patients. Thus, it appears that in COPD patients VE, f, TI/Ttot and VT/TI differ entirely from what we have observed in patients with UawO.
ZEc:HMAN et al. [23] studied the breathing pattern of healthy subjects breathing through resistance of increasing magnitude applied to inspiration, expiration or both. With inspiratory resistance there was a reduction of inspiratory flow and f, a notable increase of 1i and 1VI'tot (from about 0.45 to 0.54, as one can estimate from figure 2 in their paper), a more rectangular
inspiration and almost no change in expiration. The resistance applied to the whole respiratory cycle altered both phases in terms of flow magnitude and proftle, induced a marked reduction of f and decreased 1'1/Ttot. With expiratory resistance the subjects increased their inspiratory flows and f and decreased Tr/Ttot. Inspiration tended to be more triangular and expiration more rectangular. While these changes are similar to those exhibited by patients with COPD, most of the characteristics exhibted by our UawO patients seem to fit better into the two previous situations: resistance applied to inspiration or to the whole respiratory cycle.
In summary, we conclude that increased airflow resistance in the extrathoracic airway induces abnormalities in the pattern of resting breathing, and that these abnormalities seem to be different from those of patients with generalized lung disease.
References
1. Miller RD, Hyatt RE. - Obstructing lesions of the larynx and lrachea: clinical and physiologic characteristics. Mayo Cl in Proc, 1969, 44, 145-161. 2. Miller RD, Hyatt RE. - Evaluation of obstructing lesions of the lrachea and larynx by flow-volume loops. Am Rev Respir Dis, 1973, 108, 475-481. 3. Jordanoglou J, Pride NB.- A comparison of maximum inspiratory and expiratory flow in health and in lung disease. Thorax, 1968, 23, 38--45. 4. Empey DW. - Assessment of upper airway obstruction. Br Med J, 1972, 3, 503-505. 5. Rotman HH, Liss HP, Weg JG. - Diagnosis of upper airway obstruction by pulmonary function testing. Chest, 1975, 68, 796-799. 6. EngstrOm H, Grimby G. SOderholm B. - Dynamic spirometry in patients with lracheal stenosis. Acta Med Scand, 1964, 176, 329-334. 7. Owens OR, Murphy DMF. - Spirometric diagnosis of upper airway obstruction. Arch Intern Med, 1983, 143, 1331-1334. 8. Medical Reseach Council's Committee on the Aetiology of Chronic Bronchitis. - Standardized questionnaires on respiratory symptoms. Br Med J, 1960, 2, 1665. 9. Vincken W. - Value of spirometric indices of upper airway obstruction (UAO). Bull Eur PhysiopaJhol Respir, 1987, 23 (Suppl. 12), 382S (abslract). 10. Quanjer PH. - Standardized lung function testing. Report of Working Party , "Standardization of Lung Function Tests". European Conununity for Coal and Steel. Bull Eur Physwpathol Respir. 1983, 19 (Suppl. 5), 11-38. 11. Whitelaw WA, Derenne JP, Milic-Emili J. - Occlusion pressure as a measure of respiratory center output in conscious man. Respir Physiol, 1975, 23, 181-199. 12. Gilbert RJ, Auchincloss JH, Brodsky J, Boden W. -Changes in tidal volume, frequency, and ventilation induced by their measurement. J Appl Physiol, 1972, 33, 252-254. 13. Askanazi J, Silverberg PA, Foster RJ, Hyman AI, Milic-Emili J, Kinney JM. - Effects of respiratory appararus on breathing pattern. J Appl Physiol: Respirat Environ Eurcise Physiol, 1980, 48, 577-580.

526 J. SANCHIS ET AL.
14. Guyatt R, McBride MJ, Meanock Cl. - Evaluation of the respiratory inductive plethysmograph in man. Eur I Respir Dis, 1983, 64, 81-89. 15. Hudgel DW, Capehart M, Jolmson B, Robertson D. -Accuracy of tidal volume, and flow measurements by inductance vest in COPD patients. I Appl Physiol: Respirat Environ Exercise Physiol, 1984, 56, 1659-1665. 16. Miserocchi G, Milic-Emili J. - Effect of mechanical factors on the relation between rate and depth of breathing in cats. I Appl Physiol, 1976, 41, 2n-284. 17. Milic-Emili J, Zin WA.- R elationship between neuromuscular respiratory drive and ventilatory output. In: Handbook of Physiology, Sec. 3, The Respiratory System. Vol. m. part 2, Chp. 35. P.T. Macklem, I. Mead eds, American Physiological Society, Bethesda, 1986, pp. 631-646. 18. Bellemare F, Grassino A. - Effect of pressure and timing of contraction on human diaphragm fatigue. I Appl Physiol: Respirat Environ Exercise Physiol, 1982, 53, 1190-1195. 19. Sorli J, Grassino A, Lorange G, Milic-Emili J. - Control of breathing in patients with chronic obstructive lung disease. Clin Sci Mol Med, 1978, 54, 295-304. 20. Tobin MJ, Chadha TS, Jenouri G, Birch SJ, Gazeroglu HB, Sackner MA. - Breathing patterns. 2. Diseased subjects. Chest, 1983, 84, 28~294. 21. Loveridge B, West P, Anthonisen NR, Kryger MH. - Breathing patterns in patients with chronic obstructive pulmonary disease. Am Rev Respir Dis, 1984, 130, 73~733. 22. Loveridge B, West P, Kryger MH, Anthonisen NR. -Alteration in breathing pattern with progression of chronic obstructive pulmonary disease. Am Rev Respir Dis, 1986, 134, 93~934.
23. Zechman F, Hall FG, Hull WE. - Effects of graded resistance to tracheal airflow in man. I Appl Physiol, 1957, 10, 35~362.
Le type de respiration aw repos chez les patients atteints d'obslwction des voies aeriennes Sllperiewres. J. Sanchis, I L . Dlez-Betoret, P. Casan, J. Milic-Emili. RESUME: Nous avons enregistr~ les courbes d&it/temps pendant la respiration au repos chez 14 patients (age 36±16 ans) avec des symptomes l~gers a moder~s d'obstruction des voies a~riennes sup~rieures (UaWO), et les avons comparks a celles de 28 sujets controle bien portants (HC) afin de caracteriser le type respiratoire de ces patients. Le rapport temps inspiratoire/temps total (TJII'tot) est plus ~lev~ chez les patients (0.42 so 0.04) que che.z les controles sains (0.37 so 0.04) (p<0.001); le rapport volume courant (VT) sur Tl est plus bas chez les patients (0.37 so 0.07 l·s·1) que chez les conlroles (0.43 so 0.09 l·s-1)
(p<0.01). Les debits de pointe inspiratoires et expiratoires au repos s'averent ~galement abaiss~s chez l es patients (p<0.001). Chez ceux-ci, le rapport du debit moyen sur le d~bit de pointe a !'inspiration (0.74 so 0.07) est plus ~leve que chez les sujets normaux (0.66 so 0.04) (p<0.0005). Ceci indique une vague plus rectangulaire d'inspiration chez les patients. Toutes ces modifications pourraient etre dues a une augmentation de la charge inspiratoire. Toutefois, puisque les patients respiraient au repos avec des valeurs de VT et de debit bien inf~rieures ~ leurs valeurs sur la boucle d6bit-volume maximal, les modifications peuvent ~galement etre interpret6es comme etant une adaptation plutOt qu'une cons6quence imposk des limitations mecaruques absolues. Eur Respir J., 1990, 3, 521-S26.