Embed Size (px)
Citation preview
Vol.:(0123456789)1 3
Applied Water Science (2018) 8:94 https://doi.org/10.1007/s13201-018-0734-6
ORIGINAL ARTICLE
The pattern of N/P/Si stoichiometry and ecological nutrient limitation in Ganga River: up‑ and downstream urban influences
Amita Yadav1 · Jitendra Pandey1
Received: 10 November 2016 / Accepted: 22 May 2018 / Published online: 2 June 2018 © The Author(s) 2018
AbstractThe pattern of N/P/Si stoichiometry, although an important driver regulating river ecology, has received limited research attention for Ganga River. We investigated shifts in N/P/Si stoichiometry and ecological nutrient limitation as influenced by Varanasi urban core along a 37-km-long stretch of Ganga River. We also assessed the trophic status of the river in relation to shifting elemental stoichiometry. Together with point sources, atmospheric deposition coupled surface runoff appeared important factors leading to N/P/Si stoichiometric imbalances along the study stretch. The N/P and Si/P ratios declined downstream from 15.5 to 6.5 and 15.7 to 4.4, respectively, whereas N/Si increased from 1.01 to 1.6. Significant negative correlation of N/Si with biogenic silica to chlorophyll a (Chl a) ratios, and biogenic silica to phycocyanin ratios indicated increased growth of non-siliceous algae downstream signifying N and Si limitation with possible implications on food-web dynamics and feedback processes in the river in long run.
Keywords Atmospheric deposition · N/P/Si stoichiometry · Ganga River · Phytoplankton · BSi · Autotrophic index
Introduction
Anthropogenic-driven disproportionate nutrient loads have led to shift the elemental stoichiometry in many aquatic ecosystems of the world (Gilbert 2012). A shift in stoichio-metric ratio of critical nutrients may cause quantitative and qualitative change in composition of phytoplankton com-munity with deviation in pattern of ecological processes including nutrient limitation, biogeochemical cycling, car-bon sequestration, trophic dynamics and biological diver-sity (Paerl 1997; Elser et al. 2009). Owing to optimal tem-perature and light availability in tropical waters, nutrients often become a key factor limiting phytoplankton growth. Elemental stoichiometry is the key node to explain resource competition in phytoplankton (Tilman 1982) and associated shift in trophic cascades (Elser et al. 2009). Shift in N/P ratio toward P, for instance, favors diazotrophic phytoplankton over non-diazotrophs (Havens et al. 2003), while a change
toward Si limitation may shift phytoplankton from siliceous diatom to non-siliceous algal species (Harashim 2007). Thus, decreasing Si/N ratio and Si/P ratio may increase flag-ellated algae including harmful algal blooms with shift in trophic cascade. Composition of phytoplankton assemblage regulates the feeding efficiency of zooplankton grazers, and consequently, a shift from N to P limitation may lead to a major shift in zooplankton community as well (Elser et al. 1998). Also, the composition of heterotrophs would change in response to changes in N/P/Si ratio and associated shift in phytoplankton community.
During recent years, atmospheric deposition has become a dominant source of nutrient input to aquatic and terres-trial ecosystems worldwide (Elser et al. 2009; Ellis et al. 2015; Pandey et al. 2016a). Globally, fossil fuel burning adds ~ 25–33 Tg reactive N (Nr) and fertilizer application adds ~ 118 Tg Nr annually. On the other hand, major source of atmospheric phosphorus is mineral aerosol adding ~ 3–4 Tg P per year (Carnicer et al. 2015). Biomass burning also is an important contributor of atmospheric P (Mahowald et al. 2005; Wang et al. 2015). Surface runoff, along with land use influences, may be enriched by atmospherically added nutri-ents (Pandey et al. 2014a) stimulating blooms in receiving waters (Beman et al. 2005). The Ganga River, together with Brahmaputra and Meghna, is the second largest river system
* Jitendra Pandey [email protected]
1 Ganga River Ecology Research Laboratory, Environmental Science Division, Centre of Advanced Study in Botany, Institute of Science, Banaras Hindu University, Varanasi 221005, India
Applied Water Science (2018) 8:94
1 3
94 Page 2 of 12
of the world with respect to the amount of water discharge. The upper parts of the Ganges basin are mainly influenced with glacier runoff, while middle and lower stretches are prominently influenced with land surface runoff emerging from heterogeneous landscapes including large stretches of agricultural lands and staggered patches of densely populated metropolitan areas. Model studies show that the Ganges basin alone contributes over 71% of India’s total gray water footprint (Mekonnen and Hoekstra 2015). The basin receives ~ 3.32 Tg of Nr and ~ 173.2 Gg of P through atmospheric deposition annually (Pandey et al. 2016a). Atmospheric deposition coupled surface runoff causes dis-proportionate nutrient enrichment leading to nutrient imbal-ances and stoichiometric shift (Elser et al. 2009; Pandey et al. 2014b). Most of the studies so far on these issues have focused mainly on temperate lakes and oceans (Elser et al. 2009; Markaki et al. 2010; Lepori and Keck 2012). Data on changing N/P/Si stoichiometry, causal relationships, shift in nutrient limitation and implication in rivers of India, spe-cially for the Ganga River, are very scarce (Pandey et al. 2014a, b, 2016b; Pandey and Yadav 2015). In this paper, we present data on causal relationship of shifting N/P/Si stoichiometry, with particular reference to the influence of Varanasi urban core, and associated changes in ecological nutrient limitation along a 37-km stretch of Ganga River representing up- and downstream Varanasi city. We hypoth-esized that, together with point sources emerging from the city, increased AD-coupled surface runoff has altered the N/P/Si stoichiometry and consequently the pattern of eco-logical nutrient limitation in the river. To investigate this, we analyzed nutrient limitation pattern, phytoplankton biomass, autotroph–heterotroph proportions in the river over time and space in relation to nutrient input.
Materials and methods
Study area
The Ganga River basin is the 4th largest (1,086,000 km2) trans-boundary river basin in the world and the largest among river basins in India covering ~ 26.2% of total geo-graphical area of the country. Climate of the basin is tropi-cal monsoonal to humid subtropical. The year shows dis-tinct seasonal pattern; a humid monsoonal (July–October) with relative humidity reaching close to saturation; a cold winter (November–February) with minimum temperature sometimes below 4 °C and, hot-dry summer (March–June) where temperature may exceed 46 °C. Southwest monsoon brings most of the rainfall with over 80% during monsoon season. The river is fed by the Himalayan snow from April to June and by rain-driven runoff from July to September with recurrent floods. The average monsoonal discharge is
more than tenfold than the average dry season discharge. The rainfall fluctuates between 780 mm in the upper part through 1040 mm in middle stretch, 1820 mm in the lower delta region reaching 2500 mm in north east. The soil of the basin is highly fertile alluvial fluvisol.
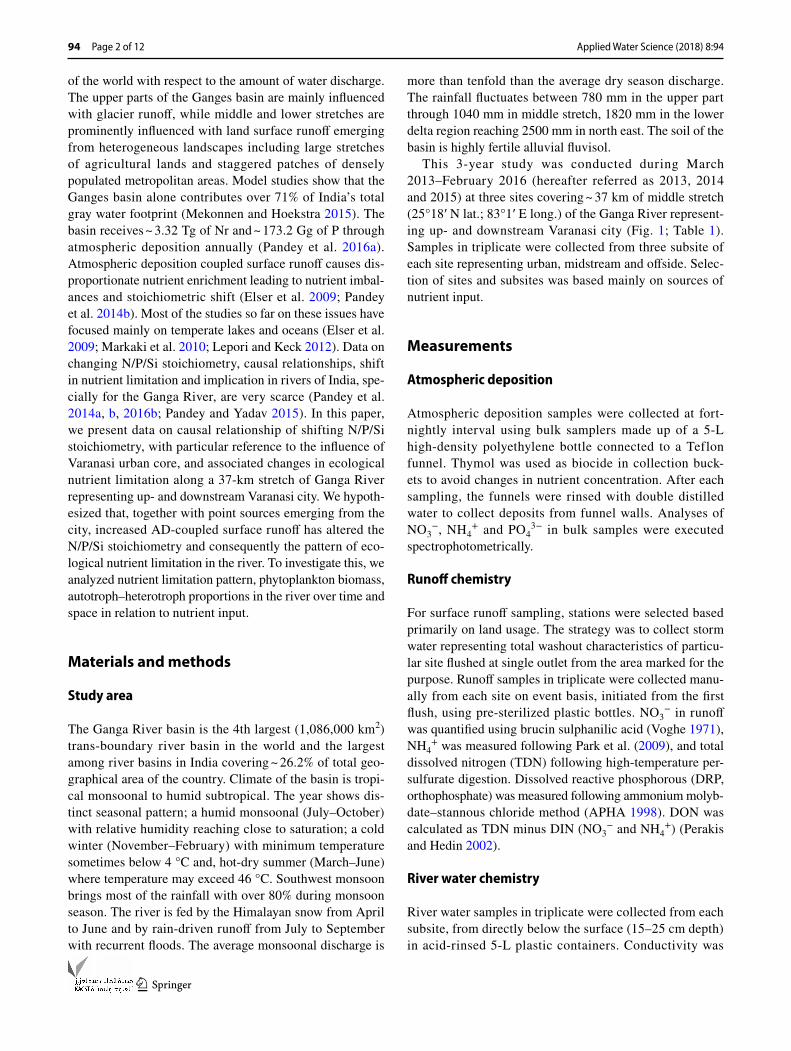
This 3-year study was conducted during March 2013–February 2016 (hereafter referred as 2013, 2014 and 2015) at three sites covering ~ 37 km of middle stretch (25°18′ N lat.; 83°1′ E long.) of the Ganga River represent-ing up- and downstream Varanasi city (Fig. 1; Table 1). Samples in triplicate were collected from three subsite of each site representing urban, midstream and offside. Selec-tion of sites and subsites was based mainly on sources of nutrient input.
Measurements
Atmospheric deposition
Atmospheric deposition samples were collected at fort-nightly interval using bulk samplers made up of a 5-L high-density polyethylene bottle connected to a Teflon funnel. Thymol was used as biocide in collection buck-ets to avoid changes in nutrient concentration. After each sampling, the funnels were rinsed with double distilled water to collect deposits from funnel walls. Analyses of NO3
−, NH4+ and PO4
3− in bulk samples were executed spectrophotometrically.
Runoff chemistry
For surface runoff sampling, stations were selected based primarily on land usage. The strategy was to collect storm water representing total washout characteristics of particu-lar site flushed at single outlet from the area marked for the purpose. Runoff samples in triplicate were collected manu-ally from each site on event basis, initiated from the first flush, using pre-sterilized plastic bottles. NO3
− in runoff was quantified using brucin sulphanilic acid (Voghe 1971), NH4
+ was measured following Park et al. (2009), and total dissolved nitrogen (TDN) following high-temperature per-sulfurate digestion. Dissolved reactive phosphorous (DRP, orthophosphate) was measured following ammonium molyb-date–stannous chloride method (APHA 1998). DON was calculated as TDN minus DIN (NO3
− and NH4+) (Perakis
and Hedin 2002).
River water chemistry
River water samples in triplicate were collected from each subsite, from directly below the surface (15–25 cm depth) in acid-rinsed 5-L plastic containers. Conductivity was
Applied Water Science (2018) 8:94
1 3
Page 3 of 12 94
measured on site using multiparameter tester (Oakton 35425-10, USA). Biological oxygen demand (BOD) and dissolved oxygen (DO) were quantified following standard methods (APHA 1998). Nitrate was estimated using brucin sulphanilic acid method, NH4
+ following phenate method (Park et al. 2009) and dissolved reactive phosphorous (DRP) following ammonium molybdate–stannous chloride method. Dissolved silica (DSi) was quantified following molybdate blue method (Diatloff and Rengel 2001).
Biological variables
Biogenic silica (BSi) was determined in reach-scale sam-ples of sediment (25–30 m reach; 0–10 cm depth). Air-dried samples (< 2 mm) were digested in 0.1% Na2CO3, and BSi was determined following molybdate blue method (Michalo-poulos and Aller 2004). Chlorophyll a (Chl a) was measured following acetone extraction procedure (Maiti 2001) and gross primary productivity (GPP) by light and dark bottle
Fig. 1 Map showing sampling locations
Table 1 Sampling sites and characteristics of sub-catchments
Nos. Name Code Location Characteristics
1 Adalpura Adpr Upstream and downstream Sheetla mata temple Relatively natural, agricultural and rural runoff2 Assi Ghat Asht Downstream panton bridge Residential and urban runoff3 Rajghat Rjht Upstream and downstream Malviya bridge Highly dense urban area, biomass burning
urban emissions urban runoff
Applied Water Science (2018) 8:94
1 3
94 Page 4 of 12
method (APHA 1998). Phytoplankton biomass (ash free dry mass; AFDM) was determined by measuring the weight loss resulting from incineration at 525 °C for 30 min on glass fiber filters. Chlorophyll a and AFDM were used to calculate autotrophic index (AI) (Wetzel and Likens 2000). Phycocya-nin was extracted in 100 mM phosphate buffer and analyzed spectrophotometrically (Boussiba and Richmond 1979).
Statistical analysis
Coefficient of variation (cv) was used as a measure of uncer-tainty. Significant effect of site and time was tested using analysis of variance (ANOVA). Correlation analyses and regression models were employed to test linearity in rela-tionships. Principal component analysis (PCA) was used to ordinate sampling locations and environmental variables. SPSS package (version 16) was used for statistical analysis.
Results
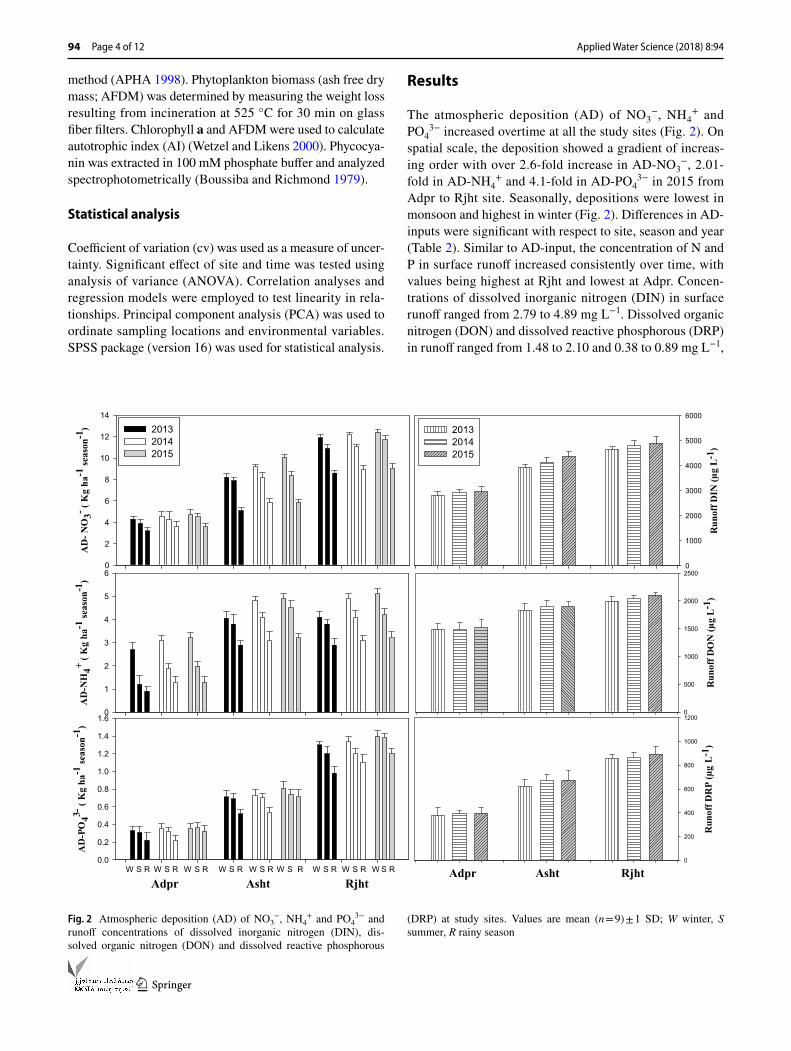
The atmospheric deposition (AD) of NO3−, NH4
+ and PO4
3− increased overtime at all the study sites (Fig. 2). On spatial scale, the deposition showed a gradient of increas-ing order with over 2.6-fold increase in AD-NO3
−, 2.01-fold in AD-NH4
+ and 4.1-fold in AD-PO43− in 2015 from
Adpr to Rjht site. Seasonally, depositions were lowest in monsoon and highest in winter (Fig. 2). Differences in AD-inputs were significant with respect to site, season and year (Table 2). Similar to AD-input, the concentration of N and P in surface runoff increased consistently over time, with values being highest at Rjht and lowest at Adpr. Concen-trations of dissolved inorganic nitrogen (DIN) in surface runoff ranged from 2.79 to 4.89 mg L−1. Dissolved organic nitrogen (DON) and dissolved reactive phosphorous (DRP) in runoff ranged from 1.48 to 2.10 and 0.38 to 0.89 mg L−1,
AD
- NO
3- ( K
g ha
-1 se
ason
-1)
0
2
4
6
8
10
12
14
201320142015
AD
-NH
4+ ( K
g ha
-1 se
ason
-1)
0
1
2
3
4
5
6
AD
-PO
43- (
Kg
ha-1
seas
on-1
)
0.0
0.2
0.4
0.6
0.8
1.0
1.2
1.4
1.6
W S R W S R W S R RSWRSWRS W S R S R S RWWW
Run
off D
IN (µ
g L
-1)
0
1000
2000
3000
4000
5000
6000
201320142015
Run
off D
RP
(µg
L-1 )
0
200
400
600
800
1000
1200R
unof
f DO
N (µ
g L-1
)0
500
1000
1500
2000
2500
Adpr Asht RjhtAdpr Asht Rjht
Fig. 2 Atmospheric deposition (AD) of NO3−, NH4
+ and PO43− and
runoff concentrations of dissolved inorganic nitrogen (DIN), dis-solved organic nitrogen (DON) and dissolved reactive phosphorous
(DRP) at study sites. Values are mean (n = 9) ± 1 SD; W winter, S summer, R rainy season
Applied Water Science (2018) 8:94
1 3
Page 5 of 12 94
respectively. Differences in runoff variables were significant (Table 2).
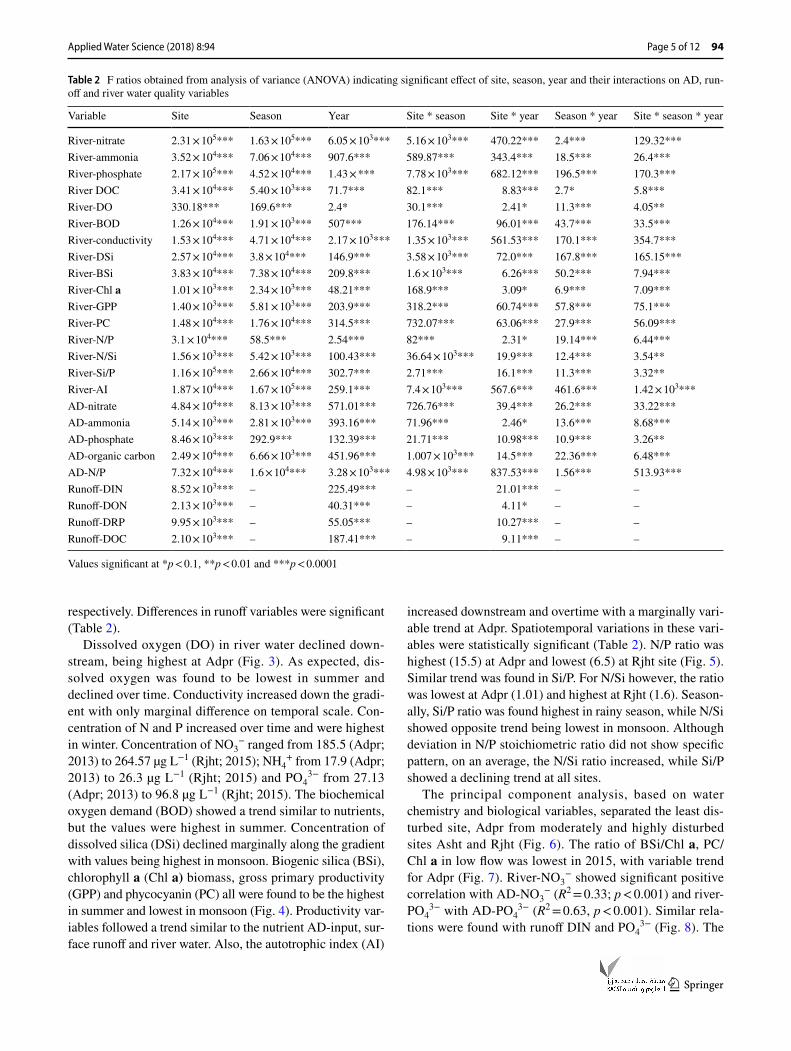
Dissolved oxygen (DO) in river water declined down-stream, being highest at Adpr (Fig. 3). As expected, dis-solved oxygen was found to be lowest in summer and declined over time. Conductivity increased down the gradi-ent with only marginal difference on temporal scale. Con-centration of N and P increased over time and were highest in winter. Concentration of NO3
− ranged from 185.5 (Adpr; 2013) to 264.57 µg L−1 (Rjht; 2015); NH4
+ from 17.9 (Adpr; 2013) to 26.3 µg L−1 (Rjht; 2015) and PO4
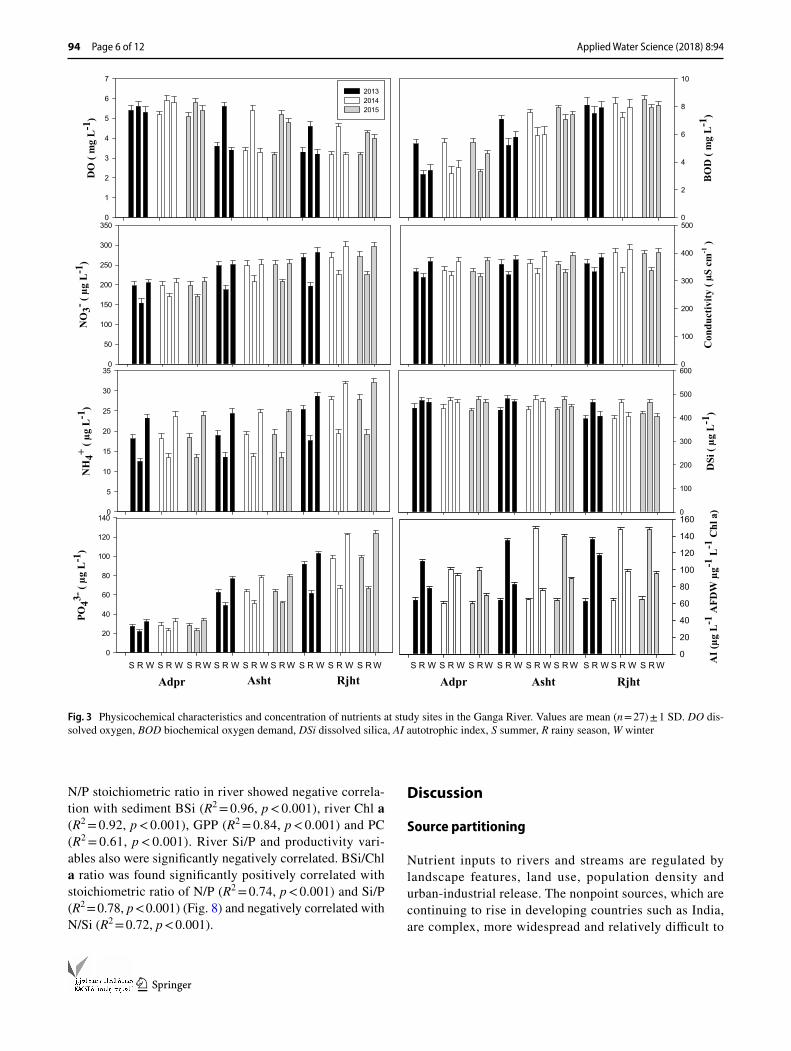
3− from 27.13 (Adpr; 2013) to 96.8 µg L−1 (Rjht; 2015). The biochemical oxygen demand (BOD) showed a trend similar to nutrients, but the values were highest in summer. Concentration of dissolved silica (DSi) declined marginally along the gradient with values being highest in monsoon. Biogenic silica (BSi), chlorophyll a (Chl a) biomass, gross primary productivity (GPP) and phycocyanin (PC) all were found to be the highest in summer and lowest in monsoon (Fig. 4). Productivity var-iables followed a trend similar to the nutrient AD-input, sur-face runoff and river water. Also, the autotrophic index (AI)
increased downstream and overtime with a marginally vari-able trend at Adpr. Spatiotemporal variations in these vari-ables were statistically significant (Table 2). N/P ratio was highest (15.5) at Adpr and lowest (6.5) at Rjht site (Fig. 5). Similar trend was found in Si/P. For N/Si however, the ratio was lowest at Adpr (1.01) and highest at Rjht (1.6). Season-ally, Si/P ratio was found highest in rainy season, while N/Si showed opposite trend being lowest in monsoon. Although deviation in N/P stoichiometric ratio did not show specific pattern, on an average, the N/Si ratio increased, while Si/P showed a declining trend at all sites.
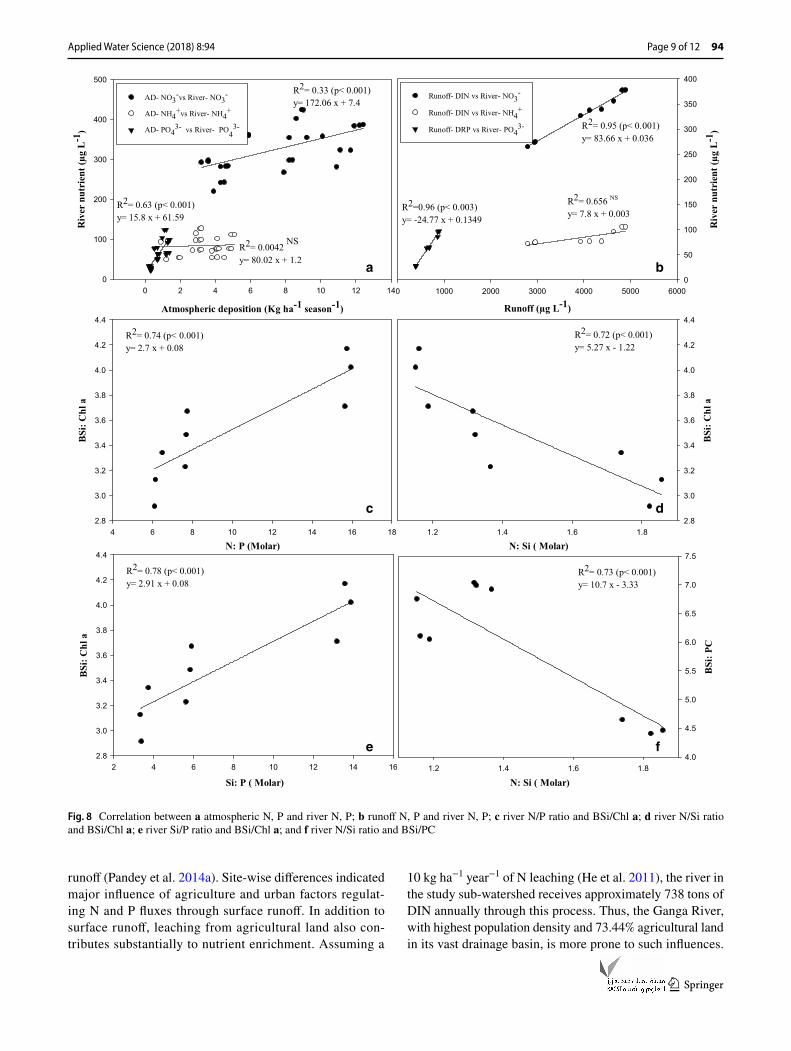
The principal component analysis, based on water chemistry and biological variables, separated the least dis-turbed site, Adpr from moderately and highly disturbed sites Asht and Rjht (Fig. 6). The ratio of BSi/Chl a, PC/Chl a in low flow was lowest in 2015, with variable trend for Adpr (Fig. 7). River-NO3
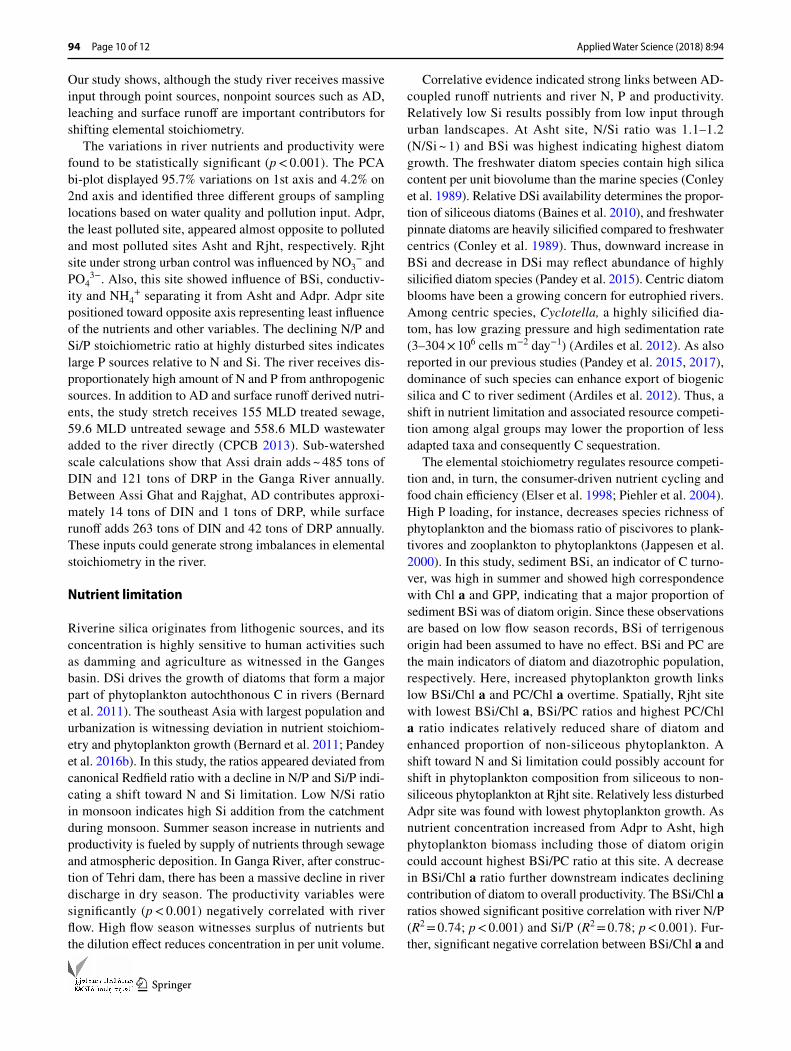
− showed significant positive correlation with AD-NO3
− (R2 = 0.33; p < 0.001) and river-PO4
3− with AD-PO43− (R2 = 0.63, p < 0.001). Similar rela-
tions were found with runoff DIN and PO43− (Fig. 8). The
Table 2 F ratios obtained from analysis of variance (ANOVA) indicating significant effect of site, season, year and their interactions on AD, run-off and river water quality variables
Values significant at *p < 0.1, **p < 0.01 and ***p < 0.0001
Variable Site Season Year Site * season Site * year Season * year Site * season * year
River-nitrate 2.31 × 10⁵*** 1.63 × 10⁵*** 6.05 × 10³*** 5.16 × 10³*** 470.22*** 2.4*** 129.32***River-ammonia 3.52 × 10⁴*** 7.06 × 10⁴*** 907.6*** 589.87*** 343.4*** 18.5*** 26.4***River-phosphate 2.17 × 10⁵*** 4.52 × 10⁴*** 1.43 × *** 7.78 × 10³*** 682.12*** 196.5*** 170.3***River DOC 3.41 × 10⁴*** 5.40 × 10³*** 71.7*** 82.1*** 8.83*** 2.7* 5.8***River-DO 330.18*** 169.6*** 2.4* 30.1*** 2.41* 11.3*** 4.05**River-BOD 1.26 × 10⁴*** 1.91 × 10³*** 507*** 176.14*** 96.01*** 43.7*** 33.5***River-conductivity 1.53 × 10⁴*** 4.71 × 10⁴*** 2.17 × 10³*** 1.35 × 10³*** 561.53*** 170.1*** 354.7***River-DSi 2.57 × 10⁴*** 3.8 × 10⁴*** 146.9*** 3.58 × 10³*** 72.0*** 167.8*** 165.15***River-BSi 3.83 × 10⁴*** 7.38 × 10⁴*** 209.8*** 1.6 × 10³*** 6.26*** 50.2*** 7.94***River-Chl a 1.01 × 10³*** 2.34 × 10³*** 48.21*** 168.9*** 3.09* 6.9*** 7.09***River-GPP 1.40 × 10³*** 5.81 × 10³*** 203.9*** 318.2*** 60.74*** 57.8*** 75.1***River-PC 1.48 × 10⁴*** 1.76 × 10⁴*** 314.5*** 732.07*** 63.06*** 27.9*** 56.09***River-N/P 3.1 × 10⁴*** 58.5*** 2.54*** 82*** 2.31* 19.14*** 6.44***River-N/Si 1.56 × 10³*** 5.42 × 10³*** 100.43*** 36.64 × 10³*** 19.9*** 12.4*** 3.54**River-Si/P 1.16 × 10⁵*** 2.66 × 10⁴*** 302.7*** 2.71*** 16.1*** 11.3*** 3.32**River-AI 1.87 × 10⁴*** 1.67 × 10⁵*** 259.1*** 7.4 × 10³*** 567.6*** 461.6*** 1.42 × 10³***AD-nitrate 4.84 × 10⁴*** 8.13 × 10³*** 571.01*** 726.76*** 39.4*** 26.2*** 33.22***AD-ammonia 5.14 × 10³*** 2.81 × 10³*** 393.16*** 71.96*** 2.46* 13.6*** 8.68***AD-phosphate 8.46 × 10³*** 292.9*** 132.39*** 21.71*** 10.98*** 10.9*** 3.26**AD-organic carbon 2.49 × 10⁴*** 6.66 × 10³*** 451.96*** 1.007 × 10³*** 14.5*** 22.36*** 6.48***AD-N/P 7.32 × 10⁴*** 1.6 × 10⁴*** 3.28 × 10³*** 4.98 × 10³*** 837.53*** 1.56*** 513.93***Runoff-DIN 8.52 × 10³*** – 225.49*** – 21.01*** – –Runoff-DON 2.13 × 10³*** – 40.31*** – 4.11* – –Runoff-DRP 9.95 × 10³*** – 55.05*** – 10.27*** – –Runoff-DOC 2.10 × 10³*** – 187.41*** – 9.11*** – –
Applied Water Science (2018) 8:94
1 3
94 Page 6 of 12
N/P stoichiometric ratio in river showed negative correla-tion with sediment BSi (R2 = 0.96, p < 0.001), river Chl a (R2 = 0.92, p < 0.001), GPP (R2 = 0.84, p < 0.001) and PC (R2 = 0.61, p < 0.001). River Si/P and productivity vari-ables also were significantly negatively correlated. BSi/Chl a ratio was found significantly positively correlated with stoichiometric ratio of N/P (R2 = 0.74, p < 0.001) and Si/P (R2 = 0.78, p < 0.001) (Fig. 8) and negatively correlated with N/Si (R2 = 0.72, p < 0.001).
Discussion
Source partitioning
Nutrient inputs to rivers and streams are regulated by landscape features, land use, population density and urban-industrial release. The nonpoint sources, which are continuing to rise in developing countries such as India, are complex, more widespread and relatively difficult to
Con
duct
ivity
( µS
cm
-1 )
0
100
200
300
400
500
DO
( m
g L-1
)
0
1
2
3
4
5
6
7
201320142015
BO
D (
mg
L-1
)
0
2
4
6
8
10N
O3- ( µ
g L-1
)
0
50
100
150
200
250
300
350
NH
4+ ( µg
L-1
)
0
5
10
15
20
25
30
35
PO43-
( µg
L-1
)
0
20
40
60
80
100
120
140
DSi
( µg
L-1
)
0
100
200
300
400
500
600
Adpr Asht Rjht Adpr Asht RjhtS R W S R W S R W S R W S R W S R W S R W S R W S R W S R W S R W S R WS R S R S R S R S R S RWWWWW W A
I (µg
L-1
AFD
W µ
g-1 L
-1 C
hl a
)
0
20
40
60
80
100
120
140
160
Fig. 3 Physicochemical characteristics and concentration of nutrients at study sites in the Ganga River. Values are mean (n = 27) ± 1 SD. DO dis-solved oxygen, BOD biochemical oxygen demand, DSi dissolved silica, AI autotrophic index, S summer, R rainy season, W winter
Applied Water Science (2018) 8:94
1 3
Page 7 of 12 94
control. Atmospheric deposition (AD), for instance, adds nutrients to river ecosystems directly on water surface and via lateral transport through surface runoff. In this study, AD-nutrients increased with increasing urban-industrial influence downstream. Additionally, agriculture is another major factor for AD-Nr. Ganges basin consumes over 45% of the total chemical fertilizers used in the country out of which Uttar Pradesh alone consumes 38% of chemical
fertilizers (NGRBA 2011). The region witnessed a tre-mendous growth in chemical fertilizer use from 4 kg ha−1 in 1962–1965 to 205 kg ha−1 in 2003–2006 (GRB-EMP 2011). Long-range transport from distant sources may also be an important source of NOx (Ellis et al. 2015). Site I (Adalpura; population 2837, situated upstream) represents rural to township type settlement with natural land patches and agricultural land. Other two sites are under direct urban influence of Varanasi, a city with over 1,500,000 population ranks 33 among 225 metropolitan cities of the country. The city with high vehicular load per unit area (about 274,331 in 2000 to over 588,000 in 2012) witnesses inefficient public transport with about 85.05% vehicles running < 18 km h−1 in peak traffic hours (Motor Trans-port Statistics of India 1999–2000). Streams in watersheds with higher road density have been shown to have high levels of N and P (Moore et al. 2014). Seasonally, highest
Chl
a (µ
g L-1
)
0
10
20
30
40
50 2013 2014 2015
GPP
(mgC
m-2
h-1
)
0
2
4
6
8
10
PC (µ
g L-1
)
0
5
10
15
20
25
30
Adpr Asht RjhtWRSWRSWRSWRS RSRS S R W S RS R W WWW
BSi
(µg
L-1)
0
20
40
60
80
100
120
140
Fig. 4 Trends in productivity variables at study sites. Values are mean (n = 27, for BSi n = 9) ± SD. Chl a chlorophyll a, PC phycocyanin, GPP gross primary productivity, BSi biogenic silica, S summer, R rainy season, W winter
N: P
( M
olar
)
4
6
8
10
12
14
16
18
Adpr Asht Rjht
N: S
i ( M
olar
)
0.6
0.8
1.0
1.2
1.4
1.6
1.8
2.0
2.2
Si: P
( M
olar
)
2
4
6
8
10
12
14
16
18
20
22
S R W S R W S R
2013 2014 2015W
Fig. 5 Spatiotemporal variations in N/P/Si stoichiometry at study sites in the Ganga River; S summer, R rainy season, W winter
Applied Water Science (2018) 8:94
1 3
94 Page 8 of 12
deposition in winter could be linked to low temperature, low wind, short range transport, low mixing height and concurrent formation of inversion especially in urban areas (Pandey et al. 2014a).
Atmospheric deposition, although vary according to source density and distribution in the watershed, is the most important source of nutrient in some areas (Howarth et al. 2002; Pandey et al. 2016a). In agriculturally domi-nated Western Europe, NH4
+ constitutes the major share, whereas in USA, with prevalence of emission from fossils fuel combustion, NOx constitutes the dominant component of AD-N (Paerl et al. 2002). AD contributes 13–19% of annual excess N input to North Atlantic Subtropical gyre (Zamara et al. 2010). The eastern US coast and eastern Gulf of Mexico receive 10–40% of new N as AD-input with influ-ence on biotic composition in receiving estuaries and coastal waters. Of the 40% of total N added as direct deposition in many coastal areas, ~ 30% comes from fossils fuel combus-tion and 10% from ammonia volatilization from agricultural sources. In this study, agriculture appeared the major fac-tor for remote areas, whereas biomass burning and auto-mobile emission seemed to be the principal determinant of AD-input in urban and near-urban areas. Downstream sites receiving emission from burning of ~ 25,000 tons wood bio-mass for crimination of over 36,000 dead bodies each year show high AD-P. Biomass burning is an important source of atmospheric P (Mahowald et al. 2005). A shift in AD-N/P stoichiometry toward P observed in this study indicates more intense sources of atmospheric P relative to N. This has rele-vance for river N/P as well (Pandey et al. 2014b). Boyer et al. (2002) estimated average oxidized-N deposition, including
both dry and wet deposition, about 6.80 kg N ha−2 year−1 in major rivers of northeastern USA, and it has been estab-lished that AD-N exceeding 6 kg ha−1 year−1 could signifi-cantly enhance chlorophyll in surface waters (Elser et al. 2009). Previous studies have shown that AD-N and P could account about 19.3–31.2 and 2.5–13.4%, respectively, of GPP in Ganga River (Pandey et al. 2014a).
Surface runoff adds large amount of nutrients to receiv-ing waters including rivers. Our data showed that dissolved inorganic-N (NO3
− + NH4+) contributed the major share in
runoff N and, both DIN and DRP were high at anthropo-genically disturbed sites. Nutrient concentration in surface runoff indicated the coupled effect of AD and land use. Earlier studies have shown that AD enhances soil nutri-ent release and consequently their concentration in surface
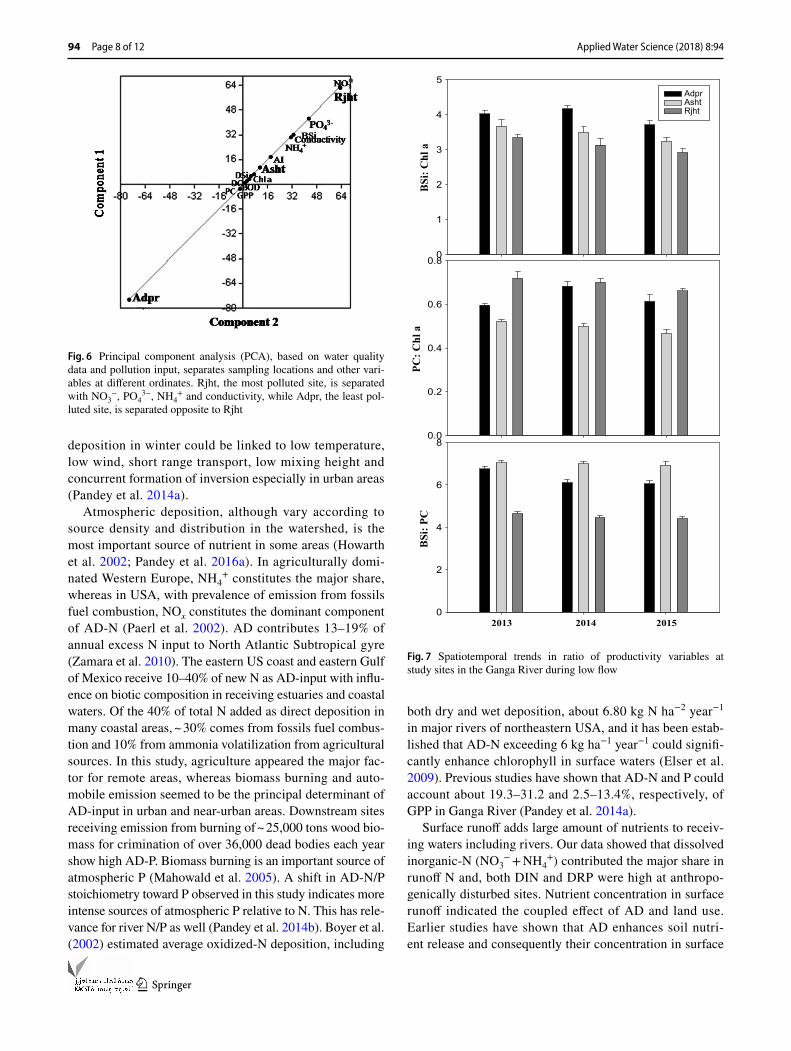
Fig. 6 Principal component analysis (PCA), based on water quality data and pollution input, separates sampling locations and other vari-ables at different ordinates. Rjht, the most polluted site, is separated with NO3
−, PO43−, NH4
+ and conductivity, while Adpr, the least pol-luted site, is separated opposite to Rjht
Col 8 Col 9 Col 10
BSi
: PC
0
2
4
6
8
2013 2014 2015
BSi
: Chl
a
0
1
2
3
4
5Adpr Asht Rjht
PC: C
hl a
0.0
0.2
0.4
0.6
0.8
Fig. 7 Spatiotemporal trends in ratio of productivity variables at study sites in the Ganga River during low flow
Applied Water Science (2018) 8:94
1 3
Page 9 of 12 94
runoff (Pandey et al. 2014a). Site-wise differences indicated major influence of agriculture and urban factors regulat-ing N and P fluxes through surface runoff. In addition to surface runoff, leaching from agricultural land also con-tributes substantially to nutrient enrichment. Assuming a
10 kg ha−1 year−1 of N leaching (He et al. 2011), the river in the study sub-watershed receives approximately 738 tons of DIN annually through this process. Thus, the Ganga River, with highest population density and 73.44% agricultural land in its vast drainage basin, is more prone to such influences.
N: P (Molar)4 6 8 10 12 14 16 18
BSi
: Chl
a
2.8
3.0
3.2
3.4
3.6
3.8
4.0
4.2
4.4
Si: P ( Molar)2 4 6 8 10 12 14 16
BSi
: Chl
a
2.8
3.0
3.2
3.4
3.6
3.8
4.0
4.2
4.4
N: Si ( Molar)1.2 1.4 1.6 1.8
BSi
: PC
4.0
4.5
5.0
5.5
6.0
6.5
7.0
7.5N: Si ( Molar)
1.2 1.4 1.6 1.8
BSi
: Chl
a
2.8
3.0
3.2
3.4
3.6
3.8
4.0
4.2
4.4Atmospheric deposition (Kg ha-1 season-1)
0 2 4 6 8 10 12 14
Riv
er n
utri
ent (
µg L
-1)
0
100
200
300
400
500
AD- NO3-vs River- NO3
-
AD- NH4+vs River- NH4
+
AD- PO43- vs River- PO4
3-
R2= 0.33 (p< 0.001)y= 172.06 x + 7.4
R2= 0.0042 NS
y= 80.02 x + 1.2
R2= 0.63 (p< 0.001)y= 15.8 x + 61.59
Runoff (µg L-1)
0 1000 2000 3000 4000 5000 6000
Riv
er n
utri
ent (
µg L
-1)
0
50
100
150
200
250
300
350
400
Runoff- DIN vs River- NO3-
Runoff- DIN vs River- NH4+
Runoff- DRP vs River- PO43- R2= 0.95 (p< 0.001)
y= 83.66 x + 0.036
R2= 0.656 NS
y= 7.8 x + 0.003R2=0.96 (p< 0.003)y= -24.77 x + 0.1349
R2= 0.74 (p< 0.001)y= 2.7 x + 0.08
R2= 0.72 (p< 0.001)y= 5.27 x - 1.22
R2= 0.78 (p< 0.001)y= 2.91 x + 0.08
R2= 0.73 (p< 0.001)y= 10.7 x - 3.33
a b
c d
e f
Fig. 8 Correlation between a atmospheric N, P and river N, P; b runoff N, P and river N, P; c river N/P ratio and BSi/Chl a; d river N/Si ratio and BSi/Chl a; e river Si/P ratio and BSi/Chl a; and f river N/Si ratio and BSi/PC
Applied Water Science (2018) 8:94
1 3
94 Page 10 of 12
Our study shows, although the study river receives massive input through point sources, nonpoint sources such as AD, leaching and surface runoff are important contributors for shifting elemental stoichiometry.
The variations in river nutrients and productivity were found to be statistically significant (p < 0.001). The PCA bi-plot displayed 95.7% variations on 1st axis and 4.2% on 2nd axis and identified three different groups of sampling locations based on water quality and pollution input. Adpr, the least polluted site, appeared almost opposite to polluted and most polluted sites Asht and Rjht, respectively. Rjht site under strong urban control was influenced by NO3
− and PO4
3−. Also, this site showed influence of BSi, conductiv-ity and NH4
+ separating it from Asht and Adpr. Adpr site positioned toward opposite axis representing least influence of the nutrients and other variables. The declining N/P and Si/P stoichiometric ratio at highly disturbed sites indicates large P sources relative to N and Si. The river receives dis-proportionately high amount of N and P from anthropogenic sources. In addition to AD and surface runoff derived nutri-ents, the study stretch receives 155 MLD treated sewage, 59.6 MLD untreated sewage and 558.6 MLD wastewater added to the river directly (CPCB 2013). Sub-watershed scale calculations show that Assi drain adds ~ 485 tons of DIN and 121 tons of DRP in the Ganga River annually. Between Assi Ghat and Rajghat, AD contributes approxi-mately 14 tons of DIN and 1 tons of DRP, while surface runoff adds 263 tons of DIN and 42 tons of DRP annually. These inputs could generate strong imbalances in elemental stoichiometry in the river.
Nutrient limitation
Riverine silica originates from lithogenic sources, and its concentration is highly sensitive to human activities such as damming and agriculture as witnessed in the Ganges basin. DSi drives the growth of diatoms that form a major part of phytoplankton autochthonous C in rivers (Bernard et al. 2011). The southeast Asia with largest population and urbanization is witnessing deviation in nutrient stoichiom-etry and phytoplankton growth (Bernard et al. 2011; Pandey et al. 2016b). In this study, the ratios appeared deviated from canonical Redfield ratio with a decline in N/P and Si/P indi-cating a shift toward N and Si limitation. Low N/Si ratio in monsoon indicates high Si addition from the catchment during monsoon. Summer season increase in nutrients and productivity is fueled by supply of nutrients through sewage and atmospheric deposition. In Ganga River, after construc-tion of Tehri dam, there has been a massive decline in river discharge in dry season. The productivity variables were significantly (p < 0.001) negatively correlated with river flow. High flow season witnesses surplus of nutrients but the dilution effect reduces concentration in per unit volume.
Correlative evidence indicated strong links between AD-coupled runoff nutrients and river N, P and productivity. Relatively low Si results possibly from low input through urban landscapes. At Asht site, N/Si ratio was 1.1–1.2 (N/Si ~ 1) and BSi was highest indicating highest diatom growth. The freshwater diatom species contain high silica content per unit biovolume than the marine species (Conley et al. 1989). Relative DSi availability determines the propor-tion of siliceous diatoms (Baines et al. 2010), and freshwater pinnate diatoms are heavily silicified compared to freshwater centrics (Conley et al. 1989). Thus, downward increase in BSi and decrease in DSi may reflect abundance of highly silicified diatom species (Pandey et al. 2015). Centric diatom blooms have been a growing concern for eutrophied rivers. Among centric species, Cyclotella, a highly silicified dia-tom, has low grazing pressure and high sedimentation rate (3–304 × 106 cells m−2 day−1) (Ardiles et al. 2012). As also reported in our previous studies (Pandey et al. 2015, 2017), dominance of such species can enhance export of biogenic silica and C to river sediment (Ardiles et al. 2012). Thus, a shift in nutrient limitation and associated resource competi-tion among algal groups may lower the proportion of less adapted taxa and consequently C sequestration.
The elemental stoichiometry regulates resource competi-tion and, in turn, the consumer-driven nutrient cycling and food chain efficiency (Elser et al. 1998; Piehler et al. 2004). High P loading, for instance, decreases species richness of phytoplankton and the biomass ratio of piscivores to plank-tivores and zooplankton to phytoplanktons (Jappesen et al. 2000). In this study, sediment BSi, an indicator of C turno-ver, was high in summer and showed high correspondence with Chl a and GPP, indicating that a major proportion of sediment BSi was of diatom origin. Since these observations are based on low flow season records, BSi of terrigenous origin had been assumed to have no effect. BSi and PC are the main indicators of diatom and diazotrophic population, respectively. Here, increased phytoplankton growth links low BSi/Chl a and PC/Chl a overtime. Spatially, Rjht site with lowest BSi/Chl a, BSi/PC ratios and highest PC/Chl a ratio indicates relatively reduced share of diatom and enhanced proportion of non-siliceous phytoplankton. A shift toward N and Si limitation could possibly account for shift in phytoplankton composition from siliceous to non-siliceous phytoplankton at Rjht site. Relatively less disturbed Adpr site was found with lowest phytoplankton growth. As nutrient concentration increased from Adpr to Asht, high phytoplankton biomass including those of diatom origin could account highest BSi/PC ratio at this site. A decrease in BSi/Chl a ratio further downstream indicates declining contribution of diatom to overall productivity. The BSi/Chl a ratios showed significant positive correlation with river N/P (R2 = 0.74; p < 0.001) and Si/P (R2 = 0.78; p < 0.001). Fur-ther, significant negative correlation between BSi/Chl a and
Applied Water Science (2018) 8:94
1 3
Page 11 of 12 94
N/Si ratio (R2 = 0.72, p < 0.001) and BSi/PC and N/Si ratio (R2 = 0.73; p < 0.001) indicated production of phytoplankton biomass with increasing non-siliceous species downstream signifying N and Si limitation. It seems that rising N, P and declining Si level would lead less silicified diatom and non-siliceous phytoplankton to prevail in near future. Low N/P and Si/P ratios in relation to BSi/Chl a ratio depict high P input to be a major factor for phytoplankton growth down the river. Autotrophic index, a ratio of AFDW/Chl a, is used as an indicator of heterotrophic and autotrophic population in streams. In this study, autotrophic index increased down-stream, being highest at Rjht indicating high relative propor-tion of heterotrophic community influenced by high organic load driven by autotrophic and allochthonous-C input. Auto-trophic index (AI) ~ 250 for periphyton is considered an indi-cator of nutrient-enriched eutrophied condition. The AI in marine phytoplanktons and pond ranges from 76–200 and 44–221, respectively (Weber 1973). In this study, average autotrophic index ranging from 81.3 to 103.5 indicates an oligotrophic condition of the river.
Conclusions
Nutrient-enriched conditions, increased autotrophic produc-tion and associated growth of heterotrophy in the river indi-cate a likely shift toward eutrophy. Based on the autotrophic index (AI), the river appears to be in oligotrophic condi-tion. Together with point sources, especially urban sewage, increased AD-coupled surface runoff has altered the N/P/Si stoichiometry of the river with a shift toward N and Si limi-tation over P limitation, which in turn, could promote growth of less silicified diatom and non-siliceous algae. Further, a shift in N/P/Si stoichiometry toward Si limitation would trig-ger shifting diatom associated C sequestration and trophic cascades with long-term implications on food-web dynamics and ecological feedbacks. Our study highlights the need for large-scale inter regional time series data on human-driven shift in elemental stoichiometry for predicting long-term changes in ecosystem attributes and associated feedbacks in river ecosystems.
Acknowledgements The authors are thankful to the Coordinator, Cen-tre of Advanced Study in Botany, Banaras Hindu University for facili-ties and to Banaras Hindu University (Grand No. 46233) for funding support in the form of fellowship to AY.
Open Access This article is distributed under the terms of the Crea-tive Commons Attribution 4.0 International License (http://creat iveco mmons .org/licen ses/by/4.0/), which permits unrestricted use, distribu-tion, and reproduction in any medium, provided you give appropriate credit to the original author(s) and the source, provide a link to the Creative Commons license, and indicate if changes were made.
References
American Public Health Association (APHA) (1998) Standard methods for the examination of water and wastewater. APHA, Washington, DC
Ardiles V, Alcocer J, Vilaclara G, Oseguera LA, Velasco L (2012) Diatom fluxes in a tropical, oligotrophic lake dominated by large-sized phytoplankton. Hydrobiologia 679:77–90
Baines SB, Twining BS, Brzezinski MA, Nelson DM, Fisher NS (2010) Cause and biogeochemical implications of regional differences in silicification of marine diatoms. Glob Biogeochem Cycl 24:1–15
Beman JM, Arrigo KR, Matson PA (2005) Agricultural runoff fuels large phytoplankton blooms in vulnerable areas of the ocean. Nature 434:211–214
Bernard CY, Durr HH, Heinze C, Segschneider J, Maier-Reimer E (2011) Contribution of riverine nutrients to the silicon biogeo-chemistry of the global ocean—a model study. Biogeosciences 8:551–564
Boussiba S, Richmond AE (1979) Isolation and characterization of phycocyanin from the blue green algal Spirulina platensis. Arch Microbiol 120:155–159
Boyer TP, Stephens C, Antonov JI, Conkright ME, Locarnini RA, O’Brian TD, Garcia HE (2002) World Ocean Atlas 2001. Salin-ity 2:165
Carnicer J, Sardans J, Stefanescub C, Ubach A, Bartrons M, Asensio D, Nuelas JP (2015) Global biodiversity, stoichiometry and eco-system function responses to human-induced C–N–P imbalances? J Plant Physiol 172:82–91
Central Pollution Control Board (2013) Pollution assessment: River Ganga. Ministry of Environment and Forests, Govt. of India, Pari-vesh Bhawan, East Arjun Nagar, 110032,Delhi
Conley DJ, Kilham SS, Theriot E (1989) Differences in silica con-tent between marine and freshwater diatoms. Limnol Oceanogr 34:205–213
Diatloff E, Rengel Z (2001) Compilation of simple spectrophotometric techniques for the determination of elements in nutrient solutions. J Plant Nutr 24:75–86
Ellis BK, Craft JA, Flathead JAS (2015) Long-term atmospheric depo-sition of nitrogen, phosphorus and sulfate in a large oligotrophic lake. Peer J 3:1–20
Elser JJ, Chrzanowski TH, Sterner RW, Mills KH (1998) Stoichiomet-ric constraints on food-web dynamics: a whole-lake experiment on the Canadian Shield. Ecosystems 1:120–136
Elser JJ, Andersen T, Baron JS, Bergstrom AK, Jansson M, Kyle M, Nydick KR, Steger L, Hessen DO (2009) Lake stoichiometry and nutrient limitation driven by atmospheric nitrogen deposition. Sci-ence 326:835–837
Ganga river basin: Environment management plan by Indian Institute of Technology (2011) Trends in agriculture and agricultural prac-tices in Ganga basin. An overview. Report code 015 GBP IIT SEC ANL 01 VER 1
Gilbert PM (2012) Ecological stoichiometry and its implications for aquatic ecosystem sustainability. Curr Opin Environ Sustain 4:272–277
Harashim A (2007) Evaluating the effects of change in input ratio of N: P: Si to coastal marine ecosystem. J Environ Sci Sustain Soc 1:33–38
Havens KE, James RT, East TL, Smith VH (2003) N: P ratios, light limitation, and cyanobacterial dominance in a subtropical lake impacted by non-point source nutrient pollution. Environ Pollut 122:379–390
He B, Kanae S, Oki T, Hirabayashi Y, Yamashiki K (2011) Assess-ment of global nitrogen pollution in rivers using an integrated biochemical modeling framework. Water Res 45:2573–2586
Applied Water Science (2018) 8:94
1 3
94 Page 12 of 12
Howarth RW, Sharpley A, Walker D (2002) Sources of nutrient pollu-tion to coastal waters in the United States: implications for achiev-ing coastal water quality goals. Estuaries 25:656–676
Jappesen E, Jensen JP, Sondergaard M, Lauridsen T, Landkildehus F (2000) Trophic structure, species richness and biodiversity in Danish lakes: changes along a phosphorous gradient. Freshw Biol 45:201–218
Lepori F, Keck F (2012) Effects of atmospheric nitrogen deposition on remote freshwater ecosystems. Ambio 41:235–246
Mahowald MN, Artaxo P, Baker AR, Jickells TD, Okin GS, Randerson JT, Townsend AR (2005) Impacts of biomass burning emissions and land use change on Amazonian atmospheric phosphorus cycling and deposition. Globl Biogeochem Cycl 19:GB4030. https ://doi.org/10.1029/2005g b0025 41
Maiti SK (2001) Handbook of methods in environmental studies. In: Water and wastewater, vol 1, ABD, Jaipur
Markaki Z, Loÿe-Pilot MD, Violaki K, Benyahya L, Mihalopoulos N (2010) Variability of atmospheric deposition of dissolved nitro-gen and phosphorus in the mediterranean and possible link to the anomalous seawater N/P ratio. Mar Chem 120:187–194
Mekonnen MM, Hoekstra AY (2015) Global gray water footprint and water pollution levels related to anthropogenic nitrogen loads to fresh water. Environ Sci Tech 49:12860–12868
Michalopoulos P, Aller RC (2004) Early diagenesis of biogenic silica in the Amazon delta: alteration, authigenic clay formation, and storage. Geochim Cosmochim Acta 68:1061–1085
Moore JW, Lambert TD, Heady WN, Susanna E, Honig SE et al (2014) Anthropogenic land-use signals propagate through stream food webs in a California, USA, watershed. Limnologica 46:124–130
Motor Transport Statistics of India (1999–2000) Transport Research Wing, Ministry of Road Transport and Highways, Govt. of India, New Delhi
National Ganga River Basin Authority: Ministry of Environment and Forest, Government of India (2011) Environmental and Social Management framework. Environmental and Social Analysis prepared by The Energy and Resource Institute Consultant, vol I, p 127
Paerl HW (1997) Coastal eutrophication and harmful algal blooms: importance of atmospheric deposition and groundwater as “new” nitrogen and other nutrient sources. Limnol Oceanogr 42:1154–1165
Paerl HW, Dennis RL, Whitall DR (2002) Atmospheric deposition of nitrogen implications for nutrient over-enrichment of coastal waters. Estuaries 25:677–693
Pandey J, Yadav A (2015) The changing state of N: P: Si stoichiometry in Ganga River: possible implications for production and fate of phytoplankton biomass. Water 6:91–99
Pandey J, Pandey U, Singh AV (2014a) Impact of changing atmos-pheric deposition chemistry on carbon and nutrient loading to Ganga River: integrating land–atmosphere–water components to uncover cross-domain carbon linkages. Biogeochemistry 014:179–198
Pandey J, Pandey U, Singh AV (2014b) The skewed N: P stoichiometry resulting from changing atmospheric deposition chemistry drives the pattern of ecological nutrient limitation in the Ganges. Curr Sci 107:956–958
Pandey J, Yadav A, Singh R (2015) The N: P: Si stoichiometry and relative abundance of diatoms in Ganga River. Br J Appl Sci Tech-nol 9:137–147
Pandey J, Pandey U, Singh AV, Tripathi S, Mishra V (2016a) Atmospheric N and P deposition in the Ganges Basin. Curr Sci 110:974–976
Pandey J, Tripathi S, Pandey U (2016b) Anthropogenically induced shifts in N: P: Si stoichiometry and implications in Ganga River. Air Soil and Water Res 9:35–43
Pandey U, Pandey J, Singh AV, Mishra A (2017) Anthropogenic driven shift in diatom dominance-diversity relationships and transparent exopolymeric particles production in Ganga River: implication for natural cleaning of river water. Curr Sci 113:959–964
Park G, Oh H, Ahn S (2009) Improvement of the ammonia analysis by the phenate method in water and wastewater. Bull Korean Chem Soc 30:2032–2038
Perakis SS, Hedin LO (2002) Nitrogen loss from unpolluted South American forests mainly via dissolved organic compounds. Nature 145:416–419
Piehler MP, Twomey LJ, Hall NS, Paerl HW (2004) Impacts of inor-ganic nutrient enrichment on phytoplankton community structure and function in Pamlico Sound, NC, USA. Estuar Coast Shelf Sci 6:197–209
Tilman D (1982) Resource competition and community structure. In: May RM (ed) Monographs in population biology, vol 17. Prince-ton University Press, Princeton, p 296
Voghe AI (1971) A text book of quantitative inorganic analysis, 4th edn. The English Language Book Society, Longman
Wang R, Balkanski Y, Boucher O, Ciais P, Penuclas J, Tao S (2015) Significant contribution of combustion-related emission to the atmospheric phosphorous budget. Nat Geosci 8:48–54
Weber CI (1973) Recent developments in the measurement of the response of plankton and periphyton to changes in their environ-ment. In: Glass G (ed) Bioassay techniques and environmental chemistry. Ann Arbor Science Publishers, Ann Arbor, pp 119–138
Wetzel RG, Likens GE (2000) Limnological analysis, 2nd edn. Spring, New York, p 491
Zamara LM, Landolfi A, Oschlies A, Hansell DA, Dietze H, Denter F (2010) Atmospheric deposition of nutrients and excess N forma-tion in the North Atlantic. Biogeosciences 7:777–793
Publisher’s Note Springer Nature remains neutral with regard to jurisdictional claims in published maps and institutional affiliations.