Embed Size (px)
Citation preview
Proceedings of the International Conference on Industrial Engineering and Operations Management Bangkok, Thailand, March 5-7, 2019
© IEOM Society International
The Paths From Service Quality Dimensions To Customer Loyalty: An Application On Sri Lankan Supermarket
Customers
M. T. Dimantha JayasankaL. H. T. De. S. WickramasuriyaDepartment of Decision Sciences,
University of Sri Jayawardenepura,Gangodawila, Nugegoda, Sri Lanka.
[email protected] [email protected]
Abstract
This research investigates the path from service quality dimensions to customer satisfaction and loyalty in supermarket customers of Sri Lanka. The expansion in the industry by international players coming to Sri Lanka and the competition prevailing in the industry emphasize the importance of this research. To certain extent this study contributes to fill the gap that exists due to the lack of knowledge about the path from service quality dimensions to customer loyalty in the country. Service quality dimensions identified through the literature survey namely Empathy, Reliability, Responsiveness, Tangibility and Assurance. The objective of this research is to identify the impact of service quality dimensions to customer satisfaction and then to customer loyalty, and to highlight the barriers to customer satisfaction & loyalty if any. Sample of this study consists of 500 supermarket customers in Colombo city and suburb. Data were collected through e-questionnaire by using Google Forms for the time period January 2018 to October 2018. The validity types concerned are the content validity and construct validity as the research constructs were measured using set of variables within each of them. The reliability of the scale measurements was tested for internal consistence using Cronbach’s Alpha and Composite Reliability. Hypotheses were tested using Structural Equation Model. According to the findings of the study, empathy is a major influencing factor in service quality dimensions in supermarkets in Sri Lanka. In addition that reliability, responsiveness, tangibility, assurance are also positively influence to the customers’ satisfaction.
1. Background of the study
With tight profit margins and increasing competition, the supermarket’s success depends heavily on its ability to
retain customers . Indeed the longer customers remained with a particular market, the more profitable they became
to the supermarket. A two percent increase in customer retention has the same effect on profits as cutting costs by 10
percent. Similarly a 5 percent reduction in customer defection rate can increase profits by 25-125 percent(Min,
2010).
Considering the significance of customer retention to the supermarket’s profitability, the supermarket should
changing needs and preferences of customers. For example, the recent hike in fuel prices in Sri Lanka may force
some customers to shop at the nearby supermarket or make fewer trips to the supermarket distant from their
neighborhood. Also those needs and preferences may represent various service attributes greater selection of
1779
Proceedings of the International Conference on Industrial Engineering and Operations Management Bangkok, Thailand, March 5-7, 2019
© IEOM Society International
healthy foods, mistake free services, ready to assist customers, 24/7 access, better lighting and modern equipment.
Once these service attributes are revealed, the supermarket should identify what service attributes customers
consider most important and how well the supermarket is performing. In an effort to help the supermarkets’ to
enhance its competitiveness that relies on the customer satisfaction on its service quality dimensions and customer
loyalty on satisfaction.
It is very difficult, however, to find studies related to service quality dimensions and their effects on customer
satisfaction and its customer satisfaction on the factors of customer loyalty such as positive word of mouth ( p-
WOM) and repurchase intention in supermarket sector. As Jamal & Anastasiadou (2009) stated, despite a significant
effect interest in service quality and its dimensions, very little research has investigated the effects of specific
dimensions of service quality dimensions on satisfaction and loyalty. In conclusion, the purpose of our study is to
investigate the path of service quality to customer satisfaction to customer loyalty. We find this study particularly to
be interesting because there have been less such studies conducted in Sri Lanka concerning customer loyalty for
supermarkets.
1.2 Identification of the research problem How service quality dimensions affect to customer loyalty in Sri Lankan supermarket industry? 1.3 Research questions Are there paths between five SERVQUAL dimensions, customer satisfaction and customer loyalty?
Do tangibles, reliability, responsiveness, assurance, empathy have a significantly positive influence on customer
satisfaction?
Does customer satisfaction have a significantly positive influence on customer repurchase intention?
Does customer satisfaction have a significantly positive influence on p-WOM?
1.4 Objectives The main objective of this study is to determine the paths between five SERVQUAL dimensions, customer
satisfaction and customer loyalty.
To find out tangibles, reliability, responsiveness, assurance, empathy has a significantly positive influence on
customer satisfaction.
To identify customer satisfaction has a significantly positive influence on customer repurchase intention.
To verify customer satisfaction has a significantly positive influence on p-WOM.
1780
Proceedings of the International Conference on Industrial Engineering and Operations Management Bangkok, Thailand, March 5-7, 2019
© IEOM Society International
2. Literature review The general definition of “quality” is “satisfying customer’s requirements” (Ghobadian A. & Jones, 1994). Service
quality, as an output of the service encountering process, is defined as the level of service offered to meet customer
expectations (Duffy, Duffy, & Kilbourne, 1997).
There is voluminous academic research on the measurement of service quality. The traditional SERVQUAL or ‘‘gap
analysis model’’ was developed by Parasuraman, Zeithaml and Berry in the early 1980s, which is based on the view
that customers assess service quality by comparing expectations of services provided with perceptions of the actual
service received from a particular service provider. A set of five service quality dimensions (namely: tangibles,
reliability, responsiveness, assurance, and empathy) across a broad spectrum of service industries is identified.
However, many studies (Finn and Lamb, 1991; Singh, 1991; Smith, 1999) that employed SERVQUAL were never
successful in retaining all of the 22 items of the five dimensions, although they were pre- validated by Parasuraman
et al. (1988). As a result of further diagnostic assessment (Parasuraman et al., 1994) to their initial 22 items, these
were collapsed into three categories: reliability and tangibility, while responsiveness, assurance, and empathy were
found to be loaded into one factor. Even though currently there is
The concept of service quality emerged as a result of the interaction between customer and service provider (Leisen
& Vance, 2002).Gronroos stated that service firms should define perceived service quality and determine the
influences of service quality in order to compete successfully. The perceived service quality as the outcome of an
evaluation process. In this process, the customer compares expectations and perceptions with the result of the
process referred to as perceived service quality.A year after Gronroos , (Parasuraman, Zeithaml, & Berry, 1985)
suggested a conceptual model. Similarly they claimed that the service quality is a comparison between expectations
and performance.
Within the framework of the European thought process which is also known as the Scandinavian school, (Grönroos,
2001) stated that the technical quality dimensions of a service replace the physical features of a product. The image
dimension has entered into the model as a dynamic factor because customers transfer their general perceptions and
previous experiences with them to the next service encounter process.Some researches define service quality as the
gap between service perceptions and customer expectations (Vinagre & Neves, 2008).The North American school
has focused its research on the intangible factors with the assumption that there are very few tangible factors in the
service encounter process (Pérez Sánchez, Gázquez Abad, Marín Carrillo, & Sánchez Fernández, 2007).
Parasuruman and his colleagues have greatly contributed to the field of service quality with the SERVQUAL scale
they developed in the light of the Scandinavian service management school and especially the pioneering work done
by Gronroos (Chowdhary & Prakash, 2007).
1781
Proceedings of the International Conference on Industrial Engineering and Operations Management Bangkok, Thailand, March 5-7, 2019
© IEOM Society International
SERVQUAL model has been pointed to as being the most extensively and successfully used service quality
measurement in the twenty first century (Kassim & Asiah Abdullah, 2010).
Empathy
Prior literature shows that consumers’ need for empathy is one of the predictors of satisfaction in services. As a
dimension of service quality, empathy is found to affect consumer satisfaction. Consumers tend to be more satisfied
when they perceive companies and the employees with which they interact to be aware of their needs.
Empathy as a service quality dimension is caring, individualized attention a firm provides to its customers.
Personalization or customization can also be understand as the empathy dimension in the SERVQUAL model
(Kassim & Asiah Abdullah, 2010).
Empathy can also be stated as the personalized assistance a firm conveys to its customers.
Reliability
Reliability is the ability to perform the promised service dependably and accurately. Need for reliability is more for
services with intangible nature of act. Services that are targeted at possessions of customers, whereby the presence
of customer on the process is not necessary and the services are carried out largely in back offices; there is a great
need for reliability of service process (Chowdhary & Prakash, 2007).
In an early study on customers’ service quality perceptions, Becker et al. (1997)measured customers’ perceptions
and expectations in floral service quality. The results of that study exposed the finding that the reliability was the
most important and the tangibles dimension was the least important of the five SERVQUAL dimensions.
Responsiveness
Satisfaction and responsiveness have not been widely studied in developing countries. The value adding role of a
retailed network in enhancing service responsiveness have not been fully explored probably because of the emphasis
on quantitative methods such as optimization commonly adopted in supply chain management research.
It is expected to meet the reasonable expectations (responsiveness) of patients lead to their satisfaction. Previous
studies have documented the effect of responsiveness on patient satisfaction; overall patient satisfaction is affected
by the responsiveness of service providers (Bleich et al., 2009; Messina et al., 2009; Faleh et al., 2015). Hospital
responsiveness generally leads to an increase in patient satisfaction with care providers, which in turn, leads to an
increase in the utilization of health services (Naidu, 2009; Malhotra and Do, 2013).
Enhancing the level of health system responsiveness and patient satisfaction in the Islamic Republic of Iran with an
emphasis on human identity and with special attention given to the spirituality, biological, psychological and social
1782
Proceedings of the International Conference on Industrial Engineering and Operations Management Bangkok, Thailand, March 5-7, 2019
© IEOM Society International
needs of patients is important. According to a study conducted in Tehran, more than 90% of respondents considered
responsiveness to be a very important issue (Rashidian et al., 2011).
Satisfaction and responsiveness have not been widely studied in developing countries (Faleh et al., 2015). To our
knowledge, these studies are lacking in Iran. Although few studies have been done on the relationship between
hospital responsiveness and patient satisfaction, but the evidence for patients’ expectation and satisfaction is still
questionable, which needs much more empirical investigation (Barlow et al. 2016; Yao et al., 2016). Moreover,
Assurance
Assurance is the knowledge and courtesy of employees and their ability to inspire trust and confidence. It is the
behavior of employees instills confidence in customers. Customers feel safe in transactions with an organization.
Employees having knowledge to answer any question answered by customers (Kassim & Asiah Abdullah, 2010).
Tangibility
Tangibility refers to aspects of physical facilities, equipment & personnel. Tangibility is an important issue with
services that require a more visible action.
Customer Satisfaction
Measuring customer satisfaction can be seen as an effort to measure human feelings, and it is therefore very difficult
at times for many researches to do so. It is important to note that “measuring customer satisfaction provides an on
how an organization is performing or providing products or services”.
Possible dimensions that one can use in measuring customer such as pricing, quality of service, speed of service,
trust in employees, types of other services needed, complaints, positioning in clients’ minds and the closeness of the
relationship between the customers and the firm.
Recent re- search offers some evidence that customer satisfaction and/or
service-quality perceptions positively affect intentions to be- have in these ways. However, most of the research
opera- tionalizes behavioral intentions in a unidimensional way rather than delineate specific types of behavior. For
example, Cronin and Taylor (1992), using a single-item purchase-in- tention scale, find a positive correlation with
service quality and customer satisfaction. Anderson and Sullivan (1990), in analyzing data from a study of customer
satisfaction among Swedish consumers, find that stated repurchase intention isstrongly related to stated satisfaction
across product cate- gories. A study conducted by Woodside, Frey, and Daly(1989) uncovers a significant
association between overall pa- tient satisfaction and intent to choose the hospital again.
If service quality is conceived from a consumer perspective, it is usually linked to the levels of customer
satisfaction, which gives the concept a subjective nature (based on perceived quality), rather than an objective nature
(based on technical or mechanical quality) (Carman, 1990). In this regard, Parasuraman et al. (1988, p. 16) defined
1783
Proceedings of the International Conference on Industrial Engineering and Operations Management Bangkok, Thailand, March 5-7, 2019
© IEOM Society International
perceived service quality as “a global judgement or attitude relative to the degree of excellence or superiority of
service”.
Customer Loyalty
Customer loyalty is measured by using customer repurchase intension and positive word of mouth. If customers are
satisfied with the service rendered by an organization they customers will be loyal to that organization. Customers
will come again to repurchase from that organization and they will inform others the quality service given to that
particular organization.
3. Methodology
The target population for the present study was the supermarket customers who deals with Keels, Cargills, Arpico
and Laugfs supermarkets situated in Colombo city and suburbs. The study was limited to this area taking into
consideration of the time and cost constraints. Due to the time and cost constraints four major supermarket chains
were selected based on the Fitch ratings special report on Sri Lankan modern grocery retail. Sample of 311
questionnaires were distributed to customers through online questionnaire using Google Form. Convenience
sampling technique was used. The unit of analysis is supermarket customers from Keels, Cargills, Arpico and
Laugfs (Individual Level). The data for this study were collected at a single point of time , thus the study is a cross
sectional in the time horizon. The period chosen for the study is July 2018 to October 2018. Data were collected
during this period.
This study was carried out based on both primary and secondary data. Hypotheses were tested basically on primary
data. Based on the secondary data the hypotheses and literature survey was developed. Secondary data included
newspapers, journals, reports, Central Bank’s reports etc. Primary data were collected from a sample of supermarket
customers from Colombo city and suburbs. The survey questionnaire consists of two parts. The first part includes
statements to measure level of service quality and the satisfaction and loyalty levels of customers. For measuring
the service quality 17 statements were used . These questions were adopted from Kueh & Voon ( 2007). In
accordance with the original model (Parasuraman, Zeithaml, & Berry, 1985) tangibility, reliability, responsiveness,
assurance, and empathy are included as quality dimensions. Each of these dimensions is measured with three or four
statements in the questionnaire. Three statements were used to measure the customer satisfaction and two statements
measured customer loyalty. The second part includes items to determine demographic profiles of the respondents. In
part one, a five-point likert scale was used for data collection with “1” as “ completely agree” and “5” as
“completely disagree” (Likert, Roslow, & Murphy, 1934).
1784
Proceedings of the International Conference on Industrial Engineering and Operations Management Bangkok, Thailand, March 5-7, 2019
© IEOM Society International
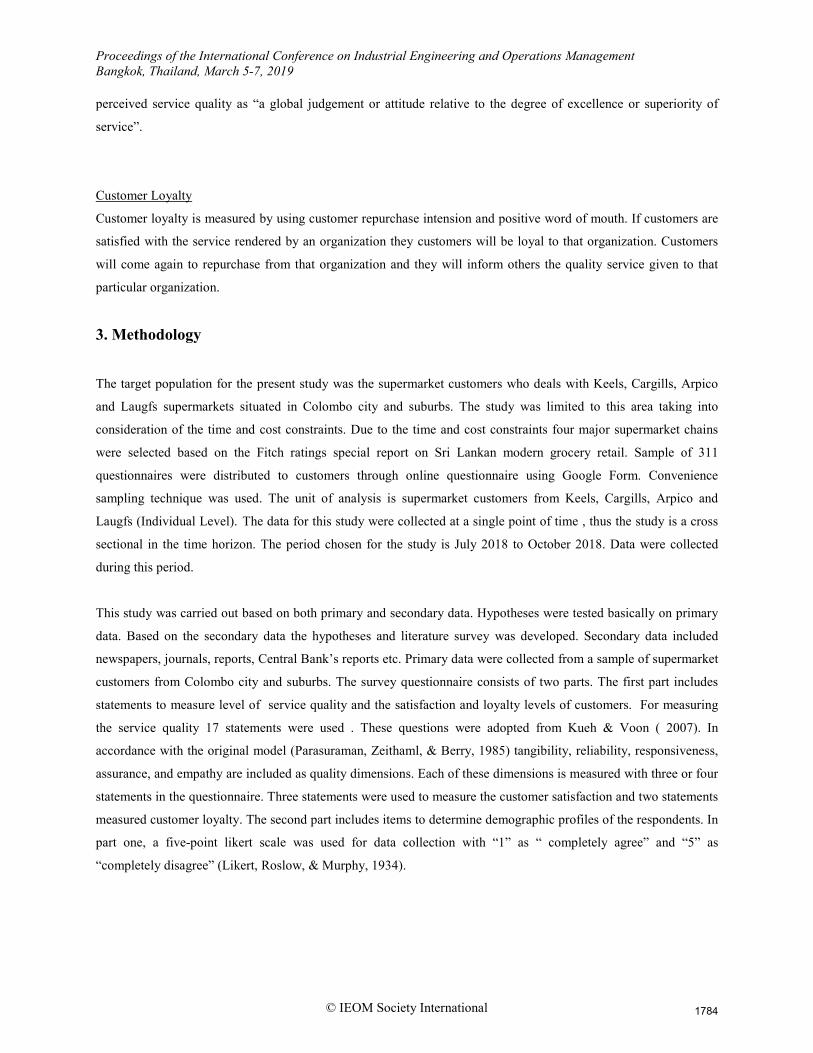
3.1 Conceptual Framework
SPSS 23.0 for Windows and AMOS V.22 was used for the data analysis. Descriptive statistics such as means,
standard deviation were calculated using SPSS. Confirmatory factor analysis (CFA) was carried out using AMOS to
examine the factor structure and validate the measurement and path model. Convergent validity and discriminant
validity were applied to test the validity of the constructs in the study.
Convergent validity of constructs
Standardized regression weights ( Standardized factor loadings) in AMOS are the first thing to look at examining
convergent validity. All factor loadings should be greater than 0.5 as a requirement for the convergent validity.
Average Variance Extracted ( AVE) values should be above 0.5 and also composite reliability values shold be
greater than 0.7 to satisfy the convergent validity test.
Discriminant validity of the constructs
To fulfill the discriminant validity test, Average Variance Extracted (AVE) values for each factor should be higher
than the correlations of other factors.
Reliability of the constructs
The reliability of the scale measurements was tested for internal consistence using Cronbach’s alpha. SPSS was used
for the computation and the common criteria of greater than 0.7 for a better reliability, was taken for the
interpretation of the results.Cronbach’s alpha is a statistic. It is commonly used as an internal consistency reliability
of a psychometric instrument. Where n is the number of components (items or testlets), Vt is the variance of the
observed total test scores, Vi is the variance of the component i.
Empathy
Reliability
Responsiveness
Tangibility
Assurance Satisfaction
Word of mouth
Repurchase Intension H1
H2
H3
H4
H5
H6
H7
Figure 1: Conceptual Framework
1785
Proceedings of the International Conference on Industrial Engineering and Operations Management Bangkok, Thailand, March 5-7, 2019
© IEOM Society International
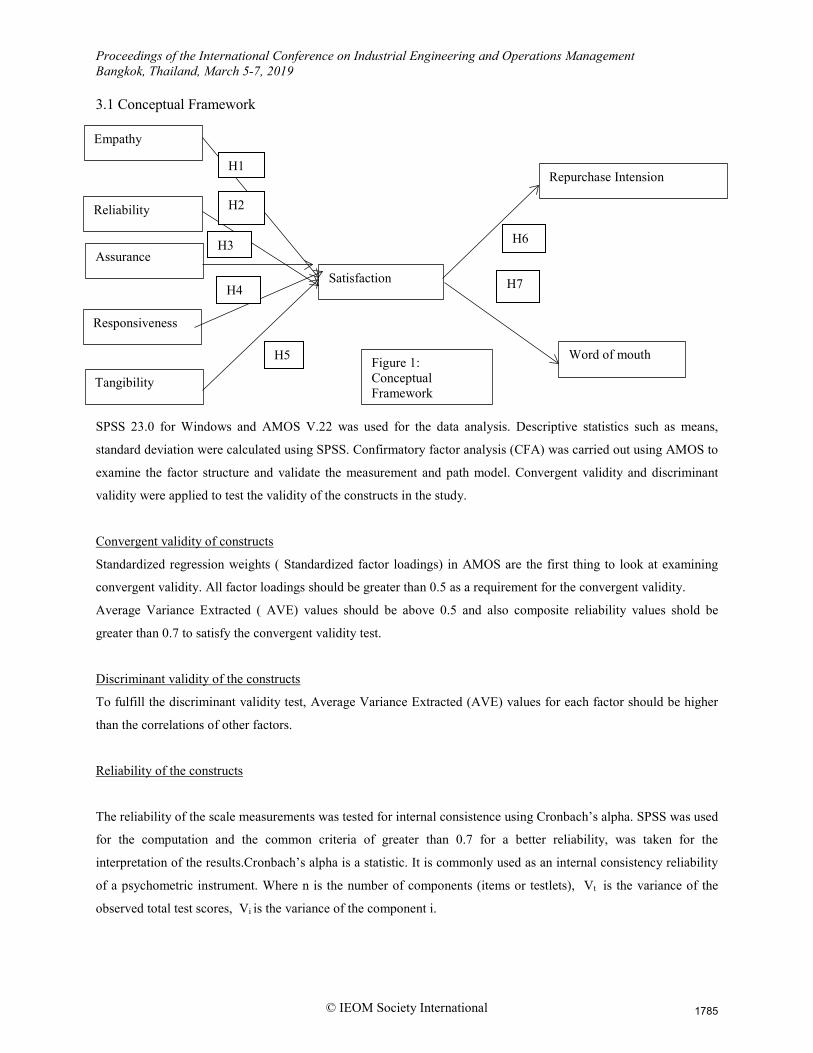
4. Data Analysis The analysis was conducted in three steps. At the first step, descriptive statistical measures such as means, frequencies and categorical tables were used. In the second step, validity and reliability of the research constructs were tested. Validity was tested by convergent validity and discriminant validity. The reliability of the research constructs was tested using Cronbach’s alpha. Finally hypotheses testing were conducted. All the hypotheses were tested by path analysis using structural model. According to figure 68.88% of respondents are male while 33.12% of respondents are female. There were no missing values in the database we made using the questionnaires. To fulfill the assumptions of structural equation model (SEM), first this study examined the data for normality by calculating kurtosis and skewness. As per cited in Hwang & Seo (2016) normal data should have a skewness and kurtosis within the range of +/-1 and +/-2 respectively.Kurtosis and skewness for the sample was generally acceptable. Therefore we can assume that the data was close to a normal distribution.The adequacy of the sample for the extracted factors is verified using KMO statistic where the minimum acceptable level is 0.5.
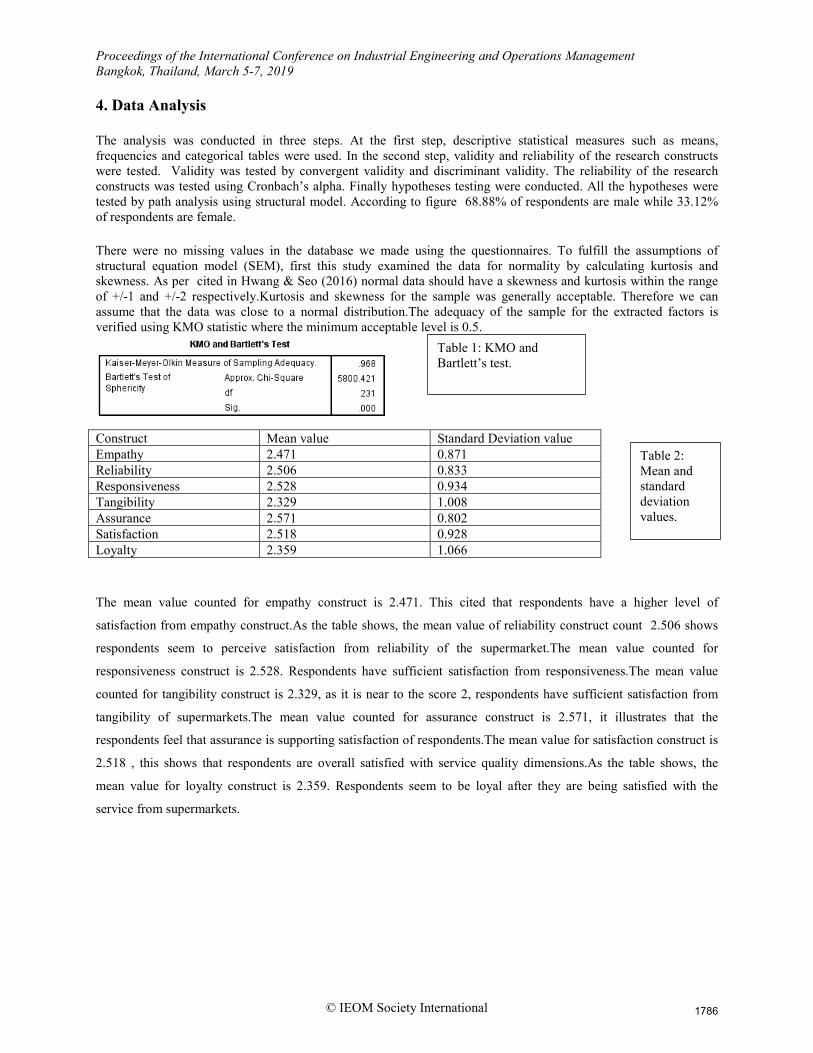
Construct Mean value Standard Deviation value Empathy 2.471 0.871 Reliability 2.506 0.833 Responsiveness 2.528 0.934 Tangibility 2.329 1.008 Assurance 2.571 0.802 Satisfaction 2.518 0.928 Loyalty 2.359 1.066
The mean value counted for empathy construct is 2.471. This cited that respondents have a higher level of
satisfaction from empathy construct.As the table shows, the mean value of reliability construct count 2.506 shows
respondents seem to perceive satisfaction from reliability of the supermarket.The mean value counted for
responsiveness construct is 2.528. Respondents have sufficient satisfaction from responsiveness.The mean value
counted for tangibility construct is 2.329, as it is near to the score 2, respondents have sufficient satisfaction from
tangibility of supermarkets.The mean value counted for assurance construct is 2.571, it illustrates that the
respondents feel that assurance is supporting satisfaction of respondents.The mean value for satisfaction construct is
2.518 , this shows that respondents are overall satisfied with service quality dimensions.As the table shows, the
mean value for loyalty construct is 2.359. Respondents seem to be loyal after they are being satisfied with the
service from supermarkets.
Table 1: KMO and Bartlett’s test.
Table 2: Mean and standard deviation values.
1786
Proceedings of the International Conference on Industrial Engineering and Operations Management Bangkok, Thailand, March 5-7, 2019
© IEOM Society International
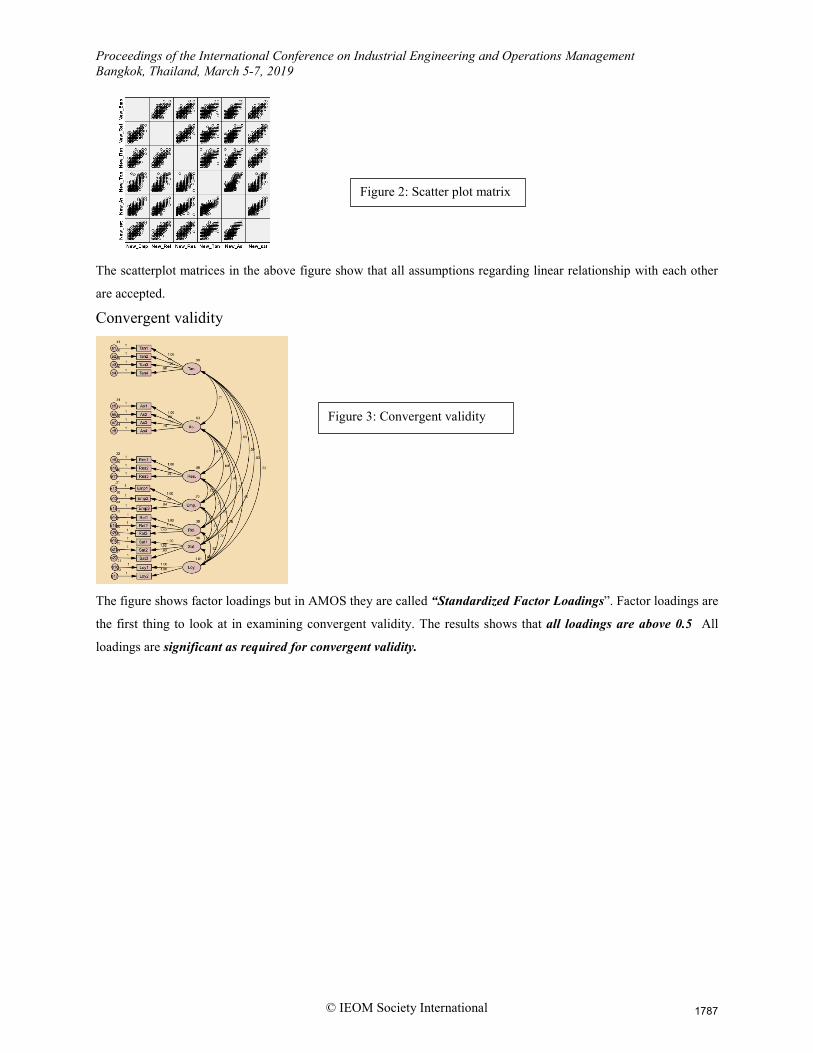
The scatterplot matrices in the above figure show that all assumptions regarding linear relationship with each other
are accepted.
Convergent validity
The figure shows factor loadings but in AMOS they are called “Standardized Factor Loadings”. Factor loadings are
the first thing to look at in examining convergent validity. The results shows that all loadings are above 0.5 All
loadings are significant as required for convergent validity.
Figure 2: Scatter plot matrix
Figure 3: Convergent validity
1787
Proceedings of the International Conference on Industrial Engineering and Operations Management Bangkok, Thailand, March 5-7, 2019
© IEOM Society International
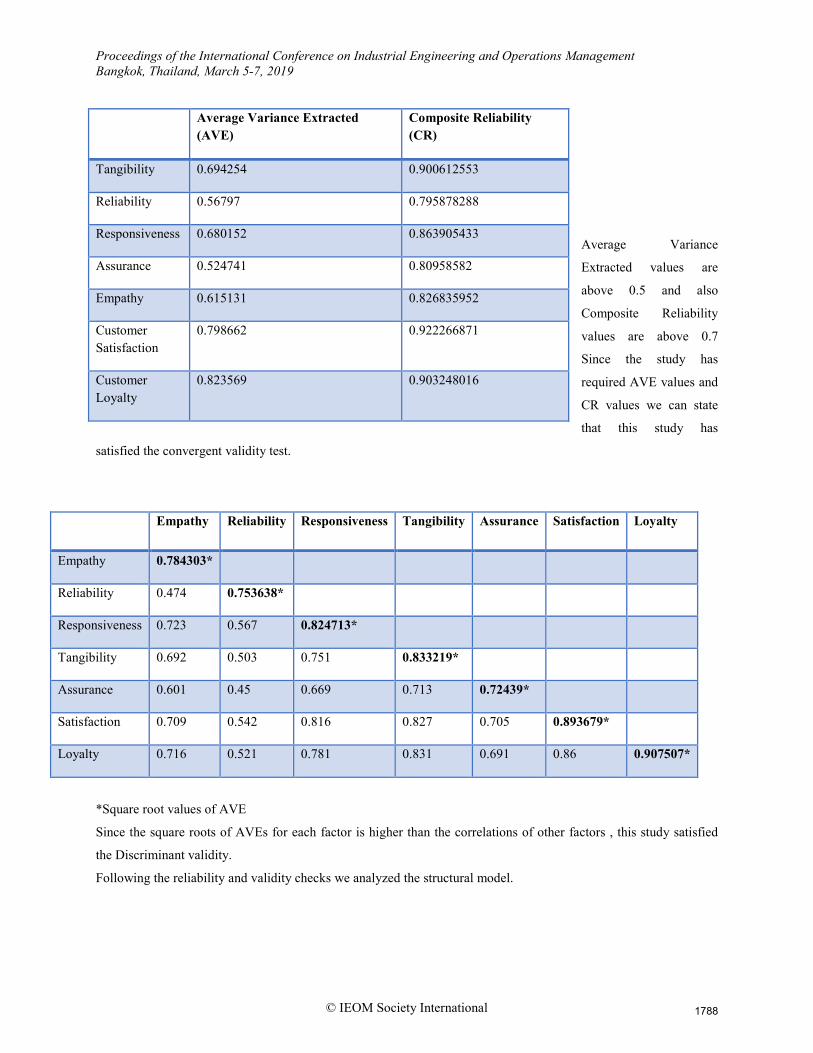
Average Variance
Extracted values are
above 0.5 and also
Composite Reliability
values are above 0.7
Since the study has
required AVE values and
CR values we can state
that this study has
satisfied the convergent validity test.
Empathy Reliability Responsiveness Tangibility Assurance Satisfaction Loyalty
Empathy 0.784303*
Reliability 0.474 0.753638*
Responsiveness 0.723 0.567 0.824713*
Tangibility 0.692 0.503 0.751 0.833219*
Assurance 0.601 0.45 0.669 0.713 0.72439*
Satisfaction 0.709 0.542 0.816 0.827 0.705 0.893679*
Loyalty 0.716 0.521 0.781 0.831 0.691 0.86 0.907507*
*Square root values of AVE
Since the square roots of AVEs for each factor is higher than the correlations of other factors , this study satisfied
the Discriminant validity.
Following the reliability and validity checks we analyzed the structural model.
Average Variance Extracted (AVE)
Composite Reliability (CR)
Tangibility 0.694254 0.900612553
Reliability 0.56797 0.795878288
Responsiveness 0.680152 0.863905433
Assurance 0.524741 0.80958582
Empathy 0.615131 0.826835952
Customer Satisfaction
0.798662 0.922266871
Customer Loyalty
0.823569 0.903248016
1788
Proceedings of the International Conference on Industrial Engineering and Operations Management Bangkok, Thailand, March 5-7, 2019
© IEOM Society International
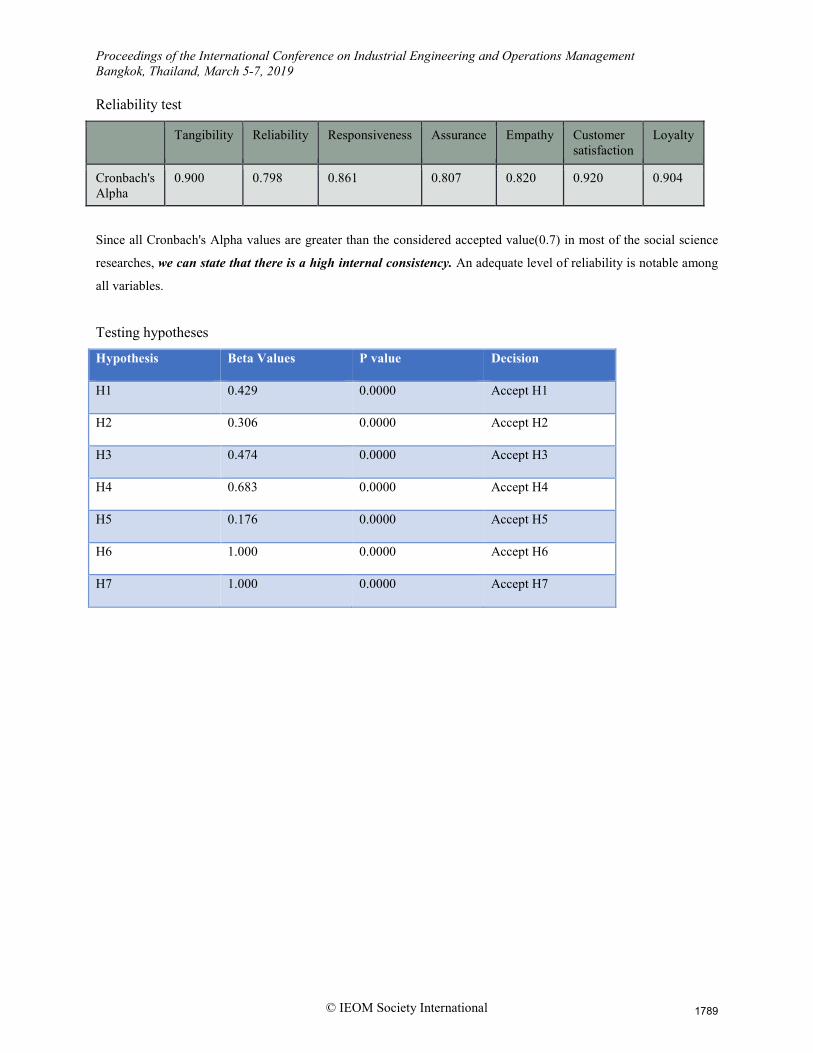
Reliability test
Tangibility Reliability Responsiveness Assurance Empathy Customer satisfaction
Loyalty
Cronbach's Alpha
0.900 0.798 0.861 0.807 0.820 0.920 0.904
Since all Cronbach's Alpha values are greater than the considered accepted value(0.7) in most of the social science
researches, we can state that there is a high internal consistency. An adequate level of reliability is notable among
all variables.
Testing hypotheses
Hypothesis Beta Values P value Decision
H1 0.429 0.0000 Accept H1
H2 0.306 0.0000 Accept H2
H3 0.474 0.0000 Accept H3
H4 0.683 0.0000 Accept H4
H5 0.176 0.0000 Accept H5
H6 1.000 0.0000 Accept H6
H7 1.000 0.0000 Accept H7
1789
Proceedings of the International Conference on Industrial Engineering and Operations Management Bangkok, Thailand, March 5-7, 2019
© IEOM Society International
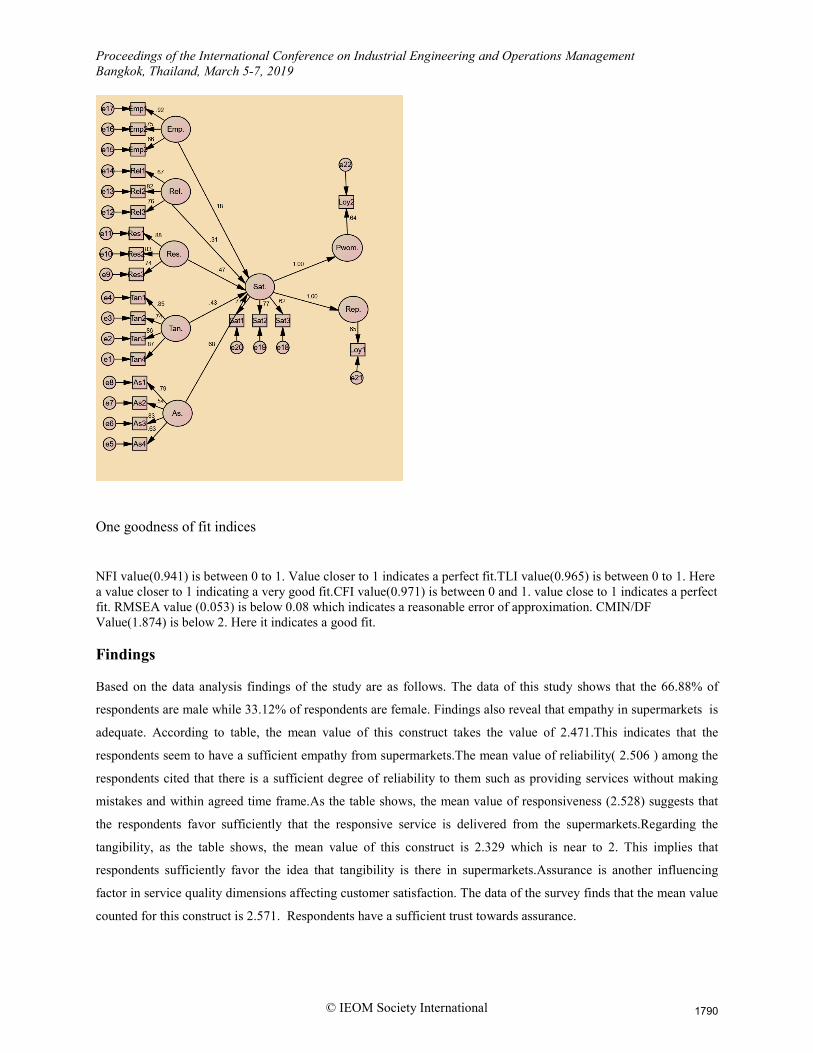
One goodness of fit indices
NFI value(0.941) is between 0 to 1. Value closer to 1 indicates a perfect fit.TLI value(0.965) is between 0 to 1. Here a value closer to 1 indicating a very good fit.CFI value(0.971) is between 0 and 1. value close to 1 indicates a perfect fit. RMSEA value (0.053) is below 0.08 which indicates a reasonable error of approximation. CMIN/DF Value(1.874) is below 2. Here it indicates a good fit. Findings Based on the data analysis findings of the study are as follows. The data of this study shows that the 66.88% of
respondents are male while 33.12% of respondents are female. Findings also reveal that empathy in supermarkets is
adequate. According to table, the mean value of this construct takes the value of 2.471.This indicates that the
respondents seem to have a sufficient empathy from supermarkets.The mean value of reliability( 2.506 ) among the
respondents cited that there is a sufficient degree of reliability to them such as providing services without making
mistakes and within agreed time frame.As the table shows, the mean value of responsiveness (2.528) suggests that
the respondents favor sufficiently that the responsive service is delivered from the supermarkets.Regarding the
tangibility, as the table shows, the mean value of this construct is 2.329 which is near to 2. This implies that
respondents sufficiently favor the idea that tangibility is there in supermarkets.Assurance is another influencing
factor in service quality dimensions affecting customer satisfaction. The data of the survey finds that the mean value
counted for this construct is 2.571. Respondents have a sufficient trust towards assurance.
1790
Proceedings of the International Conference on Industrial Engineering and Operations Management Bangkok, Thailand, March 5-7, 2019
© IEOM Society International
Regarding the respondent’s satisfaction for the service quality dimensions, the mean value counted for the construct
(2.518) implies that the satisfaction is supporting the service quality constructs.According to the survey data, the
mean value counted for loyalty is 2.359. It illustrates that the respondents feel that their satisfaction has a favorable
attitude towards loyalty to some extent.Structural equation model results show that all hypotheses could be accepted.
Thus, the hypothesis one : Tangibles have a positive influence on customer satisfaction was supported by the
empirical data. According to the table, p value for this hypothesis is .000, which means tangibles have a positive
influence on customer satisfaction. The second hypothesis: Reliability has a positive influence on customer
satisfaction is also supported by the empirical data. Structural equation model tests show that the p value is .000
.The findings of the study supported the hypothesis three : Responsiveness has a positive influence on customer
satisfaction. As mentioned previously, the mean value of responsiveness ( 2.528 ) suggests that the respondents
favor sufficiently that responsiveness is there in supermarkets. Respondents are sure that responsiveness is there in
supermarkets. The structured equation model illustrate that the hypothesis is significant at 0.05 level as p value is
.000.The empirical data supported the hypothesis four: Assurance has a positive influence on customer satisfaction.
Since p value of the structural equation model is .000, assurance has a positive influence on customer satisfaction.
The hypothesis five: Empathy has a positive influence on customer satisfaction was supported by empirical data.
According to the table, p value for this hypothesis is .000, which means that the empathy has a positive influence on
customer satisfaction.The sixth hypothesis: Customer satisfaction has a positive influence on customer repurchase
intention is also supported by the empirical data. Structural equation model results show that hypothesis is
significant at .05 level as p value is .000.The findings of the study support the hypothesis seven: Customer
satisfaction has a positive influence on p-WOM. The structural equation model illustrate that the hypothesis seven is
significant at .05 level as p value is .000.
Conclusions and recommendations
According to the findings of the study, empathy is a major influencing factor in service quality dimensions in
supermarkets in Sri Lanka. Hence, supermarkets should take necessary actions such as making customers always the
supermarkets priority, make employees understand what customers want. Findings of the study revealed that
reliability is also a major determinant factor in the service quality dimensions. Therefore supermarkets should pay
more attention to this factor and educating customers on the promises given to them are being met within reasonable
agreed time. Also necessary actions should be taken to provide services without making mistakes and to show
sincere efforts to solve customer’s problems. Responsiveness also has a significant positive effect on customer
satisfaction on service quality dimensions according to the findings of the study. Thus, supermarkets need to offer a
responsive service to their customers. Having no employees to assist clients, not providing prompt and actual service
to customers should be minimized in this regard. Findings further revealed that supermarket customers have a
sufficient trust in the tangibility construct. Thus, supermarkets should convince customers that supermarket uses
modern equipment, making the interior of the supermarket attractive, making employees have a professional looking
etc, in order to increase the customer satisfaction.
1791
Proceedings of the International Conference on Industrial Engineering and Operations Management Bangkok, Thailand, March 5-7, 2019
© IEOM Society International
Findings also revealed that assurance is significantly positively related to customer satisfaction among supermarket
customers. Hence supermarkets should need to take actions to change employee behavior to raise customers’
confident, make employees to be polite to their customers. Satisfaction has a significant positive influence on
customer repurchase intention and p-WOM. Therefore it is important to educate customers about the price reduction
in goods in the supermarket compared to others, giving customers loyalty cards, greeting customers when leaving
the supermarket to come back again.
Limitations This study has following limitations. The presented research was conducted based solely on supermarket sectors ;
therefore results cannot be generalized into other sectors of the economy. Limited resources and time resulted in a
small sample (n=311) and therefore findings cannot be generalized to all supermarket customers. Since the study
conducted was based on supermarket customers in Colombo city and suburb, the study does not represent the whole
country. The sample consists of customers of 04 major supermarket chains only. The tested model entailed a total of
seven variables only- the five SERVQUAL variables, satisfaction and loyalty.
Further research Further research should focus on measuring customer satisfaction and loyalty with wholesales and other service
industries. Further research need to be carried out by selecting a representative sample of the whole country. For
better results of high generalization, future research can be conducted by selecting all supermarkets in Sri Lanka.
This model can be developed with different variables.
Acknowledgements A First of all I would like to express my heartfelt gratitude to and thanks to L.H.T.De S. Wickramasuriya, senior
lecturer of Department of Decision Sciences, University of Sri Jayawardenepura, who supervised my research and
gave me sound advice, valuable suggestions from the beginning to the end of this attempt.
My sincere appreciation is also expressed to Dr. C.W. Chathurani Silva, senior lecturer, Mrs. D.M.E. Wedage Head
of Department of Decision Sciences and Dr. U. Anura Kumara Dean od Faculty of Management Studies and
Commerce for their encouragement and assistance throughout the program.
I extent my grateful thanks to all my lecturers of the course of the Bsc Operations and Technology Management
program who gave a valuable contribution to enrich our knowledge.
Further my thanks to all participant supermarket customers who allowed and supported me in giving necessary
information and spending their valuable time with me.
1792
Proceedings of the International Conference on Industrial Engineering and Operations Management Bangkok, Thailand, March 5-7, 2019
© IEOM Society International
Finally, I would like to give special thanks to my family members who encouraged me and supported me through
the difficult days of researching and for helping me to take this research a success.
References Chowdhary, N., & Prakash, M. (2007). Managing Service Quality : An International Journal Article information : Managing Service Quality: An International Journal, 17(5), 493–509.
Duffy, J. A., Duffy, M., & Kilbourne, W. (1997). Cross national study of perceived service quality in long-term care facilities. Journal of Aging Studies, 11(4), 327–336. https://doi.org/10.1016/S0890-4065(97)90025-6
Ghobadian A., S. S., & Jones, M. (1994). Service quality: concepts and models. International Journal of Quality & Reliability Management, 11(9), 43–66.
Grönroos, C. (2001). Guru ’ s view The perceived service quality concept ± a mistake ? Managing Service Quality: An International Journal, Vol. 11(Iss. 3), 150–152. https://doi.org/10.1108/09604520110393386
Kassim, N., & Asiah Abdullah, nor. (2010). The effect of perceived service quality dimensions on customer satisfaction, trust, and loyalty in e-commerce settings: A cross cultural analysis. Asia Pacific Journal of Marketing and Logistics, 22(3), 351–371. https://doi.org/10.1108/13555851011062269
Kitapci, O., Dortyol, I. T., Yaman, Z., & Gulmez, M. (2013). The paths from service quality dimensions to customer loyalty: An application on supermarket customers. Management Research Review, 36(3), 239–255. https://doi.org/10.1108/01409171311306391
Kueh, K., & Voon, B. H. (2007). Culture and service quality expectations: Evidence from Generation Y consumers in Malaysia. Managing Service Quality, 17(6), 656–680. https://doi.org/10.1108/09604520710834993
Ladhari, R. (2009). Service quality, emotional satisfaction, and behavioural intentions: A study in the hotel industry. Managing Service Quality, 19(3), 308–331. https://doi.org/10.1108/09604520910955320
Leisen, B., & Vance, C. (2002). Perspectives assessment of service quality in the telecommunication industry : evidence from the USA and Germany. Managing Service Quality, 11(5), 307–317. https://doi.org/10.1108/EUM0000000005904
Likert, R., Roslow, S., & Murphy, G. (1934). A simple and Reliable Method of Scoring the Thurston Attitude Scales. Gardner Journal of Social Psychology, 5(2), 689–691. https://doi.org/10.1080/00224545.1934.9919450
Parasuraman, a, Zeithaml, V. a, & Berry, L. L. (1985). A Conceptual Model of Service Quality and Its Implications for Future Research. American Marketing Association, 49(4), 41–50. https://doi.org/10.2307/1251430
Pérez Sánchez, M., Gázquez Abad, J. C., Marín Carrillo, G. M., & Sánchez Fernández, R. (2007). Effects of service quality dimensions on behavioural purchase intentions: A study in public-sector transport. Managing Service Quality, 17(2), 134–151. https://doi.org/10.1108/09604520710735164
Vinagre, M. H., & Neves, J. (2008). The influence of service quality and patients’ emotions on satisfaction. International Journal of Health Care Quality Assurance, 21(1), 87–103. https://doi.org/10.1108/09526860810841183
1793
Proceedings of the International Conference on Industrial Engineering and Operations Management Bangkok, Thailand, March 5-7, 2019
© IEOM Society International
www.cbsl.gov.lk/sites/default/files/cbslweb_documents/statistics/otherpub/Economic_%26_Social_Statistics_of_SL_2017_e.pdf
www.pressreader.com/sri-lanka/daily-mirror-sri-lanka/20180404/282316795600348
http://www.sundaytimes.lk/article/1034265/strong-growth-by-top-3-lankan-grocery-retail-chains
Biographies M. T. Dimantha Jayasanka is a management graduate from University of Sri Jayawardenepura, Sri Lanka. He is a passed finalist in Association of Accounting technicians of Sri Lanka (AATSL). He holds a Diploma in Banking from Institute of Bankers’ of Sri Lanka (IBSL). L. H. T. De. S. Wickramasuriya is a senior lecturer in University of Sri Jayawardenepura, Sri Lanka. Mr. Wickramasuriya holds a Bachelor of Commerce degree from University of Sri Jayawardenepura and a Master of Commerce degree from University of Kelaniya. He also holds a Post Graduate Diploma in Business Statistics in University of Sri Jayawardenepura. He has taught Business mathematics and Business Statistics.
1794
![Techno-Commercial and Feasibility Analysis of Energy ...ieomsociety.org/ieom2019/papers/441.pdf · Figure 5. Solar powered universal desalination unit [5] 2.1.3. RoI Analysis . A](https://img.pdfslide.us/doc/110x75/5f90b80db969fe4b24247cf4/techno-commercial-and-feasibility-analysis-of-energy-figure-5-solar-powered.jpg)