Embed Size (px)
Citation preview
The Path to the Crisis of 2008:Beware of Future Expectations
Jean-Paul RodrigueDepartment of Global Studies & Geography, Hofstra University
Theo NotteboomITMMA - University of Antwerp and Antwerp Maritime Academy
Terminal Operators Conference - EuropeValencia (Spain), June 8-10 2010
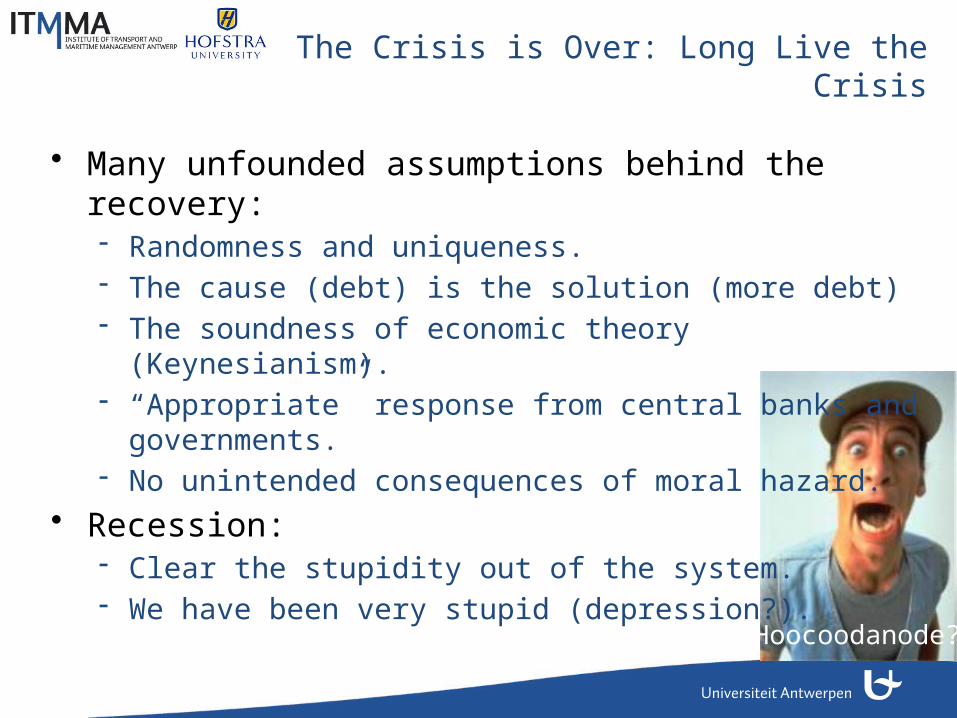
The Crisis is Over: Long Live the Crisis
• Many unfounded assumptions behind the recovery:- Randomness and uniqueness.- The cause (debt) is the solution (more debt)- The soundness of economic theory (Keynesianism).- “Appropriate” response from central banks and
governments.- No unintended consequences of moral hazard.
• Recession:- Clear the stupidity out of the system.- We have been very stupid (depression?).
Hoocoodanode?
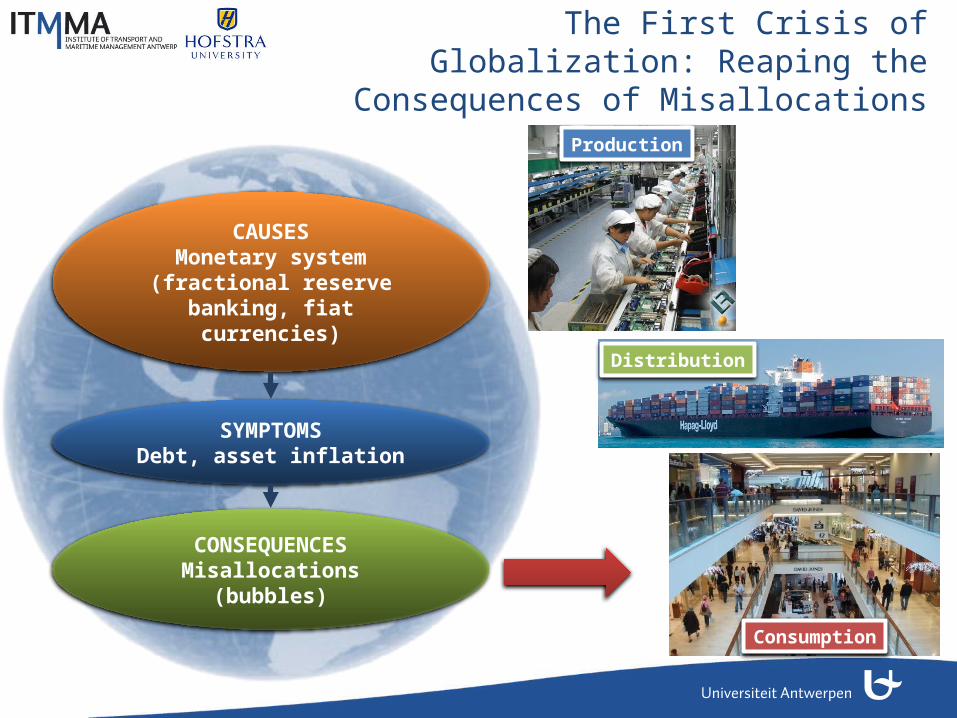
The First Crisis of Globalization: Reaping the Consequences of Misallocations
CAUSESMonetary system
(fractional reserve banking, fiat currencies)
SYMPTOMSDebt, asset inflation
Production
Consumption
Distribution
CONSEQUENCESMisallocations
(bubbles)
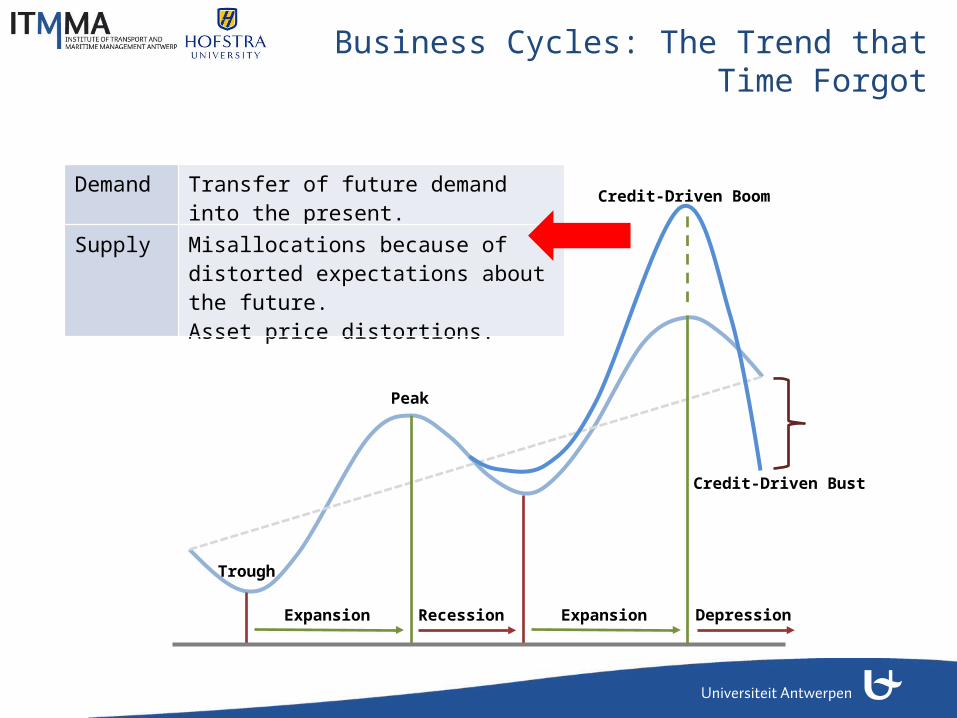
Business Cycles: The Trend that Time Forgot
Expansion Recession
Peak
Trough
Expansion
Credit-Driven Boom
Credit-Driven Bust
Depression
Demand Transfer of future demand into the present.
Supply Misallocations because of distorted expectations about the future.Asset price distortions.
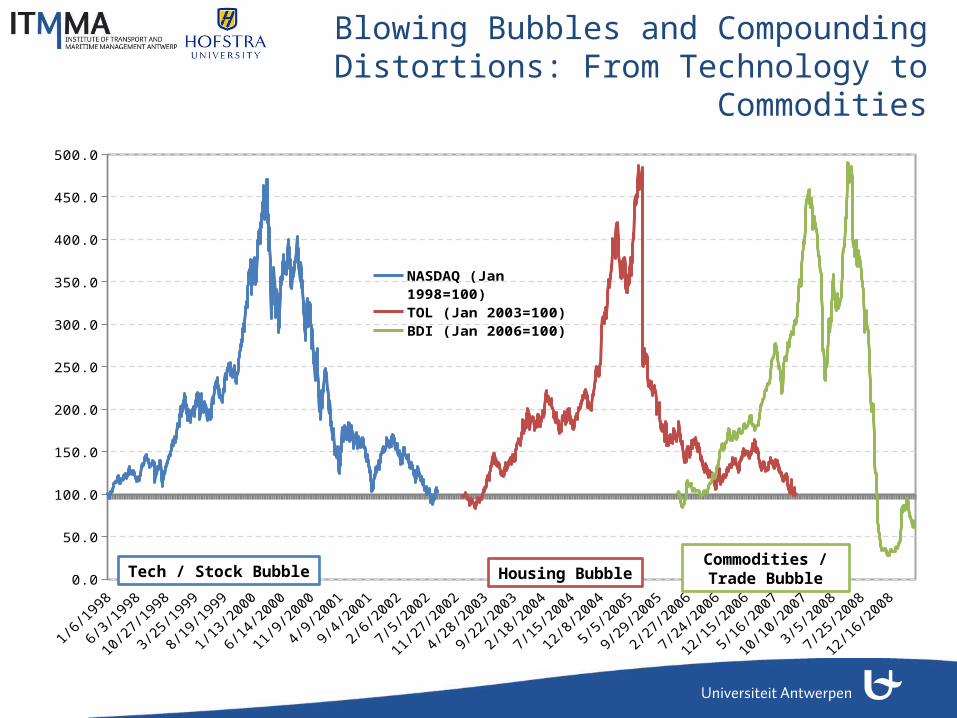
Blowing Bubbles and Compounding Distortions: From Technology to
Commodities
0.0
50.0
100.0
150.0
200.0
250.0
300.0
350.0
400.0
450.0
500.0
NASDAQ (Jan 1998=100)
TOL (Jan 2003=100)
BDI (Jan 2006=100)
Tech / Stock Bubble Housing BubbleCommodities / Trade Bubble
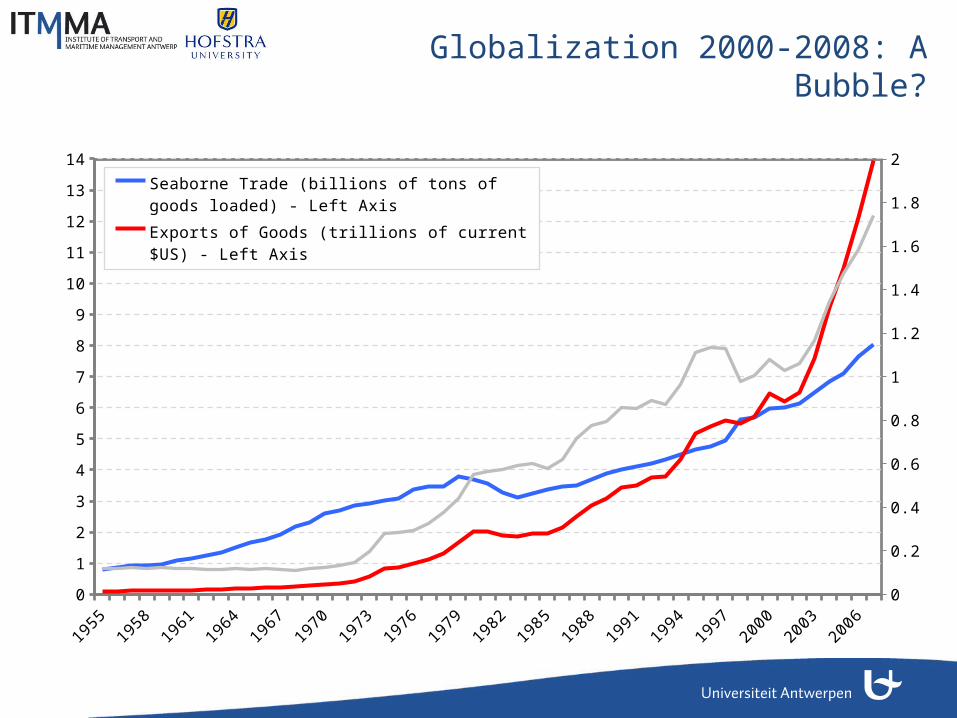
Globalization 2000-2008: A Bubble?
1955
1957
1959
1961
1963
1965
1967
1969
1971
1973
1975
1977
1979
1981
1983
1985
1987
1989
1991
1993
1995
1997
1999
2001
2003
2005
2007
0
1
2
3
4
5
6
7
8
9
10
11
12
13
14
0
0.2
0.4
0.6
0.8
1
1.2
1.4
1.6
1.8
2
Seaborne Trade (billions of tons of goods loaded) - Left Axis
Exports of Goods (trillions of current $US) - Left Axis
Ratio Exports / Seaborne Trade - Right Axis
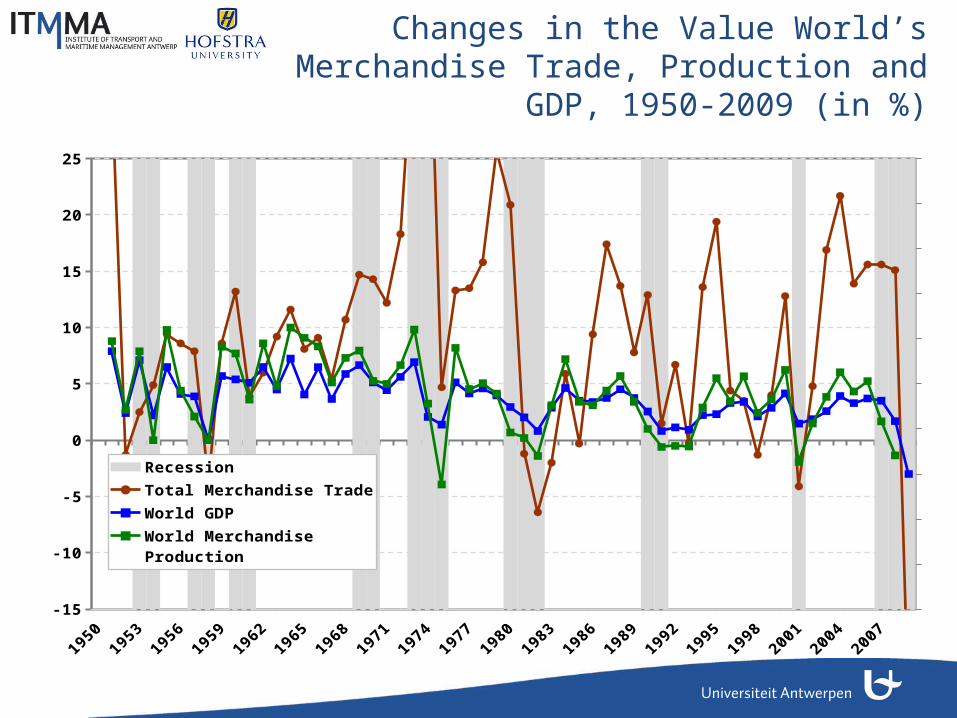
Changes in the Value World’s Merchandise Trade, Production and GDP,
1950-2009 (in %)
-15
-10
-5
0
5
10
15
20
25
Recession
Total Merchandise Trade
World GDP
World Merchandise Production
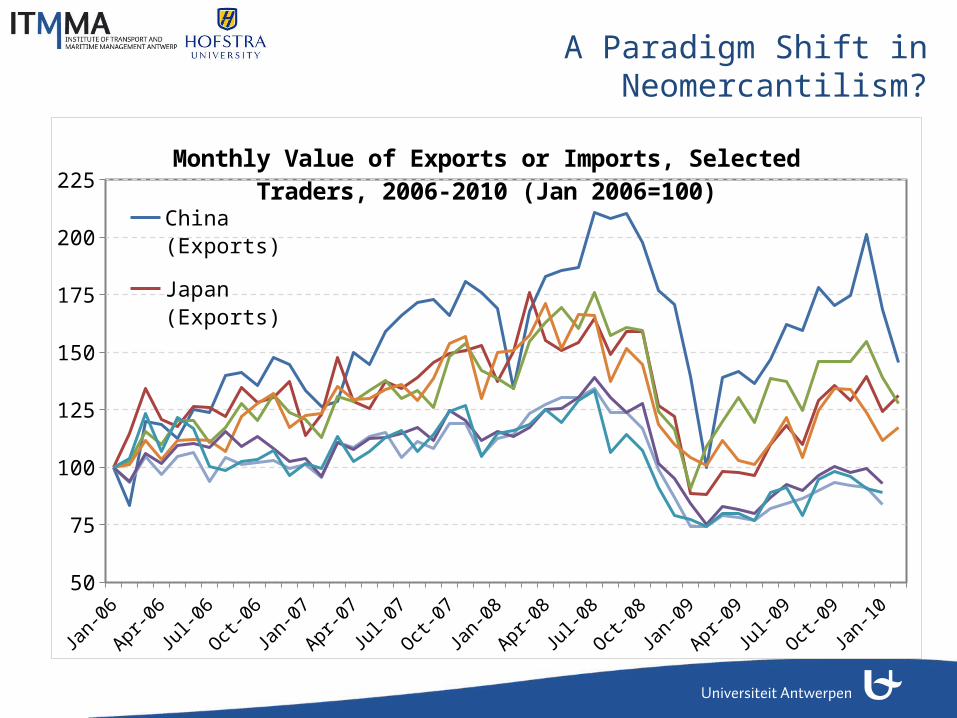
A Paradigm Shift in Neomercantilism?
Jan-0
6
Mar-06
May-06
Jul-0
6
Sep-06
Nov-06Ja
n-07
Mar-07
May-07
Jul-0
7
Sep-07
Nov-07Ja
n-08
Mar-08
May-08
Jul-0
8
Sep-08
Nov-08Ja
n-09
Mar-09
May-09
Jul-0
9
Sep-09
Nov-09Ja
n-10
50
75
100
125
150
175
200
225Monthly Value of Exports or Imports, Selected Traders, 2006-2010 (Jan
2006=100)China (Exports)Japan (Exports)Korea (Exports)Germany (Exports)Canada (Exports)USA (Imports)UK (Imports)
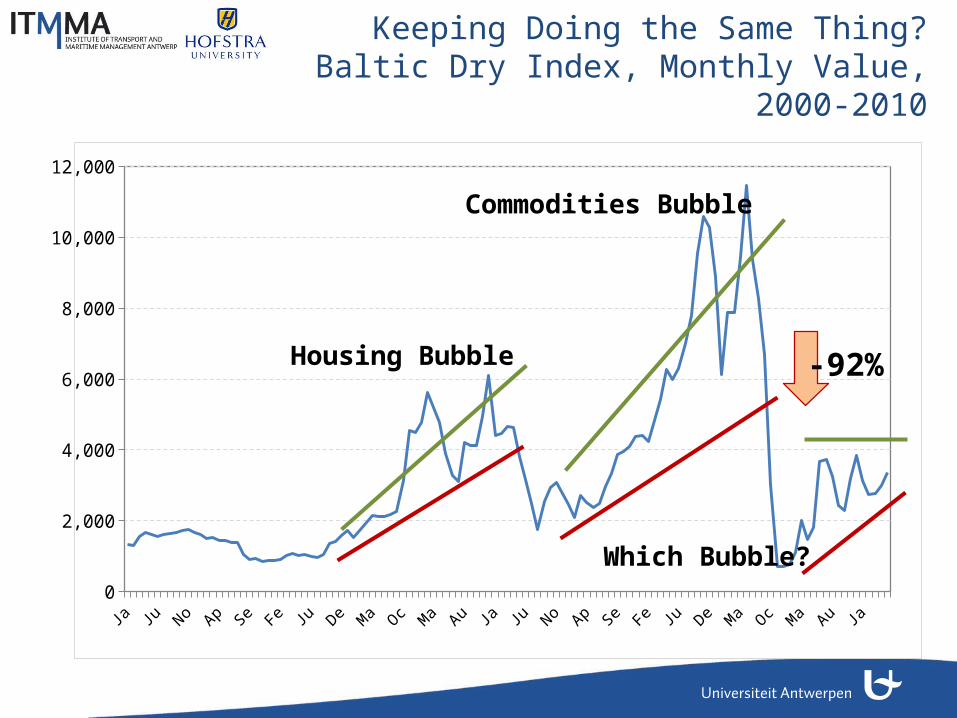
Keeping Doing the Same Thing? Baltic Dry Index, Monthly Value, 2000-2010
0
2,000
4,000
6,000
8,000
10,000
12,000
-92%Housing Bubble
Commodities Bubble
Which Bubble?
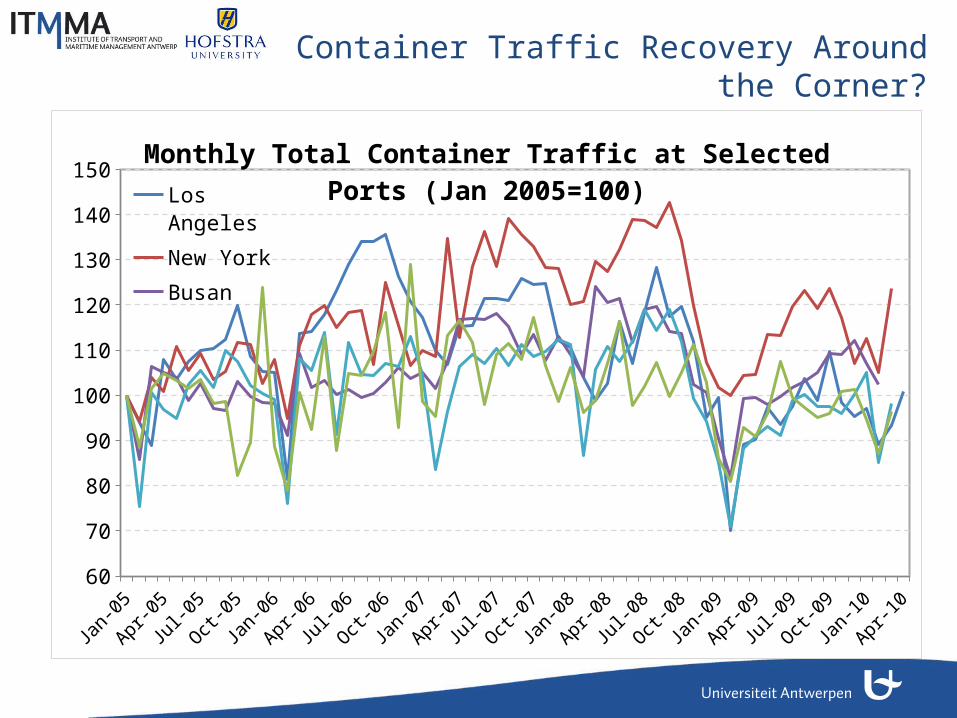
Container Traffic Recovery Around the Corner?
Jan-0
5Apr-
05Ju
l-05
Oct-05
Jan-0
6Apr-
06Ju
l-06
Oct-06
Jan-0
7Apr-
07Ju
l-07
Oct-07
Jan-0
8Apr-
08Ju
l-08
Oct-08
Jan-0
9Apr-
09Ju
l-09
Oct-09
Jan-1
0Apr-
1060
70
80
90
100
110
120
130
140
150Monthly Total Container Traffic at Selected Ports (Jan 2005=100)
Los AngelesNew YorkBusanHong KongAlgeciras
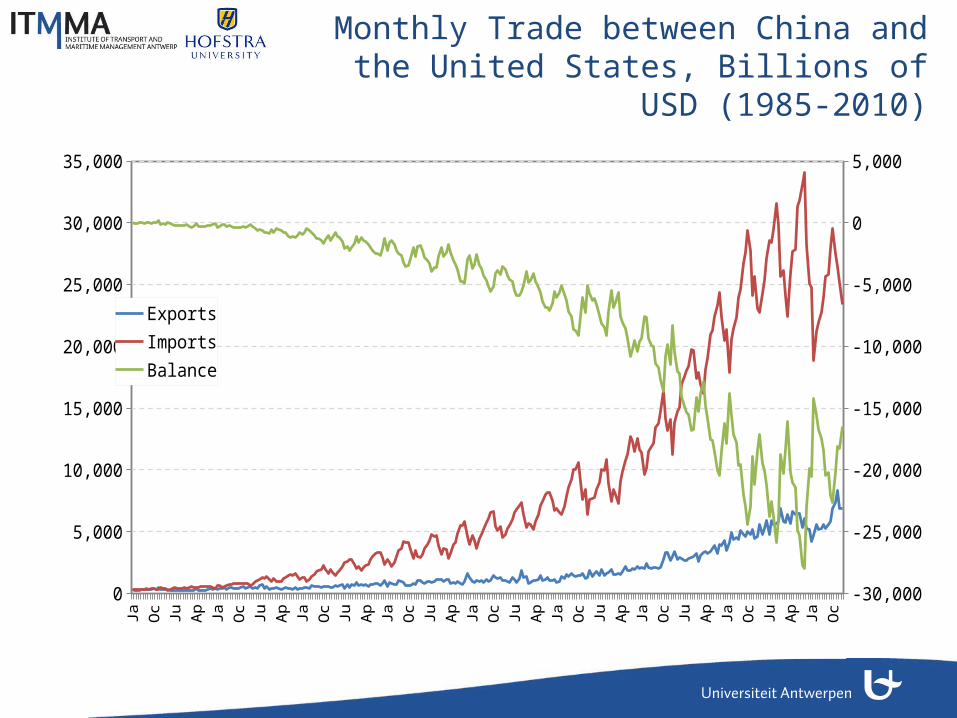
Monthly Trade between China and the United States, Billions of USD (1985-
2010)Ja
n-85
Jan-
86
Jan-
87
Jan-
88
Jan-
89
Jan-
90
Jan-
91
Jan-
92
Jan-
93
Jan-
94
Jan-
95
Jan-
96
Jan-
97
Jan-
98
Jan-
99
Jan-
00
Jan-
01
Jan-
02
Jan-
03
Jan-
04
Jan-
05
Jan-
06
Jan-
07
Jan-
08
Jan-
09
Jan-
10
0
5,000
10,000
15,000
20,000
25,000
30,000
35,000
-30,000
-25,000
-20,000
-15,000
-10,000
-5,000
0
5,000
ExportsImportsBalance
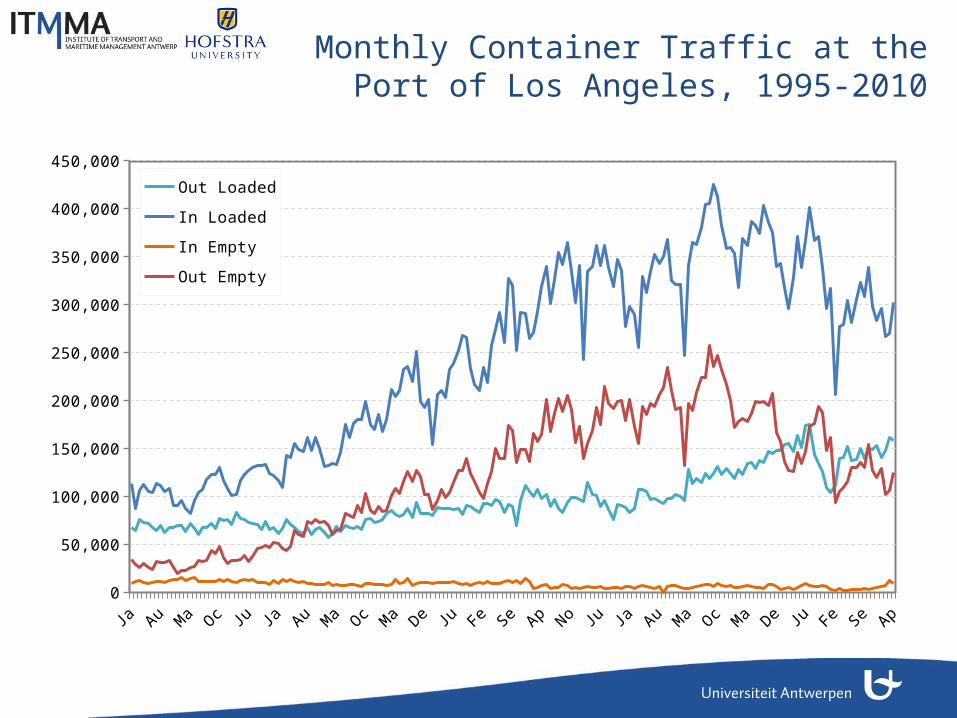
Monthly Container Traffic at the Port of Los Angeles, 1995-2010
Jan-9
5Ju
l-95Ja
n-96Ju
l-96Ja
n-97Ju
l-97Ja
n-98Ju
l-98Ja
n-99Ju
l-99Ja
n-00Ju
l-00Ja
n-01Ju
l-01Ja
n-02Ju
l-02Ja
n-03Ju
l-03Ja
n-04Ju
l-04Ja
n-05Ju
l-05Ja
n-06Ju
l-06Ja
n-07Ju
l-07Ja
n-08Ju
l-08Ja
n-09Ju
l-09Ja
n-10
0
50,000
100,000
150,000
200,000
250,000
300,000
350,000
400,000
450,000
Out Loaded
In Loaded
In Empty
Out Empty
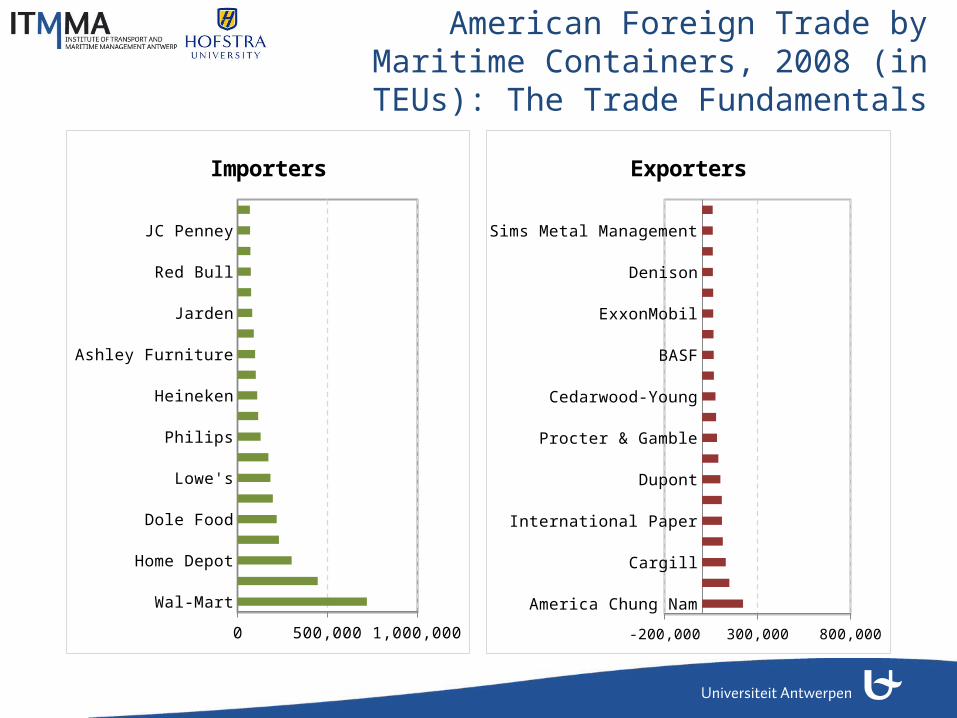
Wal-MartTarget
Home DepotSears Holding
Dole FoodCostco Wholsale
Lowe'sLG Group
PhilipsChiquita
HeinekenIkea
Ashley FurnitureGeneral Electric
JardenSamsungRed Bull
NikeJC Penney
Whirlpool
0 200,000 400,000 600,000 800,000
Importers
America Chung NamWeyerhaeuser
CargillKoch Industries
International PaperDow Chemical
DupontPotential Industries
Procter & GambleMeadwestvaco
Cedarwood-YoungArcher Daniels Midland
BASFDelong
ExxonMobilJC Horizon
DenisonCGB Enterprises
Sims Metal ManagementNewport Chinternational
0 200,000 400,000 600,000 800,000
Exporters
American Foreign Trade by Maritime Containers, 2008 (in TEUs): The Trade
Fundamentals
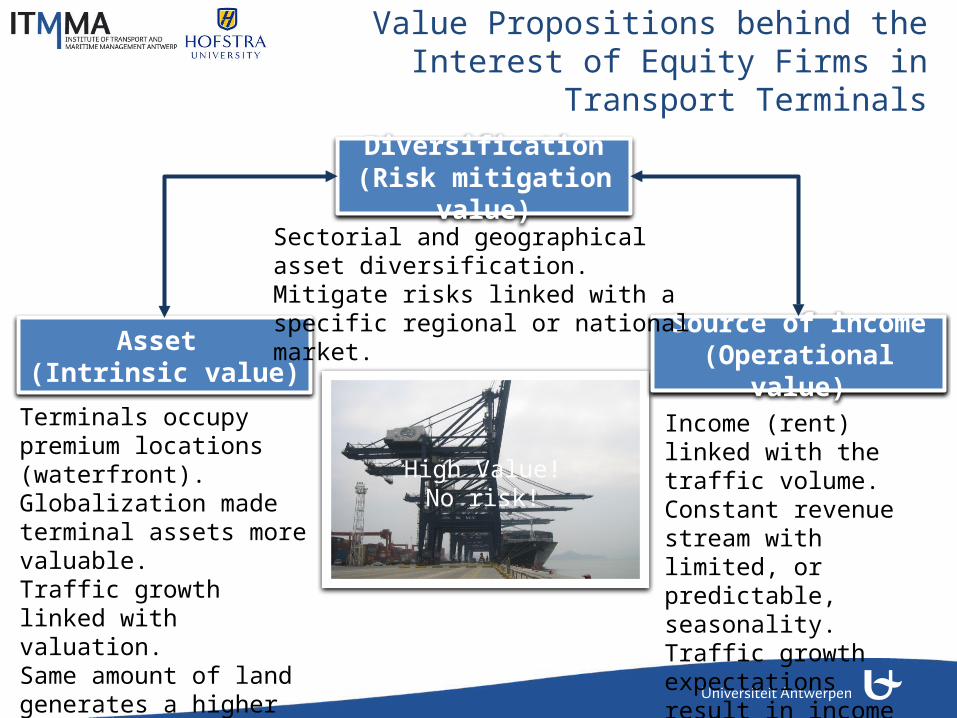
Value Propositions behind the Interest of Equity Firms in Transport Terminals
Diversification(Risk mitigation value)
Source of income(Operational value)
Asset (Intrinsic value)
Terminals occupy premium locations (waterfront).Globalization made terminal assets more valuable.Traffic growth linked with valuation.Same amount of land generates a higher income.Terminals as fairly liquid assets.
Income (rent) linked with the traffic volume.Constant revenue stream with limited, or predictable, seasonality.Traffic growth expectations result in income growth expectations.
Sectorial and geographical asset diversification.Mitigate risks linked with a specific regional or national market.
High Value!No risk!
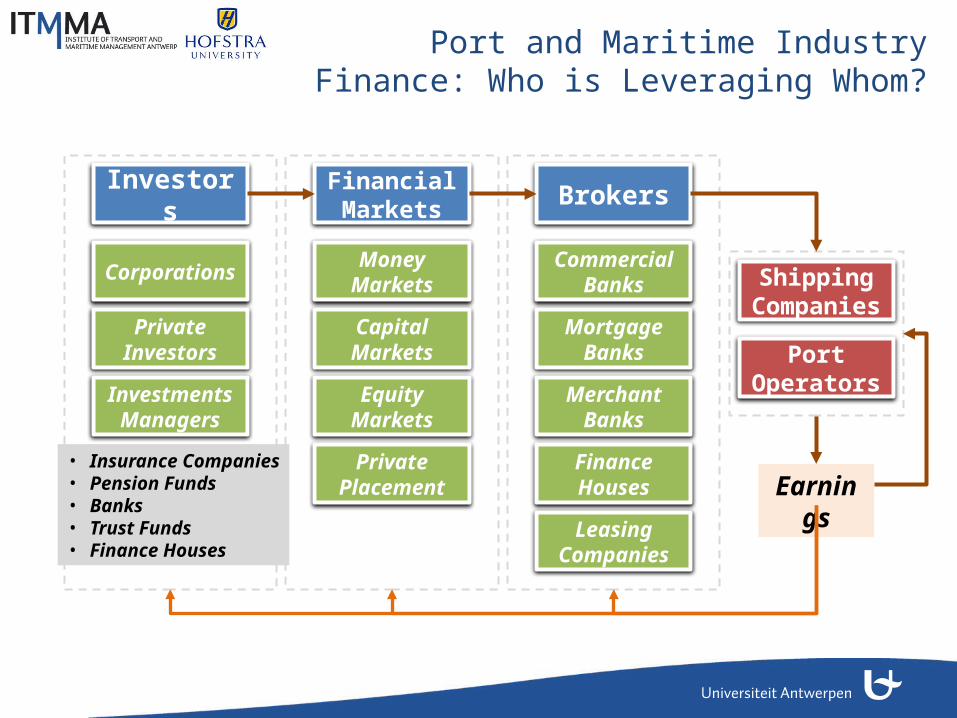
Port and Maritime Industry Finance: Who is Leveraging Whom?
BrokersFinancial MarketsInvestors
Commercial Banks
Mortgage Banks
Merchant Banks
Finance Houses
Leasing Companies
Money Markets
Capital Markets
Equity Markets
Private Placement
Corporations
Private Investors
Investments Managers
• Insurance Companies• Pension Funds• Banks• Trust Funds• Finance Houses
Shipping Companies
Port Operators
Earnings
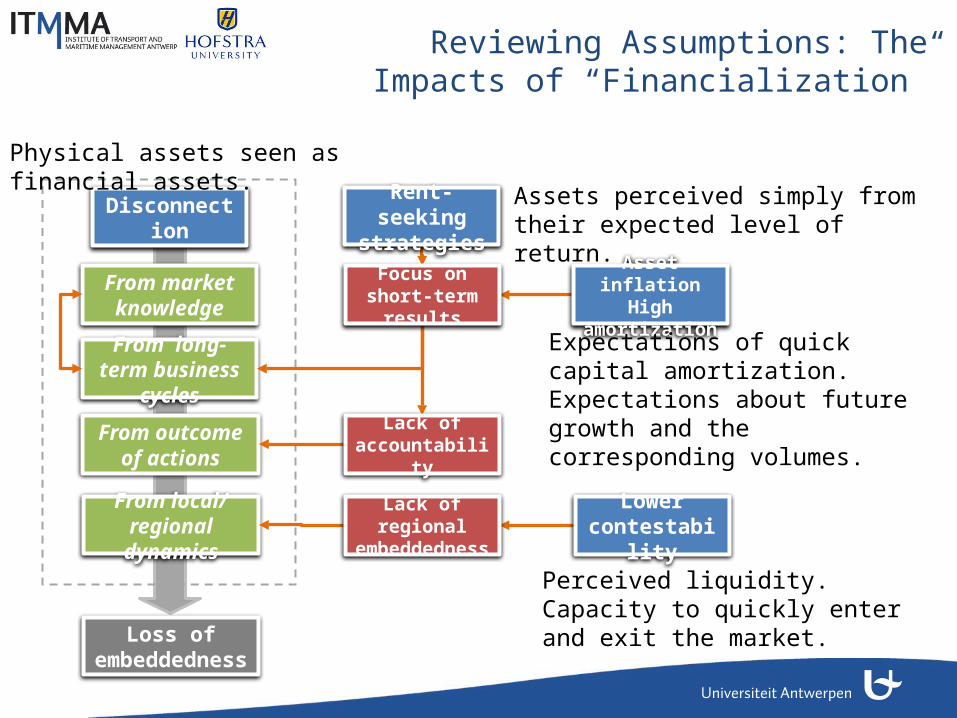
Reviewing Assumptions: The Impacts of “Financialization”
Disconnection
From market knowledge
From long-term business cycles
From local/ regional dynamics
From outcome of actions
Loss of embeddedness
Lower contestability
Rent-seeking strategies
Lack of accountability
Lack of regional embeddedness
Focus on short-term results
Asset inflationHigh amortization
Assets perceived simply from their expected level of return.
Expectations of quick capital amortization.Expectations about future growth and the corresponding volumes.
Perceived liquidity.Capacity to quickly enter and exit the market.
Physical assets seen as financial assets.
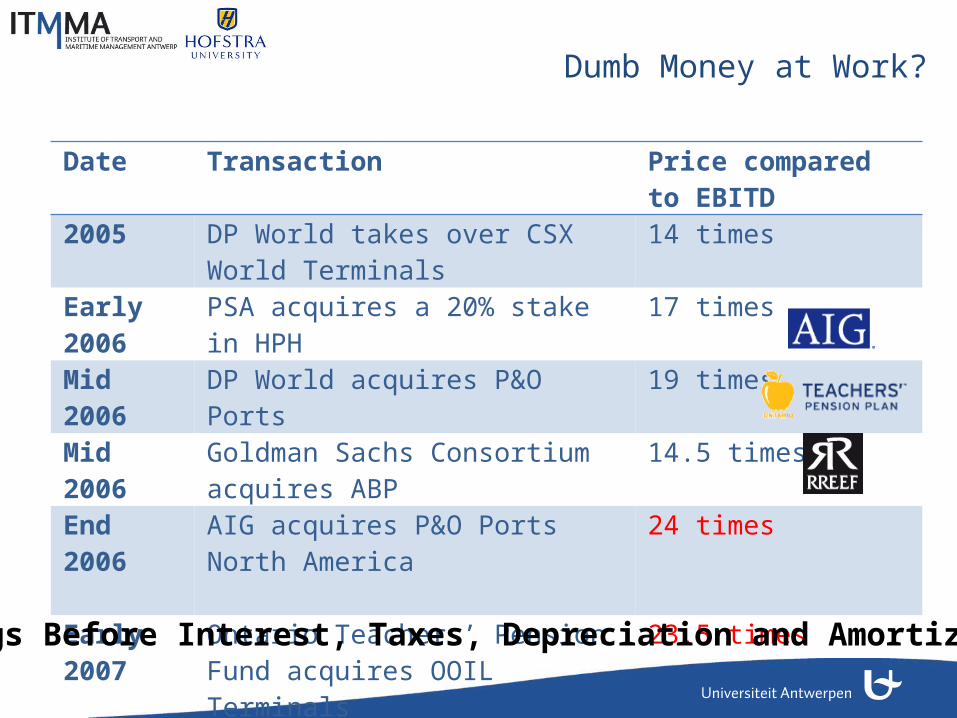
Dumb Money at Work?
Date Transaction Price compared to EBITD2005 DP World takes over CSX World Terminals 14 timesEarly 2006 PSA acquires a 20% stake in HPH 17 timesMid 2006 DP World acquires P&O Ports 19 timesMid 2006 Goldman Sachs Consortium acquires ABP 14.5 timesEnd 2006 AIG acquires P&O Ports North America 24 times
Early 2007 Ontario Teachers’ Pension Fund acquires OOIL Terminals
23.5 times
Mid 2007 RREEF acquires Maher Terminals 25 times
EBITDA = Earnings Before Interest, Taxes, Depreciation and Amortization
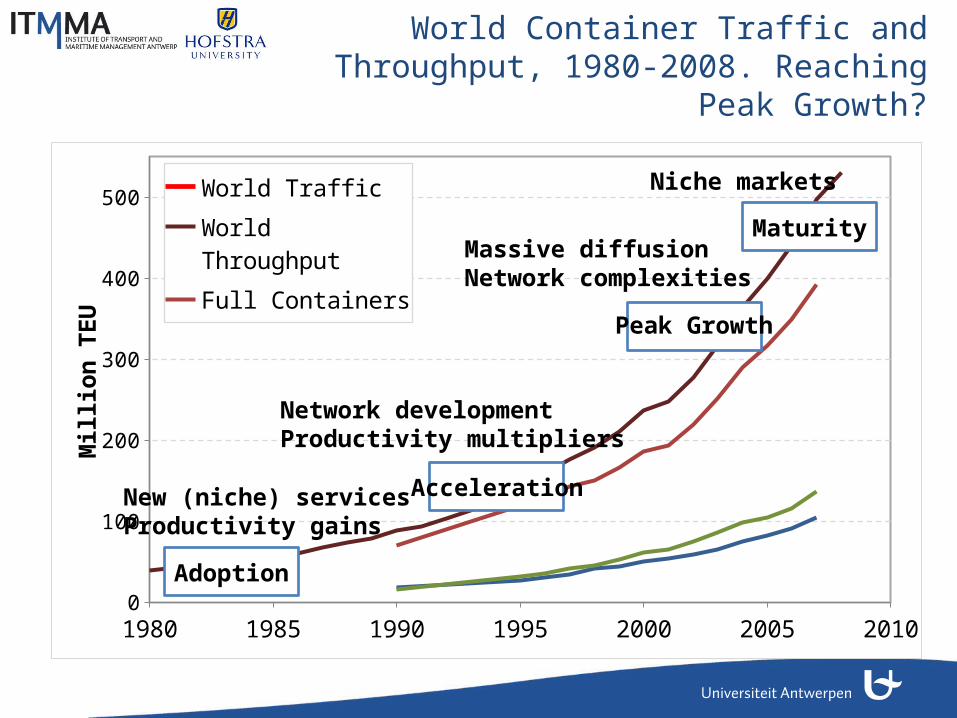
World Container Traffic and Throughput, 1980-2008. Reaching Peak Growth?
1980 1985 1990 1995 2000 2005 20100
100
200
300
400
500World TrafficWorld ThroughputFull ContainersTransshipmentEmpty Containers
Mill
ion
TEU
Adoption
Acceleration
Peak Growth
Maturity
New (niche) servicesProductivity gains
Network developmentProductivity multipliers
Massive diffusionNetwork complexities
Niche markets

Fallacies of Forecasting: 2020 Throughput Forecast, Selected Large
Ports, Linear and CAG ScenarioPort / Traffic 2007, M TEU
R2 / CAG (1998-2007) Traffic 2020 (Linear Scenario) / CAG
Traffic 2020 (CAG 1998-2007 Scenario)
New York / 5.3 0.996 / +7.9% 9.6 M TEU / +4.7% 14.2 M TEU
Savannah / 2.6 0.968 / +13.5% 4.9 M TEU / +5.1% 13.6 M TEU
Los Angeles / 8.3 0.966 / +9.5% 16.6 M TEU / +5.4% 27.1 M TEU
Antwerp / 8.2 0.974 / +9.6% 14.5 M TEU / +4.5% 26.9 M TEU
Algeciras / 3.4 0.961 / +6.5% 6.0 M TEU / +4.4% 7.7 M TEU
Busan /13.3 0.983 / +8.4% 24.3 M TEU / +4.8% 38.1 M TEU
Shanghai / 26.1 0.948 / +23.9% 56.5 M TEU / +6.1% 423.8 M TEU
From under estimating to over estimating trendsLinearity prevalent in growth trends (1998-2007)Compound annual growth common in forecastsNon-contestability assumption
Advanced forecasting(c. 2007)
If you build it they will come…
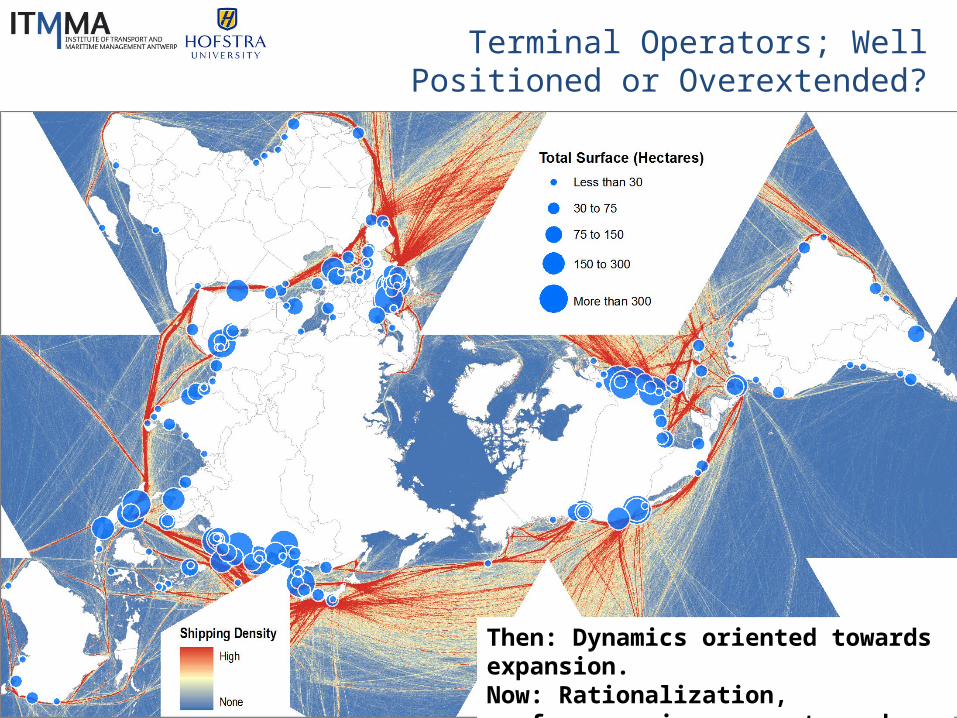
Terminal Operators; Well Positioned or Overextended?
Then: Dynamics oriented towards expansion.Now: Rationalization, performance improvements and the search for niche markets.
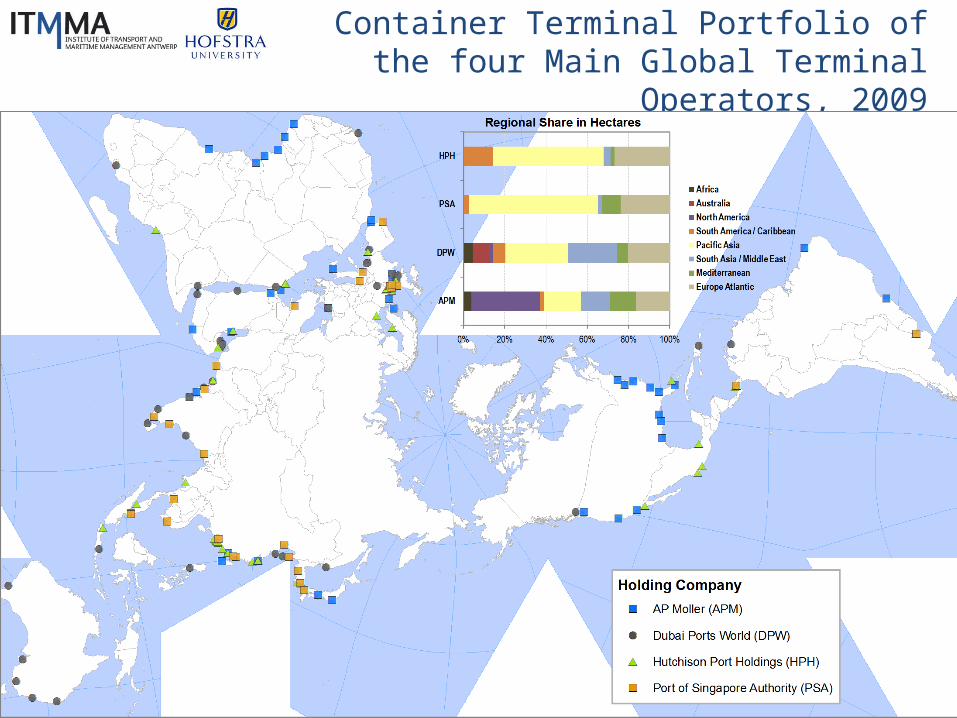
Container Terminal Portfolio of the four Main Global Terminal Operators, 2009
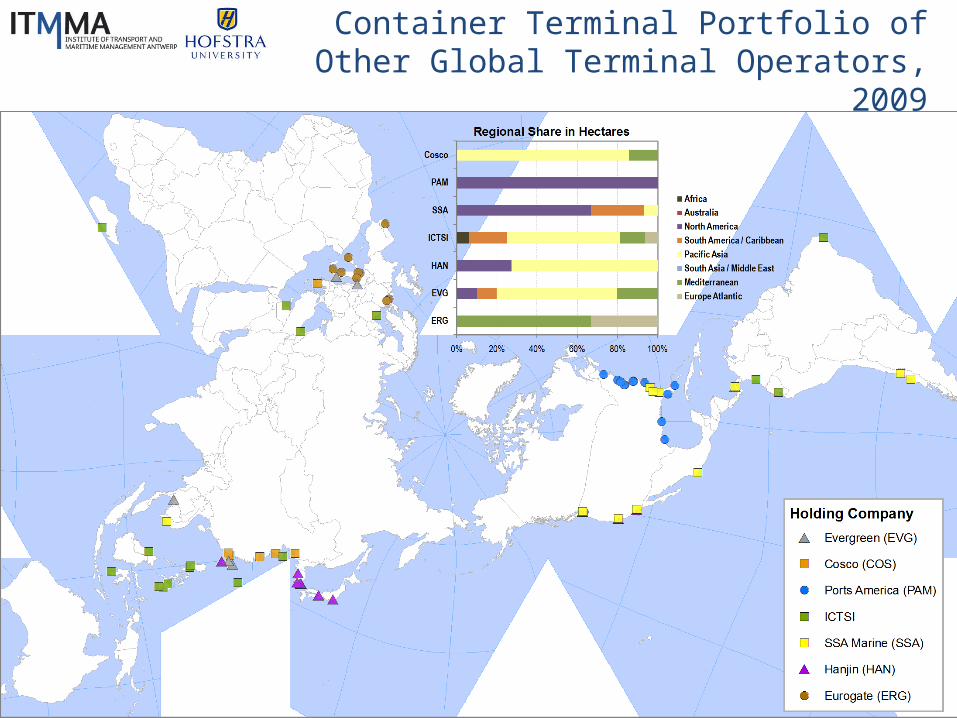
Container Terminal Portfolio of Other Global Terminal Operators, 2009
Conclusion: Beware of Future Expectations
• Intense phase of capital accumulation in the shipping and port sectors.
• Some of the growth expectations based on unsubstantiated assumptions.
• “Financialization” transformed the industry and expanded misallocations.
• What could be some specific consequences on the maritime industry?
It’s the debt stupid…