1
Literature 1 - Rulík, P., Malátová, I., Bučina, I.: Aerosol Particle Size Distribution in Dependence on the Type of Radionuclide after the Chernobyl Akcident and in the NPP Efluents, The Radioecology of Natural and Artificial Radionuclides, Proceedings of the 15 th Regional Congress of IRPA, Visby, Gotland, Sweden, 10.-14.9.1989, pp 102-107, ISSN 1013-4506 2 -Hinds, W.C ., Aerosol Technology: properties, behavior and measurement of airborne particles, J. Wiley-Interscience Publication, John Wiley & Sons, Inc., (1999), ISBN 0-471-19410-7. 3 - Dorrian, M .D .: Particle size distributions of radioactive aerosols in the environment, Radiation Protection Dosimetry 69 (2):117-132 (1997). 4 -Kinoshita, N. e t al. : Assessment of individual radionuclide distributions from the Fukushima nuclear accident covering central-east Japan. Ed.: HANSEN, J. E. Proceedings of the National Academy of Sciences of the USA. 2011, 108 (49): 19526 – 29. 5 -Reineking, A., Beckert, K. H., Porstendörfer, J.: Air Activity Concentrations and Particle Size Distributions of the Chernobyl Aerosol. Radiation Protection Dosimetry. 1987, 19, 3, s. 159-163. Tab.1: Fukushima - The AMADs and the GSDs for the individual samplings 5. Discussion The total activity concentrations after the Fukushima accident (FA) of 131 I were in the order of magnitude 10 -4 10 -3 Bq/m 3 , 134 Cs and 137 Cs in the order of magnitude 10 -5 – 10 -4 Bq/m 3 . They were 1000 times lower than after the Chernobyl accident (CA). Time courses of the activities after the CA and after the FA were different, the former defined sharply, whereas after the FA the relatively low activities gradually decreased, Fig.5 Only for volatile radionuclides 131 I, 134 Cs and 137 Cs the size distributions were determined after the FA. After the CA the size distributions for volatile ( 134 Cs, 137 Cs, 103 Ru, 106 Ru, 131 I, 132 Te) and also for refractory radionuclides ( 140 Ba, 140 La, 141 Ce, 144 Ce, 95 Zr, 95 Nb) were determined The character of most distributions (of all samplings after the FA) was similar, they were almost monomodal with the maximum of the activity at the smallest fraction (less than 0.49 µm), the minimum of the activity was attached to the particles of larger aerodynamic diameters (AD > 3 µm) , Fig.2. The character of most distributions (of samplings after the CA of the same radionuclides) was also similar – monomodal; except the 1 st sampling on 4 th May 1986 which was bimodal with the border around 0,5 µm, Fig.3 The aerosol particles with AD < 0.49 μm contained usually more than 40% of the activity after the FA and after the CA, too The aerosol particles with AD > 3 μm determined after the FA contained less than 10% of the activity, Fig.2, after the CA less than 15% of the activity, Fig.3 The AMADs after the FA ranged from 0.2 μm to 0.8 μm, the AMADs of volatile radionuclides – 131 I, 134 Cs and 137 Cs after the CA ranged from 0.1 μm to 1.0 μm , Tab.1 The geom. mean of AMADs for 131 I, 134 Cs and 137 Cs after the FA was 0.4 µm, the geom. mean of volatile radionuclides after the CA was 0.5 µm GSD values were usually from 3 to 4 μm and showed a slight increase and AMADs slightly declined during the monitored period after the FA. After the CA the GSD values were similar for the 1st month after the CA and then grew larger with time, the decline of AMADs was not observed, Fig.5 The mean of 134 Cs/ 137 Cs activity ratio after the FA was 0.9; the coincident corrections were done; after the CA the ratio was 1.8 The combined uncertainty of the AMADs was about 30% in most samples Obtained values agree well with published results [3-5] 2. Objectives To determine distribution of activities of the individual radionuclides released from the NPP Fukushima in dependence on aerosol size distribution. To compare these results with the results obtained after the Chernobyl accident. 3. Methods and equipment The samplings were carried out by 3 five-stage cascade impactors (CI, Sierra Instruments Inc., Model SA 236) connected to the pump and the flow controller. Aerosols were collected on collection substrates placed on individual stages and on the back-up filter situated after the last stage. After the end of each sampling the wipes from the inner surfaces of the impactors were taken to estimate the interstage losses. The collection substrates were measured (separately from individual stages, but combined from parallel samplings), by gamma-spectrometry (HPGe detectors). The results were used to evaluate the particle size distribution for individual radionuclides in terms of the activity median aerodynamic diameter (AMAD) and its geometric standard deviation (GSD) on the assumption of log-normal distribution of the data in agreement with [2]. 4. Results THE PARTICLE SIZE DISTRIBUTIONS OF RADIOACTIVE AEROSOLS IN PRAGUE AFTER THE FUKUSHIMA ACCIDENT Helena Malá, Petr Rulík, Ján Mihalík, Miroslav Hýža [email protected] National Radiation Protection Institute (SÚRO), Prague, Czech Republic The combined uncertainty of the AMADs consists of the following errors and uncertainties: the flow rate and its (un)stability in the sampler, interstages losses on the inner walls of the CI, rebounds of the dropped particles and removal of the already caught particles to the air stream thus displacing them from the higher stages to the lower ones, the gamma-spectrometric analysis (measurements of very low activities) The total uncertainty of the AMADs was estimated as about 30%. Fig.5: The total activity concentrations of 131 I, 134 Cs, 137 Cs , the AMADs and the GSDs for the individual sampling periods Fig.4: The AMADs of 131 I, 134 Cs, 137 Cs in log-normal quantile plot – an example Fukushima Chernobyl Fig.3: Chernobyl - The fractions of the activity concentrations (in %) of 131 I, 134 Cs, 137 Cs in the size intervals of the AD (in µm) for 9 sampling periods from 4 th May to 20 th June 1986 ddd Notes AD - aerodynamic diameter AMAD - activity median aerodynamic diameter CI - cascade impactor GSD - geometric standard deviation MSA - minimum significant activity Fig.2: Fukushima - The fractions of the activity concentrations of 131 I, 134 Cs, 137 Cs and for comparison 7 Be (in %) in the size intervals of the AD (in µm) for 5 sampling periods from 24 th March to 13 th April 2011 CZECH REPUBLIC Fukushima Chernobyl 131 I 134 Cs 137 Cs 7 Be Sampling No 1 AMAD [ µm ] 0.34 0.73 0.54 0.55 GSD 3.69 3.00 4.07 2.62 Sampling No 2 AMAD [ µm ] 0.28 0.66 0.71 0.43 GSD 3.58 2.55 2.30 2.74 Sampling No 3 AMAD [ µm ] 0.29 0.41 0.43 0.44 GSD 4.02 4.43 4.10 3.19 Sampling No 4 AMAD [ µm ] 0.37 0.26 0.32 0.33 GSD 3,61 3.66 3.44 3.36 Sampling No 5 AMAD [ µm ] 0.44 0.20 0.28 0.28 GSD 3.68 3.90 4.20 3.30 Geom. mean from L-N AMAD [ µm ] 0.34 0.40 0.43 0.39 GSD 3.71 3.44 3.54 3.03 Fig.1: CI, dismounted a sampling head of CI, a filter from an individual stage and a back-up filter Foto: P.Rulík. CR 1. Introduction The radiological importance of the radioactive aerosol particles depends not only on the kind of the radionuclide and its chemical form but also on the aerodynamic properties of the particles, mainly on their size. After the Fukushima Dai-Ichi Nuclear Power Plant (NPP) accident the aerosol particle size distribution associated with the radionuclides transported by air to the Czech Republic was investigated (in the time period from 24 th March to 13 th April 2011 five sets of samplings were performed). The results were compared with the data obtained in May and June 1986 following the Chernobyl accident (9 samplings from 4 th May to 20 th June 1986). The aerosol samplings and measurements were done by the same methods [1] . 6. Conclusions The distance Prague–Fukushima is 10 times longer than the distance Prague-Chernobyl, therefore the particle size distribution derived from the FA was influenced by processes in the atmosphere for longer time than the particle size distribution from the CA. After the FA only for 3 volatile radionuclides the particle size distribution was determined: 131 I, 134 Cs and 137 Cs. After the CA two types of radionuclides were observed: refractory and volatile, with different particle size distributions. The activities after the CA were much higher then after the FA. The sampling period after the CA was almost 50 days (9 samplings), after the FA only 20 days (5 samplings). Despite the different conditions of formation, motion and behaviour of aerosol in the atmosphere, almost the same size distribution of the aerosol particles containing these volatile radionuclides was found with very similar values of parameters: mean AMAD 0.4 - 0.5 µm, GSD between 3 and 4 and with more than 40% of the activity connected with particles with AD < 0.49 μm.

THE PARTICLE SIZE DISTRIBUTIONS OF RADIOACTIVE …

  • Upload
    others

  • View
    3

  • Download
    0

Embed Size (px)

Citation preview

Literature

1 -Rulík, P., Malátová, I., Bučina, I.: Aerosol Particle Size Distribution in Dependence on the Type of Radionuclide after the Chernobyl Akcident and in the NPP Efluents, The Radioecology of Natural and Artificial Radionuclides, Proceedings of the 15th Regional Congress of IRPA, Visby, Gotland, Sweden, 10.-14.9.1989, pp 102-107, ISSN 1013-45062 -Hinds, W.C., Aerosol Technology: properties, behavior and measurement of airborne particles, J. Wiley-Interscience Publication, John Wiley & Sons, Inc., (1999), ISBN 0-471-19410-7.3 -Dorrian, M.D.: Particle size distributions of radioactive aerosols in the environment, Radiation Protection Dosimetry 69 (2):117-132 (1997).4 -Kinoshita, N. et al.: Assessment of individual radionuclide distributions from the Fukushima nuclear accident covering central-east Japan. Ed.: HANSEN, J. E. Proceedings of the National Academy of Sciences of the USA. 2011, 108 (49): 19526 – 29. 5 -Reineking, A., Beckert, K. H., Porstendörfer, J.: Air Activity Concentrations and Particle Size Distributions of the Chernobyl Aerosol. Radiation Protection Dosimetry. 1987, 19, 3, s. 159-163.

Tab.1: Fukushima - The AMADs and the GSDs for the individual samplings

5. Discussion

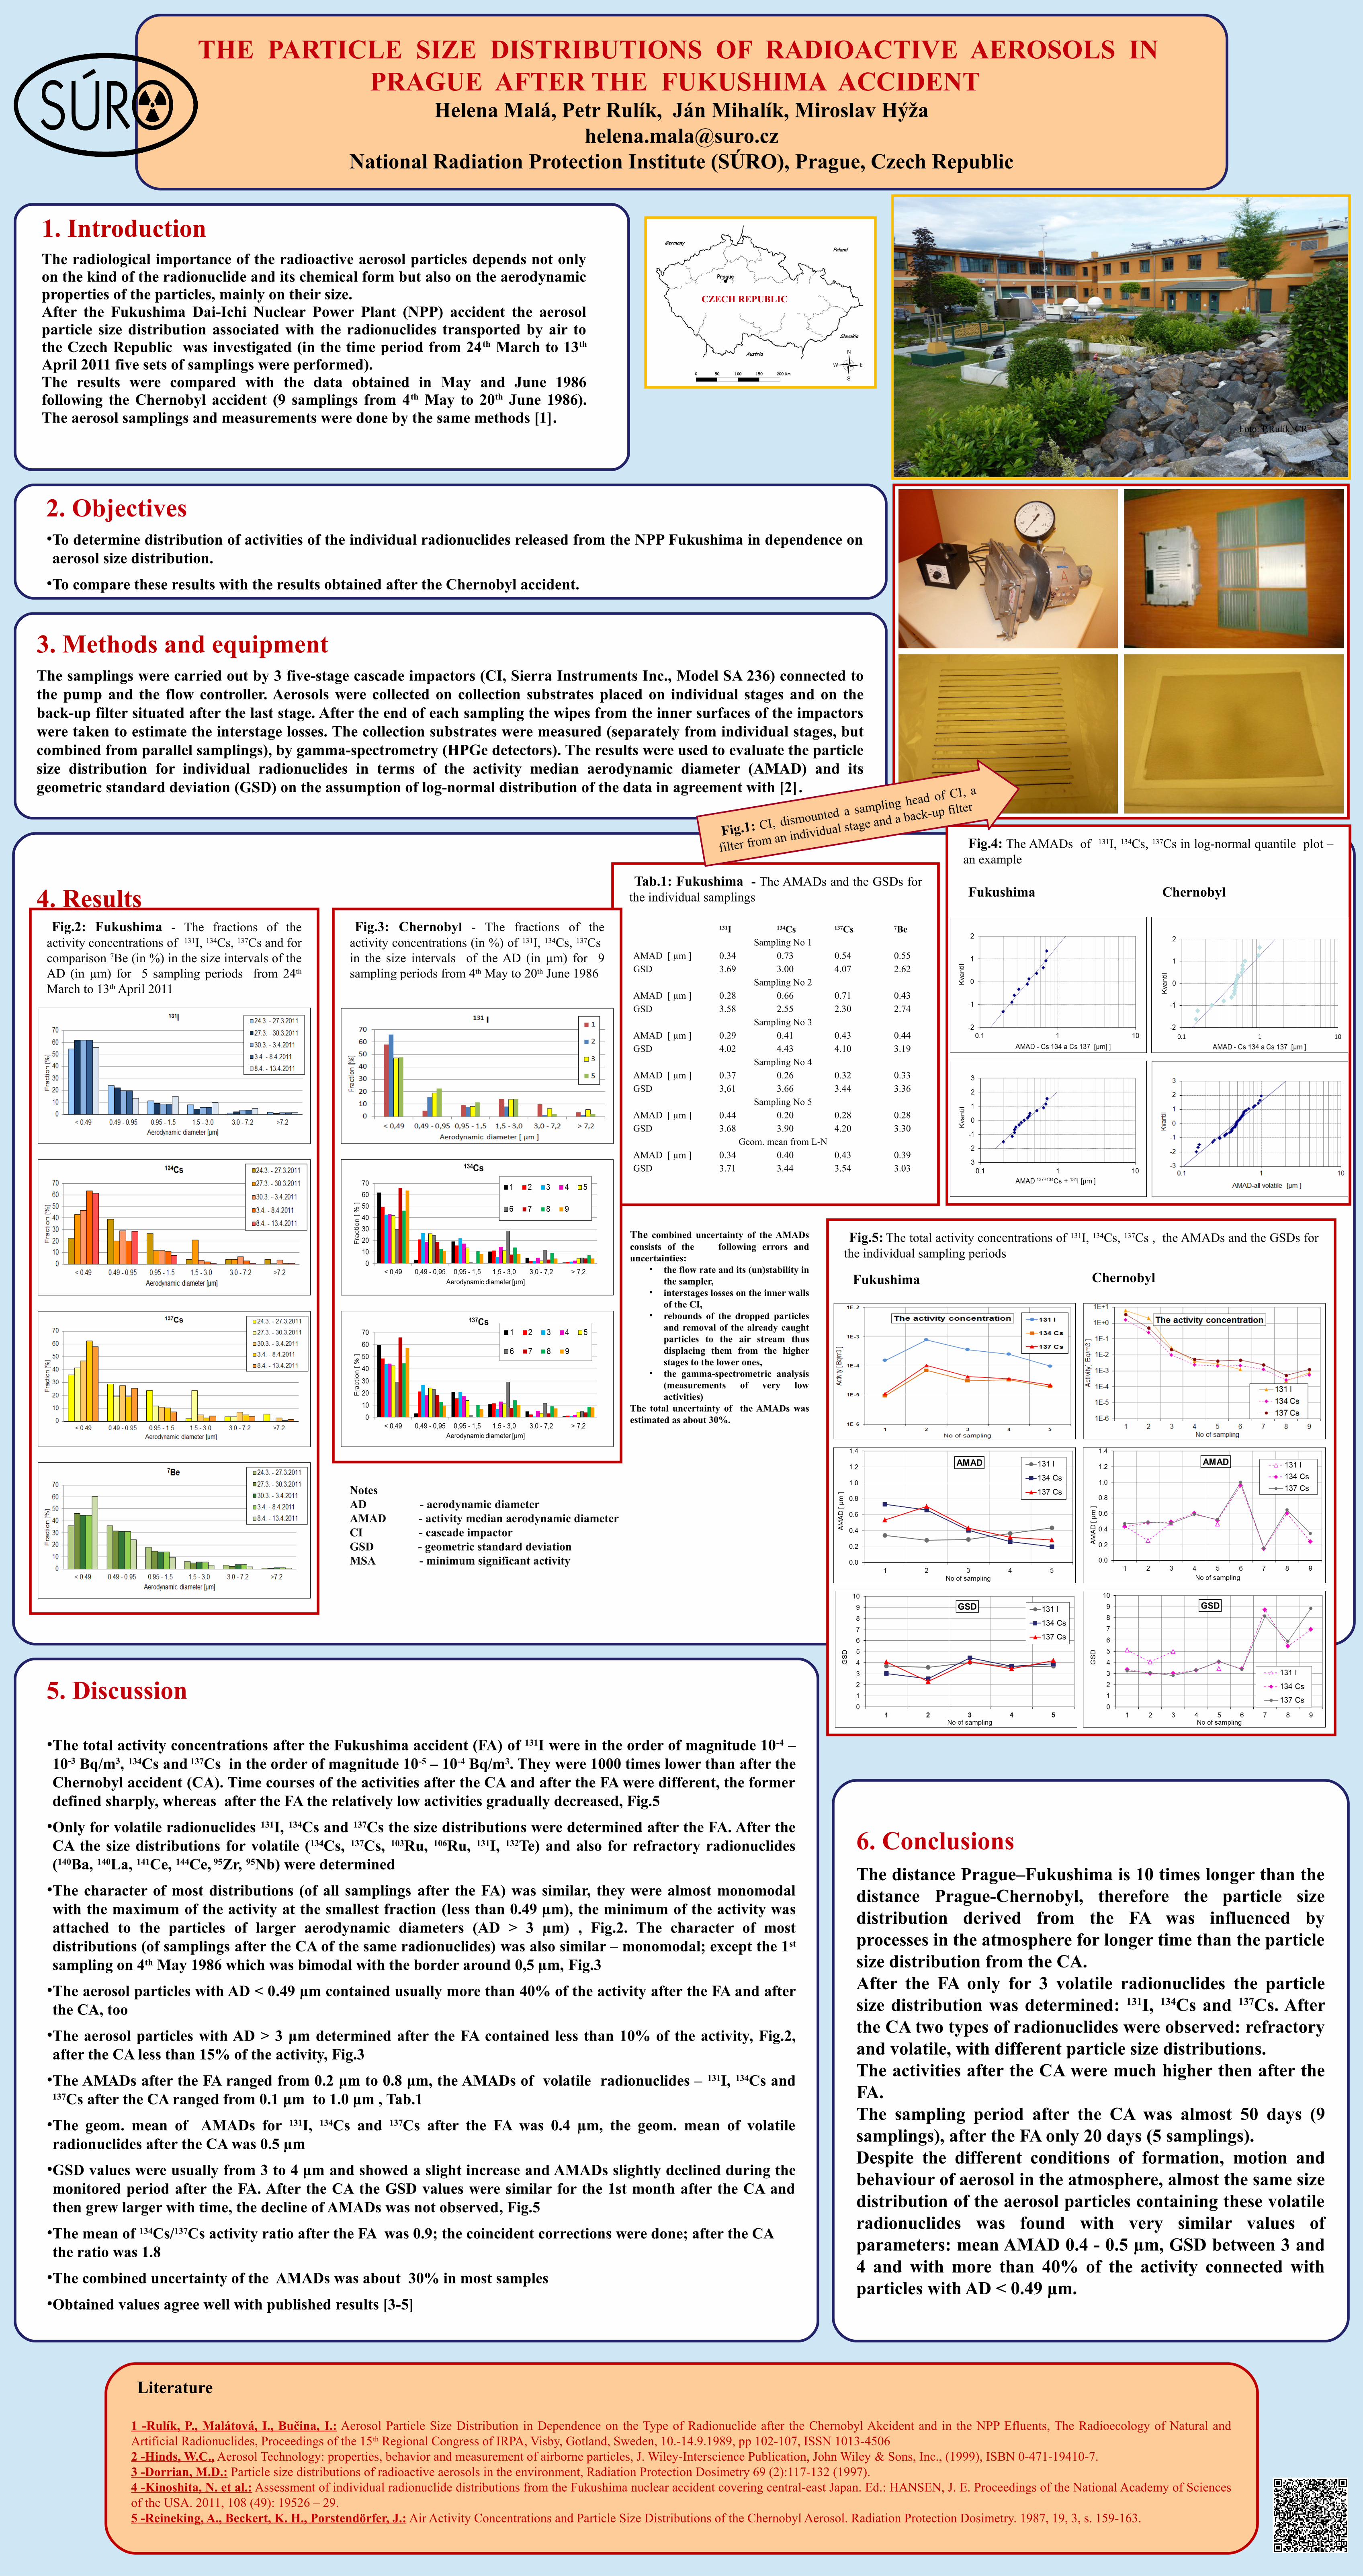
●The total activity concentrations after the Fukushima accident (FA) of 131I were in the order of magnitude 10-4 –10-3 Bq/m3, 134Cs and 137Cs in the order of magnitude 10-5 – 10-4 Bq/m3. They were 1000 times lower than after the Chernobyl accident (CA). Time courses of the activities after the CA and after the FA were different, the former defined sharply, whereas after the FA the relatively low activities gradually decreased, Fig.5

●Only for volatile radionuclides 131I, 134Cs and 137Cs the size distributions were determined after the FA. After the CA the size distributions for volatile (134Cs, 137Cs, 103Ru, 106Ru, 131I, 132Te) and also for refractory radionuclides (140Ba, 140La, 141Ce, 144Ce, 95Zr, 95Nb) were determined

●The character of most distributions (of all samplings after the FA) was similar, they were almost monomodal with the maximum of the activity at the smallest fraction (less than 0.49 µm), the minimum of the activity was attached to the particles of larger aerodynamic diameters (AD > 3 µm) , Fig.2. The character of most distributions (of samplings after the CA of the same radionuclides) was also similar – monomodal; except the 1st sampling on 4th May 1986 which was bimodal with the border around 0,5 µm, Fig.3

●The aerosol particles with AD < 0.49 μm contained usually more than 40% of the activity after the FA and after the CA, too

●The aerosol particles with AD > 3 μm determined after the FA contained less than 10% of the activity, Fig.2, after the CA less than 15% of the activity, Fig.3

●The AMADs after the FA ranged from 0.2 μm to 0.8 μm, the AMADs of volatile radionuclides – 131I, 134Cs and 137Cs after the CA ranged from 0.1 μm to 1.0 μm , Tab.1

●The geom. mean of AMADs for 131I, 134Cs and 137Cs after the FA was 0.4 µm, the geom. mean of volatile radionuclides after the CA was 0.5 µm

●GSD values were usually from 3 to 4 μm and showed a slight increase and AMADs slightly declined during the monitored period after the FA. After the CA the GSD values were similar for the 1st month after the CA and then grew larger with time, the decline of AMADs was not observed, Fig.5

●The mean of 134Cs/137Cs activity ratio after the FA was 0.9; the coincident corrections were done; after the CA the ratio was 1.8

●The combined uncertainty of the AMADs was about 30% in most samples

●Obtained values agree well with published results [3-5]

2. Objectives●To determine distribution of activities of the individual radionuclides released from the NPP Fukushima in dependence on aerosol size distribution.

●To compare these results with the results obtained after the Chernobyl accident.

3. Methods and equipmentThe samplings were carried out by 3 five-stage cascade impactors (CI, Sierra Instruments Inc., Model SA 236) connected to the pump and the flow controller. Aerosols were collected on collection substrates placed on individual stages and on the back-up filter situated after the last stage. After the end of each sampling the wipes from the inner surfaces of the impactors were taken to estimate the interstage losses. The collection substrates were measured (separately from individual stages, but combined from parallel samplings), by gamma-spectrometry (HPGe detectors). The results were used to evaluate the particle size distribution for individual radionuclides in terms of the activity median aerodynamic diameter (AMAD) and its geometric standard deviation (GSD) on the assumption of log-normal distribution of the data in agreement with [2].

4. Results

THE PARTICLE SIZE DISTRIBUTIONS OF RADIOACTIVE AEROSOLS IN PRAGUE AFTER THE FUKUSHIMA ACCIDENT

Helena Malá, Petr Rulík, Ján Mihalík, Miroslav Hýž[email protected]

National Radiation Protection Institute (SÚRO), Prague, Czech Republic

The combined uncertainty of the AMADs consists of the following errors and uncertainties:

• the flow rate and its (un)stability in the sampler,

• interstages losses on the inner walls of the CI,

• rebounds of the dropped particles and removal of the already caught particles to the air stream thus displacing them from the higher stages to the lower ones,

• the gamma-spectrometric analysis (measurements of very low activities)

The total uncertainty of the AMADs was estimated as about 30%.

Fig.5: The total activity concentrations of 131I, 134Cs, 137Cs , the AMADs and the GSDs for the individual sampling periods

Fig.4: The AMADs of 131I, 134Cs, 137Cs in log-normal quantile plot – an example

Fukushima Chernobyl

Fig.3: Chernobyl - The fractions of the activity concentrations (in %) of 131I, 134Cs, 137Cs in the size intervals of the AD (in µm) for 9 sampling periods from 4th May to 20th June 1986

ddd

NotesAD - aerodynamic diameterAMAD - activity median aerodynamic diameter CI - cascade impactorGSD - geometric standard deviationMSA - minimum significant activity

Fig.2: Fukushima - The fractions of the activity concentrations of 131I, 134Cs, 137Cs and for comparison 7Be (in %) in the size intervals of the AD (in µm) for 5 sampling periods from 24th March to 13th April 2011

CZECH REPUBLIC

Fukushima Chernobyl

  131I 134Cs 137Cs 7BeSampling No 1

AMAD [ µm ] 0.34 0.73 0.54 0.55GSD 3.69 3.00 4.07 2.62

Sampling No 2AMAD [ µm ] 0.28 0.66 0.71 0.43GSD 3.58 2.55 2.30 2.74

Sampling No 3AMAD [ µm ] 0.29 0.41 0.43 0.44GSD 4.02 4.43 4.10 3.19

Sampling No 4AMAD [ µm ] 0.37 0.26 0.32 0.33GSD 3,61 3.66 3.44 3.36

Sampling No 5AMAD [ µm ] 0.44 0.20 0.28 0.28GSD 3.68 3.90 4.20 3.30

Geom. mean from L-NAMAD [ µm ] 0.34 0.40 0.43 0.39GSD 3.71 3.44 3.54 3.03

Fig.1: CI, dismounted a sampling head of CI, a

filter from an individual stage and a back-up filter

Foto: P.Rulík. CR

1. IntroductionThe radiological importance of the radioactive aerosol particles depends not only on the kind of the radionuclide and its chemical form but also on the aerodynamic properties of the particles, mainly on their size. After the Fukushima Dai-Ichi Nuclear Power Plant (NPP) accident the aerosol particle size distribution associated with the radionuclides transported by air to the Czech Republic was investigated (in the time period from 24th March to 13th April 2011 five sets of samplings were performed).The results were compared with the data obtained in May and June 1986 following the Chernobyl accident (9 samplings from 4th May to 20th June 1986). The aerosol samplings and measurements were done by the same methods [1].

6. ConclusionsThe distance Prague–Fukushima is 10 times longer than the distance Prague-Chernobyl, therefore the particle size distribution derived from the FA was influenced by processes in the atmosphere for longer time than the particle size distribution from the CA. After the FA only for 3 volatile radionuclides the particle size distribution was determined: 131I, 134Cs and 137Cs. After the CA two types of radionuclides were observed: refractory and volatile, with different particle size distributions. The activities after the CA were much higher then after the FA. The sampling period after the CA was almost 50 days (9 samplings), after the FA only 20 days (5 samplings). Despite the different conditions of formation, motion and behaviour of aerosol in the atmosphere, almost the same size distribution of the aerosol particles containing these volatile radionuclides was found with very similar values of parameters: mean AMAD 0.4 - 0.5 µm, GSD between 3 and 4 and with more than 40% of the activity connected with particles with AD < 0.49 μm.