Embed Size (px)
Citation preview

The Partial Coherence method for assessment of impaired cerebral
autoregulation using Near-Infrared Spectroscopy: potential and limitations
S. Van Huffel*, J. Jacobs, D. De Smet*,J. Vanderhaegen**, G. Naulaers** , M. Wolf***,
P. Lemmers**** and F. van Bel****
KATHOLIEKE UNIVERSITEIT LEUVEN, BELGIUM
*DEPARTMENT OF ELECTRICAL ENGINEERING (ESAT-SCD)
** NEONATAL INTENSIVE CARE UNIT, UNIVERSITY HOSPITALS LEUVEN*** NEONATAL INTENSIVE CARE UNIT, UNIVERSITY HOSPITAL ZURICH
****DEPT. OF NEONATOLOGY, UMC, WILHELMINA CHILDREN’S HOSPITAL UTRECHT

Introduction
Problem : impaired cerebrovascular autoregulation
Δ CBF brain injuries
Preterm infants: high risk for development disorders
• Δ MABP frequent
• Δ MABP Δ CBF in some infants
To detect impaired autoregulation :
Δ MABP Δ CBF
Acronyms :
• CBF : Cerebral Blood Flow
• MABP : Mean Arterial blood Pressure
1. Introduction
2. Methods
3. Models
4. Datasets
5. Results
6. Conclusions
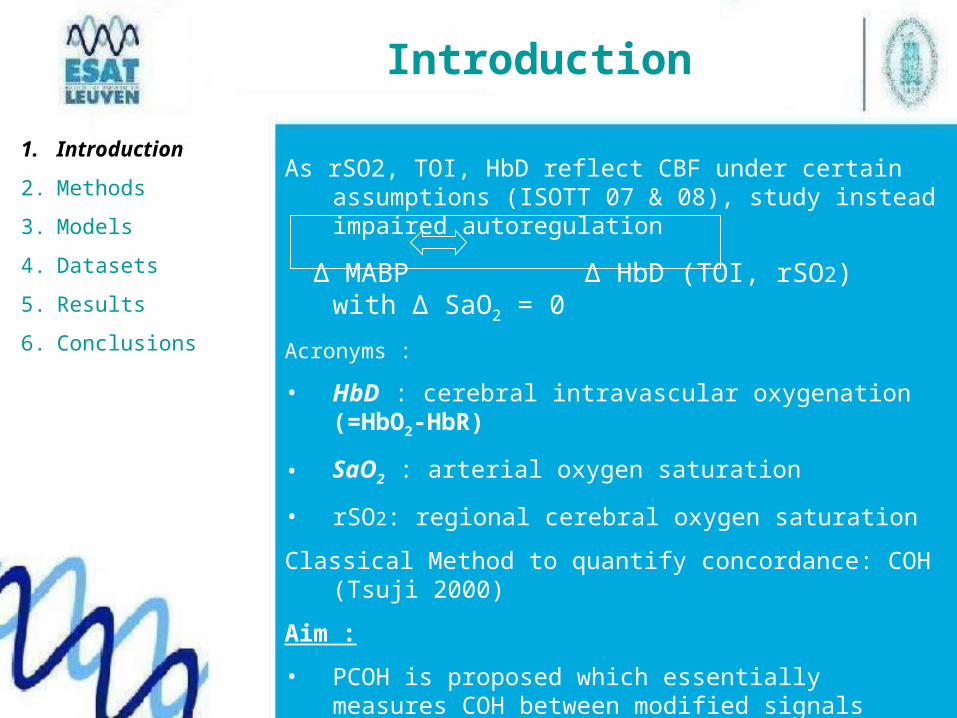
Introduction
As rSO2, TOI, HbD reflect CBF under certain assumptions (ISOTT 07 & 08), study instead impaired autoregulation
Δ MABP Δ HbD (TOI, rSO2) with Δ SaO2 = 0
Acronyms :
• HbD : cerebral intravascular oxygenation (=HbO2-HbR)
• SaO2 : arterial oxygen saturation
• rSO2: regional cerebral oxygen saturation
Classical Method to quantify concordance: COH (Tsuji 2000)
Aim :
• PCOH is proposed which essentially measures COH between modified signals (influence of SaO2 removed)
• Compare different physiological models of SaO2 influence
• Compare results using three different datasets
1. Introduction
2. Methods
3. Models
4. Datasets
5. Results
6. Conclusions

1. Introduction
2. Methods
3. Models
4. Datasets
5. Results
6. Conclusions
PCOH
Start from x1(t)= SaO2, x2(t)= MABP, x3(t) =HbD (time domain)
Step 1 : Fourier transform X1(f), X2(f), X3(f) (freq. domain)
Step 2 : expression of the linear dependence between signals
(black-box model)
With:
• P13 : CSD between x1 and x3
• P11 : PSD of x1 ( = ENERGY of x1 )
• X3(f) : dependent on X1 and X2
• X13(f) : dependent on X2
+ generalization to X12, X3
1, … and X123, X13
2, …
Step 3 : calculation of PCOH + generalization
Methods

Models
The classical method COH assumes the following model:
MABP versus HbD (TOI, rSO2)
We compared the following four models for PCOH:
1. Model 1: MABP \ SaO2 versus HbD \ SaO2
2. Model 2: MABP versus HbD \ SaO2
3. Model 3: MABP \ i(SaO2) versus HbD \ i(SaO2)
4. Model 4: MABP versus HbD \ i(SaO2)
with i(SaO2) = SaO2 – f(MABP)
Remark: instead of HbD, TOI or rSO2 may be used
1. Introduction
2. Methods
3. Models
4. Datasets
5. Results
6. Conclusions

Datasets
30 preterm infants with need for intensive care monitored during first day(s) of life: MABP monitored by indwelling arterial catheter, SaO2 by pulse oximetry on limb.
• UZ Leuven (10): TOI (NIRO300, Hamamatsu), PMA=28.7±3.3 weeks, bodyweight=1125±504 g, recording time = 6h54min±3h33min
• UMC Utrecht (10): rSO2 (INVOS4100, Somanetics), PMA= 29.3 ±1.3 weeks, bodyweight=1131±311g, recording time=49h36min± 11h48min
• UZ Zurich (10) : HbD (Critikon2001, GE), PMA=28.1±2.1 weeks, bodyweight=1198±439g, recording time=2h11min± 27min, inspired O2 fraction changed SaO2↑
All data downsampled to 0.333Hz (3s) and (pre)processed as follows:
• If artifacts > 1.5 s, then exclude data else interpolate (Soul, 07)
• Data only included if SaO2 satisfies: 80%< SaO2 < 100%
• (P)COH restricted to 0.0033-0.04 Hz (25-300s cycles) (Soul,07)
• Sliding windowing, half overlapping epochs of 12.5, 15, 10 min
• Mean COH calibrated such that CSV=0.5 for impaired autoreg.
1. Introduction
2. Methods
3. Models
4. Datasets
5. Results
6. Conclusions


Results
Global Analysis
• On average, PCOH > COH (mean scores, CPRT* and PPI**), STD of PCOH values slightly higher but not significantly.
• Model 3 gives the highest values while model 2 the smallest ones for all datasets.
• High Mean score values (> 0.5) are related to smaller PMA and less significantly to smaller birth weight and smaller survival rate
• High PCOH values (mean>0.5, CPRT>0, PPI>0) better detect bad clinical outcome than COH (MDI<84, PDI<84, Apgar<7).
• CPRT and PPI (0.1) better detect bad clinical outcome than mean score values.
Local Analysis: zoom in on epochs with higher var(SaO2)
• All mean score values significantly higher, model 3 highest.
• Using unpreprocessed data, score values are all significantly lower (factor 2) and don’t reflect concordances between signals
*CPRT = % of Recording Time with mean (P)COH >0.5 (ISOTT 2007)
**PPI = % of 10 min. epochs with mean (P)COH > 0.68 (Soul et al, 2007)
1. Introduction
2. Methods
3. Models
4. Datasets
5. Results
6. Conclusions

COH model1 model2 model3 model4
meanLeuven 0.39 0.41 0.41 0.44 0.42
STDLeuven 0.09 0.10 0.09 0.11 0.10
CPRTLeuven 14% 20% 14% 27% 22%
PPILeuven 10.1% 12.4% 11.6% 18.3% 10.4%
meanUtrecht 0.35 0.34 0.33 0.39 0.36
STDUtrecht 0.09 0.09 0.09 0.10 0.09
CPRTUtrecht 13% 11% 8% 22% 17%
PPIUtrecht 20.8% 19.3% 15.1% 28.2% 21.5%
meanZurich 0.56 0.61 0.57 0.63 0.59
STDZurich 0.09 0.09 0.09 0.12 0.11
CPRTZurich 72% 75% 70% 80% 71%
PPIZurich 17.0% 34.0% 19.3% 40.1% 29.0%

Local analysis COH model1 model2 model3 model4 VarSaO2
Overall mean 0.55 0.52 0.52 0.61 0.57 1.20Mean 20-40min 0.64 0.51 0.61 0.75 0.73 2.51

Local analysis COH model1 model2 model3 model4 varSaO2
Overall mean 0.39 0.37 0.38 0.39 0.40 1.58Mean 44-62min 0.42 0.51 0.49 0.55 0.50 3.05

Conclusions
•PCOH removes influence of SaO2 variations, thereby improving automated monitoring of (impaired) autoregulation .
•(P)COH analysis performed using three different datasets (different center, different CBF reflector)
• PCOH > COH: PCOH better detector of bad clinical outcome. CPRT and PPI (0.1) clearly better detectors than mean scores
•4 PCOH models compared model 3 best
•Further statistical analysis needed, as well as correlation of new scores with neurological outcomes on larger multicentric datasets
1. Introduction
2. Methods
3. Models
4. Datasets
5. Results
6. Conclusions