Embed Size (px)
Citation preview
THE PARLIAMENT OF KENYA
Parliamentary Budget Office
UNPACKING OF THE BUDGET POLICY STATEMENT & MEDIUM-TERM DEBT MANAGEMENT STRATEGY 2020
FEBRUARY, 2020
1
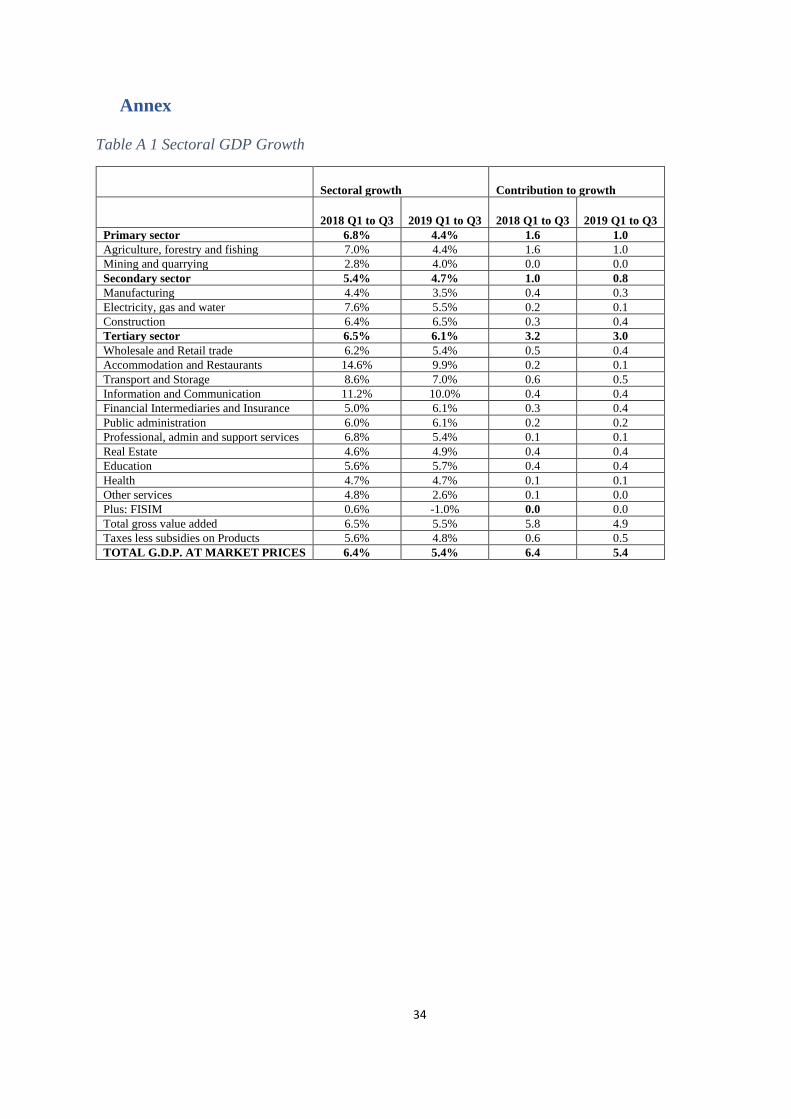
© Parliamentary Budget Office, 2020
For more information, contact:
The Director,
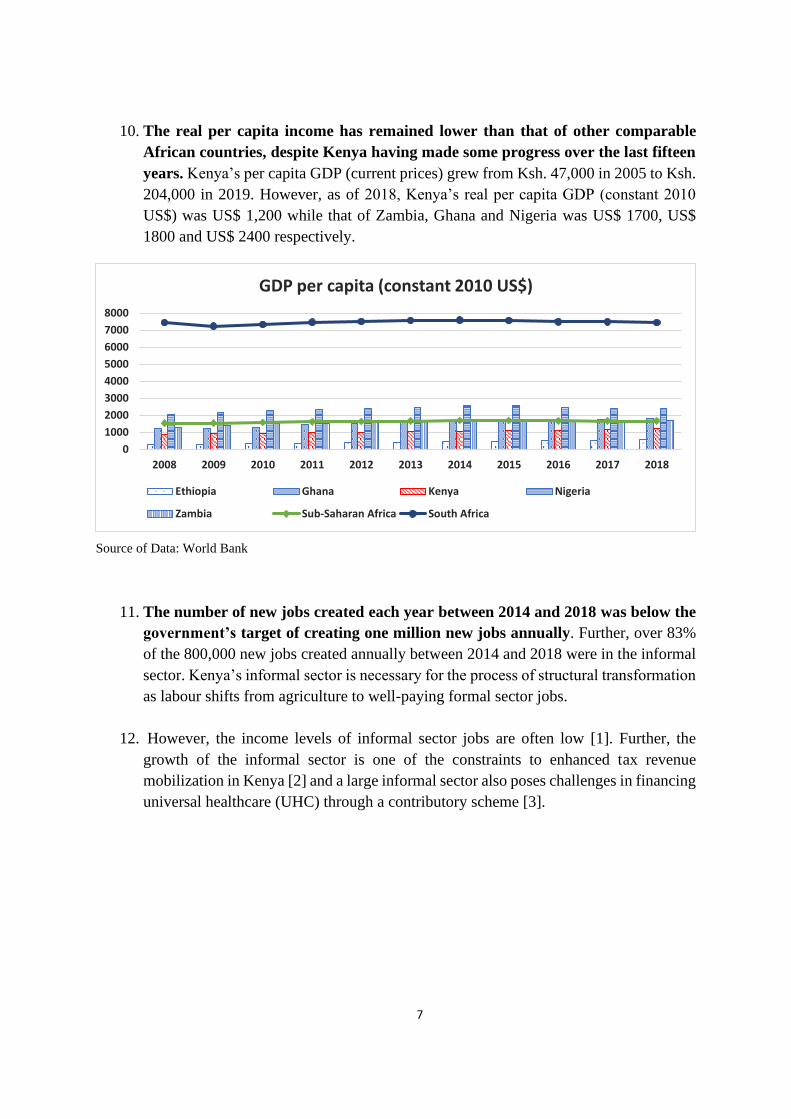
Parliamentary Budget Office
Parliament of the Republic of Kenya
Protection House, 10th Floor
P.O. Box 41842 – 00100 GPO
NAIROBI, KENYA
Tel: +254-20-284-8810
Email: [email protected]
Disclaimer
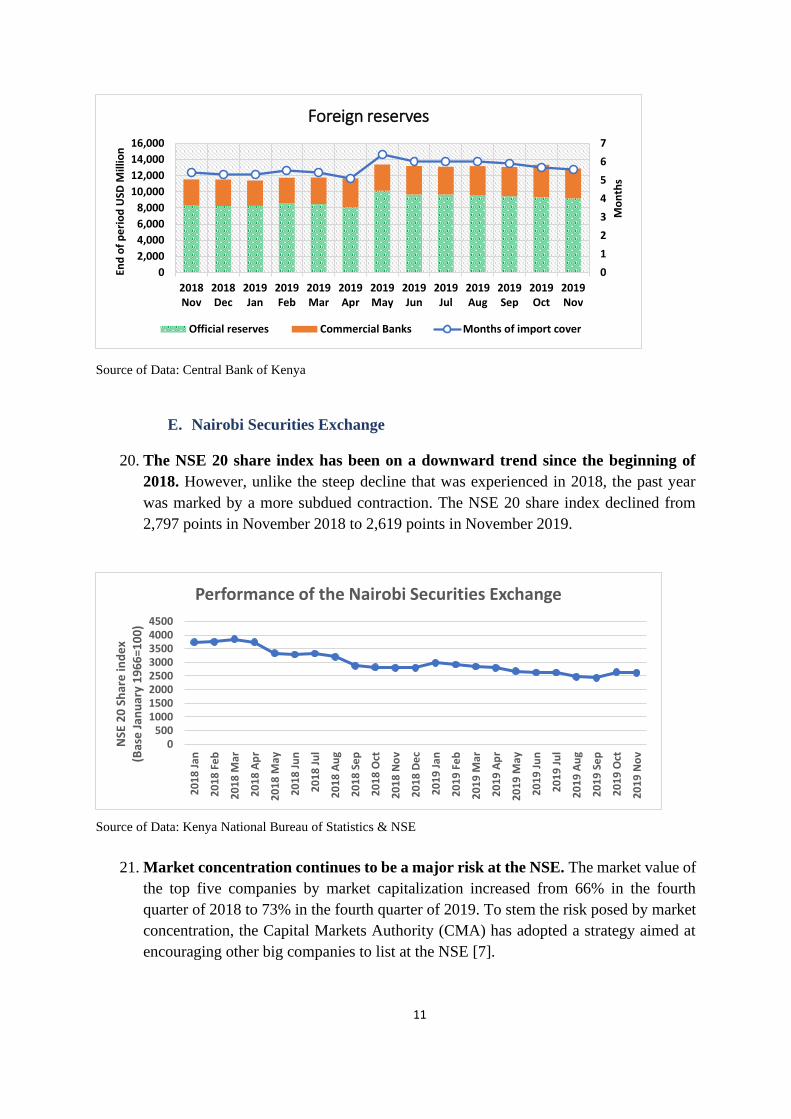
The Parliamentary Budget Office (PBO) is a non-partisan professional office of the Parliament
of the Republic of Kenya. The primary function of the Office is to provide professional advice
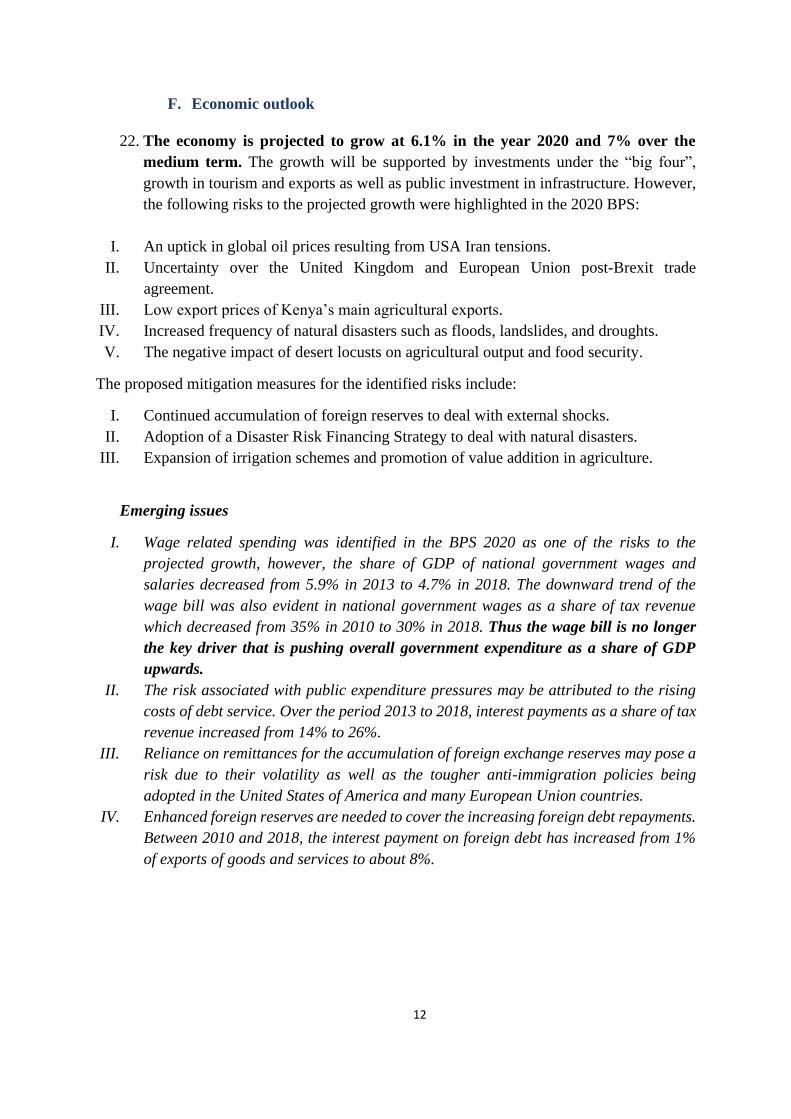
in respect of the budget, finance and economic information to committees of Parliament.
2
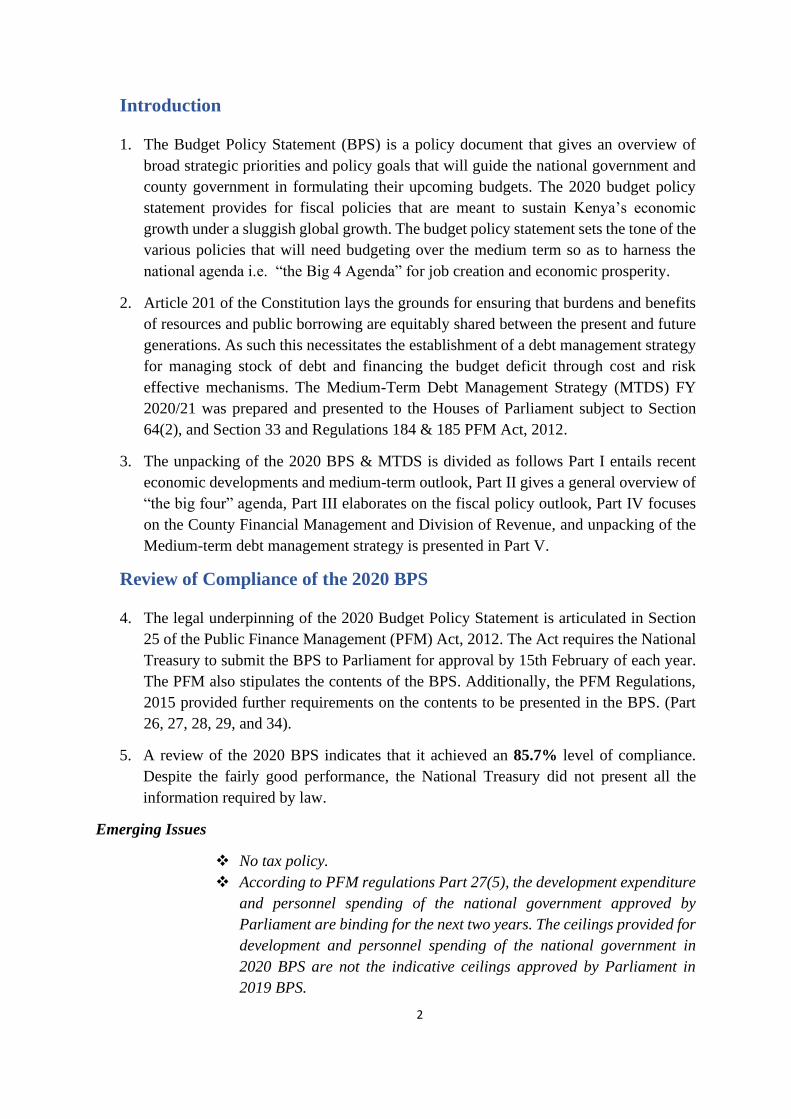
Introduction
1. The Budget Policy Statement (BPS) is a policy document that gives an overview of
broad strategic priorities and policy goals that will guide the national government and
county government in formulating their upcoming budgets. The 2020 budget policy
statement provides for fiscal policies that are meant to sustain Kenya’s economic
growth under a sluggish global growth. The budget policy statement sets the tone of the
various policies that will need budgeting over the medium term so as to harness the
national agenda i.e. “the Big 4 Agenda” for job creation and economic prosperity.
2. Article 201 of the Constitution lays the grounds for ensuring that burdens and benefits
of resources and public borrowing are equitably shared between the present and future
generations. As such this necessitates the establishment of a debt management strategy
for managing stock of debt and financing the budget deficit through cost and risk
effective mechanisms. The Medium-Term Debt Management Strategy (MTDS) FY
2020/21 was prepared and presented to the Houses of Parliament subject to Section
64(2), and Section 33 and Regulations 184 & 185 PFM Act, 2012.
3. The unpacking of the 2020 BPS & MTDS is divided as follows Part I entails recent
economic developments and medium-term outlook, Part II gives a general overview of
“the big four” agenda, Part III elaborates on the fiscal policy outlook, Part IV focuses
on the County Financial Management and Division of Revenue, and unpacking of the
Medium-term debt management strategy is presented in Part V.
Review of Compliance of the 2020 BPS
4. The legal underpinning of the 2020 Budget Policy Statement is articulated in Section
25 of the Public Finance Management (PFM) Act, 2012. The Act requires the National
Treasury to submit the BPS to Parliament for approval by 15th February of each year.
The PFM also stipulates the contents of the BPS. Additionally, the PFM Regulations,
2015 provided further requirements on the contents to be presented in the BPS. (Part
26, 27, 28, 29, and 34).
5. A review of the 2020 BPS indicates that it achieved an 85.7% level of compliance.
Despite the fairly good performance, the National Treasury did not present all the
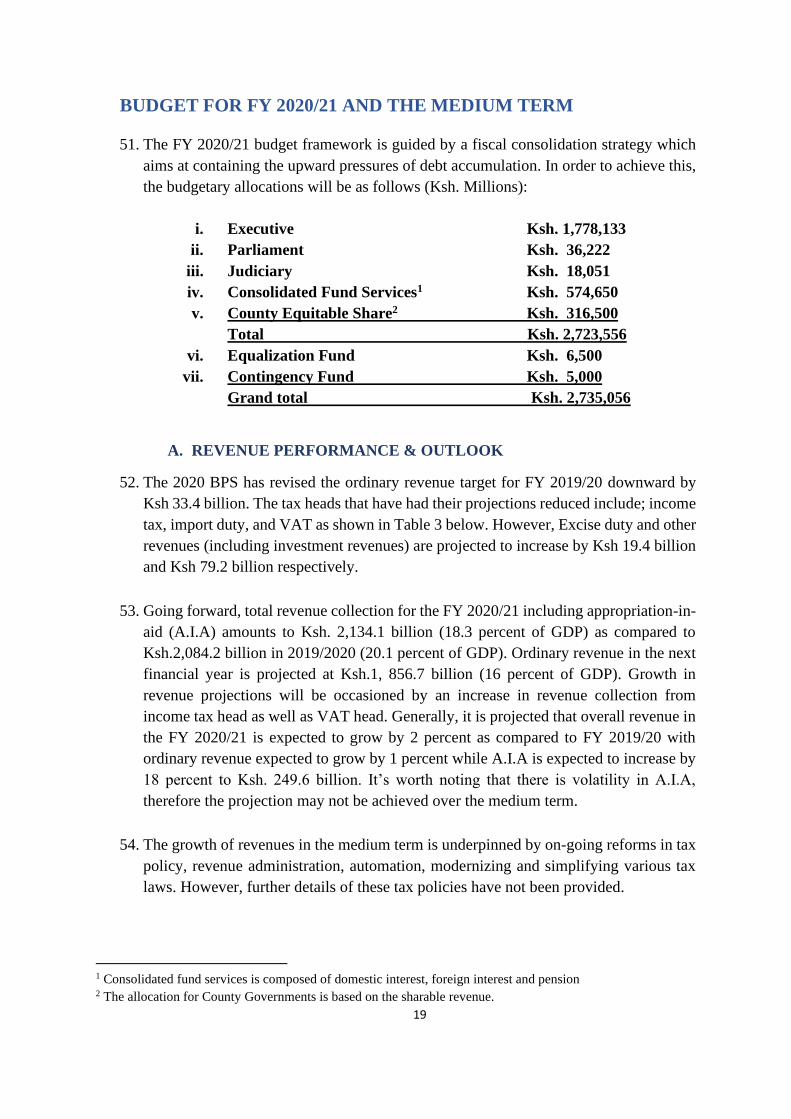
information required by law.
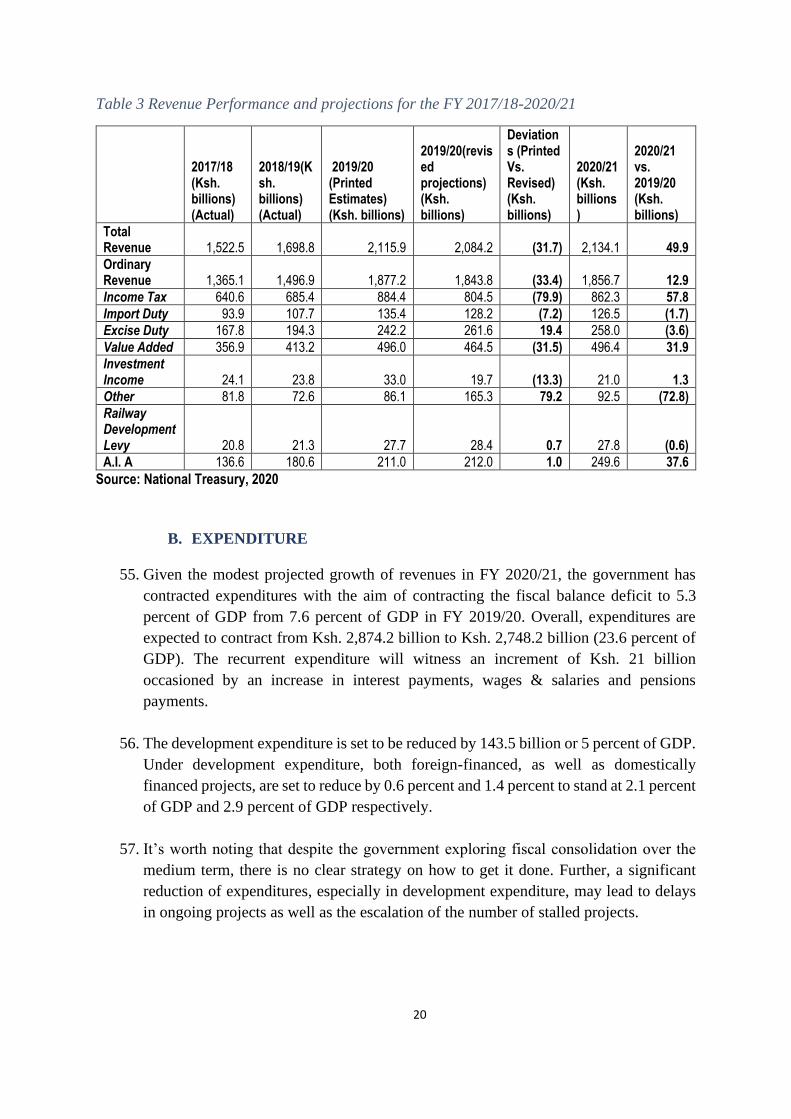
Emerging Issues
❖ No tax policy.
❖ According to PFM regulations Part 27(5), the development expenditure
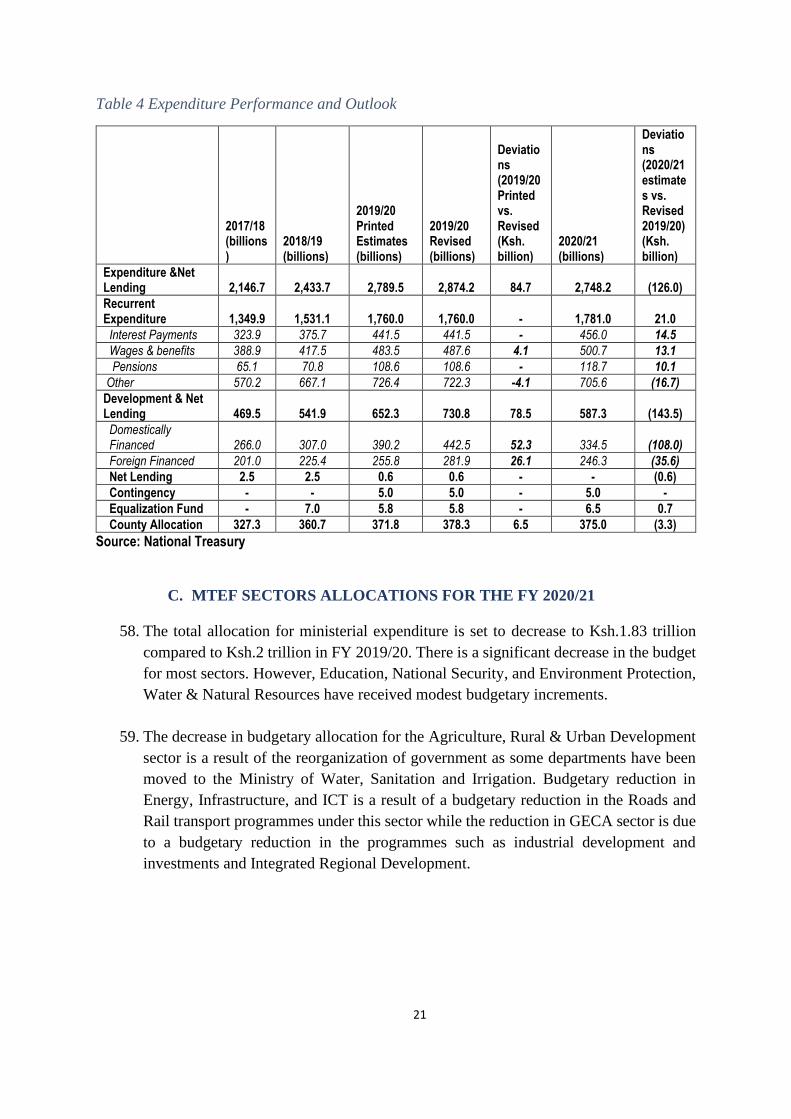
and personnel spending of the national government approved by
Parliament are binding for the next two years. The ceilings provided for
development and personnel spending of the national government in
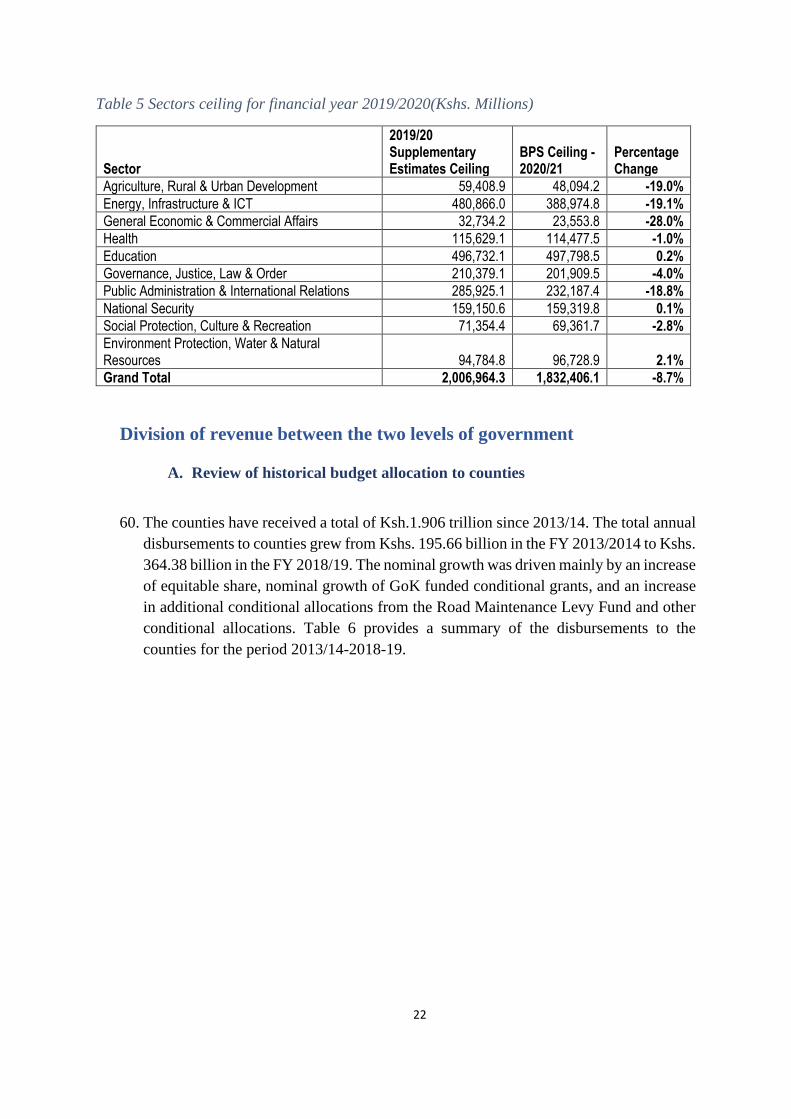
2020 BPS are not the indicative ceilings approved by Parliament in
2019 BPS.
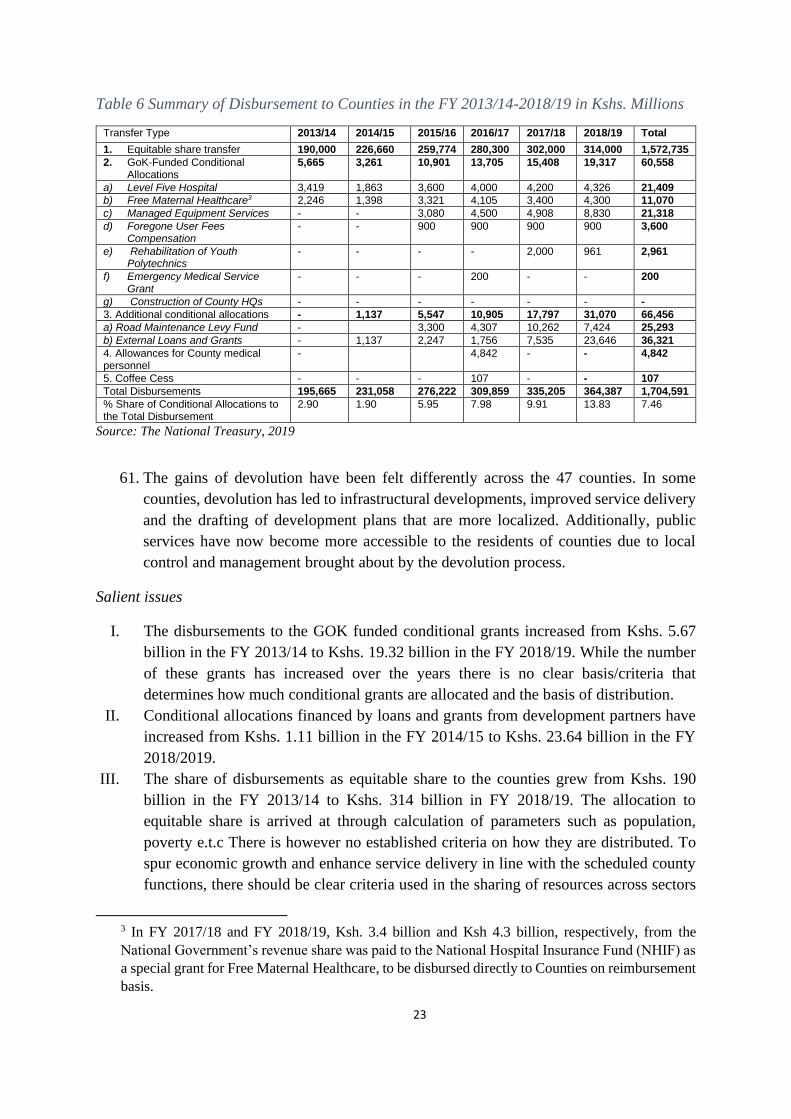
3
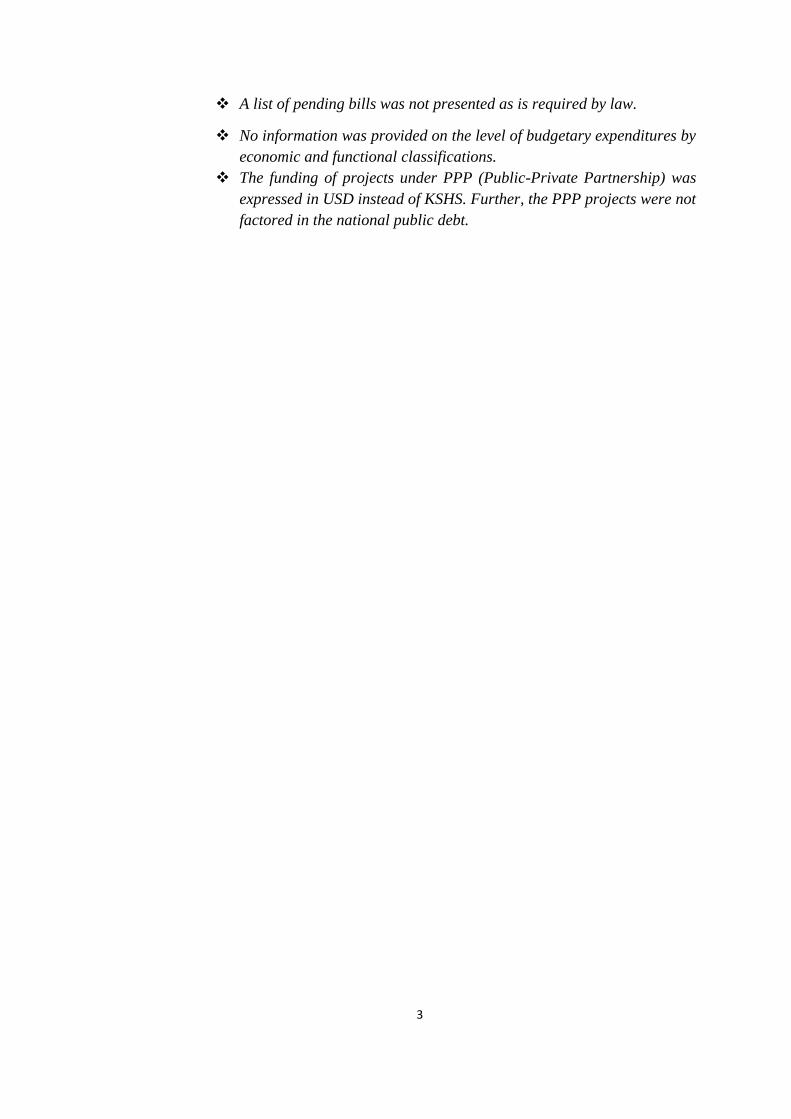
❖ A list of pending bills was not presented as is required by law.
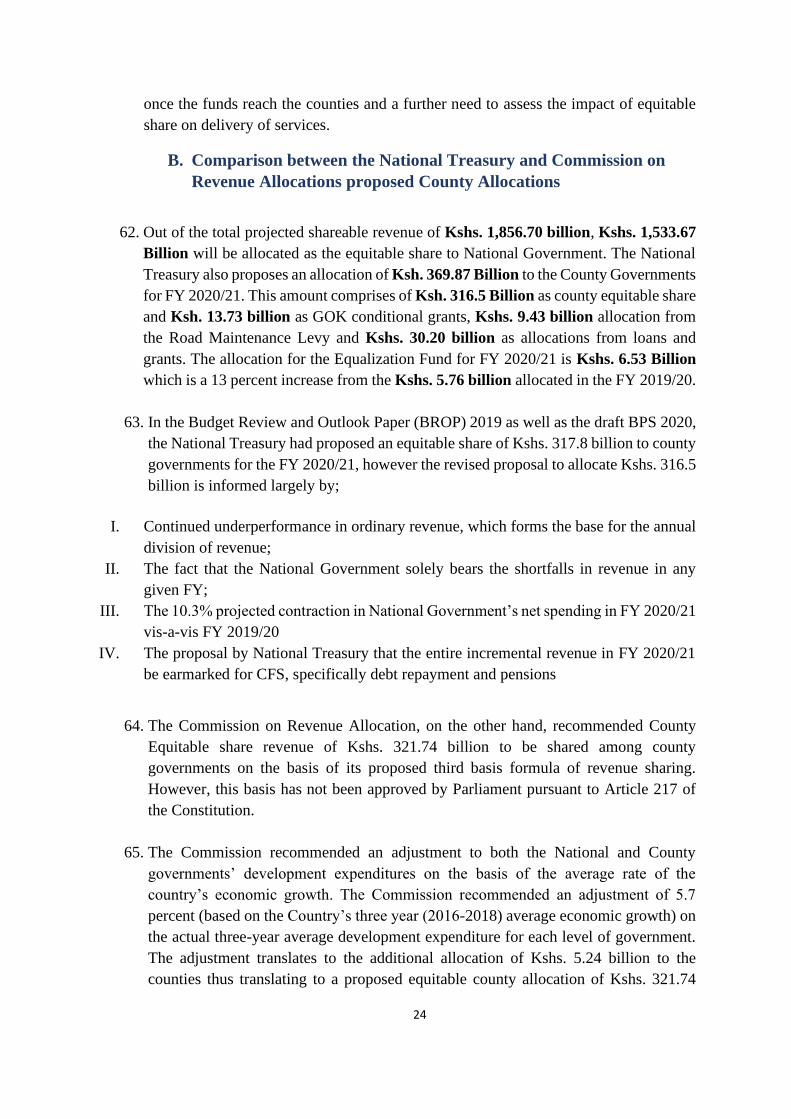
❖ No information was provided on the level of budgetary expenditures by
economic and functional classifications.
❖ The funding of projects under PPP (Public-Private Partnership) was
expressed in USD instead of KSHS. Further, the PPP projects were not
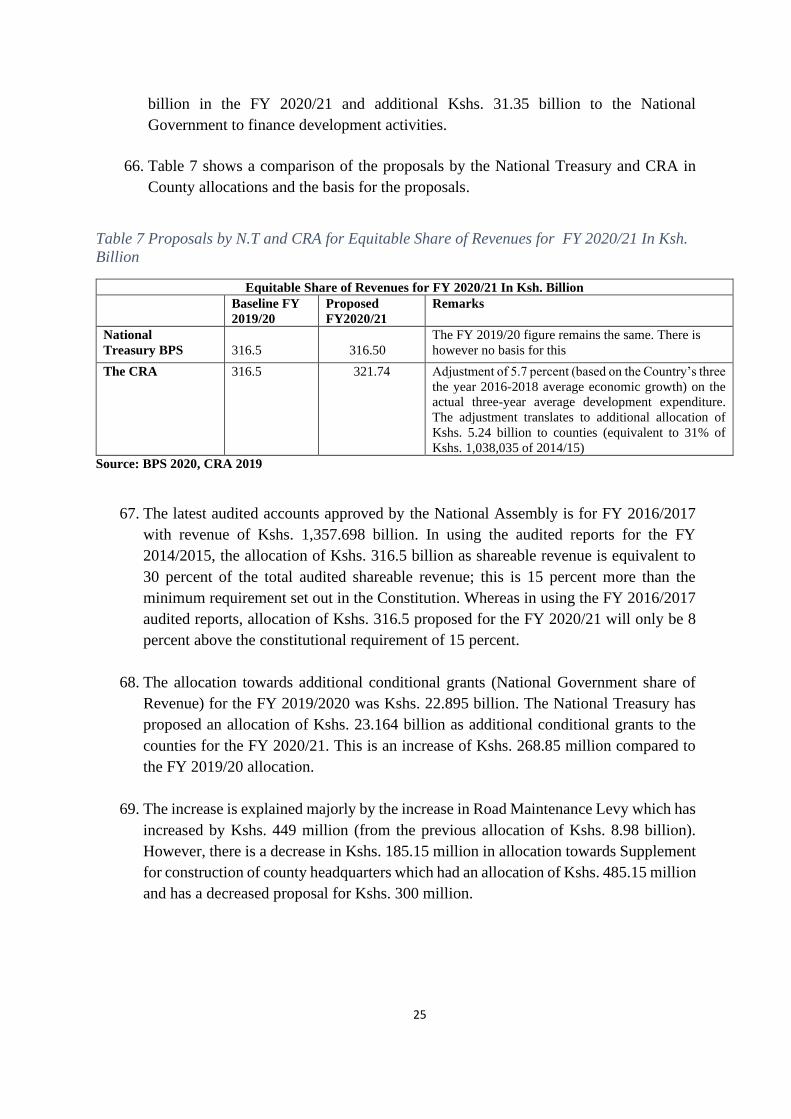
factored in the national public debt.
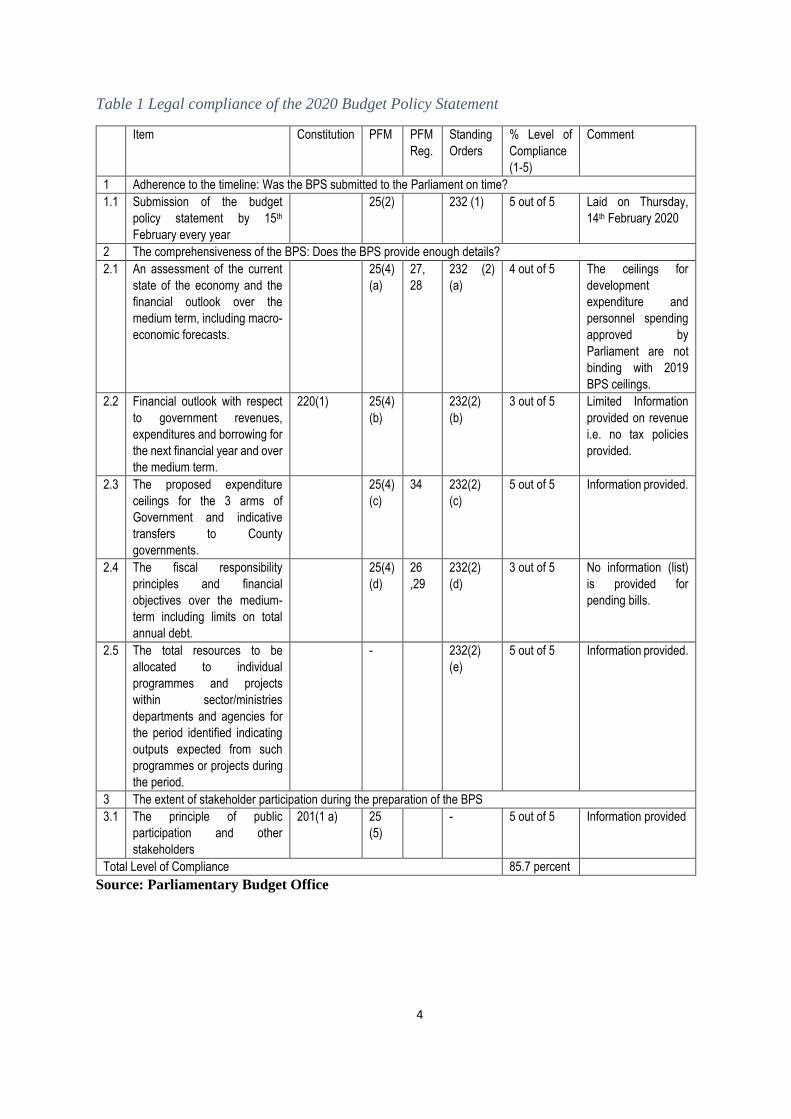
4
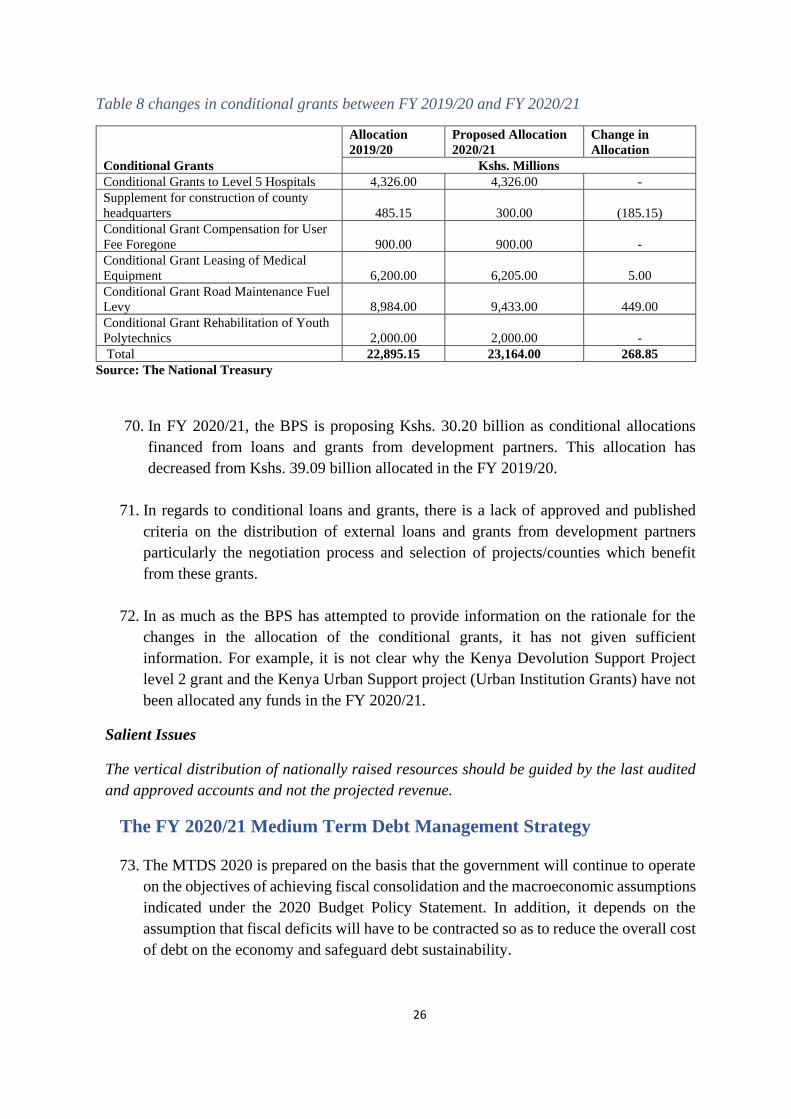
Table 1 Legal compliance of the 2020 Budget Policy Statement
Item Constitution PFM PFM
Reg.
Standing
Orders
% Level of
Compliance
(1-5)
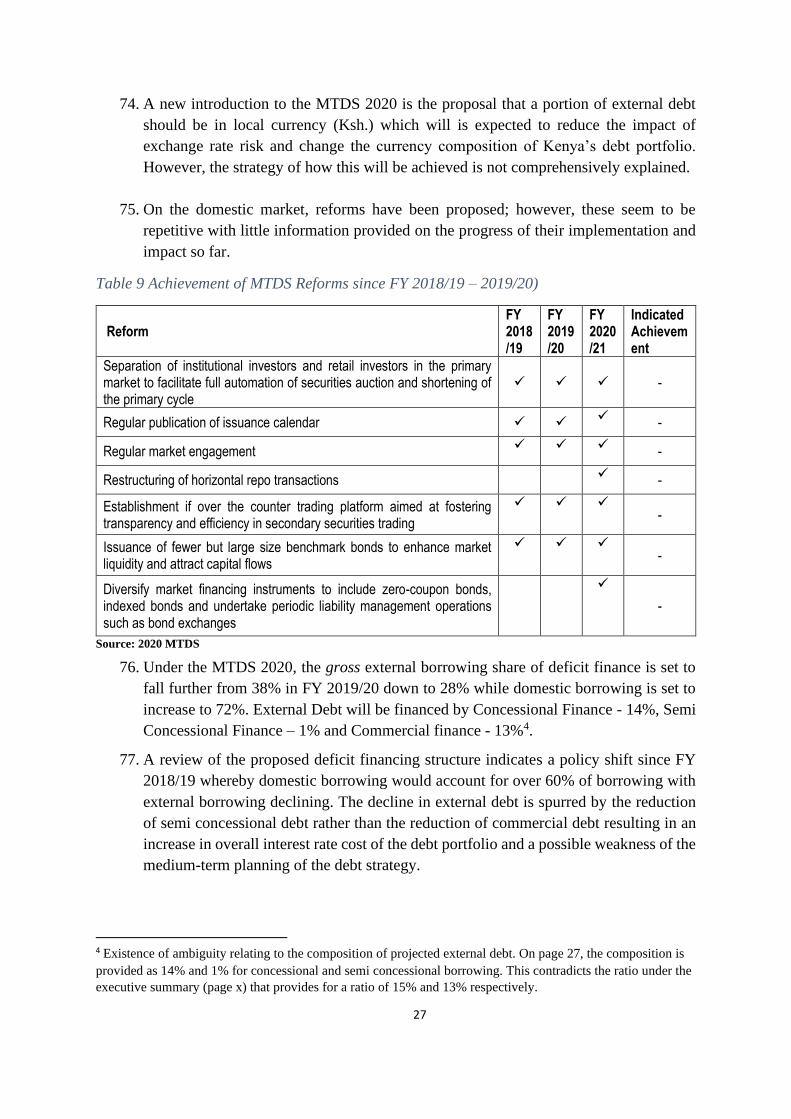
Comment
1 Adherence to the timeline: Was the BPS submitted to the Parliament on time?
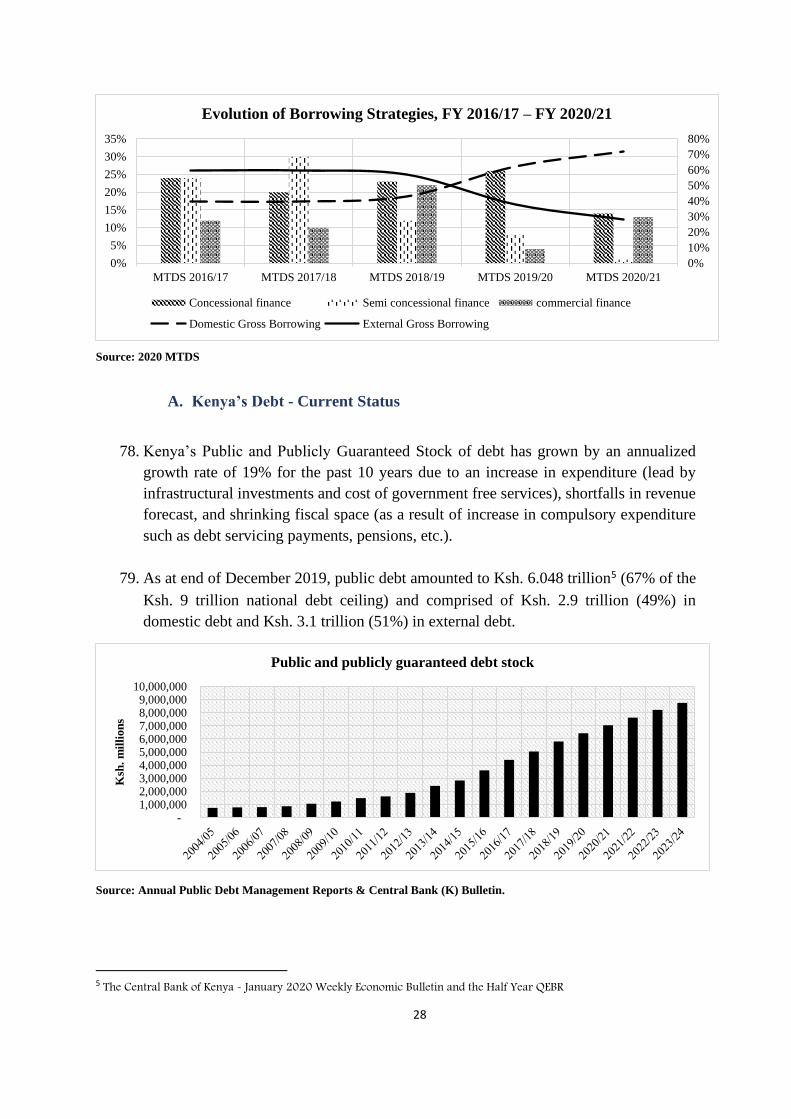
1.1 Submission of the budget
policy statement by 15th
February every year
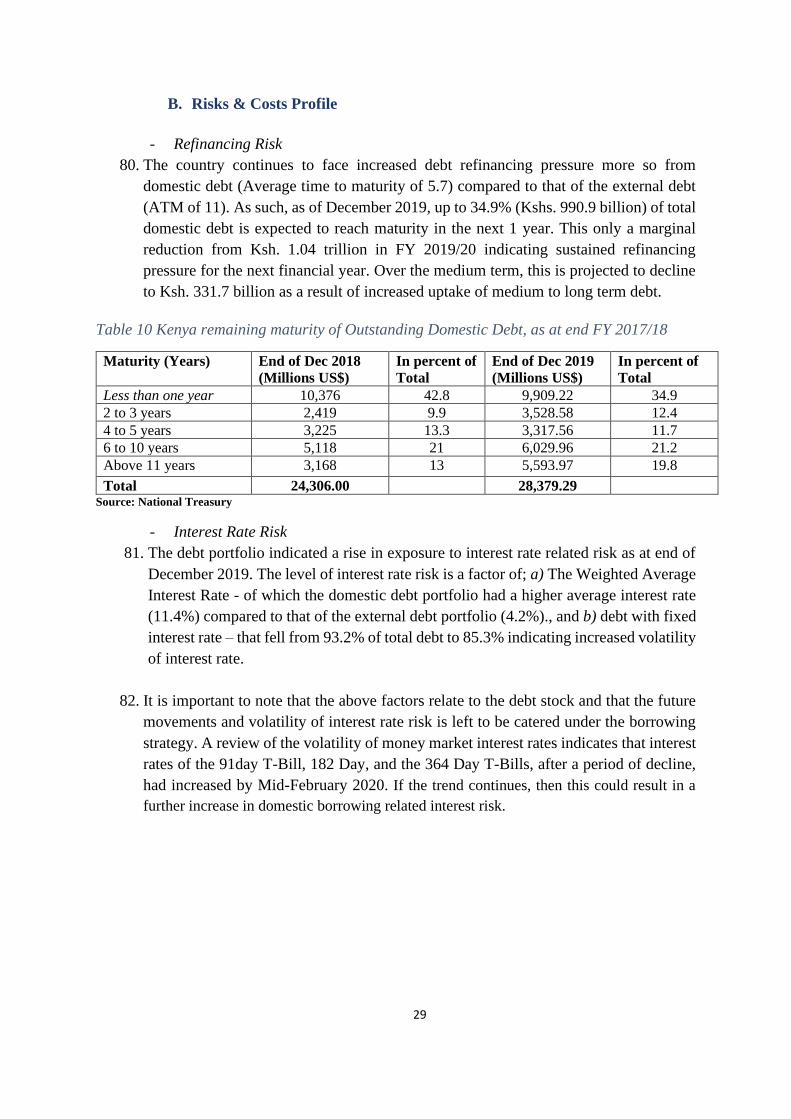
25(2) 232 (1) 5 out of 5 Laid on Thursday,
14th February 2020
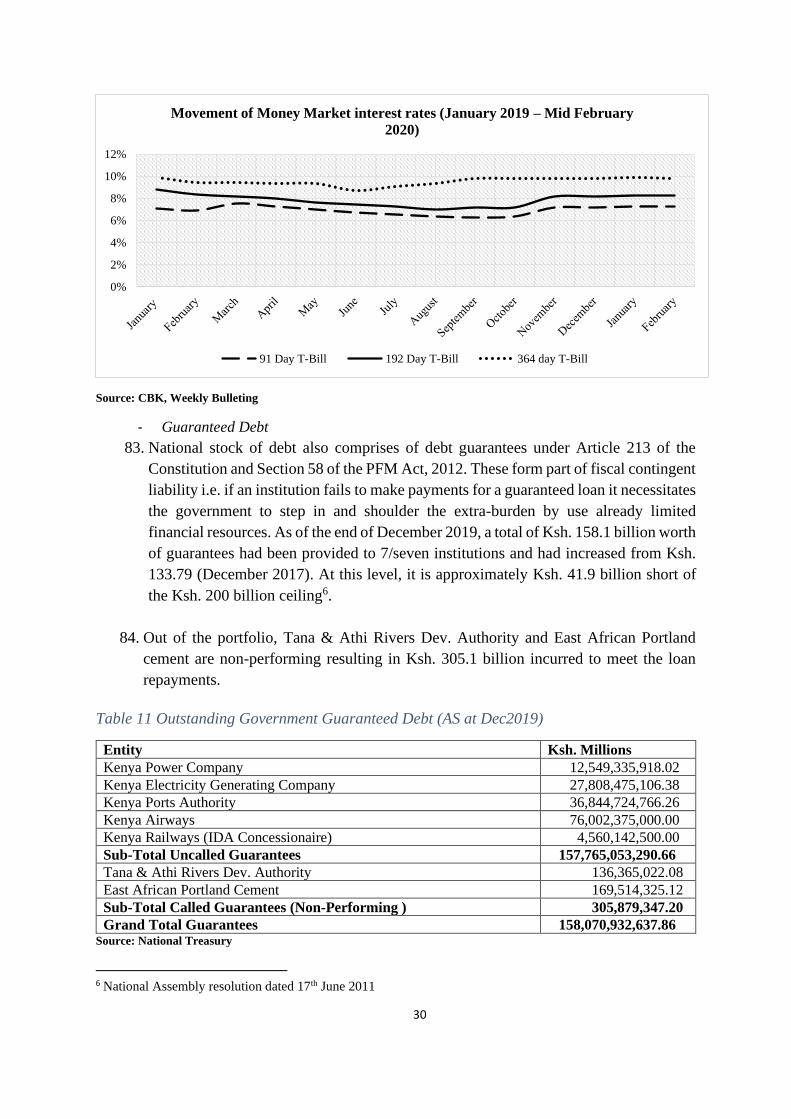
2 The comprehensiveness of the BPS: Does the BPS provide enough details?
2.1 An assessment of the current
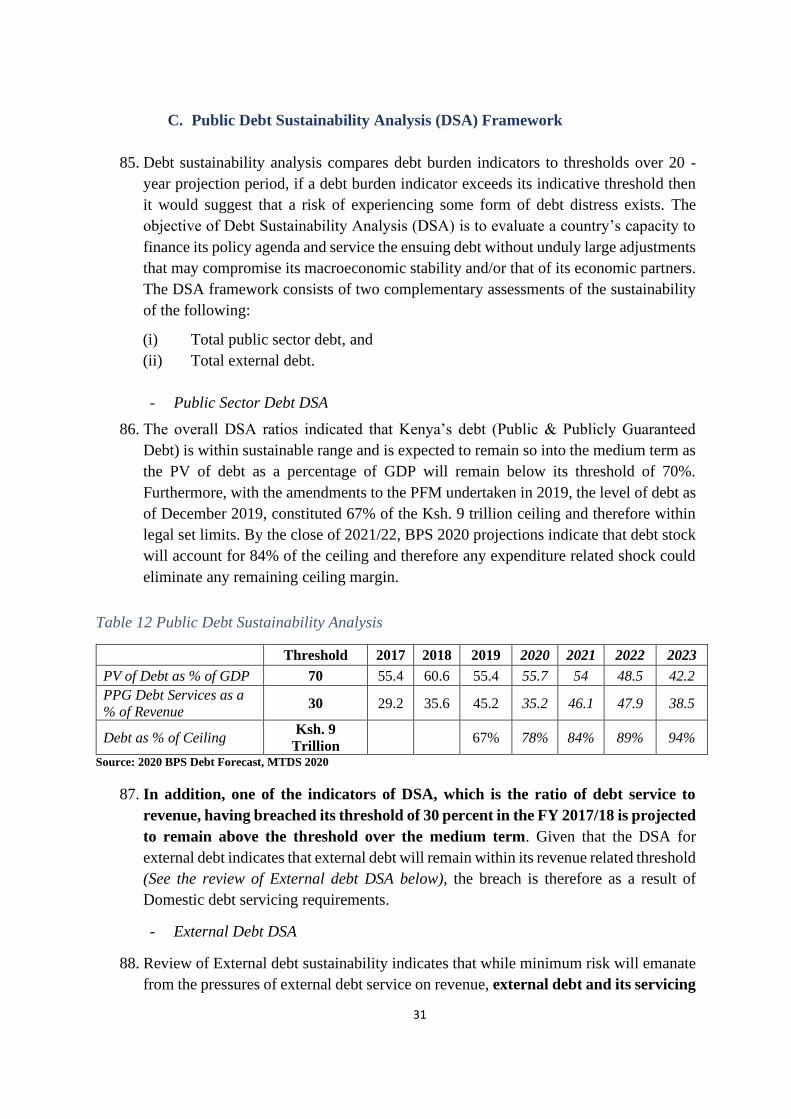
state of the economy and the
financial outlook over the
medium term, including macro-
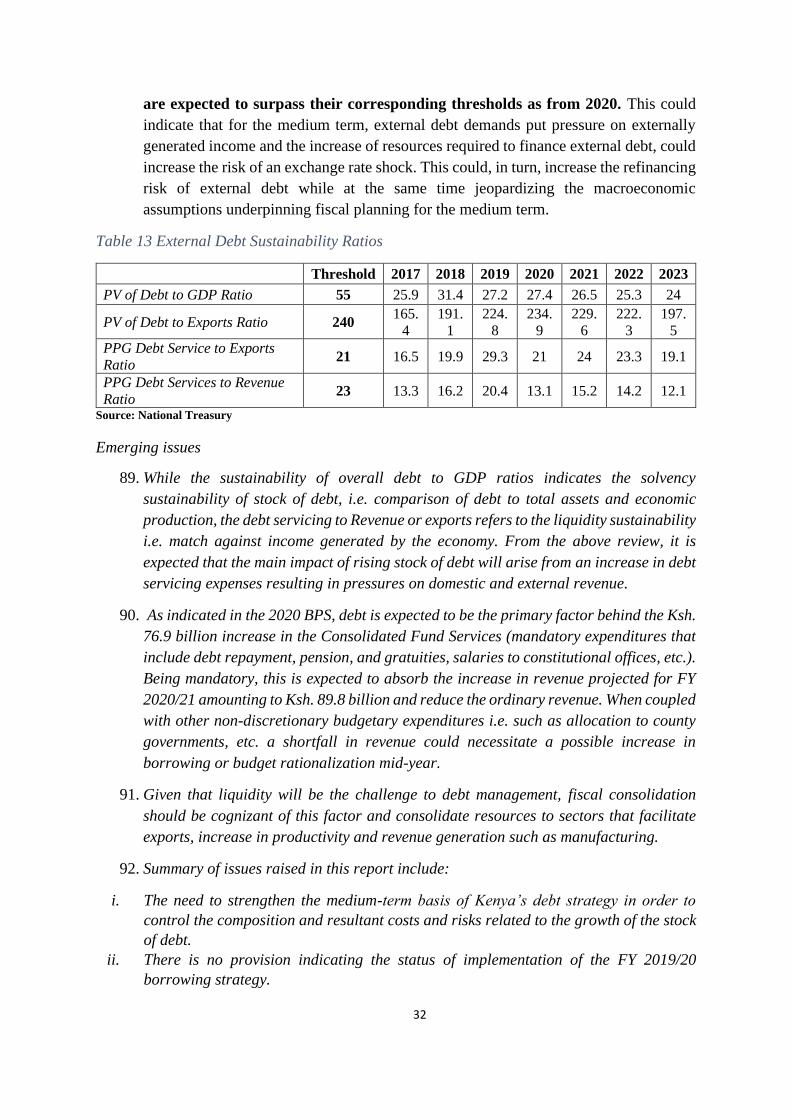
economic forecasts.
25(4)
(a)
27,
28
232 (2)
(a)
4 out of 5 The ceilings for
development
expenditure and
personnel spending
approved by
Parliament are not
binding with 2019
BPS ceilings.
2.2
Financial outlook with respect
to government revenues,
expenditures and borrowing for
the next financial year and over
the medium term.
220(1) 25(4)
(b)
232(2)
(b)
3 out of 5 Limited Information
provided on revenue
i.e. no tax policies
provided.
2.3
The proposed expenditure
ceilings for the 3 arms of
Government and indicative
transfers to County
governments.
25(4)
(c)
34 232(2)
(c)
5 out of 5 Information provided.
2.4
The fiscal responsibility
principles and financial
objectives over the medium-
term including limits on total
annual debt.
25(4)
(d)
26
,29
232(2)
(d)
3 out of 5 No information (list)
is provided for
pending bills.
2.5 The total resources to be
allocated to individual
programmes and projects
within sector/ministries
departments and agencies for
the period identified indicating
outputs expected from such
programmes or projects during
the period.
- 232(2)
(e)
5 out of 5 Information provided.
3 The extent of stakeholder participation during the preparation of the BPS
3.1 The principle of public
participation and other
stakeholders
201(1 a) 25
(5)
- 5 out of 5 Information provided
Total Level of Compliance 85.7 percent
Source: Parliamentary Budget Office
5
Recent economic developments
A. Economic Growth
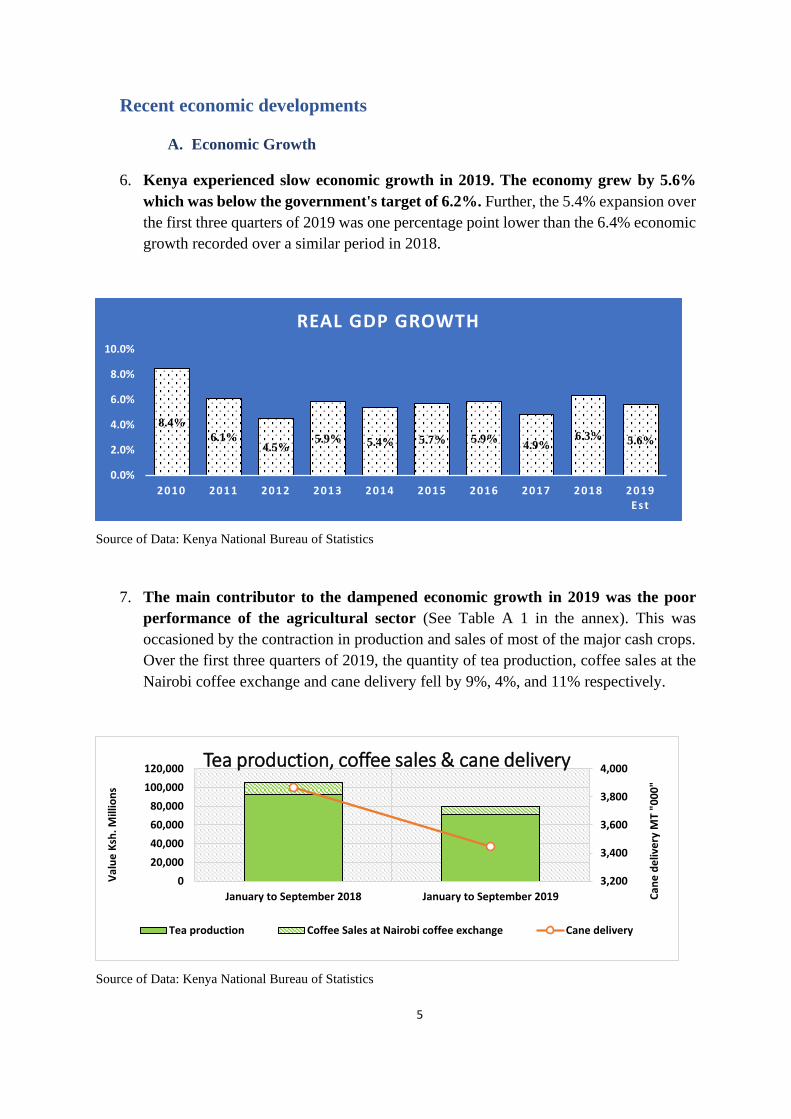
6. Kenya experienced slow economic growth in 2019. The economy grew by 5.6%
which was below the government's target of 6.2%. Further, the 5.4% expansion over
the first three quarters of 2019 was one percentage point lower than the 6.4% economic
growth recorded over a similar period in 2018.
Source of Data: Kenya National Bureau of Statistics
7. The main contributor to the dampened economic growth in 2019 was the poor
performance of the agricultural sector (See Table A 1 in the annex). This was
occasioned by the contraction in production and sales of most of the major cash crops.
Over the first three quarters of 2019, the quantity of tea production, coffee sales at the
Nairobi coffee exchange and cane delivery fell by 9%, 4%, and 11% respectively.
Source of Data: Kenya National Bureau of Statistics
8.4%
6.1%4.5%
5.9% 5.4% 5.7% 5.9%4.9%
6.3% 5.6%
0.0%
2.0%
4.0%
6.0%
8.0%
10.0%
2010 2011 2012 2013 2014 2015 2016 2017 2018 2019 Est
REAL GDP GROWTH
3,200
3,400
3,600
3,800
4,000
0
20,000
40,000
60,000
80,000
100,000
120,000
January to September 2018 January to September 2019 Can
e d
eliv
ery
MT
"00
0"
Val
ue
Ksh
. Mill
ion
s
Tea production, coffee sales & cane delivery
Tea production Coffee Sales at Nairobi coffee exchange Cane delivery
6
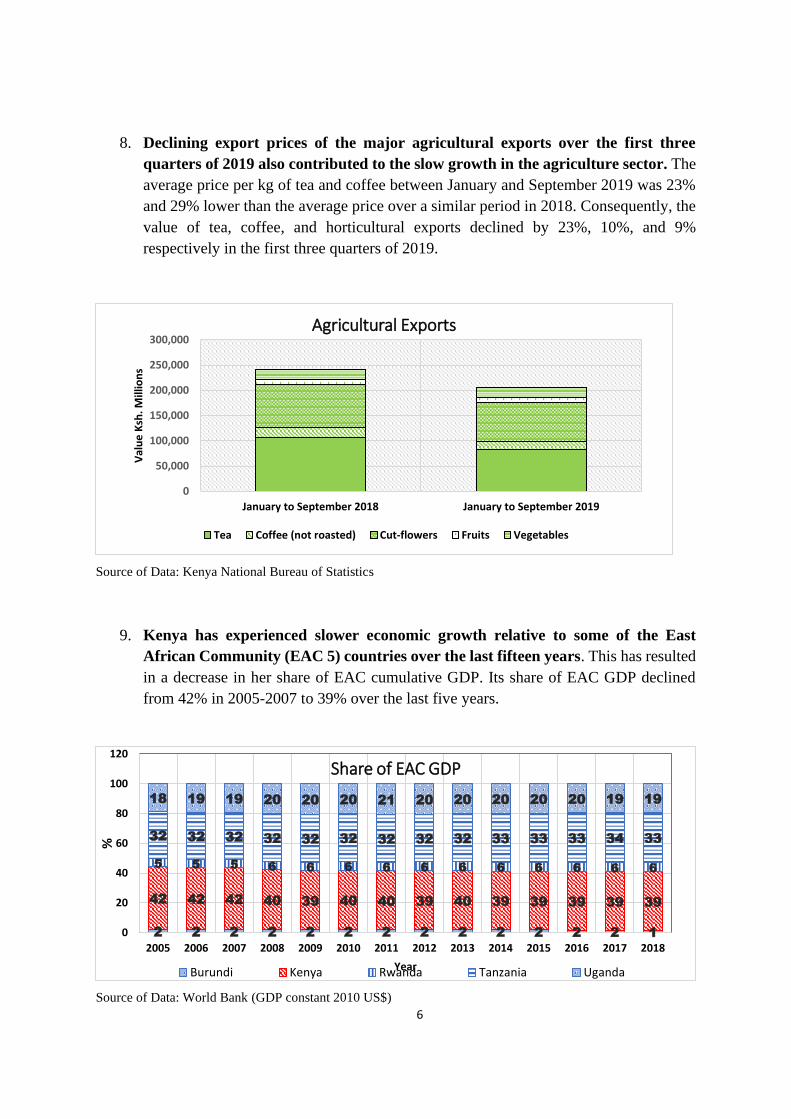
8. Declining export prices of the major agricultural exports over the first three
quarters of 2019 also contributed to the slow growth in the agriculture sector. The
average price per kg of tea and coffee between January and September 2019 was 23%
and 29% lower than the average price over a similar period in 2018. Consequently, the
value of tea, coffee, and horticultural exports declined by 23%, 10%, and 9%
respectively in the first three quarters of 2019.
Source of Data: Kenya National Bureau of Statistics
9. Kenya has experienced slower economic growth relative to some of the East
African Community (EAC 5) countries over the last fifteen years. This has resulted
in a decrease in her share of EAC cumulative GDP. Its share of EAC GDP declined
from 42% in 2005-2007 to 39% over the last five years.
Source of Data: World Bank (GDP constant 2010 US$)
0
50,000
100,000
150,000
200,000
250,000
300,000
January to September 2018 January to September 2019
Val
ue
Ksh
. Mill
ion
s
Agricultural Exports
Tea Coffee (not roasted) Cut-flowers Fruits Vegetables
2 2 2 2 2 2 2 2 2 2 2 2 2 1
42 42 42 40 39 40 40 39 40 39 39 39 39 39
5 5 5 6 6 6 6 6 6 6 6 6 6 6
32 32 32 32 32 32 32 32 32 33 33 33 34 33
18 19 19 20 20 20 21 20 20 20 20 20 19 19
0
20
40
60
80
100
120
2005 2006 2007 2008 2009 2010 2011 2012 2013 2014 2015 2016 2017 2018
%
Year
Share of EAC GDP
Burundi Kenya Rwanda Tanzania Uganda
7
10. The real per capita income has remained lower than that of other comparable
African countries, despite Kenya having made some progress over the last fifteen
years. Kenya’s per capita GDP (current prices) grew from Ksh. 47,000 in 2005 to Ksh.
204,000 in 2019. However, as of 2018, Kenya’s real per capita GDP (constant 2010
US$) was US$ 1,200 while that of Zambia, Ghana and Nigeria was US$ 1700, US$
1800 and US$ 2400 respectively.
Source of Data: World Bank
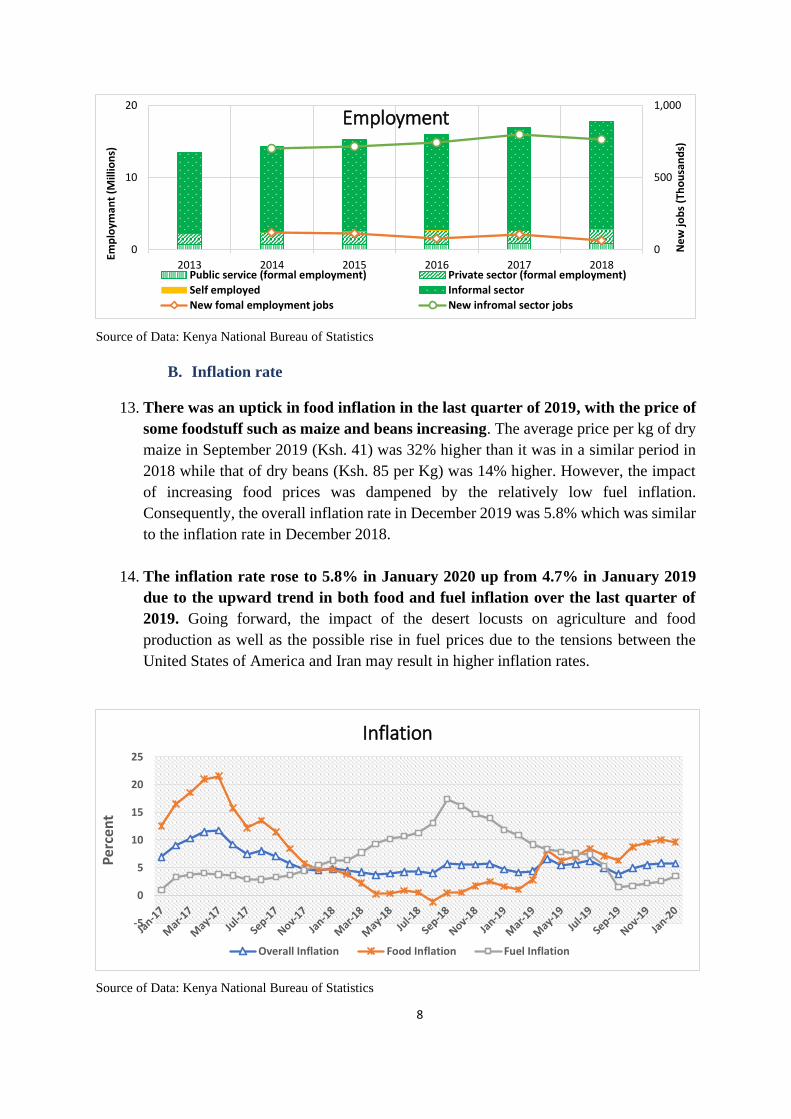
11. The number of new jobs created each year between 2014 and 2018 was below the
government’s target of creating one million new jobs annually. Further, over 83%
of the 800,000 new jobs created annually between 2014 and 2018 were in the informal
sector. Kenya’s informal sector is necessary for the process of structural transformation
as labour shifts from agriculture to well-paying formal sector jobs.
12. However, the income levels of informal sector jobs are often low [1]. Further, the
growth of the informal sector is one of the constraints to enhanced tax revenue
mobilization in Kenya [2] and a large informal sector also poses challenges in financing
universal healthcare (UHC) through a contributory scheme [3].
0
1000
2000
3000
4000
5000
6000
7000
8000
2008 2009 2010 2011 2012 2013 2014 2015 2016 2017 2018
GDP per capita (constant 2010 US$)
Ethiopia Ghana Kenya Nigeria
Zambia Sub-Saharan Africa South Africa
8
Source of Data: Kenya National Bureau of Statistics
B. Inflation rate
13. There was an uptick in food inflation in the last quarter of 2019, with the price of
some foodstuff such as maize and beans increasing. The average price per kg of dry
maize in September 2019 (Ksh. 41) was 32% higher than it was in a similar period in
2018 while that of dry beans (Ksh. 85 per Kg) was 14% higher. However, the impact
of increasing food prices was dampened by the relatively low fuel inflation.
Consequently, the overall inflation rate in December 2019 was 5.8% which was similar
to the inflation rate in December 2018.
14. The inflation rate rose to 5.8% in January 2020 up from 4.7% in January 2019
due to the upward trend in both food and fuel inflation over the last quarter of
2019. Going forward, the impact of the desert locusts on agriculture and food
production as well as the possible rise in fuel prices due to the tensions between the
United States of America and Iran may result in higher inflation rates.
Source of Data: Kenya National Bureau of Statistics
0
500
1,000
0
10
20
2013 2014 2015 2016 2017 2018
Ne
w jo
bs
(Th
ou
san
ds)
Emp
loym
ant
(Mill
ion
s)Employment
Public service (formal employment) Private sector (formal employment)
Self employed Informal sector
New fomal employment jobs New infromal sector jobs
-5
0
5
10
15
20
25
Per
cen
t
Inflation
Overall Inflation Food Inflation Fuel Inflation
9
C. Interest rates and credit
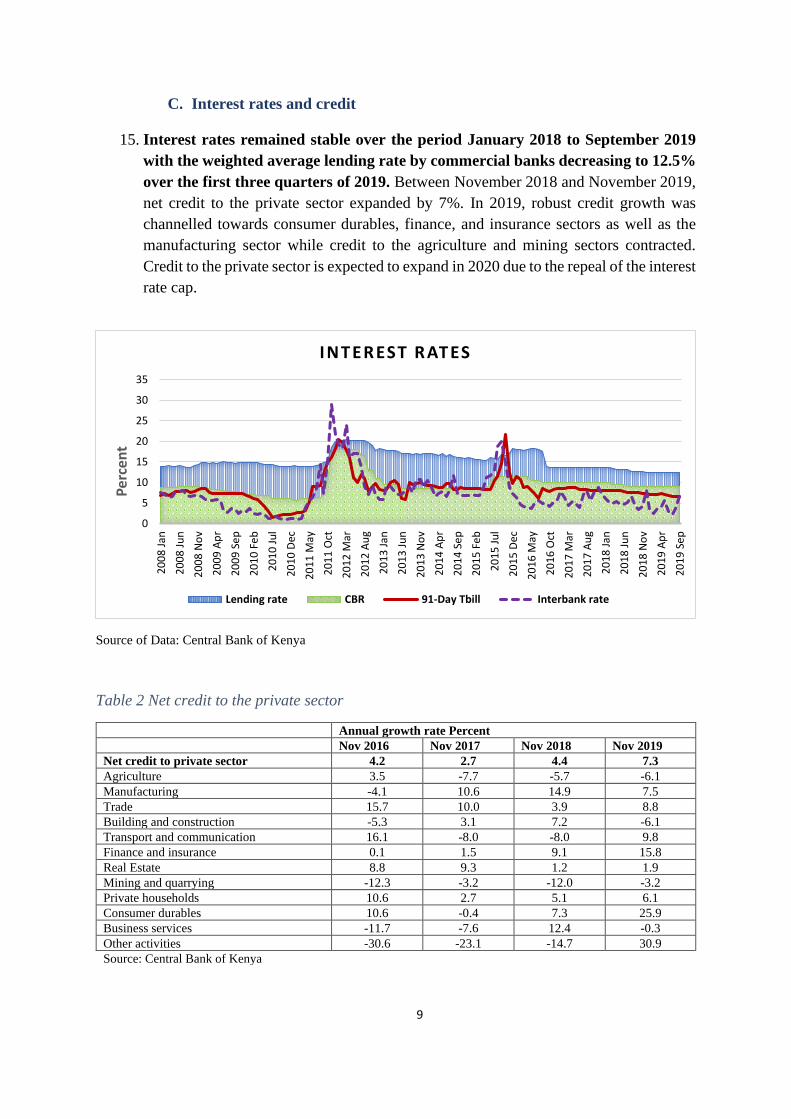
15. Interest rates remained stable over the period January 2018 to September 2019
with the weighted average lending rate by commercial banks decreasing to 12.5%
over the first three quarters of 2019. Between November 2018 and November 2019,
net credit to the private sector expanded by 7%. In 2019, robust credit growth was
channelled towards consumer durables, finance, and insurance sectors as well as the
manufacturing sector while credit to the agriculture and mining sectors contracted.
Credit to the private sector is expected to expand in 2020 due to the repeal of the interest
rate cap.
Source of Data: Central Bank of Kenya
Table 2 Net credit to the private sector
Annual growth rate Percent
Nov 2016 Nov 2017 Nov 2018 Nov 2019
Net credit to private sector 4.2 2.7 4.4 7.3
Agriculture 3.5 -7.7 -5.7 -6.1
Manufacturing -4.1 10.6 14.9 7.5
Trade 15.7 10.0 3.9 8.8
Building and construction -5.3 3.1 7.2 -6.1
Transport and communication 16.1 -8.0 -8.0 9.8
Finance and insurance 0.1 1.5 9.1 15.8
Real Estate 8.8 9.3 1.2 1.9
Mining and quarrying -12.3 -3.2 -12.0 -3.2
Private households 10.6 2.7 5.1 6.1
Consumer durables 10.6 -0.4 7.3 25.9
Business services -11.7 -7.6 12.4 -0.3
Other activities -30.6 -23.1 -14.7 30.9
Source: Central Bank of Kenya
0
5
10
15
20
25
30
35
20
08
Jan
20
08
Ju
n
20
08
No
v
20
09
Ap
r
20
09
Se
p
20
10
Fe
b
20
10
Ju
l
20
10
Dec
20
11
May
20
11
Oct
20
12
Mar
20
12
Au
g
20
13
Jan
20
13
Ju
n
20
13
No
v
20
14
Ap
r
20
14
Se
p
20
15
Fe
b
20
15
Ju
l
20
15
Dec
20
16
May
20
16
Oct
20
17
Mar
20
17
Au
g
20
18
Jan
20
18
Ju
n
20
18
No
v
20
19
Ap
r
20
19
Se
p
Per
cen
t
INTEREST RATES
Lending rate CBR 91-Day Tbill Interbank rate
10
D. External sector
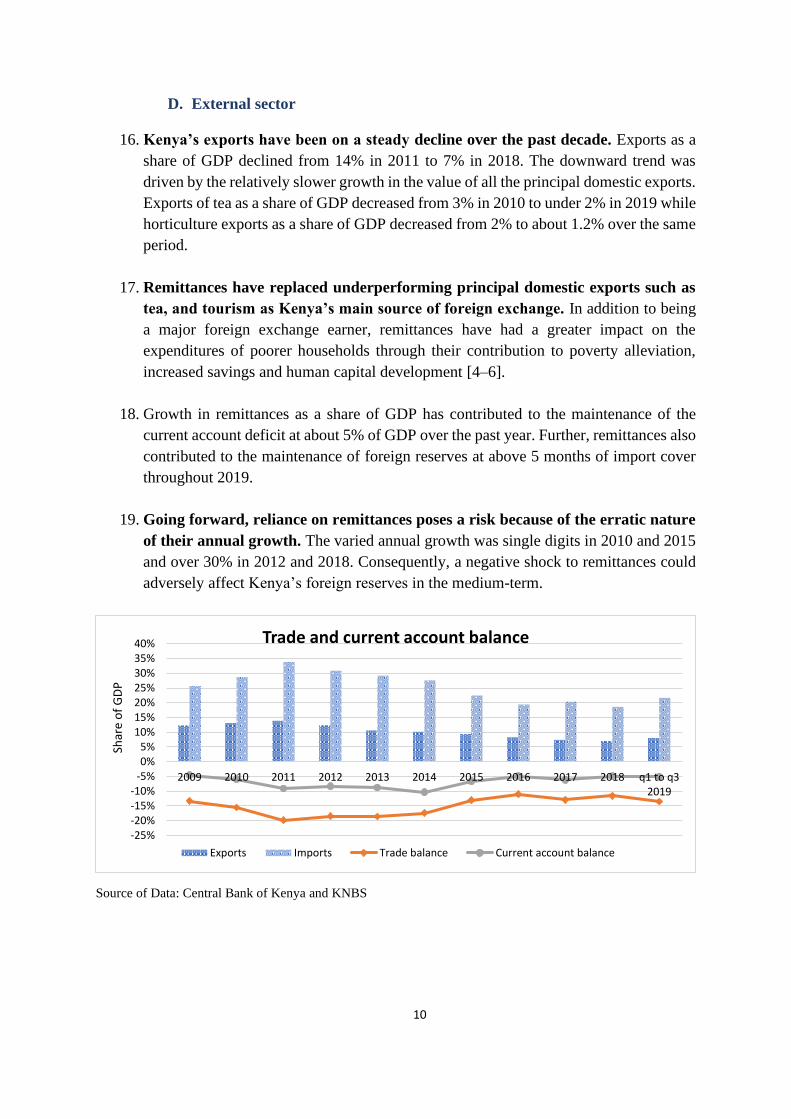
16. Kenya’s exports have been on a steady decline over the past decade. Exports as a
share of GDP declined from 14% in 2011 to 7% in 2018. The downward trend was
driven by the relatively slower growth in the value of all the principal domestic exports.
Exports of tea as a share of GDP decreased from 3% in 2010 to under 2% in 2019 while
horticulture exports as a share of GDP decreased from 2% to about 1.2% over the same
period.
17. Remittances have replaced underperforming principal domestic exports such as
tea, and tourism as Kenya’s main source of foreign exchange. In addition to being
a major foreign exchange earner, remittances have had a greater impact on the
expenditures of poorer households through their contribution to poverty alleviation,
increased savings and human capital development [4–6].
18. Growth in remittances as a share of GDP has contributed to the maintenance of the
current account deficit at about 5% of GDP over the past year. Further, remittances also
contributed to the maintenance of foreign reserves at above 5 months of import cover
throughout 2019.
19. Going forward, reliance on remittances poses a risk because of the erratic nature
of their annual growth. The varied annual growth was single digits in 2010 and 2015
and over 30% in 2012 and 2018. Consequently, a negative shock to remittances could
adversely affect Kenya’s foreign reserves in the medium-term.
Source of Data: Central Bank of Kenya and KNBS
-25%-20%-15%-10%
-5%0%5%
10%15%20%25%30%35%40%
2009 2010 2011 2012 2013 2014 2015 2016 2017 2018 q1 to q32019
Shar
e o
f G
DP
Trade and current account balance
Exports Imports Trade balance Current account balance
11
Source of Data: Central Bank of Kenya
E. Nairobi Securities Exchange
20. The NSE 20 share index has been on a downward trend since the beginning of
2018. However, unlike the steep decline that was experienced in 2018, the past year
was marked by a more subdued contraction. The NSE 20 share index declined from
2,797 points in November 2018 to 2,619 points in November 2019.
Source of Data: Kenya National Bureau of Statistics & NSE
21. Market concentration continues to be a major risk at the NSE. The market value of
the top five companies by market capitalization increased from 66% in the fourth
quarter of 2018 to 73% in the fourth quarter of 2019. To stem the risk posed by market
concentration, the Capital Markets Authority (CMA) has adopted a strategy aimed at
encouraging other big companies to list at the NSE [7].
0
1
2
3
4
5
6
7
0
2,000
4,000
6,000
8,000
10,000
12,000
14,000
16,000
2018Nov
2018Dec
2019Jan
2019Feb
2019Mar
2019Apr
2019May
2019Jun
2019Jul
2019Aug
2019Sep
2019Oct
2019Nov
Mo
nth
s
End
of
pe
rio
d U
SD M
illio
nForeign reserves
Official reserves Commercial Banks Months of import cover
0500
10001500200025003000350040004500
20
18
Jan
20
18
Fe
b
20
18
Mar
20
18
Ap
r
20
18
May
20
18
Ju
n
20
18
Ju
l
20
18
Au
g
20
18
Se
p
20
18
Oct
20
18
No
v
20
18
De
c
20
19
Jan
20
19
Fe
b
20
19
Mar
20
19
Ap
r
20
19
May
20
19
Ju
n
20
19
Ju
l
20
19
Au
g
20
19
Se
p
20
19
Oct
20
19
No
v
NSE
20
Sh
are
ind
ex
(Bas
e J
anu
ary
19
66
=10
0)
Performance of the Nairobi Securities Exchange
12
F. Economic outlook
22. The economy is projected to grow at 6.1% in the year 2020 and 7% over the
medium term. The growth will be supported by investments under the “big four”,
growth in tourism and exports as well as public investment in infrastructure. However,
the following risks to the projected growth were highlighted in the 2020 BPS:
I. An uptick in global oil prices resulting from USA Iran tensions.
II. Uncertainty over the United Kingdom and European Union post-Brexit trade
agreement.
III. Low export prices of Kenya’s main agricultural exports.
IV. Increased frequency of natural disasters such as floods, landslides, and droughts.
V. The negative impact of desert locusts on agricultural output and food security.
The proposed mitigation measures for the identified risks include:
I. Continued accumulation of foreign reserves to deal with external shocks.
II. Adoption of a Disaster Risk Financing Strategy to deal with natural disasters.
III. Expansion of irrigation schemes and promotion of value addition in agriculture.
Emerging issues
I. Wage related spending was identified in the BPS 2020 as one of the risks to the
projected growth, however, the share of GDP of national government wages and
salaries decreased from 5.9% in 2013 to 4.7% in 2018. The downward trend of the
wage bill was also evident in national government wages as a share of tax revenue
which decreased from 35% in 2010 to 30% in 2018. Thus the wage bill is no longer
the key driver that is pushing overall government expenditure as a share of GDP
upwards.
II. The risk associated with public expenditure pressures may be attributed to the rising
costs of debt service. Over the period 2013 to 2018, interest payments as a share of tax
revenue increased from 14% to 26%.
III. Reliance on remittances for the accumulation of foreign exchange reserves may pose a
risk due to their volatility as well as the tougher anti-immigration policies being
adopted in the United States of America and many European Union countries.
IV. Enhanced foreign reserves are needed to cover the increasing foreign debt repayments.
Between 2010 and 2018, the interest payment on foreign debt has increased from 1%
of exports of goods and services to about 8%.
13
HARNESSING THE BIG FOUR FOR JOB CREATION AND
ECONOMIC PROSPERITY
23. In the BPS 2018, the government identified four key strategic areas of focus (“The Big
Four”) that were to accelerate broad-based economic growth and address challenges
such as unemployment, poverty, and income inequality. The strategic areas under the
big four plan that were outlined in the 2018 BPS include:
I. Creation of jobs and poverty reduction through supporting value addition and raising
the manufacturing sector’s share of GDP to 15 percent by 2022.
II. Focusing on initiatives that guarantee food security and improve nutrition to all
Kenyans by 2022.
III. Providing Universal Health Coverage thereby guaranteeing quality and affordable
healthcare to all Kenyans.
IV. Improving living standards of Kenyans by providing at least five hundred thousand
(500,000) affordable new houses by 2022.
24. The Big Four agenda has been in implementation over the past two years and with
approximately two and a half years left to finalize implementation, the 2020/21 budget
should not only take stock of what has been achieved so far but also provide a clear
plan for how the remaining targets will be achieved within the remaining time frame.
25. Generally, it is not easy to keep track of the big four projects as these are scattered
throughout the entire budget and the manner of reporting differs from year to year.
Some of the targets/outputs that were specified in previous BPSs as part of the Big Four
agenda have fizzled out and are no longer mentioned in the 2020 BPS. It isn’t clear
whether these have been completely dropped off or were already achieved.
26. As indicated in previous discussions on the Big Four Agenda, it would perhaps be more
useful to have a separate accountability framework for the Big Four that clearly spells
out the policies and programmes with a results matrix for resource allocation as well as
a monitoring and evaluation framework.
A. Supporting the manufacturing sector for job creation
27. The main goal of the manufacturing pillar is to support job creation through increased
value addition and to raise the manufacturing share of GDP to 15% by the year 2022.
As such, the government sought to undertake reforms with the aim of improving the
business environment so as to encourage investment in manufacturing, and to protect
local industries against dumping. Some of the main initiatives that were to be
undertaken include;
I. Development of Special Economic Zones and industrial parks.
14
II. Promotion of value addition to agricultural products.
III. Promotion of manufacture of automotive and motorcycle parts.
IV. Skills development and enhanced capacity for research and technology
development.
28. In the 2020 BPS, some indicative progress on the policies and programmes under this
pillar are provided. Under the Special Economic Zones (SEZ) and Industrial Parks, it
is reported that the Dongo Kundu SEZ is being developed as is the construction of the
Naivasha Industrial Park. Pre-feasibility studies for the Kisumu Special Economic Zone
are also underway. However, this reporting is very scanty and a further review of the
targeted outputs under this pillar reveals a few gaps.
29. Leather Industry: For the Kinanie Leather Park, it is reported that the Common
Effluent Treatment Plant is 30% complete against a target of 40% completion by
2018/19. Further, the government targets to scale this up to 80% completion by end of
2019/20 and 100% completion by 2020/21.
30. A common Effluent Treatment Plant is arguably one of the most important targets for
the industrial park to be functional. According to the Leather Industry report, one of the
biggest difficulties facing the leather industry is a lack of quality effluent facilities
which increases environmental and health costs associated with processing finished
leather. One of the major attractions of any leather park, therefore, is the Common
Effluent Facility hence the need to expedite its completion.
31. The BPS 2020, is not clear on why the 2018/19 target was not met, whether the 80%
completion rate target for 2019/20 is on track and what measures have been put in place
to ensure 100% completion by 2020/21. Furthermore, it is not clear whether
interventions in the livestock industry have been adequate enough to improve the
quality of hides and skins produced as this is one of the major challenges facing the
leather industry. For FY 2018/19, the Kenya Meat Commission failed to achieve its
targeted number of hides and skins production and it isn’t clear whether it will meet its
2019/20 target.
32. The Dongo Kundu SEZ and Naivasha Industrial Park are reported as ongoing however,
it is not clear whether the 40% and 30% completion targets respectively for 2019/20
are on track especially since previously reported actual achievement for 2018/19 was
only 3% and 4% completion respectively. It would be very crucial for further details to
be provided on what aspects of these SEZs are being developed in order to properly
gauge progress.
33. Textile Industry: In the textile sector, Rivatex is reportedly making significant
progress in the installation of machinery, an effluent plant as well as increasing the
acreage under cotton production and the amount of cotton produced.
15
34. The government recently approved commercial farming of BT Cotton with effect from
March 2020 following successful field trials. This is expected to boost production
significantly as well as mitigate against losses from pests and diseases among other
environmental stresses. The government is also targeting to distribute seeds and
fertilizer in order to address quality concerns. While this is good progress for the textile
sector, the focus should shift towards complementary interventions such as education
of cotton farmers on proper planting, harvesting and defoliation practices in order to
improve the quality of production.
35. In the unpacking of the BPS 2018, one of the biggest concerns in the textile and apparel
sector is poor labour productivity. According to the 2015 textile industry report, training
given to workers in the textile industry is not only of poor quality but has also been
described as ‘not fit for purpose.’ Thus, though there is ongoing industrial training as
reported in the BPS, it is not clear whether a training needs audit was carried out and
the syllabus structured accordingly. Most of the training in textile training institutions
has focused on fashion and design rather than production skills even though these are
also in demand.
Emerging issues
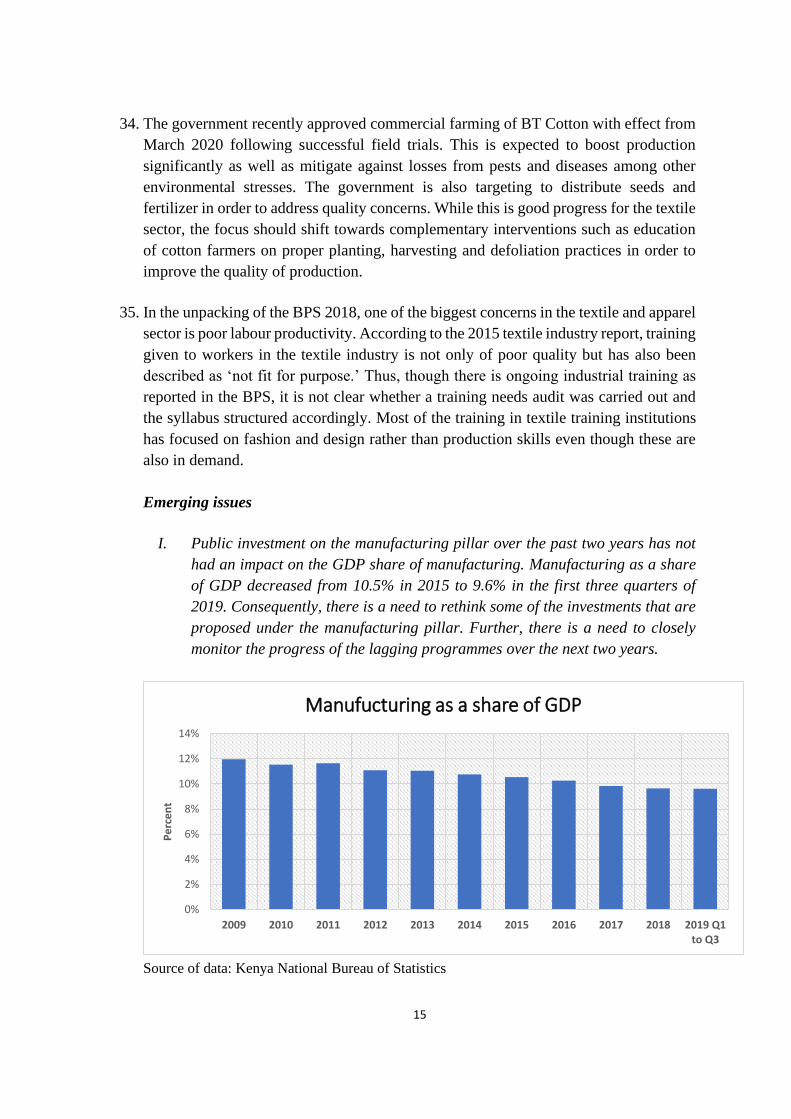
I. Public investment on the manufacturing pillar over the past two years has not
had an impact on the GDP share of manufacturing. Manufacturing as a share
of GDP decreased from 10.5% in 2015 to 9.6% in the first three quarters of
2019. Consequently, there is a need to rethink some of the investments that are
proposed under the manufacturing pillar. Further, there is a need to closely
monitor the progress of the lagging programmes over the next two years.
Source of data: Kenya National Bureau of Statistics
0%
2%
4%
6%
8%
10%
12%
14%
2009 2010 2011 2012 2013 2014 2015 2016 2017 2018 2019 Q1to Q3
Pe
rce
nt
Manufucturing as a share of GDP
16
II. The targets set for 2020/2021 and the medium term for many of the key projects
under the manufacturing pillar may not be achieved. For instance, the Common
Effluent Treatment Plant at Kinanie Leather Park which was reported to be
30% complete in 2018/19 is expected to be scaled up to 80% completion by end
of 2019/20 and 100% completion by 2020/21. Similarly, the Dongo Kundu SEZ
and Naivasha Industrial Park which reported 3% and 4% completion
respectively in 2018/19 have a target of 40% and 30% completion targets
respectively for 2019/20.
B. Food and Nutrition Security to all Kenyans
36. The overall strategy under this pillar is to expand irrigation schemes, support large
scale production of staples, increase access to agricultural inputs, implement
programmes to support smallholder farmers and promote the use of appropriate farming
techniques.
37. The government has made some strides towards increasing land under irrigation.
Notably, the 2020 BPS reported that Galana Kulalu farm acreage increased from 52,000
to 100,000, further, both the Lower Nzoia Irrigation project and the rehabilitation of
Bura irrigation scheme are underway. However, a review of the key outputs and
performance indicators matrix reveals that only 2000 acres out of a targeted 10,000
acres were planted in Galana Kulalu in 2018/19 and the target for 2019/20 is an
additional 5,300 acres. Further, it should also be noted that maize production in Galana
Kulalu was only 4,320 tons in 2018/19 against a target of 54,000 tons and the targeted
production for 2019/20 is 4,000 tons.
38. Bura irrigation scheme also appears to be off-target as the number of acres rehabilitated
was reported as 196 acres against a target of 8,000 acres in 2018/19. Further, the target
for 2019/20 is 7000 acres but it isn’t clear what strategies were put in place to improve
performance given the dismal performance of the previous financial year. It should also
be noted that tons of seed maize produced in the Bura scheme was 1,186 tons against a
target of 10,000 tons and given this performance it isn’t clear how the target to produce
20,000 tons in 2019/20 will be achieved.
39. The National Expanded Irrigation Scheme has reported significant progress in
increasing the amount of acreage under irrigation as well as the amount of rice and
maize produced. Mwea Irrigation scheme appears to be performing reasonably well as
is the Turkana, Perkerra, Lower Kuja and Lower Sabor Irrigation schemes in terms of
increasing acreage under production. However, it is not clear whether there has been a
concomitant increase in food production in these schemes as this is not expressly
reported.
17
40. Fish production is also a key strategy being employed to attain food security. In the face
of recent reports of pollution and poisons killing Lake Victoria, there is a need for a
clear strategy by the government on how this issue will be addressed in order to protect
the fish industry. In the output and KPI matrix, there are no clear interventions to
address pollution concerns in Lake Victoria.
C. Universal Health Coverage
41. The main purpose of the Universal Healthcare Coverage pillar was to reduce
inequalities in healthcare by making it easy for all citizens to access healthcare services
at minimum cost. A pilot programme was rolled out in 2018 in Kisumu, Isiolo,
Machakos and Nyeri counties.
42. Milestones reported in the BPS 2020 for this pillar include increased access to essential
health services, increased skilled deliveries attributed to the Linda mama initiative,
operationalization of the Othaya National Teaching and Referral Hospital as well as the
Kenyatta University Teaching Research and Referral Hospital, Beyond Zero mobile
clinics in all 47 counties, decentralizing of cancer management services, enhanced
access to specialized services in 120 hospitals across the country under the Managed
Equipment Service (MES) and increased health care access under the Health Insurance
Subsidy Programme (HISP).
43. The BPS 2020 reports that moving forward the focus will be on addressing human
resource needs, providing basic equipment and ensuring the availability of
pharmaceutical and non-pharmaceutical commodities in all health facilities, however,
the strategy of how this will be achieved remains unclear.
44. Lack of equipment and amenities, as well as strikes by doctors and nurses due to various
concerns, are arguably the main challenges facing the health sector. It is therefore not
enough to simply state that there will be an increased focus on these matters without
providing a clear strategy complete with targets and Key Performance Indicators.
Furthermore, it is extremely crucial for the National government to indicate how it is
collaborating with the County governments as Health is a devolved function. This is a
key missing link. Further, the challenges facing NHIF have to be addressed for
universal healthcare to be successful.
45. There is no report on the progress of key policy reforms under this pillar such as medical
tourism strategy, development of emergency medical care policy, implementation of
the Kenya Environmental Sanitation & Hygiene policy; as well as legal reforms
(enactment of the food and drug authority bill, National research for health bill, etc.).
In addition, there are key reports pending publication to review the implementation of
projects such as the MES project of the UHC program that if published, could enhance
efficiency and value for money.
18
D. Affordable and Decent Housing for All Kenyans
46. One of the goals of this pillar is to provide 500,000 affordable housing units by the year
2020. In an effort to realise this goal, the government has forged partnerships with the
private sectors. One such partnership is the Habitat Height by the United Nations Office
for Project Services (UNOPS). Through this partnership, 8,888 low-cost units will be
availed to Kenyans and a further 200,000 units in due course.
47. The government has also identified land to develop 100,000 units and ensure the
provision of all amenities of a modern metropolis. However, it should be noted that
beyond UNOPS it is not clear whether the government has been able to identify other
Private Sector Partners in order to be able to fully fund this project. It may be difficult
to convince other private partners to take on this project given the duration of
implementation as well as uncertainty on whether the project will be carried forward
when government transitions in 2022.
48. The BPS 2020 reports that the National and County Governments will appropriate land
for affordable housing projects at no cost. However, it is not clear how much land the
government can avail in this manner.
49. Other measures that have been identified as enablers to achieving the goals of this pillar
include exempting homeowners from Stamp duty under the affordable housing scheme,
doubling of the homeownership saving plan, waiving construction charges by NEMA
and National Construction Authority as well as operationalizing the National Housing
Development Fund and the Kenya Mortgage Refinancing Company. In addition, the
government will reportedly amend the Housing Fund law to make contributions to the
Housing Fund voluntary.
50. Under social housing, the government is looking for suitable investors to implement
decent homes project for Nairobi’s Kibera Zone B residents.
19
BUDGET FOR FY 2020/21 AND THE MEDIUM TERM
51. The FY 2020/21 budget framework is guided by a fiscal consolidation strategy which
aims at containing the upward pressures of debt accumulation. In order to achieve this,
the budgetary allocations will be as follows (Ksh. Millions):
i. Executive Ksh. 1,778,133
ii. Parliament Ksh. 36,222
iii. Judiciary Ksh. 18,051
iv. Consolidated Fund Services1 Ksh. 574,650
v. County Equitable Share2 Ksh. 316,500
Total Ksh. 2,723,556
vi. Equalization Fund Ksh. 6,500
vii. Contingency Fund Ksh. 5,000
Grand total Ksh. 2,735,056
A. REVENUE PERFORMANCE & OUTLOOK
52. The 2020 BPS has revised the ordinary revenue target for FY 2019/20 downward by
Ksh 33.4 billion. The tax heads that have had their projections reduced include; income
tax, import duty, and VAT as shown in Table 3 below. However, Excise duty and other
revenues (including investment revenues) are projected to increase by Ksh 19.4 billion
and Ksh 79.2 billion respectively.
53. Going forward, total revenue collection for the FY 2020/21 including appropriation-in-
aid (A.I.A) amounts to Ksh. 2,134.1 billion (18.3 percent of GDP) as compared to
Ksh.2,084.2 billion in 2019/2020 (20.1 percent of GDP). Ordinary revenue in the next
financial year is projected at Ksh.1, 856.7 billion (16 percent of GDP). Growth in
revenue projections will be occasioned by an increase in revenue collection from
income tax head as well as VAT head. Generally, it is projected that overall revenue in
the FY 2020/21 is expected to grow by 2 percent as compared to FY 2019/20 with
ordinary revenue expected to grow by 1 percent while A.I.A is expected to increase by
18 percent to Ksh. 249.6 billion. It’s worth noting that there is volatility in A.I.A,
therefore the projection may not be achieved over the medium term.
54. The growth of revenues in the medium term is underpinned by on-going reforms in tax
policy, revenue administration, automation, modernizing and simplifying various tax
laws. However, further details of these tax policies have not been provided.
1 Consolidated fund services is composed of domestic interest, foreign interest and pension 2 The allocation for County Governments is based on the sharable revenue.
20
Table 3 Revenue Performance and projections for the FY 2017/18-2020/21
2017/18 (Ksh. billions) (Actual)
2018/19(Ksh. billions) (Actual)
2019/20 (Printed Estimates) (Ksh. billions)
2019/20(revised projections) (Ksh. billions)
Deviations (Printed Vs. Revised) (Ksh. billions)
2020/21(Ksh. billions)
2020/21 vs. 2019/20 (Ksh. billions)
Total Revenue 1,522.5 1,698.8 2,115.9 2,084.2 (31.7) 2,134.1 49.9
Ordinary Revenue 1,365.1 1,496.9 1,877.2 1,843.8 (33.4) 1,856.7 12.9
Income Tax 640.6 685.4 884.4 804.5 (79.9) 862.3 57.8
Import Duty 93.9 107.7 135.4 128.2 (7.2) 126.5 (1.7)
Excise Duty 167.8 194.3 242.2 261.6 19.4 258.0 (3.6)
Value Added 356.9 413.2 496.0 464.5 (31.5) 496.4 31.9
Investment Income 24.1 23.8 33.0 19.7 (13.3) 21.0 1.3
Other 81.8 72.6 86.1 165.3 79.2 92.5 (72.8)
Railway Development Levy 20.8 21.3 27.7 28.4 0.7 27.8 (0.6)
A.I. A 136.6 180.6 211.0 212.0 1.0 249.6 37.6
Source: National Treasury, 2020
B. EXPENDITURE
55. Given the modest projected growth of revenues in FY 2020/21, the government has
contracted expenditures with the aim of contracting the fiscal balance deficit to 5.3
percent of GDP from 7.6 percent of GDP in FY 2019/20. Overall, expenditures are
expected to contract from Ksh. 2,874.2 billion to Ksh. 2,748.2 billion (23.6 percent of
GDP). The recurrent expenditure will witness an increment of Ksh. 21 billion
occasioned by an increase in interest payments, wages & salaries and pensions
payments.
56. The development expenditure is set to be reduced by 143.5 billion or 5 percent of GDP.
Under development expenditure, both foreign-financed, as well as domestically
financed projects, are set to reduce by 0.6 percent and 1.4 percent to stand at 2.1 percent
of GDP and 2.9 percent of GDP respectively.
57. It’s worth noting that despite the government exploring fiscal consolidation over the
medium term, there is no clear strategy on how to get it done. Further, a significant
reduction of expenditures, especially in development expenditure, may lead to delays
in ongoing projects as well as the escalation of the number of stalled projects.
21
Table 4 Expenditure Performance and Outlook
2017/18 (billions)
2018/19 (billions)
2019/20 Printed Estimates (billions)
2019/20 Revised (billions)
Deviations (2019/20 Printed vs. Revised (Ksh. billion)
2020/21 (billions)
Deviations (2020/21 estimates vs. Revised 2019/20) (Ksh. billion)
Expenditure &Net Lending 2,146.7 2,433.7 2,789.5 2,874.2 84.7 2,748.2 (126.0)
Recurrent Expenditure 1,349.9 1,531.1 1,760.0 1,760.0 - 1,781.0 21.0
Interest Payments 323.9 375.7 441.5 441.5 - 456.0 14.5
Wages & benefits 388.9 417.5 483.5 487.6 4.1 500.7 13.1
Pensions 65.1 70.8 108.6 108.6 - 118.7 10.1
Other 570.2 667.1 726.4 722.3 -4.1 705.6 (16.7)
Development & Net Lending 469.5 541.9 652.3 730.8 78.5 587.3 (143.5)
Domestically Financed 266.0 307.0 390.2 442.5 52.3 334.5 (108.0)
Foreign Financed 201.0 225.4 255.8 281.9 26.1 246.3 (35.6)
Net Lending 2.5 2.5 0.6 0.6 - - (0.6)
Contingency - - 5.0 5.0 - 5.0 -
Equalization Fund - 7.0 5.8 5.8 - 6.5 0.7
County Allocation 327.3 360.7 371.8 378.3 6.5 375.0 (3.3)
Source: National Treasury
C. MTEF SECTORS ALLOCATIONS FOR THE FY 2020/21
58. The total allocation for ministerial expenditure is set to decrease to Ksh.1.83 trillion
compared to Ksh.2 trillion in FY 2019/20. There is a significant decrease in the budget
for most sectors. However, Education, National Security, and Environment Protection,
Water & Natural Resources have received modest budgetary increments.
59. The decrease in budgetary allocation for the Agriculture, Rural & Urban Development
sector is a result of the reorganization of government as some departments have been
moved to the Ministry of Water, Sanitation and Irrigation. Budgetary reduction in
Energy, Infrastructure, and ICT is a result of a budgetary reduction in the Roads and
Rail transport programmes under this sector while the reduction in GECA sector is due
to a budgetary reduction in the programmes such as industrial development and
investments and Integrated Regional Development.
22
Table 5 Sectors ceiling for financial year 2019/2020(Kshs. Millions)
Sector
2019/20 Supplementary Estimates Ceiling
BPS Ceiling - 2020/21
Percentage Change
Agriculture, Rural & Urban Development 59,408.9 48,094.2 -19.0%
Energy, Infrastructure & ICT 480,866.0 388,974.8 -19.1%
General Economic & Commercial Affairs 32,734.2 23,553.8 -28.0%
Health 115,629.1 114,477.5 -1.0%
Education 496,732.1 497,798.5 0.2%
Governance, Justice, Law & Order 210,379.1 201,909.5 -4.0%
Public Administration & International Relations 285,925.1 232,187.4 -18.8%
National Security 159,150.6 159,319.8 0.1%
Social Protection, Culture & Recreation 71,354.4 69,361.7 -2.8%
Environment Protection, Water & Natural Resources 94,784.8 96,728.9 2.1%
Grand Total 2,006,964.3 1,832,406.1 -8.7%
Division of revenue between the two levels of government
A. Review of historical budget allocation to counties
60. The counties have received a total of Ksh.1.906 trillion since 2013/14. The total annual
disbursements to counties grew from Kshs. 195.66 billion in the FY 2013/2014 to Kshs.
364.38 billion in the FY 2018/19. The nominal growth was driven mainly by an increase
of equitable share, nominal growth of GoK funded conditional grants, and an increase
in additional conditional allocations from the Road Maintenance Levy Fund and other
conditional allocations. Table 6 provides a summary of the disbursements to the
counties for the period 2013/14-2018-19.
23
Table 6 Summary of Disbursement to Counties in the FY 2013/14-2018/19 in Kshs. Millions
Transfer Type 2013/14 2014/15 2015/16 2016/17 2017/18 2018/19 Total
1. Equitable share transfer 190,000 226,660 259,774 280,300 302,000 314,000 1,572,735
2. GoK-Funded Conditional Allocations
5,665 3,261 10,901 13,705 15,408 19,317 60,558
a) Level Five Hospital 3,419 1,863 3,600 4,000 4,200 4,326 21,409
b) Free Maternal Healthcare3 2,246 1,398 3,321 4,105 3,400 4,300 11,070
c) Managed Equipment Services - - 3,080 4,500 4,908 8,830 21,318
d) Foregone User Fees Compensation
- - 900 900 900 900 3,600
e) Rehabilitation of Youth Polytechnics
- - - - 2,000 961 2,961
f) Emergency Medical Service Grant
- - - 200 - - 200
g) Construction of County HQs - - - - - - -
3. Additional conditional allocations - 1,137 5,547 10,905 17,797 31,070 66,456
a) Road Maintenance Levy Fund -
3,300 4,307 10,262 7,424 25,293
b) External Loans and Grants - 1,137 2,247 1,756 7,535 23,646 36,321
4. Allowances for County medical personnel
-
4,842 - - 4,842
5. Coffee Cess - - - 107 - - 107
Total Disbursements 195,665 231,058 276,222 309,859 335,205 364,387 1,704,591
% Share of Conditional Allocations to the Total Disbursement
2.90 1.90 5.95 7.98 9.91 13.83 7.46
Source: The National Treasury, 2019
61. The gains of devolution have been felt differently across the 47 counties. In some
counties, devolution has led to infrastructural developments, improved service delivery
and the drafting of development plans that are more localized. Additionally, public
services have now become more accessible to the residents of counties due to local
control and management brought about by the devolution process.
Salient issues
I. The disbursements to the GOK funded conditional grants increased from Kshs. 5.67
billion in the FY 2013/14 to Kshs. 19.32 billion in the FY 2018/19. While the number
of these grants has increased over the years there is no clear basis/criteria that
determines how much conditional grants are allocated and the basis of distribution.
II. Conditional allocations financed by loans and grants from development partners have
increased from Kshs. 1.11 billion in the FY 2014/15 to Kshs. 23.64 billion in the FY
2018/2019.
III. The share of disbursements as equitable share to the counties grew from Kshs. 190
billion in the FY 2013/14 to Kshs. 314 billion in FY 2018/19. The allocation to
equitable share is arrived at through calculation of parameters such as population,
poverty e.t.c There is however no established criteria on how they are distributed. To
spur economic growth and enhance service delivery in line with the scheduled county
functions, there should be clear criteria used in the sharing of resources across sectors
3 In FY 2017/18 and FY 2018/19, Ksh. 3.4 billion and Ksh 4.3 billion, respectively, from the
National Government’s revenue share was paid to the National Hospital Insurance Fund (NHIF) as
a special grant for Free Maternal Healthcare, to be disbursed directly to Counties on reimbursement
basis.
24
once the funds reach the counties and a further need to assess the impact of equitable
share on delivery of services.
B. Comparison between the National Treasury and Commission on
Revenue Allocations proposed County Allocations
62. Out of the total projected shareable revenue of Kshs. 1,856.70 billion, Kshs. 1,533.67
Billion will be allocated as the equitable share to National Government. The National
Treasury also proposes an allocation of Ksh. 369.87 Billion to the County Governments
for FY 2020/21. This amount comprises of Ksh. 316.5 Billion as county equitable share
and Ksh. 13.73 billion as GOK conditional grants, Kshs. 9.43 billion allocation from
the Road Maintenance Levy and Kshs. 30.20 billion as allocations from loans and
grants. The allocation for the Equalization Fund for FY 2020/21 is Kshs. 6.53 Billion
which is a 13 percent increase from the Kshs. 5.76 billion allocated in the FY 2019/20.
63. In the Budget Review and Outlook Paper (BROP) 2019 as well as the draft BPS 2020,
the National Treasury had proposed an equitable share of Kshs. 317.8 billion to county
governments for the FY 2020/21, however the revised proposal to allocate Kshs. 316.5
billion is informed largely by;
I. Continued underperformance in ordinary revenue, which forms the base for the annual
division of revenue;
II. The fact that the National Government solely bears the shortfalls in revenue in any
given FY;
III. The 10.3% projected contraction in National Government’s net spending in FY 2020/21
vis-a-vis FY 2019/20
IV. The proposal by National Treasury that the entire incremental revenue in FY 2020/21
be earmarked for CFS, specifically debt repayment and pensions
64. The Commission on Revenue Allocation, on the other hand, recommended County
Equitable share revenue of Kshs. 321.74 billion to be shared among county
governments on the basis of its proposed third basis formula of revenue sharing.
However, this basis has not been approved by Parliament pursuant to Article 217 of
the Constitution.
65. The Commission recommended an adjustment to both the National and County
governments’ development expenditures on the basis of the average rate of the
country’s economic growth. The Commission recommended an adjustment of 5.7
percent (based on the Country’s three year (2016-2018) average economic growth) on
the actual three-year average development expenditure for each level of government.
The adjustment translates to the additional allocation of Kshs. 5.24 billion to the
counties thus translating to a proposed equitable county allocation of Kshs. 321.74
25
billion in the FY 2020/21 and additional Kshs. 31.35 billion to the National
Government to finance development activities.
66. Table 7 shows a comparison of the proposals by the National Treasury and CRA in
County allocations and the basis for the proposals.
Table 7 Proposals by N.T and CRA for Equitable Share of Revenues for FY 2020/21 In Ksh.
Billion
Equitable Share of Revenues for FY 2020/21 In Ksh. Billion
Baseline FY
2019/20
Proposed
FY2020/21
Remarks
National
Treasury BPS
316.5
316.50
The FY 2019/20 figure remains the same. There is
however no basis for this
The CRA 316.5 321.74 Adjustment of 5.7 percent (based on the Country’s three
the year 2016-2018 average economic growth) on the
actual three-year average development expenditure.
The adjustment translates to additional allocation of
Kshs. 5.24 billion to counties (equivalent to 31% of
Kshs. 1,038,035 of 2014/15)
Source: BPS 2020, CRA 2019
67. The latest audited accounts approved by the National Assembly is for FY 2016/2017
with revenue of Kshs. 1,357.698 billion. In using the audited reports for the FY
2014/2015, the allocation of Kshs. 316.5 billion as shareable revenue is equivalent to
30 percent of the total audited shareable revenue; this is 15 percent more than the
minimum requirement set out in the Constitution. Whereas in using the FY 2016/2017
audited reports, allocation of Kshs. 316.5 proposed for the FY 2020/21 will only be 8
percent above the constitutional requirement of 15 percent.
68. The allocation towards additional conditional grants (National Government share of
Revenue) for the FY 2019/2020 was Kshs. 22.895 billion. The National Treasury has
proposed an allocation of Kshs. 23.164 billion as additional conditional grants to the
counties for the FY 2020/21. This is an increase of Kshs. 268.85 million compared to
the FY 2019/20 allocation.
69. The increase is explained majorly by the increase in Road Maintenance Levy which has
increased by Kshs. 449 million (from the previous allocation of Kshs. 8.98 billion).
However, there is a decrease in Kshs. 185.15 million in allocation towards Supplement
for construction of county headquarters which had an allocation of Kshs. 485.15 million
and has a decreased proposal for Kshs. 300 million.
26
Table 8 changes in conditional grants between FY 2019/20 and FY 2020/21
Conditional Grants
Allocation
2019/20
Proposed Allocation
2020/21
Change in
Allocation
Kshs. Millions
Conditional Grants to Level 5 Hospitals 4,326.00 4,326.00 -
Supplement for construction of county
headquarters 485.15 300.00 (185.15)
Conditional Grant Compensation for User
Fee Foregone 900.00 900.00 -
Conditional Grant Leasing of Medical
Equipment 6,200.00 6,205.00 5.00
Conditional Grant Road Maintenance Fuel
Levy 8,984.00 9,433.00 449.00
Conditional Grant Rehabilitation of Youth
Polytechnics 2,000.00 2,000.00 -
Total 22,895.15 23,164.00 268.85
Source: The National Treasury
70. In FY 2020/21, the BPS is proposing Kshs. 30.20 billion as conditional allocations
financed from loans and grants from development partners. This allocation has
decreased from Kshs. 39.09 billion allocated in the FY 2019/20.
71. In regards to conditional loans and grants, there is a lack of approved and published
criteria on the distribution of external loans and grants from development partners
particularly the negotiation process and selection of projects/counties which benefit
from these grants.
72. In as much as the BPS has attempted to provide information on the rationale for the
changes in the allocation of the conditional grants, it has not given sufficient
information. For example, it is not clear why the Kenya Devolution Support Project
level 2 grant and the Kenya Urban Support project (Urban Institution Grants) have not
been allocated any funds in the FY 2020/21.
Salient Issues
The vertical distribution of nationally raised resources should be guided by the last audited
and approved accounts and not the projected revenue.
The FY 2020/21 Medium Term Debt Management Strategy
73. The MTDS 2020 is prepared on the basis that the government will continue to operate
on the objectives of achieving fiscal consolidation and the macroeconomic assumptions
indicated under the 2020 Budget Policy Statement. In addition, it depends on the
assumption that fiscal deficits will have to be contracted so as to reduce the overall cost
of debt on the economy and safeguard debt sustainability.
27
74. A new introduction to the MTDS 2020 is the proposal that a portion of external debt
should be in local currency (Ksh.) which will is expected to reduce the impact of
exchange rate risk and change the currency composition of Kenya’s debt portfolio.
However, the strategy of how this will be achieved is not comprehensively explained.
75. On the domestic market, reforms have been proposed; however, these seem to be
repetitive with little information provided on the progress of their implementation and
impact so far.
Table 9 Achievement of MTDS Reforms since FY 2018/19 – 2019/20)
Reform FY 2018/19
FY 2019/20
FY 2020/21
Indicated Achievement
Separation of institutional investors and retail investors in the primary market to facilitate full automation of securities auction and shortening of the primary cycle
✓ ✓ ✓ -
Regular publication of issuance calendar ✓ ✓ ✓ -
Regular market engagement ✓ ✓ ✓ -
Restructuring of horizontal repo transactions ✓ -
Establishment if over the counter trading platform aimed at fostering transparency and efficiency in secondary securities trading
✓ ✓ ✓ -
Issuance of fewer but large size benchmark bonds to enhance market liquidity and attract capital flows
✓ ✓ ✓ -
Diversify market financing instruments to include zero-coupon bonds, indexed bonds and undertake periodic liability management operations such as bond exchanges
✓
-
Source: 2020 MTDS
76. Under the MTDS 2020, the gross external borrowing share of deficit finance is set to
fall further from 38% in FY 2019/20 down to 28% while domestic borrowing is set to
increase to 72%. External Debt will be financed by Concessional Finance - 14%, Semi
Concessional Finance – 1% and Commercial finance - 13%4.
77. A review of the proposed deficit financing structure indicates a policy shift since FY
2018/19 whereby domestic borrowing would account for over 60% of borrowing with
external borrowing declining. The decline in external debt is spurred by the reduction
of semi concessional debt rather than the reduction of commercial debt resulting in an
increase in overall interest rate cost of the debt portfolio and a possible weakness of the
medium-term planning of the debt strategy.
4 Existence of ambiguity relating to the composition of projected external debt. On page 27, the composition is
provided as 14% and 1% for concessional and semi concessional borrowing. This contradicts the ratio under the
executive summary (page x) that provides for a ratio of 15% and 13% respectively.
28
Source: 2020 MTDS
A. Kenya’s Debt - Current Status
78. Kenya’s Public and Publicly Guaranteed Stock of debt has grown by an annualized
growth rate of 19% for the past 10 years due to an increase in expenditure (lead by
infrastructural investments and cost of government free services), shortfalls in revenue
forecast, and shrinking fiscal space (as a result of increase in compulsory expenditure
such as debt servicing payments, pensions, etc.).
79. As at end of December 2019, public debt amounted to Ksh. 6.048 trillion5 (67% of the
Ksh. 9 trillion national debt ceiling) and comprised of Ksh. 2.9 trillion (49%) in
domestic debt and Ksh. 3.1 trillion (51%) in external debt.
Source: Annual Public Debt Management Reports & Central Bank (K) Bulletin.
5 The Central Bank of Kenya - January 2020 Weekly Economic Bulletin and the Half Year QEBR
0%
10%
20%
30%
40%
50%
60%
70%
80%
0%
5%
10%
15%
20%
25%
30%
35%
MTDS 2016/17 MTDS 2017/18 MTDS 2018/19 MTDS 2019/20 MTDS 2020/21
Evolution of Borrowing Strategies, FY 2016/17 – FY 2020/21
Concessional finance Semi concessional finance commercial finance
Domestic Gross Borrowing External Gross Borrowing
- 1,000,000 2,000,000 3,000,000 4,000,000 5,000,000 6,000,000 7,000,000 8,000,000 9,000,000
10,000,000
Ksh
. m
illi
on
s
Public and publicly guaranteed debt stock
29
B. Risks & Costs Profile
- Refinancing Risk
80. The country continues to face increased debt refinancing pressure more so from
domestic debt (Average time to maturity of 5.7) compared to that of the external debt
(ATM of 11). As such, as of December 2019, up to 34.9% (Kshs. 990.9 billion) of total
domestic debt is expected to reach maturity in the next 1 year. This only a marginal
reduction from Ksh. 1.04 trillion in FY 2019/20 indicating sustained refinancing
pressure for the next financial year. Over the medium term, this is projected to decline
to Ksh. 331.7 billion as a result of increased uptake of medium to long term debt.
Table 10 Kenya remaining maturity of Outstanding Domestic Debt, as at end FY 2017/18
Maturity (Years) End of Dec 2018
(Millions US$)
In percent of
Total
End of Dec 2019
(Millions US$)
In percent of
Total
Less than one year 10,376 42.8 9,909.22 34.9
2 to 3 years 2,419 9.9 3,528.58 12.4
4 to 5 years 3,225 13.3 3,317.56 11.7
6 to 10 years 5,118 21 6,029.96 21.2
Above 11 years 3,168 13 5,593.97 19.8
Total 24,306.00
28,379.29
Source: National Treasury
- Interest Rate Risk
81. The debt portfolio indicated a rise in exposure to interest rate related risk as at end of
December 2019. The level of interest rate risk is a factor of; a) The Weighted Average
Interest Rate - of which the domestic debt portfolio had a higher average interest rate
(11.4%) compared to that of the external debt portfolio (4.2%)., and b) debt with fixed
interest rate – that fell from 93.2% of total debt to 85.3% indicating increased volatility
of interest rate.
82. It is important to note that the above factors relate to the debt stock and that the future
movements and volatility of interest rate risk is left to be catered under the borrowing
strategy. A review of the volatility of money market interest rates indicates that interest
rates of the 91day T-Bill, 182 Day, and the 364 Day T-Bills, after a period of decline,
had increased by Mid-February 2020. If the trend continues, then this could result in a
further increase in domestic borrowing related interest risk.
30
Source: CBK, Weekly Bulleting
- Guaranteed Debt
83. National stock of debt also comprises of debt guarantees under Article 213 of the
Constitution and Section 58 of the PFM Act, 2012. These form part of fiscal contingent
liability i.e. if an institution fails to make payments for a guaranteed loan it necessitates
the government to step in and shoulder the extra-burden by use already limited
financial resources. As of the end of December 2019, a total of Ksh. 158.1 billion worth
of guarantees had been provided to 7/seven institutions and had increased from Ksh.
133.79 (December 2017). At this level, it is approximately Ksh. 41.9 billion short of
the Ksh. 200 billion ceiling6.
84. Out of the portfolio, Tana & Athi Rivers Dev. Authority and East African Portland
cement are non-performing resulting in Ksh. 305.1 billion incurred to meet the loan
repayments.
Table 11 Outstanding Government Guaranteed Debt (AS at Dec2019)
Entity Ksh. Millions
Kenya Power Company 12,549,335,918.02
Kenya Electricity Generating Company 27,808,475,106.38
Kenya Ports Authority 36,844,724,766.26
Kenya Airways 76,002,375,000.00
Kenya Railways (IDA Concessionaire) 4,560,142,500.00
Sub-Total Uncalled Guarantees 157,765,053,290.66
Tana & Athi Rivers Dev. Authority 136,365,022.08
East African Portland Cement 169,514,325.12
Sub-Total Called Guarantees (Non-Performing ) 305,879,347.20
Grand Total Guarantees 158,070,932,637.86 Source: National Treasury
6 National Assembly resolution dated 17th June 2011
0%
2%
4%
6%
8%
10%
12%
Movement of Money Market interest rates (January 2019 – Mid February
2020)
91 Day T-Bill 192 Day T-Bill 364 day T-Bill
31
C. Public Debt Sustainability Analysis (DSA) Framework
85. Debt sustainability analysis compares debt burden indicators to thresholds over 20 -
year projection period, if a debt burden indicator exceeds its indicative threshold then
it would suggest that a risk of experiencing some form of debt distress exists. The
objective of Debt Sustainability Analysis (DSA) is to evaluate a country’s capacity to
finance its policy agenda and service the ensuing debt without unduly large adjustments
that may compromise its macroeconomic stability and/or that of its economic partners.
The DSA framework consists of two complementary assessments of the sustainability
of the following:
(i) Total public sector debt, and
(ii) Total external debt.
- Public Sector Debt DSA
86. The overall DSA ratios indicated that Kenya’s debt (Public & Publicly Guaranteed
Debt) is within sustainable range and is expected to remain so into the medium term as
the PV of debt as a percentage of GDP will remain below its threshold of 70%.
Furthermore, with the amendments to the PFM undertaken in 2019, the level of debt as
of December 2019, constituted 67% of the Ksh. 9 trillion ceiling and therefore within
legal set limits. By the close of 2021/22, BPS 2020 projections indicate that debt stock
will account for 84% of the ceiling and therefore any expenditure related shock could
eliminate any remaining ceiling margin.
Table 12 Public Debt Sustainability Analysis
Threshold 2017 2018 2019 2020 2021 2022 2023
PV of Debt as % of GDP 70 55.4 60.6 55.4 55.7 54 48.5 42.2
PPG Debt Services as a
% of Revenue 30 29.2 35.6 45.2 35.2 46.1 47.9 38.5
Debt as % of Ceiling Ksh. 9
Trillion 67% 78% 84% 89% 94%
Source: 2020 BPS Debt Forecast, MTDS 2020
87. In addition, one of the indicators of DSA, which is the ratio of debt service to
revenue, having breached its threshold of 30 percent in the FY 2017/18 is projected
to remain above the threshold over the medium term. Given that the DSA for
external debt indicates that external debt will remain within its revenue related threshold
(See the review of External debt DSA below), the breach is therefore as a result of
Domestic debt servicing requirements.
- External Debt DSA
88. Review of External debt sustainability indicates that while minimum risk will emanate
from the pressures of external debt service on revenue, external debt and its servicing
32
are expected to surpass their corresponding thresholds as from 2020. This could
indicate that for the medium term, external debt demands put pressure on externally
generated income and the increase of resources required to finance external debt, could
increase the risk of an exchange rate shock. This could, in turn, increase the refinancing
risk of external debt while at the same time jeopardizing the macroeconomic
assumptions underpinning fiscal planning for the medium term.
Table 13 External Debt Sustainability Ratios
Threshold 2017 2018 2019 2020 2021 2022 2023
PV of Debt to GDP Ratio 55 25.9 31.4 27.2 27.4 26.5 25.3 24
PV of Debt to Exports Ratio 240 165.
4
191.
1
224.
8
234.
9
229.
6
222.
3
197.
5
PPG Debt Service to Exports
Ratio 21 16.5 19.9 29.3 21 24 23.3 19.1
PPG Debt Services to Revenue
Ratio 23 13.3 16.2 20.4 13.1 15.2 14.2 12.1
Source: National Treasury
Emerging issues
89. While the sustainability of overall debt to GDP ratios indicates the solvency
sustainability of stock of debt, i.e. comparison of debt to total assets and economic
production, the debt servicing to Revenue or exports refers to the liquidity sustainability
i.e. match against income generated by the economy. From the above review, it is
expected that the main impact of rising stock of debt will arise from an increase in debt
servicing expenses resulting in pressures on domestic and external revenue.
90. As indicated in the 2020 BPS, debt is expected to be the primary factor behind the Ksh.
76.9 billion increase in the Consolidated Fund Services (mandatory expenditures that
include debt repayment, pension, and gratuities, salaries to constitutional offices, etc.).
Being mandatory, this is expected to absorb the increase in revenue projected for FY
2020/21 amounting to Ksh. 89.8 billion and reduce the ordinary revenue. When coupled
with other non-discretionary budgetary expenditures i.e. such as allocation to county
governments, etc. a shortfall in revenue could necessitate a possible increase in
borrowing or budget rationalization mid-year.
91. Given that liquidity will be the challenge to debt management, fiscal consolidation
should be cognizant of this factor and consolidate resources to sectors that facilitate
exports, increase in productivity and revenue generation such as manufacturing.
92. Summary of issues raised in this report include:
i. The need to strengthen the medium-term basis of Kenya’s debt strategy in order to
control the composition and resultant costs and risks related to the growth of the stock
of debt.
ii. There is no provision indicating the status of implementation of the FY 2019/20
borrowing strategy.
33
iii. There is a need to limit the use of commercial debt over the medium term in order to
reduce the related refinancing risk.
iv. Information on the progress of the indicated domestic market reforms intended to
support public debt management is missing.
v. Thresholds relating to debt service i.e. to revenue and exports have been breached
therefore indicating sustained pressure on both domestic and on externally generated
income.
34
Annex
Table A 1 Sectoral GDP Growth
Sectoral growth Contribution to growth
2018 Q1 to Q3 2019 Q1 to Q3 2018 Q1 to Q3 2019 Q1 to Q3
Primary sector 6.8% 4.4% 1.6 1.0
Agriculture, forestry and fishing 7.0% 4.4% 1.6 1.0
Mining and quarrying 2.8% 4.0% 0.0 0.0
Secondary sector 5.4% 4.7% 1.0 0.8
Manufacturing 4.4% 3.5% 0.4 0.3
Electricity, gas and water 7.6% 5.5% 0.2 0.1
Construction 6.4% 6.5% 0.3 0.4
Tertiary sector 6.5% 6.1% 3.2 3.0
Wholesale and Retail trade 6.2% 5.4% 0.5 0.4
Accommodation and Restaurants 14.6% 9.9% 0.2 0.1
Transport and Storage 8.6% 7.0% 0.6 0.5
Information and Communication 11.2% 10.0% 0.4 0.4
Financial Intermediaries and Insurance 5.0% 6.1% 0.3 0.4
Public administration 6.0% 6.1% 0.2 0.2
Professional, admin and support services 6.8% 5.4% 0.1 0.1
Real Estate 4.6% 4.9% 0.4 0.4
Education 5.6% 5.7% 0.4 0.4
Health 4.7% 4.7% 0.1 0.1
Other services 4.8% 2.6% 0.1 0.0
Plus: FISIM 0.6% -1.0% 0.0 0.0
Total gross value added 6.5% 5.5% 5.8 4.9
Taxes less subsidies on Products 5.6% 4.8% 0.6 0.5
TOTAL G.D.P. AT MARKET PRICES 6.4% 5.4% 6.4 5.4
35
References
1. Arndt C, McKay A, Tarp F. Growth and poverty in sub-Saharan Africa. Oxford
University Press Oxford; 2016.
2. Wawire NH. Constraints to Enhanced Revenue Mobilization and Spending Quality in
Kenya. Washington, DC: Center for Global Development; 2020. Report No.: Policy
paper 163.
3. Okungu VR, McIntyre D. Does the informal sector in Kenya have financial potential to
sustainably prepay for health care? Implications for financing universal health coverage
in low-income settings. Health Systems & Reform. 2019;5(2):145–157.
4. Bang JT, Mitra A, Wunnava PV. Do remittances improve income inequality? An
instrumental variable quantile analysis of the Kenyan case. Economic Modelling.
2016;58:394–402.
5. Hines AL, Simpson NB. Migration, remittances and human capital investment in
Kenya. Economic Notes: Review of Banking, Finance and Monetary Economics.
2019;48(3):e12142.
6. Dendir S. Saving out of Remittances: Evidence from Ethiopia and Kenya. International
Migration. 2017;55(4):118–140.
7. Capital Markets Authority. The Capital Markets Soundness Report (CMSR). Nairobi,
Kenya: Capital Markets Authority; 2019 Quarter IV. Report No.: Volume XIII.