Embed Size (px)
Citation preview
University of South CarolinaScholar Commons
Theses and Dissertations
1-1-2013
The Parasitic Oligarchy? The Elites in Trinidad andTobagoAlison Mc LetchieUniversity of South Carolina
Follow this and additional works at: https://scholarcommons.sc.edu/etd
Part of the Sociology Commons
This Open Access Dissertation is brought to you by Scholar Commons. It has been accepted for inclusion in Theses and Dissertations by an authorizedadministrator of Scholar Commons. For more information, please contact [email protected].
Recommended CitationMc Letchie, A.(2013). The Parasitic Oligarchy? The Elites in Trinidad and Tobago. (Doctoral dissertation). Retrieved fromhttps://scholarcommons.sc.edu/etd/1933
THE PARASITIC OLIGARCHY? THE ELITES IN TRINIDAD AND TOBAGO
by
Alison Mc Letchie
Bachelor of Science
South Carolina State University, 2000
Master of Arts
University of South Carolina, 2003
Submitted in Partial Fulfillment of the Requirements
For the Degree of Doctor of Philosophy in
Sociology
College of Arts and Sciences
University of South Carolina
2013
Accepted by:
Jimy Sanders, Major Professor
Patrick Nolan, Committee Member
Shelley Smith, Committee Member
Ann Kingsolver, Committee Member
Lacy Ford, Vice Provost and Dean of Graduate Studies
ii
© Copyright by Alison Mc Letchie, 2013
All Rights Reserved.
iii
DEDICATION
This dissertation is dedicated to my large, unruly, loud, cantankerous, nosey
family, including Henrietta Baptiste who I miss dearly, each of has showered me with
love and support me throughout this process.
iv
ACKNOWLEDGEMENTS
I would like to express my deepest gratitude to my committee members, Jimy
Sanders, Patrick Nolan, Shelley Smith and Ann Kingsolver, for their guidance and
patience. I especially want to recognize the best chair in the world, ever – Jimy Sanders
– who worked tirelessly with me.
Thanks also to all my family and friends who supported me every step of the way.
In particular my personal Hercules, who suffered through more than 12 labors and time
and time again let me cling to his thick neck as he carried me.
v
ABSTRACT
The existence of an elite class within societies is often a topic of research in the study of
inequality of power and influence. Researchers, however, acknowledge that the nature
and composition of the elite varies. Trinidad and Tobago, with its colonial history and
diverse population has had to confront issues surrounding access to power by various
groups within the society. One driving force of the 1970s Black Power Revolution was
the practice of color discrimination in the banking industry. Informed by Mills’ (1956)
elite theory and rooted in Beckford’s (1972) economic theory, this project surveys the
elite of Trinidad and Tobago. I examine three important national sectors: business, the
judiciary, and the National Senate – all appointed positions – to explore which groups
have access to positions of power and influence. Information was collected with regards
to individuals’ terms of service or length of appointments, type of appointment, ethnicity,
religion, gender and the high school they graduated from. While some of the data are
incomplete, women are unrepresented and Whites over-represented across all three
sectors.
vi
TABLE OF CONTENTS
DEDICATION …………………………………………………………………………...…iii
ACKNOWLEDGEMENTS …………………………………………………………………....iv
ABSTRACT …...………………………………………………………………..………..….v
LIST OF TABLES …………………………………………………………………………viii
CHAPTER I INTRODUCTION …………………………………………………...…………....1
CHAPTER II HISTORICAL FRAMEWORK ………………………………………..…………..6
2.1 HISTORICAL CONTEXT AND THE RISE OF THE POST-INDEPENDENCE ELITE ………..17
CHAPTER III LITERATURE REVIEW ………………………………………………………19
3.1 ELITES ……………………………………………………………………………..19
3.2 SOCIAL NETWORKS ………………………………………………………………..21
3.3 ECONOMIC DEVELOPMENT …………………………………………………………23
3.4 TRINIDAD AND TOBAGO …………………………………………………………...27
CHAPTER IV CONCEPTUAL MODEL ………………………………………………….…...30
4.1 SUMMARY OF CONCEPTUAL MODEL ……………………………………………….36
4.2 RESEARCH QUESTIONS …………………………………………………………….37
CHAPTER V DATA AND METHODS ……………………………………………….……....40
5.1 DATA ………………………………………………………………………………40
5.2 VARIABLES ………………………………………………………………………...42
5.3 ANALYSES …………………………………………………………………………43
CHAPTER VI RESULTS ……………………………………………………….……….…..46
6.1 JUDGES …………………………………………………………………………….46
6.2 BOARDS ……………………………………………………………………………51
6.3 SENATORS …………………………………………………………………………59
6.4 HOLDING POSITIONS OF INFLUENCE IN TWO INSTITUTIONS ……………………..…65
vii
6.5 FAMILIES OF INFLUENCE …………………………………………………………..66
CHAPTER VII CONCLUSION …………………………………………………….…..…….68
7.1 RAGAMUFFIN MONARCHY OR PARASITIC OLIGARCHY? …………………………...70
7.2 WOMAN IS BOSS? ……………………………………………………………….…71
7.3 EDUCATION IS ESSENTIAL …………………………………………………………72
7.4 MIX UP …………………………………………………………………………….75
7.5 THE FUTURE IS NOW ………………………………………………………………77
REFERENCES …………………………………………………….…………………….....80
APPENDIX A: JUDGES …………………………………………………………………….85
APPENDIX B: COMPANY DIRECTORS ………………………………………….………….88
APPENDIX C: NATIONAL SENATORS ………………………………………….………....109
APPENDIX D: UNISIC……………………………………………………….…..……...119
APPENDIX E: PRESTIGE SCHOOLS …................................................................................121
viii
LIST OF TABLES
Table 1.1: Occupational-Ethnic Relationships of the Elite …………………………..….. 2
Table 2.1: Population by Ethnic Group ……………………………………….…….……7
Table 2.2: Income Distribution by Ethnicity ………………………………….………….8
Table 2.3: Population Change, 1784 to 1797 ..………………………………..…...……...9
Table 5.1: Judges’ Sex ……………………………………………………..….………...47
Table 5.2: Judges’ Ethnicity …………………….…………………………..…..………47
Table 5.3: Judges’ Religion ……………………………………………………..…...….48
Table 5.4: Judges’ High School ……………………………………………...……..…...48
Table 5.5: Judges’ Appointments …………………………………………………....….49
Table 5.6a: High Court Appointment ………………………………………..…….…....50
Table 5.6b: High Court Appointment …………………………………………...……....50
Table 5.7a: Directors’ Sex ……………………………………………….……….….….51
Table 5.7b: Sex by Multiple Board Appointments by Industry .....……………….....…..52
Table 5.8: Board Occupational Distribution ……………………………...…...…….......54
Table 5.9: Occupational Group by Industry ……………….…………………...…….…55
Table 5.10 Boards’ Ethnicity (less unknown) ……………………………………….......56
Table 5.11a: Multiple Board Appointments …………….……………………...……… 57
Table 5.11b: Multiple Board Appointments …………………………………………….58
Table 5.11c: Multiple Board Appointments ………………………………..……...……58
Table 5.12a: Senators’ Sex ………………………………………………………..…….60
Table 5.12b: Number of Terms by Sex ………………………………………...………..60
Table 5.13: Senators’ Occupational Group by Sex ……….………….………...………..61
Table 5.14a: Single Senate Term ……………………………………………...………...62
Table 5.14b: Single Senate Term …………………………………….………...………..63
Table 5.14c: Single Senate Term …………………………………………………...…...64
Table 5.14d: Single Senate Term ………………………………………………...……...65
Table 5.15: Single Individuals with Multiple Position …….…….……………….……..66
1
CHAPTER I
INTRODUCTION
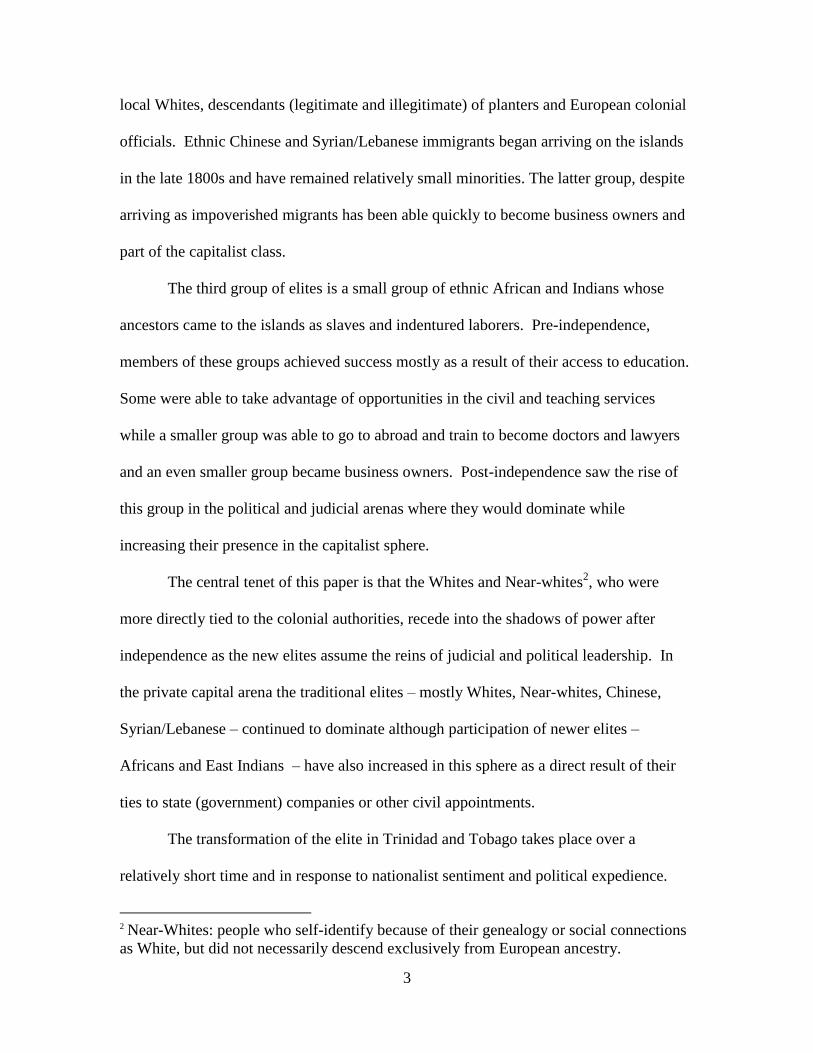
One January 31st, 2009, the Trinidad Newsday announced on the front page “Govt Bails
Out CLICO”. The article described the government’s move to rescue the company
which, according to the article, manages “assets of over $38 billion, more than 25 percent
of this country’s Gross Domestic Product (GDP)”. Cyril Duprey founded the firm in
1936 as an insurance company. Under the direction of Lawrence Duprey, his nephew, it
became one of the largest multi-national companies in the region. The failure of the
company reflects the convergence of world market forces and poor investment decisions
by the younger Duprey and his management team. The speed and nature of the
government’s actions are of particular interest to my research. Some argue that the
government had no choice because of the size of the company in relation to the national
economy, others speculate that the deal struck was a result of the relationship of key
members of CLICO’s management and the government. Basdeo Panday, one-time leader
of the Untied National Congress (UNC) is the godfather of Duprey’s child and Duprey is
thought to be one of financers of Panday’s political party. Andre Monteil1, one of
1 A distant maternal cousin.
2
Duprey’s closest business associates, having served as financial director in the company,
has strong ties to the Peoples National Movement (PNM) where he has been the party’s
treasurer. This dissertation is a sociological study of the judicial, political and capitalist
class in Trinidad and Tobago. Rooted in economic theory, particularly Beckford’s (1972)
plantation economy and Mills’ (1956) elite theory, it compiles a comprehensive list of
three major segments of civic society – the judiciary, national Senate and company
boards. It examines the demographic composition of these groups and studies the
relationship between the members. This project argues that leading up to independence
in 1962 and since then there are three categories of elites formed on the islands. They
are: descendants of colonial officials and plantation owners; descendents of Chinese and
Syrian/Lebanese immigrants; and a relatively small group of Afro- and Indo-Trinidadians
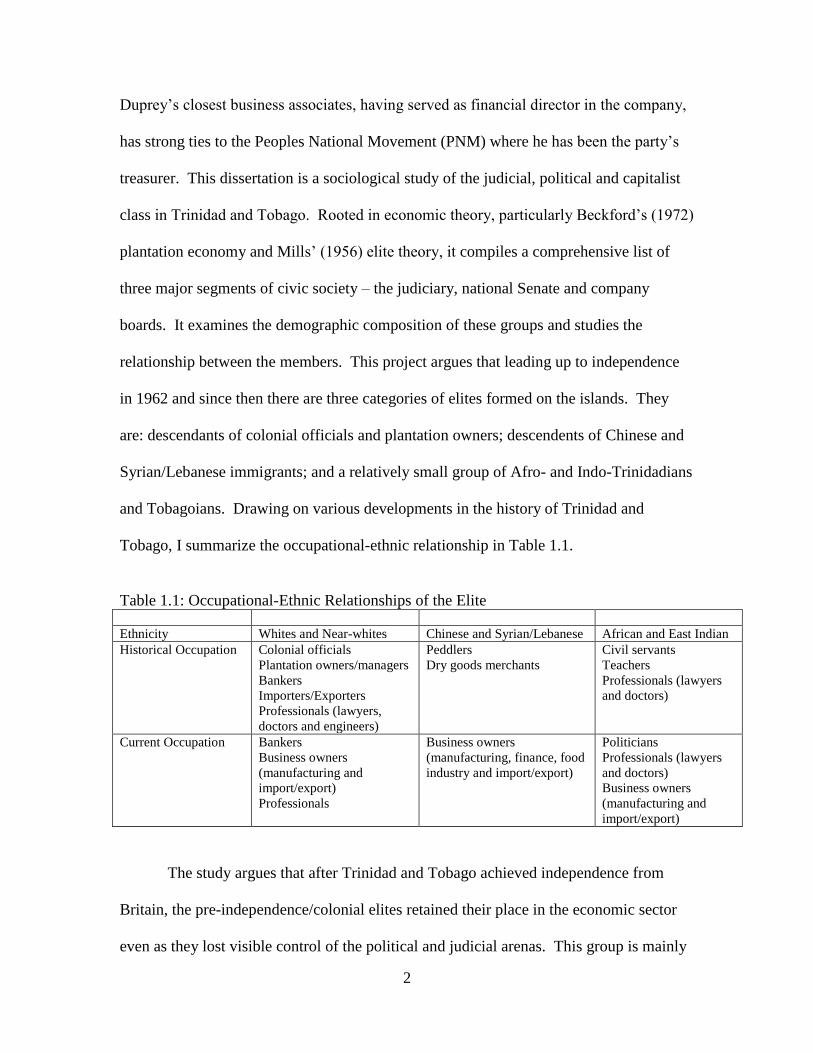
and Tobagoians. Drawing on various developments in the history of Trinidad and
Tobago, I summarize the occupational-ethnic relationship in Table 1.1.
Table 1.1: Occupational-Ethnic Relationships of the Elite
Ethnicity Whites and Near-whites Chinese and Syrian/Lebanese African and East Indian
Historical Occupation Colonial officials
Plantation owners/managers
Bankers
Importers/Exporters
Professionals (lawyers,
doctors and engineers)
Peddlers
Dry goods merchants
Civil servants
Teachers
Professionals (lawyers
and doctors)
Current Occupation Bankers
Business owners
(manufacturing and
import/export)
Professionals
Business owners
(manufacturing, finance, food
industry and import/export)
Politicians
Professionals (lawyers
and doctors)
Business owners
(manufacturing and
import/export)
The study argues that after Trinidad and Tobago achieved independence from
Britain, the pre-independence/colonial elites retained their place in the economic sector
even as they lost visible control of the political and judicial arenas. This group is mainly
3
local Whites, descendants (legitimate and illegitimate) of planters and European colonial
officials. Ethnic Chinese and Syrian/Lebanese immigrants began arriving on the islands
in the late 1800s and have remained relatively small minorities. The latter group, despite
arriving as impoverished migrants has been able quickly to become business owners and
part of the capitalist class.
The third group of elites is a small group of ethnic African and Indians whose
ancestors came to the islands as slaves and indentured laborers. Pre-independence,
members of these groups achieved success mostly as a result of their access to education.
Some were able to take advantage of opportunities in the civil and teaching services
while a smaller group was able to go to abroad and train to become doctors and lawyers
and an even smaller group became business owners. Post-independence saw the rise of
this group in the political and judicial arenas where they would dominate while
increasing their presence in the capitalist sphere.
The central tenet of this paper is that the Whites and Near-whites2, who were
more directly tied to the colonial authorities, recede into the shadows of power after
independence as the new elites assume the reins of judicial and political leadership. In
the private capital arena the traditional elites – mostly Whites, Near-whites, Chinese,
Syrian/Lebanese – continued to dominate although participation of newer elites –
Africans and East Indians – have also increased in this sphere as a direct result of their
ties to state (government) companies or other civil appointments.
The transformation of the elite in Trinidad and Tobago takes place over a
relatively short time and in response to nationalist sentiment and political expedience.
2 Near-Whites: people who self-identify because of their genealogy or social connections
as White, but did not necessarily descend exclusively from European ancestry.
4
Changes were particularly dramatic after the 1970 Black Power rebellion (Ryan, 1972;
Bennett, 1996; and Premdas, 2007). Despite these changes and drawing from the
analysis of Beckford (1970, 1972, 2000a, 2000b, 2000c, 2001) this study explores the
degree to which the super-structure developed by the colonial plantation system is still
evident in current national political and economic institutions. The most important
question is: Are traditional elites able to retain key roles and strongly influence national
life in spite of post-independence political change.
Relying on Beckford’s (1972) model, this paper examines some of the critical
business and political institutions alongside the judiciary in order to reveal the extent to
which it is the members of the new elite group who participate in the government and
judiciary while the traditional group have retained considerable influence in the financial
and economic sectors. This is significant because it considers which groups control the
national economy, legal system and one arm of the national government therefore
possibly influences policy formation.
Trinidad and Tobago’s post-independent political leadership recognizes the role
and importance of the traditional elite, particularly in terms of their economic influence
and financial dominance. One result of this is that governments occasionally reward
members of the traditional elite with appointments to public office; in this study, the
judiciary and national Senate. The new elite play a significant and highly visible role in
politics particularly as elected government officials and growing appointments to the
legal bench. Additionally their presence in the professional and business community has
grown since independence in particular as appointed board members of state companies.
5
This paper maintains, that in order to sustain a democratic system for fifty years,
national governments, which are comprised mostly of individuals of African and East
Indian heritage, acknowledge the need to appease various sectors of the society, including
the capitalist elites (mostly, Whites, Near-whites, Chinese and Syrian/Lebanese). It
demonstrates that members of the traditional (capitalist) elite are tied to various political
parties as evidenced particularly by Senatorial appointments. These appointments may
be construed as rewards by the political party leadership that is dominated by new elite
members. It is also surmises that through these appointments the traditional elite have
been able to maintain their economic position since independence in 1962. These
political appointments are important because they afford the capitalists elite access to
information while at the same time rewarding them for their support of the political
parties. The support is inferred because many of the capitalist elite families have
members who actively participate in both political parties.
6
CHAPTER II
HISTORICAL FRAMEWORK
The success of many former colonies as viable nation-states is mixed (Knight, 1978;
Stone 1986; Clarke 1991 and Payne & Sutton 2001). Many economists, historians, and
political scientists debate the reason for this phenomenon. George Beckford (1972,
2000a, 2000b, 2000c and 2001) suggests that former colonials, particularly those in the
Caribbean, were part of a larger system that was meant to support the colonial
government. This support came even at the expense of many colonies’ wellbeing. In the
English-speaking Caribbean, land was often used to produce sugar, coffee, cocoa and
more recently bananas for export to Europe and America. Beckford argues that the
plantation system created by colonialists initially as part of the larger slave economy left
significant marks on the institutions of the Caribbean long after slavery ended. He
proposes not only that plantation economies created, economic distinctions based
primarily on racial lines and access to the colonial power structure but that the economic
paradigm filtered into social life manifesting in what he described as a plantation society.
According to him this society is characterized by a largely unskilled labor force,
dependent on agriculture, a small ex-patriot supervisory force, cultural pluralism, a caste
system based on occupation and social status, an authoritative managerial style, and
centralized decision making.
This paper argues that since independence in 1962, national politics in Trinidad
and Tobago is dominated by a small and inter-connected group of individuals; the elites.
7
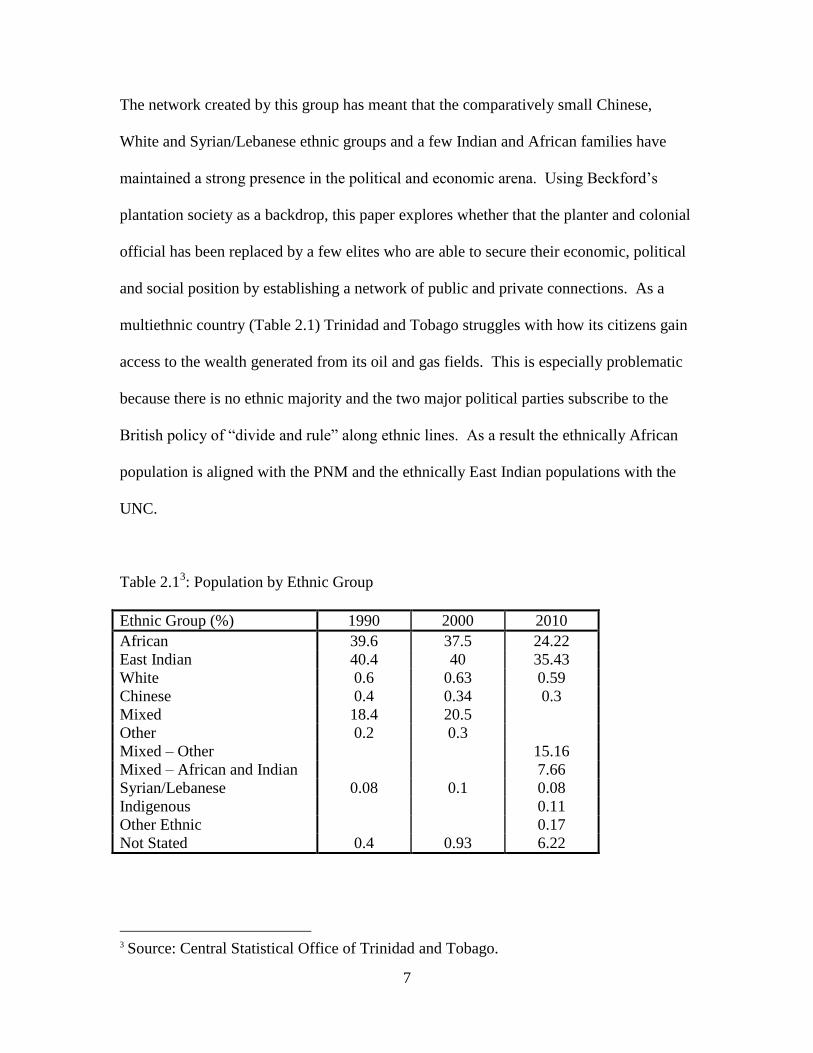
The network created by this group has meant that the comparatively small Chinese,
White and Syrian/Lebanese ethnic groups and a few Indian and African families have
maintained a strong presence in the political and economic arena. Using Beckford’s
plantation society as a backdrop, this paper explores whether that the planter and colonial
official has been replaced by a few elites who are able to secure their economic, political
and social position by establishing a network of public and private connections. As a
multiethnic country (Table 2.1) Trinidad and Tobago struggles with how its citizens gain
access to the wealth generated from its oil and gas fields. This is especially problematic
because there is no ethnic majority and the two major political parties subscribe to the
British policy of “divide and rule” along ethnic lines. As a result the ethnically African
population is aligned with the PNM and the ethnically East Indian populations with the
UNC.
Table 2.13: Population by Ethnic Group
Ethnic Group (%) 1990 2000 2010
African 39.6 37.5 24.22
East Indian 40.4 40 35.43
White 0.6 0.63 0.59
Chinese 0.4 0.34 0.3
Mixed 18.4 20.5
Other 0.2 0.3
Mixed – Other 15.16
Mixed – African and Indian 7.66
Syrian/Lebanese 0.08 0.1 0.08
Indigenous 0.11
Other Ethnic 0.17
Not Stated 0.4 0.93 6.22
3 Source: Central Statistical Office of Trinidad and Tobago.
8
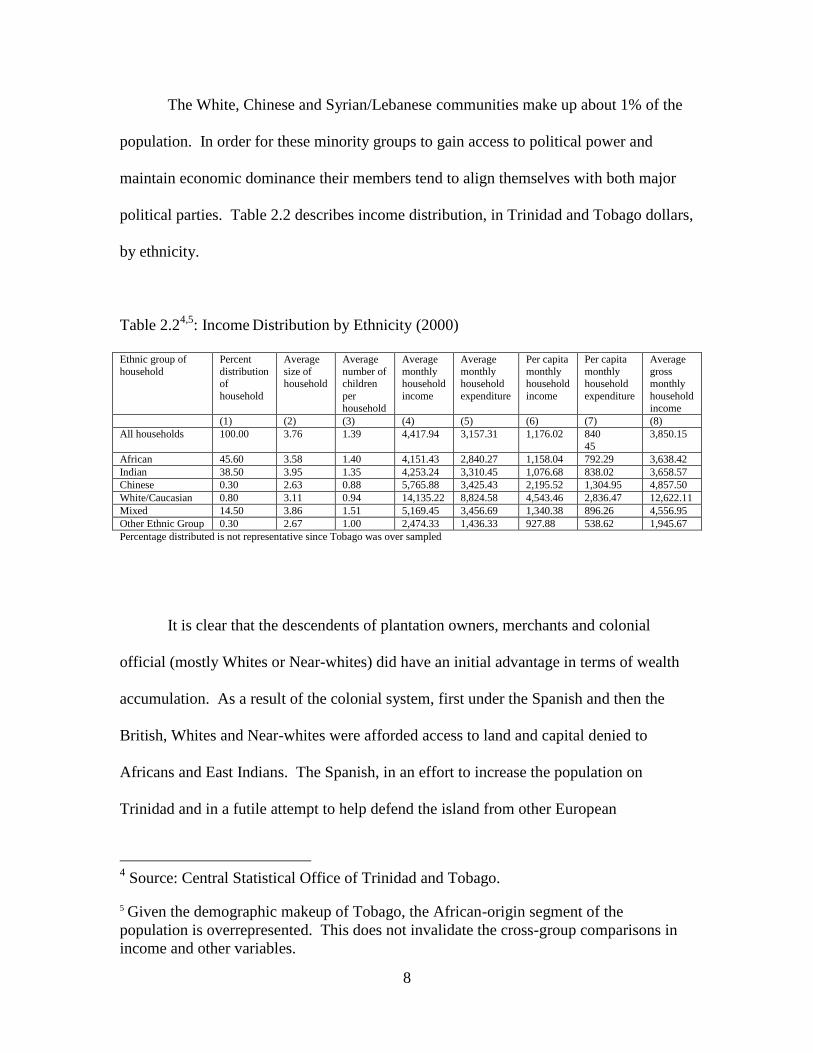
The White, Chinese and Syrian/Lebanese communities make up about 1% of the
population. In order for these minority groups to gain access to political power and
maintain economic dominance their members tend to align themselves with both major
political parties. Table 2.2 describes income distribution, in Trinidad and Tobago dollars,
by ethnicity.
Table 2.24,5
: Income Distribution by Ethnicity (2000)
Ethnic group of
household
Percent
distribution of
household
Average
size of household
Average
number of children
per
household
Average
monthly household
income
Average
monthly household
expenditure
Per capita
monthly household
income
Per capita
monthly household
expenditure
Average
gross monthly
household
income
(1) (2) (3) (4) (5) (6) (7) (8)
All households 100.00 3.76 1.39 4,417.94 3,157.31 1,176.02 840
45
3,850.15
African 45.60 3.58 1.40 4,151.43 2,840.27 1,158.04 792.29 3,638.42
Indian 38.50 3.95 1.35 4,253.24 3,310.45 1,076.68 838.02 3,658.57
Chinese 0.30 2.63 0.88 5,765.88 3,425.43 2,195.52 1,304.95 4,857.50
White/Caucasian 0.80 3.11 0.94 14,135.22 8,824.58 4,543.46 2,836.47 12,622.11
Mixed 14.50 3.86 1.51 5,169.45 3,456.69 1,340.38 896.26 4,556.95
Other Ethnic Group 0.30 2.67 1.00 2,474.33 1,436.33 927.88 538.62 1,945.67
Percentage distributed is not representative since Tobago was over sampled
It is clear that the descendents of plantation owners, merchants and colonial
official (mostly Whites or Near-whites) did have an initial advantage in terms of wealth
accumulation. As a result of the colonial system, first under the Spanish and then the
British, Whites and Near-whites were afforded access to land and capital denied to
Africans and East Indians. The Spanish, in an effort to increase the population on
Trinidad and in a futile attempt to help defend the island from other European
4 Source: Central Statistical Office of Trinidad and Tobago.
5 Given the demographic makeup of Tobago, the African-origin segment of the
population is overrepresented. This does not invalidate the cross-group comparisons in
income and other variables.
9
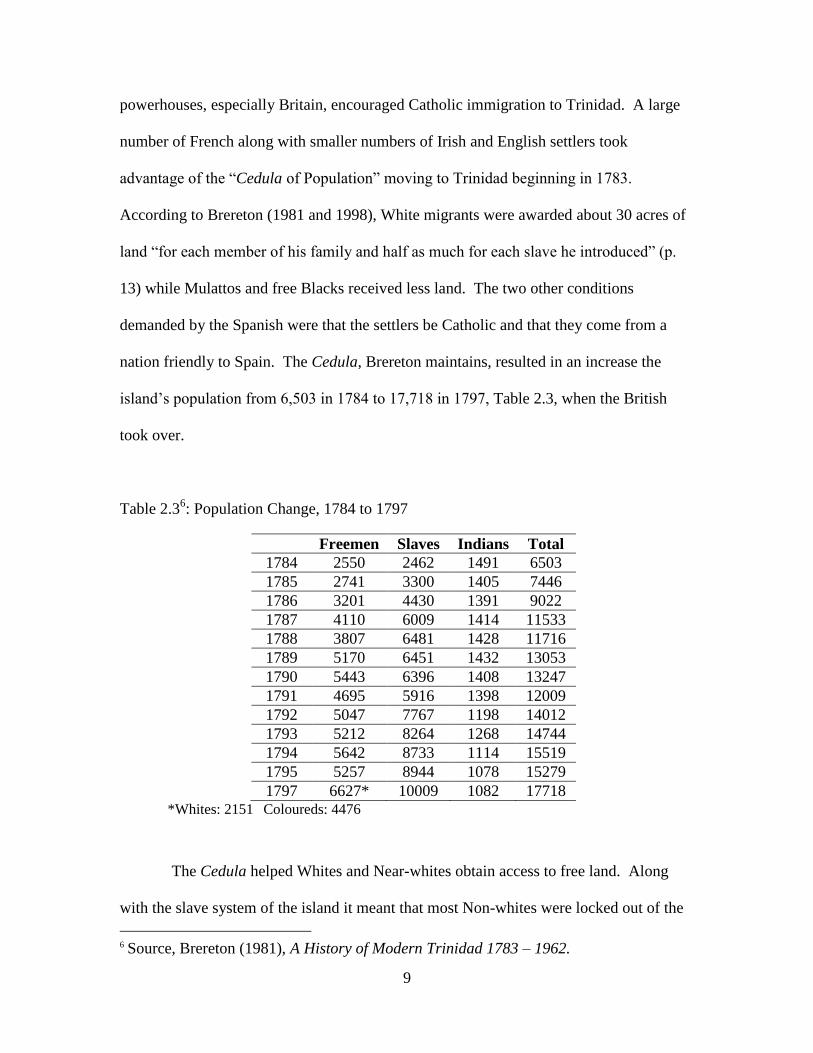
powerhouses, especially Britain, encouraged Catholic immigration to Trinidad. A large
number of French along with smaller numbers of Irish and English settlers took
advantage of the “Cedula of Population” moving to Trinidad beginning in 1783.
According to Brereton (1981 and 1998), White migrants were awarded about 30 acres of
land “for each member of his family and half as much for each slave he introduced” (p.
13) while Mulattos and free Blacks received less land. The two other conditions
demanded by the Spanish were that the settlers be Catholic and that they come from a
nation friendly to Spain. The Cedula, Brereton maintains, resulted in an increase the
island’s population from 6,503 in 1784 to 17,718 in 1797, Table 2.3, when the British
took over.
Table 2.36: Population Change, 1784 to 1797
Freemen Slaves Indians Total
1784 2550 2462 1491 6503
1785 2741 3300 1405 7446
1786 3201 4430 1391 9022
1787 4110 6009 1414 11533
1788 3807 6481 1428 11716
1789 5170 6451 1432 13053
1790 5443 6396 1408 13247
1791 4695 5916 1398 12009
1792 5047 7767 1198 14012
1793 5212 8264 1268 14744
1794 5642 8733 1114 15519
1795 5257 8944 1078 15279
1797 6627* 10009 1082 17718 *Whites: 2151 Coloureds: 4476
The Cedula helped Whites and Near-whites obtain access to free land. Along
with the slave system of the island it meant that most Non-whites were locked out of the
6 Source, Brereton (1981), A History of Modern Trinidad 1783 – 1962.
10
ownership class. Brereton points out however that the White racial group itself was not
homogeneous. She argues that there were multiple divisions within this group (1998).
These included, but were not limited to: place of birth (European mainland vs.
Caribbean); length of residence on the island (old vs. new families/arrivals); language
and ethnicity (Spanish vs. French vs. English); religion (Catholic vs. Protestant – mostly
Anglican); class (elites – plantation and large business owners and high level colonial
officials vs. middle-class – lower level colonial officials, overseers, teachers and other
professionals vs. the lower-class – small village shopkeepers and farmers). Brereton
claims that the small Syrian and Lebanese population that began arriving in 1890 was
subsumed into the White racial category and are often considered as such however it has
maintained itself as a separate own sub-group and has resisted intermarriage with other
groups (both Whites and Non-whites). This group initially worked as peddlers and small-
scale traders, but over time became integral to the commercial infrastructure on the
islands.
The Chinese came to Trinidad in two phases7, a first wave in beginning in 1853
and a second wave in the first part of the 1900s. Originally hired as indentured laborers
many of them quickly abandoned the fields. Instead they became village shopkeepers,
small farmers (mainly cocoa) or merchants involved in the import/export trade. Unlike
East Indian indentured laborers the Chinese were not promised return passage to their
7 There has been a more recent wave beginning in the late 1990s but it is yet unclear if
these are economic sojourners or permanent immigrants.
11
homeland. Their numbers remained low however because of high levels of mortality8.
According to Look Lai (1993) the post-indentureship opportunities were very favorable
to the Chinese and many of them were in fact able to buy out their contract before the
five-year period ended. He writes that:
“[B]y the time of the census of 1891, the vast majority of the small Chinese
community in Trinidad had gravitated out of its early duality of occupation (part
agriculturist, part small trader). Most found themselves in the later occupation,
jostling side by side with their Portuguese, Indian, and Black counterparts, but
having at least in Trinidad – an image of being the most successful of these
groups in this field” (p. 191).
A racialized system of land ownership developed wherein Whites and Near-
whites owned most of the plantations on the islands at the time of emancipation.
According to Williams (1942), “in 1841 the Trinidad planters objected to a proposal from
the Secretary of State that 40 acres should be the smallest area of Crown land granted to
any person” (p. 87). The planters insisted that grants be no smaller than 320 acres and by
opposing this plan they were able to ensure sugar production, the most profitable crop at
that time, would continue to be out of the reach of the newly freed slaves because sugar
needed to be cultivated on large landholdings for maximum efficiency and profitability.
This also effectively meant that the newly freed slaves would be restricted to peasant
agriculture (Mintz 1989). Williams argues that the colonial government actively worked
against the interest of small farmers in favor of large plantation holders, who were often
represented in the Crown Colony system of government. It is the desire to maintain these
large-scale plantations that Williams, Mintz and Beckford claimed inspired and
maintained the hierarchical racialized labor market. Concurring with R.T. Smith,
8 Robert and Byrnes (1966) found that between 1882 and 1884, 2645 Chinese came to
Trinidad and Look Lai (1993) found that the 1931 census found 2027 Chinese on the
island.
12
Beckford (2000a) argues that plantation “society as a whole was therefore rigidly
stratified by race and colour directly correlated with occupational status on the plantation,
with very limited social mobility” (p. 246)
Access to land ownership was especially essential in the plantation economy.
Large-scale holdings were needed for the production of sugar and later cocoa and coffee.
According to Beckford (2000a), emancipation did little to change the position of Blacks
in the society because the Whites and Near-whites were able “to maintain their
stranglehold over the basic means of production – the land” (p. 247). He claims that even
on an island like Trinidad, with an excess of land (relative to smaller islands) Whites
control over most of the fertile land led to four major consequences. Firstly, social and
economic mobility was very restricted. Secondly, the plantation society developed a
social system “based on caste, race and colour” (p. 247). Thirdly, production and
resources were geared towards fulfilling the needs of the colonial power rather than the
native population. Finally, that labor was organized inefficiently in the plantation
system. Beckford suggests that the plantation system created an unequal society, where
social mobility and wealth was tied to land ownership. Therefore as long as land
ownership was denied to the majority, wealth accumulation would also be elusive. Mintz
(1998) supports this view when he writes that in the competition between the plantation
owner and small-scale (peasant) farmer “for scarce resources – such as agricultural
extension, assistance, government-supported irrigation, and highways. Such struggles are
consistently won by the plantations” (p. 133)
As early as 1857, Williams (1942) states that the profitability of sugar on the
island was threatened, not by disease or world prices, but by the development of mega-
13
plantations on Cuba. Cuban plantations were not only larger, but had better technology,
produced a better product and investors from America had sunk about US$30 million in
the industry by 1896. Alongside Cuban sugar, Trinidad, according to Williams was also
competing with beet sugar from Europe, particularly Germany and by 1902 “king” sugar
was dead.
According to Brereton (1981) cocoa production became a viable alternative to
sugar between 1866 and 1920. Unlike sugar, smaller plots of land could be converted
into cocoa estates and with the loosening of availability of Crown lands by Governor
Gordon9 large numbers of small-scale farmers could become involved in the industry.
Brereton points out that there were two ways smaller farmers would gain access; either as
the owner/cultivator of their land or as a contracted cultivator of someone else’s property.
Usually an investor would purchase large tracts of Crown lands and then turn them over
to the farmer for a five year period and a percentage of the sale of the crop. Despite the
development of these small farms, the White elite were able to ensure their continued
dominance in the economic and political life of the islands. Brereton points out that the
colonial government failed to sustain land reform started by Gordon and continued
preferential access of elites to the capital and the financial market. As the large-scale
model of the plantation began to failed, peasant farmers who were excluded from access
the financial market were unable to form a viable middle-class and would take longer for
this group to emerge.
Even with the failure of large-scale plantation agriculture by 1930, land
ownership remained important to wealth accumulation. Brereton describes how even
9 Gordon was governor from 1866 to 1870
14
with the collapse in the prices of sugar and cocoa, the colonial government worked with
large, mostly white plantation owners, to prevent the foreclosure of their properties by the
banks to which they were mortgaged. Laborers on the plantations continued to be
subjected to arduous working conditions. The sugar industry moved towards a system of
cane farmers where smaller farmers would sell their crops to the larger estate, thus
removing the need to pay for labor altogether from the estate’s costs. Brereton also
points out that some of the earliest oil wells were dug, Africans and Indians were
employed to clear the forest, but Whites (British, Americans and local Creoles) and a
Chinese-Trinidadian who were given leases, able to gain access to capital and the
government, and had the technical know-how.
The pattern of social hierarchy established at the inception of European rule
continued as the island moved towards independence in 1962. The planter class (mostly
White), long after the failure of plantation agriculture, continued to receive favorable
treatment from the colonial government and as a result higher had social status. Many of
them were able to use their land to acquire capital (through sale or mortgages) to start
businesses or provide university (usually European but sometimes American) education
for their children especially in medicine and law. This group also controlled the banking
sector, worked for oil companies and owned large merchandizing companies. The
Chinese and Syrian/Lebanese groups, by 1962, had entrenched themselves in the
merchant and trader class, running import/export businesses, working as middle men
between the wholesaler and the rural shopkeeper or acting as the rural shopkeeper. The
Syrian/Lebanese group developed a reputation of being cloth merchants while the
Chinese were more diverse. The much larger African and Indian populations remained
15
mostly employed as laborers, lower level civil servants, store clerks and teachers. Some
did manage to become professionals (lawyers and doctors), clergy and businessmen;
these were more often the exception.
In 1925 the Woods Commission expanded suffrage (Williams, 1942). The
criterion was based on “the domination of property and wealth” (p. 220). Eligibility of
voters and those permitted to serve in the legislative council was tied to proof of income,
residence and education. The trade union movement, which began in the 1920s the trade
union movement, flourished on the islands. Initially it was closely tied to the general
political development of the working-class, which was comprised of mostly ethnically
African and Indian laborers. With leaders like Cipriani, Butler and Rienzi, sugar and oil
workers began to organize themselves. The growing labor movement attempted to
respond to the unfair working conditions that had long received the tacit approval of the
colonial government. Brereton claims that alongside this growing political awareness
was a simultaneous cultural awakening that encouraged people to learn and to appreciate
the various ethnic traditions present on the islands. For the first time, the African and
Indian working class saw leaders who championed their causes. With increased access to
education, many of them were able to achieve middle class status.
Outside of the major urban centers of Port of Spain and San Fernando, however,
the African and Indian remained mostly segregated by geography and employment. This
was not by formal design as in the United States, but rather by coincidence. After slavery
Africans tended moved into urban centers to look for work and remained there. Indians,
having been recruited to replace African labor, were settled, on, or near, the plantations
they would work on and their movement was often restricted. When their indentureship
16
ended many were given plots of land instead of their return passage. Africans received
no such compensation at the end of slavery. Many Indians therefore worked as
agricultural laborers or in the sugar industry. Working class Africans tended to be
employed as laborers in oil, casual day laborers and agriculture. The only real access to
the middle class available to these two groups was education. Primary education was
free by 1851 but the quality was sometimes dubious. A sound primary school education
however could allow a graduate to enter the teaching ranks through a long system of
mentorship and obtain other middle class jobs. Secondary education remained available
mostly to those who could afford to pay for it except when a poor child passed a national
examination that allowed them access. Gaining entry to a secondary school was no
guarantee of attendance or completion since parents, particularly rural ones, would often
be forced into paying for their child’s books and room and board since most of the high
schools were located in urban centers.
The growing African and Indian middle and intellectual class, supported by the
working class pushed for political independence10
. Although divided mostly along
ethnicity, two major political parties formed, the PNM lead by Eric Williams with an
overwhelmingly urban, African and Christian membership and the Democratic Labour
Party (DLP) which by default was consisted of mostly Indian, non-Christian and rural
members. This was not the first time race was present in social movements, but
according to Brereton (1981) Williams reacted to the DLP’s 1958 federal election victory
in a speech by accusing them of appealing to race in order to motivate the electorate. She
argues that what Williams in fact was doing is making “an appeal for counter-
10
Independence from Britain was achieved in 1962.
17
mobilization” (p. 239). Eventually, this pattern of racialized politics, which first surfaced
in the early trade union movement, would become a permanent fixture of the political
scene. The PNM would continue to be perceived as the African party and the DLP along
with all its political descendants, the Indian party.
Political independence however did not lead to radical social change. The PNM
who were able to obtain the political majority in the parliament beginning in 1962 until
1986 were forced to confront the social order in 1970 by the Black Power Movement.
This social rebellion was in response to the rigid cultural divides on the island. Up to this
point in time, Africans and Indians found themselves marginalized socially and excluded
from various fields of employment. Young, mostly middle-class, Afro-Trinidadian
students, organized and led marches in the capital to protest their continued exclusion
from jobs especially those in the private sector like banking. The organizers saw
themselves as champions of all the middle and working classes and not just of Afro-
Trinidadians. Unfortunately for them, many Indo-Trinidadians rejected the idea of Black
Power as a solely African expression. Among some Afro-Trinidadians, including the
ruling class, the movement leaders were seen as rebellious, violent and ungrateful.
Although the movement did achieve some of it goals including the opening up of new
employment opportunities to Africans and Indians, it remains characterized as Afro-
centric in nature.
2.1 HISTORICAL CONTEXT AND THE RISE OF THE POST-INDEPENDENCE ELITE
Using Beckford’s plantation society model, the study examines the political and
capitalists elites of Trinidad and Tobago. An underlying assumption is that the capitalist
18
elites retain the social capital and gain political access through the membership of various
family members in political parties and the financing of political campaigns. These
activities are then rewarded by appointments to a number of state-controlled positions.
Premdas (2007) writes that “[t]he issue of equality and inequality in the context of inter-
ethnic rivalry under the pervasive condition of multi-ethnicity in the contemporary state”
(p.3) accordingly, my study would imply that there might be some covert collusion
between the elite and the political parties who govern the country. The results of which
are reflected in Table 2.2. Citing an article in the Economist Henry (1986) maintains that
within plural societies and from
“the standpoint of Marxian and Dependency perspectives, the new elites
that succeeded the former colonial elite have simply adapted to a new role
in a continuing relationship between their own peripheral country and the
metropolitan center and are the new agents for the maintenance of the old
arrangements which are now mediated through transnational corporations
and the bureaucratic state” (p. 76).
This suggests the importance of examining the composition of elite in Trinidad and
Tobago.
19
CHAPTER III
LITERATURE REVIEW
3.1 ELITES
Social scientists generally agree that modern societies typically have a hierarchical social
structure, the elite on the top and the working and underclass at the bottom (Mills, 1945
& 1956 and Pareto 2000). The idea of the elite however needs to be examined. The
assumption is often made, not just of their existence but that they are a well-defined
easily identifiable group (Laumann and Pappi 1973 and Zeitlin, Neuman and Ratcliff
1976). Mills’ 1956 classic work, The Power Elite argues that this group is identifiable
and has tremendous power over society. According to Mills, the elite “is composed of
men whose positions enable them to transcend the ordinary environments of ordinary
men and women; they are in positions to make decisions having major consequences” (p.
3). Mills suggests that elites in America are able to influence various parts of the society
including the military, government, business and media. He claims that the emergence of
the elite is shaped by historical events and the nature of modern social institutions which
trends towards centralization of decision making. In an earlier study Mills (1945)
examined seven periods of American history, from 1570 – 1879, and determined that
there are some discernible patterns among the elite with regards to their geographic
location, educational level, father’s occupation and family linage. The
20
current study examines the elite of Trinidad and Tobago by looking at senatorial, judicial
and company board of director appointments made from 1962 – 2002 in order to
determine if there are any obvious patterns within this group with regards to ethnicity,
gender, high school affiliations and business connections.
Dahl (1958) and Mintz, Freitag, Hendrick and Schwartz (1976) suggest that some
scholarly work fails to properly define “the elite”. The authors contend that this is a
major deficiency with elite research. Wrong (1968); Bachrach and Baratz (1962); and
Perrucci and Pilisuk (1970) all argue that research on elites does a poor job of defining
precisely who the elite are and what, if any power they actually have. According to these
authors there is a difference between “people who have a reputation for power, which
may or may not be related to actual power” (p. 1041). These authors point out that a
major problem that is evident with much of elite research is the assumption that the
“ruling elite is a well-defined group” (Dahl, 1958). Dahl’s suggestion therefore that the
ruling elite are “a minority of individuals whose preferences regularly prevail in cases of
difference in preference on key political issues” (p. 464) is an excellent working
definition. One of the implications of this study is that these appointees in Trinidad and
Tobago who are the subject of this study, by virtue of their appointments and the nature
of their business interest, have access to information not readily available to others. It is
this access that allows this group and the networks which they are a part of to maintain
their economic and social elite status.
21
3.2 SOCIAL NETWORKS
Many researchers use social networks to examine the presence and influence of elites in
the political arena (Moore, 1979; Padgett and Ansell 1993; Alba and Moore 1983;
Kadushin 1995; Heinz, Laumann, Salisbury and Nelson 1990; Higley, Hoffmann-Lange,
Kadushin and Moore 1991; and Ussem 1978). This methodological approach attempts to
uncover the subtle links between individuals and institutions that are not always apparent.
It tries to discover whether the assertion that is often made that political power is
concentrated in the hands of a few (the elite), who use this position to benefit
economically, socially and politically is valid. Often these studies examine the presence
of particular families or ethnic groups in certain industries; as members of executive
boards; political offices or some combination of these. Even though all of these studies
found that there was a core group of elites, the composition and structure of these groups
differed. Some groups are primarily comprised of one ethnicity and others school
friends. Generally however researchers concluded that their membership was primarily
comprised of wealthy individuals but some networks were loosely connected members
revolving around a centralized inner group while other networks were a series of spheres
connected by go-betweens.
Padgett and Ansell (1993) make a strong case for the need to study elite social
networks in order “to penetrate beneath the veneer of formal institutions and apparently
clear goals, down to the relational substratum of people’s actual lives” (p. 1310). Their
work suggests that any investigation of elites must consider public (formal) and private
(informal) links between the group as, “it is clear that marriage [private] and trading
[public] relationships are primary forces behind this blockmodel portrait of the Florentine
elite” (p. 1313). It is this perceived link and strength of ties between the private and
22
public that social network methodology can uncover. Aside from family connections,
friendships are also a source of network connections for elites with regard to access to
information, especially in the fields of employment, politics and business (Kadushin,
1995; Krackhardt, 1990; and Gibbons, 2004). This paper contends that the elite network
in Trinidad and Tobago is dominated by members who are connected via family
membership (by blood or marriage); and friendships (formed in secondary school and by
religious affiliation).
The pattern of interlocking directorates between business enterprises and political
appointments or interest groups is another example of elite networks (Dooley, 1969;
Freitag, 1975; and Levine, 1972). The hypothesis that guides this proposal is not just that
this pattern also exist in Trinidad and Tobago, but that in regard to appointments to non-
elected offices including, but not limited to, the boards of public enterprises, judgeships
and as national Senators minority ethnic groups are over-represented when compared to
their composition within the general population. The old elite of Trinidad and Tobago
are primarily comprised of members who are in the ethnic minority. Greeley (1974) in
his own investigation of political participation among ethnic groups found there were
significant differences in the levels of involvement. Alba and Moore (1982) sampled the
ethnicity of the leadership of public and private sector organizations from 1971 – 1972.
According to their findings, certain ethnic minorities, particularly Irish Catholics, are
over represented within the American elite and that White Anglo-Saxon Protestants
(WASPs) elites tend to “have more elite educations, and are older than other groups” (p.
380).
23
3.3 ECONOMIC DEVELOPMENT
Williams (1966) argues in Capitalism and Slavery that the European colonists developed
the Caribbean region to service the needs of its empires with little regard for the region’s
inhabitants. This foundational work examines the connections between economics,
politics and society. Alonso (2002) claims that one result of this colonial arrangement is
dependency on the exportation of one or two (usually agricultural) goods. This means
that the region is often subject to boom and bust cycles as the price of the good rises and
falls on the world market and over which they have little control. Various governments
try to break this pattern through diversification, encouraging foreign investment and
developing the tourism sector but the results are questionable.
Sir W. Arthur Lewis, the St. Lucian-born, Nobel laureate, conceived of his theory
of modernization based on the ideas of classical economists and experiences of Western
industrialized countries (Lesson, 1982 and Rostow, 1990). This two-tiered development
model was proposed to help countries transition from underdeveloped to developed
status. The traditional sector, consisting mainly of subsistence agricultural, labor-
intensive production requires little capital investment is to be a source of food and other
locally-produced goods intended for the national market employing large numbers of
unskilled workers. The modern sector, which is the industrial or manufacturing segment
of the economy employs wage labor, requires capital investment and has as its goal the
generation of profits. This segment of the economic is intended to attract and retain
foreign investment and technology in order to produce goods for an international market.
According to Demas (1980) Lewis’ model “advocates aggressive extra-regional export-
led growth supported by regional import-substitution as the solution to the region’s
24
unemployment problem” (p. 82). The two sectors are not to compete with each other, but
rather to support the national economy. The tradition tier employing large number while
supplying food and other goods and the modern tier increasing the foreign currency
reserves, the pool of skilled wage earners and access to technology. St. Cyr (1980)
maintains that Lewis and his disciples “concluded that the islands must industrialise at all
cost” (p. 19) for development to take place.
Cumper (1974) states that a survey of Lewis’ work would demonstrate “that his
main concern has always been with the strategy of development, in relation to which the
policy of developing light manufactures for export was seen by him as a particular tactic
adapted to the needs of the Caribbean” (p. 466). Very few Caribbean nations have had
any success with private foreign investors or marketing their goods on the international
market because of history of mono-crop agricultural production, limited technological
expertise and restricted access to large amounts of capital that is often located in North
American or European metropole. Farrell (1980) suggests that this is a major
shortcoming of Caribbean governments because they do very little to promote the
manufactured exports and “that the Caribbean governments did not follow the Lewis
strategy” (p. 63). Instead the region remains in the same position it has always been,
exporting raw materials (bananas, oil, natural gas, bauxite and asphalt) to the world and
importing finished goods (food, machinery, technology and clothes). Even though many
islands have turned to tourism, the viability of this industry has been tenuous and the
social problems that have resulted are many.
Wallerstien’s world-systems model attempts to understand and account for the
discrepancies between the developed and developing world economies. He writes (1976)
25
that, “despite all the presumed effort (aid, technical assistance, human investment), the
so-called ‘gap’ between the ‘developed’ and the ‘developing’ countries was growing
bigger, not smaller” (p. 344). According to the world-systems model, countries and their
economies are located somewhere within a sphere, either close to the core or towards the
periphery. Hass (2007) contends that this theory “posits real structural forces and
mechanisms that create and reproduce global inequality” (p. 50). Wallerstein’s model
suggests that countries situated within the core, have stronger economies and are more
influential in the world market. These countries are mostly in North America and
Western Europe and have robust manufacturing, technological and financial sectors.
They also usually have stable democratic governments. For countries on the periphery,
much of their economy is based on agriculture and mining. The prices set for these goods
tend to be controlled by forces outside their boundaries in the futures markets in major
metropolitan cities like London, New York and Chicago. Many of the governments in
these countries are unstable and there are often limited democratic institutions.
Dependency theory, which grew out of the world-systems paradigm, examines the
role structural relationships between countries. In this model, distribution of economic
resources among countries is a reflection of the balance of power between them.
According to Leys (1977) this theory, developed by Andre Gunder Frank in the 1970s,
attempts to address the failures of the modernization concept (especially in Latin America
and Africa) and
“inverted many of the assumptions of modernization theory. It saw
metropolitan policy as maleficent, not beneficent; inflows of foreign
investment were seen as giving rise to much greater interest and profit
outflows; ‘modernizing elites’ were really compradors, or lumpen-
bourgeoisies, serving their own and foreign interest, not those of the
people; world trade perpetuated structures of underdevelopment, rather
26
than acting as a solvent of them. Capitalist development … offered
nothing to the periphery; and the solution lay in reducing links to the
metropoles and bring about ‘autocentric’ national growth” (p. 12).
Proponents of this theory suggest that less developed countries remain underdeveloped
because of the control and influence of more developed countries on major international
institutions like the World Bank and International Monitory Fund (IMF) and other
sources of capital. For these theorists, the role of multinational corporations and business
elite needs to be considered because they argue that these controlling groups have the
power to shape international monitory policy and their monopolization of international
capital have direct consequences on development. According to Gereffi and Fonda
(1992) dependency theory “stresses the fact that structural dependency on foreign capital
and external markets in the more advanced countries of the third world constrains and
distorts, but is not incompatible with, capitalist economic development” (p. 424).
Beckford’s (1972) plantation economy system while not solely a model of
development attempts to explain the underdevelopment of the region. Beckford argues
that economic forces work alongside social ones to inhibit growth. He writes that the
plantation system is “the totality of institutional arrangements surrounding the production
and marketing of the plantation staple” (p. 245). According to this model, an individual’s
caste and color are important factors in the process of social stratification. As a result
Whites and Near-whites are privileged and Non-whites (Blacks and Indians) are
not. Beckford maintains that emancipation did little to end this social order, in fact
because the “plantations managed to maintain their stranglehold over the basic means of
production – the land” (p. 247) the plight of Non-white laborers remains the same. This
model claims that the Caribbean underdevelopment continues because resources are still
27
controlled by a few (the White and Near-white elites) from the colonial era, there is an
abundance of inexpensive and unskilled labor and the peasant farmer is restricted to poor
quality land and receives little institutional support.
Unlike Lewis’ model, the plantation model proposed is by Beckford considers
historical and social factors that shaped the society. Beckford argues that these factors
are important because the privilege afforded to the elites and the access denied the non-
elites have become institutionalized. According to Beckford, Lewis’ model does not
account for these factors and therefore will fail (Demas 1980, Farrell 1980 and St. Cyr
1980). Farrell (1980) writes that the New School of economics (of which Beckford was a
member) “was united in an approach to Caribbean economic analysis which stressed the
colonial origins of the economy and its institutions and focused on the new neo-colonial
order which was being created in the Caribbean area in the post-independence period” (p.
64). Farrell’s analysis the New School indicates that it was fervently opposed to Lewis’
suggestion that the modern sector encourage international companies to invest in the
Caribbean since in their opinion was another form of colonialization. Beckford’s
plantation economy model counters Lewis’ by advocating a more holistic approach not
just to the task of development but also to the possible impediments to any plan.
3.4 TRINIDAD AND TOBAGO
Studies of the business and political elite in the Caribbean and Trinidad and
Tobago are relatively scarce. Generally, research has focused on the problems that face
the political and economic development in the Caribbean as a consequence or in response
to issues of ethnic diversity particularly with regard to access to capital and the
28
development of an entrepreneurial class (Ayearst, 1954; Allahar, 2004; Henry, 1989 and
1990; and Adams & Masuoka 1961). This study considers not just the broad subject of
how elites access political and economic power in a post-colonial environment, but
focuses on the ethnic minorities in Trinidad and Tobago and their representation in the
national Senate, judiciary and various company boards. Parris’ (1985) article found that
there was a pattern of interlocking directorships among 28 of the companies traded on the
Trinidad and Tobago Stock Exchange. Most of these board members were from ethnic
minorities and all were educated at two of the most prestigious grammar schools in
Trinidad. While Parris’ paper does not utilize social network theory, it does offer a very
basic analysis of one aspect of the economic elite class that points to board membership
and school alumni.
Premdas’ (2007) work in conjunction with Paris’ suggests that the ethnic
minorities of Trinidad and Tobago enjoy preferential membership within the national
government. Premdas looked mainly at the ethnic tension between African and East
Indians within the public sector in Trinidad and Tobago, stemming from their access to,
and promotion within, the civil service. He includes however some scrutiny of other
ethnic groups within the government. He points out that over the course of 10 elections
between 1961 and 2002, there were 354 Members of Parliament elected and of that
number 20 (5.7%) were white and 7 (2%) were Chinese or part-Chinese. These figures
indicate that the two minority groups are over represented as elected officials in the
national government11
. Cabinet ministerial appointments of the 2002 PNM government,
which included national senators (who are appointed and not elected) reflects the fact that
11
According to the Central Statistical Office in 2000 Whites were 0.6% and Chinese
0.3% of the total population.
29
minorities are a significant segment compared to the population at large. Of the 24
ministers, 3 were white and 1 Chinese. Premdas’ inquiry does indicate that there is a
pattern within the national government that favors ethnic minorities disproportionally
compared to the African and East Indian majority. While neither of these studies utilize
social networking methodologies, they do hint at the possible richness and need for a
study like the one currently proposed.
30
CHAPTER IV
CONCEPTUAL MODEL
This paper investigates membership within the elite strata of Trinidadian and Tobagoian
society.
1) There are three groups of elites:
a. Local Whites and Near-whites, mainly the of descendents of planters and
European colonial officials;
b. Descendants of ethnic Chinese and Syrian/Lebanese immigrants; and
c. Ethnic Africans and East Indians.
2) These elites have been appointed to various company/agency boards, the judiciary
and the national Senate. The nature of these organizations are:
a. Private companies: wholly owned by private investors (no government
interests)
b. Public enterprises: partly owned by the State, allowing the State the ability
to appoint members to the board of directors
c. National Senate: these are constitutionally required appointments which
are made by the Prime Minster, Leader of the Opposition, President or
some combination of the three.
d. Judiciary: appointments made by the President based on the
recommendations of the Judicial and Legal Services Commission.
31
Elite theorists (Mills, 1945 & 1956; and Pareto 2000) have proposed that one
characteristic particular to modern industrialized society is the development of an elite
stratum. The means by which membership is obtained in this stratum differs from society
to society. Access to this stratum maybe as a result of family ties, profession, economic
wealth, or race. Historically, elite status in Trinidad and Tobago is a consequence of a
combination of factors. One legacy of the plantation system and British Colonial rule is
the formation of a caste system based on race, occupation and wealth. Plantation owners
and colonial officers occupied the top strata while the plantation workers, mostly people
of African and East Indian ethnicity, dominated the lower levels.
Additionally, the islands’ unique cultural composition complicates the social
order. Although the British Colonial system and its officials influenced the legal
structure of the society, a large number of the plantations were owned and run by
Europeans of French and Spanish heritage. The Spanish settlers who were the islands
first Colonial masters had invited French, Irish and other Catholic Europeans to move to
Trinidad in 1783 in a failed attempt to ward off English occupation. The majority of
those who came were French (Whites and free Blacks) with their slaves. Consequently,
Trinidad more so that Tobago was culturally and socially French but legally British. One
direct effect of this was manifested in the way children of White planters and Non-black
mothers were treated. There is evidence that French and Spanish planters, more so than
British planters or colonial officials, tacitly acknowledged their mixed children. This
acknowledgment sometimes took the form of financial support and/or formal education
which helped create a professional mixed race social class on the islands.
32
The importance of education cannot be overstated (Williams, 1942 and Brereton,
1981). Access to educational opportunities historically has been limited and the system is
based on the British model that rewards the very smartest and the wealthy. Pre-
emancipation, only free persons (mostly Whites) were entitled to be educated and this
usually meant sending the students to Europe to be formally educated. Once slavery
ended, the government was confronted with a growing population who were mostly
illiterate and unemployed. Both the Colonial government and religions bodies
established a number of primary schools. St. Joseph’s Convent, which would eventually
become a girls’ high school, was founded in 1836 to serve children of the French,
Catholic planter class. Secondary education remained limited until 1859 when the
government opened Queen’s Royal College (QRC) for the education of boys. Catholics
worried about the possible Anglicization of their boys at QRC because even though the
school was officially secular, many of its teachers and administrators were Church of
England officials. The Catholic archbishop requested The Holy Ghost Fathers to start a
school for boys and the College of the Immaculate Conception (CIC) or St. Mary’s
College began in 1863.
These two high schools remained at the forefront of male education well into the
twentieth-century when a number of new schools were opened. Most of these schools
had ties to religious denominations and were similar to the English public or grammar
schools in terms of social prestige and academic achievement of their students although
not all schools are afforded the same level of esteem. Collectively these schools are
referred to as the Prestige or First Choice Schools (see Appendix E) because these are the
schools which parents usually rank as their first desired choice if their children are
33
successful in the national exam administered at the end of primary school. These types of
schools closely resemble the English Public School especially as it relates to social status.
Students usually take the exam between age 10 and 12. Typically they have to score in
the highest percentiles to gain entry into these Prestige Schools and because there is a
shortage of space in this type of secondary school, qualified students are sometimes
denied slots.
In an attempt to create more educational opportunities, the government entered
into an agreement with religious school boards in 1960 known as the Concordat. One
result is that more secondary school seats became available. Schools with religious
affiliations however are guaranteed the ability to select up to 20% of their entrance class.
In theory this quota could only be picked from the high achieving and often children of
who are members of the religious organization, siblings of students already attending,
children of alumni, teachers or administrators benefit from these spots. Competition for
secondary school seats is intensive at the Prestige Schools. Parents invest in private
lessons. Those that could afford it, or have the connections, send their children to private
primary or selected public primary schools which are characterized as feeder institutions
for the Prestige Schools. Early in the history of the nation, education was marked as an
important tool for success.
Society in Trinidad and Tobago at the start of the twentieth-century was highly
complex. Divisions by race and ethnicity were plain. Whites were granted more
deference than Non-whites, but among Whites, there was tension between the British and
non-British. Non-whites were also divided by ethnicity and occupation. Within this
group, ability to advance socially and financially was dependent on access to education,
34
jobs and other economic resources that were very limited. Compounding this was the
normative practice of skin color bias. Religious discrimination was also present.
Christians had greater access to official institutions but Catholics claimed to suffer
discrimination when interacting with Colonial offices. Gender inequity was also apparent
both culturally and institutionally as illustrated by the limits in quantity and quality of
girls’ education (especially at the secondary and post-secondary levels) as well as in the
types of occupations or professions available to women. Wealth and occupational
divisions also existed. Plantation owners, high-ranking Colonial officials and
professionals (particularly doctors, lawyers and engineers) were well-placed while small-
scale farmers, itinerant merchants, shop-keepers and low-level Colonial officers like
teachers, postal workers and policemen wheeled less influence while laborers and the
occasional employed had the least influence.
As the country moved towards independence, connections – both formal and
informal, became an important social and political resource in navigating the national
super-structure. Conclusions about an individual’s competence and character were often
inferred based on their public religious affiliation; family name and relations; the high
school (a sometimes primary school) attended; skin color; gender; and profession or
family business. The Black Power Revolt that began in February 1970 openly challenged
this social order. One of the organizers’ complaints was the denial of private sector jobs
particularly in banking and finance to qualified dark-skinned applicants. According to
movement leaders this practice limited occupational and professional access to the
majority ethnic populations (Blacks and East Indians) by a powerful minority (Whites
and Near-whites). Professional development was also severely restricted because of the
35
relatively few free secondary school places available. Admittance to, and successful
completion of, high school was necessary for university education. Top performers at the
secondary level could compete for a government sponsored university scholarship that
was necessary if students wanted to peruse law (as a barrister) or medicine but
completing secondary education according to Brereton (1981) “opened up various
possibilities for white-collar jobs: teaching, the civil service, journalism, minor positions
in business, a practice as a solicitor” (p. 126). By 1970, the Non-white middle-class had
grown and literacy rates, especially in urban areas were high but many well-educated
young people felt excluded from joining the private sector because of traditional
recruitment practices.
The government, through the civil and teaching services and the growing number
of state enterprises was able to absorb many of the newly educated, Non-white members
of the middle-class, but entry into the private sector continued to be restricted. While the
Black Power Revolt did succeed in relaxing some of these constraints at the lower and
middle-management levels, admission to upper-management and company directorships
was usually bestowed to family members (in family-owned firms) or expiates or the very
highly qualified and well-connected national in non-family owned businesses. It follows
therefore, that many of board members at privately owned and state companies would be
alumni of the same secondary schools that judges and senators attended since given the
elitist education system only the very brightest and very wealthy attended these schools.
As a consequence of the social history of the country, this paper is interested in
how decisions about appointments to companies, the national Senate and judiciary are
made. Principally, it will focus on the uncovering the extent to which appointments
36
maybe a result of high school acquaintances or appear to be a result of specialized
expertise or qualifications. While appointments to judgeships require certain professional
credentials, board membership and the Senate does not. Examining all these
appointments might reveal trends towards the professionalization of boards and the
Senate or using these positions as a political reward (at state enterprises and the
Parliament) or a means of accessing information and networking. Attention is paid to
differences in the ethnic composition of these appointments overtime. It is expected that
post-Black Power, there will be a rise in Non-white appointments because of the revolt;
the ever-increasing number of educated Non-white and the majority Non-whites elected
government. A final question for consideration is the status of women. This paper
investigates trends in the appointment of women either in the private or public sectors.
Beckford’s framework suggests that the plantation society developed into a highly
stratified caste system which, by privileging race, limited access to wealth to the ethnic
majorities (Africans and East Indians). Post-independence Africans and East Indians
have risen to become the political leadership creating a majority political elite while
ownership of private capital has remained in the hands of the Whites, Near-whites,
Chinese and Syrian/Lebanese groups.
4.1 SUMMARY OF CONCEPTUAL MODEL
During the post-independence period, the nation has been undergoing social
transformations that make it increasingly possible for non-whites and women to gain
important roles in the private and public sectors. Similarly, opportunities have also
expanded for those who subscribe to non-mainstream religions and those who have not
37
attended the most prestigious schools. Yet these changes have been coming about slowly,
and not without push-back from those who have benefitted most from the traditional
distribution of positions of power and influence.
In this dissertation, I am seeking to establish the degree to which members of
groups that were once not considered for positions of power and influence have gained
such positions during the post-independence period. I am able to examine the record of
appointments to the Senate and to the High Court since independence. Data that pertain
to appointments to the Board of Directors of key businesses are more difficult to
collect. Consequently, the time period covered in my analysis of these appointments is
limited to 2000 through 2011.
4.2 RESEARCH QUESTIONS
With respect to ethnicity:
To what extent are the appointments of Non-whites to the High Court, the Senate,
and Directorships to key companies low in comparison to Whites and Near-
whites?
o In the case of the judiciary, how are appointments distributed vis-á-vis
types of judgeships and ethnicity?
o With regards to the Senate and Directorships, what is the likelihood of
individuals serving multiple appointments during the time period being
considered?
38
With respect to gender:
To what extent are the appointments of women to the High Court, the Senate, and
Directorships to key companies low in comparison to men?
o In the case of the judiciary, how are appointments distributed vis-á-vis
types of judgeships and gender?
o With regards to the Senate and Directorships, what is the likelihood of
women serving multiple appointments during the time period being
considered?
With respect to religious identity:
To what extent is the religious diversity of the nation represented in the High
Court, the Senate, and Directorships?
With respect to educational background:
To what extent have graduates from non-prestige schools been appointed to the
High Court, the Senate, and Directorships?
Beckford’s work suggests that although political independence has been achieved,
the plantation super-structure is re-shaped to include some ethnic majority members, but
ethnic minorities retain significant influence in the public sphere. This paper maintains
that there have been changes overtime to the ethnic, religious, educational and gender
diversity of the elites and therefore power is more dispersed. Because of the size of the
African and East Indian ethnic groups, this paper considers if these appointments are
39
drawn from a large pool of potential candidates or if the Non-white pool is limited to a
small, exclusive group whose members share similar characteristics. Things that might
indicate exclusiveness include ethnicity, gender, cohort, high school affiliation,
profession and if it can be determined, family connections via birth and/or marriage and
religion. In the first scenario, prestige is distributed by the elite who make these
appointments based on patronage, qualifications or expertise and network connections. If
the second scenario is true, then these appointments are closed and limited to very few
who are well connected and their qualifications may be less important (unless it is highly
specialized) than their connections (social, political or economic).
40
CHAPTER V
DATA AND METHODS
This project examines three groups. The first are judges appointed to the High and
Appeal courts and those persons who serve as Chief Justices. This group includes all 113
persons who served from 1900 to up to 2010 (see Appendix A). The analysis, however,
is limited to 101 persons who were on the bench from 1962 to 2010. This means all the
men who served prior to political independence are excluded. The second group consists
of 499 individuals who worked as board members on 26 companies between 2000 and
2011 (see Appendix B). The company records are incomplete and this is discussed in
detail in the next section. The final group comprised 273 persons who served as a full-
time National Senator starting with the First Independent Parliament in 1962 until the
Ninth Republican Parliament ending in 2010 (see Appendix C).
5.1 DATA
There are 3 sources of data used for this project. The first database was obtained from
the library of the Supreme Court of Trinidad and Tobago. It includes the names of all the
persons who served in a permanent capacity as a judge at the High or Appeals Court level
or as Chief Justice. The initial information provided by the library’s records was the
name of individuals as well as the year appointed to the bench. Information related to
sex, ethnicity, date of birth and death, high school and place of birth was obtained
41
through a careful examination of various archival records and official government and
newspaper websites.
The second database is compiled from the records at the Trinidad and Tobago
Ministry of Legal Affairs Companies Registry online search facility. All 5 commercial
banks are included, 7 insurance companies, 3 conglomerates, 3 developers, 3 media and
information entities, 4 distributors and 1 mining enterprise. A total of 15 companies are
privately owned, 2 companies are subject to state supervision and the remaining 9 are
wholly or partial controlled by the state.
It should be noted that although the information for this database was obtained
from official records, for some companies, the records were incomplete. As indicated in
Appendix B, the Registry did not have all the documents for all the companies for the 10
year period under review. The lists of board members for most of the companies are
included but some companies’ records are incomplete. The companies (Appendix F)
with missing information are National Flour Mills (2006 to 2011); Caribbean New Media
(2005 to 2001) ALGICO (2001 to 2011); British American (2001 to 2011); Gulf (2001 to
2011); and Lake Asphalt (2000 to 2009 and 2011).
The official records from the Trinidad and Tobago Parliament is the source of the
third database. Only individuals who served as permanent national senators are included.
As with the judicial database, archival records and government and newspaper websites
are used in an attempt to collect missing information. It is important to recognize there is
a significant anomaly with the records. After the election of April 2002, attempts to form
a government failed. As a result only Independent and Peoples National Movement
senators were named.
42
5.2 VARIABLES
The independent variables used to analyze the data are sex, race, religion, occupation,
high school graduated and industry. In order to determine sex and race, names and
pictures of the subjects are examined. The complexity of race in Trinidad and Tobago
allows for the possibility for individuals to have multiple identities or to ignore
phenotype and instead embrace ethnic cultural heritage exclusively. The decision was
made to use six racial categories: African, Indian, Chinese, White, Mixed and
Syrian/Lebanese. These groups do not reflect the complete racial diversity of the islands
but none of the official documents records race. Therefore race is assigned based on
phenotypical characteristics as observed in photographs, or based on knowledge about
family history, or where the individuals themselves offered a declarative statement about
their race.
Religion is designated based on self-declared statements or where information
about the holy book used at the times of the individual’s public swearing-in ceremony.
This is specific in the case of judges and senators. Additional information used includes
when membership in an organization with religious ties is uncovered or when an obituary
indicated a denomination.
Occupation is determined by examination of official records. For example in the
case of board members, the forms submitted on behalf of the companies in order to
satisfy the Companies Act is relied upon. These documents listed the names, addresses
and occupations of all company directors. The occupations of senators are also recorded
through an examination of the parliamentary and political party websites and newspaper
articles. All occupations are then assigned a code using the United Nations’ International
43
Standard Industrial Classification of All Economic Activities (ISIC), Revision 4. The
document lists 21 codes see Appendix D but category S was reassigned to Trade Union
activities and U to Clergy. Five codes were added to indicate High Court Judges (V),
Appeal Court Judges (W), Chief Justices (X), unspecified retirees (Y) and instances were
occupations were not stated (Z).
High school information is gathered by examining newspaper articles and where
available, alumni records. Of particular interest for the analysis are the schools that are
widely acknowledged to be of high prestige, Appendix E. Where individuals did not
graduate from secondary schools, the names of primary schools are included. This is
important because in the recent past there has been the ability for students to obtain a
School Leaving Certificate in standard 6 or enter into the teaching profession through a
type of apprenticeship program that allowed pupil-teachers or monitors to become
primary school teachers.
Industry categories are allocated using the membership directory developed by the
Trinidad and Tobago Manufacturing Association and individual company websites.
There are 7 categories: banking, insurance, conglomerates, developer, information,
distributors and mining.
5.3 ANALYSES
Three outcomes are examined in this section. The first analysis concerns judges. The
Judiciary of Trinidad and Tobago is comprised of the Magistracy and the Supreme Court.
Both sections ultimately report to the Chief Justice. Magistrates serve a number of
functions but a key one involves determining if a criminal case can proceed to trial in the
44
Supreme Court. The Supreme Court has 2 levels, the High Court with High Court judges
and the Appeals Court which has Appeals Court judges. The Court hears criminal,
family and civil matters.
Judges are appointed to the Court by a five person Judicial and Legal Services
Commission of which the Chief Justice is the Chair. The Commission recommends
candidates to serve on the judiciary to the President who is constitutionally bound to act
on these recommendations. Persons can be appointed directly to the High Court, Court
of Appeal or to serve as the Chief Justice. Qualifications for High Court judges are
minimal – an attorney-at-law with ten at least years of experience – appointments directly
to the Appeals Bench and Chief Justice requires more credentials. The type of
appointment of interest for this analysis involves those judges who have only served on
the High Court. Since all judges must be qualified attorneys-at-law, the decision of
which individuals from the legal profession are selected reflects more than simple legal
knowledge. Descriptive data are summarized and models predicting which judges serve
only on the High Court are estimated.
The second analysis focuses on those who have held multiple appointments on the
boards of companies. These companies are drawn from private and state companies and
include a cross-section of economic activities. Each company has its own criteria for
board appointments. For state companies the qualifications are articulated and usually
mandated by an act of parliament but private companies determine their own membership
qualifications. All directors are appointed therefore learning which individuals are
selected by which companies is telling. More particularly by focusing on those who have
held multiple appointments on the boards of companies, this study seeks to determine
45
which individuals are positioned to be influential within the business world. Descriptive
data are summarized and models predicting which individuals serve on only one board
and which individuals serve on two or more company boards.
The third analysis examines the appointment of national Senators. The national
bicameral government is divided between the Lower House – elected Members of
Parliament and the Upper House – appointed Senators. There are 3 types of Senators:
Government, Opposition and Independent. Government and Opposition Senators are
nominated by the political parties that are successful in the national elections and their
names submitted to the President. However Independent Senators are selected by the
President in consultation with the Prime Minster and Leader of the Opposition. There
are 2 minimum qualifications for serving in the Senate. Individuals must be at least 25
years old and a citizen of Trinidad and Tobago.
This study focuses on Senators who have served multiple terms and compares
them to one-term Senators. It can be surmised that individuals who serve multiple terms
are perceived as having extra-ordinary talents important to the national community or as
valuable to the particular political party that nominates them. Descriptive data are
summarized and models predicting which Senators have served only 1 term and which
Senators have 2 or more terms.
46
CHAPTER VI
RESULTS
Results for this research are presented by dataset. Beginning with the individual
databases, the frequencies, crosstabs and binary logistic regressions for judges, board
members and senators are reported. Next, the 3 groups are analyzed to investigate the
connections between the three groups to learn about connections between the various
individuals in the groups.
6.1 JUDGES
The first woman appointed to the High Court, the lowest level of the Supreme Court of
Judicature, was Elizabeth Bourne in 1976 more than 14 years after the country achieved
national independence. Jean Permanand was appointed to the Appeals Court 7 years later
in 1983. Although the number has increased, women are still a minority in the judiciary,
16.8% (Table 5.1) and no woman has been appointed to serve as chief judge, even
temporarily.
As discussed earlier, the years considered in this analyses range from 1962 to
2012. This period begins with political independence and includes several changes in the
governing political parties.
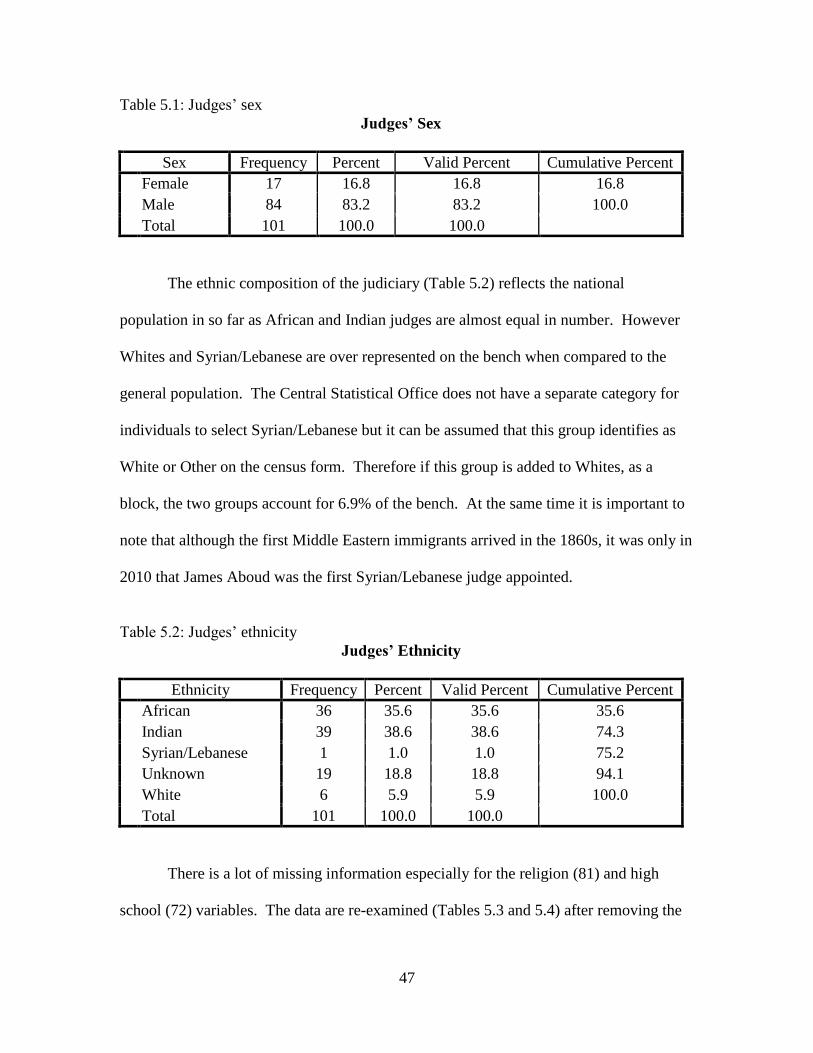
47
Table 5.1: Judges’ sex
Judges’ Sex
Sex Frequency Percent Valid Percent Cumulative Percent
Female 17 16.8 16.8 16.8
Male 84 83.2 83.2 100.0
Total 101 100.0 100.0
The ethnic composition of the judiciary (Table 5.2) reflects the national
population in so far as African and Indian judges are almost equal in number. However
Whites and Syrian/Lebanese are over represented on the bench when compared to the
general population. The Central Statistical Office does not have a separate category for
individuals to select Syrian/Lebanese but it can be assumed that this group identifies as
White or Other on the census form. Therefore if this group is added to Whites, as a
block, the two groups account for 6.9% of the bench. At the same time it is important to
note that although the first Middle Eastern immigrants arrived in the 1860s, it was only in
2010 that James Aboud was the first Syrian/Lebanese judge appointed.
Table 5.2: Judges’ ethnicity
Judges’ Ethnicity
Ethnicity Frequency Percent Valid Percent Cumulative Percent
African 36 35.6 35.6 35.6
Indian 39 38.6 38.6 74.3
Syrian/Lebanese 1 1.0 1.0 75.2
Unknown 19 18.8 18.8 94.1
White 6 5.9 5.9 100.0
Total 101 100.0 100.0
There is a lot of missing information especially for the religion (81) and high
school (72) variables. The data are re-examined (Tables 5.3 and 5.4) after removing the
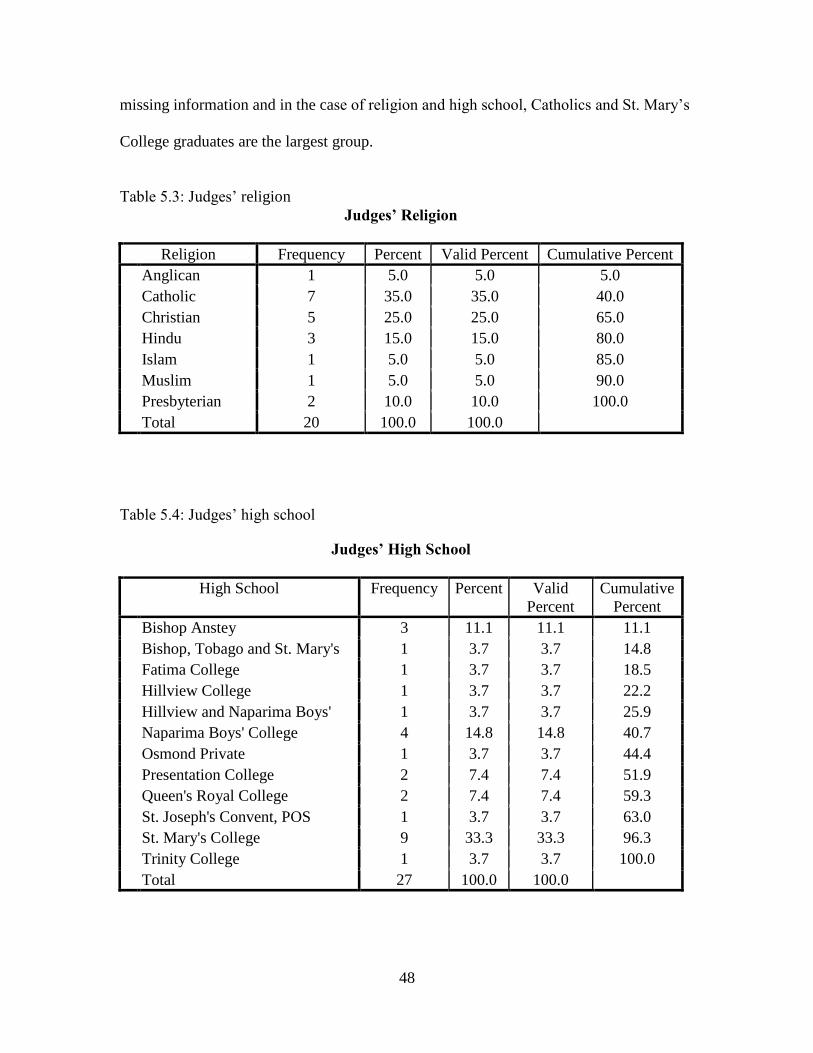
48
missing information and in the case of religion and high school, Catholics and St. Mary’s
College graduates are the largest group.
Table 5.3: Judges’ religion
Judges’ Religion
Religion Frequency Percent Valid Percent Cumulative Percent
Anglican 1 5.0 5.0 5.0
Catholic 7 35.0 35.0 40.0
Christian 5 25.0 25.0 65.0
Hindu 3 15.0 15.0 80.0
Islam 1 5.0 5.0 85.0
Muslim 1 5.0 5.0 90.0
Presbyterian 2 10.0 10.0 100.0
Total 20 100.0 100.0
Table 5.4: Judges’ high school
Judges’ High School
High School Frequency Percent Valid
Percent
Cumulative
Percent
Bishop Anstey 3 11.1 11.1 11.1
Bishop, Tobago and St. Mary's 1 3.7 3.7 14.8
Fatima College 1 3.7 3.7 18.5
Hillview College 1 3.7 3.7 22.2
Hillview and Naparima Boys' 1 3.7 3.7 25.9
Naparima Boys' College 4 14.8 14.8 40.7
Osmond Private 1 3.7 3.7 44.4
Presentation College 2 7.4 7.4 51.9
Queen's Royal College 2 7.4 7.4 59.3
St. Joseph's Convent, POS 1 3.7 3.7 63.0
St. Mary's College 9 33.3 33.3 96.3
Trinity College 1 3.7 3.7 100.0
Total 27 100.0 100.0
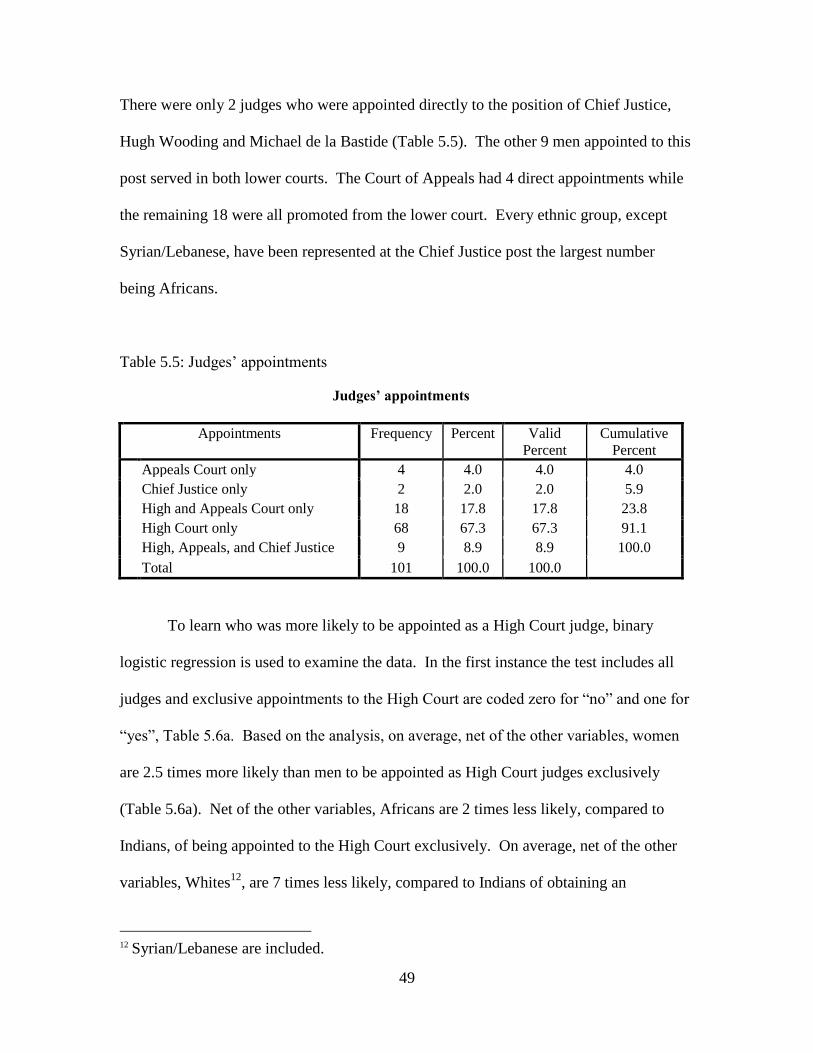
49
There were only 2 judges who were appointed directly to the position of Chief Justice,
Hugh Wooding and Michael de la Bastide (Table 5.5). The other 9 men appointed to this
post served in both lower courts. The Court of Appeals had 4 direct appointments while
the remaining 18 were all promoted from the lower court. Every ethnic group, except
Syrian/Lebanese, have been represented at the Chief Justice post the largest number
being Africans.
Table 5.5: Judges’ appointments
Judges’ appointments
Appointments Frequency Percent Valid
Percent Cumulative
Percent
Appeals Court only 4 4.0 4.0 4.0
Chief Justice only 2 2.0 2.0 5.9
High and Appeals Court only 18 17.8 17.8 23.8
High Court only 68 67.3 67.3 91.1
High, Appeals, and Chief Justice 9 8.9 8.9 100.0
Total 101 100.0 100.0
To learn who was more likely to be appointed as a High Court judge, binary
logistic regression is used to examine the data. In the first instance the test includes all
judges and exclusive appointments to the High Court are coded zero for “no” and one for
“yes”, Table 5.6a. Based on the analysis, on average, net of the other variables, women
are 2.5 times more likely than men to be appointed as High Court judges exclusively
(Table 5.6a). Net of the other variables, Africans are 2 times less likely, compared to
Indians, of being appointed to the High Court exclusively. On average, net of the other
variables, Whites12
, are 7 times less likely, compared to Indians of obtaining an
12
Syrian/Lebanese are included.
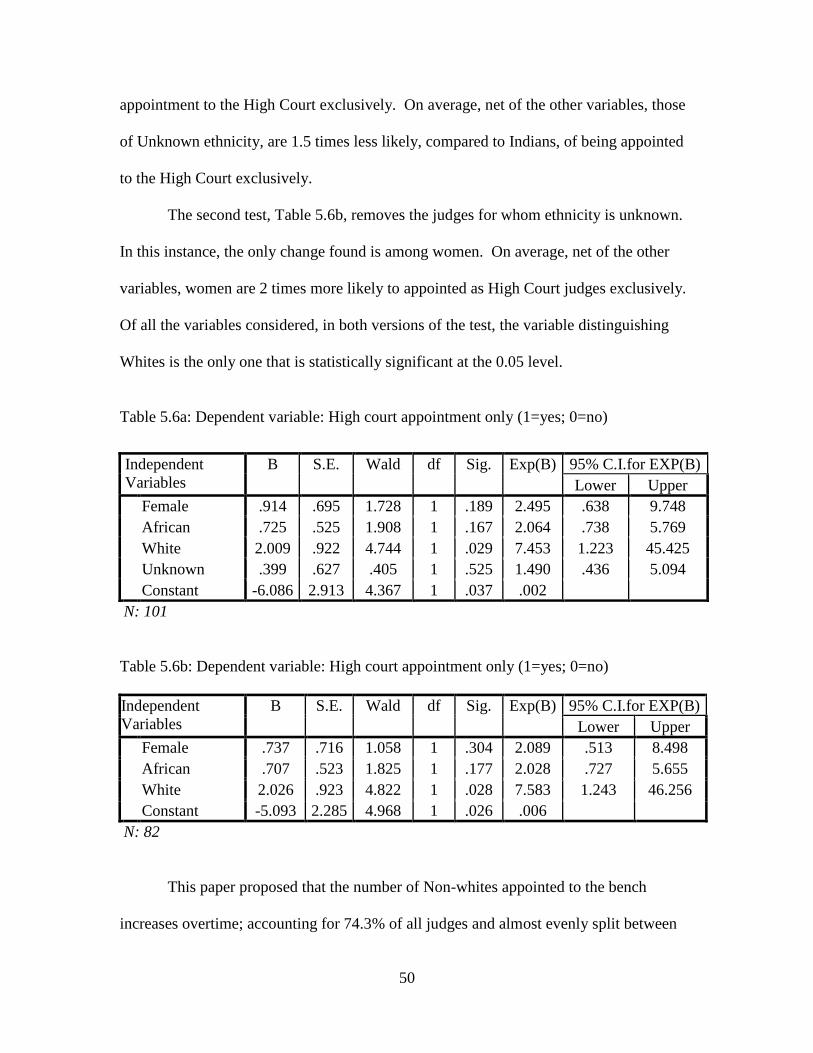
50
appointment to the High Court exclusively. On average, net of the other variables, those
of Unknown ethnicity, are 1.5 times less likely, compared to Indians, of being appointed
to the High Court exclusively.
The second test, Table 5.6b, removes the judges for whom ethnicity is unknown.
In this instance, the only change found is among women. On average, net of the other
variables, women are 2 times more likely to appointed as High Court judges exclusively.
Of all the variables considered, in both versions of the test, the variable distinguishing
Whites is the only one that is statistically significant at the 0.05 level.
Table 5.6a: Dependent variable: High court appointment only (1=yes; 0=no)
Table 5.6b: Dependent variable: High court appointment only (1=yes; 0=no)
Independent
Variables
B S.E. Wald df Sig. Exp(B) 95% C.I.for EXP(B)
Lower Upper
Female .737 .716 1.058 1 .304 2.089 .513 8.498
African .707 .523 1.825 1 .177 2.028 .727 5.655
White 2.026 .923 4.822 1 .028 7.583 1.243 46.256
Constant -5.093 2.285 4.968 1 .026 .006
N: 82
This paper proposed that the number of Non-whites appointed to the bench
increases overtime; accounting for 74.3% of all judges and almost evenly split between
Independent
Variables
B S.E. Wald df Sig. Exp(B) 95% C.I.for EXP(B)
Lower Upper
Female .914 .695 1.728 1 .189 2.495 .638 9.748
African .725 .525 1.908 1 .167 2.064 .738 5.769
White 2.009 .922 4.744 1 .029 7.453 1.223 45.425
Unknown .399 .627 .405 1 .525 1.490 .436 5.094
Constant -6.086 2.913 4.367 1 .037 .002
N: 101
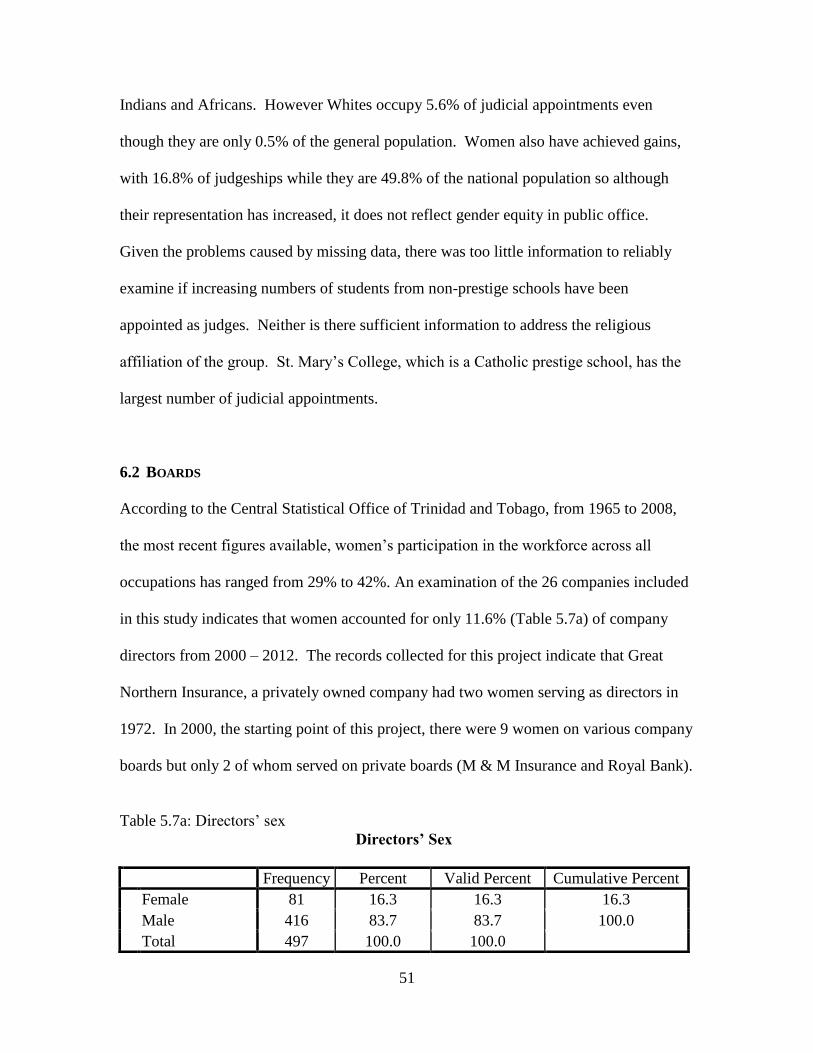
51
Indians and Africans. However Whites occupy 5.6% of judicial appointments even
though they are only 0.5% of the general population. Women also have achieved gains,
with 16.8% of judgeships while they are 49.8% of the national population so although
their representation has increased, it does not reflect gender equity in public office.
Given the problems caused by missing data, there was too little information to reliably
examine if increasing numbers of students from non-prestige schools have been
appointed as judges. Neither is there sufficient information to address the religious
affiliation of the group. St. Mary’s College, which is a Catholic prestige school, has the
largest number of judicial appointments.
6.2 BOARDS
According to the Central Statistical Office of Trinidad and Tobago, from 1965 to 2008,
the most recent figures available, women’s participation in the workforce across all
occupations has ranged from 29% to 42%. An examination of the 26 companies included
in this study indicates that women accounted for only 11.6% (Table 5.7a) of company
directors from 2000 – 2012. The records collected for this project indicate that Great
Northern Insurance, a privately owned company had two women serving as directors in
1972. In 2000, the starting point of this project, there were 9 women on various company
boards but only 2 of whom served on private boards (M & M Insurance and Royal Bank).
Table 5.7a: Directors’ sex
Directors’ Sex
Frequency Percent Valid Percent Cumulative Percent
Female 81 16.3 16.3 16.3
Male 416 83.7 83.7 100.0
Total 497 100.0 100.0
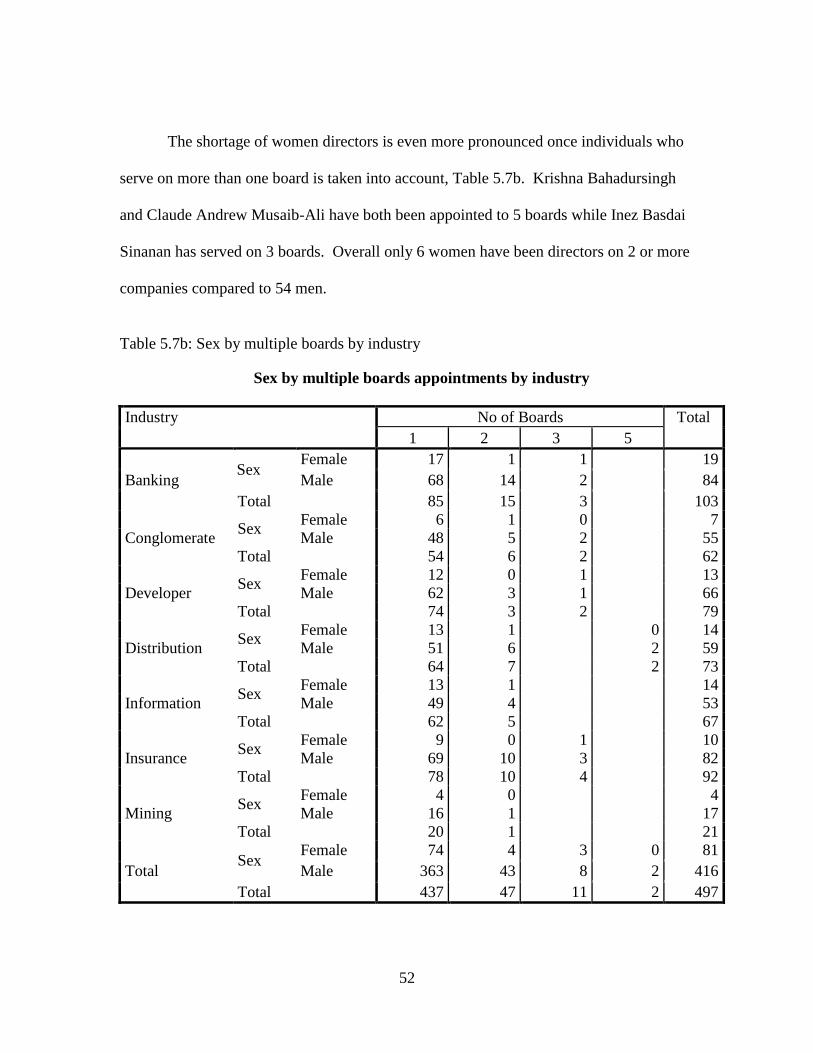
52
The shortage of women directors is even more pronounced once individuals who
serve on more than one board is taken into account, Table 5.7b. Krishna Bahadursingh
and Claude Andrew Musaib-Ali have both been appointed to 5 boards while Inez Basdai
Sinanan has served on 3 boards. Overall only 6 women have been directors on 2 or more
companies compared to 54 men.
Table 5.7b: Sex by multiple boards by industry
Sex by multiple boards appointments by industry
Industry No of Boards Total
1 2 3 5
Banking Sex
Female 17 1 1 19
Male 68 14 2 84
Total 85 15 3 103
Conglomerate Sex
Female 6 1 0 7
Male 48 5 2 55
Total 54 6 2 62
Developer Sex
Female 12 0 1 13
Male 62 3 1 66
Total 74 3 2 79
Distribution Sex
Female 13 1 0 14
Male 51 6 2 59
Total 64 7 2 73
Information Sex
Female 13 1 14
Male 49 4 53
Total 62 5 67
Insurance Sex
Female 9 0 1 10
Male 69 10 3 82
Total 78 10 4 92
Mining Sex
Female 4 0 4
Male 16 1 17
Total 20 1 21
Total Sex
Female 74 4 3 0 81
Male 363 43 8 2 416
Total 437 47 11 2 497
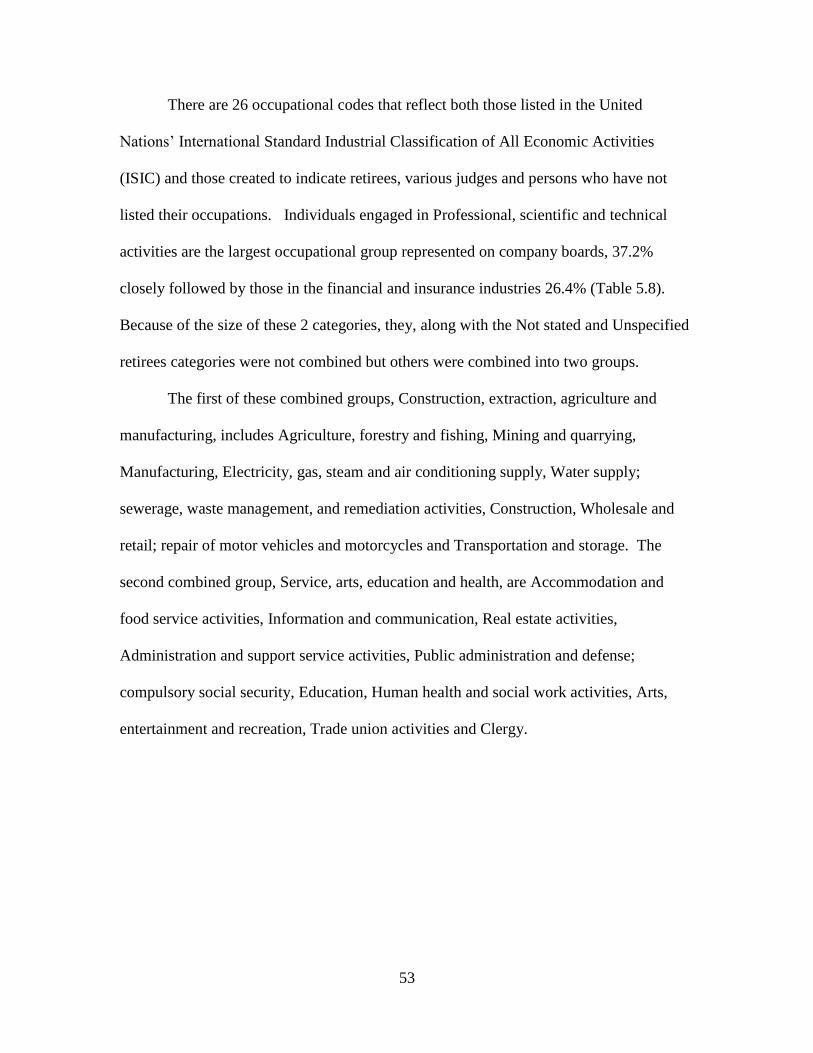
53
There are 26 occupational codes that reflect both those listed in the United
Nations’ International Standard Industrial Classification of All Economic Activities
(ISIC) and those created to indicate retirees, various judges and persons who have not
listed their occupations. Individuals engaged in Professional, scientific and technical
activities are the largest occupational group represented on company boards, 37.2%
closely followed by those in the financial and insurance industries 26.4% (Table 5.8).
Because of the size of these 2 categories, they, along with the Not stated and Unspecified
retirees categories were not combined but others were combined into two groups.
The first of these combined groups, Construction, extraction, agriculture and
manufacturing, includes Agriculture, forestry and fishing, Mining and quarrying,
Manufacturing, Electricity, gas, steam and air conditioning supply, Water supply;
sewerage, waste management, and remediation activities, Construction, Wholesale and
retail; repair of motor vehicles and motorcycles and Transportation and storage. The
second combined group, Service, arts, education and health, are Accommodation and
food service activities, Information and communication, Real estate activities,
Administration and support service activities, Public administration and defense;
compulsory social security, Education, Human health and social work activities, Arts,
entertainment and recreation, Trade union activities and Clergy.
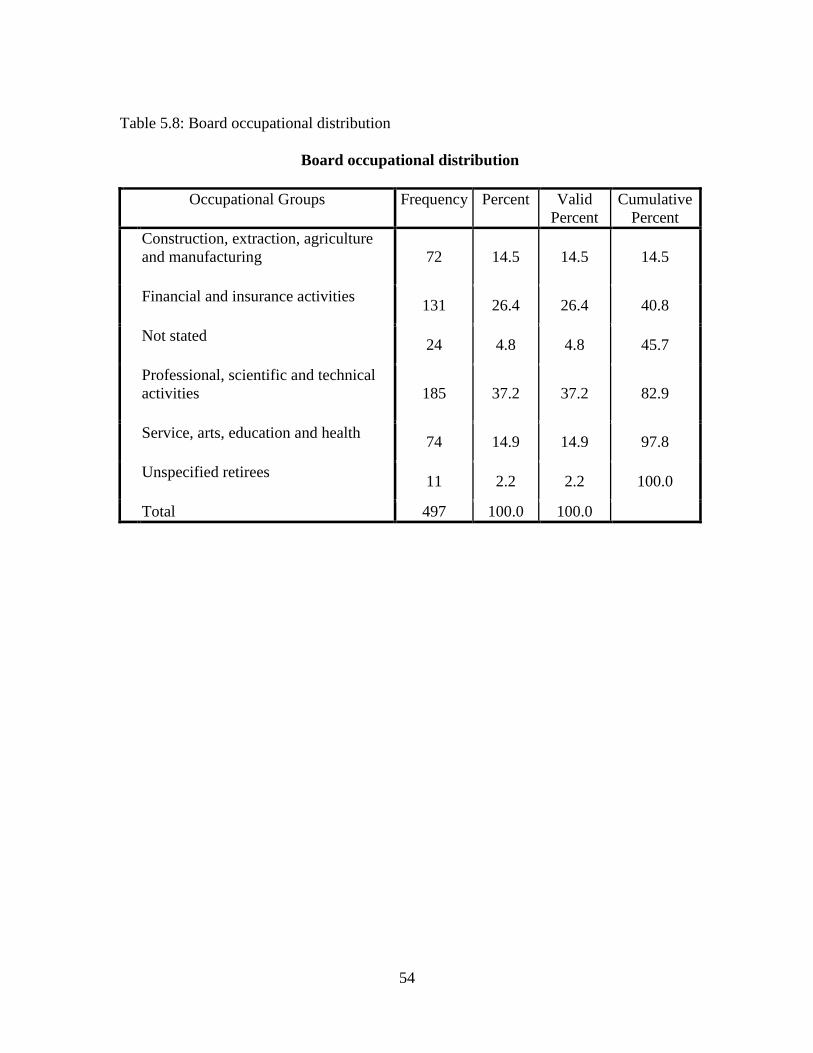
54
Table 5.8: Board occupational distribution
Board occupational distribution
Occupational Groups Frequency Percent Valid
Percent
Cumulative
Percent
Construction, extraction, agriculture
and manufacturing
72 14.5 14.5 14.5
Financial and insurance activities
131 26.4 26.4 40.8
Not stated
24 4.8 4.8 45.7
Professional, scientific and technical
activities
185 37.2 37.2 82.9
Service, arts, education and health
74 14.9 14.9 97.8
Unspecified retirees
11 2.2 2.2 100.0
Total 497 100.0 100.0
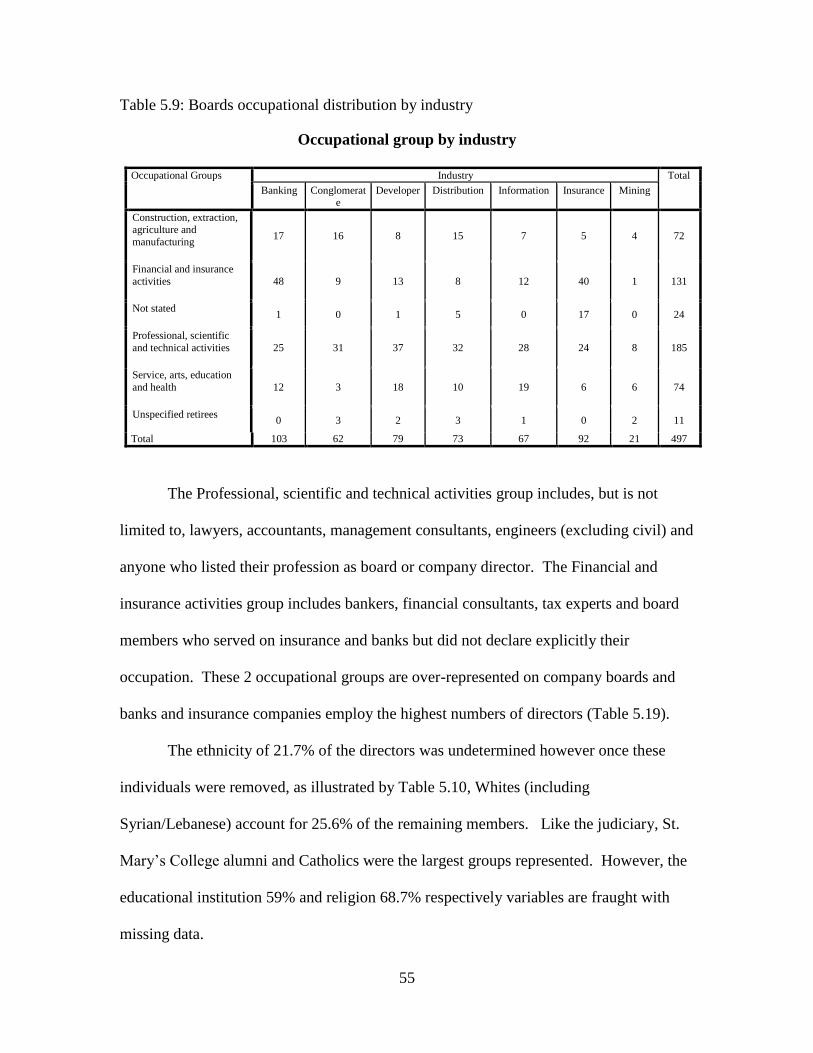
55
Table 5.9: Boards occupational distribution by industry
Occupational group by industry
Occupational Groups Industry Total
Banking Conglomerate
Developer Distribution Information Insurance Mining
Construction, extraction, agriculture and
manufacturing
17 16 8 15 7 5 4 72
Financial and insurance
activities
48 9 13 8 12 40 1 131
Not stated
1 0 1 5 0 17 0 24
Professional, scientific
and technical activities
25 31 37 32 28 24 8 185
Service, arts, education
and health
12 3 18 10 19 6 6 74
Unspecified retirees
0 3 2 3 1 0 2 11
Total 103 62 79 73 67 92 21 497
The Professional, scientific and technical activities group includes, but is not
limited to, lawyers, accountants, management consultants, engineers (excluding civil) and
anyone who listed their profession as board or company director. The Financial and
insurance activities group includes bankers, financial consultants, tax experts and board
members who served on insurance and banks but did not declare explicitly their
occupation. These 2 occupational groups are over-represented on company boards and
banks and insurance companies employ the highest numbers of directors (Table 5.19).
The ethnicity of 21.7% of the directors was undetermined however once these
individuals were removed, as illustrated by Table 5.10, Whites (including
Syrian/Lebanese) account for 25.6% of the remaining members. Like the judiciary, St.
Mary’s College alumni and Catholics were the largest groups represented. However, the
educational institution 59% and religion 68.7% respectively variables are fraught with
missing data.
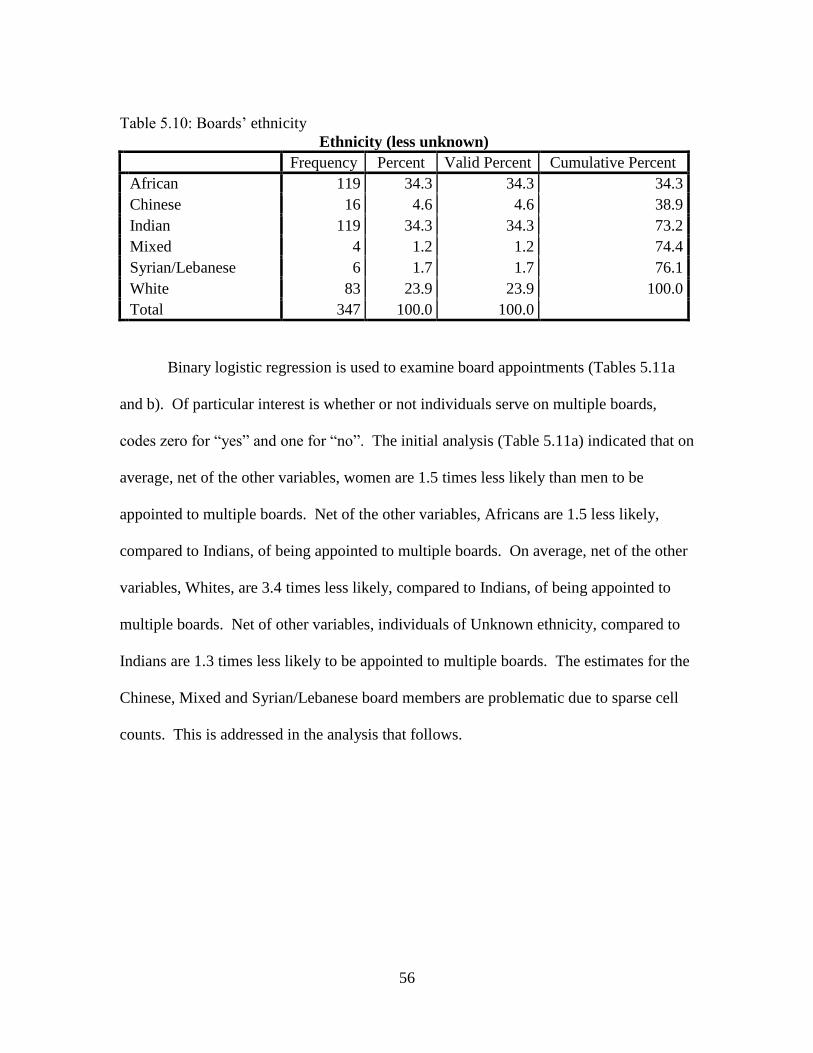
56
Table 5.10: Boards’ ethnicity
Ethnicity (less unknown)
Frequency Percent Valid Percent Cumulative Percent
African 119 34.3 34.3 34.3
Chinese 16 4.6 4.6 38.9
Indian 119 34.3 34.3 73.2
Mixed 4 1.2 1.2 74.4
Syrian/Lebanese 6 1.7 1.7 76.1
White 83 23.9 23.9 100.0
Total 347 100.0 100.0
Binary logistic regression is used to examine board appointments (Tables 5.11a
and b). Of particular interest is whether or not individuals serve on multiple boards,
codes zero for “yes” and one for “no”. The initial analysis (Table 5.11a) indicated that on
average, net of the other variables, women are 1.5 times less likely than men to be
appointed to multiple boards. Net of the other variables, Africans are 1.5 less likely,
compared to Indians, of being appointed to multiple boards. On average, net of the other
variables, Whites, are 3.4 times less likely, compared to Indians, of being appointed to
multiple boards. Net of other variables, individuals of Unknown ethnicity, compared to
Indians are 1.3 times less likely to be appointed to multiple boards. The estimates for the
Chinese, Mixed and Syrian/Lebanese board members are problematic due to sparse cell
counts. This is addressed in the analysis that follows.
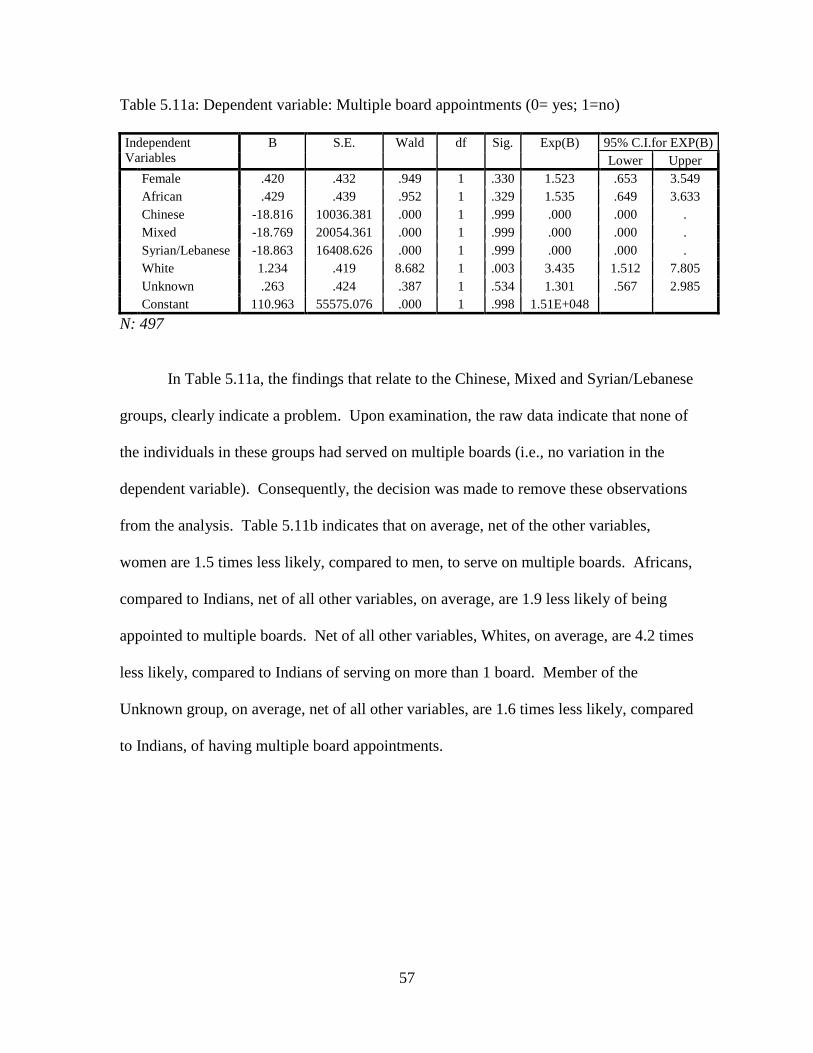
57
Table 5.11a: Dependent variable: Multiple board appointments (0= yes; 1=no)
Independent
Variables
B S.E. Wald df Sig. Exp(B) 95% C.I.for EXP(B)
Lower Upper
Female .420 .432 .949 1 .330 1.523 .653 3.549
African .429 .439 .952 1 .329 1.535 .649 3.633
Chinese -18.816 10036.381 .000 1 .999 .000 .000 .
Mixed -18.769 20054.361 .000 1 .999 .000 .000 .
Syrian/Lebanese -18.863 16408.626 .000 1 .999 .000 .000 .
White 1.234 .419 8.682 1 .003 3.435 1.512 7.805
Unknown .263 .424 .387 1 .534 1.301 .567 2.985
Constant 110.963 55575.076 .000 1 .998 1.51E+048
N: 497
In Table 5.11a, the findings that relate to the Chinese, Mixed and Syrian/Lebanese
groups, clearly indicate a problem. Upon examination, the raw data indicate that none of
the individuals in these groups had served on multiple boards (i.e., no variation in the
dependent variable). Consequently, the decision was made to remove these observations
from the analysis. Table 5.11b indicates that on average, net of the other variables,
women are 1.5 times less likely, compared to men, to serve on multiple boards. Africans,
compared to Indians, net of all other variables, on average, are 1.9 less likely of being
appointed to multiple boards. Net of all other variables, Whites, on average, are 4.2 times
less likely, compared to Indians of serving on more than 1 board. Member of the
Unknown group, on average, net of all other variables, are 1.6 times less likely, compared
to Indians, of having multiple board appointments.
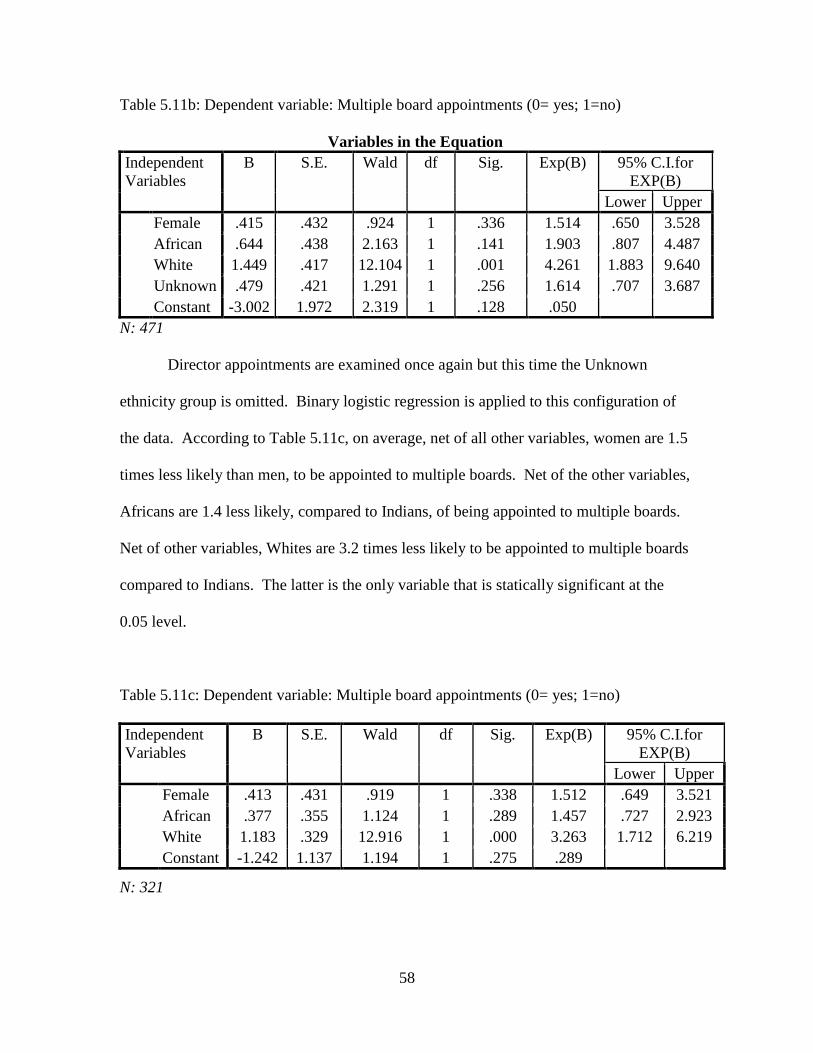
58
Table 5.11b: Dependent variable: Multiple board appointments (0= yes; 1=no)
Variables in the Equation
Independent
Variables
B S.E. Wald df Sig. Exp(B) 95% C.I.for
EXP(B)
Lower Upper
Female .415 .432 .924 1 .336 1.514 .650 3.528
African .644 .438 2.163 1 .141 1.903 .807 4.487
White 1.449 .417 12.104 1 .001 4.261 1.883 9.640
Unknown .479 .421 1.291 1 .256 1.614 .707 3.687
Constant -3.002 1.972 2.319 1 .128 .050
N: 471
Director appointments are examined once again but this time the Unknown
ethnicity group is omitted. Binary logistic regression is applied to this configuration of
the data. According to Table 5.11c, on average, net of all other variables, women are 1.5
times less likely than men, to be appointed to multiple boards. Net of the other variables,
Africans are 1.4 less likely, compared to Indians, of being appointed to multiple boards.
Net of other variables, Whites are 3.2 times less likely to be appointed to multiple boards
compared to Indians. The latter is the only variable that is statically significant at the
0.05 level.
Table 5.11c: Dependent variable: Multiple board appointments (0= yes; 1=no)
Independent
Variables
B S.E. Wald df Sig. Exp(B) 95% C.I.for
EXP(B)
Lower Upper
Female .413 .431 .919 1 .338 1.512 .649 3.521
African .377 .355 1.124 1 .289 1.457 .727 2.923
White 1.183 .329 12.916 1 .000 3.263 1.712 6.219
Constant -1.242 1.137 1.194 1 .275 .289
N: 321
59
These findings indicate that as hypothesized, there is an increase in the number of
appointments of Non-whites to boards since independence and Indians are more likely to
be appointed to multiple boards compared to Africans. Whites, as a percentage of all
appointments, are the dominant group at 16.7% although they are little more than 0.5% of
the general population. Women continue to be underrepresented in terms of multiple
appointments and even though the numbers of individual women grew from 11 in 2000 to
as high as 22 in 2011, this growth was not consistent. There were some years that saw no
new women appointed to any of the boards examined, 2008, and in 2012, only one new
woman was became a director. Given the problems caused by missing data, there was
too little information to reliably analyze the effect of religion on board appointments.
6.3 SENATORS
The first Independent Parliament included 5 women senators, 2 for the government, 2 for
the opposition and 1 independent. This represented 21.7% of the first independent
parliament’s 23 person senate and as Table 5.12a indicates, cumulatively, from 1962 to
2010, 24.6% of the senate has been composed of women. There have been 6 Presidents of
the Senate and Linda Baboolal was the only woman ever appointed to this post from
2002 to 2007. This is an important national office since according to the national
constitution the President of the Senate acts for national president in his/her absence.
There have been 62 men who served multiple terms as Senators compared to 20 women
(Table 5.12b).
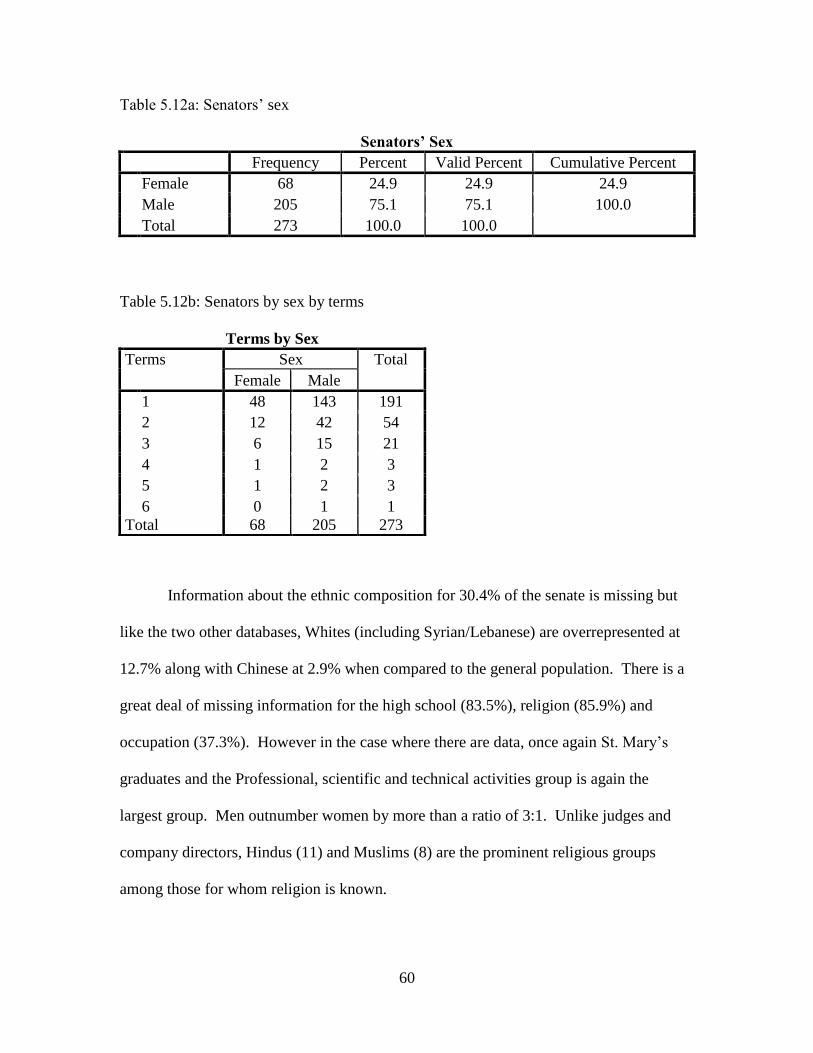
60
Table 5.12a: Senators’ sex
Senators’ Sex
Frequency Percent Valid Percent Cumulative Percent
Female 68 24.9 24.9 24.9
Male 205 75.1 75.1 100.0
Total 273 100.0 100.0
Table 5.12b: Senators by sex by terms
Information about the ethnic composition for 30.4% of the senate is missing but
like the two other databases, Whites (including Syrian/Lebanese) are overrepresented at
12.7% along with Chinese at 2.9% when compared to the general population. There is a
great deal of missing information for the high school (83.5%), religion (85.9%) and
occupation (37.3%). However in the case where there are data, once again St. Mary’s
graduates and the Professional, scientific and technical activities group is again the
largest group. Men outnumber women by more than a ratio of 3:1. Unlike judges and
company directors, Hindus (11) and Muslims (8) are the prominent religious groups
among those for whom religion is known.
Terms by Sex
Terms Sex Total
Female Male
1 48 143 191
2 12 42 54
3 6 15 21
4 1 2 3
5 1 2 3
6 0 1 1
Total 68 205 273
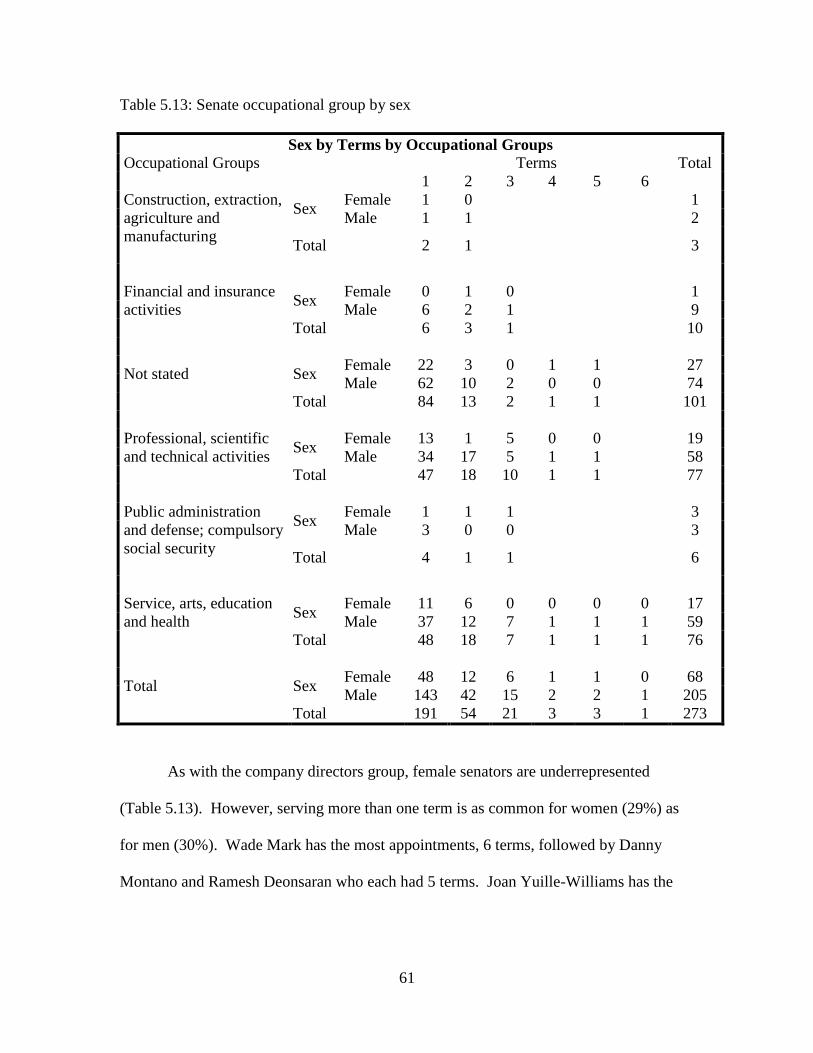
61
Table 5.13: Senate occupational group by sex
Sex by Terms by Occupational Groups Occupational Groups Terms Total
1 2 3 4 5 6
Construction, extraction,
agriculture and
manufacturing
Sex Female 1 0 1
Male 1 1 2
Total 2 1
3
Financial and insurance
activities
Sex Female 0 1 0 1
Male 6 2 1 9
Total 6 3 1 10
Not stated
Sex Female 22 3 0 1 1 27
Male 62 10 2 0 0 74
Total 84 13 2 1 1 101
Professional, scientific
and technical activities
Sex Female 13 1 5 0 0 19
Male 34 17 5 1 1 58
Total 47 18 10 1 1 77
Public administration
and defense; compulsory
social security
Sex Female 1 1 1 3
Male 3 0 0 3
Total 4 1 1
6
Service, arts, education
and health
Sex Female 11 6 0 0 0 0 17
Male 37 12 7 1 1 1 59
Total 48 18 7 1 1 1 76
Total
Sex Female 48 12 6 1 1 0 68
Male 143 42 15 2 2 1 205
Total 191 54 21 3 3 1 273
As with the company directors group, female senators are underrepresented
(Table 5.13). However, serving more than one term is as common for women (29%) as
for men (30%). Wade Mark has the most appointments, 6 terms, followed by Danny
Montano and Ramesh Deonsaran who each had 5 terms. Joan Yuille-Williams has the
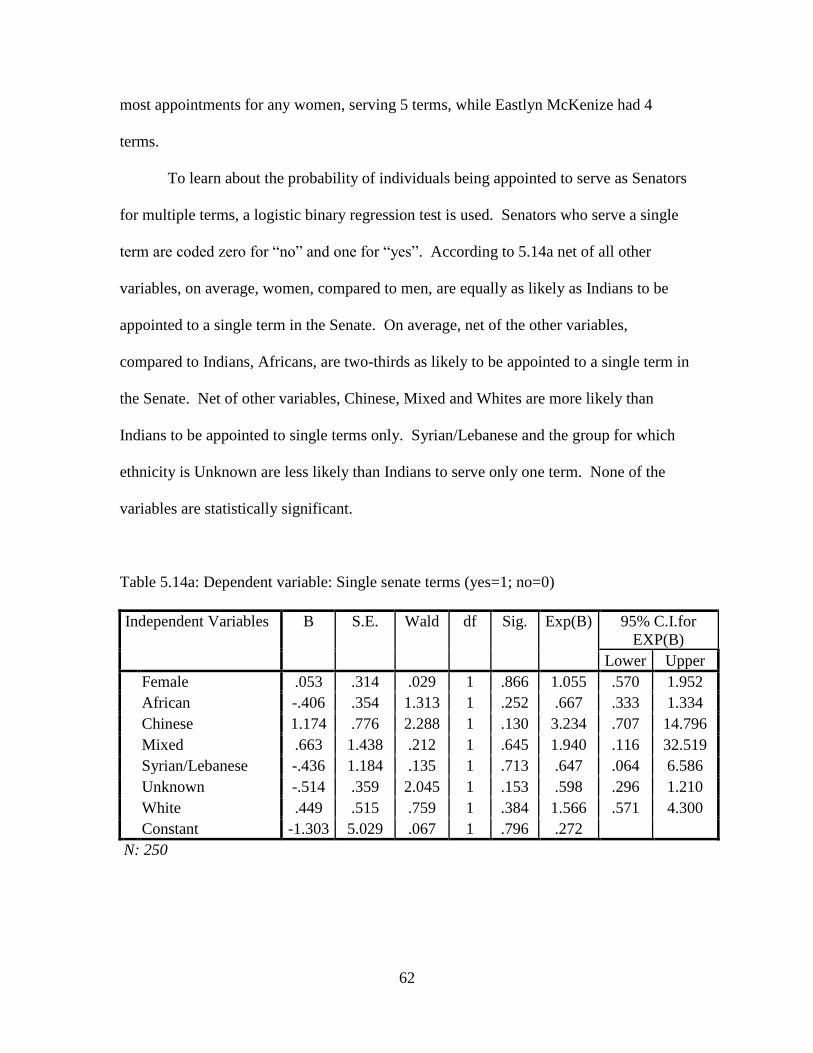
62
most appointments for any women, serving 5 terms, while Eastlyn McKenize had 4
terms.
To learn about the probability of individuals being appointed to serve as Senators
for multiple terms, a logistic binary regression test is used. Senators who serve a single
term are coded zero for “no” and one for “yes”. According to 5.14a net of all other
variables, on average, women, compared to men, are equally as likely as Indians to be
appointed to a single term in the Senate. On average, net of the other variables,
compared to Indians, Africans, are two-thirds as likely to be appointed to a single term in
the Senate. Net of other variables, Chinese, Mixed and Whites are more likely than
Indians to be appointed to single terms only. Syrian/Lebanese and the group for which
ethnicity is Unknown are less likely than Indians to serve only one term. None of the
variables are statistically significant.
Table 5.14a: Dependent variable: Single senate terms (yes=1; no=0)
Independent Variables B S.E. Wald df Sig. Exp(B) 95% C.I.for
EXP(B)
Lower Upper
Female .053 .314 .029 1 .866 1.055 .570 1.952
African -.406 .354 1.313 1 .252 .667 .333 1.334
Chinese 1.174 .776 2.288 1 .130 3.234 .707 14.796
Mixed .663 1.438 .212 1 .645 1.940 .116 32.519
Syrian/Lebanese -.436 1.184 .135 1 .713 .647 .064 6.586
Unknown -.514 .359 2.045 1 .153 .598 .296 1.210
White .449 .515 .759 1 .384 1.566 .571 4.300
Constant -1.303 5.029 .067 1 .796 .272
N: 250
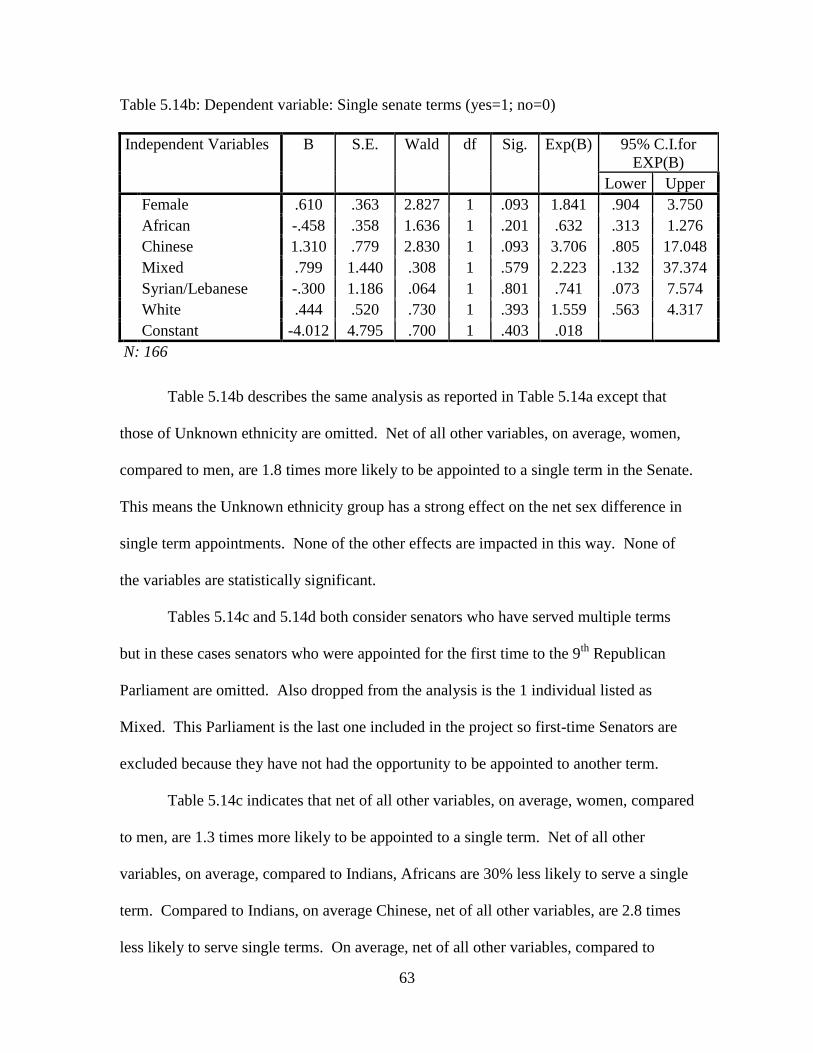
63
Table 5.14b: Dependent variable: Single senate terms (yes=1; no=0)
Independent Variables B S.E. Wald df Sig. Exp(B) 95% C.I.for
EXP(B)
Lower Upper
Female .610 .363 2.827 1 .093 1.841 .904 3.750
African -.458 .358 1.636 1 .201 .632 .313 1.276
Chinese 1.310 .779 2.830 1 .093 3.706 .805 17.048
Mixed .799 1.440 .308 1 .579 2.223 .132 37.374
Syrian/Lebanese -.300 1.186 .064 1 .801 .741 .073 7.574
White .444 .520 .730 1 .393 1.559 .563 4.317
Constant -4.012 4.795 .700 1 .403 .018
N: 166
Table 5.14b describes the same analysis as reported in Table 5.14a except that
those of Unknown ethnicity are omitted. Net of all other variables, on average, women,
compared to men, are 1.8 times more likely to be appointed to a single term in the Senate.
This means the Unknown ethnicity group has a strong effect on the net sex difference in
single term appointments. None of the other effects are impacted in this way. None of
the variables are statistically significant.
Tables 5.14c and 5.14d both consider senators who have served multiple terms
but in these cases senators who were appointed for the first time to the 9th
Republican
Parliament are omitted. Also dropped from the analysis is the 1 individual listed as
Mixed. This Parliament is the last one included in the project so first-time Senators are
excluded because they have not had the opportunity to be appointed to another term.
Table 5.14c indicates that net of all other variables, on average, women, compared
to men, are 1.3 times more likely to be appointed to a single term. Net of all other
variables, on average, compared to Indians, Africans are 30% less likely to serve a single
term. Compared to Indians, on average Chinese, net of all other variables, are 2.8 times
less likely to serve single terms. On average, net of all other variables, compared to
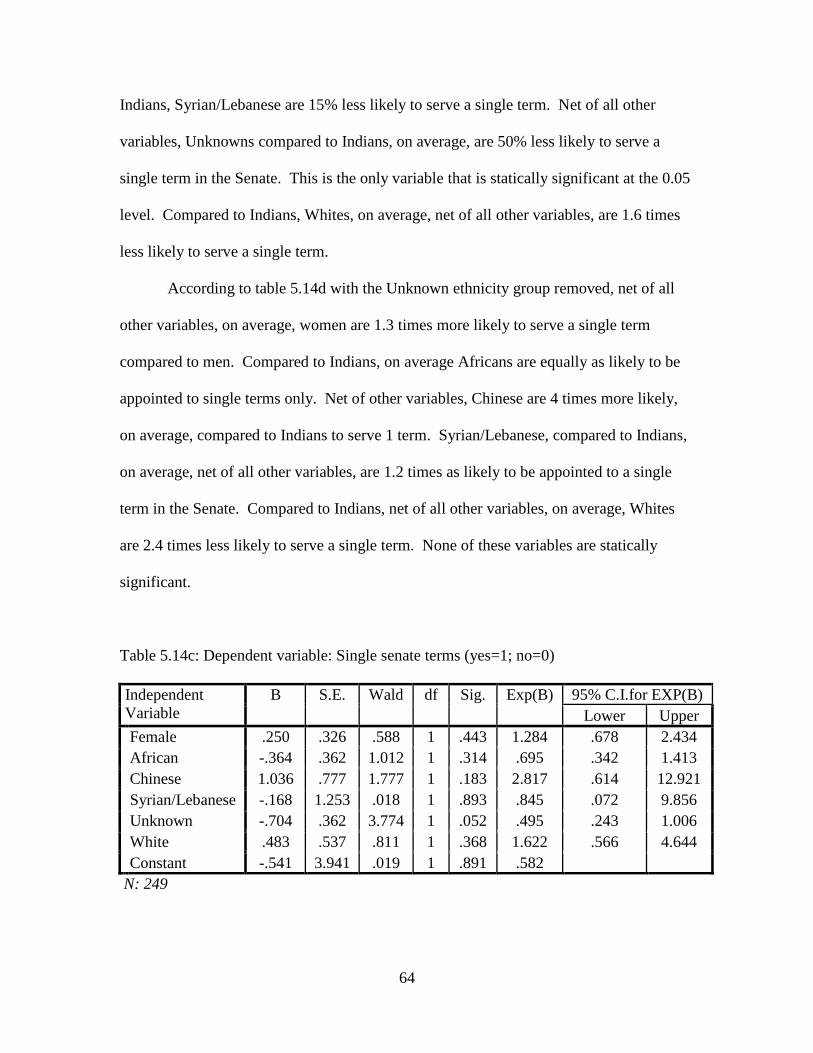
64
Indians, Syrian/Lebanese are 15% less likely to serve a single term. Net of all other
variables, Unknowns compared to Indians, on average, are 50% less likely to serve a
single term in the Senate. This is the only variable that is statically significant at the 0.05
level. Compared to Indians, Whites, on average, net of all other variables, are 1.6 times
less likely to serve a single term.
According to table 5.14d with the Unknown ethnicity group removed, net of all
other variables, on average, women are 1.3 times more likely to serve a single term
compared to men. Compared to Indians, on average Africans are equally as likely to be
appointed to single terms only. Net of other variables, Chinese are 4 times more likely,
on average, compared to Indians to serve 1 term. Syrian/Lebanese, compared to Indians,
on average, net of all other variables, are 1.2 times as likely to be appointed to a single
term in the Senate. Compared to Indians, net of all other variables, on average, Whites
are 2.4 times less likely to serve a single term. None of these variables are statically
significant.
Table 5.14c: Dependent variable: Single senate terms (yes=1; no=0)
Independent
Variable
B S.E. Wald df Sig. Exp(B) 95% C.I.for EXP(B)
Lower Upper
Female .250 .326 .588 1 .443 1.284 .678 2.434
African -.364 .362 1.012 1 .314 .695 .342 1.413
Chinese 1.036 .777 1.777 1 .183 2.817 .614 12.921
Syrian/Lebanese -.168 1.253 .018 1 .893 .845 .072 9.856
Unknown -.704 .362 3.774 1 .052 .495 .243 1.006
White .483 .537 .811 1 .368 1.622 .566 4.644
Constant -.541 3.941 .019 1 .891 .582
N: 249
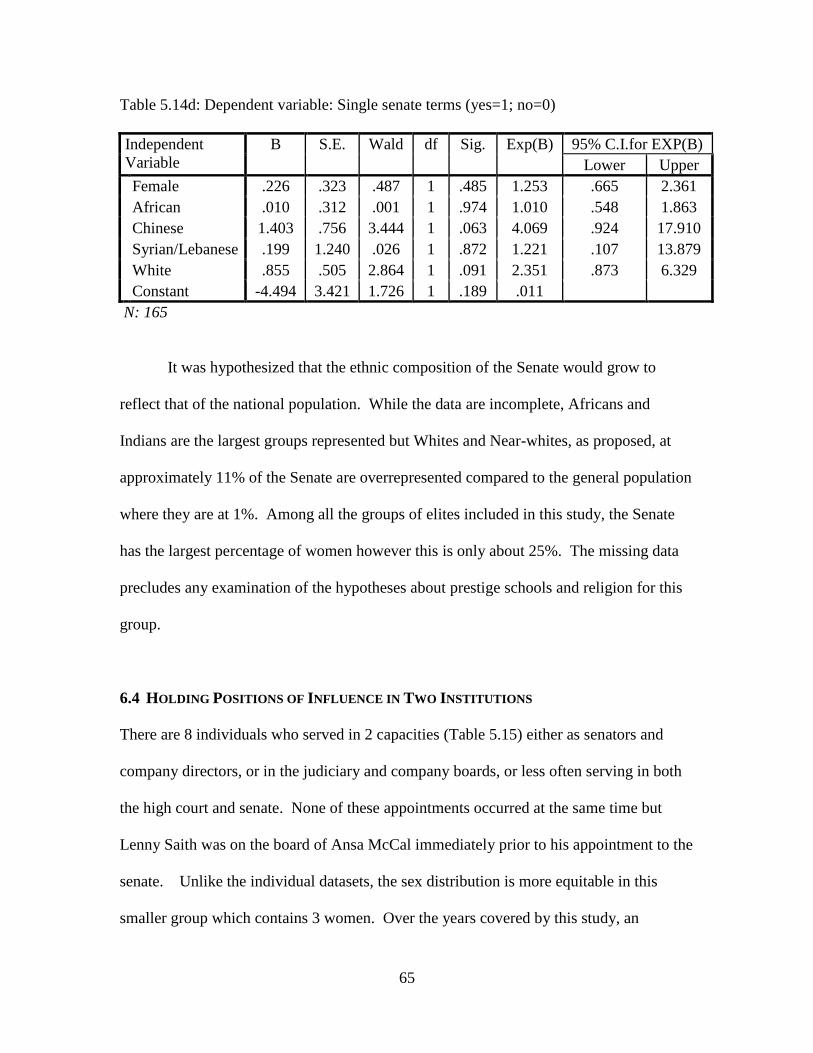
65
Table 5.14d: Dependent variable: Single senate terms (yes=1; no=0)
Independent
Variable
B S.E. Wald df Sig. Exp(B) 95% C.I.for EXP(B)
Lower Upper
Female .226 .323 .487 1 .485 1.253 .665 2.361
African .010 .312 .001 1 .974 1.010 .548 1.863
Chinese 1.403 .756 3.444 1 .063 4.069 .924 17.910
Syrian/Lebanese .199 1.240 .026 1 .872 1.221 .107 13.879
White .855 .505 2.864 1 .091 2.351 .873 6.329
Constant -4.494 3.421 1.726 1 .189 .011
N: 165
It was hypothesized that the ethnic composition of the Senate would grow to
reflect that of the national population. While the data are incomplete, Africans and
Indians are the largest groups represented but Whites and Near-whites, as proposed, at
approximately 11% of the Senate are overrepresented compared to the general population
where they are at 1%. Among all the groups of elites included in this study, the Senate
has the largest percentage of women however this is only about 25%. The missing data
precludes any examination of the hypotheses about prestige schools and religion for this
group.
6.4 HOLDING POSITIONS OF INFLUENCE IN TWO INSTITUTIONS
There are 8 individuals who served in 2 capacities (Table 5.15) either as senators and
company directors, or in the judiciary and company boards, or less often serving in both
the high court and senate. None of these appointments occurred at the same time but
Lenny Saith was on the board of Ansa McCal immediately prior to his appointment to the
senate. Unlike the individual datasets, the sex distribution is more equitable in this
smaller group which contains 3 women. Over the years covered by this study, an
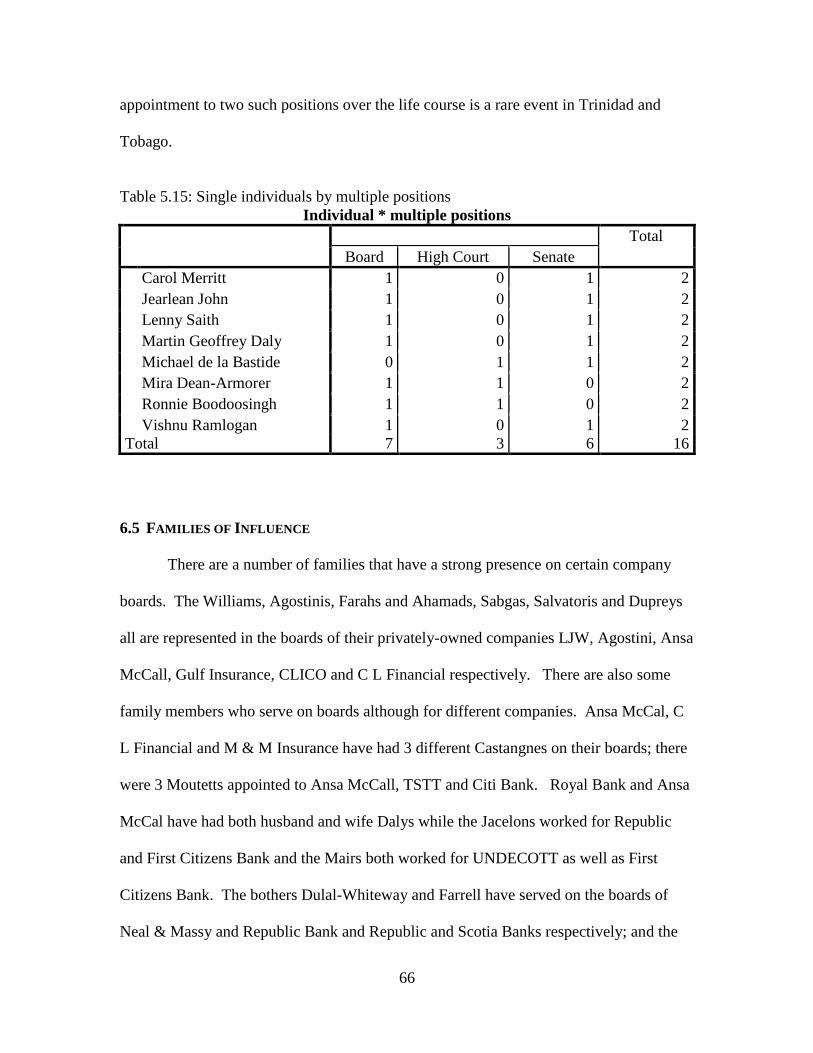
66
appointment to two such positions over the life course is a rare event in Trinidad and
Tobago.
Table 5.15: Single individuals by multiple positions
Individual * multiple positions
Total
Board High Court Senate
Carol Merritt 1 0 1 2
Jearlean John 1 0 1 2
Lenny Saith 1 0 1 2
Martin Geoffrey Daly 1 0 1 2
Michael de la Bastide 0 1 1 2
Mira Dean-Armorer 1 1 0 2
Ronnie Boodoosingh 1 1 0 2
Vishnu Ramlogan 1 0 1 2
Total 7 3 6 16
6.5 FAMILIES OF INFLUENCE
There are a number of families that have a strong presence on certain company
boards. The Williams, Agostinis, Farahs and Ahamads, Sabgas, Salvatoris and Dupreys
all are represented in the boards of their privately-owned companies LJW, Agostini, Ansa
McCall, Gulf Insurance, CLICO and C L Financial respectively. There are also some
family members who serve on boards although for different companies. Ansa McCal, C
L Financial and M & M Insurance have had 3 different Castangnes on their boards; there
were 3 Moutetts appointed to Ansa McCall, TSTT and Citi Bank. Royal Bank and Ansa
McCal have had both husband and wife Dalys while the Jacelons worked for Republic
and First Citizens Bank and the Mairs both worked for UNDECOTT as well as First
Citizens Bank. The bothers Dulal-Whiteway and Farrell have served on the boards of
Neal & Massy and Republic Bank and Republic and Scotia Banks respectively; and the
67
Poon Tips on Gulf Insurance and National Flour Mills. The Montano and Williams
brothers are the 2 sibling pairs who have served on opposite sides of the aisle in the
senate.
There are also some instances where 2 generations have had positions on across
the various groups. Bovell senior served in the senate, while Bovell junior served on
First Citizens Bank. Noor and Khalid Hassanali another father and son, worked as a
judge (and eventually national President) and director of PLIPDECO. The Luckys have
had a judge, Anthony (father), senator Gillian (daughter) and director Antonia (daughter).
Karl de la Bastide was a judge while his son Michael was both a judge and a senator.
Victor Mouttet worked both as a senator as well as a director for CITI bank. There have
been 2 pairs of brothers who have been both senators and judges, the Goopeesinghs and
the Stollmeyers. Another sibling pair is the Kangaloos, Christine, a senator and Wendell,
a judge.
68
CHAPTER VII
CONCLUSION
The existence of elites within modern societies is a given (Mills, 1945 & 1956; and
Pareto 2000). Like other former colonies, Trinidad and Tobago is shaped politically by
colonial experiences involving both Spanish and British masters, and socially by the
encounters the various immigrant groups had with aboriginal natives and each other on
the islands. Beckford’s Plantation Society theory describes conditions which contribute
to the social structure of post-colonial societies particularly those in the Caribbean. He
argues that the Caribbean served as external plantation sites for their European rulers the
result, according to him, are societies with caste systems based on race. The ethnic
composition of Trinidad and Tobago would suggest that over time Non-whites emerge as
the elite. Ryan (1972) writes however that Whites have “retained a great deal of the
influence which they had in the colonial period. This influence is not as unquestioned as
it once was, nor is it exercised in the same crude forms, but it is nevertheless abiding” (p.
364).
Ryan’s observation, although over forty years old, still warrants consideration.
European colonial societies were designed to give advantages to, and re-enforce the
continuation of, a small but powerful group of mostly White men. In a study of the
corporate class of neighboring Barbados, Karch (1981) argues that Whites have
maintained their position of privilege post-independence. According to her, there has
been “a modification of classes – the composition of the ruling class, complexity of
69
occupational strata – but not major structural change in the class/race stratification which
has characterized island society since the 17th
century” (p. 237).
This study hypothesized that the elite of Trinidad and Tobago has transformed but
not so radically as to fundamentally change the positions of certain ethnic groups or the
importance of certain social markers like gender, professed religious affiliation and high
school attended. The three datasets examined in this project: High Court judges, National
Senators and directors of selected companies were incomplete. However, using the
information I was able to collect, I have concluded that Trinidad and Tobago remains a
highly stratified society. The hierarchy that exists is similar to the colonial system in
many ways especially with regards to the benefits given to men, Christians and graduates
from prestige high schools. Religion and high school, because of the history of the
educational system were, and have continued to be, closely intertwined.
The position of ethnic groups in some ways still mirror the colonial arrangement
but there have also been many changes. Even with incomplete data because of the
problems identifying each individual’s ethnic or racial group, Whites and Near-whites are
over-represented in all the datasets when compared to the groups’ actual size as a
proportion of the general population. At the same time, large numbers of Non-whites
(Afro- and Indo-Trinbagoians) have ascended to key posts in business, the judiciary and
National Senate. These promotions are a consequence of improved educational access
because of the building of more secondary schools, the increased number of available
positions as a result of an expanding economy and a political response to growth in the
Afro- and Indo- middle and upper classes. It can be argued that the single most important
event that led to this change was the Black Power Revolt of the 1970s. Politicians and
70
businesspersons recognized that de facto employment discrimination that excluded
people based on skin color especially in certain industries would no longer be tolerated
by the national population.
7.1 RAGAMUFFIN MONARCHY OR PARASITIC OLIGARCHY?
Discussions about the existence of an elite class in Trinidad and Tobago are ongoing in
the public sphere often debated on the radio, letters to the editor and referenced in
calypsos. As an art form, calypso draws on heavily on the African griot tradition and has
maintained its importance as an archive of social and political history. In the cultural
landscape, these singers are characterized as the “voice of the people” and politicians are
especially sensitive to the songs’ lyrical content. The focus of these discussions usually
center on the privilege and status enjoyed by certain members of the community.
Incidents where some individuals receive benefits because of who they are or who they
are related to are infamous. In 1964, Dr. Patrick Solomon, the then Minister of Home
Affairs, removed his stepson from police custody and proclaimed that the charges of
using obscene language and throwing missiles were cancelled. More recently in 2010,
Jack Warner resigned as vice-president of the International Federation of Football
Association (FIFA) after allegations of bribery surfaced. Mr. Warner at the time of his
resignation was serving as the Minister of Works and Infrastructure subsequently was
reassigned to serve as the Minister of National Security and has acted as Prime Minster.
These are two very public examples of civic leaders who appear to be above the law and
who act with impunity.
71
7.2 WOMAN IS BOSS?
The data indicate that in Trinidad and Tobago the elite fit a certain profile. They
on average tend to be male and graduates from prestigious high schools. The absence of
women in public life is in itself a contraction. Women in the society have worked
alongside men as providers for their families and community and political organizers and
leaders. Slavery and indentureship forced working class women to toil with their men
folk and in some cases elite women ran highly efficient plantations. As the nation moved
towards self-governance women helped organize political parties especially notorious
was the “fat ass brigade” of the PNM. This term was used to describe, not always as a
complement, committed female supporters of Williams13
and his party and who were
relied upon as an ever present audience at his public meetings and party conventions.
Additionally organizations of women, for example various orders of Catholic nuns and
individuals, like Audrey Jeffers14
, served the community in a variety of ways.
These women through their female led organizations made primary school
education available to the masses and provided care for the marginal in society.
Although these tasks support the stereotype of women in helping professions, they
provided examples of female leadership capabilities and opportunities for female
management to emerge. As a consequence there is a ready pool of competent, well-
educated women with proven records in leadership roles. At the same time however
cultural, social and religious norms work to re-enforce restrictions on the role of women
13
Eric Williams, historian and the first Chief Minister and later Prime Minister of
Trinidad and Tobago and founding member of the Peoples National Movement.
14
The first elected female member of the Port of Spain City Council and appointed
member Legislative Council. She was a social worker by profession and established the
Coterie of Social Workers which served the poor.
72
in public life. Seepaul (1988) considers the predicament of Hindu women in particular.
She argues that traditional notions of womanhood are challenged by the educational
opportunities afforded to girls. Addressing women as elected national leaders, Barrow-
Giles (2011) writes, “the picture which emerges on the status of women in the electoral
systems in the Caribbean is one of continued exclusion and marginalization” (p. 8). The
data included in this project certainly support the motion that women in Trinidad and
Tobago in spite of their many gains, including the election of a female prime minster in
2010, continue to have limited access to institutions of power, influence and status. Of
the three groups examined, senators have the highest level of female participation, at
25%. More notably, the nature and type of appointments afforded to women are most
often at the lowest levels. For women serving as company directors and senators, their
appointments are usually limited to one company, typically at one with State interests and
for senators to one term. Female judges are most frequently appointed to the High Court,
the lowest level in the judiciary.
7.3 EDUCATION IS ESSENTIAL
The importance of graduating from a prestige high school should not be over looked. By
and large, prestige schools are those older secondary schools, typically founded before
1960. They tend to be single gender and usually affiliated to a religious organization, the
most notable exception is Queen’s Royal College (QRC) which was established by
colonial authorities as an expressly secular school. This project hypothesized that these
types of high schools give their alumni certain social and cultural capital not available to
students at other secondary schools.
73
These schools initially served the children of the planter, colonial and merchant
classes and were private. Working class and poor children had no access until the 1870s
when a national examination, taken at the end of primary school, allowed the brightest,
mostly male, students to obtain scholarships to attend these schools. Campbell (1997)
points out that primary schools were “meant to effect conversion to Christianity, to
improve Christian moral standards, and to cement denominational loyalties as well as to
provide literacy. The intention was not to promote upward social mobility since the
colony needed a plantation labour force” (p. 2). Williams (1942) recounts this
philosophy in the testimony given by to planters in 1926 before a select committee of the
Legislative Committee. Two planters, Robinson and Knox, argue that education is of no
value to most children in what they refer to as an “agricultural country.” According to
their rationale, only the brightest students should be educated, all others some reading
and writing but not more the 3 hours per day and not beyond 10 years of age.
The opportunity for a secondary school education was coveted because it “opened
up various possibilities for white-collar jobs: teaching, the civil service, journalism,
minor positions in business, a practice as a solicitor” (Brereton, 1981) to the very
brightest working class and poor students. Free access to secondary schools expanded
because in the 1960s the national government entered into an agreement with religious
bodies known as the Concordat and built a number of new, secular, schools. Although
the number of high school places has increased, partly as a consequence of the primary
school exit examination, prestige schools have retained their social and academic
superiority. These schools are able to compete for the country’s smartest students in any
given year. Parents rank their school preferences and because students are placed based
74
on examination scores and not their neighborhood, the best students attend the best
schools. Another factor that influences the incoming class is the right of the principal to
select up to 20% of the first year class of students. These schools therefore, are able to
retain their high status because they receive the best group of students each year. As long
as they achieve good results in the secondary school exit exams, particularly at the pre-
university level (the seventh year), they will retain their position.
The influence of prestige schools on national life cannot be overstated. The
students at these schools are academically the best in the country. Additionally since
most of these schools have some sort of religious affiliation, there is an assumption that
they receive moral and ethical training along with rigorous scholastic training. The data
collected for this project suggest that the elite continue to be drawn from prestige schools.
Scott (1992), writing about the British public schools which the schools in Trinidad and
Tobago are modeled on, claims they are an important “mechanisms for the integration
and recruitment of both eth Establishment and the wider business class. They maintain a
high level of closure in access to positions of privilege, and they ensure the assimilation
of those newcomers who have necessarily to be granted entry” (p. 88). There were
problems collecting high school graduation data, however among judges, prestige school
graduates were over-represented as well as among persons holding positions of influence
in two institutions and families of influence. Although there was not sufficient
information about the high schools of Senators and company directors, a quick review of
the information contained in Appendices B and C suggest that graduates from prestige
schools remain dominant.
75
7.4 MIX UP
The history of the educational system has led to the development of certain trends that
may account for the absence of women and the overwhelming presence Christians,
especially Catholics and Anglicans, among the elite. Even though St. Joseph’s Convent –
Port of Spain (SJC-POS) is the oldest secondary school in the nation; Campbell points
out that historically “secondary education was most explicable as a provision for boys
who were then the only sex to have responsible public positions and professional careers”
(p.3). Educated upper and middle class women of any ethnicity were expected to become
housewives. Also, the next secondary school, St. Joseph’s Convent – St. Joseph, that
served girls was not opened until 1870, 34 years after SJC-POS. Public educational
access for women was therefore very restricted. Only families of means could afford to
pay for the education of their daughters and the returns on this investment were limited
since marriage or religious life were the only real options available to women. It was not
until the 1920s and 1930s that opportunities became available for women in public life
and even then, women were expected to enter respectable occupations; teaching and
maybe medicine (typically nursing).
The influence of religious bodies on the educational system is important to
examine. As the data indicate, Christianity is the most prevalent religion among the elite.
This reflects a confluence of many factors. Firstly, schools, particularly secondary
schools, were established by religious organizations to educate their members. Because
of the immigrant and colonial history of Trinidad in specifically, Catholics wanted
venues for teaching their congregants doctrine and re-enforce the French culture of the
French planter class; literacy and numeracy was superfluous. Education was an
76
opportunity to resist English cultural indoctrination or Anglicanization (culturally and
religiously).
Denominational schools therefore worked hard at, and often demanded that,
pupils entering their schools shared their faith. Many parents changed religions to ensure
places for their children. This meant that the various Christian dominations with the
largest number of schools were able to use them to proselytize to the population.
Children of East Indian immigrants however suffered from this arrangement. Brereton
(1981) maintains that these parents sometimes kept their children out of school because
they feared teachers would try Creolize them and to convert them to Christianity.
Canadian Presbyterian missionaries in fact came to Trinidad for that expressed purpose in
1868. The supremacy afforded Christianity by colonial officials institutionally meant that
Non-Christians were stigmatized and until Lakshmi Girls’ Hindu College (1963) and
ASJA Boys’ College – Muslim (1960) opened these students were forced to participate in
the religious practices of their schools unless they attended a government-run institution
and except for QRC, none of the secular schools were considered prestige schools.
The stratification system that developed was rigidly based on ethnicity, class,
religion and gender; Beckford (1972) argues it resembled a caste rather than class system
and the data collected for this project reflects this. The entry and closure point of this
caste system is high school. The networks and friendships that develop in high school
help determine life chances and access to the elite. Foote (1990) however asserts that in
societies where “the hierarchy of power and privilege is stratified by race, its visibility is
especially convenient for those doing the structuring. And it may seem permanent. But
stratification does not arise from or depend upon genetic differences. It is entirely
77
artificial – man-made – hence subject to being unmade” (p. 145). Certainly as the data
indicate, the elite have become more ethnically diverse. Non-whites and Non-Christians
have risen to occupy their place in business, the judiciary and National Senate. Indians
have done particularly in all the groups included in this study. This is particularly
significant given as Ryan (1996) writes, “every effort was made to keep them out of the
citadels of political power enhanced and drove their anxiety to capture it” (p. xxxii). The
relationship between Indians and the wider society is complicated. Originating with
reason for their introduction to Trinidad, benefits afforded to them at the end of
indentureship, attempts to deny them the franchise, and the racialized nature of political
parties. In general however the elite remains overwhelming male, reinforcing social and
cultural norms about the role of women in public life. Additionally the continued
presence of graduates from prestige high schools among the elite allows these schools to
maintain their claim of producing citizens of superior academic and moral character thus
supporting their institutions’ myths and preserving the discriminatory system which
produced them.
7.5 THE FUTURE IS NOW
This project examined the composition of the business, judicial and political class in
Trinidad and Tobago. There were problems confronted in collecting the data that were
unanticipated. It quickly became apparent that there are no centralized repositories for
the collection and archiving of the information that is the focus of this study. Some
information was collected from the Ministry of Legal Affairs, the libraries of the High
Court and the Parliament. None of these sources however contained data about
78
individuals’ religions, ethnicity or high schools. This information was obtained by
scouring newspapers and websites. The difficulty encountered trying to acquire the
material necessary for this project has led me to consider the following. Either there was
a deliberate decision not to include these variables, especially by State agencies, in order
to downplay the importance of these characteristics in national life. Or because the
society is small, the assumption is that everyone knows everyone, so there is no need to
collect the information at all. In the future I intend to fill in the information about the
individuals contained in these data sets but also expand the scope of the collection to
included members of the House of Representatives.
The title of this dissertation asks the question about the nature of the elite. I argue
that Beckford’s claim that the old elite are replaced overtime by newer, more ethnical
diverse elite is supported by the data included in this project. At the same time, the old
elite have not completely disappeared. Certainly they are over-represented, when
compared to their size in the general population, in all three groups but this is to be
expected given the role they played historically especially with regards to the ownership
and control of capital and ties to the colonial authorities in particular the judiciary. When
Panday in a 1994 election speech claimed there was a parasitic oligarchy that worked to
keep the PNM government in power, he was not referring to any ethnic group but rather
to those for whom, in his opinion, it was in their economic interests to maintain the status
quo. Panday would go on to become the country’s first Indian Prime Minister but in
point and fact the members of the elite have not changed. Inherent in Panday’s assertion
is the idea that the goal of elite is the purposeful exploitation of the nation’s wealth. The
fact is – elites will exist in every society. Their existence does not preclude their
79
members from being patriotic citizens. Individuals cannot be blamed because they are
privileged. They can, and should, however be held accountable if they abuse their power.
It is the instances where this accountability among the elite is absent that demonstrates its
parasitic nature.
80
REFERENCES
Adams, Inez and J. Masuoka. 1961. Emerging Elites and Culture Change. Social and
Economic Studies 10(1): 86-92.
Alba, Richard D. and Gwen Moore. 1982. Ethnicity in the American Elite. American
Sociological Review 47 (3): 373-383.
Allahar, Anton. 2004. Ethnic Entrepreneurship and Nationalism in Trinidad:
Afrocentrism and Hindutva. Social and Economic Studies 53(2): 117-
154.
Alonso, Irma T. 2002. Caribbean Economies in the Twenty-first Century. Gainesville:
University of Florida Press.
Ayearst, Morley. 1954. A Note on Some Characteristics of West Indian Political
Parties. Social and Economic Studies 3(2): 186-196.
Bachrach, Peter and Morton S. Baratz. 1962. Two Faces of Power. The American
Political Science Review 56(4): 947-952.
Beckford, George L. 1970. The Dynamics of Growth and the Nature of Metropolitan
Plantation Enterprise. Social and Economic Studies 19(4): 435-465.
____________. 1972. Persistent Poverty: Underdevelopment in Plantation Economies
of the Third World. New York: Oxford University Press.
____________. 2000. Persistent Poverty: Possibilities for Change. In The George
Beckford Papers, ed. K. Levitt, 217-231. Barbados: Canoe Press.
____________. 2000. The Future of Plantation Society in Comparative Perspective. In
The George Beckford Papers, ed. K. Levitt, 336-346. Barbados: Canoe
Press.
___________. 2000. Plantation Capitalism and Black Dispossession. In The George
Beckford Papers, ed. K. Levitt, 323-335 in Barbados: Canoe Press.
____________. 2001. Plantation Society: Toward General Theory of Caribbean
Society. In Caribbean Sociology: Introductory Readings, eds. C. Barrow
and R. Reddock, 139-150 in Kingston: Ian Randle Publishers.
81
Bennett, Herman L. 1996. The Black Power February (1970) Revolution in Trinidad. In
Caribbean Freedom: Economy and Society from Emancipation to the
Present, eds. H. Beckles and V. Shepherd, 548-556. Kingston: Ian Randle
Publishers.
Brereton, Bridget. 1981. A History of Modern Trinidad 1783-1962. London:
Heinemann.
______________. 1998. The White Elite of Trinidad, 1838 – 1950. In The White
Minority in the Caribbean, eds. Howard Johnson and Karl Watson, 32-70.
Kingston: Ian Randle Publishers.
Campbell, Carl C. 1997. Endless Education: Main Currents in the Education System of
Modern Trinidad and Tobago 1939-1986. Jamaica: The Press University
of the West Indies.
Clarke, Colin. 1991. Society and Politics in the Caribbean. New York: St. Martin’s
Press.
Cumper, G. E. 1974. Dependence, Development, and the Sociology of Economic
Thought. Social and Economic Studies 23(3): 465-483.
Dahl, Robert A. 1958. A Critique of the Ruling Elite Model. The American Political
Science Review 52(2): 463-469.
Demas, William G. 1980. Arthur Lewis and His Last Development Policy Model for
the Caribbean. Social and Economic Studies 29: 85-94.
Dooley, Peter C. 1969. The Interlocking Directorate. The American Economic Review
59(3): 314-323.
Farrell, Terrence. 1980. Arthur Lewis and the Case for Caribbean Industrialisation.
Social and Economic Studies 29: 52-75.
Freitag, Peter J. 1975. The Cabinet and Big Business: A Study of Interlocks. Social
Problems 23(2): 137-152.
Foote, Nelson N. 1990. Ethnic and Economic Pluralism: No Race is a Majority – All are
Minorities. Caribbean Affairs 3(5): 134-150.
Gereffi, Gary and Stephanie Fonda. 1992. Regional Paths of Development. Annual
Review of Sociology 18: 419-448.
Gibbons, Deborah. 2004. Friendship and Advice Networks in the Context of Changing
Professional Values. Administrative Science Quarterly 49(2): 238-262.
82
Greeley, Andrew M. 1974. Political Participation among Ethnic Groups in the United
State: A Preliminary Reconnaissance. American Journal of Sociology,
80(1): 170-204.
Hass, Jeffrey K. 2007. Economic Sociology: An Introduction. London: Routledge.
Heinz, John P., Edward O. Laumann, Robert H. Salisbury and Robert L. Nelson. 1990.
Inner Circles or Hollow Cores? Elite Networks in National Policy
Systems. The Journal of Politics 52(2): 356 -390.
Henry, Ralph M. 1989. Inequality in Plural Societies: An Exploration. Social and
Economic Studies 38(2): 69-109.
______________. 1990. Capital Availability, Small Business Formation and
Performance in Barbados, Jamaica and Trinidad: An Empirical Foray.
Social and Economic Studies 39(40): 1-43.
Higley, John, Ursula Hoffmann-Lange, Charles Kadushin & Gwen Moore. 1991. Elite
Integration in Stable Democracies: A Reconsideration. European
Sociological Review 7(1): 35-53.
Kadushin, Charles. 1995. Friendship Among the French Financial Elite. American
Sociological Review 60(2): 202-221.
Karch, Cecilia. 1981. The Growth of the Corporate Economy in Barbados: Class/Race
Factors, 1890-1977. In Contemporary Caribbean: a sociological reader,
ed. Susan Craig, 213-243. St. Augustine: College Press.
Krackhardt, David. 1990. Assessing the Political Landscape: Structure, Cognition, and
Power in Organizations. Administrative Science Quarterly 35(2): 342-
396.
Knight, Franklin W. 1978. The Caribbean: The Genesis of Fragmented Nationalism.
New York: Oxford University Press.
Laumann, Edward O. and Franz Urban Pappi. 1973. New Directions in the Study of
Community Elites. American Sociological Review 38: 212-230.
Leeson, P. F. 1982. The Lewis Model and Development Theory. In Perspectives on
Economic Development: Essays in the Honour of W. Arthur Lewis, eds. T.
Barker, A. Downes and J. Sackey, 1-20. England: University Press of
America, Inc.
Levine, Joel H. 1972. The Sphere of Influence. American Sociological Review 37(1):
14-27.
83
Leys, Colin. 1996. The Rise and Fall of Development Theory. Bloomington: Indiana
University Press.
Look Lai, Walton. 1993. Indentured Labor, Caribbean Sugar: Chinese and Indian
Migrants to the British West Indies, 1938-1918. Baltimore: The Johns
Hopkins University Press.
Mills, C. Wright. 1945. The American Business Elite: A Collective Portrait. The
Journal of Economic History 5, Supplement: 20-44.
_____________. 1956. The Power Elite. New York: Oxford University Press.
Mintz, Beth, Peter Freitag, Carol Hendricks and Michael Schwartz. 1976. Problems of
Proof in Elite Research. Social Problems 23(3): 314-324.
Mintz, Sidney W. 1989. Caribbean Transformations. New York: Columbia University
Press.
Moore, Gwen. 1979. The Structure of National Elite Networks. American Sociological
Review 44(5): 673-692.
Padgett, John F. and Christopher K. Ansell. 1993. Robust Action and the Rise of the
Medici, 1400 – 1434. American Journal of Sociology 98(6): 1259-1319.
Parris, Carl. 1985. Power and Privilege in Trinidad and Tobago. Social and Economic
Studies 34(2): 97-109.
Pareto, Vilfredo. 1991. The Rise and Fall of Elites: An Application of Theoretical
Sociology. New Jersey: Transaction Publishers
Payne, Anthony and Paul Sutton. 2001. Charting Caribbean Development. Gainesville:
University Press of Florida.
Perrucci, Robert and Marc Pilisuk. 1970. Leaders and Ruling Elites: The
Interorgranizational Bases of Community Power. American Sociological
Review 35: 1040-1057.
Premdas, Ralph. 2007. Trinidad and Tobago: Ethnic Conflict, Inequality, and Public
Sector Governance. London: Palgrave Macmillan.
Rostant, Rory. 2009. “Govt bails out CLICO.” Trinidad and Tobago Newsday, January
31. Retrieved March 18, 2009 (http://www.newsday.co.tt).
Rostow, W. W. 1990. Theorists of Economic Growth from David Hume to the Present:
With a Perspective on the Next Century. Oxford: Oxford University Press.
84
Ryan, Selwyn. 1972. Race and Nationalism in Trinidad and Tobago: A Study of
Decolonization in a Multiracial Society. Toronto: University of Toronto
Press.
St. Cyr, E.B.A. 1980. On Lewis’ Theory of Growth and Development. Social and
Economic Studies 29:16-26.
Seapaul, Occah 1988. Hindu Women in Today’s Society: Moving Away from
Stereotypes of Dolls and Playthings. Caribbean Affairs 1(3): 90 -95.
Stone, Carl. 1986. Power in the Caribbean Basin: A Comparative Study of Political
Economy. Philadelphia: A Publication of the Institute for the Study of
Human Issues.
Useem, Michael. 1978. The Inner Group of the American Capitalist Class. Social
Problems 25(3): 225-240.
Wallerstein, Immanuel. 1976. A world-system perspective on the social sciences. The
British Journal of Sociology 27(3): 343-352.
William, Eric E. 1942. History of the People of Trinidad and Tobago. New York: A&B
Books Publishers.
____________. 1966. Capitalism and Slavery. New York: Capricorn Books.
Wrong, Dennis, H. 1968. Some Problems in Defining Social Power. The American
Journal of Sociology 73: 673-681.
Zeitlim, Maurice, W. Lawrence Neuman and Richard Earl Ratcliff. 1976. Class
segments: Agrarian Property and Political Leadership in the Capitalist
Class of Chile. American Sociological Review 41:1006-1029
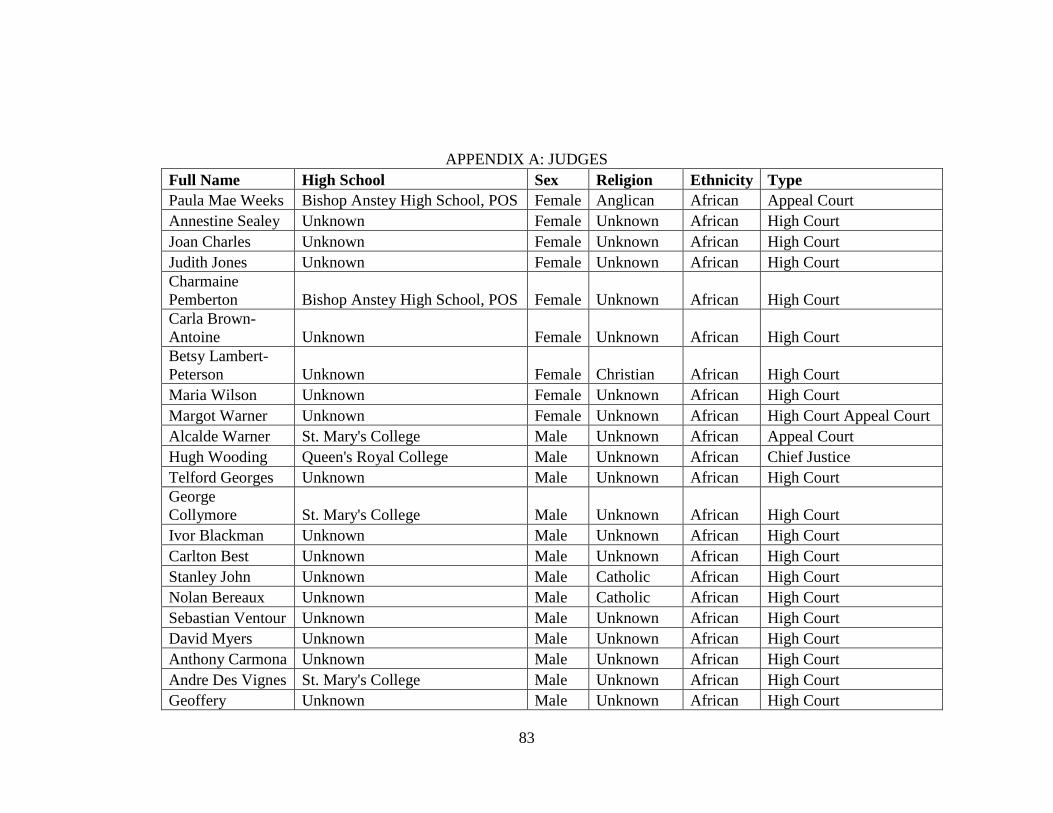
83
APPENDIX A: JUDGES
Full Name High School Sex Religion Ethnicity Type
Paula Mae Weeks Bishop Anstey High School, POS Female Anglican African Appeal Court
Annestine Sealey Unknown Female Unknown African High Court
Joan Charles Unknown Female Unknown African High Court
Judith Jones Unknown Female Unknown African High Court
Charmaine
Pemberton Bishop Anstey High School, POS Female Unknown African High Court
Carla Brown-
Antoine Unknown Female Unknown African High Court
Betsy Lambert-
Peterson Unknown Female Christian African High Court
Maria Wilson Unknown Female Unknown African High Court
Margot Warner Unknown Female Unknown African High Court Appeal Court
Alcalde Warner St. Mary's College Male Unknown African Appeal Court
Hugh Wooding Queen's Royal College Male Unknown African Chief Justice
Telford Georges Unknown Male Unknown African High Court
George
Collymore St. Mary's College Male Unknown African High Court
Ivor Blackman Unknown Male Unknown African High Court
Carlton Best Unknown Male Unknown African High Court
Stanley John Unknown Male Catholic African High Court
Nolan Bereaux Unknown Male Catholic African High Court
Sebastian Ventour Unknown Male Unknown African High Court
David Myers Unknown Male Unknown African High Court
Anthony Carmona Unknown Male Unknown African High Court
Andre Des Vignes St. Mary's College Male Unknown African High Court
Geoffery Unknown Male Unknown African High Court
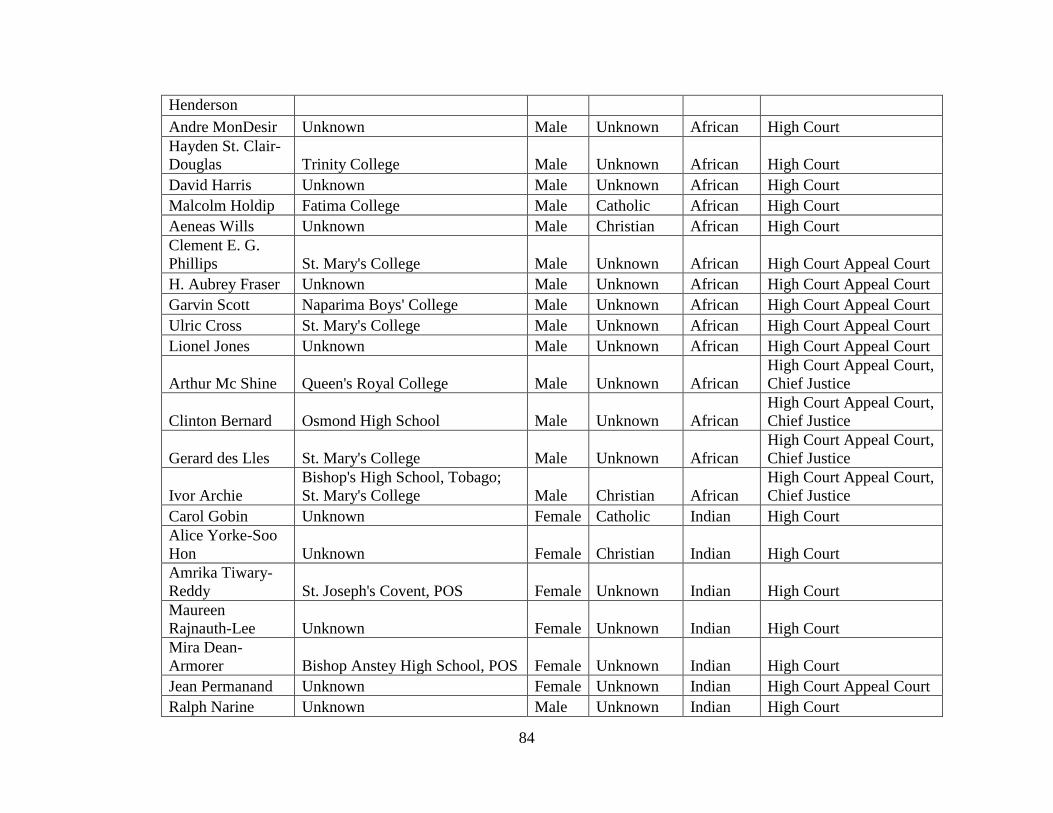
84
Henderson
Andre MonDesir Unknown Male Unknown African High Court
Hayden St. Clair-
Douglas Trinity College Male Unknown African High Court
David Harris Unknown Male Unknown African High Court
Malcolm Holdip Fatima College Male Catholic African High Court
Aeneas Wills Unknown Male Christian African High Court
Clement E. G.
Phillips St. Mary's College Male Unknown African High Court Appeal Court
H. Aubrey Fraser Unknown Male Unknown African High Court Appeal Court
Garvin Scott Naparima Boys' College Male Unknown African High Court Appeal Court
Ulric Cross St. Mary's College Male Unknown African High Court Appeal Court
Lionel Jones Unknown Male Unknown African High Court Appeal Court
Arthur Mc Shine Queen's Royal College Male Unknown African
High Court Appeal Court,
Chief Justice
Clinton Bernard Osmond High School Male Unknown African
High Court Appeal Court,
Chief Justice
Gerard des Lles St. Mary's College Male Unknown African
High Court Appeal Court,
Chief Justice
Ivor Archie
Bishop's High School, Tobago;
St. Mary's College Male Christian African
High Court Appeal Court,
Chief Justice
Carol Gobin Unknown Female Catholic Indian High Court
Alice Yorke-Soo
Hon Unknown Female Christian Indian High Court
Amrika Tiwary-
Reddy St. Joseph's Covent, POS Female Unknown Indian High Court
Maureen
Rajnauth-Lee Unknown Female Unknown Indian High Court
Mira Dean-
Armorer Bishop Anstey High School, POS Female Unknown Indian High Court
Jean Permanand Unknown Female Unknown Indian High Court Appeal Court
Ralph Narine Unknown Male Unknown Indian High Court
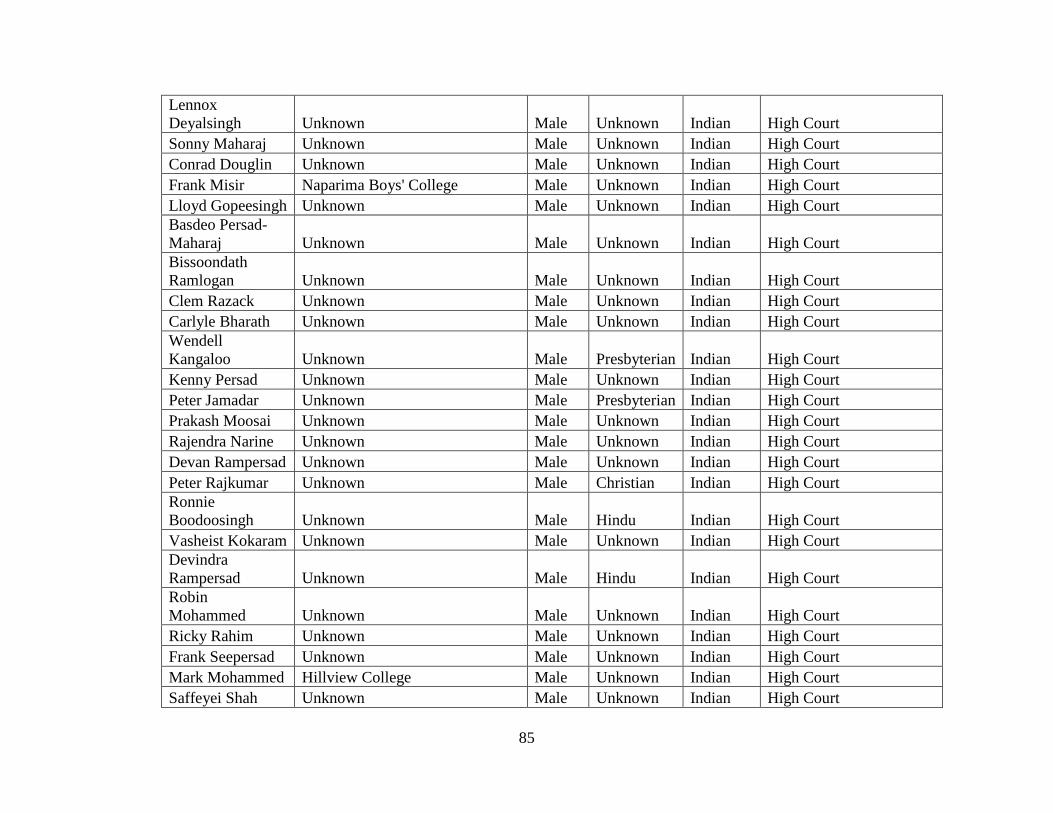
85
Lennox
Deyalsingh Unknown Male Unknown Indian High Court
Sonny Maharaj Unknown Male Unknown Indian High Court
Conrad Douglin Unknown Male Unknown Indian High Court
Frank Misir Naparima Boys' College Male Unknown Indian High Court
Lloyd Gopeesingh Unknown Male Unknown Indian High Court
Basdeo Persad-
Maharaj Unknown Male Unknown Indian High Court
Bissoondath
Ramlogan Unknown Male Unknown Indian High Court
Clem Razack Unknown Male Unknown Indian High Court
Carlyle Bharath Unknown Male Unknown Indian High Court
Wendell
Kangaloo Unknown Male Presbyterian Indian High Court
Kenny Persad Unknown Male Unknown Indian High Court
Peter Jamadar Unknown Male Presbyterian Indian High Court
Prakash Moosai Unknown Male Unknown Indian High Court
Rajendra Narine Unknown Male Unknown Indian High Court
Devan Rampersad Unknown Male Unknown Indian High Court
Peter Rajkumar Unknown Male Christian Indian High Court
Ronnie
Boodoosingh Unknown Male Hindu Indian High Court
Vasheist Kokaram Unknown Male Unknown Indian High Court
Devindra
Rampersad Unknown Male Hindu Indian High Court
Robin
Mohammed Unknown Male Unknown Indian High Court
Ricky Rahim Unknown Male Unknown Indian High Court
Frank Seepersad Unknown Male Unknown Indian High Court
Mark Mohammed Hillview College Male Unknown Indian High Court
Saffeyei Shah Unknown Male Unknown Indian High Court
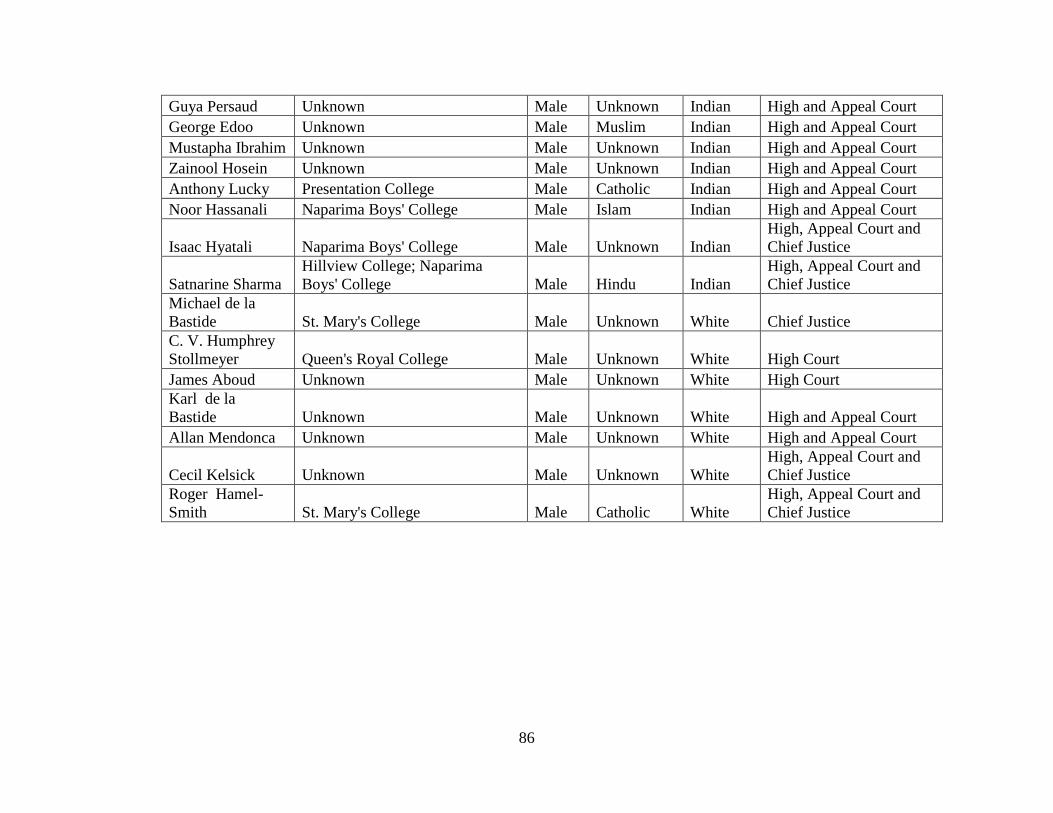
86
Guya Persaud Unknown Male Unknown Indian High and Appeal Court
George Edoo Unknown Male Muslim Indian High and Appeal Court
Mustapha Ibrahim Unknown Male Unknown Indian High and Appeal Court
Zainool Hosein Unknown Male Unknown Indian High and Appeal Court
Anthony Lucky Presentation College Male Catholic Indian High and Appeal Court
Noor Hassanali Naparima Boys' College Male Islam Indian High and Appeal Court
Isaac Hyatali Naparima Boys' College Male Unknown Indian
High, Appeal Court and
Chief Justice
Satnarine Sharma
Hillview College; Naparima
Boys' College Male Hindu Indian
High, Appeal Court and
Chief Justice
Michael de la
Bastide St. Mary's College Male Unknown White Chief Justice
C. V. Humphrey
Stollmeyer Queen's Royal College Male Unknown White High Court
James Aboud Unknown Male Unknown White High Court
Karl de la
Bastide Unknown Male Unknown White High and Appeal Court
Allan Mendonca Unknown Male Unknown White High and Appeal Court
Cecil Kelsick Unknown Male Unknown White
High, Appeal Court and
Chief Justice
Roger Hamel-
Smith St. Mary's College Male Catholic White
High, Appeal Court and
Chief Justice
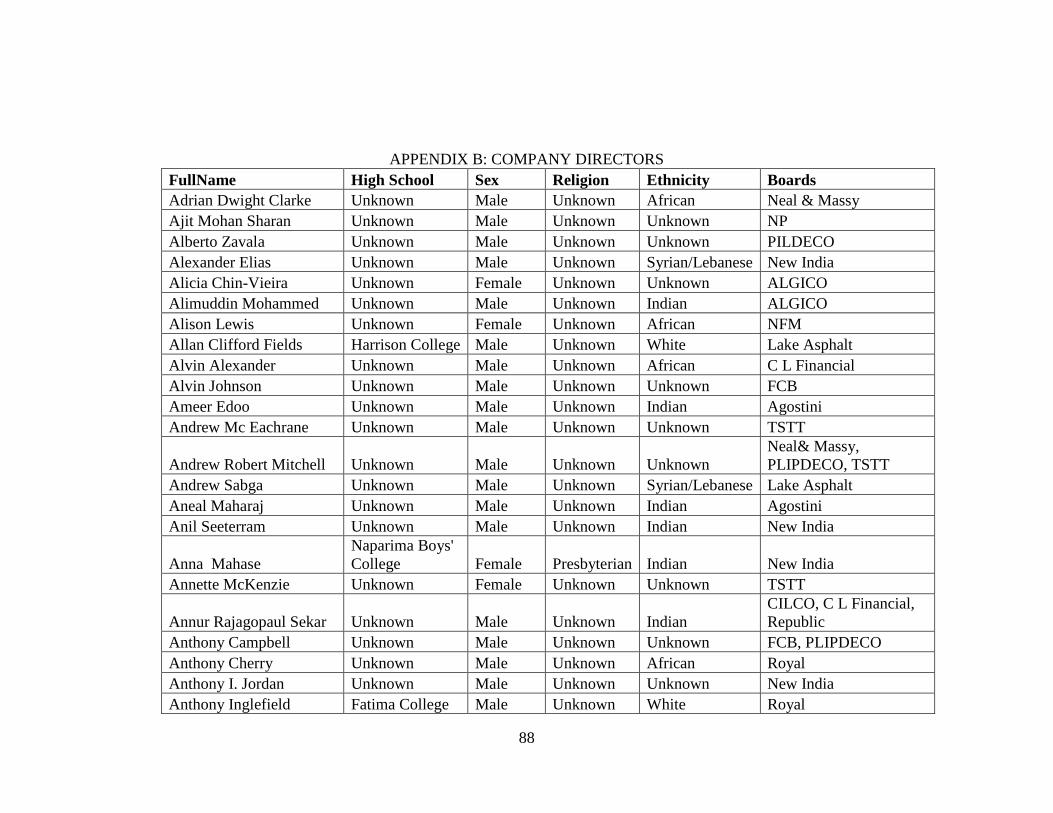
88
APPENDIX B: COMPANY DIRECTORS
FullName High School Sex Religion Ethnicity Boards
Adrian Dwight Clarke Unknown Male Unknown African Neal & Massy
Ajit Mohan Sharan Unknown Male Unknown Unknown NP
Alberto Zavala Unknown Male Unknown Unknown PILDECO
Alexander Elias Unknown Male Unknown Syrian/Lebanese New India
Alicia Chin-Vieira Unknown Female Unknown Unknown ALGICO
Alimuddin Mohammed Unknown Male Unknown Indian ALGICO
Alison Lewis Unknown Female Unknown African NFM
Allan Clifford Fields Harrison College Male Unknown White Lake Asphalt
Alvin Alexander Unknown Male Unknown African C L Financial
Alvin Johnson Unknown Male Unknown Unknown FCB
Ameer Edoo Unknown Male Unknown Indian Agostini
Andrew Mc Eachrane Unknown Male Unknown Unknown TSTT
Andrew Robert Mitchell Unknown Male Unknown Unknown
Neal& Massy,
PLIPDECO, TSTT
Andrew Sabga Unknown Male Unknown Syrian/Lebanese Lake Asphalt
Aneal Maharaj Unknown Male Unknown Indian Agostini
Anil Seeterram Unknown Male Unknown Indian New India
Anna Mahase
Naparima Boys'
College Female Presbyterian Indian New India
Annette McKenzie Unknown Female Unknown Unknown TSTT
Annur Rajagopaul Sekar Unknown Male Unknown Indian
CILCO, C L Financial,
Republic
Anthony Campbell Unknown Male Unknown Unknown FCB, PLIPDECO
Anthony Cherry Unknown Male Unknown African Royal
Anthony I. Jordan Unknown Male Unknown Unknown New India
Anthony Inglefield Fatima College Male Unknown White Royal
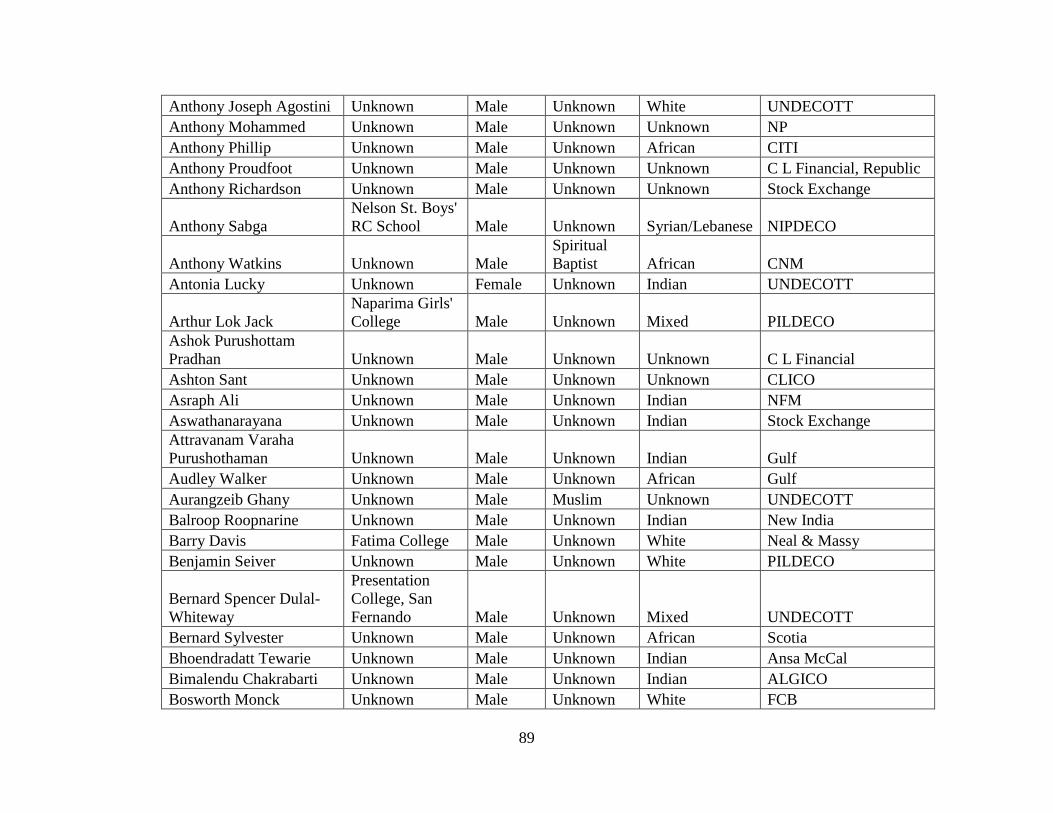
89
Anthony Joseph Agostini Unknown Male Unknown White UNDECOTT
Anthony Mohammed Unknown Male Unknown Unknown NP
Anthony Phillip Unknown Male Unknown African CITI
Anthony Proudfoot Unknown Male Unknown Unknown C L Financial, Republic
Anthony Richardson Unknown Male Unknown Unknown Stock Exchange
Anthony Sabga
Nelson St. Boys'
RC School Male Unknown Syrian/Lebanese NIPDECO
Anthony Watkins Unknown Male
Spiritual
Baptist African CNM
Antonia Lucky Unknown Female Unknown Indian UNDECOTT
Arthur Lok Jack
Naparima Girls'
College Male Unknown Mixed PILDECO
Ashok Purushottam
Pradhan Unknown Male Unknown Unknown C L Financial
Ashton Sant Unknown Male Unknown Unknown CLICO
Asraph Ali Unknown Male Unknown Indian NFM
Aswathanarayana Unknown Male Unknown Indian Stock Exchange
Attravanam Varaha
Purushothaman Unknown Male Unknown Indian Gulf
Audley Walker Unknown Male Unknown African Gulf
Aurangzeib Ghany Unknown Male Muslim Unknown UNDECOTT
Balroop Roopnarine Unknown Male Unknown Indian New India
Barry Davis Fatima College Male Unknown White Neal & Massy
Benjamin Seiver Unknown Male Unknown White PILDECO
Bernard Spencer Dulal-
Whiteway
Presentation
College, San
Fernando Male Unknown Mixed UNDECOTT
Bernard Sylvester Unknown Male Unknown African Scotia
Bhoendradatt Tewarie Unknown Male Unknown Indian Ansa McCal
Bimalendu Chakrabarti Unknown Male Unknown Indian ALGICO
Bosworth Monck Unknown Male Unknown White FCB
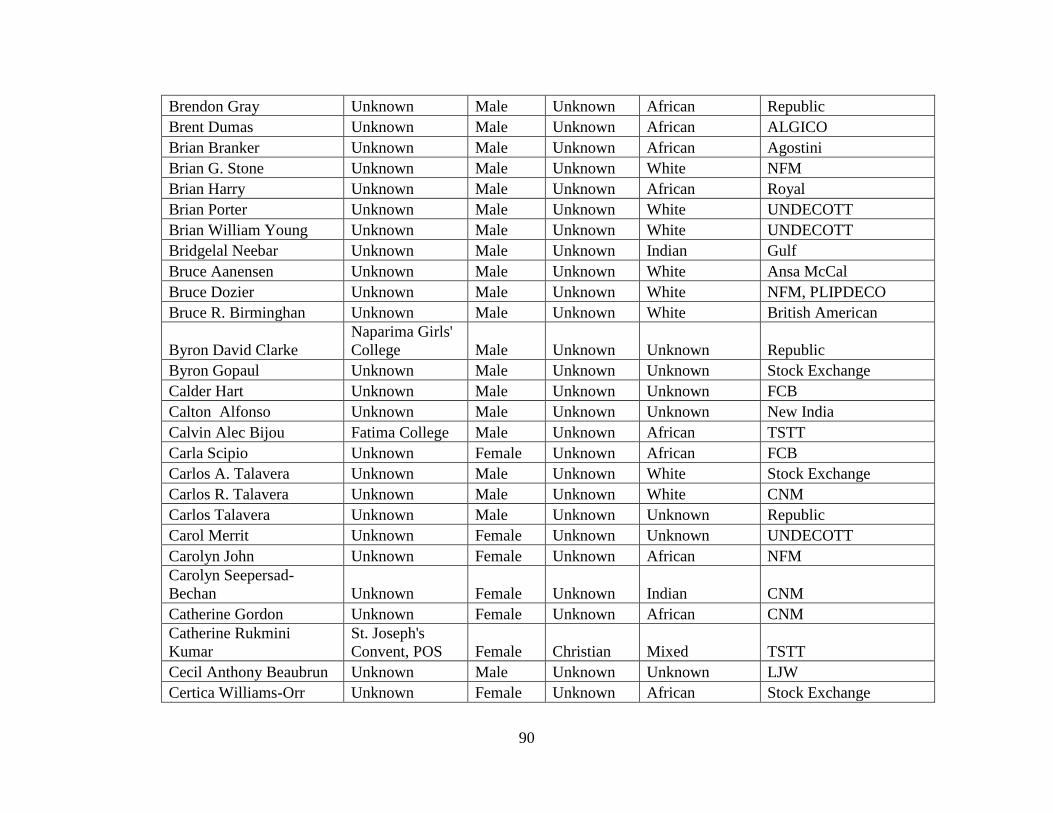
90
Brendon Gray Unknown Male Unknown African Republic
Brent Dumas Unknown Male Unknown African ALGICO
Brian Branker Unknown Male Unknown African Agostini
Brian G. Stone Unknown Male Unknown White NFM
Brian Harry Unknown Male Unknown African Royal
Brian Porter Unknown Male Unknown White UNDECOTT
Brian William Young Unknown Male Unknown White UNDECOTT
Bridgelal Neebar Unknown Male Unknown Indian Gulf
Bruce Aanensen Unknown Male Unknown White Ansa McCal
Bruce Dozier Unknown Male Unknown White NFM, PLIPDECO
Bruce R. Birminghan Unknown Male Unknown White British American
Byron David Clarke
Naparima Girls'
College Male Unknown Unknown Republic
Byron Gopaul Unknown Male Unknown Unknown Stock Exchange
Calder Hart Unknown Male Unknown Unknown FCB
Calton Alfonso Unknown Male Unknown Unknown New India
Calvin Alec Bijou Fatima College Male Unknown African TSTT
Carla Scipio Unknown Female Unknown African FCB
Carlos A. Talavera Unknown Male Unknown White Stock Exchange
Carlos R. Talavera Unknown Male Unknown White CNM
Carlos Talavera Unknown Male Unknown Unknown Republic
Carol Merrit Unknown Female Unknown Unknown UNDECOTT
Carolyn John Unknown Female Unknown African NFM
Carolyn Seepersad-
Bechan Unknown Female Unknown Indian CNM
Catherine Gordon Unknown Female Unknown African CNM
Catherine Rukmini
Kumar
St. Joseph's
Convent, POS Female Christian Mixed TSTT
Cecil Anthony Beaubrun Unknown Male Unknown Unknown LJW
Certica Williams-Orr Unknown Female Unknown African Stock Exchange
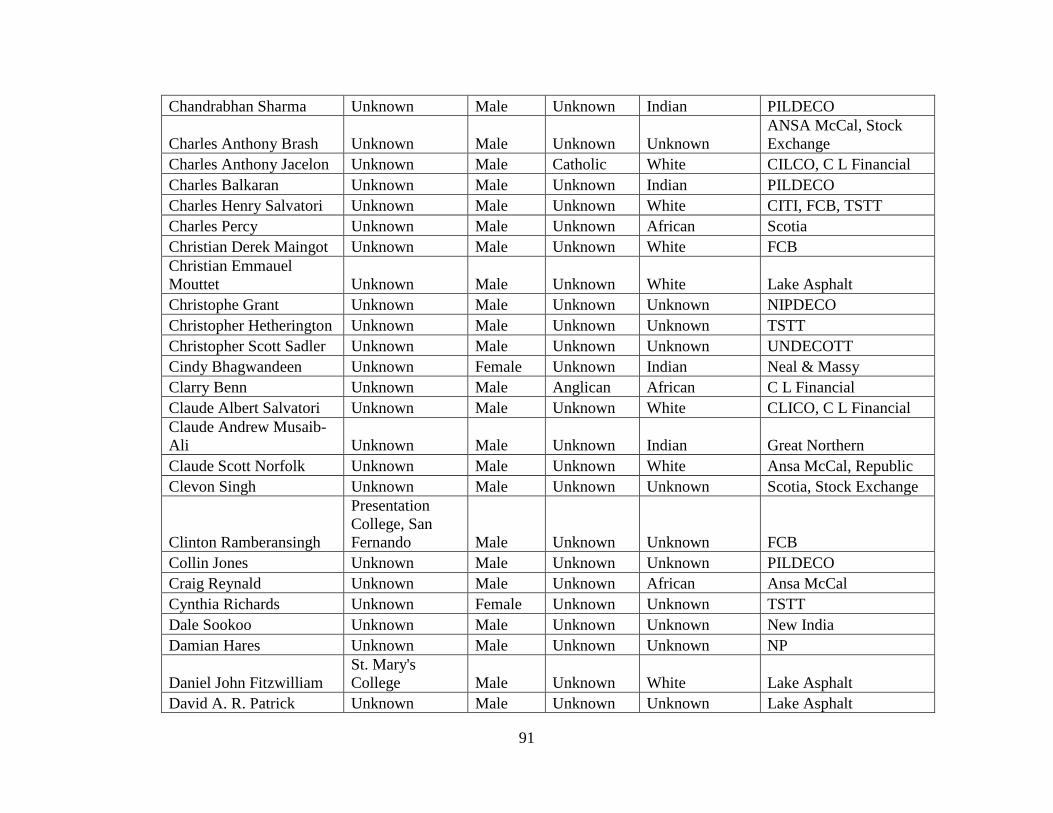
91
Chandrabhan Sharma Unknown Male Unknown Indian PILDECO
Charles Anthony Brash Unknown Male Unknown Unknown
ANSA McCal, Stock
Exchange
Charles Anthony Jacelon Unknown Male Catholic White CILCO, C L Financial
Charles Balkaran Unknown Male Unknown Indian PILDECO
Charles Henry Salvatori Unknown Male Unknown White CITI, FCB, TSTT
Charles Percy Unknown Male Unknown African Scotia
Christian Derek Maingot Unknown Male Unknown White FCB
Christian Emmauel
Mouttet Unknown Male Unknown White Lake Asphalt
Christophe Grant Unknown Male Unknown Unknown NIPDECO
Christopher Hetherington Unknown Male Unknown Unknown TSTT
Christopher Scott Sadler Unknown Male Unknown Unknown UNDECOTT
Cindy Bhagwandeen Unknown Female Unknown Indian Neal & Massy
Clarry Benn Unknown Male Anglican African C L Financial
Claude Albert Salvatori Unknown Male Unknown White CLICO, C L Financial
Claude Andrew Musaib-
Ali Unknown Male Unknown Indian Great Northern
Claude Scott Norfolk Unknown Male Unknown White Ansa McCal, Republic
Clevon Singh Unknown Male Unknown Unknown Scotia, Stock Exchange
Clinton Ramberansingh
Presentation
College, San
Fernando Male Unknown Unknown FCB
Collin Jones Unknown Male Unknown Unknown PILDECO
Craig Reynald Unknown Male Unknown African Ansa McCal
Cynthia Richards Unknown Female Unknown Unknown TSTT
Dale Sookoo Unknown Male Unknown Unknown New India
Damian Hares Unknown Male Unknown Unknown NP
Daniel John Fitzwilliam
St. Mary's
College Male Unknown White Lake Asphalt
David A. R. Patrick Unknown Male Unknown Unknown Lake Asphalt
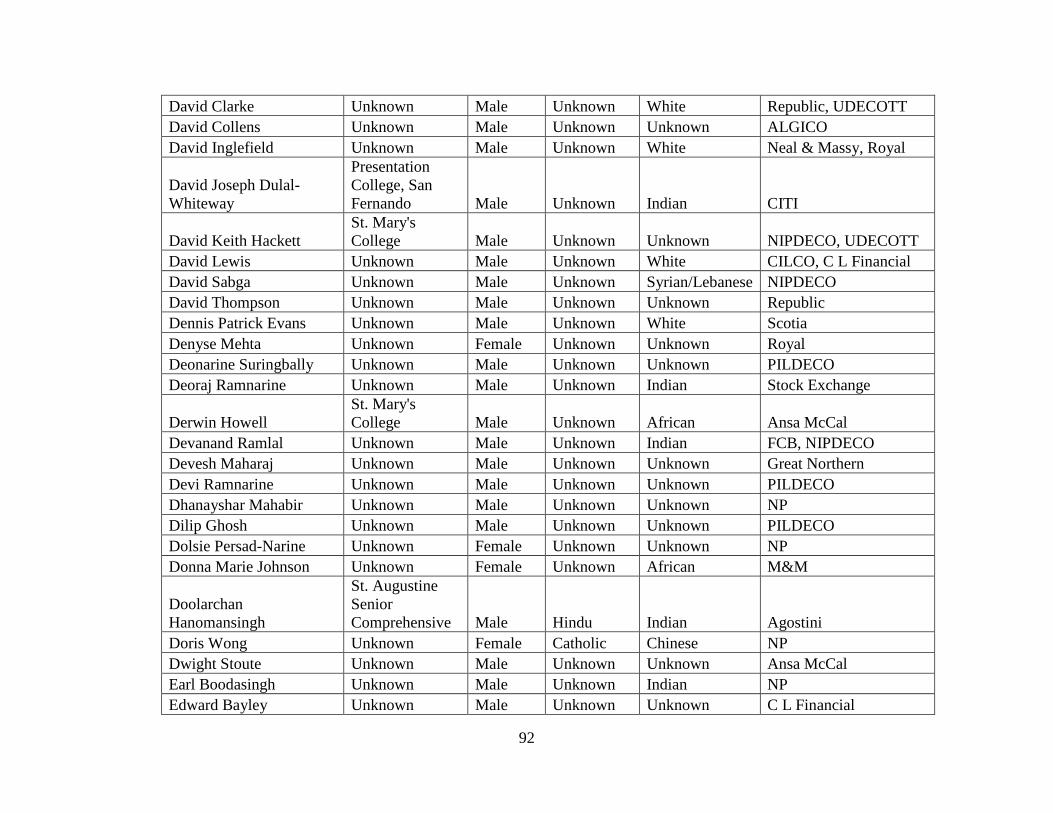
92
David Clarke Unknown Male Unknown White Republic, UDECOTT
David Collens Unknown Male Unknown Unknown ALGICO
David Inglefield Unknown Male Unknown White Neal & Massy, Royal
David Joseph Dulal-
Whiteway
Presentation
College, San
Fernando Male Unknown Indian CITI
David Keith Hackett
St. Mary's
College Male Unknown Unknown NIPDECO, UDECOTT
David Lewis Unknown Male Unknown White CILCO, C L Financial
David Sabga Unknown Male Unknown Syrian/Lebanese NIPDECO
David Thompson Unknown Male Unknown Unknown Republic
Dennis Patrick Evans Unknown Male Unknown White Scotia
Denyse Mehta Unknown Female Unknown Unknown Royal
Deonarine Suringbally Unknown Male Unknown Unknown PILDECO
Deoraj Ramnarine Unknown Male Unknown Indian Stock Exchange
Derwin Howell
St. Mary's
College Male Unknown African Ansa McCal
Devanand Ramlal Unknown Male Unknown Indian FCB, NIPDECO
Devesh Maharaj Unknown Male Unknown Unknown Great Northern
Devi Ramnarine Unknown Male Unknown Unknown PILDECO
Dhanayshar Mahabir Unknown Male Unknown Unknown NP
Dilip Ghosh Unknown Male Unknown Unknown PILDECO
Dolsie Persad-Narine Unknown Female Unknown Unknown NP
Donna Marie Johnson Unknown Female Unknown African M&M
Doolarchan
Hanomansingh
St. Augustine
Senior
Comprehensive Male Hindu Indian Agostini
Doris Wong Unknown Female Catholic Chinese NP
Dwight Stoute Unknown Male Unknown Unknown Ansa McCal
Earl Boodasingh Unknown Male Unknown Indian NP
Edward Bayley Unknown Male Unknown Unknown C L Financial
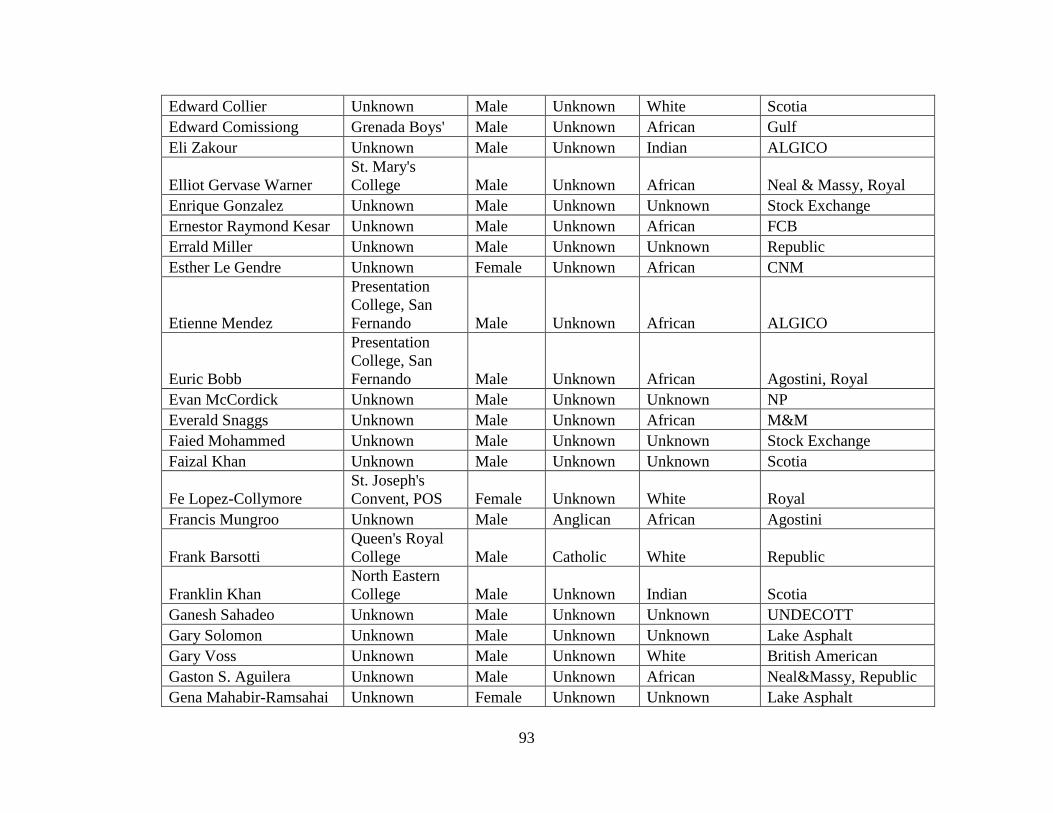
93
Edward Collier Unknown Male Unknown White Scotia
Edward Comissiong Grenada Boys' Male Unknown African Gulf
Eli Zakour Unknown Male Unknown Indian ALGICO
Elliot Gervase Warner
St. Mary's
College Male Unknown African Neal & Massy, Royal
Enrique Gonzalez Unknown Male Unknown Unknown Stock Exchange
Ernestor Raymond Kesar Unknown Male Unknown African FCB
Errald Miller Unknown Male Unknown Unknown Republic
Esther Le Gendre Unknown Female Unknown African CNM
Etienne Mendez
Presentation
College, San
Fernando Male Unknown African ALGICO
Euric Bobb
Presentation
College, San
Fernando Male Unknown African Agostini, Royal
Evan McCordick Unknown Male Unknown Unknown NP
Everald Snaggs Unknown Male Unknown African M&M
Faied Mohammed Unknown Male Unknown Unknown Stock Exchange
Faizal Khan Unknown Male Unknown Unknown Scotia
Fe Lopez-Collymore
St. Joseph's
Convent, POS Female Unknown White Royal
Francis Mungroo Unknown Male Anglican African Agostini
Frank Barsotti
Queen's Royal
College Male Catholic White Republic
Franklin Khan
North Eastern
College Male Unknown Indian Scotia
Ganesh Sahadeo Unknown Male Unknown Unknown UNDECOTT
Gary Solomon Unknown Male Unknown Unknown Lake Asphalt
Gary Voss Unknown Male Unknown White British American
Gaston S. Aguilera Unknown Male Unknown African Neal&Massy, Republic
Gena Mahabir-Ramsahai Unknown Female Unknown Unknown Lake Asphalt
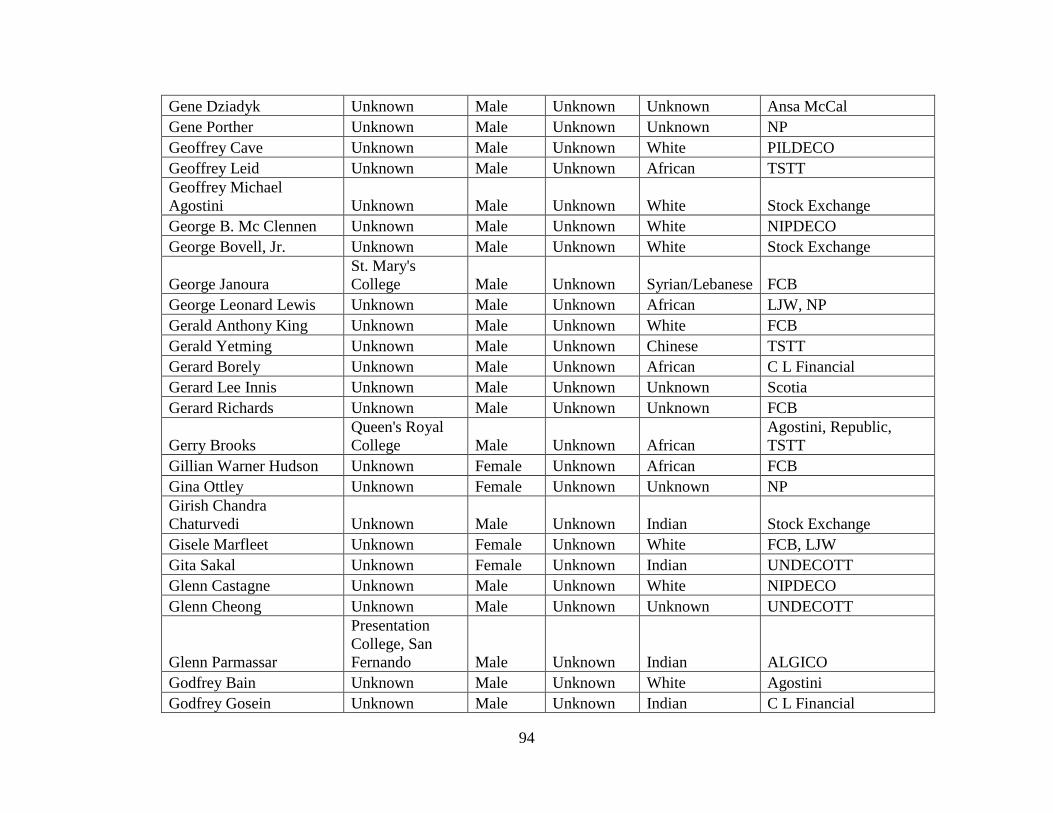
94
Gene Dziadyk Unknown Male Unknown Unknown Ansa McCal
Gene Porther Unknown Male Unknown Unknown NP
Geoffrey Cave Unknown Male Unknown White PILDECO
Geoffrey Leid Unknown Male Unknown African TSTT
Geoffrey Michael
Agostini Unknown Male Unknown White Stock Exchange
George B. Mc Clennen Unknown Male Unknown White NIPDECO
George Bovell, Jr. Unknown Male Unknown White Stock Exchange
George Janoura
St. Mary's
College Male Unknown Syrian/Lebanese FCB
George Leonard Lewis Unknown Male Unknown African LJW, NP
Gerald Anthony King Unknown Male Unknown White FCB
Gerald Yetming Unknown Male Unknown Chinese TSTT
Gerard Borely Unknown Male Unknown African C L Financial
Gerard Lee Innis Unknown Male Unknown Unknown Scotia
Gerard Richards Unknown Male Unknown Unknown FCB
Gerry Brooks
Queen's Royal
College Male Unknown African
Agostini, Republic,
TSTT
Gillian Warner Hudson Unknown Female Unknown African FCB
Gina Ottley Unknown Female Unknown Unknown NP
Girish Chandra
Chaturvedi Unknown Male Unknown Indian Stock Exchange
Gisele Marfleet Unknown Female Unknown White FCB, LJW
Gita Sakal Unknown Female Unknown Indian UNDECOTT
Glenn Castagne Unknown Male Unknown White NIPDECO
Glenn Cheong Unknown Male Unknown Unknown UNDECOTT
Glenn Parmassar
Presentation
College, San
Fernando Male Unknown Indian ALGICO
Godfrey Bain Unknown Male Unknown White Agostini
Godfrey Gosein Unknown Male Unknown Indian C L Financial
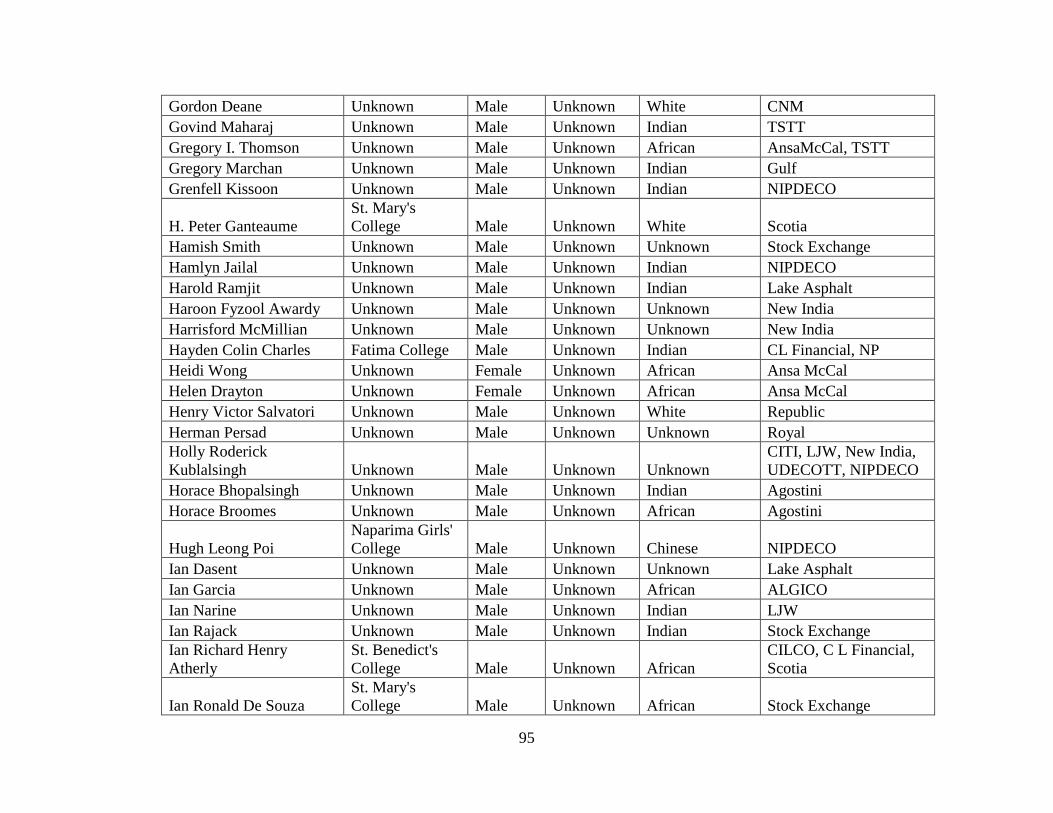
95
Gordon Deane Unknown Male Unknown White CNM
Govind Maharaj Unknown Male Unknown Indian TSTT
Gregory I. Thomson Unknown Male Unknown African AnsaMcCal, TSTT
Gregory Marchan Unknown Male Unknown Indian Gulf
Grenfell Kissoon Unknown Male Unknown Indian NIPDECO
H. Peter Ganteaume
St. Mary's
College Male Unknown White Scotia
Hamish Smith Unknown Male Unknown Unknown Stock Exchange
Hamlyn Jailal Unknown Male Unknown Indian NIPDECO
Harold Ramjit Unknown Male Unknown Indian Lake Asphalt
Haroon Fyzool Awardy Unknown Male Unknown Unknown New India
Harrisford McMillian Unknown Male Unknown Unknown New India
Hayden Colin Charles Fatima College Male Unknown Indian CL Financial, NP
Heidi Wong Unknown Female Unknown African Ansa McCal
Helen Drayton Unknown Female Unknown African Ansa McCal
Henry Victor Salvatori Unknown Male Unknown White Republic
Herman Persad Unknown Male Unknown Unknown Royal
Holly Roderick
Kublalsingh Unknown Male Unknown Unknown
CITI, LJW, New India,
UDECOTT, NIPDECO
Horace Bhopalsingh Unknown Male Unknown Indian Agostini
Horace Broomes Unknown Male Unknown African Agostini
Hugh Leong Poi
Naparima Girls'
College Male Unknown Chinese NIPDECO
Ian Dasent Unknown Male Unknown Unknown Lake Asphalt
Ian Garcia Unknown Male Unknown African ALGICO
Ian Narine Unknown Male Unknown Indian LJW
Ian Rajack Unknown Male Unknown Indian Stock Exchange
Ian Richard Henry
Atherly
St. Benedict's
College Male Unknown African
CILCO, C L Financial,
Scotia
Ian Ronald De Souza
St. Mary's
College Male Unknown African Stock Exchange
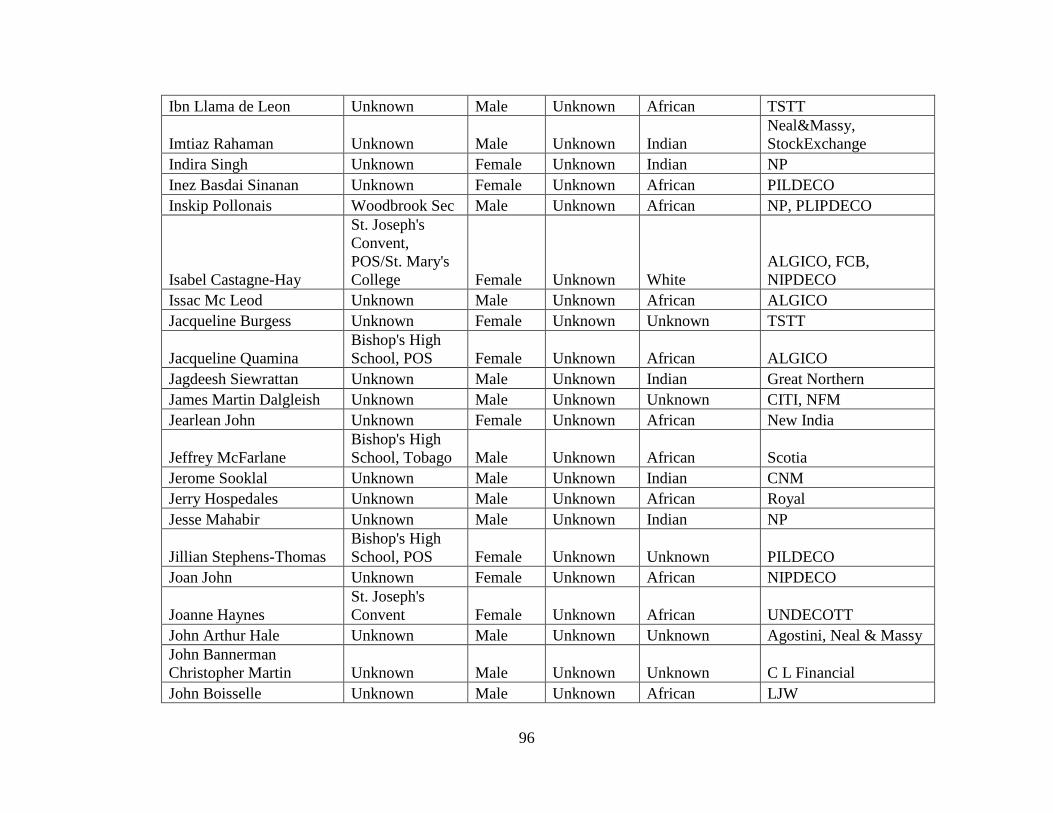
96
Ibn Llama de Leon Unknown Male Unknown African TSTT
Imtiaz Rahaman Unknown Male Unknown Indian
Neal&Massy,
StockExchange
Indira Singh Unknown Female Unknown Indian NP
Inez Basdai Sinanan Unknown Female Unknown African PILDECO
Inskip Pollonais Woodbrook Sec Male Unknown African NP, PLIPDECO
Isabel Castagne-Hay
St. Joseph's
Convent,
POS/St. Mary's
College Female Unknown White
ALGICO, FCB,
NIPDECO
Issac Mc Leod Unknown Male Unknown African ALGICO
Jacqueline Burgess Unknown Female Unknown Unknown TSTT
Jacqueline Quamina
Bishop's High
School, POS Female Unknown African ALGICO
Jagdeesh Siewrattan Unknown Male Unknown Indian Great Northern
James Martin Dalgleish Unknown Male Unknown Unknown CITI, NFM
Jearlean John Unknown Female Unknown African New India
Jeffrey McFarlane
Bishop's High
School, Tobago Male Unknown African Scotia
Jerome Sooklal Unknown Male Unknown Indian CNM
Jerry Hospedales Unknown Male Unknown African Royal
Jesse Mahabir Unknown Male Unknown Indian NP
Jillian Stephens-Thomas
Bishop's High
School, POS Female Unknown Unknown PILDECO
Joan John Unknown Female Unknown African NIPDECO
Joanne Haynes
St. Joseph's
Convent Female Unknown African UNDECOTT
John Arthur Hale Unknown Male Unknown Unknown Agostini, Neal & Massy
John Bannerman
Christopher Martin Unknown Male Unknown Unknown C L Financial
John Boisselle Unknown Male Unknown African LJW
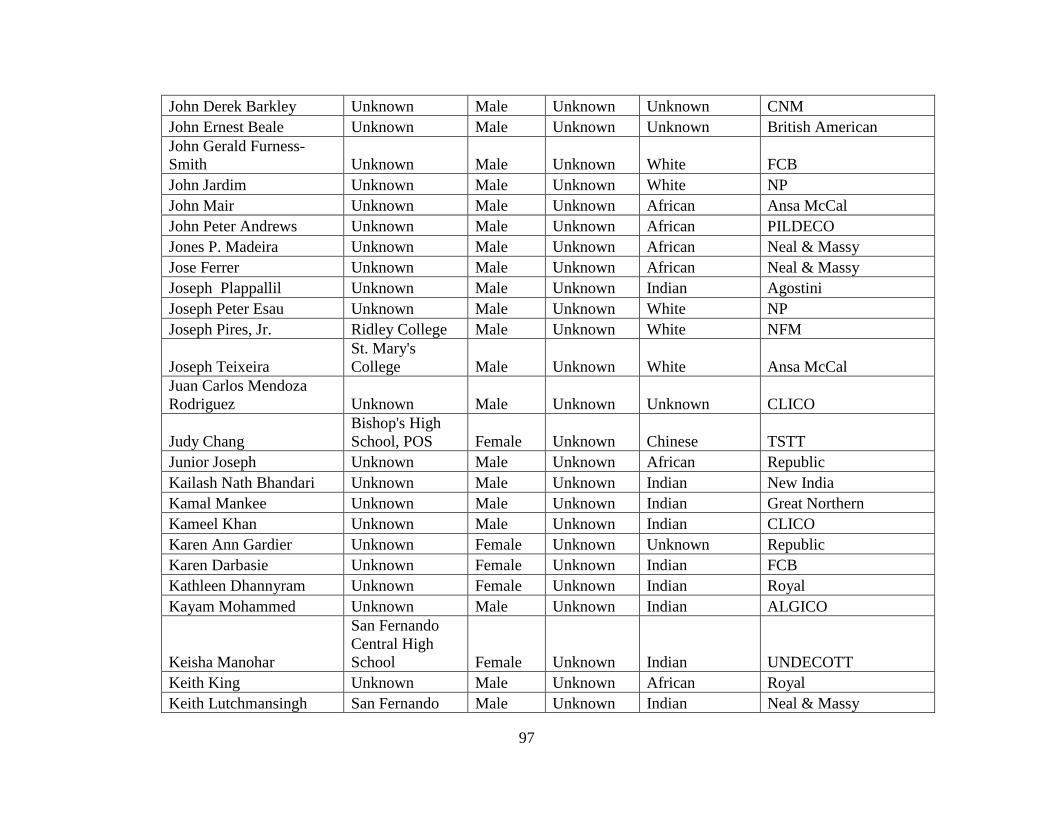
97
John Derek Barkley Unknown Male Unknown Unknown CNM
John Ernest Beale Unknown Male Unknown Unknown British American
John Gerald Furness-
Smith Unknown Male Unknown White FCB
John Jardim Unknown Male Unknown White NP
John Mair Unknown Male Unknown African Ansa McCal
John Peter Andrews Unknown Male Unknown African PILDECO
Jones P. Madeira Unknown Male Unknown African Neal & Massy
Jose Ferrer Unknown Male Unknown African Neal & Massy
Joseph Plappallil Unknown Male Unknown Indian Agostini
Joseph Peter Esau Unknown Male Unknown White NP
Joseph Pires, Jr. Ridley College Male Unknown White NFM
Joseph Teixeira
St. Mary's
College Male Unknown White Ansa McCal
Juan Carlos Mendoza
Rodriguez Unknown Male Unknown Unknown CLICO
Judy Chang
Bishop's High
School, POS Female Unknown Chinese TSTT
Junior Joseph Unknown Male Unknown African Republic
Kailash Nath Bhandari Unknown Male Unknown Indian New India
Kamal Mankee Unknown Male Unknown Indian Great Northern
Kameel Khan Unknown Male Unknown Indian CLICO
Karen Ann Gardier Unknown Female Unknown Unknown Republic
Karen Darbasie Unknown Female Unknown Indian FCB
Kathleen Dhannyram Unknown Female Unknown Indian Royal
Kayam Mohammed Unknown Male Unknown Indian ALGICO
Keisha Manohar
San Fernando
Central High
School Female Unknown Indian UNDECOTT
Keith King Unknown Male Unknown African Royal
Keith Lutchmansingh San Fernando Male Unknown Indian Neal & Massy
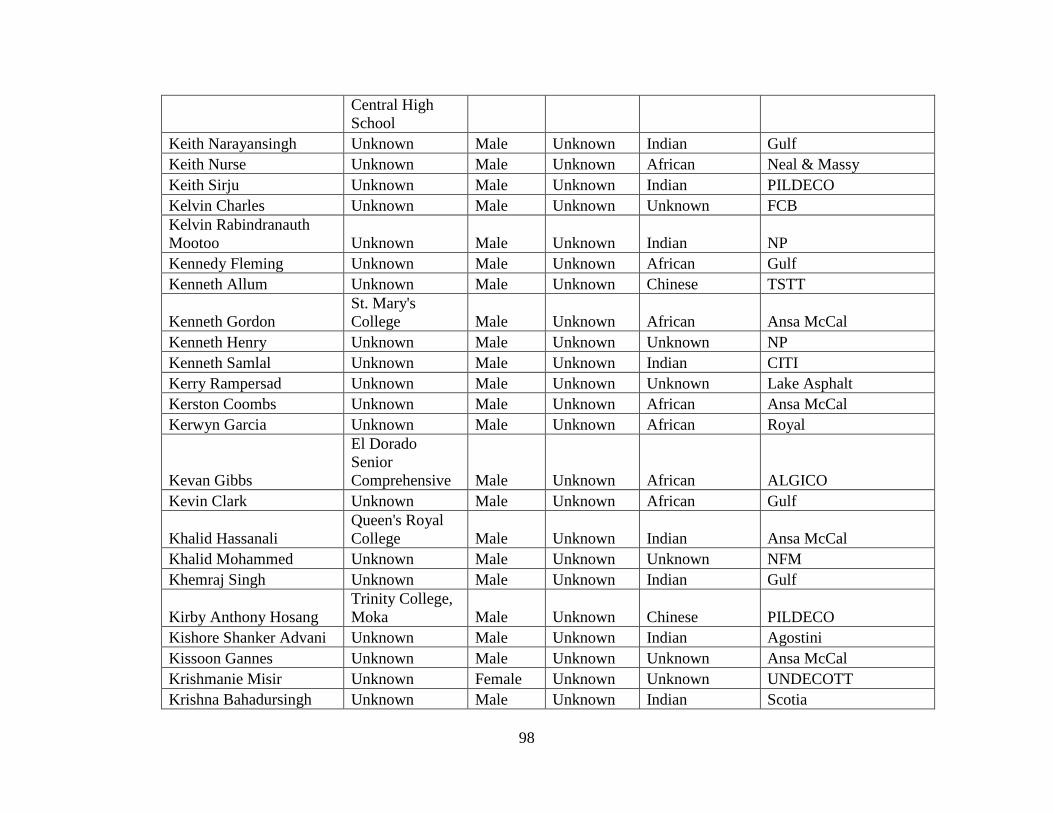
98
Central High
School
Keith Narayansingh Unknown Male Unknown Indian Gulf
Keith Nurse Unknown Male Unknown African Neal & Massy
Keith Sirju Unknown Male Unknown Indian PILDECO
Kelvin Charles Unknown Male Unknown Unknown FCB
Kelvin Rabindranauth
Mootoo Unknown Male Unknown Indian NP
Kennedy Fleming Unknown Male Unknown African Gulf
Kenneth Allum Unknown Male Unknown Chinese TSTT
Kenneth Gordon
St. Mary's
College Male Unknown African Ansa McCal
Kenneth Henry Unknown Male Unknown Unknown NP
Kenneth Samlal Unknown Male Unknown Indian CITI
Kerry Rampersad Unknown Male Unknown Unknown Lake Asphalt
Kerston Coombs Unknown Male Unknown African Ansa McCal
Kerwyn Garcia Unknown Male Unknown African Royal
Kevan Gibbs
El Dorado
Senior
Comprehensive Male Unknown African ALGICO
Kevin Clark Unknown Male Unknown African Gulf
Khalid Hassanali
Queen's Royal
College Male Unknown Indian Ansa McCal
Khalid Mohammed Unknown Male Unknown Unknown NFM
Khemraj Singh Unknown Male Unknown Indian Gulf
Kirby Anthony Hosang
Trinity College,
Moka Male Unknown Chinese PILDECO
Kishore Shanker Advani Unknown Male Unknown Indian Agostini
Kissoon Gannes Unknown Male Unknown Unknown Ansa McCal
Krishmanie Misir Unknown Female Unknown Unknown UNDECOTT
Krishna Bahadursingh Unknown Male Unknown Indian Scotia
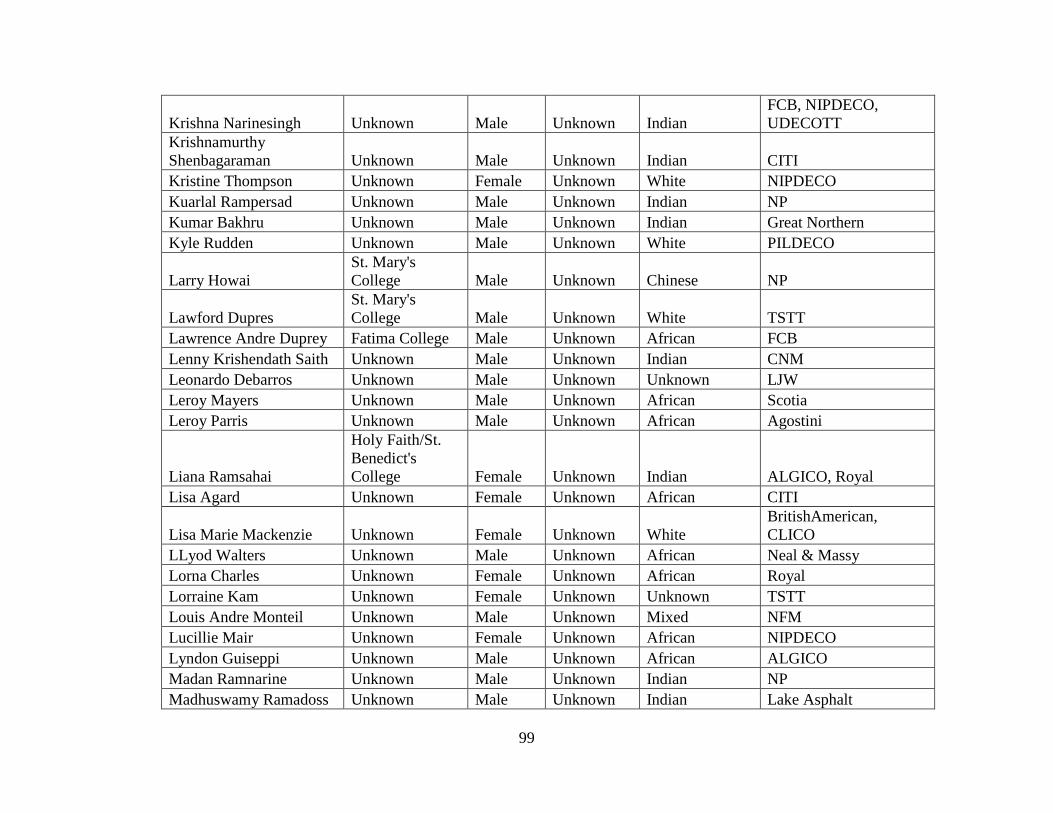
99
Krishna Narinesingh Unknown Male Unknown Indian
FCB, NIPDECO,
UDECOTT
Krishnamurthy
Shenbagaraman Unknown Male Unknown Indian CITI
Kristine Thompson Unknown Female Unknown White NIPDECO
Kuarlal Rampersad Unknown Male Unknown Indian NP
Kumar Bakhru Unknown Male Unknown Indian Great Northern
Kyle Rudden Unknown Male Unknown White PILDECO
Larry Howai
St. Mary's
College Male Unknown Chinese NP
Lawford Dupres
St. Mary's
College Male Unknown White TSTT
Lawrence Andre Duprey Fatima College Male Unknown African FCB
Lenny Krishendath Saith Unknown Male Unknown Indian CNM
Leonardo Debarros Unknown Male Unknown Unknown LJW
Leroy Mayers Unknown Male Unknown African Scotia
Leroy Parris Unknown Male Unknown African Agostini
Liana Ramsahai
Holy Faith/St.
Benedict's
College Female Unknown Indian ALGICO, Royal
Lisa Agard Unknown Female Unknown African CITI
Lisa Marie Mackenzie Unknown Female Unknown White
BritishAmerican,
CLICO
LLyod Walters Unknown Male Unknown African Neal & Massy
Lorna Charles Unknown Female Unknown African Royal
Lorraine Kam Unknown Female Unknown Unknown TSTT
Louis Andre Monteil Unknown Male Unknown Mixed NFM
Lucillie Mair Unknown Female Unknown African NIPDECO
Lyndon Guiseppi Unknown Male Unknown African ALGICO
Madan Ramnarine Unknown Male Unknown Indian NP
Madhuswamy Ramadoss Unknown Male Unknown Indian Lake Asphalt
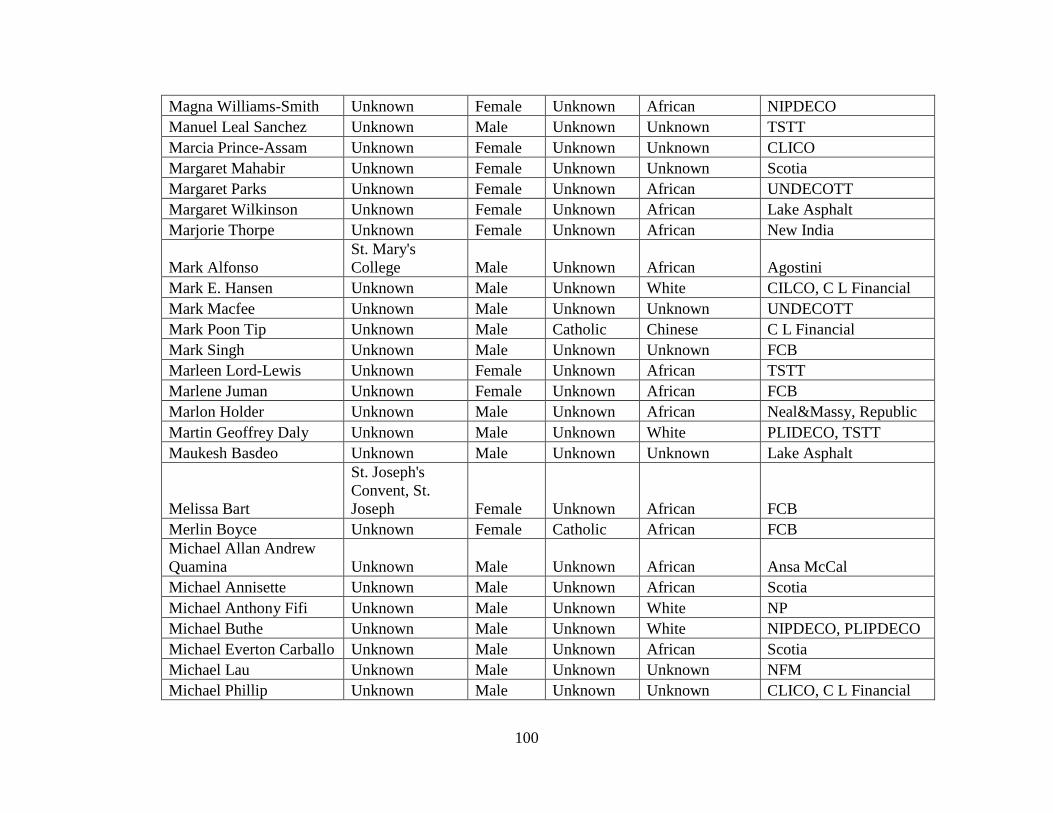
100
Magna Williams-Smith Unknown Female Unknown African NIPDECO
Manuel Leal Sanchez Unknown Male Unknown Unknown TSTT
Marcia Prince-Assam Unknown Female Unknown Unknown CLICO
Margaret Mahabir Unknown Female Unknown Unknown Scotia
Margaret Parks Unknown Female Unknown African UNDECOTT
Margaret Wilkinson Unknown Female Unknown African Lake Asphalt
Marjorie Thorpe Unknown Female Unknown African New India
Mark Alfonso
St. Mary's
College Male Unknown African Agostini
Mark E. Hansen Unknown Male Unknown White CILCO, C L Financial
Mark Macfee Unknown Male Unknown Unknown UNDECOTT
Mark Poon Tip Unknown Male Catholic Chinese C L Financial
Mark Singh Unknown Male Unknown Unknown FCB
Marleen Lord-Lewis Unknown Female Unknown African TSTT
Marlene Juman Unknown Female Unknown African FCB
Marlon Holder Unknown Male Unknown African Neal&Massy, Republic
Martin Geoffrey Daly Unknown Male Unknown White PLIDECO, TSTT
Maukesh Basdeo Unknown Male Unknown Unknown Lake Asphalt
Melissa Bart
St. Joseph's
Convent, St.
Joseph Female Unknown African FCB
Merlin Boyce Unknown Female Catholic African FCB
Michael Allan Andrew
Quamina Unknown Male Unknown African Ansa McCal
Michael Annisette Unknown Male Unknown African Scotia
Michael Anthony Fifi Unknown Male Unknown White NP
Michael Buthe Unknown Male Unknown White NIPDECO, PLIPDECO
Michael Everton Carballo Unknown Male Unknown African Scotia
Michael Lau Unknown Male Unknown Unknown NFM
Michael Phillip Unknown Male Unknown Unknown CLICO, C L Financial
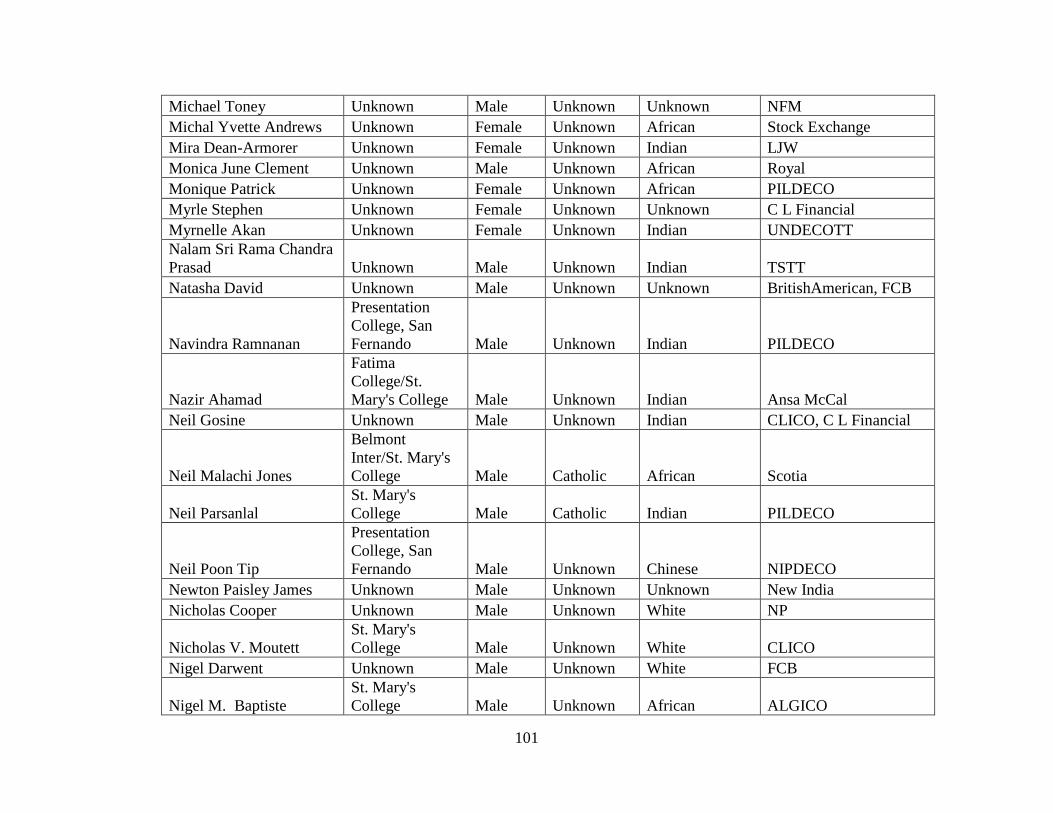
101
Michael Toney Unknown Male Unknown Unknown NFM
Michal Yvette Andrews Unknown Female Unknown African Stock Exchange
Mira Dean-Armorer Unknown Female Unknown Indian LJW
Monica June Clement Unknown Male Unknown African Royal
Monique Patrick Unknown Female Unknown African PILDECO
Myrle Stephen Unknown Female Unknown Unknown C L Financial
Myrnelle Akan Unknown Female Unknown Indian UNDECOTT
Nalam Sri Rama Chandra
Prasad Unknown Male Unknown Indian TSTT
Natasha David Unknown Male Unknown Unknown BritishAmerican, FCB
Navindra Ramnanan
Presentation
College, San
Fernando Male Unknown Indian PILDECO
Nazir Ahamad
Fatima
College/St.
Mary's College Male Unknown Indian Ansa McCal
Neil Gosine Unknown Male Unknown Indian CLICO, C L Financial
Neil Malachi Jones
Belmont
Inter/St. Mary's
College Male Catholic African Scotia
Neil Parsanlal
St. Mary's
College Male Catholic Indian PILDECO
Neil Poon Tip
Presentation
College, San
Fernando Male Unknown Chinese NIPDECO
Newton Paisley James Unknown Male Unknown Unknown New India
Nicholas Cooper Unknown Male Unknown White NP
Nicholas V. Moutett
St. Mary's
College Male Unknown White CLICO
Nigel Darwent Unknown Male Unknown White FCB
Nigel M. Baptiste
St. Mary's
College Male Unknown African ALGICO
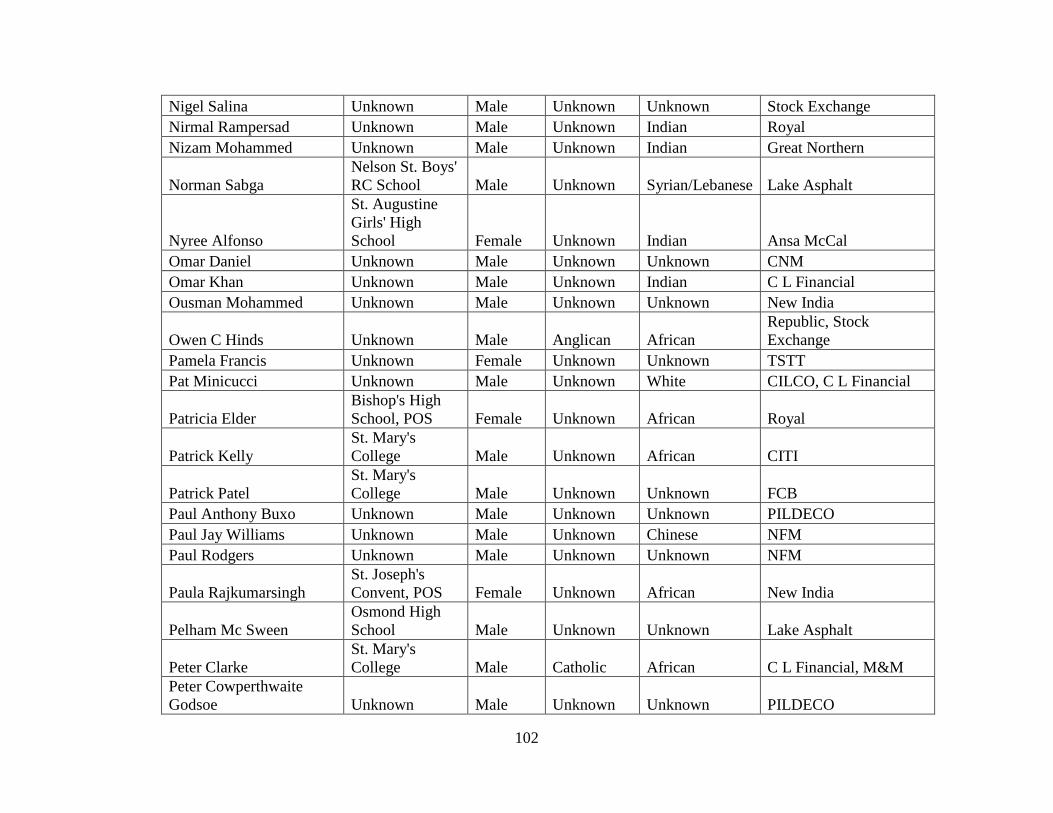
102
Nigel Salina Unknown Male Unknown Unknown Stock Exchange
Nirmal Rampersad Unknown Male Unknown Indian Royal
Nizam Mohammed Unknown Male Unknown Indian Great Northern
Norman Sabga
Nelson St. Boys'
RC School Male Unknown Syrian/Lebanese Lake Asphalt
Nyree Alfonso
St. Augustine
Girls' High
School Female Unknown Indian Ansa McCal
Omar Daniel Unknown Male Unknown Unknown CNM
Omar Khan Unknown Male Unknown Indian C L Financial
Ousman Mohammed Unknown Male Unknown Unknown New India
Owen C Hinds Unknown Male Anglican African
Republic, Stock
Exchange
Pamela Francis Unknown Female Unknown Unknown TSTT
Pat Minicucci Unknown Male Unknown White CILCO, C L Financial
Patricia Elder
Bishop's High
School, POS Female Unknown African Royal
Patrick Kelly
St. Mary's
College Male Unknown African CITI
Patrick Patel
St. Mary's
College Male Unknown Unknown FCB
Paul Anthony Buxo Unknown Male Unknown Unknown PILDECO
Paul Jay Williams Unknown Male Unknown Chinese NFM
Paul Rodgers Unknown Male Unknown Unknown NFM
Paula Rajkumarsingh
St. Joseph's
Convent, POS Female Unknown African New India
Pelham Mc Sween
Osmond High
School Male Unknown Unknown Lake Asphalt
Peter Clarke
St. Mary's
College Male Catholic African C L Financial, M&M
Peter Cowperthwaite
Godsoe Unknown Male Unknown Unknown PILDECO
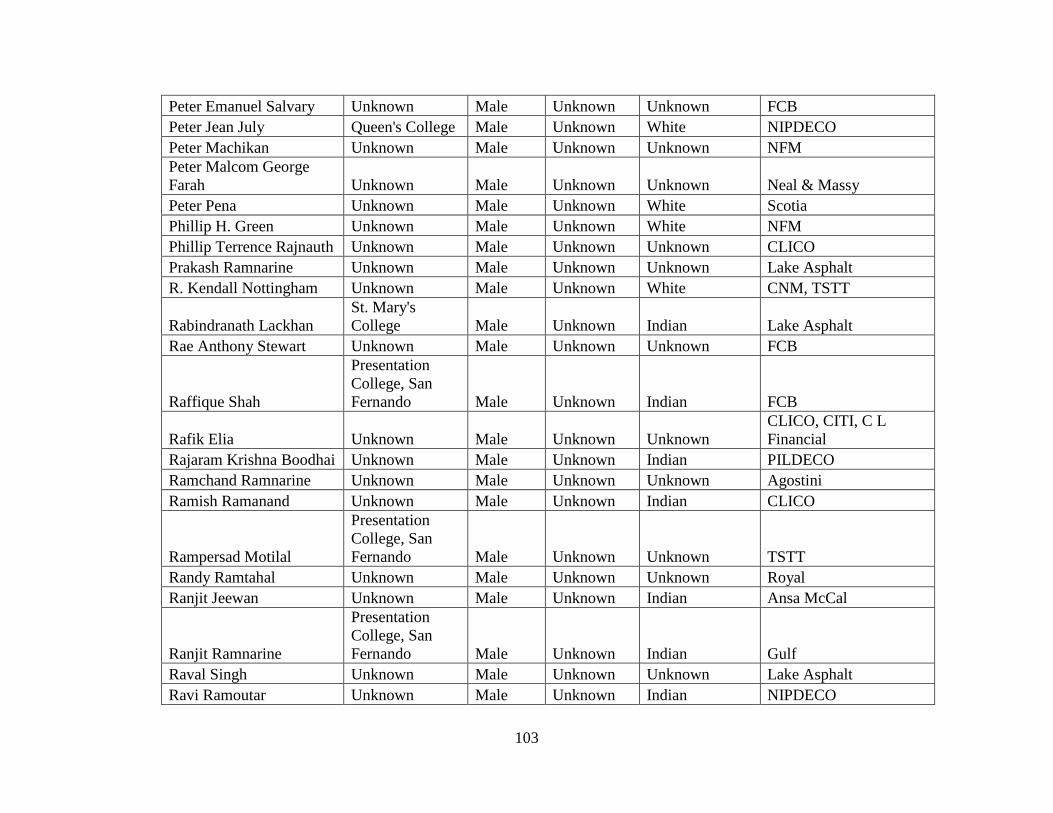
103
Peter Emanuel Salvary Unknown Male Unknown Unknown FCB
Peter Jean July Queen's College Male Unknown White NIPDECO
Peter Machikan Unknown Male Unknown Unknown NFM
Peter Malcom George
Farah Unknown Male Unknown Unknown Neal & Massy
Peter Pena Unknown Male Unknown White Scotia
Phillip H. Green Unknown Male Unknown White NFM
Phillip Terrence Rajnauth Unknown Male Unknown Unknown CLICO
Prakash Ramnarine Unknown Male Unknown Unknown Lake Asphalt
R. Kendall Nottingham Unknown Male Unknown White CNM, TSTT
Rabindranath Lackhan
St. Mary's
College Male Unknown Indian Lake Asphalt
Rae Anthony Stewart Unknown Male Unknown Unknown FCB
Raffique Shah
Presentation
College, San
Fernando Male Unknown Indian FCB
Rafik Elia Unknown Male Unknown Unknown
CLICO, CITI, C L
Financial
Rajaram Krishna Boodhai Unknown Male Unknown Indian PILDECO
Ramchand Ramnarine Unknown Male Unknown Unknown Agostini
Ramish Ramanand Unknown Male Unknown Indian CLICO
Rampersad Motilal
Presentation
College, San
Fernando Male Unknown Unknown TSTT
Randy Ramtahal Unknown Male Unknown Unknown Royal
Ranjit Jeewan Unknown Male Unknown Indian Ansa McCal
Ranjit Ramnarine
Presentation
College, San
Fernando Male Unknown Indian Gulf
Raval Singh Unknown Male Unknown Unknown Lake Asphalt
Ravi Ramoutar Unknown Male Unknown Indian NIPDECO
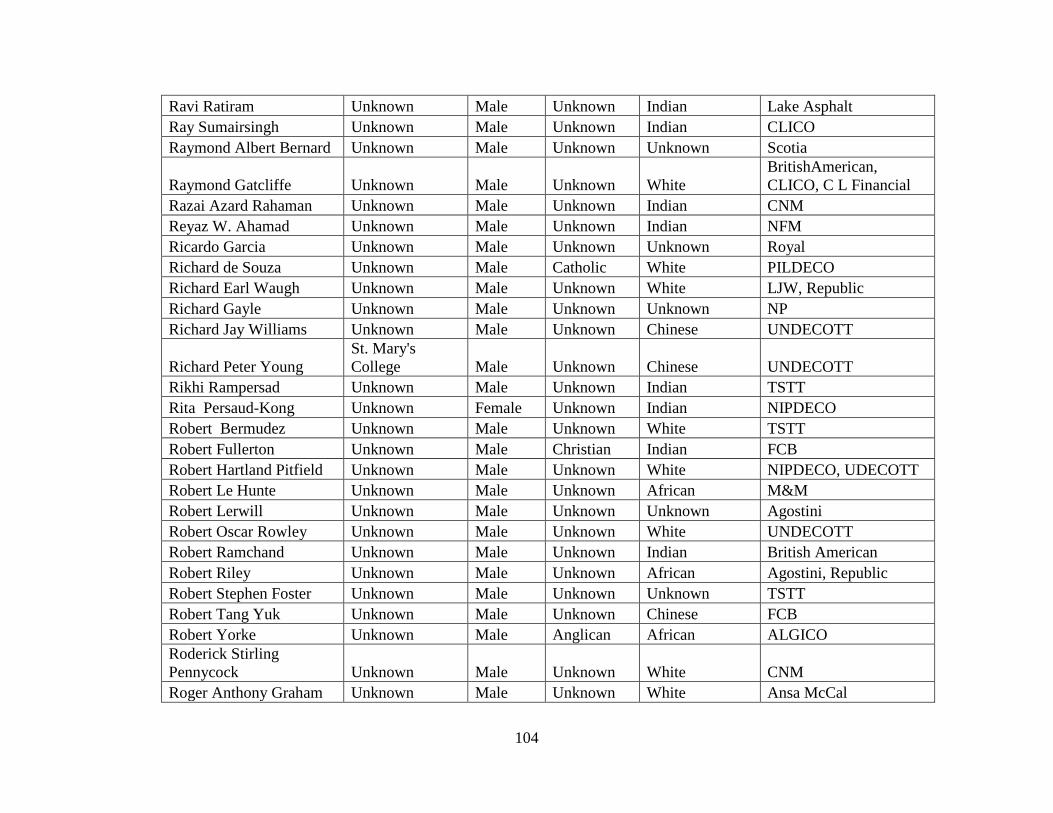
104
Ravi Ratiram Unknown Male Unknown Indian Lake Asphalt
Ray Sumairsingh Unknown Male Unknown Indian CLICO
Raymond Albert Bernard Unknown Male Unknown Unknown Scotia
Raymond Gatcliffe Unknown Male Unknown White
BritishAmerican,
CLICO, C L Financial
Razai Azard Rahaman Unknown Male Unknown Indian CNM
Reyaz W. Ahamad Unknown Male Unknown Indian NFM
Ricardo Garcia Unknown Male Unknown Unknown Royal
Richard de Souza Unknown Male Catholic White PILDECO
Richard Earl Waugh Unknown Male Unknown White LJW, Republic
Richard Gayle Unknown Male Unknown Unknown NP
Richard Jay Williams Unknown Male Unknown Chinese UNDECOTT
Richard Peter Young
St. Mary's
College Male Unknown Chinese UNDECOTT
Rikhi Rampersad Unknown Male Unknown Indian TSTT
Rita Persaud-Kong Unknown Female Unknown Indian NIPDECO
Robert Bermudez Unknown Male Unknown White TSTT
Robert Fullerton Unknown Male Christian Indian FCB
Robert Hartland Pitfield Unknown Male Unknown White NIPDECO, UDECOTT
Robert Le Hunte Unknown Male Unknown African M&M
Robert Lerwill Unknown Male Unknown Unknown Agostini
Robert Oscar Rowley Unknown Male Unknown White UNDECOTT
Robert Ramchand Unknown Male Unknown Indian British American
Robert Riley Unknown Male Unknown African Agostini, Republic
Robert Stephen Foster Unknown Male Unknown Unknown TSTT
Robert Tang Yuk Unknown Male Unknown Chinese FCB
Robert Yorke Unknown Male Anglican African ALGICO
Roderick Stirling
Pennycock Unknown Male Unknown White CNM
Roger Anthony Graham Unknown Male Unknown White Ansa McCal
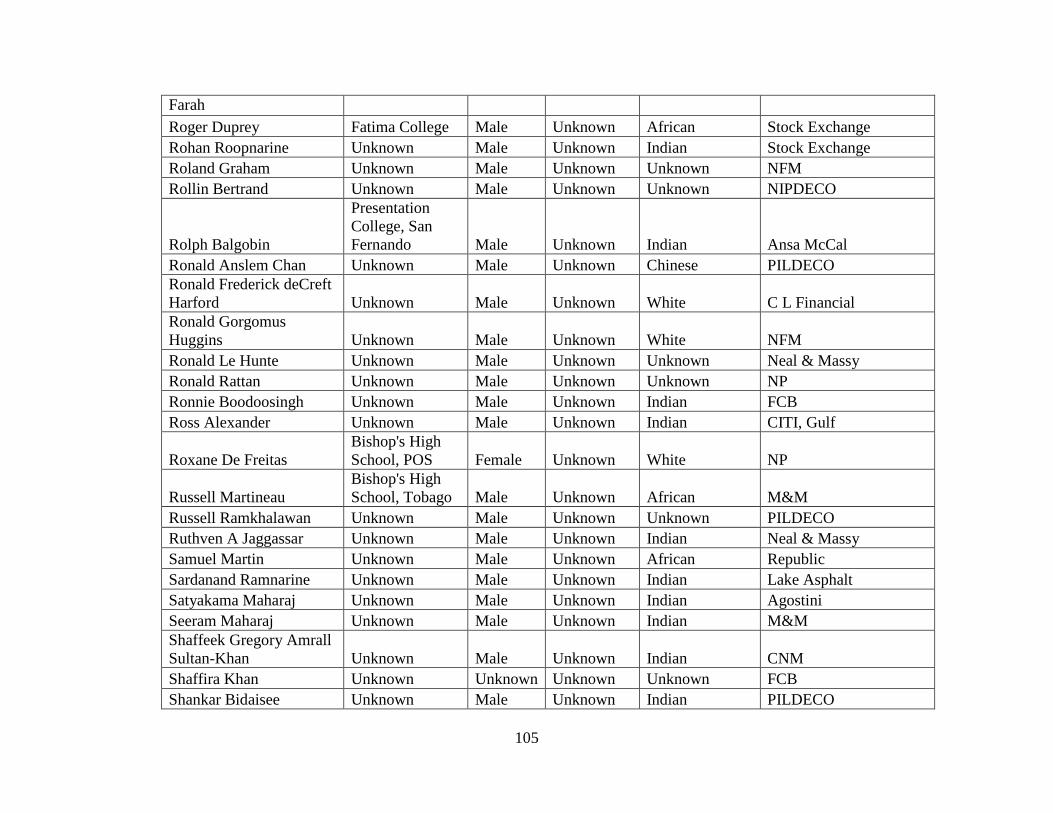
105
Farah
Roger Duprey Fatima College Male Unknown African Stock Exchange
Rohan Roopnarine Unknown Male Unknown Indian Stock Exchange
Roland Graham Unknown Male Unknown Unknown NFM
Rollin Bertrand Unknown Male Unknown Unknown NIPDECO
Rolph Balgobin
Presentation
College, San
Fernando Male Unknown Indian Ansa McCal
Ronald Anslem Chan Unknown Male Unknown Chinese PILDECO
Ronald Frederick deCreft
Harford Unknown Male Unknown White C L Financial
Ronald Gorgomus
Huggins Unknown Male Unknown White NFM
Ronald Le Hunte Unknown Male Unknown Unknown Neal & Massy
Ronald Rattan Unknown Male Unknown Unknown NP
Ronnie Boodoosingh Unknown Male Unknown Indian FCB
Ross Alexander Unknown Male Unknown Indian CITI, Gulf
Roxane De Freitas
Bishop's High
School, POS Female Unknown White NP
Russell Martineau
Bishop's High
School, Tobago Male Unknown African M&M
Russell Ramkhalawan Unknown Male Unknown Unknown PILDECO
Ruthven A Jaggassar Unknown Male Unknown Indian Neal & Massy
Samuel Martin Unknown Male Unknown African Republic
Sardanand Ramnarine Unknown Male Unknown Indian Lake Asphalt
Satyakama Maharaj Unknown Male Unknown Indian Agostini
Seeram Maharaj Unknown Male Unknown Indian M&M
Shaffeek Gregory Amrall
Sultan-Khan Unknown Male Unknown Indian CNM
Shaffira Khan Unknown Unknown Unknown Unknown FCB
Shankar Bidaisee Unknown Male Unknown Indian PILDECO
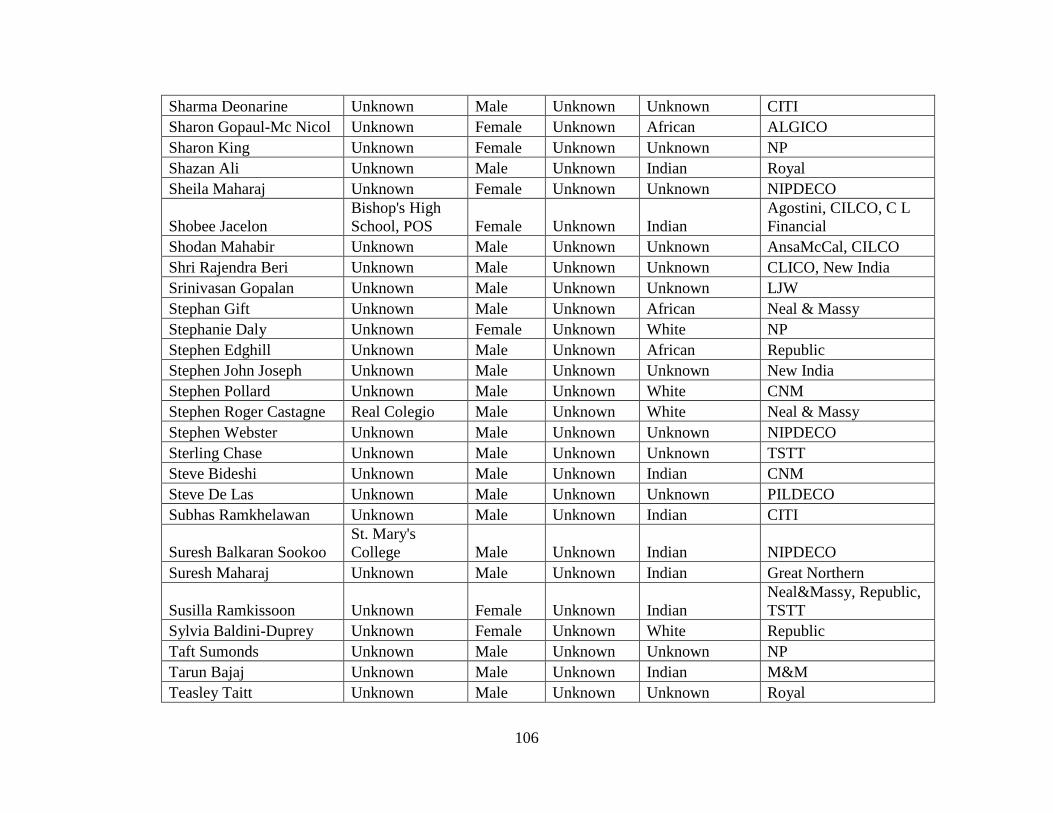
106
Sharma Deonarine Unknown Male Unknown Unknown CITI
Sharon Gopaul-Mc Nicol Unknown Female Unknown African ALGICO
Sharon King Unknown Female Unknown Unknown NP
Shazan Ali Unknown Male Unknown Indian Royal
Sheila Maharaj Unknown Female Unknown Unknown NIPDECO
Shobee Jacelon
Bishop's High
School, POS Female Unknown Indian
Agostini, CILCO, C L
Financial
Shodan Mahabir Unknown Male Unknown Unknown AnsaMcCal, CILCO
Shri Rajendra Beri Unknown Male Unknown Unknown CLICO, New India
Srinivasan Gopalan Unknown Male Unknown Unknown LJW
Stephan Gift Unknown Male Unknown African Neal & Massy
Stephanie Daly Unknown Female Unknown White NP
Stephen Edghill Unknown Male Unknown African Republic
Stephen John Joseph Unknown Male Unknown Unknown New India
Stephen Pollard Unknown Male Unknown White CNM
Stephen Roger Castagne Real Colegio Male Unknown White Neal & Massy
Stephen Webster Unknown Male Unknown Unknown NIPDECO
Sterling Chase Unknown Male Unknown Unknown TSTT
Steve Bideshi Unknown Male Unknown Indian CNM
Steve De Las Unknown Male Unknown Unknown PILDECO
Subhas Ramkhelawan Unknown Male Unknown Indian CITI
Suresh Balkaran Sookoo
St. Mary's
College Male Unknown Indian NIPDECO
Suresh Maharaj Unknown Male Unknown Indian Great Northern
Susilla Ramkissoon Unknown Female Unknown Indian
Neal&Massy, Republic,
TSTT
Sylvia Baldini-Duprey Unknown Female Unknown White Republic
Taft Sumonds Unknown Male Unknown Unknown NP
Tarun Bajaj Unknown Male Unknown Indian M&M
Teasley Taitt Unknown Male Unknown Unknown Royal
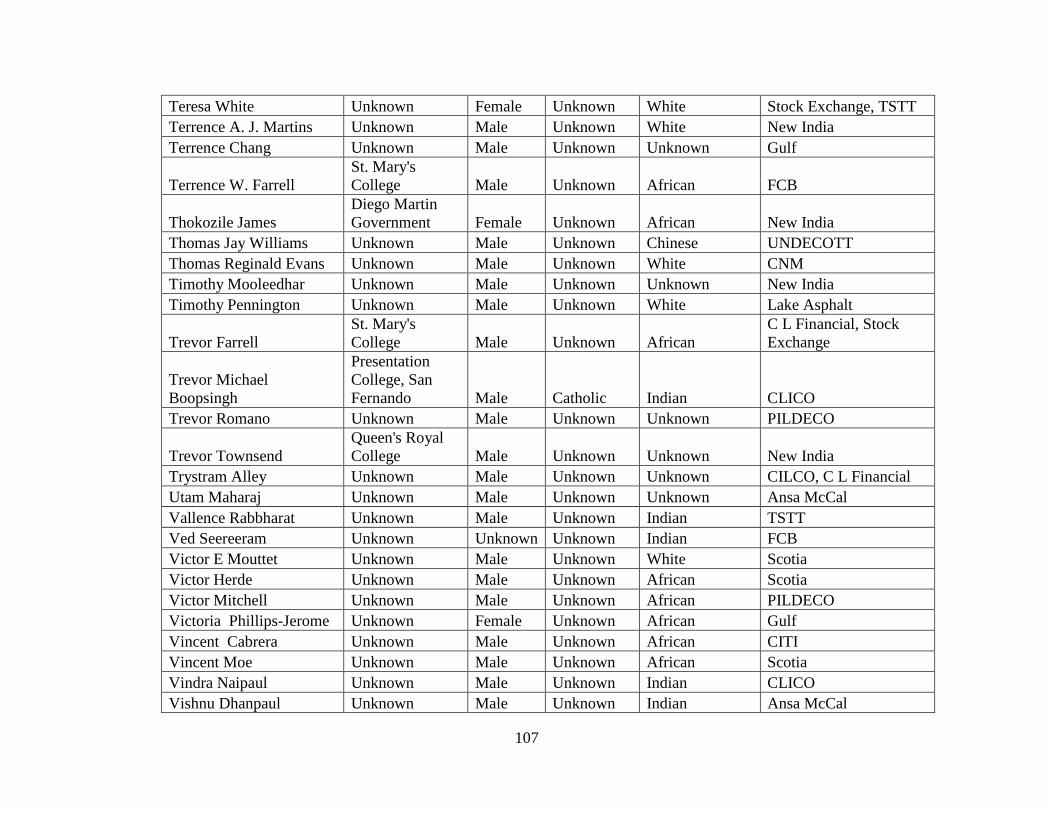
107
Teresa White Unknown Female Unknown White Stock Exchange, TSTT
Terrence A. J. Martins Unknown Male Unknown White New India
Terrence Chang Unknown Male Unknown Unknown Gulf
Terrence W. Farrell
St. Mary's
College Male Unknown African FCB
Thokozile James
Diego Martin
Government Female Unknown African New India
Thomas Jay Williams Unknown Male Unknown Chinese UNDECOTT
Thomas Reginald Evans Unknown Male Unknown White CNM
Timothy Mooleedhar Unknown Male Unknown Unknown New India
Timothy Pennington Unknown Male Unknown White Lake Asphalt
Trevor Farrell
St. Mary's
College Male Unknown African
C L Financial, Stock
Exchange
Trevor Michael
Boopsingh
Presentation
College, San
Fernando Male Catholic Indian CLICO
Trevor Romano Unknown Male Unknown Unknown PILDECO
Trevor Townsend
Queen's Royal
College Male Unknown Unknown New India
Trystram Alley Unknown Male Unknown Unknown CILCO, C L Financial
Utam Maharaj Unknown Male Unknown Unknown Ansa McCal
Vallence Rabbharat Unknown Male Unknown Indian TSTT
Ved Seereeram Unknown Unknown Unknown Indian FCB
Victor E Mouttet Unknown Male Unknown White Scotia
Victor Herde Unknown Male Unknown African Scotia
Victor Mitchell Unknown Male Unknown African PILDECO
Victoria Phillips-Jerome Unknown Female Unknown African Gulf
Vincent Cabrera Unknown Male Unknown African CITI
Vincent Moe Unknown Male Unknown African Scotia
Vindra Naipaul Unknown Male Unknown Indian CLICO
Vishnu Dhanpaul Unknown Male Unknown Indian Ansa McCal
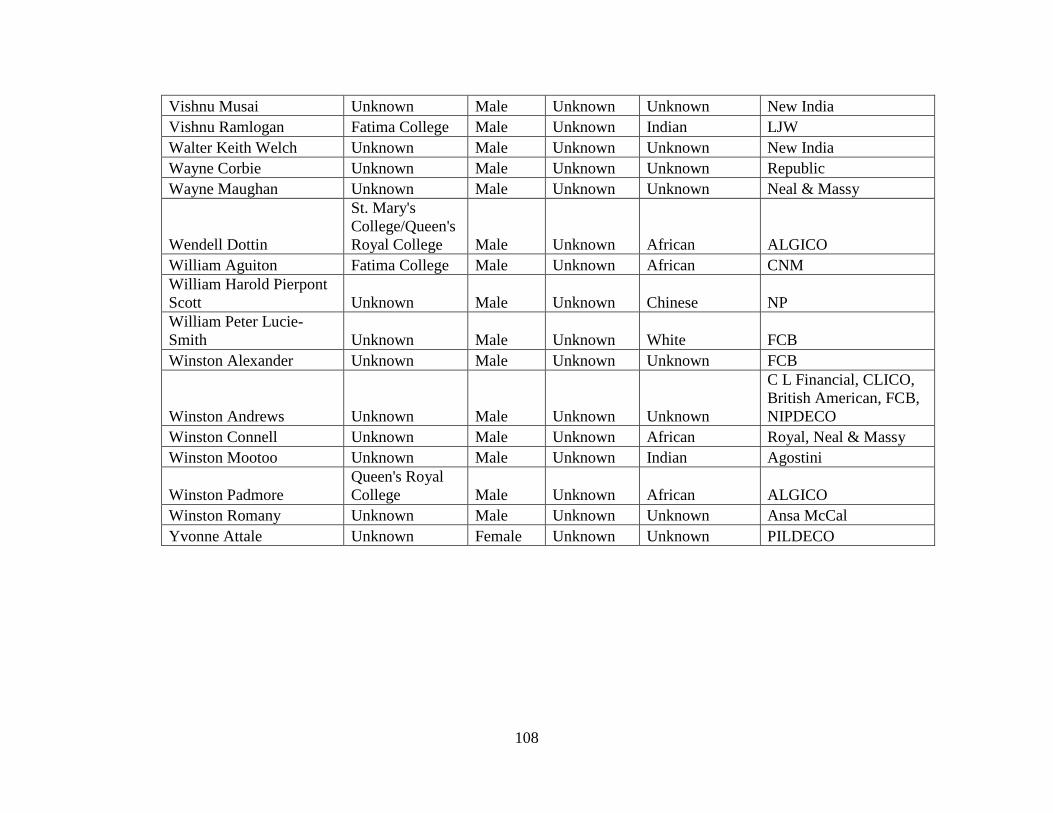
108
Vishnu Musai Unknown Male Unknown Unknown New India
Vishnu Ramlogan Fatima College Male Unknown Indian LJW
Walter Keith Welch Unknown Male Unknown Unknown New India
Wayne Corbie Unknown Male Unknown Unknown Republic
Wayne Maughan Unknown Male Unknown Unknown Neal & Massy
Wendell Dottin
St. Mary's
College/Queen's
Royal College Male Unknown African ALGICO
William Aguiton Fatima College Male Unknown African CNM
William Harold Pierpont
Scott Unknown Male Unknown Chinese NP
William Peter Lucie-
Smith Unknown Male Unknown White FCB
Winston Alexander Unknown Male Unknown Unknown FCB
Winston Andrews Unknown Male Unknown Unknown
C L Financial, CLICO,
British American, FCB,
NIPDECO
Winston Connell Unknown Male Unknown African Royal, Neal & Massy
Winston Mootoo Unknown Male Unknown Indian Agostini
Winston Padmore
Queen's Royal
College Male Unknown African ALGICO
Winston Romany Unknown Male Unknown Unknown Ansa McCal
Yvonne Attale Unknown Female Unknown Unknown PILDECO
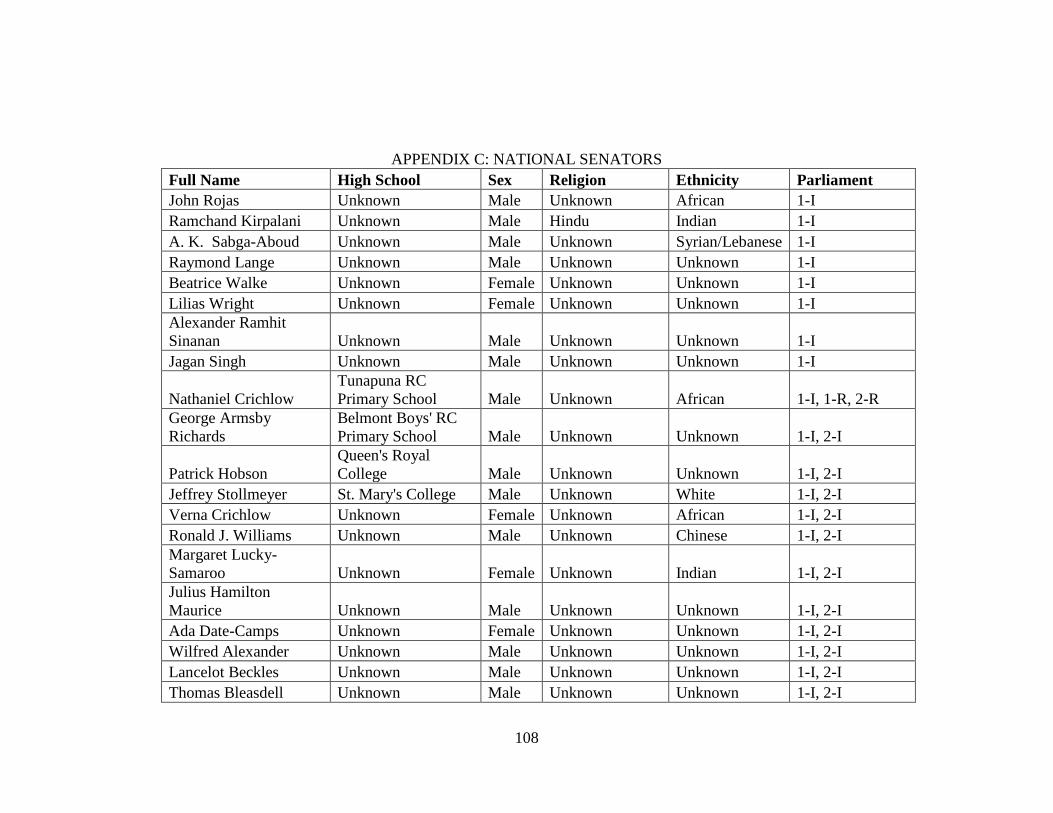
108
APPENDIX C: NATIONAL SENATORS
Full Name High School Sex Religion Ethnicity Parliament
John Rojas Unknown Male Unknown African 1-I
Ramchand Kirpalani Unknown Male Hindu Indian 1-I
A. K. Sabga-Aboud Unknown Male Unknown Syrian/Lebanese 1-I
Raymond Lange Unknown Male Unknown Unknown 1-I
Beatrice Walke Unknown Female Unknown Unknown 1-I
Lilias Wright Unknown Female Unknown Unknown 1-I
Alexander Ramhit
Sinanan Unknown Male Unknown Unknown 1-I
Jagan Singh Unknown Male Unknown Unknown 1-I
Nathaniel Crichlow
Tunapuna RC
Primary School Male Unknown African 1-I, 1-R, 2-R
George Armsby
Richards
Belmont Boys' RC
Primary School Male Unknown Unknown 1-I, 2-I
Patrick Hobson
Queen's Royal
College Male Unknown Unknown 1-I, 2-I
Jeffrey Stollmeyer St. Mary's College Male Unknown White 1-I, 2-I
Verna Crichlow Unknown Female Unknown African 1-I, 2-I
Ronald J. Williams Unknown Male Unknown Chinese 1-I, 2-I
Margaret Lucky-
Samaroo Unknown Female Unknown Indian 1-I, 2-I
Julius Hamilton
Maurice Unknown Male Unknown Unknown 1-I, 2-I
Ada Date-Camps Unknown Female Unknown Unknown 1-I, 2-I
Wilfred Alexander Unknown Male Unknown Unknown 1-I, 2-I
Lancelot Beckles Unknown Male Unknown Unknown 1-I, 2-I
Thomas Bleasdell Unknown Male Unknown Unknown 1-I, 2-I
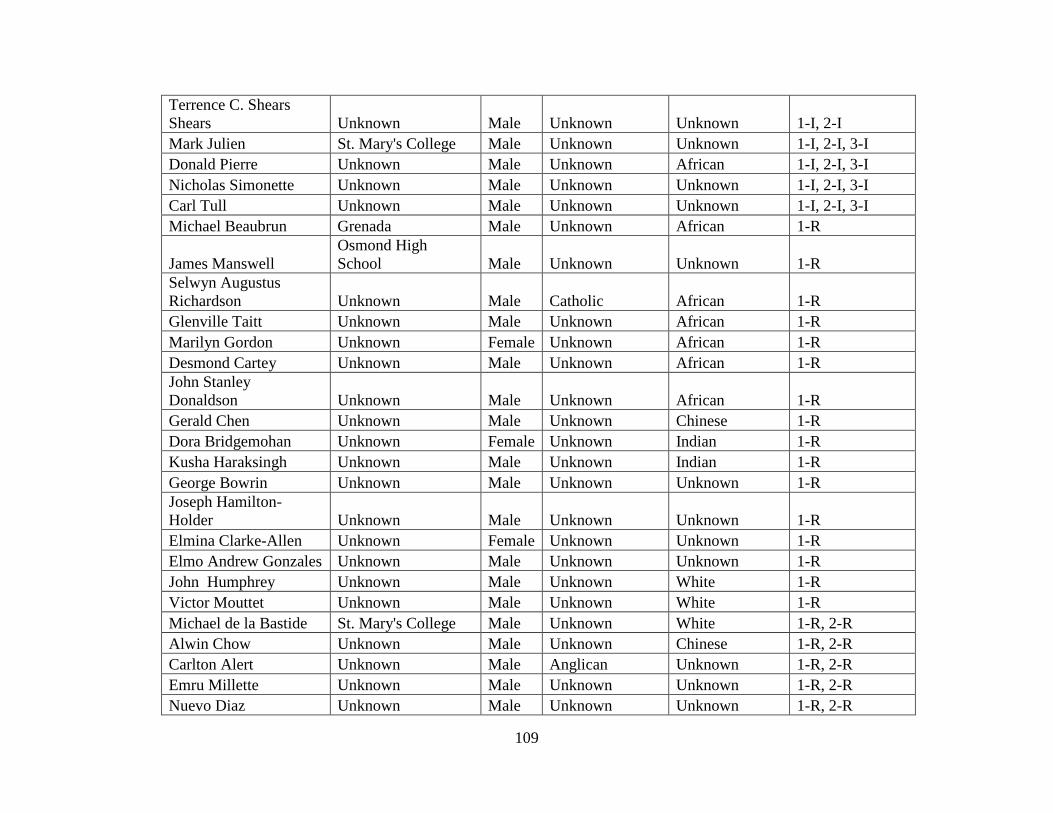
109
Terrence C. Shears
Shears Unknown Male Unknown Unknown 1-I, 2-I
Mark Julien St. Mary's College Male Unknown Unknown 1-I, 2-I, 3-I
Donald Pierre Unknown Male Unknown African 1-I, 2-I, 3-I
Nicholas Simonette Unknown Male Unknown Unknown 1-I, 2-I, 3-I
Carl Tull Unknown Male Unknown Unknown 1-I, 2-I, 3-I
Michael Beaubrun Grenada Male Unknown African 1-R
James Manswell
Osmond High
School Male Unknown Unknown 1-R
Selwyn Augustus
Richardson Unknown Male Catholic African 1-R
Glenville Taitt Unknown Male Unknown African 1-R
Marilyn Gordon Unknown Female Unknown African 1-R
Desmond Cartey Unknown Male Unknown African 1-R
John Stanley
Donaldson Unknown Male Unknown African 1-R
Gerald Chen Unknown Male Unknown Chinese 1-R
Dora Bridgemohan Unknown Female Unknown Indian 1-R
Kusha Haraksingh Unknown Male Unknown Indian 1-R
George Bowrin Unknown Male Unknown Unknown 1-R
Joseph Hamilton-
Holder Unknown Male Unknown Unknown 1-R
Elmina Clarke-Allen Unknown Female Unknown Unknown 1-R
Elmo Andrew Gonzales Unknown Male Unknown Unknown 1-R
John Humphrey Unknown Male Unknown White 1-R
Victor Mouttet Unknown Male Unknown White 1-R
Michael de la Bastide St. Mary's College Male Unknown White 1-R, 2-R
Alwin Chow Unknown Male Unknown Chinese 1-R, 2-R
Carlton Alert Unknown Male Anglican Unknown 1-R, 2-R
Emru Millette Unknown Male Unknown Unknown 1-R, 2-R
Nuevo Diaz Unknown Male Unknown Unknown 1-R, 2-R
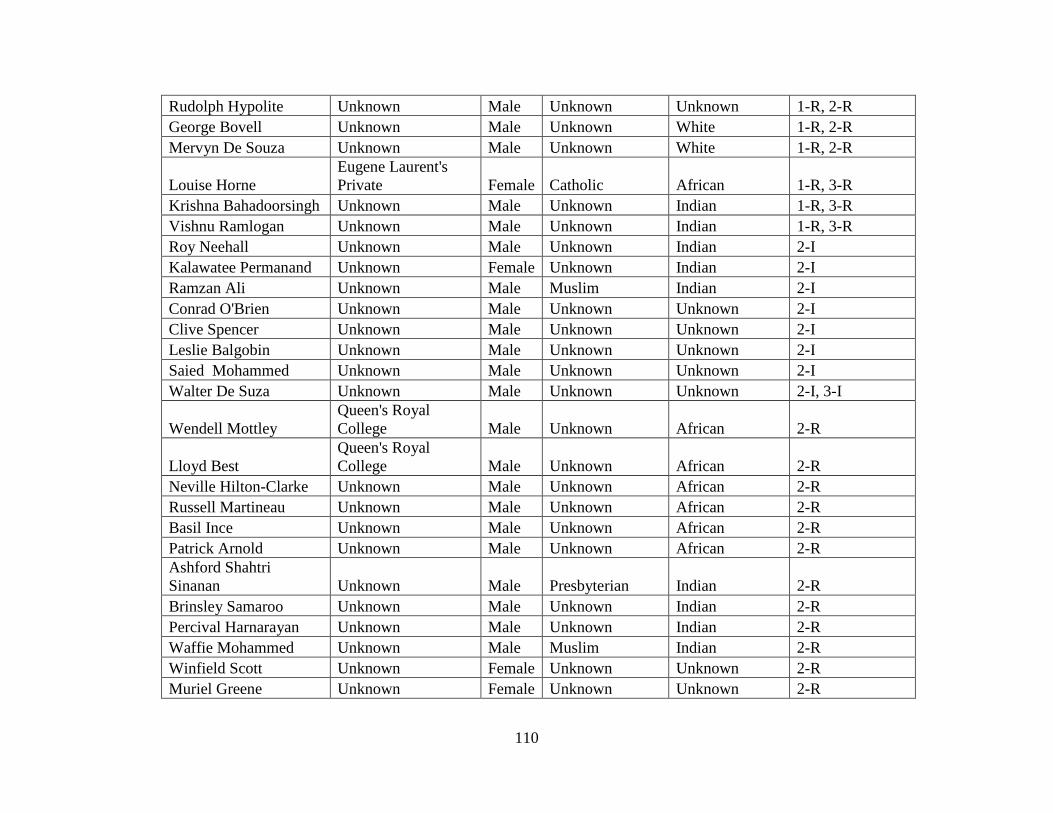
110
Rudolph Hypolite Unknown Male Unknown Unknown 1-R, 2-R
George Bovell Unknown Male Unknown White 1-R, 2-R
Mervyn De Souza Unknown Male Unknown White 1-R, 2-R
Louise Horne
Eugene Laurent's
Private Female Catholic African 1-R, 3-R
Krishna Bahadoorsingh Unknown Male Unknown Indian 1-R, 3-R
Vishnu Ramlogan Unknown Male Unknown Indian 1-R, 3-R
Roy Neehall Unknown Male Unknown Indian 2-I
Kalawatee Permanand Unknown Female Unknown Indian 2-I
Ramzan Ali Unknown Male Muslim Indian 2-I
Conrad O'Brien Unknown Male Unknown Unknown 2-I
Clive Spencer Unknown Male Unknown Unknown 2-I
Leslie Balgobin Unknown Male Unknown Unknown 2-I
Saied Mohammed Unknown Male Unknown Unknown 2-I
Walter De Suza Unknown Male Unknown Unknown 2-I, 3-I
Wendell Mottley
Queen's Royal
College Male Unknown African 2-R
Lloyd Best
Queen's Royal
College Male Unknown African 2-R
Neville Hilton-Clarke Unknown Male Unknown African 2-R
Russell Martineau Unknown Male Unknown African 2-R
Basil Ince Unknown Male Unknown African 2-R
Patrick Arnold Unknown Male Unknown African 2-R
Ashford Shahtri
Sinanan Unknown Male Presbyterian Indian 2-R
Brinsley Samaroo Unknown Male Unknown Indian 2-R
Percival Harnarayan Unknown Male Unknown Indian 2-R
Waffie Mohammed Unknown Male Muslim Indian 2-R
Winfield Scott Unknown Female Unknown Unknown 2-R
Muriel Greene Unknown Female Unknown Unknown 2-R
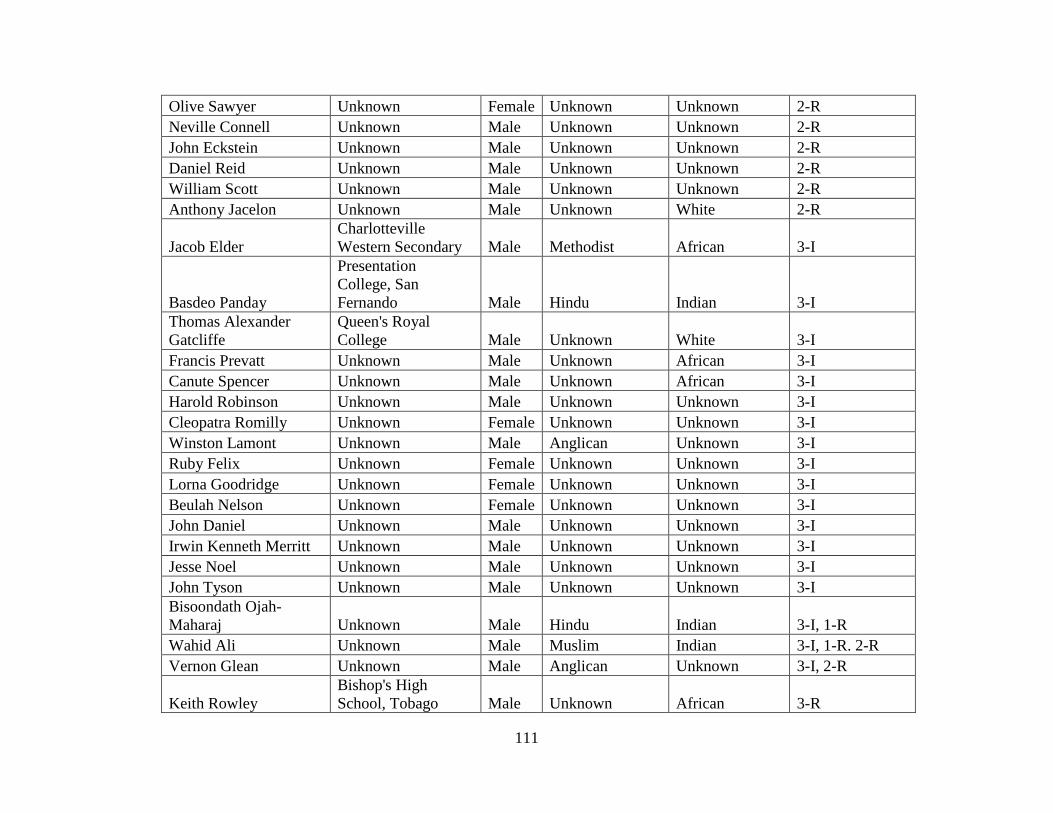
111
Olive Sawyer Unknown Female Unknown Unknown 2-R
Neville Connell Unknown Male Unknown Unknown 2-R
John Eckstein Unknown Male Unknown Unknown 2-R
Daniel Reid Unknown Male Unknown Unknown 2-R
William Scott Unknown Male Unknown Unknown 2-R
Anthony Jacelon Unknown Male Unknown White 2-R
Jacob Elder
Charlotteville
Western Secondary Male Methodist African 3-I
Basdeo Panday
Presentation
College, San
Fernando Male Hindu Indian 3-I
Thomas Alexander
Gatcliffe
Queen's Royal
College Male Unknown White 3-I
Francis Prevatt Unknown Male Unknown African 3-I
Canute Spencer Unknown Male Unknown African 3-I
Harold Robinson Unknown Male Unknown Unknown 3-I
Cleopatra Romilly Unknown Female Unknown Unknown 3-I
Winston Lamont Unknown Male Anglican Unknown 3-I
Ruby Felix Unknown Female Unknown Unknown 3-I
Lorna Goodridge Unknown Female Unknown Unknown 3-I
Beulah Nelson Unknown Female Unknown Unknown 3-I
John Daniel Unknown Male Unknown Unknown 3-I
Irwin Kenneth Merritt Unknown Male Unknown Unknown 3-I
Jesse Noel Unknown Male Unknown Unknown 3-I
John Tyson Unknown Male Unknown Unknown 3-I
Bisoondath Ojah-
Maharaj Unknown Male Hindu Indian 3-I, 1-R
Wahid Ali Unknown Male Muslim Indian 3-I, 1-R. 2-R
Vernon Glean Unknown Male Anglican Unknown 3-I, 2-R
Keith Rowley
Bishop's High
School, Tobago Male Unknown African 3-R
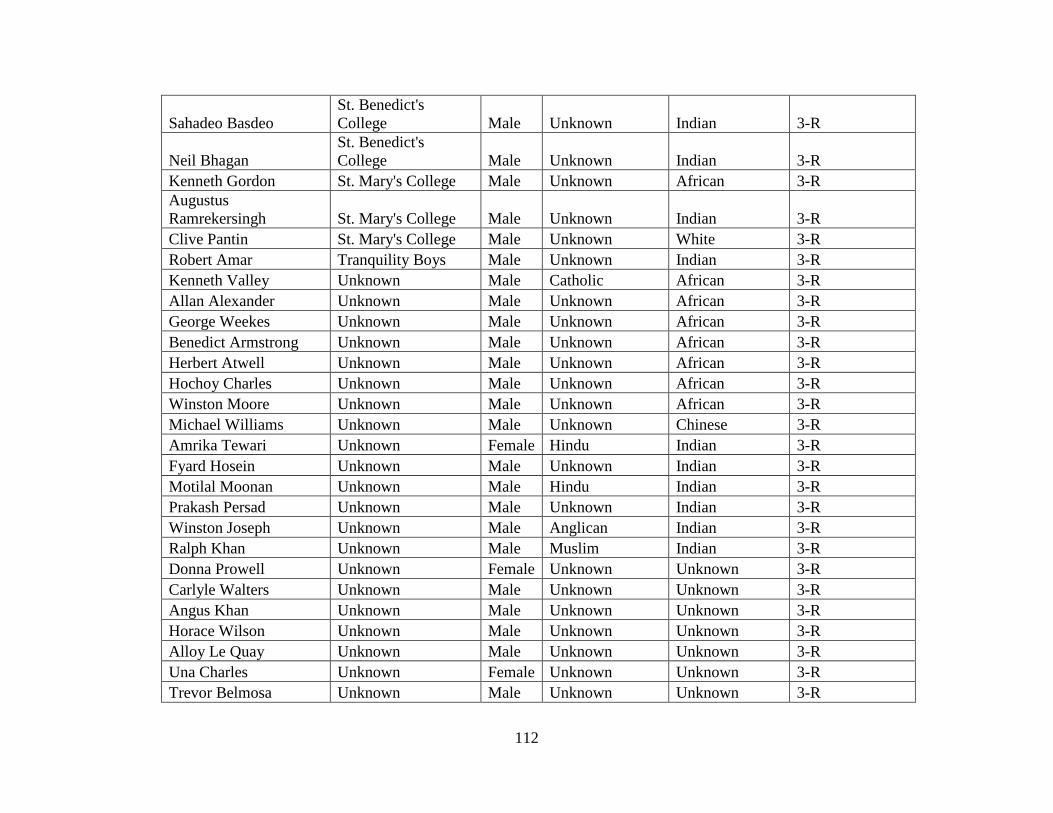
112
Sahadeo Basdeo
St. Benedict's
College Male Unknown Indian 3-R
Neil Bhagan
St. Benedict's
College Male Unknown Indian 3-R
Kenneth Gordon St. Mary's College Male Unknown African 3-R
Augustus
Ramrekersingh St. Mary's College Male Unknown Indian 3-R
Clive Pantin St. Mary's College Male Unknown White 3-R
Robert Amar Tranquility Boys Male Unknown Indian 3-R
Kenneth Valley Unknown Male Catholic African 3-R
Allan Alexander Unknown Male Unknown African 3-R
George Weekes Unknown Male Unknown African 3-R
Benedict Armstrong Unknown Male Unknown African 3-R
Herbert Atwell Unknown Male Unknown African 3-R
Hochoy Charles Unknown Male Unknown African 3-R
Winston Moore Unknown Male Unknown African 3-R
Michael Williams Unknown Male Unknown Chinese 3-R
Amrika Tewari Unknown Female Hindu Indian 3-R
Fyard Hosein Unknown Male Unknown Indian 3-R
Motilal Moonan Unknown Male Hindu Indian 3-R
Prakash Persad Unknown Male Unknown Indian 3-R
Winston Joseph Unknown Male Anglican Indian 3-R
Ralph Khan Unknown Male Muslim Indian 3-R
Donna Prowell Unknown Female Unknown Unknown 3-R
Carlyle Walters Unknown Male Unknown Unknown 3-R
Angus Khan Unknown Male Unknown Unknown 3-R
Horace Wilson Unknown Male Unknown Unknown 3-R
Alloy Le Quay Unknown Male Unknown Unknown 3-R
Una Charles Unknown Female Unknown Unknown 3-R
Trevor Belmosa Unknown Male Unknown Unknown 3-R
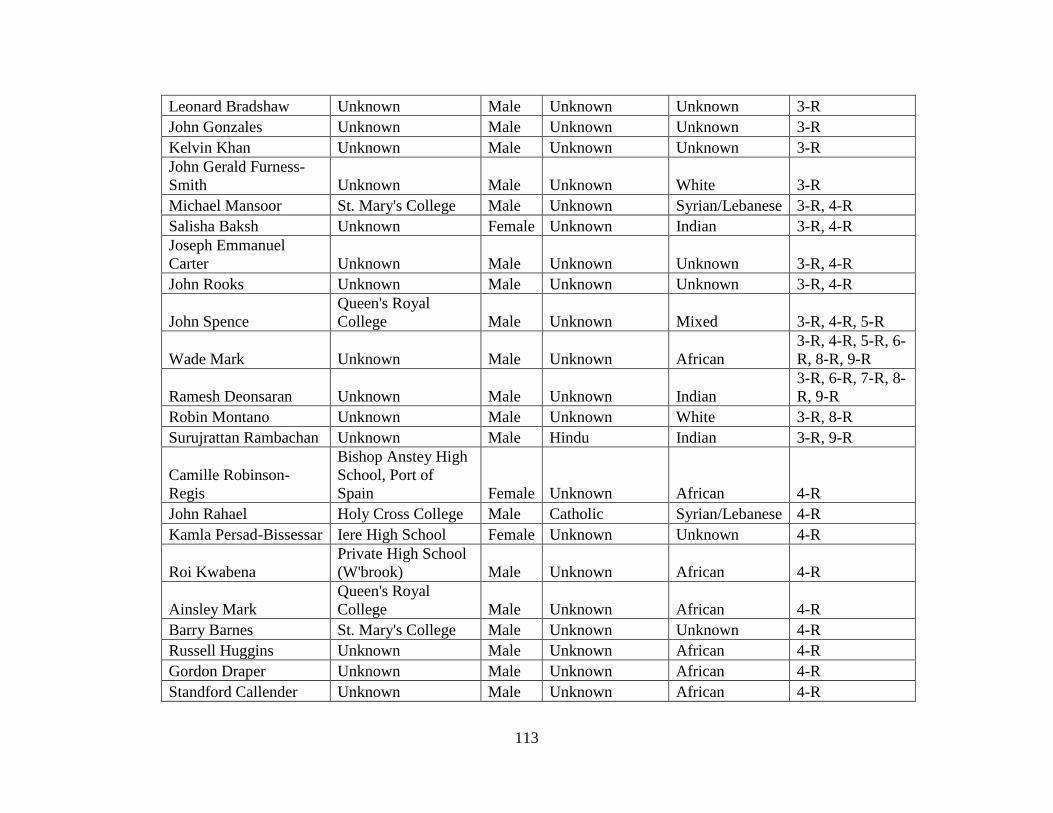
113
Leonard Bradshaw Unknown Male Unknown Unknown 3-R
John Gonzales Unknown Male Unknown Unknown 3-R
Kelvin Khan Unknown Male Unknown Unknown 3-R
John Gerald Furness-
Smith Unknown Male Unknown White 3-R
Michael Mansoor St. Mary's College Male Unknown Syrian/Lebanese 3-R, 4-R
Salisha Baksh Unknown Female Unknown Indian 3-R, 4-R
Joseph Emmanuel
Carter Unknown Male Unknown Unknown 3-R, 4-R
John Rooks Unknown Male Unknown Unknown 3-R, 4-R
John Spence
Queen's Royal
College Male Unknown Mixed 3-R, 4-R, 5-R
Wade Mark Unknown Male Unknown African
3-R, 4-R, 5-R, 6-
R, 8-R, 9-R
Ramesh Deonsaran Unknown Male Unknown Indian
3-R, 6-R, 7-R, 8-
R, 9-R
Robin Montano Unknown Male Unknown White 3-R, 8-R
Surujrattan Rambachan Unknown Male Hindu Indian 3-R, 9-R
Camille Robinson-
Regis
Bishop Anstey High
School, Port of
Spain Female Unknown African 4-R
John Rahael Holy Cross College Male Catholic Syrian/Lebanese 4-R
Kamla Persad-Bissessar Iere High School Female Unknown Unknown 4-R
Roi Kwabena
Private High School
(W'brook) Male Unknown African 4-R
Ainsley Mark
Queen's Royal
College Male Unknown African 4-R
Barry Barnes St. Mary's College Male Unknown Unknown 4-R
Russell Huggins Unknown Male Unknown African 4-R
Gordon Draper Unknown Male Unknown African 4-R
Standford Callender Unknown Male Unknown African 4-R
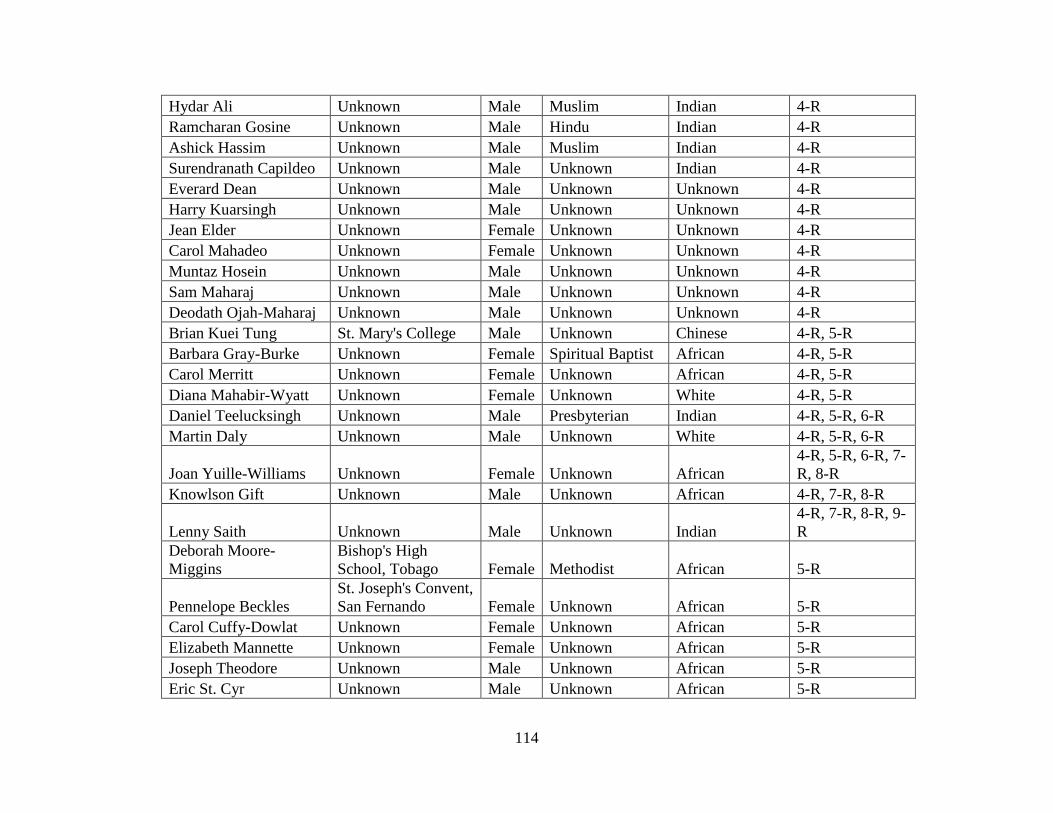
114
Hydar Ali Unknown Male Muslim Indian 4-R
Ramcharan Gosine Unknown Male Hindu Indian 4-R
Ashick Hassim Unknown Male Muslim Indian 4-R
Surendranath Capildeo Unknown Male Unknown Indian 4-R
Everard Dean Unknown Male Unknown Unknown 4-R
Harry Kuarsingh Unknown Male Unknown Unknown 4-R
Jean Elder Unknown Female Unknown Unknown 4-R
Carol Mahadeo Unknown Female Unknown Unknown 4-R
Muntaz Hosein Unknown Male Unknown Unknown 4-R
Sam Maharaj Unknown Male Unknown Unknown 4-R
Deodath Ojah-Maharaj Unknown Male Unknown Unknown 4-R
Brian Kuei Tung St. Mary's College Male Unknown Chinese 4-R, 5-R
Barbara Gray-Burke Unknown Female Spiritual Baptist African 4-R, 5-R
Carol Merritt Unknown Female Unknown African 4-R, 5-R
Diana Mahabir-Wyatt Unknown Female Unknown White 4-R, 5-R
Daniel Teelucksingh Unknown Male Presbyterian Indian 4-R, 5-R, 6-R
Martin Daly Unknown Male Unknown White 4-R, 5-R, 6-R
Joan Yuille-Williams Unknown Female Unknown African
4-R, 5-R, 6-R, 7-
R, 8-R
Knowlson Gift Unknown Male Unknown African 4-R, 7-R, 8-R
Lenny Saith Unknown Male Unknown Indian
4-R, 7-R, 8-R, 9-
R
Deborah Moore-
Miggins
Bishop's High
School, Tobago Female Methodist African 5-R
Pennelope Beckles
St. Joseph's Convent,
San Fernando Female Unknown African 5-R
Carol Cuffy-Dowlat Unknown Female Unknown African 5-R
Elizabeth Mannette Unknown Female Unknown African 5-R
Joseph Theodore Unknown Male Unknown African 5-R
Eric St. Cyr Unknown Male Unknown African 5-R
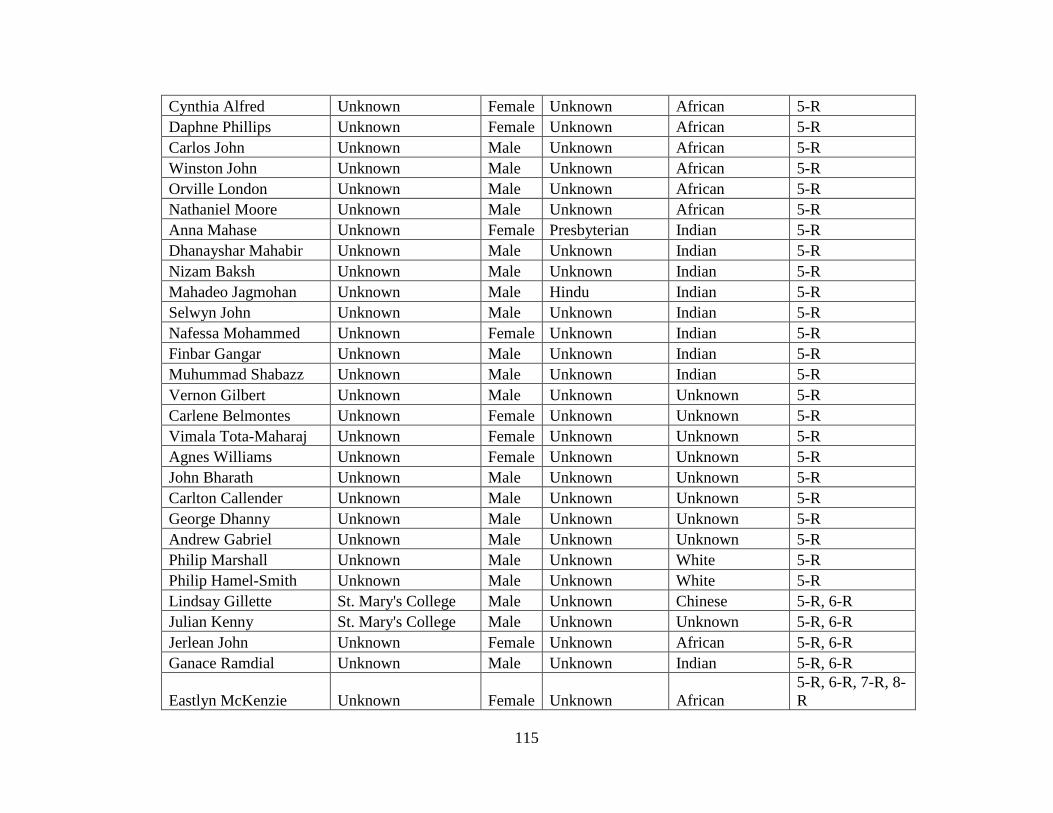
115
Cynthia Alfred Unknown Female Unknown African 5-R
Daphne Phillips Unknown Female Unknown African 5-R
Carlos John Unknown Male Unknown African 5-R
Winston John Unknown Male Unknown African 5-R
Orville London Unknown Male Unknown African 5-R
Nathaniel Moore Unknown Male Unknown African 5-R
Anna Mahase Unknown Female Presbyterian Indian 5-R
Dhanayshar Mahabir Unknown Male Unknown Indian 5-R
Nizam Baksh Unknown Male Unknown Indian 5-R
Mahadeo Jagmohan Unknown Male Hindu Indian 5-R
Selwyn John Unknown Male Unknown Indian 5-R
Nafessa Mohammed Unknown Female Unknown Indian 5-R
Finbar Gangar Unknown Male Unknown Indian 5-R
Muhummad Shabazz Unknown Male Unknown Indian 5-R
Vernon Gilbert Unknown Male Unknown Unknown 5-R
Carlene Belmontes Unknown Female Unknown Unknown 5-R
Vimala Tota-Maharaj Unknown Female Unknown Unknown 5-R
Agnes Williams Unknown Female Unknown Unknown 5-R
John Bharath Unknown Male Unknown Unknown 5-R
Carlton Callender Unknown Male Unknown Unknown 5-R
George Dhanny Unknown Male Unknown Unknown 5-R
Andrew Gabriel Unknown Male Unknown Unknown 5-R
Philip Marshall Unknown Male Unknown White 5-R
Philip Hamel-Smith Unknown Male Unknown White 5-R
Lindsay Gillette St. Mary's College Male Unknown Chinese 5-R, 6-R
Julian Kenny St. Mary's College Male Unknown Unknown 5-R, 6-R
Jerlean John Unknown Female Unknown African 5-R, 6-R
Ganace Ramdial Unknown Male Unknown Indian 5-R, 6-R
Eastlyn McKenzie Unknown Female Unknown African
5-R, 6-R, 7-R, 8-
R
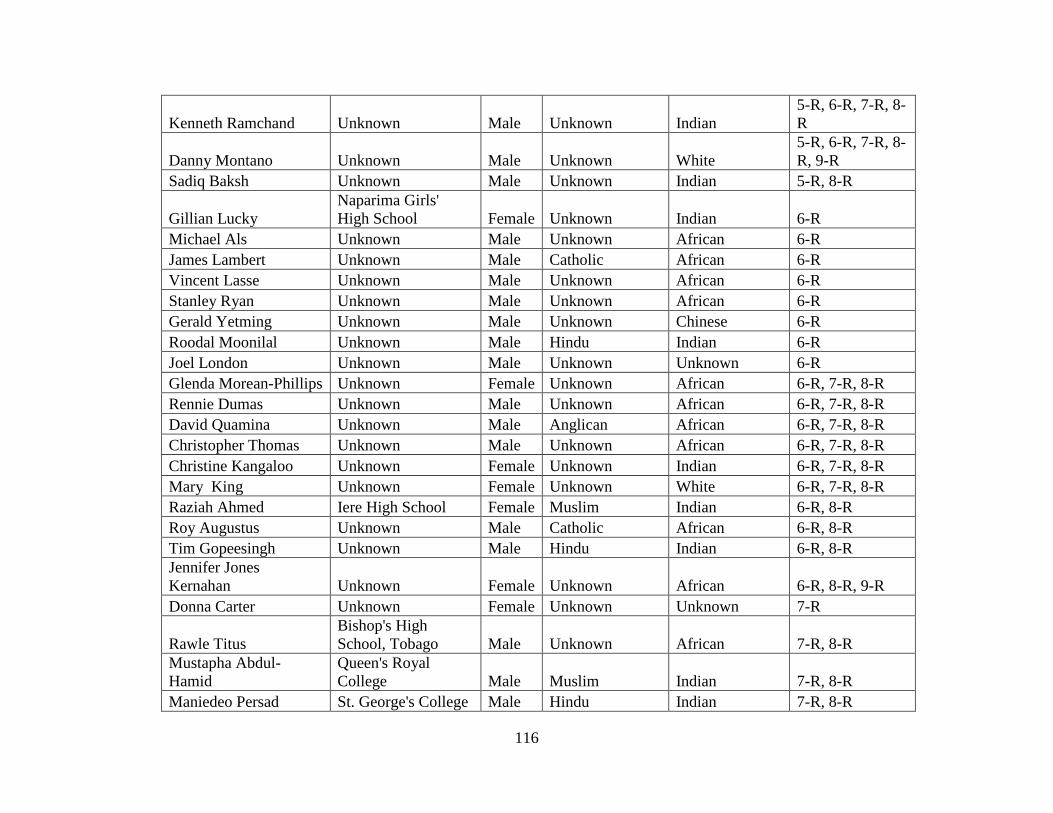
116
Kenneth Ramchand Unknown Male Unknown Indian
5-R, 6-R, 7-R, 8-
R
Danny Montano Unknown Male Unknown White
5-R, 6-R, 7-R, 8-
R, 9-R
Sadiq Baksh Unknown Male Unknown Indian 5-R, 8-R
Gillian Lucky
Naparima Girls'
High School Female Unknown Indian 6-R
Michael Als Unknown Male Unknown African 6-R
James Lambert Unknown Male Catholic African 6-R
Vincent Lasse Unknown Male Unknown African 6-R
Stanley Ryan Unknown Male Unknown African 6-R
Gerald Yetming Unknown Male Unknown Chinese 6-R
Roodal Moonilal Unknown Male Hindu Indian 6-R
Joel London Unknown Male Unknown Unknown 6-R
Glenda Morean-Phillips Unknown Female Unknown African 6-R, 7-R, 8-R
Rennie Dumas Unknown Male Unknown African 6-R, 7-R, 8-R
David Quamina Unknown Male Anglican African 6-R, 7-R, 8-R
Christopher Thomas Unknown Male Unknown African 6-R, 7-R, 8-R
Christine Kangaloo Unknown Female Unknown Indian 6-R, 7-R, 8-R
Mary King Unknown Female Unknown White 6-R, 7-R, 8-R
Raziah Ahmed Iere High School Female Muslim Indian 6-R, 8-R
Roy Augustus Unknown Male Catholic African 6-R, 8-R
Tim Gopeesingh Unknown Male Hindu Indian 6-R, 8-R
Jennifer Jones
Kernahan Unknown Female Unknown African 6-R, 8-R, 9-R
Donna Carter Unknown Female Unknown Unknown 7-R
Rawle Titus
Bishop's High
School, Tobago Male Unknown African 7-R, 8-R
Mustapha Abdul-
Hamid
Queen's Royal
College Male Muslim Indian 7-R, 8-R
Maniedeo Persad St. George's College Male Hindu Indian 7-R, 8-R
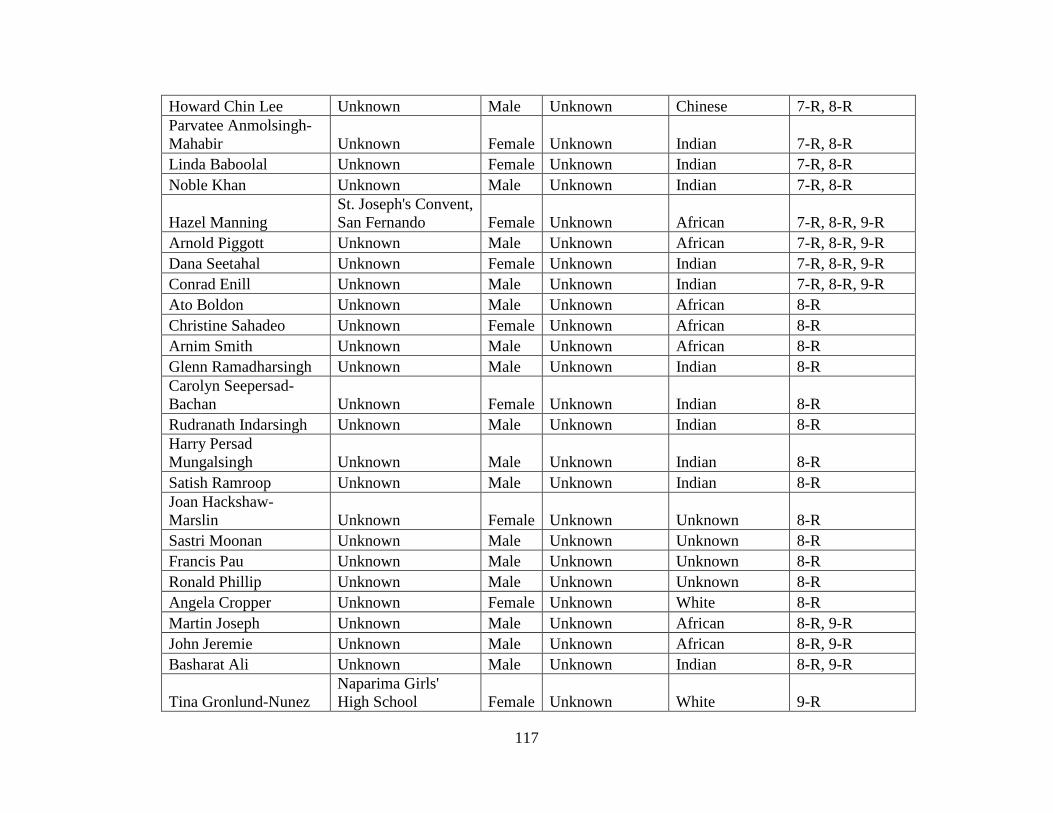
117
Howard Chin Lee Unknown Male Unknown Chinese 7-R, 8-R
Parvatee Anmolsingh-
Mahabir Unknown Female Unknown Indian 7-R, 8-R
Linda Baboolal Unknown Female Unknown Indian 7-R, 8-R
Noble Khan Unknown Male Unknown Indian 7-R, 8-R
Hazel Manning
St. Joseph's Convent,
San Fernando Female Unknown African 7-R, 8-R, 9-R
Arnold Piggott Unknown Male Unknown African 7-R, 8-R, 9-R
Dana Seetahal Unknown Female Unknown Indian 7-R, 8-R, 9-R
Conrad Enill Unknown Male Unknown Indian 7-R, 8-R, 9-R
Ato Boldon Unknown Male Unknown African 8-R
Christine Sahadeo Unknown Female Unknown African 8-R
Arnim Smith Unknown Male Unknown African 8-R
Glenn Ramadharsingh Unknown Male Unknown Indian 8-R
Carolyn Seepersad-
Bachan Unknown Female Unknown Indian 8-R
Rudranath Indarsingh Unknown Male Unknown Indian 8-R
Harry Persad
Mungalsingh Unknown Male Unknown Indian 8-R
Satish Ramroop Unknown Male Unknown Indian 8-R
Joan Hackshaw-
Marslin Unknown Female Unknown Unknown 8-R
Sastri Moonan Unknown Male Unknown Unknown 8-R
Francis Pau Unknown Male Unknown Unknown 8-R
Ronald Phillip Unknown Male Unknown Unknown 8-R
Angela Cropper Unknown Female Unknown White 8-R
Martin Joseph Unknown Male Unknown African 8-R, 9-R
John Jeremie Unknown Male Unknown African 8-R, 9-R
Basharat Ali Unknown Male Unknown Indian 8-R, 9-R
Tina Gronlund-Nunez
Naparima Girls'
High School Female Unknown White 9-R
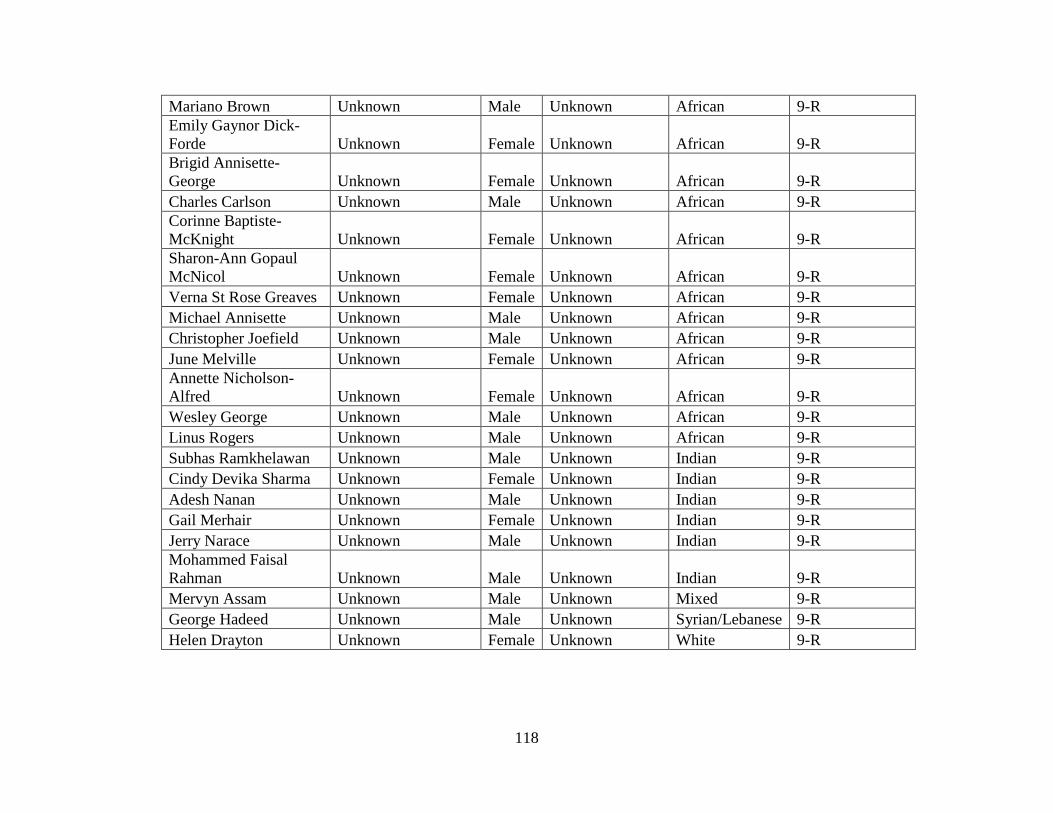
118
Mariano Brown Unknown Male Unknown African 9-R
Emily Gaynor Dick-
Forde Unknown Female Unknown African 9-R
Brigid Annisette-
George Unknown Female Unknown African 9-R
Charles Carlson Unknown Male Unknown African 9-R
Corinne Baptiste-
McKnight Unknown Female Unknown African 9-R
Sharon-Ann Gopaul
McNicol Unknown Female Unknown African 9-R
Verna St Rose Greaves Unknown Female Unknown African 9-R
Michael Annisette Unknown Male Unknown African 9-R
Christopher Joefield Unknown Male Unknown African 9-R
June Melville Unknown Female Unknown African 9-R
Annette Nicholson-
Alfred Unknown Female Unknown African 9-R
Wesley George Unknown Male Unknown African 9-R
Linus Rogers Unknown Male Unknown African 9-R
Subhas Ramkhelawan Unknown Male Unknown Indian 9-R
Cindy Devika Sharma Unknown Female Unknown Indian 9-R
Adesh Nanan Unknown Male Unknown Indian 9-R
Gail Merhair Unknown Female Unknown Indian 9-R
Jerry Narace Unknown Male Unknown Indian 9-R
Mohammed Faisal
Rahman Unknown Male Unknown Indian 9-R
Mervyn Assam Unknown Male Unknown Mixed 9-R
George Hadeed Unknown Male Unknown Syrian/Lebanese 9-R
Helen Drayton Unknown Female Unknown White 9-R
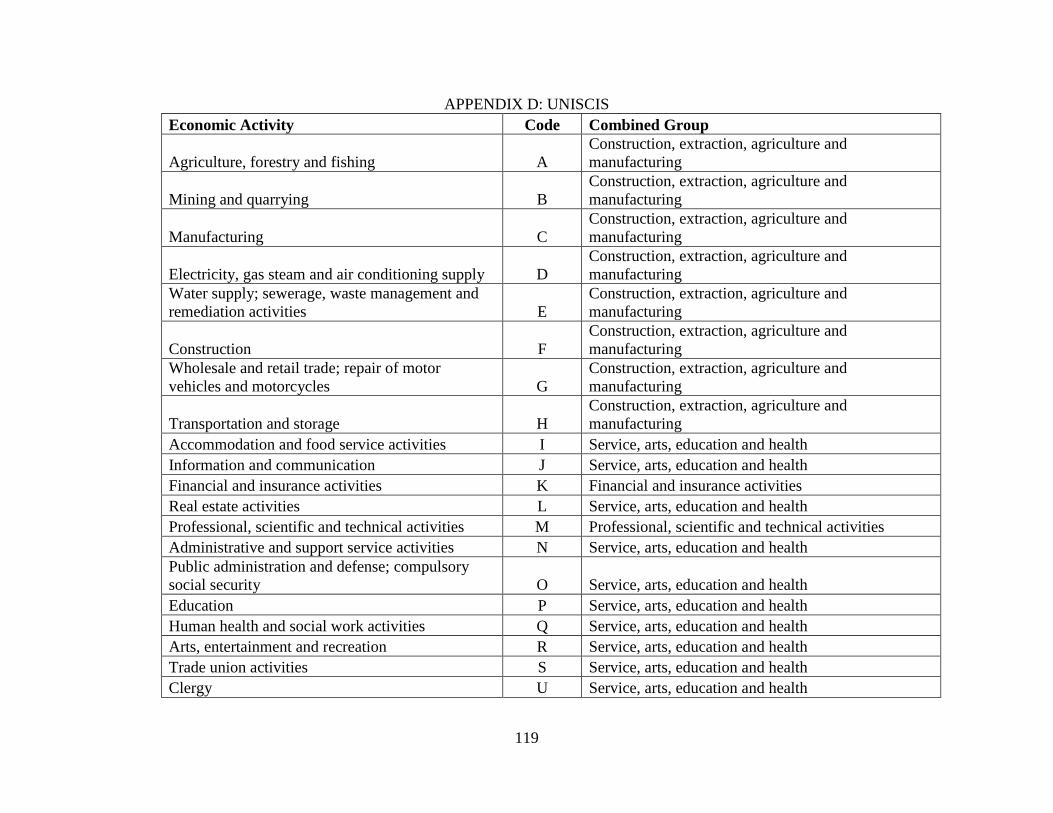
119
APPENDIX D: UNISCIS
Economic Activity Code Combined Group
Agriculture, forestry and fishing A
Construction, extraction, agriculture and
manufacturing
Mining and quarrying B
Construction, extraction, agriculture and
manufacturing
Manufacturing C
Construction, extraction, agriculture and
manufacturing
Electricity, gas steam and air conditioning supply D
Construction, extraction, agriculture and
manufacturing
Water supply; sewerage, waste management and
remediation activities E
Construction, extraction, agriculture and
manufacturing
Construction F
Construction, extraction, agriculture and
manufacturing
Wholesale and retail trade; repair of motor
vehicles and motorcycles G
Construction, extraction, agriculture and
manufacturing
Transportation and storage H
Construction, extraction, agriculture and
manufacturing
Accommodation and food service activities I Service, arts, education and health
Information and communication J Service, arts, education and health
Financial and insurance activities K Financial and insurance activities
Real estate activities L Service, arts, education and health
Professional, scientific and technical activities M Professional, scientific and technical activities
Administrative and support service activities N Service, arts, education and health
Public administration and defense; compulsory
social security O Service, arts, education and health
Education P Service, arts, education and health
Human health and social work activities Q Service, arts, education and health
Arts, entertainment and recreation R Service, arts, education and health
Trade union activities S Service, arts, education and health
Clergy U Service, arts, education and health
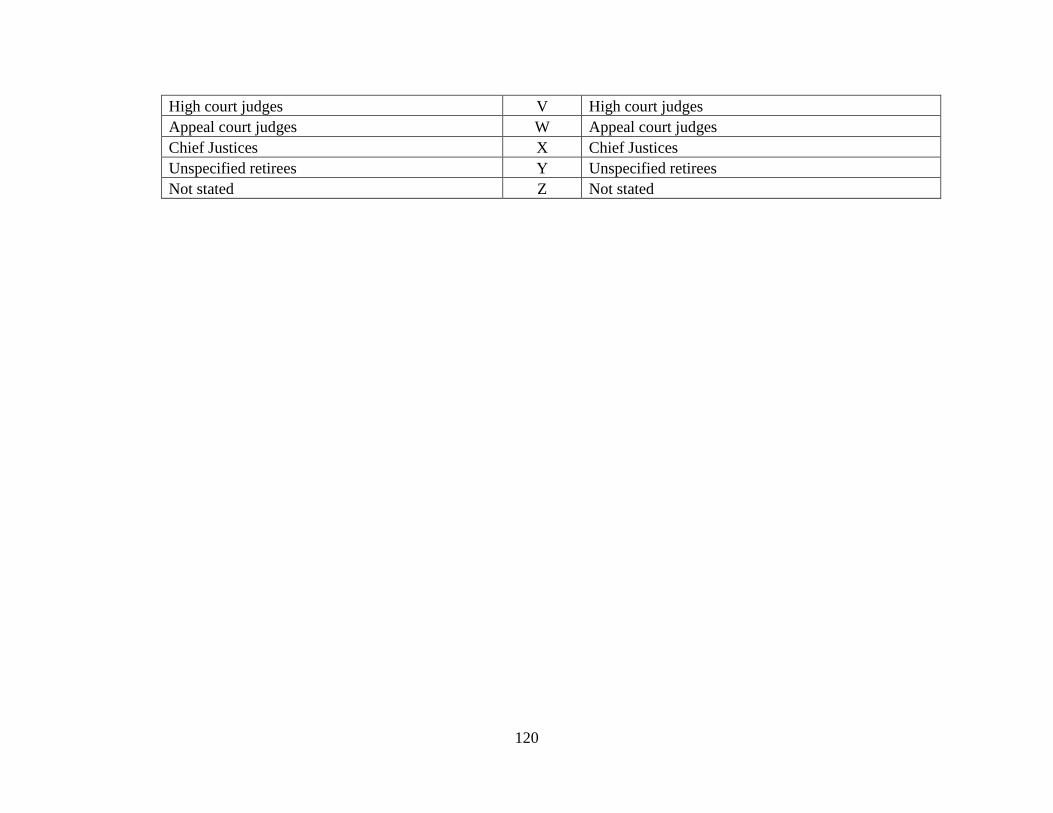
120
High court judges V High court judges
Appeal court judges W Appeal court judges
Chief Justices X Chief Justices
Unspecified retirees Y Unspecified retirees
Not stated Z Not stated
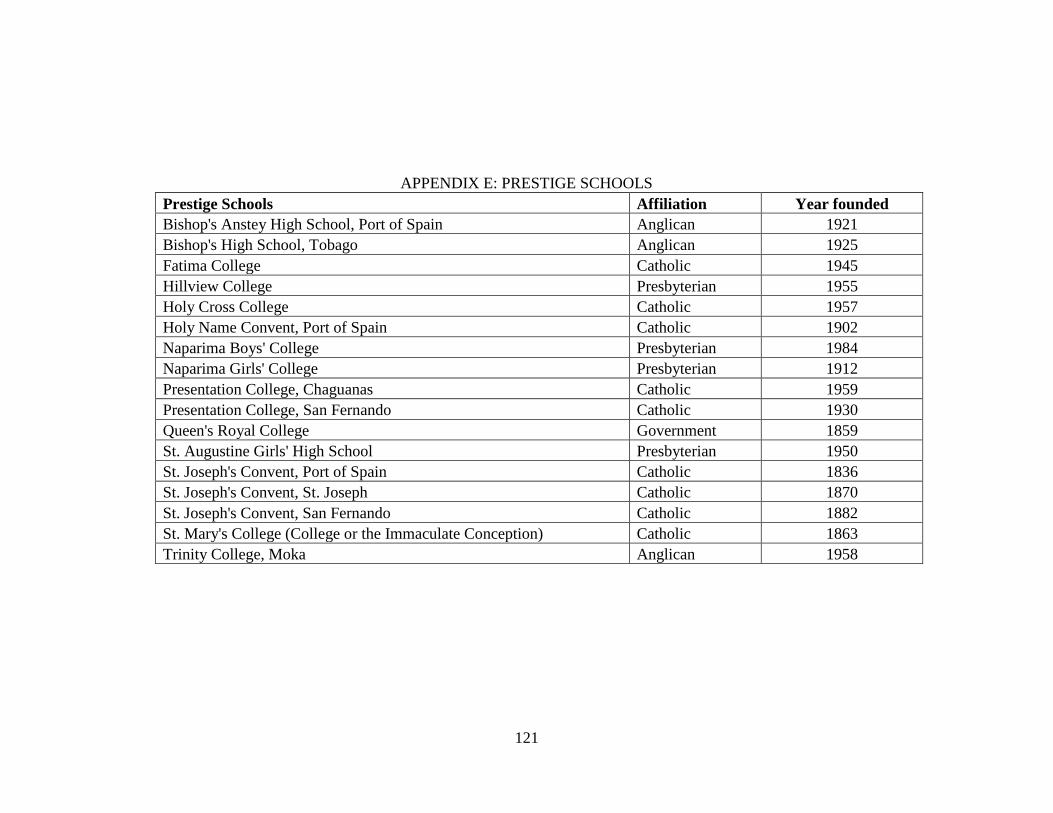
121
APPENDIX E: PRESTIGE SCHOOLS
Prestige Schools Affiliation Year founded
Bishop's Anstey High School, Port of Spain Anglican 1921
Bishop's High School, Tobago Anglican 1925
Fatima College Catholic 1945
Hillview College Presbyterian 1955
Holy Cross College Catholic 1957
Holy Name Convent, Port of Spain Catholic 1902
Naparima Boys' College Presbyterian 1984
Naparima Girls' College Presbyterian 1912
Presentation College, Chaguanas Catholic 1959
Presentation College, San Fernando Catholic 1930
Queen's Royal College Government 1859
St. Augustine Girls' High School Presbyterian 1950
St. Joseph's Convent, Port of Spain Catholic 1836
St. Joseph's Convent, St. Joseph Catholic 1870
St. Joseph's Convent, San Fernando Catholic 1882
St. Mary's College (College or the Immaculate Conception) Catholic 1863
Trinity College, Moka Anglican 1958