Embed Size (px)
Citation preview
The Paradoxical Roles of Cell Death Pathways in Immune Cells
Scott McComb
Thesis submitted to the Faculty of Graduate and Postdoctoral Studies
In partial fulfillment of the requirements For the PhD degree in Microbiology and Immunology
Department of Biochemistry, Microbiology and Immunology
Faculty of Medicine
University of Ottawa
©Scott McComb, Ottawa, Canada 2013
`
ABSTRACT
Cell death plays a vital role throughout the immune response, from the onset of inflammation
to the elimination of primed T cells. Understanding the regulation of cell death within immune cells
is of vital importance to understanding the immune system and developing therapies against various
immune-disorders. In this thesis I have investigated the regulation of cell death and its functional
role in of the innate and adaptive arms of the immune system.
The mechanisms that govern expansion and contraction of antigen stimulated CD8+ T cells are
not well understood. In the first section of this thesis, I show that caspase-3 becomes activated in
proliferating CD8+ proliferation, yet this does not result in cell death. I used both in vivo and in
vitro models to demonstrate that caspase-3 activation is specifically driven by antigen presentation
and not inflammation, and that it likely plays a role in promoting T cell proliferation.
Next, I present novel data regarding the regulation of a newly identified form of programmed
cell death via necrosis, known as necroptosis. I show that the cellular inhibitor of apoptosis (cIAP)
proteins act to limit activation of key necroptosis proteins in macrophage cells. Furthermore, I show
that necroptosis can be exploited by intracellular bacterial pathogens to escape removal by the
immune system. I also demonstrate that necroptosis is highly intertwined with the pathway of
inflammation, and the autocrine production of type-I interferon constitutes a vital positive feedback
loop in the induction of inflammatory cell death. In the final section of my thesis work, I delve into
the specific regulation of Rip1 kinase and demonstrate that in addition to previously demonstrated
regulation by caspase-8, cathepsins are also able to cleave Rip1 kinase and limit necroptosis.
This thesis presents a wide variety of novel data regarding the regulation of cell death within
immune cells. In total, the results reveal a picture of two divergent forms of programmed cell death,
1

apoptosis and necroptosis. Through improving the understanding of the cross-regulation of these two
key cell death pathways this work aims to improve the understanding of the immune function.
2

ACKNOWLEDGEMENTS
I would like to acknowledge all of the many people who helped me along the way in my
graduate studies. The process of science is at its heart a collaborative one, and I have many people to
thank. I would like to thank all current and former members of Krishnan and Sad (LKSS) labs; their
help has been invaluable in my training and scientific work. Thank you to the many LKSS graduate
students, postdoctoral researchers, and alumni; you have been an indispensable source of inspiration,
discussion, collaboration and friendship. Thanks as well to the students I had the pleasure of
mentoring both in the Sad lab and outside of it, your hard work and inquiring minds have helped me
grow as a scientist and a teacher.
I would also like to thank the professors of the University of Ottawa Department of
Microbiology and Immunology, who have instilled in me the knowledge and skills which I hope will
enable me to pursue my own academic career. To my supervisor, Dr. Subash Sad, thank you for your
patient guidance over the years. Thank you for encouraging me to think outside of the box and
having the courage and trust for us to follow through on these ideas in the lab.
Finally, I would like to thank my family, who have given me the base of love and support
that has allowed me to reach for and realize my dreams. I especially want to thank my wife Andrea
for patiently bearing the idiosyncrasies of a scientific mind; I could not have accomplished this
without you.
Thank you to the Canadian public for supporting scientific research. My work was supported
by scholarships from the Ontario Graduate Scholarship Program and University of Ottawa.
Research funds were provided by grants from the Canadian Institute for Health Research.
3
TABLE OF CONTENTS
ABSTRACT ......................................................................................................................................... 1 ACKNOWLEDGEMENTS ............................................................................................................... 3 TABLE OF CONTENTS ................................................................................................................... 4 LIST OF ABBREVIATIONS ............................................................................................................ 7 LIST OF FIGURES AND TABLES .................................................................................................. 9 1.0 INTRODUCTION....................................................................................................................... 11
1.1 The Immune System............................................................................................................... 12 1.1.A Macrophages ...................................................................................................................... 13
1.1.A-I Innate Immune Cells and Inflammation – See Figure 1 ............................................. 15 1.1.A-II Macrophage Cell Death in Bacterial Infections ........................................................ 20
1.1.B CD8+ T cells ....................................................................................................................... 22 1.1.B-I Cell Death Pathways in CD8+ T Cell Function .......................................................... 25
1.2 Programmed Cell Death ......................................................................................................... 26 1.2.A Apoptosis ........................................................................................................................... 28
1.2.A-I Extrinsic Apoptosis ..................................................................................................... 28 1.2.A-II Intrinsic Apoptosis..................................................................................................... 32 1.2.A-III Caspase-3 ................................................................................................................. 34 1.2.A-IV SMAC and IAPs ....................................................................................................... 35
1.2.B Necroptosis ........................................................................................................................ 37 1.2.B-I Necrotic Cell Death and Inflammation ....................................................................... 42
2.0 SUMMARY ................................................................................................................................. 50 2.1 Hypothesis ................................................................................................................................ 50 2.2 Aims .......................................................................................................................................... 50
3.0 METHODS AND MATERIALS ............................................................................................... 51 3.1 Animal Work ........................................................................................................................... 51
Adoptive transfer of OT1 splenocytes ......................................................................................... 51 In vivo Infection Models ............................................................................................................. 51 Table 1: Mouse strains utilized in experiments, .......................................................................... 52 In vivo Antigen Presentation ....................................................................................................... 53
3.2 Bacterial Methods ................................................................................................................... 53
CFU Assay ................................................................................................................................... 54
3.3 Cell Purification and Sorting ................................................................................................. 54
Magnetic Isolation of Cells.......................................................................................................... 54 Cell Sorting by Flow Cytometry ................................................................................................. 55
4
3.4 Cell Culture .............................................................................................................................. 55
In vitro Antigen Presentation to CD8+ T cells ............................................................................. 55 In vitro LM-OVA Infection and Limiting Dilution Assay .......................................................... 55 Generation of Bone Marrow Macrophages and Dendritic Cells ................................................. 56 In vitro Inhibitor Assays .............................................................................................................. 57 RNA Interference ........................................................................................................................ 58 Mitochondrial Activity Cell Viability Assay (MTT) .................................................................. 58 Table 2: Inhibitors utilized in experiments .................................................................................. 59 Cell death assay (LDH release) ................................................................................................... 60
3.5 Immunofluorescent Analyses ................................................................................................. 60
Flow Cytometry ........................................................................................................................... 60 Table 3: Antibodies and staining reagents ................................................................................... 61 Intracellular Staining ................................................................................................................... 62 Live Cell Flow-Cytometry .......................................................................................................... 62 Confocal Microscopy .................................................................................................................. 62 Live Cell Fluorescence Microscopy ............................................................................................ 63
3.6 Biochemical Analyses .............................................................................................................. 64
Quantitative RT-PCR .................................................................................................................. 64 SDS-PAGE and western blotting ................................................................................................ 64 Protein Dephosphorylation .......................................................................................................... 65 Immunoprecipitation ................................................................................................................... 65 Plasmid constructs and protein purification ................................................................................ 66 Cell free cleavage assay ............................................................................................................... 66
3.7 Statistics.................................................................................................................................... 66 3.8 Technical Acknowledgement .................................................................................................. 66
4.0 RESULTS .................................................................................................................................... 68 4.1 Caspase-3 Activation in CD8+ T –Cell Function .................................................................. 68
4.1.A Caspase-3 is upregulated in proliferating CD8+ T cells ..................................................... 68 4.1.B Active caspase-3 in proliferating CD8+ T cells does not lead to cell death ....................... 70 4.1.C Proliferating CD8+ T Cells show elevated caspase-3 in vivo ............................................ 73 4.1.D The timing and magnitude of caspase-3 activation corresponds with the timing and ....... 75 magnitude of antigen presentation ............................................................................................... 75 4.1.E Proliferating caspase-3+ CD8+ T cells show an apoptotic like phenotype ....................... 77 4.1.F Active caspase-3high CD8+ T cells do not progress to cell death ........................................ 77 4.1.G Active caspase-3 is driven by antigen presentation and not inflammation ....................... 80 4.1.H Caspase-3 activation occurs before the emergence of differentiated CD8+ effector cells 83 4.1.I Active caspase-3 promotes CD8+ T cell proliferation ........................................................ 84
4.2 The Role of IAPs in Innate Immune Cell Function ............................................................. 87
4.2.A cIAPs limit cell death in innate immune cells .................................................................... 87 4.2.B SM-induced death is associated with increased inflammatory cytokine production ......... 90
5

4.2.C SM induces programmed necrosis in macrophages ........................................................... 92 4.2.D cIAP1 and cIAP2 additively limit macrophage necroptosis .............................................. 92 4.2.E xIAP limits SM-induced apoptosis .................................................................................... 95 4.2.F Loss of cIAPs increases Rip1 activation ............................................................................ 95 4.2.G Loss of cIAPs reduces constitutive degradation of Rip1 and Rip3 kinases ...................... 95 4.2.H Autocrine TNFR1 or 2 signaling is necessary for SM-induced necroptosis ..................... 97 4.2.I In vivo administration of SM results in macrophage cell death .......................................... 99 4.2.J Loss of cIAP function in vivo decreases control of Listeria monocytogenes .................... 99
4.3 Salmonella Induces Interferon Dependent Necroptosis ..................................................... 102
4.3.A cIAP1-/- or cIAP2-/- mice are more susceptible to Salmonella typhimurium ................... 102 4.3.B ST infection of macrophages leads to delayed necroptosis ............................................. 102 4.3.C ST induces necroptosis in macrophages in vivo .............................................................. 104 4.3.D Type-I interferon signaling is required for ST-induced necroptosis ............................... 104 4.3.E Treatment with IFN-β and zVAD induces necroptosis .................................................... 107 4.3.F Type-I interferon is a key feedback in LPS induced necroptosis..................................... 107 4.3.G Type-I interferon induced death drives systemic shock in vivo ...................................... 110
4.4 Cathepsins Regulate Necroptosis ......................................................................................... 110
4.4.A zVAD alone can induce macrophage necroptosis ............................................................ 110 4.4.B LPS stimulation drives Rip1 kinase activation independently of TNFR signaling ......... 113 4.4.C Cysteine cathepsins cleave Rip1 kinase ........................................................................... 116 4.4.D Cathepsin S and B both cleave Rip1 kinase .................................................................... 118 4.4.E Cathepsins associate with Rip1 kinase directly ............................................................... 121 4.4.F Cathepsins can directly cleave Rip1 kinase ..................................................................... 121 4.4.G Cathepsins and caspase-8 cooperate to limit necroptosis ................................................ 124
5.0 DISCUSSION ............................................................................................................................ 127 5.1 The role of Caspase-3 in CD8+ T Cells ................................................................................ 127 5.2 The Role of IAPs in Innate Immune Cell Function ........................................................... 135 5.3 Necroptosis and Interferon ................................................................................................... 141 5.4 The Regulation of Necroptosis by Cathepsins .................................................................... 151
6.0 CONCLUSION ......................................................................................................................... 157 REFERENCES ................................................................................................................................ 160 CONTRIBUTIONS OF COLLABORATORS ............................................................................ 179
6
LIST OF ABBREVIATIONS
ANT Adeninine Nucleotide Transporter
LM-OVA Listeria monocytogenes expressing OVA
BCL-2 B-Cell Lymphoma 2 LPS Lipopolysaccharide BH-3 BCL2 Homology Domain 3 MCMV Mouse cytomegalorvirus BMDM Bone Marrow derived
macrophage MHC Major Histocompatibility Complex
C8I Caspase-8 Inhibitor MLKL Mixed Lineage Kinase domain-Like cFLIP Cellular FLICE-like Inhibitory
Protein MOMP Mitochondrial Outer Membrane
Permeabilization CFSE Carboxyfluorescein succinimidyl
ester MPTP Mitochondrial Permability
Transition Pore CFU Colony Forming Units Myd88 Myeloid Differentiation Primary
Response Gene 88 cIAP(1/2) Cellular Inhibitor of Apoptosis Nec Necrostatin CLP Caecal ligation and puncture NEMO NF-κβ essential modulator CTL Cytolytic T cell NF-κβ Nuclear Factor Kappa-light-chain-
enhancer of activated B cells CYPD Cyclophilin D OT-1 Transgenic Mouse with OVA
specific TCR DAMP Damage Associated Molecular
Pattern OVA Ovalbumin
DD Death Domain PAMP
DED Death Effector Domain PBS DISC Death inducing signaling
complex PD-1
Pathogen Associated Molecular Pattern Phosphate buffered saline Programmed Death Marker 1
DSB Double Strand Breaks PI Propidium Iodide E64D E64-D cysteine protease inhibitor PKR Protein Kinase R FADD Fas-Associated Death Domain
Protein PPL PhiPhiLux - Fluorescent Caspase-3
Substrate HMGB1 High-mobility Group Box Protein
1 PRR Pattern Recognition Receptor
IFN Interferon R8 RPMI with 8% Fetal Bovine Serum IFNAR Interferon α/β Receptor RHIM Rip Homotypic Interaction Domain IL-(1...) Interleukin Rip(1/3) Receptor Interacting Protein Kinase IRAK Interleukin-1 Associated Kinase RNS Reactive nitrogen species IRF(3/7) Interferon Regulatory Factor ROS Reactive oxygen species Iκβ Inhibitor of κβ SM SMAC Mimetic LCMV Lymphocytic choriomeningitis
virus SMAC Secondary Mitochondrial Activator
of Cell Death LM Listeria monocytogenes ST Salmonella Typhimuirum
7
STAT Signal Transducers and
Activators of Transcription TRADD TNF-Receptor Associated Death
Domain Protein ST-OVA Salmonella Typhimuirum
expressing OVA TRAF(1…) TNF-Receptor Associated Factor
TBS Tris-buffered Saline TRIF TIR-domain Containing Adapter Inducing IFN-β
TCR T-cell receptor TUNEL Terminal dUTP nick end labeling TLR Toll-like Receptor xIAP X-linked Inhibitor of Apoptosis TNF Tumour Necrosis Factor zVAD z-VAD-FMK Pan-caspase Inhibitor TNFR Tumour Necrosis Factor Receptor
8

LIST OF FIGURES AND TABLES
Figure 1: Inflammatory signaling pathways 16 Figure 2: Antigen presentation activates the T cell response 23 Figure 3: Extrinsic and intrinsic apoptotic signaling pathways 29 Figure 4: The many outcomes of TNF receptor signaling 31 Figure 5: The necrosome as a functional integrator of many signaling pathways. 43 Figure 6: The functional spectrum of necroptosis. 45 Figure 7: Active caspase-3 is upregulated in proliferating T cells. 69 Figure 8: Active caspase-3hi CD8+ T Cells do not exhibit DNA fragmentation. 71
Figure 9: Active Caspase-3 in proliferating CD8 T cells does not lead to cell death. 72 Figure 10: Proliferating CD8+ T Cells show elevated Caspase-3 during in vivo response. 74 Figure 11: The timing and magnitude of caspase-3 activation corresponds with the timing and
magnitude of antigen presentation. 76
Figure 12: Activated antigen specific CD8+ T cells simultaneously display markers for apoptosis and proliferation.
78
Figure 13: Caspase-3hi proliferating CD8+ T cells in vivo do not show signs of progressing to cell death.
79
Figure 14: Caspase-3hi proliferating CD8+ T cells do not undergo significant cell death when supplemented with supportive cytokine ex vivo.
81
Figure 15: Active caspase-3 is driven by antigen presentation and not inflammation. 82 Figure 16: Caspase-3 activation occurs before the emergence of differentiated CD8+ effector
T cells. 85
Figure 17: Caspase-3 inhibition slows CD8+ T cell proliferation and enhances cell death 86 Figure 18: cIAPs inhibition does not have a significant impact on CD8+ T cell proliferation. 88 Figure 19: cIAPs limit cell death in bone marrow derived macrophages and dendritic cells. 89 Figure 20: SM-induced death is associated with increased inflammatory cytokine production. 91 Figure 21: SM treatment induces programmed necrosis in macrophages. 93 Figure 22: cIAP1 and cIAP2 are functionally redundant and additive in limiting macrophage
necroptosis, while XIAP limits SM-induced apoptosis. 94
Figure 23: Loss of cIAPs increases Rip1 and Rip3 expression and activation. 96 Figure 24: Autocrine TNFR1 signaling is necessary for SM-induced necroptosis. 98 Figure 25: In vivo administration of SM results in cIAP degradation and macrophage cell
death. 100
Figure 26: Decreased cIAP function in vivo decreases control of Listeria monocytogenes. 101 Figure 27: cIAP1 Deficient mice are more susceptible to infection with Salmonella
typhimurium. 103
Figure 28: Infection of BMDM cells with ST induces delayed necroptotic cell death. 105 Figure 29: Rip3-deficient mice show less macrophage cell death during ST infection in vivo. 106 Figure 30: IFNAR-deficient BMDMs show less phosphorylation of Rip1 and Rip3 kinases and
less necroptosis upon infection with ST. 108
9

Figure 31: Treatment of J774 macrophages with IFNβ drives necroptosis.
109
Figure 32: Autocrine production of type-I interferon is a key mechanism in the induction of necroptosis through the zVAD/LPS pathway.
111
Figure 34: zVAD alone can induce macrophage necroptosis. 112 Figure 35: LPS stimulation drives necroptosis independently of TNFR signaling 114 Figure 36: A non-caspase-8 cysteine protease cleaves Rip1 Kinase. 117 Figure 37: Cathepsin S and B can cleave Rip1 kinase. 119 Figure 38: Single knockouts for cathepsin S or cathepsin B show no change in susceptibility to
necroptosis. 120
Figure 39: Cathepsins associate with Rip1 kinase directly. 122 Figure 40: Cathepsins can directly cleave Rip1 kinase in a cell free environment. 123 Figure 41: Cathepsins and caspase-8 cooperate to limit necroptosis. 125 Figure 42: CD8+ T cells become active caspase-3 high soon after activation and
progressively lose this as cells proliferate. 134
Figure 43: Activation of Rip1 is kept in check by cIAP mediated degradation. 142 Figure 44: Model of how ST induces necroptosis 146 Figure 45: The role of interferon in LPS/zVAD induced necroptosis 150 Figure 46: The positive and negative regulators of necroptosis. 155
Table 1: Mouse strains utilized in experiments 51 Table 2: Inhibitors utilized in experiments 58 Table 3: Antibodies and staining reagents 60
10
1.0 INTRODUCTION
Cell death is an indispensable mechanism for development and maintenance of all forms of
complex life. Without the ability to trim unnecessary or damaged cells from the body, multicellular
life would likely be impossible. Programmed cell death has even been observed within bacterial
colonies in order to remove damaged cells1,2. Programmed cell death also plays a particularly
important role at every level of an immune response. From the outset, cell death, induced by cellular
damage or by pathogens directly, is thought to play a central role in the initiation of an inflammatory
response3. In some cases, immune cells must also become resistant to normal cell death pathways in
order to function within infected and cytotoxic microenvironments. In adaptive immune cells, these
cells maintain the ability to rapidly expand massively by clonal proliferation in response to specific
antigenic stimulation. Paradoxically, cell death pathways appear to play a role in this process of
immune cell proliferation4,5. Following an adaptive response, the removal of the majority of
activated immune cells while maintaining a reservoir of memory cells, also seems to rely on
programmed cell death mechanisms6,7.
A clear understanding of the regulation of cell death pathways within immune cells is essential
to understanding of the immune system as a whole. In the work presented here, I will delve into new
mechanisms that regulate cell death within innate and acquired immune cells. I will begin by
presenting work in CD8 T cells, wherein we have uncovered novel data showing the activation of
apoptotic cell death proteins without the induction of cell death in proliferating T cells. In follow up
to this work, we next became interested in the role of non-apoptotic cell death pathways. Thus, I will
next present work investigating the role of a new form of programmed necrotic cell death within
innate immune cells, with a focus on macrophages. Finally, I will apply new understanding of the
11
regulation of programmed necrosis to bona fide models of infection and inflammation. Through
revealing novel pathways by which immune cells have evolved to regulate cell death, I provide new
insight into the regulation of key immune processes such as inflammation and T cell activation.
Using both in vitro and in vivo techniques, I will demonstrate in a number of different systems how
dysregulated immune cell death can lead to poorer immune response and pathology.
1.1 THE IMMUNE SYSTEM
The mammalian immune system can be broadly divided into the innate and adaptive arms.
The innate immune system is made of the physical, chemical and cellular barriers which react
directly to damage or infection. To accomplish this ends, the innate immune system has genetically
fixed receptors which are programmed to be activated by a large number of molecules indicative of
damage or infection. The specific cells of the innate immune system include macrophages,
monocytes, neutrophils and dendritic cells, among others8. These cells usually react first to infection,
often acting to induce the earliest inflammatory immune responses. In contrast to the innate immune
system, the adaptive immune system is populated by cells that are constantly generated within
specialized immune tissues, each carrying a specialized and specific immune receptor. These unique
adaptive immune receptors are generated in developing T and B cells through a process of random
shuffling of genetic elements known as VDJ rearrangement8. Only if adaptive immune cells
encounter a molecule which can specifically bind their specific receptor will they become activated
and able to perform their specific immune function. By combining the general ability of the innate
immune system to initiate inflammatory immune reactions with the ability of the acquired immune
system to focus its effects on particular targets, the mammalian immune system can effectively
12
recognize and defend against the staggering variety of bacteria, viruses and parasites present in the
external environment (see 9 for more).
There is a large body of work covering the ways in which innate immune cells are able to
respond to pathogens and initiate specific immune responses. Given that this thesis concentrates
mainly on the functional role of macrophage cells, I will utilize these cells to introduce the important
innate immunity concepts of pattern recognition receptors, cytokines, and inflammation. Similarly,
within the adaptive immune compartment, the work described in this thesis examines the role of
CD8 T cells. Thus, I will utilize the CD8 T cell section of this introduction to discuss important
adaptive immune cell concepts such as antigen presentation, T cell activation, effector functions, and
contraction of the response.
1.1.A Macrophages Innate immune cells are found throughout the tissues of the body, where they continually
scan the environment through phagocytosis. These tissue resident innate immune cells are formed
when circulating monocytes extravasate from blood vessels and mature at peripheral sites.
Macrophages are one important subtype of these highly phagocytic cells found in all tissues of the
body9. Because they are found in high numbers throughout the body, macrophages are generally
considered the first line of defense against pathogens. Upon encountering particles of appropriate
size [0.5-2µM10], macrophages will ingest the particulate matter via phagocytosis. For smaller
particles such as macromolecules and viruses, macrophages also show high levels of endocytosis
through a variety of receptors, as well as performing pinocytosis11. The cell will then analyze the
contents of this ingested material through an array of specialized immune pattern recognition
receptors (PRRs)12. Depending on specific pathogen or damage associated molecular pattern
(PAMPs and DAMPs) in the material ingested or in the environment around the macrophage, the
13
cells may become activated. Macrophages will then digest the particulate matter through
proteolytic enzymes, become activated to produce various cytokines, and diminish pathogen
replication13. Ultimately it is thought that inflammatory macrophage activation represents a key
step in the initiation of the immune response to pathogens and in various inflammatory
pathologies14.
The role of macrophages in controlling bacterial infections has been well characterized. For
example, mice lacking the key innate immune cell proliferation factor, GM-CSF, have been shown
to be highly susceptible to Streptococcus15 and Listeria16 infections. While lack of GM-CSF might
also have significant off-target effects on innate immune cells other than macrophages, the specific
depletion of macrophages through a genetically encoded drug-inducible apoptosis system has also
been shown to enhance susceptibility to Yersinia pestis17. Anti-bacterial macrophage activity has
also been demonstrated as a vital element in control of Salmonella enterica serovar typhimurium
(Salmonella typhimuirum) infection18,19. In a number of viral infection models, it has also been
shown that macrophages are specifically important in limiting viral replication20–22. In dengue virus
infections for example, it has been shown that depletion of macrophages actually had slightly lower
virus within draining lymph nodes but allowed much higher systemic viral load, suggesting that
macrophage cells act to pull virus into immune sites and limit peripheral spread22.
While there is certainly strong evidence to support the vital role of macrophages in controlling
acute infection, macrophages have deleterious effects in some infections. For example, in mouse
models of necrotizing fasciitis it was shown that depletion of macrophages resulted in less systemic
dissemination of Streptococcus bacteria from a site of subcutaneous infection, ultimately leading to
improved survival23. Similarly, Salmonella typhimuirum24, Listeria monocytogenes25, C.
pneumoniae26 and several viruses27–29 also utilize macrophage cells for systemic dissemination. In
14
the case of chronic pathogens such as HIV29, Salmonella30 and Mycobacterium tuberculosis31 it is
thought that macrophages can also act as a key reservoir, aiding in persistence of these diseases.
In addition to possible deleterious effects in various infection models, macrophages are also
implicated in inflammatory pathologies. In a macrophage specific CD11b promoter driven
diphtheria toxin (DT) receptor model of macrophage depletion, macrophages have been shown to
play a key role in the acute peritoneal inflammatory response32 and atherosclerotic plaque
formation33. Similarly, liposome mediated macrophage depletion has been used to demonstrate the
role of macrophages in many models of inflammatory pathology including endotoxic shock34,35,
rheumatoid arthritis36, and implant-wear associated inflammation37. These experiments clearly
place macrophages at the centre of inflammatory program. Whether such inflammation leads to a
protective immune response or becomes pathological will ultimately be determined by a careful
balance of key signaling factors which are not yet fully understood.
1.1.A-I Innate Immune Cells and Inflammation – See Figure 1
The innate immune system relies on an array of pattern recognition receptors (PRRs) to
become activated in response to signals of damage or infection. When PRRs bind their cognate
pathogen (PAMP) or damage (DAMP) associated ligands, it is thought that this generally drives
clustering of two or more receptor monomers38. In the case of TLR proteins, ligand binding
allows the toll/IL-1 domains (TIR domains) of two or more receptors to associate, inducing a
conformational change which in turn allows signaling molecules such as Myd88 and TRIF to bind
at the intracellular tail of the receptor12. Interactions with additional signal kinases leads to the
formation of a larger complex of proteins that drives downstream signaling, eventually
culminating in the activation of nuclear transcription factors such as NF-κβ, MAPK or IRFs12.
15

Figure 1: Inflammatory signaling pathways. PAMPs and DAMPs are able to stimulate immune cells through specific PRRs. PRRs can be located on the cell surface, on vacuoles, or in the cytosol. Activation of these PRRs cause the translocation of various signaling elements to the nucleus which can induce the expression and release of inflammatory cytokines. Inflammatory stimulation can also have important metabolic affects, which may drive the release of ROS. Inflammatory cytokines can have a wide range of effects on the cell, including activation of additional transcriptional modifiers such as STATs or NF-κβ. Some cytokine receptors can also induce cell death, as is the case for the TNF-receptor.

PRR
PRR
PRR
STATs
Cell Death
Metabolic Effects
ROS
Cytokine Receptors
PRR
NF‐κβIRFs
NF‐κβ
IL‐1β
IL‐6
TNF
IFN
PAMP
DAMP
Damaged/Dying Cell
MACROPHAGE CELL
16
Recently, many PRR signaling pathways have been demonstrated to also interact with key
programmed necrosis proteins Rip1 and Rip3 (discussed in section 1.2.B-I).
The activation of nuclear transcription factors drives the expression of target genes. Taking
the activation of NF-κβ by the PRR TLR4 for example, signaling is initiated by binding of
bacterial lipopolysaccharide to the TLR4 receptor. This binding, which also involves extracellular
factors such as CD14 and MD2, activates a conformational change in TLR4. This conformational
change results in the recruitment of Myd88 to the intracellular tail of the receptor complex, which
subsequently recruits members of the IL-1 receptor associated kinase (IRAK) family39. As the
IRAKs (IRAK1, 2 and 4) become phosphorylated they associate with and catalyze the K63-
autoubiquitination of TRAF640. Non-degradative K63-ubiquitnation of TRAF6 allows the
recruitment of the NF-κβ activating TAB2/TAK1/NEMO complex. Subsequently, NEMO
becomes K63-ubiquitinated by TRAF641, which then allows it to associate with IKKα and IKKβ.
Interestingly, NEMO seems to act as a signal integrator by receiving stimulus from a number of
signalling pathways in activating NF-κβ, including TNF, Toll-like receptors, and genotxic
stress42. This complex of NEMO/IKKα/IKKβ is then able to phosphorylate the key inhibitor of
NF-κβ, Iκβ43. Phosphorylated Iκβ becomes rapidly degraded, which finally allows the
translocation of NF-κβ into the nucleus (reviewed in 44). Once in the nucleus, NF-κβ can interact
with cell specific transcription factors and bind available genes depending upon methylation and
histone interaction45. Contingent on the specific immune cells wherein NF-κβ is being activated,
the transcription of a different subset of cytokines can be activated.
Similarly to NF-κβ, expression of type-I interferon is also activated downstream of a number
of PRRs. In this case, TRIF drives the phosphorylation of the interferon-regulatory factor 3 and/or
7 (IRF3 and IRF7)46. The subsequent translocation of phosphorylated homo- and hetero-dimers
17
of IRF3 and IRF7 to the nucleus induces the expression and release of type-I interferons (IFNα
and/or IFNβ) from innate immune cells46. Thus, through the translocation of various transcription
factors into the nucleus in response to PRR stimulation, innate immune cells induce the
expression of powerful inflammatory mediators. While these inflammatory mediators can include
chemokines and cytokines; this thesis will focus on the role of cytokines in particular.
Inflammatory cytokines released by innate immune cells will quickly diffuse into the
immediate areas surrounding the site of inflammation. While cytokines are released more widely
into the body, the local effects of higher concentrations of cytokines are better defined in most
cases. Cytokine receptors have varying expression patterns depending on their specific function,
ranging from wide to highly specific expression on just a subset of immune cells9.
Upon binding their cognate receptors, cytokines can also activate a range of signaling
pathways. For example, the inflammatory cytokines IL-1 and TNFα activate NF-κβ, whereas IL-6
and interferons generally signal through the JAK/STAT1 signaling axis47. Similar to PRR
signaling, the movement of transcription factors to the nucleus induces cells to increase
expression of various genes involved in lowering the susceptibility of cells to infection, induction
of cell death, or attraction of immune cells48. In addition, cytokine signaling often drives negative
feedback cycles, as occurs with increased suppressor of cytokine signaling (SOCS) expression in
response to interferon, as well as other inflammatory stimuli49. In some cases, cytokines can also
drive cell death, as is sometimes the case in TNF signaling (see section 1.2.A-I).
Inflammatory stimulation also induces important metabolic changes within the target cell, in
particularly within immune cell types. Specifically, both PRRs50,51 and cytokine receptors52–54
have been shown to increase glucose uptake and glycolytic metabolism. In the case of innate
immune cells, such as neutrophils and macrophages, investigations have revealed a significant
18
shift in the cellular metabolism away from mitochondrial respiration and towards aerobic
glycolysis during inflammation55,56. It is believed that this switch to glycolysis actually provides
faster access to energy in inflamed tissue, despite being significantly less efficient than
mitochondrial respiration57. In addition, the glycolytic shift is thought to lower cellular
susceptibility to infection55, allow cells to resist the hypoxic environment of inflamed tissue50, and
increase cellular proliferation58.
Coincident with the metabolic shift to glycolysis, there is also an increase in the production
of reactive oxygen and reactive nitrogen species (ROS and RNS)59. Within macrophages and
other innate immune cells, ROS production occurs both at the plasma membrane, by NADPH
oxidase, and within the cytosol, by the mitochondria60. ROS and RNS can damage sensitive
biological molecules61. Some forms of these small ROS and RNS are also able to diffuse across
membranes and into neighbouring cells where they can propagate the effects of inflammation60.
In recent reports, some of the more specific connections between inflammation and ROS have
been defined. In particular, it has been shown that the cytosolic protein NLRP3 undergoes a
conformational change when it is exposed to elevated ROS levels62. In turn, NLRP3 forms a
complex with ASC and caspase-1, termed the inflammasome, which activates the cleavage and
release of a mature form of the inflammatory cytokine IL-1β63. Thus, the production and release
of ROS/RNS represents an important step in the inflammatory program (see Figure 1).
Inflammation significantly alters the metabolic state and gene expression patterns of
surrounding cells. Specific genes induced include those that code for adhesion molecules, kinases,
proteases, chaperones and various other factors48. The expression and release of cytokines and
chemokines from sites of infection leads to recruitment of innate immune cells to the site of
infection. Increased adhesion protein expression on vascular endothelial cells attracts phagocytic
19
innate immune cells to the site of infection, where they can extravasate from blood vessels64. Cell
specific effects of inflammation can also decrease the cells ‘infectability’. Taking the case of
interferon for instance, several anti-viral genes are induced: (1) ISG15 is a small protein
modifying factor akin to ubiquitin that lowers susceptibility to some viruses65,66; (2) the
expression of OAS pathway factors induces the activation of RNAse-L which in turn leads to the
transient degradation of all RNA within the cell, potentially nullifying a viral infection67; (3)
Protein Kinase R (PKR) is activated by long strands of dsRNA and leads to the phosphorylation
of eIF2a, shutting down protein translation and limiting viral replication68.
In addition to the induction of an anti-viral state, it has been demonstrated that interferon
signaling also increases cell death. By inducing a number of pro-apoptotic genes, it is thought that
interferon can promote a pro-cell death state69. There is also evidence for a more direct pathway
for interferon induced cell death. Dendritic cells, for example, have been shown to undergo a
type-I interferon dependent cell death in response to poly-I:C treatment70. Similarly, there is
evidence that interferon-β is able to induce apoptosis directly in a number of cancer cell lines71,72.
By promoting cell death in this way, type-I interferons function to increase death of infected cells
and prevent the propagation of viral pathogens68. It has yet to be investigated what effect
interferon signaling might have on programmed necrotic cell death (see section 1.2.B).
1.1.A-II Macrophage Cell Death in Bacterial Infections
Given the central role of macrophage activity in the inflammatory program outlined above,
cell death of macrophages may have particularly important implications for the pathology of an
infection. In particular, the specific mode of cell death (see section 1.2) may have important
implications for the inflammatory effect of macrophages. Interestingly, death of macrophages is
consistently observed during early stages of microbial infection73. For the most part, this death
20
has been previously attributed mostly to apoptotic cell death74, but new forms of cell death have
recently been shown to be of importance.
Work in Shigella infection was the first to show that IL-1β converting enzyme (ICE), also
known as caspase-1, was vital for both production of the inflammatory cytokine IL-1β and death
of macrophages75. This caspase-1 dependent inflammatory death of macrophages occurs in the
first few days of infection with both intracellular pathogens Shigella and Salmonella typhimurium
(ST)76. In this form of death, caspase-1 is activated through the assembly of a protein complex
known as the inflammasome, which normally cleaves pro-IL-1β to produce active cytokine77.
Activation of caspase-1 can also lead to an inflammatory form of cell death now known as
pyroptosis78. Importantly, caspase-1 has not been implicated in the pathways of extrinsic and
intrinsic apoptosis (see section 1.2.A). It was shown that pyroptosis aids in the dissemination of
ST from the gut, with pyroptosis resistant caspase-1/11-deficient mice showing less ST
invasion79. In contrast, caspase-1/11 deficient mice are more susceptible to intravenous infection
with ST80,81, underlining the complex relationships of immune response and cell death. Similarly,
components of the caspase-1 activating complex (known as the inflammasome) have also been
associated with improved responses to viral infections82,83, but a clear characterization of the role
of cell death through pyroptosis in this model was not made.
In contrast to the rapid pyroptotic form of cell death, which can be induced in macrophages
under conditions of LPS priming or high infection loads84, ST infection has also been observed to
induce a delayed mode of cell death85. For delayed ST-induced death, it has been demonstrated
that expression of PKR and TLR4 are key players in the death of infected macrophage cells86.
Somewhat similarly, the delayed death in Listeria monocytogenes infected macrophages was
found to be mediated by type-I interferon signaling87. In vivo, mice deficient in IFNAR
21
expression were also shown to be resistant to Listeria monocytogenes challenge, but viability of
macrophages was not assessed88. A deleterious role for type-I interferon signaling in bacterial
infection is somewhat paradoxical, given the well-established role of type-I interferons as key
anti-viral cytokines (discussed above). This emphasizes the need for immune responses to be
suited to specific pathogens.
1.1.B CD8+ T cells Whereas innate immune cells are primed to react directly to a wide range of pathogen
molecules, acquired immune cells, such as B and T cells, must receive highly specific stimulus in
order to become activated (see Figure 2A). New T cells are formed throughout the lifetime of an
organism. As T cells develop, they undergo a random rearrangement of V(D)J DNA elements, to
create a highly specific, and highly unique T cell receptor (TCR). T cells will continually
interrogate antigen loaded MHC molecule displayed on the surface of target cells. Generally, only
if the TCR has a high affinity for the antigen-MHC complex will it be able to form a long lasting
interaction, resulting in signals necessary for activation. In some cases, lower affinity TCRs and
MHC/antigen complexes can also form activating connections, as occurs in T cell selection and
some immune diseases. T cells can be classified by their ability to bind type-I or type-II MHC-
antigen complexes. MHC-II molecules usually present extracellular antigens to CD4 T cells, and
are mostly expressed on specialized antigen presenting cells. In contrast, MHC-I molecules are
expressed on all cell types, and present cytosolic antigens to CD8 T cells (reviewed in 9).
Following activation, antigen specific T cells will begin to proliferate. The affinity of the TCR
for the MHC-antigen complex, as well as amount of MHC-antigen complexes available on the
antigen presenting cell will determine the potency of stimulus delivered to the T cell. In addition,
the expression of costimulatory molecules and inflammatory cytokines by the APC will also impact
22
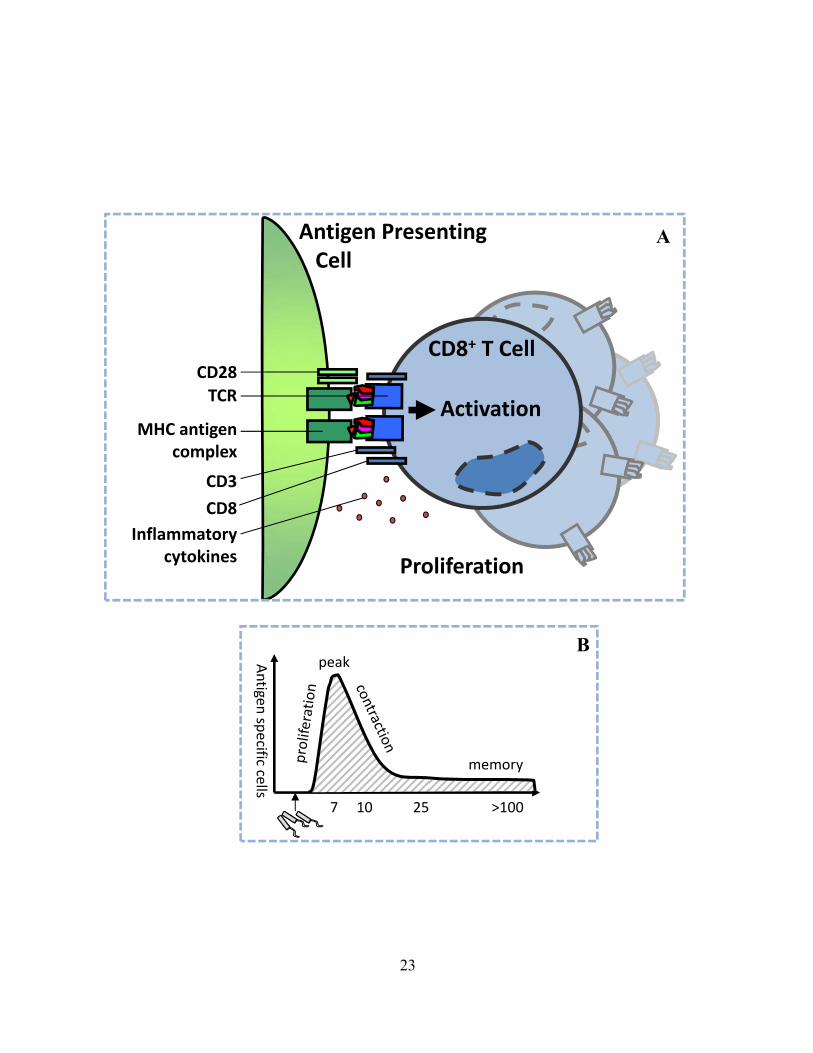
Figure 2: Antigen presentation activates the T cell response. Unlike innate immune cells, T cells must receive very specific stimulation in order to become activated. (A) T cells will continually scan the MHC-peptide complexes presented by antigen presenting cells. If the T cell encounters a high affinity MHC-peptide complex, it receives an activation signal involving the TCR. The activation signal for T cells is communicated through complex interaction of many molecules on or released from the APC (including MHC/antigen complex, CD28 and inflammatory cytokines) and molecules present on the T cell (including the TCR, CD3, and CD8 receptors). (B) Co-stimulatory molecules are engaged by signalling through PAMPs. T cell response can be divided into 4 phases. First the antigen specific T cells expand rapidly, then they reach a peak and differentiate into effector cells. Majority of T cells are removed during contraction phase, leaving a small stable pool of memory T cells.
An
tigen sp
ecific cells
peak
memory
7 10 25 >100
A
B
Activation
Proliferation
CD8+ T Cell
Antigen Presenting Cell
23
CD28
TCR
MHC antigen complex
CD3
CD8
Inflammatory cytokines
the ultimate level of T cell activation. Depending on this multitude of stimulatory factors, activated
T cells will proliferate slowly or very rapidly, up to 10 000 fold within 7 days89. Activated T cells
will undergo a differentiation program into effector cells and are then endowed with the ability to
perform specific functions, such as killing target cells and producing cytokines which aid in
elimination of specific pathogens.
CD4 T cells produce cytokines that aid in the generation of antibody responses by B cells. In
addition, activated CD4 and CD8 T cells can emigrate into the periphery, homing to sites of
inflammation by following cytokine and chemokine gradients. In contrast to CD4 T cells, CD8 T
cells can scan all peripheral cells via the ubiquitously expressed MHC-I. Upon binding their
cognate antigen-MHC complex in the periphery CD8+ T cells can induce apoptosis in target cells,
in order to eliminate intracellular infections. For this reason, CD8+ T cells are commonly known as
cytotoxic T lymphocytes (CTL) [reviewed in 90].
Following activation of T cells, the expanding numbers of antigen specific CD8+ T cells
eventually reach a point where competition of clonal cells outstrips the local resources of activation
(e.g. IL-15, antigen-MHC complexes etc…). This loss of activating stimulus pushes T cells to stop
proliferating. In acute viral and some intracellular bacterial infections, the peak of expansion
typically occurs approximately 7-8 days after challenge91–94. It is important to note that most
bacterial pathogens are extracellular and thus predominantly activate an MHC-II dominated
response, as their antigens are not present in the cytosol. Following this peak, a significant
proportion of effector CD8+ T cells emigrate to the periphery to mediate immune-surveillance and
effector function in non-lymphoid tissue. Between days 7-20 of an acute response, the majority of
primed cells are eliminated through a poorly understood process known as contraction. For
example, in an acute antigen specific responses to lymphocytic choriomeningitis virus (LCMV) or
24
Listeria monocytogenes, responding CD8+ T cells populations will contract to form a stable
memory population of ~5-10% of the peak number of cells94,95 (see Figure 2B). The exact
mechanisms that control the expansion, activation, contraction and memory of T cells are an area
of intensive investigation. While some of the key molecular interactions that control CD8+ T cell
activation have been well identified (eg MHC/TCR, costimulation, cytokine production), the
interaction of these pathways with cell death is not yet well understood.
1.1.B-I Cell Death Pathways in CD8+ T Cell Function
The role of cell death pathways in regulating T cell function is a prime example of the
complex and often paradoxical functions cell death pathways can have. When lymphocytes lack
the death receptor Fas or its ligand, this results in a serious lymphoproliferative disorder in both
mouse and human96. While this defect in the homeostatic balance of T cell numbers might seem
predictable, mutations in Fas or its signaling partners FADD and caspase-8, also result in
perplexing defects in antigen induced T cell proliferation97,98. The importance of caspases in T
cell activation is reiterated by defective T cell activation observed in humans lacking functional
caspase-899. Furthermore, chemical inhibitors of caspases have been shown to inhibit T cell
activation4. This adds to a growing paradigm whereby apoptotic mechanisms, normally
associated with cell death, seem to also play a role in cell proliferation and differentiation100.
Specifically, caspase-3 activation without cell death has been observed associated with the normal
differentiation of skeletal muscle cells101, macrophages102, and erythroblasts103.
Recently it has been revealed that the reason that caspase-8 expression is needed in CD8+ T
cells is that it specifically limits the induction of a specialized type of cell death known as
programmed necrosis104. Consistent with this, defective T cell responses can thus be rescued by
concurrent knockdown of Rip3 in order to eliminate the activation of programmed necrosis105.
25
These Rip3/caspase-8 double knockout animals do show an accumulation of atypical
lymphocytes similar to Fas deficient animals106. At this time while it is clear that caspases are
expressed and activated within in vitro stimulated T cells97,107,108, it is unclear what processes
drive this activation. Through examination of apoptotic markers during the entirety of the CD8+ T
cell response to a constant antigen (OVA) under divergent conditions, we hope to gain insight
into the link between the signaling networks of immune stimulation and cell death.
Interestingly, Rip3/caspase-8 double knockout T cells also showed a normal contraction of an
antigen specific response, suggesting that neither extrinsic apoptosis (see section 1.2.A-I) nor
programmed necrosis (see section 1.2.B) are required for T cell contraction105. Treatment of mice
with caspase inhibitors during T cell contraction has similarly been shown to have no effect on
contraction109. In contrast to this view, mice deficient in the pro-apoptotic mitochondrial outer
membrane protein, Bim, have been demonstrated to show less T cell contraction following a CD8
T cell response110,111. A protein which is very similar to Bim, Puma, has also been shown to
function in the removal of activated T cells112. Furthermore, double knockout mice for Fas and
Bim show almost no contraction following an antigen specific T cell response and severe
autoimmune pathology7,113,114. Given the additive effects that observed for these pro-apoptotic
mediators, it seems likely that overlapping death pathways are at play in the removal of activated
T cells by contraction.
1.2 PROGRAMMED CELL DEATH
Death of tissues of the body following extreme injury and/or infection has been referred to as
necrosis since the time of Galen in ancient Rome115. By the mid-19th century, medical journals were
publishing many accounts of painful necrosis of tissue, mostly within damaged bones in a process
26

that would now be known as osteonecrosis116. Even at this early time, it was recognized that damage
effecting the vascular conveyance of nourishment was likely driving the ‘mortification’ of tissues117.
The association of necrosis with infections and immune reactions was also becoming clear by 1885,
as scientists observed the ‘inflammatory exudation’ of fibrous tissue associated with tissue necrosis
induced by experimental models of diphtheria118.
In parallel with these observations of necrosis, the first scientific observations were also being
made of a quieter (non-inflammatory) type of cell death associated with natural fetal development. In
a seminal 1885 paper, after having recently coined the term mitosis, the German biologist Walther
Flemming observed that the maturing ovarian follicle was littered with cellular debris released from
cells with shrunken (pyknotic) nuclei119. In beautiful camera obscura drawings, Flemming clearly
showed the nucleus of the cell breaking into smaller fragments in a process he coined
chromatolysis120. While it was proposed that this form of cell death might provide a key function in
all organs of the body whenever cells must be eliminated, the subject remained largely restricted to
developmental biology throughout the early part of the 20th century. It wasn’t until 1972 when this
type of cell death was rediscovered and coined apoptosis121. At this time, scientists quickly saw the
potential role of this form of cell death and acknowledged that it was a “basic biological
phenomenon” which occurred throughout all tissues121.
Today, several more forms of cell death have been defined (such as autophagy or pyroptosis), but
the two most studied remain apoptosis and necrosis. Owing to its association with various
inflammatory tissue pathologies, necrosis has usually been seen as a ‘death by default’ caused by
cellular damage or nutrient withdrawal. However, recent work has shown that necrosis can also
occur by specific programmed mechanisms (discussed below)122. The existence of this specialized
pathway of necrosis has now led some to question whether necroptosis might have a specific
27
functional relevance. Can a controlled level of inflammatory cell death be beneficial for the rapid
activation of an immune response at the site of an infection? What role does this type of cell death
potentially play in pathologies? These questions have become the subject of intensive research, and
are the subject of much of this thesis.
1.2.A Apoptosis Apoptosis has been specifically defined as cellular death characterized by cell rounding,
chromatin condensation, nuclear fragmentation, and plasma membrane blebbing (release of small
membrane vesicles) by the Nomenclature Committee on Cell Death123. Generally, apoptosis is
differentiated into that induced by extrinsic signaling (death receptors, see section 1.2.A-I) and
intrinsic signaling (mitochondrial signaling, see section 1.2.A-II)124. Both of these pathways
usually involve the activation of apical caspases (caspase-8 or caspase-9) which in turn activate
downstream effector caspases such as caspase-3 (see Figure 3). Ultimately, the activation of the
caspase cascade leads to the activation and/or translocation of various factors to the nucleus which
begin to fragment the DNA125. Concurrently, the plasma membrane of apoptotic cells becomes
highly active, displaying rapid blebbing which can extend over the course of several hours. The
final demise of the cell can eventually lead to loss of plasma membrane integrity known as
secondary necrosis; although, it is thought that phagocytic removal of apoptotic cells mostly
prevents this process from happening in vivo126.
1.2.A-I Extrinsic Apoptosis
Extrinsic apoptosis occurs when death receptors on the cell surface are stimulated. Upon ligand
binding, pre-assembled trimers of death receptors undergo conformational changes which allow
28
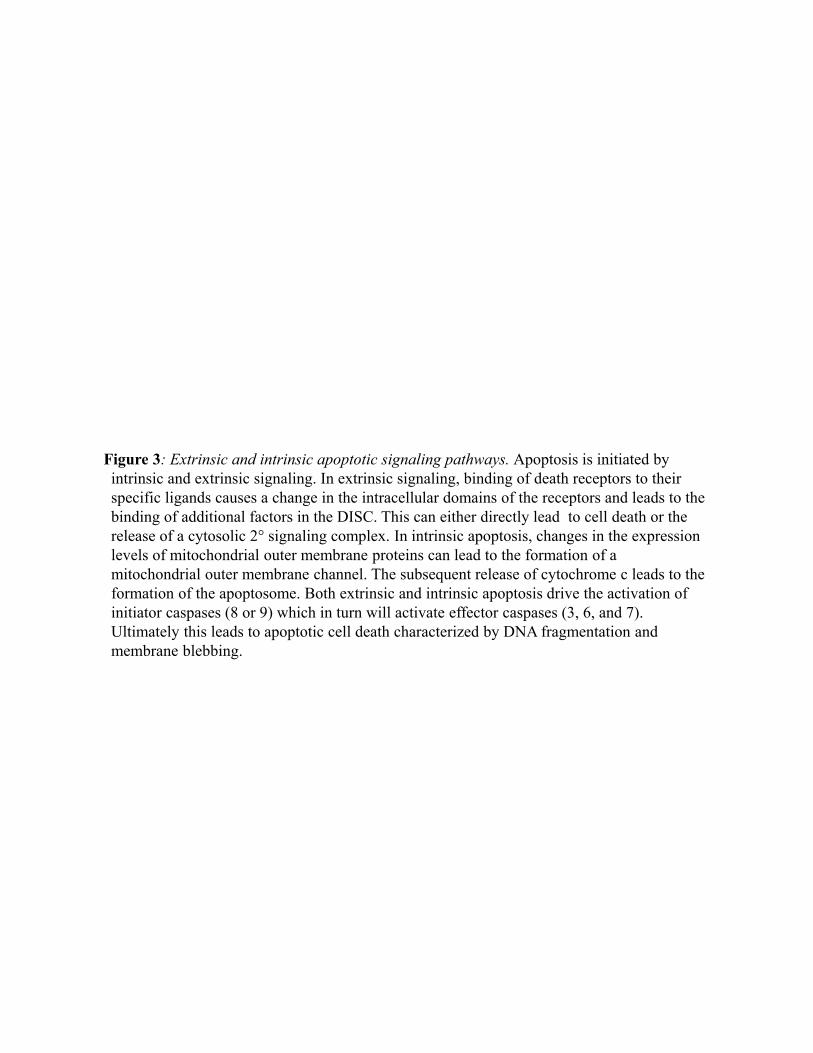
Figure 3: Extrinsic and intrinsic apoptotic signaling pathways. Apoptosis is initiated by intrinsic and extrinsic signaling. In extrinsic signaling, binding of death receptors to their specific ligands causes a change in the intracellular domains of the receptors and leads to the binding of additional factors in the DISC. This can either directly lead to cell death or the release of a cytosolic 2° signaling complex. In intrinsic apoptosis, changes in the expression levels of mitochondrial outer membrane proteins can lead to the formation of a mitochondrial outer membrane channel. The subsequent release of cytochrome c leads to the formation of the apoptosome. Both extrinsic and intrinsic apoptosis drive the activation of initiator caspases (8 or 9) which in turn will activate effector caspases (3, 6, and 7). Ultimately this leads to apoptotic cell death characterized by DNA fragmentation and membrane blebbing.
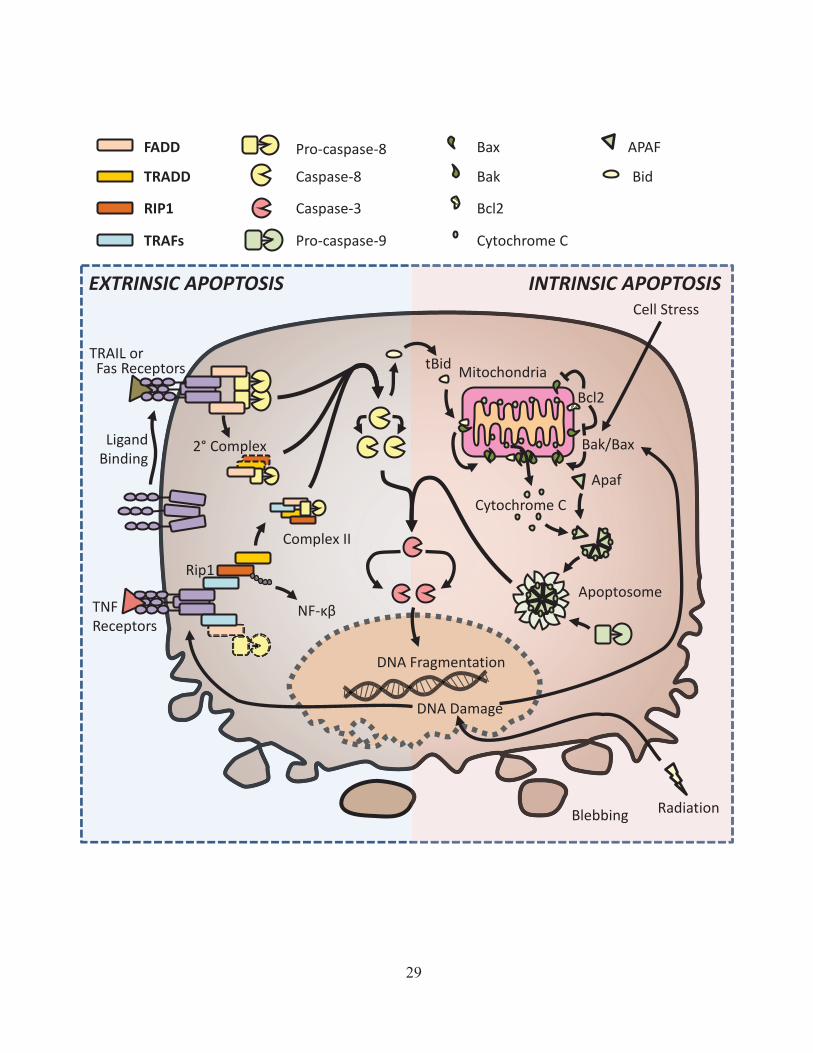
Pro-caspase-8
29
Cytochrome C
Bcl2
Apaf
Apoptosome
Radiation
DNA Damage
Cell Stress
Ligand Binding
Fas Receptors
TNF Receptors
TRAIL or tBid
INTRINSIC APOPTOSIS EXTRINSIC APOPTOSIS
DNA Fragmentation
Blebbing
Mitochondria
Rip1
2° Complex
Complex II
NF-
Bak/Bax
FADD
TRADD
RIP1
TRAFs
Caspase-8
Caspase-3
Pro-caspase-9
Bak
Bax
Bcl2
Cytochrome C
APAF
Bid
the assembly of the death inducing signaling complex (DISC) at the intracellular tail of the
receptor127. The first member of the DISC to be recruited is the Fas-Associated Death Domain
protein (FADD), through homotypic interaction of death domains (DD) found in both the death
receptor and FADD128. FADD also contains a death effector domain (DED) which can form
homotypic interactions with a DED in caspase-8129. There is also evidence that higher level
clustering of death receptors aid in the initiation of death signaling130.
In addition to the membrane associated DISC complex, the caspase-8 and FADD containing
complex can be released into the cytosol where it forms what is known as the secondary
complex131. The Fas/TRAIL induced secondary complex may contain additional signaling factors
such as the TRADD, TRAF2 and Rip1-kinase which can drive other non-cell death signaling such
as cytokine or chemokine production132. Overall, both the membrane associated DISC and
cytosolic secondary complex are thought to function by allowing multiple caspase-8 molecules
into close proximity with each other, leading to their mutual cleavage and activation133. This
active form of cleaved caspase-8 can in turn cleave and activate caspase-3, eventually resulting in
apoptotic cell death. Interestingly, new data suggests that propagation in the activation of apical
caspases may also rely on feedback from effector caspases134,135.
While death receptors can drive cytokine or chemokine expression in some cases, the typical
outcome of signaling through FAS/TRAIL receptors is considered to be apoptosis. In contrast to
this, TNF receptor (TNFR) signaling is chiefly associated with pro-inflammatory signaling and
will only induce apoptosis under certain conditions136 (See Figure 2). Instead of binding to
FADD, the TNFR recruits the TNFR-associated death domain protein (TRADD) which lacks a
DED, and thus cannot recruit caspase-8 directly137. Through homotypic interaction between their
death domains, TRADD then recruits receptor interacting protein kinase 1 (Rip1)138. Other
30
members of the TNFR membrane complex (known as Complex I), also include TNFR-associated
factor 2 (TRAF2) and cellular inhibitors of apoptosis (cIAP)136. Currently it is thought that cIAP
proteins mediate non-degradative (K63) ubiquitination of Rip1, which in turn allows the
recruitment of the NF-kB signaling factors, and the initiation of pro-inflammatory signaling139.
In contrast to the view that cIAPs are required for NF-κβ signaling, Rip1 knockout fibroblast
cells were recently shown to only have only minor defects in NF-κβ activation and normal
cytokine production in response to TNF stimulation140,141. It has also been shown that treatment of
some cancer cells with a cIAP inhibitor actually results in an increase in constitutive NF-κβ
activation142,143, which in turn can drive the autocrine secretion of TNF-α144. Genetic deficiency
for cIAP expression can also increase non-canonical NF-κβ signaling downstream of the TNF-
receptor145, and is associated with B-cell cancers such as multiple myeloma146. While the exact
role of cIAPs in NF-κβ remains unclear, there is strong evidence to show that cIAPs are key
regulators of Rip1 dependent cell death (discussed further in section 1.2.B). Regardless of the
specific signaling axis responsible, TNFR signaling typically leads to the activation of NF-kB,
ultimately resulting in the production of pro-inflammatory cytokines such as IL-6 and TNF-α147.
For TNFR signaling to result in apoptosis instead of cytokine production, the membrane
associated TNFR complex must be released into the cytosol to form what is known as complex II.
Similar to the secondary complex sometimes formed in FAS/TRAIL signaling, complex II
involves the association of the cytosolic TRADD/Rip1/TRAF2 complex with FADD and caspase-
8148. In addition to these factors, cytosolic death signaling complexes may recruit the cellular
FLICE/caspase-8 like inhibitory protein (cFLIP)149. Because cFLIP lacks the protease function of
caspase-8, it will inhibit caspase-8 cleavage and activation of apoptosis150. Thus, depending on
the mix of components present in complex II, it may or may not result in cleavage and activation
31
of caspase-8. As in other death receptor signaling, active caspase-8 amplifies the apoptotic signal
through further cleavage of caspase-8, eventually resulting in activation of effector caspases and
apoptotic cell death151.
1.2.A-II Intrinsic Apoptosis
The other major form of apoptosis is known as intrinsic apoptosis (see Figure 3). Unlike
extrinsic apoptosis, this form of cell death is controlled by signals intrinsic within the cell,
specifically by signals derived from the mitochondria. This form of cell death can be triggered by
a number of cell stressors such as DNA damage, oxidative stress, growth factor deprivation or
hypoxia124. For instance, cell exposure to ionizing radiation results in double strand breaks (DSB)
in DNA, which in turn recruits a DSB complex and activates ATM kinase152. Active ATM kinase
then activates the key tumor suppressor transcription factor p53 through phosphorylation153.
Active p53 induces increased expression of many target genes, including death receptors such as
FAS and the pro-apoptotic protein Bax154.
Bax is a member of a group of pro-apoptotic and anti-apoptotic regulatory proteins known as
the BCL-2 family. The namesake of this family of proteins was initially identified for its
overproduction in B cell lymphomas (hence BCL-2)155. Since its discovery, a number of BCL-2
homology (BH) proteins have been discovered, which are further subdivided according to the
number of BH domains the proteins contain. Those containing 4 BH (numbered 1-4) domains are
anti-apoptotic and include Bcl-2, Bcl-XL and Bcl-w. Proteins with only 3 BH domains are pro-
apoptotic and include Bax and Bak. Finally, there are several pro-apoptotic proteins which have
only one BH domain (BH3-only); these include Bid, Bim and PUMA (reviewed in 156).
32
Under optimal conditions, Bax is located in the cytosol of cells, where protein chaperones
such as 14-3-3 silence its activity157. Phosphorylation of 14-3-3 allows Bax to then translocate to
the mitochondrial outer membrane. The translocation of Bax to the mitochondria is not adequate
for activation of apoptosis, however, as anti-apoptotic Bcl-2 proteins are also located at the
mitochondrial membrane and will act to bind and inhibit Bax or Bak155. Similarly, the expression
of BH3-only proteins is thought to inhibit anti-apoptotic Bcl-2 family proteins, thus de-inhibiting
Bax and Bak and precipitating mitochondrial apoptosis158. In addition to this, Bid cleavage by
caspase-8 has been shown to produce a truncated Bid (tBid) which can directly interact with Bax
and encourage apoptosis induction159. As the amount of Bax or Bak at the mitochondrial
membrane begins to outweigh the amount of Bcl-2, this will allow Bax and Bak to increasingly
associate. Eventually 9 or 10 Bax and/or Bak monomers will associate into oligomeric channels
in the outer mitochondrial membrane160.
The assembly of Bax/Bak channels on the mitochondrial surface results in mitochondrial
outer membrane permeabilization (MOMP). This leads to the release of several pro-apoptotic
factors from the mitochondria, including cytochrome c161. Once in the cytosol, cytochrome c is
able to interact with APAF, which drives the association of up to 7 APAF-1/cytochrome c
molecules into a macromolecular complex162. This oligomerization process exposes the CARD
domains of APAF-1 which results in the recruitment of caspase-9 through homotypic
interaction163, similarly to the DD interactions between FADD and caspase-8 noted above. In
contrast to caspase-8, it is thought that cleavage of caspase-9 is not strictly necessary for the
activation of caspase-9; rather, simple dimerization of caspase-9 within the apoptosome is
adequate to activate catalytic activity of caspase-9164. Assuming there is adequate caspase-9
33
available, the apoptosome will drive cleavage of effector caspases and apoptotic death in a similar
fashion as described for caspase-8 in extrinsic apoptosis165.
1.2.A-III Caspase-3
Activation of the effector caspases, caspases-3, -6, and/or -7, occurs downstream of both the
extrinsic and intrinsic apoptosis pathways. The gene homologous to human caspase-3 was
initially discovered for its role in programmed death of specific cells during C. elegans
development, and was thus coined C. elegans death protein 3 (CED-3)166. It was later shown that
this protein was homologous to the protease then referred to as IL-1β converting enzyme (ICE),
now known as caspase-1167. This family of cysteine-aspartic acid proteases was eventually
renamed caspases in 1996168. The vital need for caspase-3 and apoptosis in development is
exemplified by the fact that caspase-3 deficient mice show perinatal death due to abnormalities in
brain formation, although some strains of mice are viable169. It is thought that compensatory
upregulation of caspase-7 is responsible for survival within these mice170. Consistent with this,
thymocytes deficient in caspase-3 show some delays in death but are still able to undergo
apoptosis in response to a number of stimuli171, whereas caspase-3/7 double knockout thymocytes
were shown to be deficient for intrinsic apoptosis172.
Generally, the function of these effector caspases is to activate a variety of mechanisms
associated with cell death through promiscuous cleavage of a large number of substrates173. One
well characterized target is the DNAse inhibitor ICAD; cleavage of ICAD by caspase-3 results in
de-inhibition of DNA fragmentation174. Similarly, caspase-3 also cleaves and inactivates
multiple members of focal adhesion kinases175 and the actin filament network176 contributing to
the cell detachment, shrinkage, and rounding associated with apoptosis. Thus, by targeting a
34
variety of proteins for cleavage, effector caspases directly affect the terminal phases of apoptosis
and drive cell death.
In addition to its role in precipitating apoptosis, caspase-3 has been shown to have some non-
apoptotic roles in various cell signaling pathways. In Drosophila, the connection of caspase
activation to proliferation has been well characterized. Studies have shown that expression of an
exogenous inhibitor of caspases can allow the activation of caspase-analogues without cell death
in the insect cells; fascinatingly, this activation of caspases leads to enhanced cellular
proliferation177. Caspase-3 has specifically been implicated in the differentiation of neurons, and
in the maintenance of synaptic plasticity178. In both inhibitor studies and caspase-3 deficient mice,
it has been shown that memory formation is affected, although the exact mechanism of this action
is not entirely clear179. Similarly, caspase-3 has also been shown to act in the differentiation of
macrophage cells through an unknown mechanism, although it seems to involve protection from
cell death102. Finally, there is evidence to indicate that caspase-3 as well as other caspases are
important for normal T cell activation, proliferation and differentiation (see section 1.1.B-I).
1.2.A-IV SMAC and IAPs
In addition to the release of cytochrome c following MOMP (as described in section 1.2.A-
II), many other regulators of apoptosis are also released from the mitochondria. Among these
factors is a small protein which acts to drive the degradation of the inhibitor of apoptosis proteins
(IAPs), known as SMAC. SMAC was first identified when a research group noticed that
detergent lysed membrane fractions had novel caspase activating properties180. These researchers
were able to specifically identify and isolate a novel protein which they coined as the second
mitochondrial activator of cell death (hence SMAC)180. Published simultaneously, the work of
35
another group was focusing on finding an IAP binding protein181, analogous to the known pro-
apoptotic mediators in Drosophila182. This group showed that a specific protein was capable of
binding and inhibiting the X-linked inhibitor of apoptosis (xIAP); they coined this protein as the
direct IAP binding protein with low pI (DIABLO). Thus, SMAC/DIABLO (henceforth referred to
as SMAC) was shown to be a key de-inhibitor of caspases and promoter of apoptosis.
It was later shown that SMAC can form homodimers, greatly increasing their ability to
inhibit the xIAP183. It has also been demonstrated that SMAC is able to induce the auto-
ubiquitination and degradation of the cellular-IAPS (cIAP1 and cIAP2)184. Both xIAP and cIAPs
were initially identified to directly bind apoptotic caspases, and were thus thought to act as
inhibitors of apoptosis185,186. While xIAP is generally accepted to be a bona fide caspase
inhibitor, cIAPs are no longer thought to directly inhibit caspases187. Rather, cIAPs have been
identified to have important alternative roles in NF-κβ signaling187. The best studied mechanism
of cIAPs is their E3 ubiquitin ligase activity. In particular, cIAP seem to have a key role in
ubiquitination and regulation of Rip1 kinase in the TNFR complex (discussed further in section
1.2.B, see Figure 2)188,189. Interestingly, monoubiquitylation of caspases 3 and 7 by cIAPs has
been observed190, but at this time it remains unclear what the functional consequences of this
might be. Thus, through interaction with many targets, poly-, mono- and auto-ubiquitylation, IAP
proteins perform many complex functions in the regulation of apoptotic signaling.
Since the discovery of SMAC, there has been intense scientific interest in the role of IAPs
and SMAC. This interest has been accelerated by the discovery that cIAPs are overexpressed in
many forms of cancer145. Given that TNF-α is also overexpressed in many tumours191, the ability
of cIAPs to convert the TNF-α signal from pro-apoptotic to pro-survival/inflammatory NF-κβ
signaling (see section 1.1.A-I) may be important in the enabling the process of oncogenesis145.
36
With the goal of inhibiting the activity of IAPs within cancer cells, small molecule SMAC
mimetics (SMs) have been developed. While these SMs were initially intended as a means to
inhibit xIAP and thus induce caspase mediated apoptosis, a number of papers have shown that
these compounds are often dependent on the degradation of cIAPs192. This loss of cIAP
expression drives cell death via a TNF-α dependent apoptosis pathway involving Rip1kinase and
caspase-8142–144,193 (discussed further below).
1.2.B Necroptosis Since the term apoptosis was coined in the 1970’s, the bulk of research into cell death has
concentrated on discovering the mechanisms that regulated this form of cell death (as described
above). During this time, apoptosis was often used synonymously with any form of programmed
cell death, whereas necrosis described unregulated mechanisms such as nutrient deprivation or
cellular damage119. This over-simplified paradigm was never truly accurate. Rather, types of cell
death are better defined based on their morphological characteristics; with apoptosis showing
blebbing and nuclear condensation (see above), whereas necrosis exhibits rapid membrane collapse
and release of cytosolic material123.
Over the last 15 years, findings have conclusively demonstrated that necrosis can be the result of
programmed signaling194,195. It was only a short time after the canonical apoptosis inhibitor z-
VAD-FMK (zVAD) was demonstrated to specifically inhibit caspases196, researchers reported that
death receptor stimulation combined with zVAD could result in necrotic-like cell death197. This
observation was quickly followed up with a number of other publications showing that something
akin to necrosis occurs in caspase inhibited cells198–201. It has now been conclusively shown that
caspase-8 is the key inhibitor of programmed necrosis, as embryonic lethality observed in caspase-
8 knockout mice can be rescued by also knocking out the key programmed necrosis protein
37
Rip3106. Now known as necroptosis, programmed necrosis is often thought of as a back-up
mechanism of apoptosis, normally inhibited by caspases202, although it is now clear that caspase
inhibition is not always required in order to activate necroptosis.
It was in work examining the induction of this caspase-independent cell death by Fas-receptor
signaling, wherein Rip1-kinase activity was first shown to be required for programmed necrosis203,
but a similar effect for TNF soon followed122. The next big leap forward for the field of
programmed necrosis came with a seminal paper from the Yuan group at Harvard Medical School,
wherein they coined the term necroptosis to refer to programmed necrosis204. In this paper, they
also identified a novel small molecule inhibitor of cell death induced by combined TNF-α and
zVAD treatment, which they called necrostatin-1 (nec)204. This group also later confirmed that nec
specifically inhibits Rip1 kinase activity to block necroptosis205. Rip3 was later demonstrated to
also be essential for sensitivity to necroptosis206.
With the advent of an unambiguous name for Rip1-dependent programmed necrosis and an
easily employed inhibitor, research into necroptosis has greatly accelerated in recent years. As
discussed above, cIAPs function as E3 ubiquitin ligases for Rip1188. Through this ubiquitination of
Rip1 it has been proposed that cIAPs prevent the activation of necroptosis in response to TNF-α
signaling148,207, whereas other enzymes such as A20 and CYLD can deubiquitinate Rip1 and
promote necroptosis208–210. Similar to the initiation of apoptosis through TNFR signaling,
necroptosis also relies on the formation of a secondary cytosolic complex known as complex IIb or
the necrosome211 (see Figure 4). It is unclear at this point whether additional factors in the TNFR
DISC are responsible for the initial phosphorylation of Rip1, but the ultimate formation of the
necrosome complex is known to depend on the sequential phosphorylation of Rip1 and Rip3
kinases206.
38
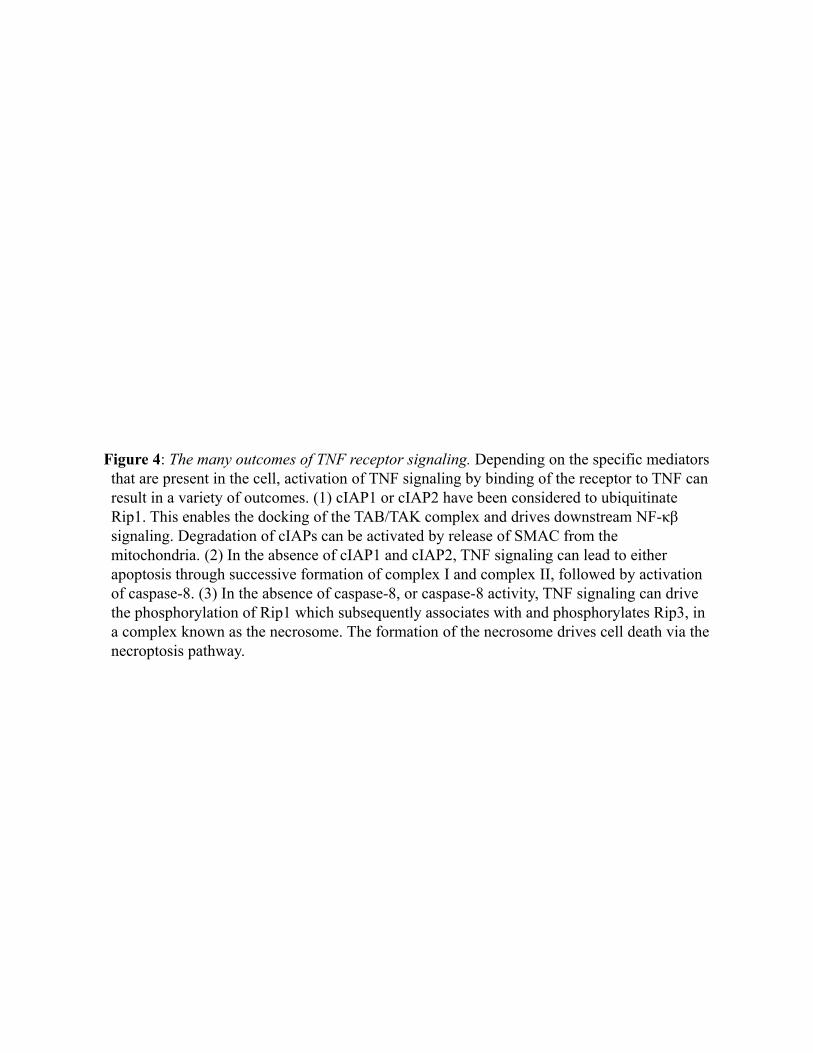
Figure 4: The many outcomes of TNF receptor signaling. Depending on the specific mediators that are present in the cell, activation of TNF signaling by binding of the receptor to TNF can result in a variety of outcomes. (1) cIAP1 or cIAP2 have been considered to ubiquitinate Rip1. This enables the docking of the TAB/TAK complex and drives downstream NF-κβ signaling. Degradation of cIAPs can be activated by release of SMAC from the mitochondria. (2) In the absence of cIAP1 and cIAP2, TNF signaling can lead to either apoptosis through successive formation of complex I and complex II, followed by activation of caspase-8. (3) In the absence of caspase-8, or caspase-8 activity, TNF signaling can drive the phosphorylation of Rip1 which subsequently associates with and phosphorylates Rip3, in a complex known as the necrosome. The formation of the necrosome drives cell death via the necroptosis pathway.
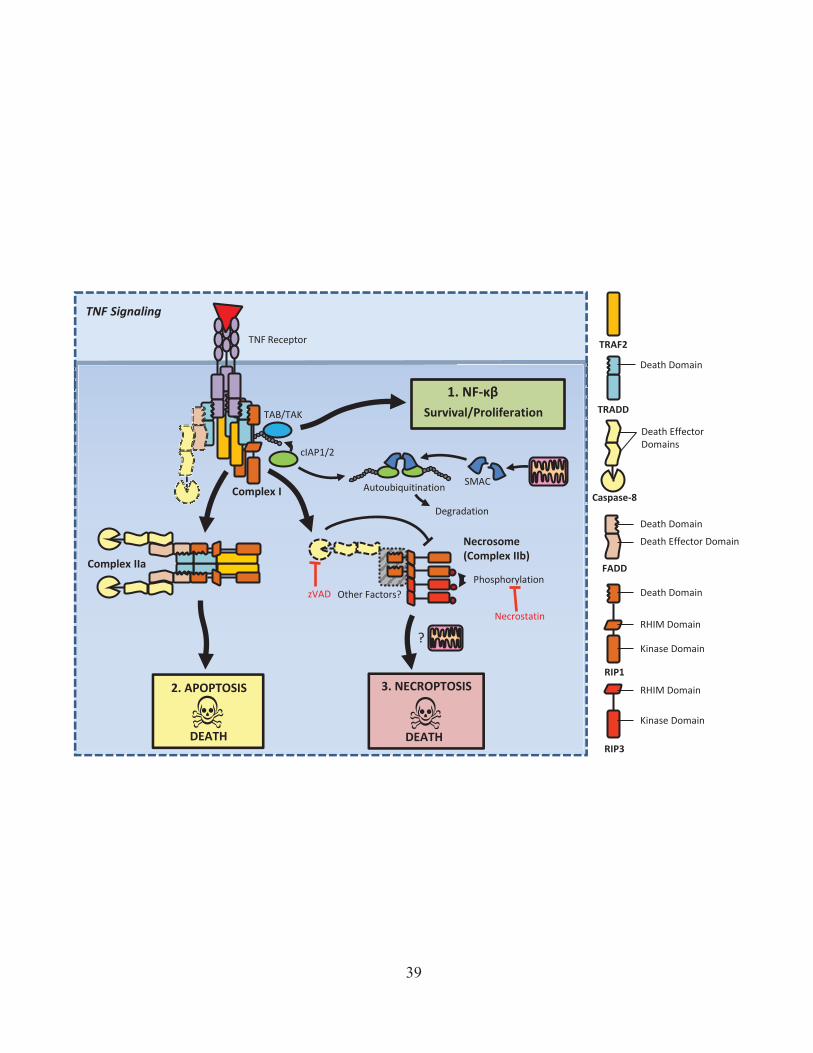
TRADD
Death Domain
Caspase-8
Death Effector Domains
FADD
Death Effector Domain
Death Domain
TRAF2
RIP1
Death Domain
RHIM Domain
Kinase Domain
TNF Receptor
Necrosome (Complex IIb)
Complex I
Complex IIa
cIAP1/2
RIP3
RHIM Domain
Kinase Domain
2. APOPTOSIS
TAB/TAK
3. NECROPTOSIS
Phosphorylation
?
Necrostatin
zVAD
TNF Signaling
1. NF-
Survival/Proliferation
DEATH DEATH
Degradation
SMAC Autoubiquitination
Other Factors?
39

The involvement of factors other than Rip kinases in the necrosome complex is unclear at this
point. It has been shown that genetic depletion of either FADD or caspase-8 results in embryonic
lethality due to uncontrolled necroptotic cell death in the developing embryo150, suggesting that the
formation of FADD and caspase-8 containing complexes (ie Fas 2° complex or TNFR complex II)
inhibits the formation of the necrosome. Consistent with this, knocking out of either Rip3 or Rip1
rescues embryonic lethality in FADD-/- mice140,150. It is not known what role TRADD plays in the
formation of the necrosome, although knockdown of this gene seemed to have little impact on
sensitivity to necroptosis in L929 fibroblast cells212. Importantly, an apoptosis inducing complex
similar to the necrosome, involving Rip1 kinase activity, caspase-8 and FADD has recently been
reported207. This complex is also inhibited by cIAP activity, and is known as the Ripoptosome213.
Generally, the phosphorylation driven assembly of the Rip1 and Rip3 necrosome has been
consistently associated with the initiation of necroptosis; although, new evidence has shown that
when Rip3 is overexpressed, TNF stimulation is able to induce necroptosis in the absence of
Rip1214. This suggests that Rip1 may simply act as a signal amplifier in activating the downstream
necroptotic activity of Rip3. Rip1 and Rip3 associate through binding of their RIP homotypic
interaction domains (RHIMs)215. One recent paper has shown that many phosphorylated Rip1 and
Rip3 proteins can assemble in amyloid like structures via interactions of their RHIM domains216.
This raises the possibility that the amyloid-like oligomerization of the necrosome could constitute a
feedback mechanism to amplify pro-necroptotic signaling and drive cell death.
Downstream of the activation of Rip1 and Rip3 phosphorylation, recent work has also shown
that Rip3 associates with, and phosphorylates the mixed-lineage kinase like protein (MLKL),
which leads to necroptotic cell death217. In addition to the MLKL dependent pathway, Rip1
activation has also been shown to lead to the inhibition adenine nucleotide translocase (ANT) pores
40
on the mitochondria; this drives the release of ATP from the mitochondria218. Some cells can also
be protected from programmed necrosis through the inhibition of cylophilin D (CYPD) by
cyclosporine A219. CYPD is a key protein for generating the mitochondrial permeability transition
pore (MPTP), which allows unregulated movement of ions into the mitochondria220.
Necroptosis has also been associated with the elevated production of reactive oxygen species
(ROS)221. The release of mitochondrial ROS during necroptosis has been documented to steadily
increase preceding necroptotic cell death in fibroblast cells, followed by a rapid collapse as the
plasma membrane integrity is lost221. Consistent with this, some results have shown that treatment
with ROS scavengers can protect some cell lines from necroptotic cell death (eg. L929 fibroblast or
HT-22 neuronal cells)222,223. Complicating the situation, however, it appears that cells of
hematopoietic origin (eg. U937 or Jurkat lymphocyte cells) are not protected from necroptosis by
ROS scavengers218,224. To resolve this dissonance, it has been proposed that there exist at least two
classes of cells which are susceptible to necroptotic cell death. In type-I cells, death relies on
activation of the MPTP pathway without requiring ROS, whereas type-II cells require the
generation of high levels of ROS in order to undergo necroptosis215. The recently discovered
Rip3/MLKL necroptosis pathway has been associated with ROS production217, but it remains
unclear whether it might also play a role in ROS independent necroptosis.
While the best characterized mode of inducing necroptotic cell death is through the death
receptors TNFR, FAS and TRAIL203,225, it has very recently been shown that certain
immunoreceptors can also activate necroptotic signaling. In particular it has been shown that
stimulation through toll-like receptors 3 and 4 (TLR3 and TLR4, see section 1.1.A-I) can induce
necroptosis when combined with the zVAD to block caspase activity226. Specifically, it was shown
that ligand binding by TLR3 or 4 caused TRIF to interact directly with Rip3 via a RHIM contained
41
in TRIF. Thus TRIF drives activation of the necrosome and necroptosis226. Similar to TRIF, it has
also recently been demonstrated that the cytoplasmic DNA sensor DAI is able to interact with both
Rip1 and Rip3 via its RHIM domain227. The DAI dependent pathway was also shown to be
important in murine cytomegalovirus (MCMV) induced cell necrosis228. In addition to these
pathogen associated molecular pattern (PAMP) sensing pathways, new work has demonstrated that
genotoxic stress can activate assembly of a Rip1 and Rip3 dependent complex similar to the
necrosome, and which promotes both apoptotic and necroptotic cell death213,229. These examples
add to a new paradigm wherein the necrosome acts as a functional integrator of multiple signaling
axes in the initiation of necroptosis (see Figure 5, reviewed in 230).
The activation of Rip1 and Rip3 kinases and downstream effectors eventually leads to rapid
necrotic release of cytoplasmic material into the extracellular space. It is thought that this cytosolic
release likely represents a potent inflammatory stimulus. The specific cytoplasmic components
responsible for this effect are collectively known as damage associated molecular patterns
(DAMPs). The archetypal DAMP, HMGB1, has been well associated with inflammatory
pathologies such as rheumatoid arthritis231, lupus232, and sepsis233. While it can also be secreted by
mechanisms independent of cell death, release of HMGB1 is usually associated with the loss of
plasma membrane integrity234, and has been recently observed following Rip1 kinase dependent
death207,235.
1.2.B-I Necrotic Cell Death and Inflammation
There is ample evidence to show that inflammation is an important activator of cell death (as
discussed above), but the reverse question should also be asked: how important is necrotic cell
death as a source of inflammation? The existence of a programmed pathway of necrosis begs the
42
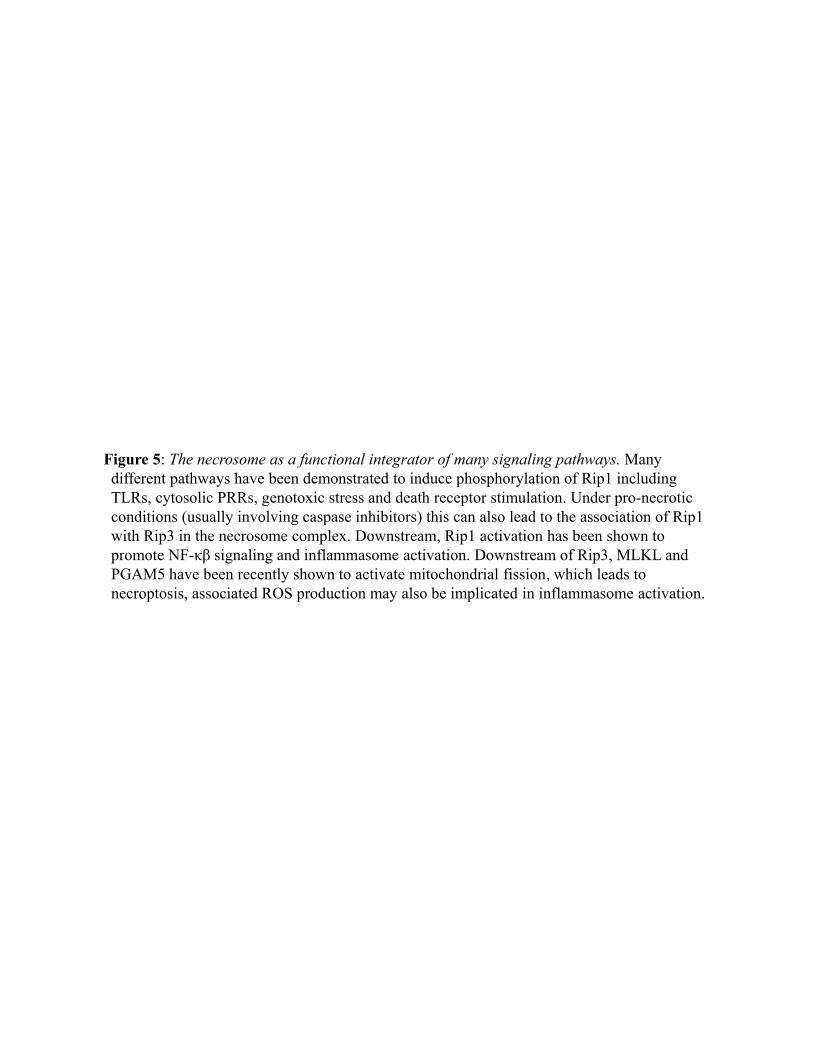
Figure 5: The necrosome as a functional integrator of many signaling pathways. Many different pathways have been demonstrated to induce phosphorylation of Rip1 including TLRs, cytosolic PRRs, genotoxic stress and death receptor stimulation. Under pro-necrotic conditions (usually involving caspase inhibitors) this can also lead to the association of Rip1 with Rip3 in the necrosome complex. Downstream, Rip1 activation has been shown to promote NF-κβ signaling and inflammasome activation. Downstream of Rip3, MLKL and PGAM5 have been recently shown to activate mitochondrial fission, which leads to necroptosis, associated ROS production may also be implicated in inflammasome activation.
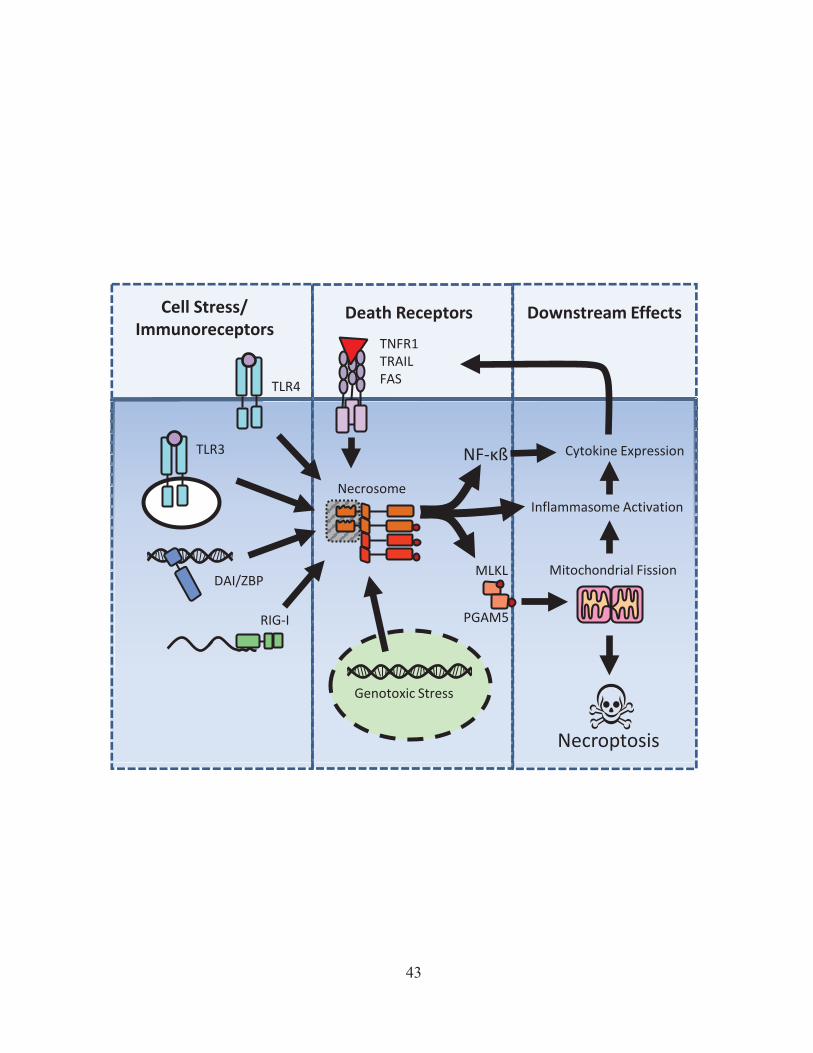
Necrosome
Death Receptors
TNFR1 TRAIL FAS
Cell Stress/ Immunoreceptors
TLR4
TLR3
DAI/ZBP
RIG-I
Genotoxic Stress
Necroptosis
NF- ß
MLKL
PGAM5
Mitochondrial Fission
Cytokine Expression
Downstream Effects
Inflammasome Activation
43
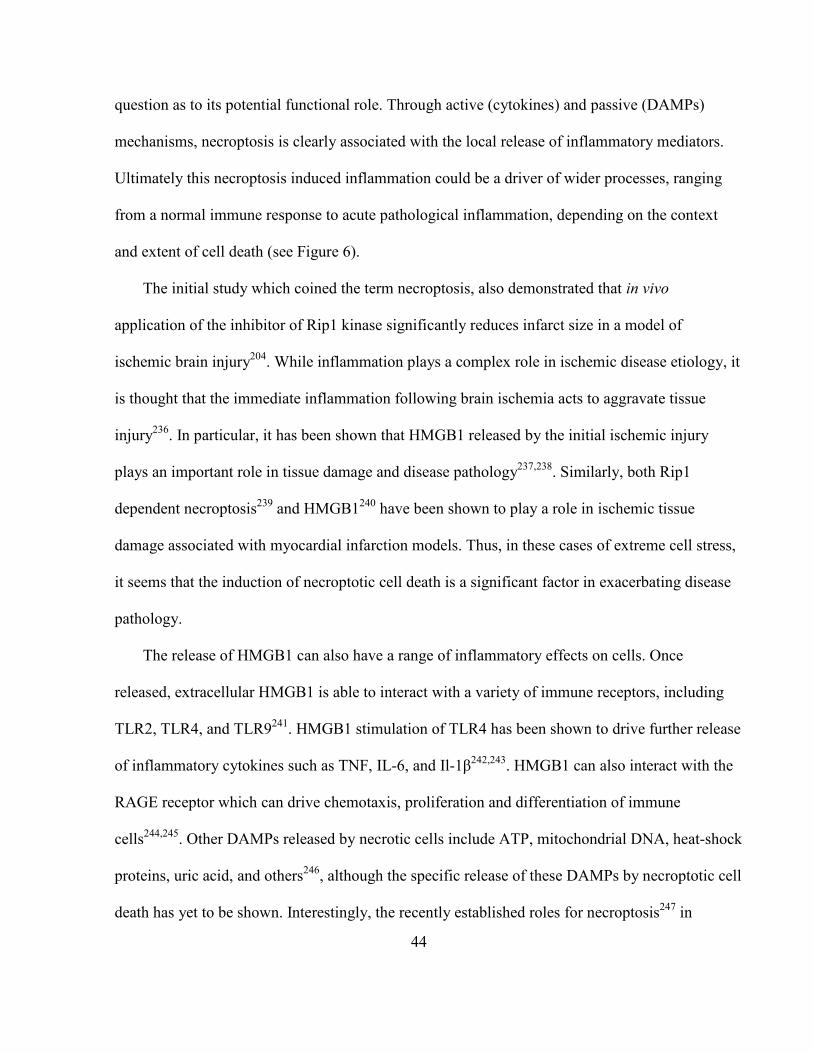
question as to its potential functional role. Through active (cytokines) and passive (DAMPs)
mechanisms, necroptosis is clearly associated with the local release of inflammatory mediators.
Ultimately this necroptosis induced inflammation could be a driver of wider processes, ranging
from a normal immune response to acute pathological inflammation, depending on the context
and extent of cell death (see Figure 6).
The initial study which coined the term necroptosis, also demonstrated that in vivo
application of the inhibitor of Rip1 kinase significantly reduces infarct size in a model of
ischemic brain injury204. While inflammation plays a complex role in ischemic disease etiology, it
is thought that the immediate inflammation following brain ischemia acts to aggravate tissue
injury236. In particular, it has been shown that HMGB1 released by the initial ischemic injury
plays an important role in tissue damage and disease pathology237,238. Similarly, both Rip1
dependent necroptosis239 and HMGB1240 have been shown to play a role in ischemic tissue
damage associated with myocardial infarction models. Thus, in these cases of extreme cell stress,
it seems that the induction of necroptotic cell death is a significant factor in exacerbating disease
pathology.
The release of HMGB1 can also have a range of inflammatory effects on cells. Once
released, extracellular HMGB1 is able to interact with a variety of immune receptors, including
TLR2, TLR4, and TLR9241. HMGB1 stimulation of TLR4 has been shown to drive further release
of inflammatory cytokines such as TNF, IL-6, and Il-1β242,243. HMGB1 can also interact with the
RAGE receptor which can drive chemotaxis, proliferation and differentiation of immune
cells244,245. Other DAMPs released by necrotic cells include ATP, mitochondrial DNA, heat-shock
proteins, uric acid, and others246, although the specific release of these DAMPs by necroptotic cell
death has yet to be shown. Interestingly, the recently established roles for necroptosis247 in
44

Figure 6: The functional spectrum of necroptosis. Depending on the context and extent of programmed necrosis there is evidence that death can range from inadequate to pathological. In cases of some viral infections, such as vaccinia, it has been shown that mice deficient in key necroptosis proteins do not mount a normal immune response. There is also evidence that in some cases necroptosis is associated with inflammatory pathology. This occurs in ischemic injury models as well as models of systemic shock.
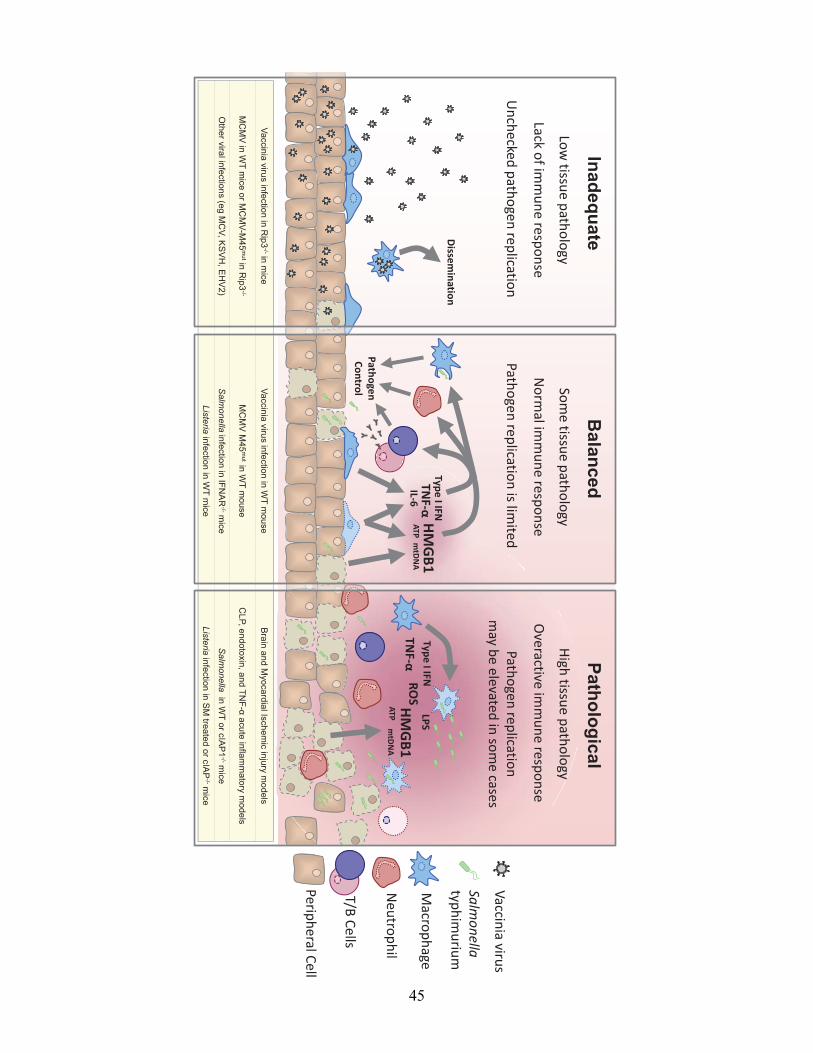
InadequateB
alancedPathological
Type
I IFN
TNF-
T/B C
ells
Lack of im
mu
ne resp
on
se
Low
tissue p
atho
logy
Un
checked
path
ogen
replicatio
n
No
rmal im
mu
ne resp
on
se
Som
e tissue p
atho
logy
Patho
gen rep
lication
is limited
Overactive im
mu
ne resp
on
se
High
tissue p
atho
logy
Patho
gen rep
lication
m
ay be elevated
in so
me cases
HM
GB
1
LPS
RO
S H
MG
B1
A
TP
Type
I IFN
TNF-
Disse
min
ation
Path
oge
n
Co
ntro
l
mtD
NA
ATP
m
tDN
A
IL-6
Vacciniavirus infection in R
ip3-/-in m
ice Vaccinia
virus infection in WT m
ouse B
rain and Myocardial Ischem
ic injury models
MC
MV
in WT m
ice or MC
MV-M
45m
utin Rip3
-/-M
CM
V M
45m
ut in WT m
ouse C
LP, endotoxin, and TNF-α acute inflam
matory m
odels
Other viral infections (eg
MC
V, KS
VH
, EH
V2)
Salm
onella infection in IFNA
R-/-m
ice S
almonella in W
T or cIAP
1-/-m
ice
Listeria infection in WT m
iceListeria infection in S
M treated or cIA
P-/-m
ice
Periph
eral Cell
Macro
ph
age
Neu
trop
hil
Vaccin
ia virus
Salmonella
typh
imu
rium
45
various inflammatory pathologies are mirrored by work investigating the role of HMGB1234,
underlining the likelihood of an intimate connection of DAMPs and necroptotic cell death.
In addition to the indirect inflammatory effects of necroptotic release of DAMPs, current
evidence also suggests a more direct impact of Rip1/3 kinase signaling on inflammatory cytokine
expression. The dual role of Rip1 in death and cytokine signaling is well accepted, particularly
downstream of TNFR. Commonly, it has been thought that these functions of Rip1 can be
separated based on kinase activity, wherein the phosphorylation activity is associated with death
and is dispensable for its role in cytokine expression248. In contrast to this simple bifurcation of
Rip1 activity, it was also recently shown that production of TNF-α in macrophage cell lines can
be inhibited using necrostatin229,249. This work suggests that increased Rip1 kinase activity can
actually drive expression of inflammatory cytokines. Consistent with this, DNA damage induced
expression of IL-8 has also been shown to require Rip1 kinase activity229. Work examining
TLR3/4 signaling has also shown that Rip1 phosphorylation and ubiquitination is required for
TRIF mediated NF-κβ signaling250. Furthermore, TLR4 mediated inflammasome activation and
IL-1β production in response to LPS stimulation can be blocked through either overexpression of
caspase-8 or treatment with necrostatin251. These data clearly show that across diverse signaling
pathways Rip1 kinase is a key inducer of inflammatory cytokine expression (see Figure 5).
Similar to the kinase activity of Rip1, the lack of an overt phenotype of Rip3-deficent mice
has led to it being disregarded in cytokine signaling. Consistent with this view, expression of
Rip3 is dispensable for NF-kB signaling in response to B-cell, T-cell, TLR, and TNF
receptors252,253. In contrast however, Rip3 has been shown to play a key role in NF-kB activation
downstream of the cytosolic DNA sensor, DAI227. In the case of inflammasome activation, the
ROS production downstream of Rip3 expression has also been specifically implicated in
46
inflammasome mediated IL-1β activation254. Production of IL-6 and TNF in response to
endotoxin injection in vivo is also significantly decreased in Rip3 knockout animals, although this
may be a secondary effect of necrotic cell death226. Based on these data, it seems clear that in at
least some cases, activation of the necrosome can directly drive inflammatory cytokine
expression.
This type of induction of inflammatory cytokine expression by Rip1/Rip3 kinase signaling
may constitute a key step in driving the ultimate death of the cell. Case in point: autocrine TNF-α
signaling has been consistently shown to be both induced by necroptotic stimulus and ultimately
to be necessary for necroptosis255,256. Thus, the release of TNF induced by Rip1 kinase activity249
could be acting as a positive feedback for the induction of necrotic cell death. It is unclear at this
time whether the expression of other inflammatory cytokines, such as interferon or IL-1β, plays a
role in the induction of cell death.
One recently published commentary has suggested that the immediate function of Rip1/Rip3
kinases may be to induce cytokine expression, with the induction of necroptotic death being a
secondary effect of this inflammatory stimulation257. Whether it turns out to be the ‘chicken or the
egg’ in this case, the data clearly underlines a complex intertwining of inflammation and
necroptotic cell death. Additional experiments to examine the timecourse of events preceding
necroptosis may be highly informative regarding the interaction of these pathways.
Necroptosis has recently been demonstrated in models of sepsis. Mice deficient in Rip3 show
lower cytokine release and significantly improved survival in the caecal ligation and puncture
(CLP) and LPS injection models of sepsis 226,258. In TNF-injection induced inflammation, similar
protection by Rip3-deficiency was observed, but pathology was exacerbated by the Rip-1 kinase
inhibitor259, underlining important as of yet undistilled complexities. Findings showing
47

necroptosis in sepsis are mirrored by an established role for HMGB1 in acute inflammation
models. Antibody treatment targeting extracellular HMGB1 in the (CLP) mouse model of sepsis
have shown a significant benefit in terms of cytokine release and mouse survival260,261. These
results clearly point to a model by which necroptosis and associated HMGB1 release could be the
key driver acute pathological inflammation in sepsis; further studies are well justified to further
characterize the mechanisms regulating this effect.
Very recently, Rip3 dependent necroptosis of macrophages has been associated with the
formation of advanced atherosclerotic plaques262; a pathology which also has a well-established
connection to HMGB1263,264. Given the medical significance of atherosclerosis to Canadians,
further research is needed to investigate how this occurs, and whether interventions targeting
necroptosis could be effective in treating advanced atherosclerosis.
While the inflammation induced by necrotic cell death can be associated with the pathologies
described above, it also appears that necroptosis can aid in the activation of an immune response.
In a clear example of this effect, Rip3-deficient mice infected with vaccinia virus showed
significantly lower tissue pathology in response to infection but eventually succumbed to high
viral loads. In contrast, WT mice infected with the same virus which showed tissue pathology but
were able to control the infection206. Similar results were observed in vaccinia virus infection of
TNFR2-/- mice265. It has also been discovered that the MCMV virus has evolved means of
inhibiting necroptosis by targeting Rip1 kinase with its M45 (or vIRA) protein266. MCMV
mutants lacking vIRA are unable to infect WT mice, but show normal infection in Rip3 knockout
mice228. Other viruses also appear to modulate programmed necrosis through expression of viral
FLIP-like proteins, such as K13 in Kaposi sarcoma virus, E8 in equine herpesvirus-2, and MC159
48
in poxvirus Molluscum contagiosum265. These studies clearly demonstrate that necroptosis can
have a pro-inflammatory effect which aid in immune response and viral clearance.
While the results discussed above illustrate how programmed necrotic cell death can have a
positive role in the initiation of an appropriate inflammatory response to pathogens, key questions
remain regarding the role death of particular cell types might play in this response: Is the death of
infected cells the primary source of this of necrotic inflammation? Do innate immune cells
undergo inflammatory suicide to enhance the inflammatory cascade? What is the role of
necroptosis in chronic inflammation? What is the role of necroptotic cell death during bacterial
infections? Experiments to address the complex role of cell death of specific cell types across the
full-spectrum of inflammation are essential to a more complete understanding of the function of
the immune system.
49
2.0 SUMMARY
2.1 HYPOTHESIS: Cell death pathways have significant impact on the immune function in both innate and acquired immune responses.
2.2 AIMS:
1. To determine the factors which regulate the induction of caspase-3 activity during CD8+ T cell activation.
a. Careful experiments will confirm whether caspase-3 high cells are undergoing cell death during CD8+proliferation.
b. The relative impact of inflammation and antigen presentation to caspase-3 will be investigated.
c. Experiments will investigate the timing and magnitude of caspase-3 activation during in vivo CD8+ responses to the same antigen (OVA) under varying conditions of presentation.
d. Experiments will probe the role of caspase-3 in promoting CD8+ proliferation. 2. To investigate the factors which regulate programmed necrosis within innate immune
cells, with particular focus on macrophages. a. The newly developed small molecule mimetic of SMAC, SM-164, will be employed
to investigate the regulation of necroptosis by IAPs b. The relative sensitivity of macrophages and dendritic cells to the induction of
necroptosis will be studied. c. The relative release of inflammatory cytokines in the response of dendritic cells and
macrophages to immunostimulatory and/or necroptotic stimulus will be assessed. d. Specific knockout models will be used to delineate the specific roles of cIAP1,
cIAP2, and xIAP in the regulation of necroptosis. e. Knockout models and SM-164 treatment in vivo will be utilized to investigate the
importance of necroptotic control during the immune response to intracellular bacterial infections.
3. To investigate the relationship of the necroptosis death program with the production of inflammatory cytokines.
a. The role of necroptosis in Salmonella-induced death of macrophages will be investigated
b. The specific interaction of the type-I interferon pathway in necroptosis of macrophages will be investigated.
4. To examine the proteolysis of RIP kinases in the regulation of necroptosis. a. The relative effect of immune-activating TLRs in necroptosis will be investigated. b. The canonical model of necroptosis induction using the pan-caspase inhibitor zVAD
will be utilized to examine changes in Rip1 cleavage products during the necroptotic program.
c. Using various small-molecule protease inhibitors, the relative role of different proteases to limiting necroptosis will be investigated.
d. Using a totally cell free cleavage assay, the ability of cathepsins to directly cleave Rip1 kinase will be demonstrated.
50
3.0 METHODS AND MATERIALS
3.1 ANIMAL WORK: All animals were housed at the animal facilities of the National Research
Council Institute for Biological Science, or at the University of Ottawa. Animals were
maintained in accordance with CCAC guidelines. Protocols and procedures were approved and
monitored by the National Research Council of Canada-Institute for Biological Sciences Animal
Care and Ethics Board and/or the University of Ottawa Animal Care Committee. The strains of
mice utilized for experiments and their sources are listed in Table 1. Any genetic analysis
necessary for strain determination was performed utilizing tail clips and genomic PCR.
Experiments utilizing multiple transgenic mice utilized age and sex matched mice.
Adoptive transfer of OT1 splenocytes: For experiments requiring adoptive transfer of OVA-
specific T cells, OT1 TCR transgenic mice were sacrificed and spleens were removed. Cells
were counted and resuspended at appropriate concentrations in HBSS. Generally 106
splenocytes were transferred to each recipient mouse unless otherwise stated in the text. Sex-
matched recipient mice were injected intravenously (iv) with cells followed by 1 week of
equilibration prior to further manipulations.
In vivo Infection Models: Animal infections were performed by iv or intraperitoneal route
according to descriptions given in the text. In brief, stated pathogens were resuspended at
appropriate concentration in HBSS and 200 µL was injected into mice. Daily monitoring was
utilized to assess animal health, and mice were sacrificed at established humane endpoints
(>20% weight loss or symptoms of illness such as lethargy, hunched, shivering etc…). Mice
were euthanized by carbon dioxide inhalation followed by cervical dislocation. Various
inhibitors (see Table 2) were also injected into mice as described in the text. In brief, inhibitors
were
51

Table 1: Mouse strains utilized in experiments, their source and the derivation of the strain are
also given.
Mouse Strain Source Origin/Notes C57BL/6J Jackson Laboratories
Stock #000664
*OT1 Transgenic Mouse (CD45.2+)
Bred in house OT1 mice have transgenic CD8+ TCR expression. >90% of CD8+ T cells were confirmed to be OVA specific via FACS
*OT1 Transgenic Mouse (CD45.1+)
Bred in house OT1 transgenic mice were backcrossed to CD45.1 expressing C57BL mice to provide a marker for identifying adoptively transferred cells
C57BLx129SvJ “F1 mice”
Bred in house F1 mice show resistance to Salmonella infection yet are immunologically compatible with OT1 adoptive transfer
*cIAP1-/-
Bred in house (University of Ottawa)
As described in 267
*cIAP2-/-
Bred in house (University of Ottawa)
As described in 268
*IFNAR-/- Bred in house A kind gift from K Murali-Krishna
Backcrossed to C57BL in 269 from mice generated as described in 270
*Rip3-/- Bred in house A kind gift from V. Dixit
As described in 253
*CTSB-/- Bone marrow samples received from collaborator
*CTSS-/- Bone marrow samples received from collaborator
As described in 271
*Note: all transgenic mice were bred on the C57/BL background.
52
suspended at appropriate concentration in phosphate buffered saline (PBS) to achieve desired
dose/kg and injected intraperitoneally.
For experiments examining immune cells in other tissues (lungs or brain), mice were first
bled to obtain blood samples, then anaesthetized and perfused using 50 mL of PBS before
sacrificing. Following this, organs were removed and placed in RPMI (Invitrogen 31800-022)
on ice. Tissues were dissociated in RPMI using a Potter-Elvehjem homogenizer and a cell
strainer to obtain a single cell suspension before FACS analysis as described below.
Following euthanasia, for peritoneal lavage studies, the skin was first removed to expose the
peritoneal membrane. 10 mL of cold PBS was then injected into the peritoneal cavity using a
washing motion 4-5 times before removing the lavage liquid. Samples were then placed
immediately on ice. For splenic examinations, the spleen was removed and placed immediately
in RPMI media and placed on ice. For experiments requiring bone marrow cells, mouse hind-
and forelimbs were removed, taking care to include the ischium with the hind limbs. The skin
was removed and samples were placed on ice in RPMI before further processing (see section
3.3).
In vivo Antigen Presentation: For evaluation of antigen presentation in vivo, CFSE labeled OT-
1 cells were injected (5×10⁶) into mice iv. After allowing 3–4 days for cells to equilibrate,
mice were infected with bacteria through the iv route as described in the text. Four to five days
after infection, spleens were removed from the recipient mice. The presence of donor OT-1
CD8+ T cells (CD45.1+) and the reduction in CFSE intensity of donor cells was evaluated by
FACS (see below).
3.2 BACTERIAL METHODS: Bacterial lines utilized for experiments outlined in this thesis include
SL1344 strain Salmonella enterica serovar typhimurium, OVA expressing Salmonella SL1344
53
(ST-OVA as described in 272), Listeria monocytogenes strain 10403S , and OVA expressing
Listeria (LM-OVA as described in 273).
CFU Assay: For in vivo infection models, the bacterial load in the peritoneum and/or spleen was
assessed at various timepoints after infection as described in the text. Bacterial colony-forming
units (CFU) assessment was performed by diluting peritoneal lavage, or splenic suspension to
varying extent in saline and plating on BHI-agar plates. CFU numbers were then counted after
incubation for 24 hours at 37°C.
3.3 CELL PURIFICATION AND SORTING: In order to obtain high concentrations of different cell
types, various cell purification and sorting procedures were utilized.
Magnetic Isolation of Cells: CD8+ T cells were enriched by negative selection (Stem cell
Cat#19753) according to the manufacturer’s instructions. In brief, a single suspension of
splenic cells was stained with a cocktail of biotinylated antibodies targeted against the non-
CD8+ cells of the spleen (e.g. B cells, CD4 T cells, macrophages, stromal cells etc…). These
cells were then combined with streptavidin conjugated to magnetic beads. Using a magnetic
field, the non-CD8+ cells can then be retained as the cell suspension is decanted, leaving only
the enriched CD8+ cells.
Similarly, macrophages were isolated using positive magnetic separation. In this case
peritoneal cells were placed in single cell suspension in PBS with 1% BSA, then stained using
anti-F4/80 PE (BD Biosciences, Franklin Lakes, NJ, USA; 123109). Magnetic isolation was
then performed using anti-PE magnetic beads (StemCell Technologies Inc., Vancouver, BC,
Canada; 18554). Purification was performed according to manufacturer’s protocol, similar as
described above but retaining magnetically retained F4/80+ cells. Cell purity was confirmed to
be >90% by flow cytometry (see below).
54
Cell Sorting by Flow Cytometry: For studies examining CD8+ cell populations, splenic cells
were first enriched for CD8+ by negative selection as described above. A single cell suspension
of CD8+ cells was then stained for CD45.1 APC and caspase activity using PhiPhiLux (see
antibodies and stains in table 3). Cells were then sorted on MoFlo cell sorter into CD45.1+
OVA-specific CD8+ T cells that express low or high levels of caspase 3 activity. Sorted cells
were then placed in 96 well plates with or without the addition of supporting IL-7 (1 ng/ml)
using limiting dilutions. Cells were examined for viability over several days using TMRE
staining similar as described above.
3.4 CELL CULTURE: Cells used for experiments outlined in this thesis were primarily bone marrow
derived macrophages and dendritic cells, J774 macrophage cells (C57BL6 mouse background)
were also employed. Unless otherwise stated, all cell culture experiments were performed in
RPMI supplemented with 8% fetal bovine serum, 50µM 2-mercaptoethanol, and 50 µg/mL
gentamicin. Cells were incubated at 37°C at 5-7% CO2.
In vitro Antigen Presentation to CD8+ T cells: For evaluation of antigen-presentation in vitro,
a single cell suspension of OT-1 splenocytes was seeded in a 24-well plate at 5×10⁶ cells/well
in 1 ml of media. Soluble SIINFEKL (OVA257–264) peptide was added directly to the culture
(0.1 pg to 1 mg). Cells were allowed to proliferate for 24–72 hours and then analyzed by
FACS (as described below). In some cases OT-1 cells were first labeled with 1 mM of
carboxyfluorescein succinimidyl ester (CFSE, See Table 3) for 8 minutes before antigen
presentation. After 3–4 days of culture, cells were harvested from the wells and stained, and
the expression of CFSE or other markers evaluated by flow cytometry.
In vitro LM-OVA Infection and Limiting Dilution Assay: OT1 spleen cells were obtained
from a naïve donor animal and placed in a flask at approximately 5×10⁶ cells/ml. 104 LM-
55
OVA bacteria were then added to the flask and the infected culture was incubated overnight at
37°C. At this time, cells were spun down and washed in fresh media to remove bacteria from
the culture. Gentamicin (50 mg/ml) was also added to prevent further bacterial replication.
Cells were washed and returned to a flask at 2×10⁶ cells/ml and allowed to proliferate
overnight. At 48 hours after initial infection, the cells are split to allow further proliferation to
occur; at this time supporting IL-7 is also added to the culture at 1 ng/ml. After a total of 3
days in culture, an aliquot of cells was stained using a similar procedure as detailed above to
confirm that >90% of cells are CD8+ and active-caspase-3+. Cells were then counted and
placed in a 96-well round bottom plate at approximately 200 cells/well. Two fold dilutions
were performed row-wise to approximately 6.25 cells/well. At various time intervals, TMRE
was added at 1 nM and live cells were examined using Olympus IX81 fluorescent microscope
after 18 h. At least 6 wells were examined for every dilution of cells. 12.5 cells/well was
chosen for daily analysis because the number of cells was adequate for counting, while
providing a small enough number to preclude the possibility that a sub-population outgrowth
accounts for the majority of the culture. Similarly as described, cells were also plated for
limiting dilution analysis after 12 days in post-infection culture with regular media changes
(every 2-3 days) and added IL-7 cytokine.
Generation of Bone Marrow Macrophages and Dendritic Cells: In order to generate primary
bone marrow derived macrophages (BMDMs) and dendritic cells (BMDCs) for in vitro
experiments, mouse bone marrow was used as a cell source. In brief, mouse femurs and radius
bones were removed from mice of the appropriate genotype (as described in the text) and the
muscle and tissue was removed using scissors and forceps. Gentle rubbing using a paper towel
56
wetted with 70% ethanol was also employed to clean the bone of muscle. The bones were then
flushed with PBS using a small-gauge needle to obtain the bone marrow.
To generate macrophages, cells were then placed in RPMI with 8% FBS (R8 media) in
50mm plastic petri dishes. It is of note that non-tissue culture grade petri dishes were
employed here, as macrophages seem to develop better on adherent plastics274. In developing
the protocol for BMDM cells, I also observed that spreading the M-CSF (at 5 ng/ml) on the
petri dish before plating bone marrow lead to higher yields of macrophages. Cells were then
given 7-12 days (as described in the text) to allow cell differentiation before being used for
experiments. Flow cytometry was used to confirm the purity of macrophages
(F4/80+/CD11b+).
The generation of BMDCs was performed in T150 tissue culture flasks. Bone marrow cells
were placed at ~20-30×106 cells per flask with GM-CSF (at 5 ng/mL). After 3 and 5 days, the
media was changed to remove non-adherent cells with very gently washing in order to retain
the less adherent dendritic cell population, with the addition of more GM-CSF at each media
change. After 7 days in culture, the non-adherent cells were then utilized for experiments as
described in the text.
In vitro Inhibitor Assays: BMDMs and BMDCs were treated with a variety of different small
molecule inhibitors over the course of experiments as described in the text. A full list of
inhibitors employed and their sources can be found in Table 2. A variety of techniques were
used, with pertinent details given in the text. In general, cells were differentiated from bone
marrow as described above for 7-10 days, before being placed in R8 media within 96-well
plates at ~50 000 cells/well. Cells were given 24 hours to adhere to the plates before treatment
with inhibitors was initiated. At this time, cells were treated with appropriate concentrations of
57
inhibitors and left for 24 hours before assessing cell death or viability, unless otherwise stated
in the text. Experiments to generate protein lysates from cells were performed with 250 000
cells/well in 24-well plates, and terminated at various timepoints.
RNA Interference: siRNA targeted against specific genes was obtained from various
commercial sources as follows: scrambled control (Santa Cruz sc-37007), cathepsin S (Santa
Cruz sc-29941), cathepsin B OnTarget SMARTpool siRNA (Thermo Scientific L-044712-00-
0005), TRIF (Santa Cruz sc-106845). J774 macrophages were transfected with siRNA using
Dharmafect 4 (Thermo Scientific T-2004-02) according to manufacturer’s instruction. In brief,
cells were plated at low density (~15 000 cells/well) in 96-well plates 24 hours before
transfection. 0.2 µL of Dharmafect was combined with 0.5µL of 5µM siRNA in 20µL of total
serum free RPMI and incubated at room temperature for 20 minutes to allow complexes to
form. 80µL of R8 medium without antibiotics was then added and the total volume was placed
on the cells. For bone marrow derived macrophages, cells were transfected using the Lonza
electroporation kit for bone marrow macrophages (Lonza VPA-1009) in accordance with
manufacturer’s protocol. In brief, siRNA and cells were combined in the specialized
transfection buffer and electroporated. For both J774 and BMDMs, 24 hours after transfection,
cells were then treated with various inhibitors and incubated for an additional 24 hours. At this
time, cells were assessed for protein expression or viability as described in the text.
Mitochondrial Activity Cell Viability Assay (MTT): Cell viability was assessed using the MTT
assay. MTT staining reagent was added to cells at a final concentration of 0.5 mg/ml and
incubated at 37°C for 4 h. Cells were then lysed and the MTT crystals solubilized using 5mM
HCl in isopropyl alcohol. Results were quantified by measuring absorption at 570 nm with a
reference wavelength of 650 nm on a Molecular Devices Emax plate reader.
58
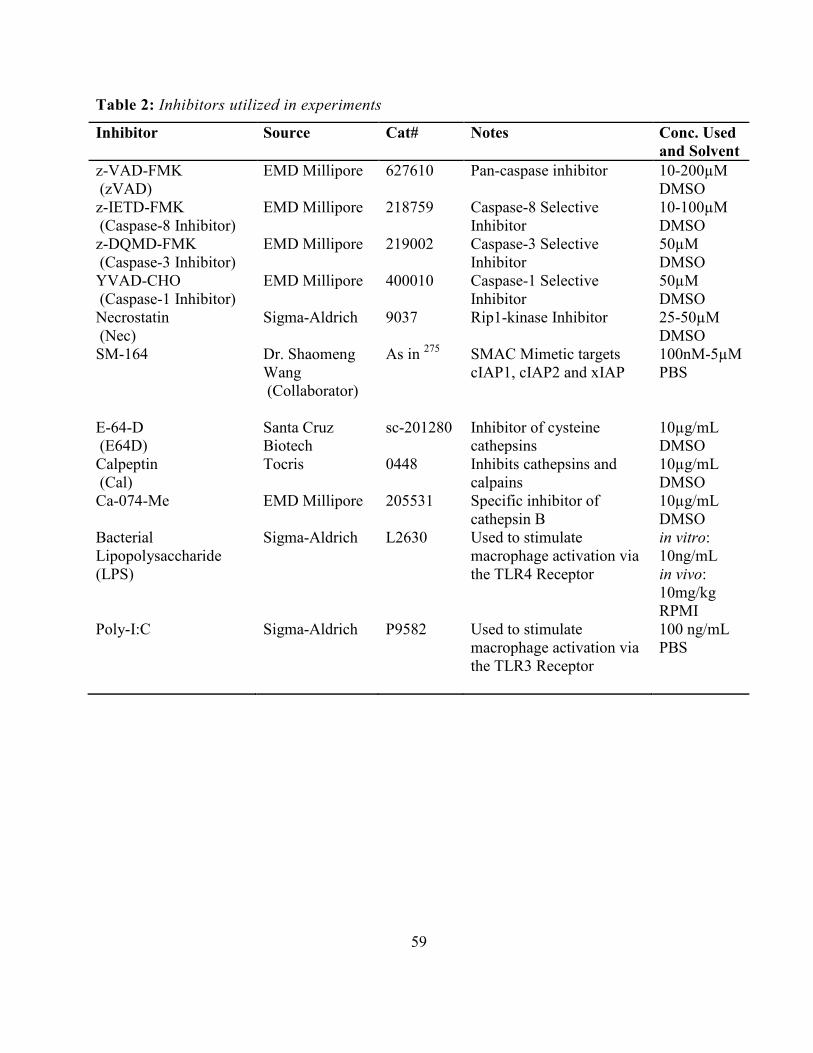
Table 2: Inhibitors utilized in experiments
Inhibitor Source Cat# Notes Conc. Used and Solvent
z-VAD-FMK (zVAD)
EMD Millipore 627610 Pan-caspase inhibitor 10-200µM DMSO
z-IETD-FMK (Caspase-8 Inhibitor)
EMD Millipore 218759 Caspase-8 Selective Inhibitor
10-100µM DMSO
z-DQMD-FMK (Caspase-3 Inhibitor)
EMD Millipore 219002 Caspase-3 Selective Inhibitor
50µM DMSO
YVAD-CHO (Caspase-1 Inhibitor)
EMD Millipore 400010 Caspase-1 Selective Inhibitor
50µM DMSO
Necrostatin (Nec)
Sigma-Aldrich 9037 Rip1-kinase Inhibitor 25-50µM DMSO
SM-164 Dr. Shaomeng Wang (Collaborator)
As in 275 SMAC Mimetic targets cIAP1, cIAP2 and xIAP
100nM-5µM PBS
E-64-D (E64D)
Santa Cruz Biotech
sc-201280 Inhibitor of cysteine cathepsins
10µg/mL DMSO
Calpeptin (Cal)
Tocris 0448 Inhibits cathepsins and calpains
10µg/mL DMSO
Ca-074-Me EMD Millipore 205531 Specific inhibitor of cathepsin B
10µg/mL DMSO
Bacterial Lipopolysaccharide (LPS)
Sigma-Aldrich L2630 Used to stimulate macrophage activation via the TLR4 Receptor
in vitro: 10ng/mL in vivo: 10mg/kg RPMI
Poly-I:C Sigma-Aldrich P9582 Used to stimulate macrophage activation via the TLR3 Receptor
100 ng/mL PBS
59
Cell death assay (LDH release): Cell death was assessed using a commercial LDH release
assay (Sigma-Aldrich #TOX7). Supernatants were collected from SM-treated cell cultures and
subjected to analysis for total LDH according to manufacturer’s instructions. In brief, the assay
mixture was first prepared by mixing equal parts of LDH substrate, LDH dye and LDH
cofactor. This was then combined in equal parts with supernatants generated experimentally.
After 20-30 minutes of incubation the reaction was stopped with 1/10 volume of 1N HCl and
the signal was measured at 490nm with background subtracted using 650nm reading on a
Molecular Devices Emax plate reader. Cell death was alternatively measured using various
fluorescent staining techniques (described below).
3.5 IMMUNOFLUORESCENT ANALYSES: Various commercial antibodies were used for FACS and
immunofluorescence staining, see Table 3 for a complete list of antibodies employed.
Flow Cytometry: For surface staining, aliquots of cells derived from various in vitro or in vivo
experiments as described above (5×10⁶ cells) were incubated in 100 µl of PBS with 1% BSA
(PBS-BSA) with Fc block (anti-CD16/32) at 4°C. After 10 min., cells were stained various
antibodies of interest for 30 min. at room temperature. When OVA-tetramer was utilized, cells
were stained first with tetramer for 15 minutes before the addition of other antibodies. Cells
were washed, fixed in 0.5% formaldehyde and acquired on BD Biosciences FACS Canto
analyzer.
For analysis of apoptosis, annexin V staining for phosphatidylserine exposure was employed
as follows. Aliquots of cells (5×10⁶ cells) were first surface stained with desired surface
markers as described above. This was followed by washing cells with PBS and resuspension in
3 ml annexin binding buffer (provided in Annexin staining kit). Annexin V was then added,
60
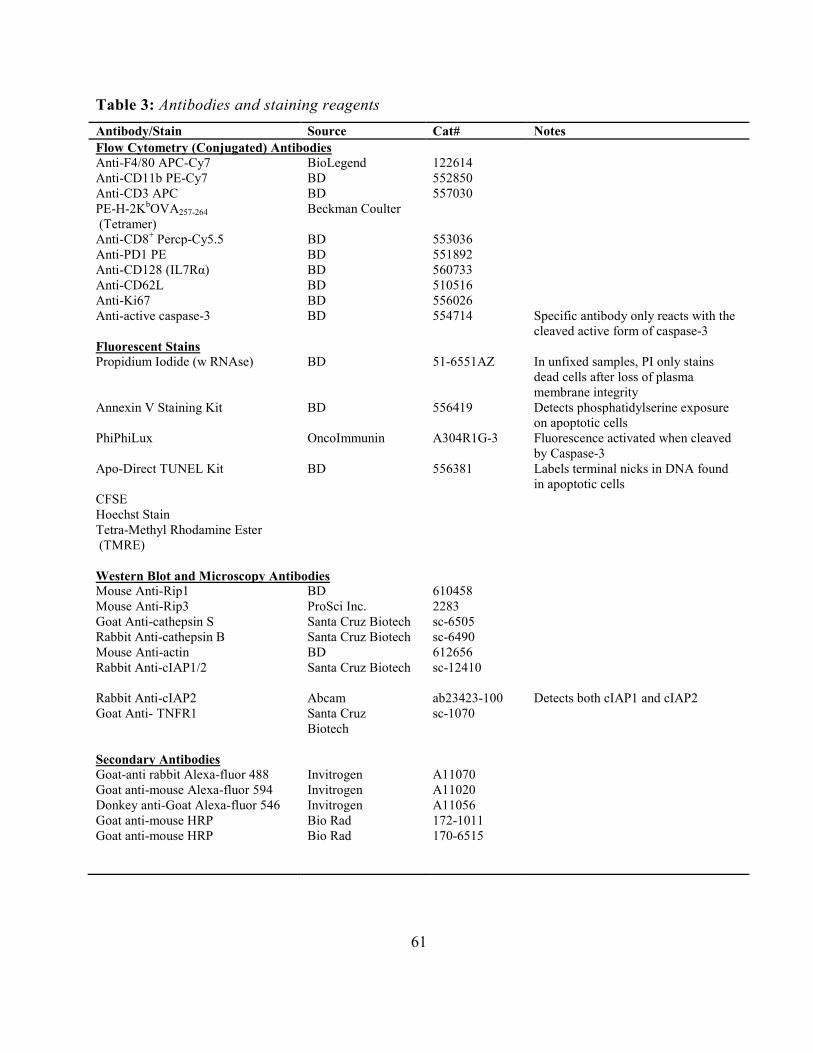
Table 3: Antibodies and staining reagents Antibody/Stain Source Cat# Notes Flow Cytometry (Conjugated) Antibodies Anti-F4/80 APC-Cy7 BioLegend 122614 Anti-CD11b PE-Cy7 BD 552850 Anti-CD3 APC BD 557030 PE-H-2KbOVA257-264 (Tetramer)
Beckman Coulter
Anti-CD8+ Percp-Cy5.5 BD 553036 Anti-PD1 PE BD 551892 Anti-CD128 (IL7Rα) BD 560733 Anti-CD62L BD 510516 Anti-Ki67 BD 556026 Anti-active caspase-3 BD 554714 Specific antibody only reacts with the
cleaved active form of caspase-3 Fluorescent Stains Propidium Iodide (w RNAse) BD 51-6551AZ In unfixed samples, PI only stains
dead cells after loss of plasma membrane integrity
Annexin V Staining Kit BD 556419 Detects phosphatidylserine exposure on apoptotic cells
PhiPhiLux OncoImmunin A304R1G-3 Fluorescence activated when cleaved by Caspase-3
Apo-Direct TUNEL Kit BD 556381 Labels terminal nicks in DNA found in apoptotic cells
CFSE Hoechst Stain Tetra-Methyl Rhodamine Ester (TMRE)
Western Blot and Microscopy Antibodies Mouse Anti-Rip1 BD 610458 Mouse Anti-Rip3 ProSci Inc. 2283 Goat Anti-cathepsin S Santa Cruz Biotech sc-6505 Rabbit Anti-cathepsin B Santa Cruz Biotech sc-6490 Mouse Anti-actin BD 612656 Rabbit Anti-cIAP1/2
Santa Cruz Biotech sc-12410
Rabbit Anti-cIAP2 Abcam ab23423-100 Detects both cIAP1 and cIAP2 Goat Anti- TNFR1 Santa Cruz
Biotech sc-1070
Secondary Antibodies Goat-anti rabbit Alexa-fluor 488 Invitrogen A11070 Goat anti-mouse Alexa-fluor 594 Invitrogen A11020 Donkey anti-Goat Alexa-fluor 546 Invitrogen A11056 Goat anti-mouse HRP Bio Rad 172-1011 Goat anti-mouse HRP Bio Rad 170-6515
61
and the cells were incubated with annexin V for 15 minutes. Cells were then analyzed by flow
cytometry as above, leaving the cells in annexin binding buffer.
Intracellular Staining: Staining for intracellular markers was also employed to examine cells
for active caspase-3 and Ki67 expression. Cells were first stained with surface markers as
above, then washed and fix/permeabilized for 15 minutes on ice (BD – Cat#554714). Cells
were then washed in permabilization/wash buffer (PW, BD – Cat#554723) and resuspended in
100µL PW and stained with a biotin conjugated antibody against active caspase-3 and Ki67.
The cells were subsequently washed and resuspended in 100µL PW for streptavidin labelling.
Finally the cells were analyzed by flow cytometry as described above.
DNA cleavage was also examined using the Apo-Direct TUNEL kit. Briefly, cells were
stained with surface markers of interest, then fixed using the combination
fixative/permeabilization solution described above. Cells were washed, resuspended in
TUNEL buffer, and incubated at 37°C with a solution containing terminal transferase enzyme
and a FITC labeled dNTP. After incubation for 1 hour, cells were then fixed in 0.5%
formaldehyde and read by flow cytometry.
Live Cell Flow-Cytometry: For live staining techniques, cells (up to 5×10⁶) were resuspended in
100µL of RPMI and surface markers were directly added to the mixture. Cells were then
incubated at 37°C for 20 minutes. Cells were then washed and resuspended in RPMI for flow
cytometric analysis. Live cell flow cytometric analysis was used to determine the cleavage
activity of caspase-3. This was accomplished using a cell permeable fluorogenic substrate,
PhiPhiLux, according to the manufacturer’s recommended protocol.
Confocal Microscopy: Cells obtained by various in vitro experimental techniques, as described
in the text and above, were examined via fluorescence microscopy. Cells were first fixed using
62
4% paraformaldehyde and washed with PBS containing 1% FBS. Cells were then
permeabilized using 0.4% Triton X-100 for 15 minutes at room temperature. Cells were rinsed
3× in PBS with 0.1% Triton X-100. Primary antibody was then diluted in PBS with 0.1% TX-
100 and 0.5% FBS and incubated on the cells overnight at 4°C. Cells were again rinsed 5× in
PBS with 0.1% Triton X-100. Appropriate fluorescently conjugated secondary antibodies (see
Table 3) were diluted in PBS with 0.1% TX-100 and 0.5% FBS and incubated on the cells for
1 hour at room temperature. Appropriate unstained and secondary only controls were utilized
to confirm the specificity of antibodies in initial testing. Images were captured using an
extended focus image constructed from 10 exposures on the Olympus Fluoview 1000 confocal
microscope.
Live Cell Fluorescence Microscopy: Cell viability and function were tested using live cell
fluorescence microscropy in various experiments as described in the text. For experiments
measuring mitochondrial activity via TMRE staining, the stain was added directly to fresh R8
media and the cells were pre-incubated for 15 minutes before measurement. Cells were then
examined for TMRE signal at 37°C using an Olympus IX81 fluorescence microscope. Dead
cells were determined by lack of TMRE signal and clear dead cell morphology (i.e. small,
rounded and granular). Time-lapse monitoring of cell viability following treatment with
various inhibitors as described in the text was also performed. In this case, cells were
maintained at 37°C with 5% CO2 and images were acquired every 30 seconds over an
extended time period.
An additional technique used to confirm cell viability results determined by techniques
described above was the use of propidium iodide (PI) to identify loss of plasma membrane
integrity. Hoechst and PI stains were added directly to R8 media, and cells were incubated for
63
15 minutes at 37°C. Images of cells after various treatments were then acquired using an
Olympus IX81 fluorescence microscope. The percentage of dead cells was then determined
using Image Pro Software (Mediacybernetics) to perform automated counting of Hoechst
versus PI positive nuclei.
3.6 BIOCHEMICAL ANALYSES:
Quantitative RT-PCR: RNA for qRT-PCR was isolated from cells after various inhibitor
treatments as described in the text. RNA was converted to cDNA using Superscript III Reverse
Transcriptase (Invitrogen). cDNA was then analyzed using Sybr green fast method performed
on an Applied Biosystems 7500-Fast qRTPCR System. Specific primers for mRNA of interest
were synthesized using the NCBI primer tool in order to amplify 150-200bp sequences
spanning at least one exon junction. The qRTPCR amplification of a fragment of the correct
length was also confirmed by electrophoresis.
SDS-PAGE and western blotting: Cell lysates were obtained during various experiments by
lysing cells directly in SDS lysis buffer with 0.5% β-mercaptoethanol and boiling immediately
to minimize protein degradation. SDS-PAGE and PVDF membrane transfer was performed by
standard protocol. In brief, 10% or 8% polyacrylamide gels were poured with stacking gels
and allowed to set. Gels were then loaded with 15-20µL of lysates and gels were run at 120 V
for 1-1.5h. Transfer to PVDF was then performed via wet transfer using 20% methanol
transfer buffer. Membranes were subsequently blocked in a blocking buffer of 5% skim milk
in Tris Buffered Saline (TBS, 0.5M Tris 1.5M NaCl pH7) for 1 hour at room temperature.
Western blotting was performed with varying concentrations of primary antibody (see Table 3,
dilutions were 1/1000 or in accordance with manufacturers’ suggestions) overnight in blocking
buffer. Washes were done using TBS with 0.5% Tween-20 before probing with appropriate
64
secondary antibody for 2 h. Finally, blots were visualized using either luminol ECL reagent
(Thermo Scientific #32106) the highly sensitive West Femto ECL (Thermo Scientific #34095)
for proteins with low expression. Results were obtained by exposing photosensitive film
(Sigma-Aldrich, Carestream Health 785019). Densitometric measurement was performed for
some blots using Image-J software.
Protein Dephosphorylation: Some proteins ran as two forms which migrated slightly differently
by SDS-PAGE. Because it has been reported that these bands correspond to the
phosphorylated form of the proteins, we wished to confirm this by dephosphorylation of the
proteins. In this case, cells were plated at 250 000 cells/well in 24-well plates, and treated with
various inhibitors as described in the text. Cells were then lysed using RIPA buffer containing
a protease inhibitor cocktail (Roche Applied Science, 04693132001). Phosphatase treatments
were performed using 500 units of lambda phosphatase (Santa Cruz Biotechnology sc-200312)
for 30min at 30°C. SDS lysis buffer was then added and the samples were boiled before
analysis via western blot (as describe above).
Immunoprecipitation: Co-immunoprecipitations were performed as follows. Cells were plated
at 250 000/well in 24-well plates. Cells were subsequently treated with inhibitors as described
in the text and lysed with RIPA buffer containing a protease inhibitor cocktail (Roche Applied
Science 04693132001) and phosphatase inhibitor cocktail (Sigma-Aldrich P5726). Lysates
were then sonicated for 5 minutes and pre-cleared using unconjugated protein-G sepharose
beads (GE Healthcare, Waukesha, WI, USA; 51-3478-CO-EG) and mouse control IgG.
Specific antibodies targeting protein of interest (see Table 3) were incubated with cell lysates
overnight at 4°C. Lysates were then incubated with protein-G sepharose beads for 1 hour with
agitation on ice. Finally, immunoprecipitates were collected by centrifugation and washed with
65
PBS several times. Immunoprecipitates were then denatured by boiling in SDS for 5 minutes
before analysis by western blot (as described above).
Plasmid constructs and protein purification: Bacterial strain E. coli DH5α harboring plasmid
encoding for mouse RIPK1 with N terminal GST tag was obtained from Addgene, plasmid
11972276. By the use of restriction free cloning strategy277, a plasmid encoding the shorter
version of mouse RIPK1 from 280aa to 656aa also with N terminal GST tag was generated and
E. coli BL21 was transformed with it. The GST-RIP280-656 protein was purified with GE
Healthcare GSTrap FF (17-5130-01) according to manufacturer recommendations and eluted
at pH-8.0.
Cell free cleavage assay: Cell free cleavage of GST-Rip1280-656 was performed as follows.
Purified GST-Rip1280-656 (6µg) was combined with active mouse Cathepsin S (Sino
Biologicals 50769-M08H) or mouse Cathepsin B (R&D Systems 965-CY) or cathepsin L
(R&D Systems 1515-CY-010). Reactions were performed as recommended by manufacturers
under following conditions. Cathepsin S reaction was set for 2 hours at 37°C, pH-7.4; the
cathepsin B reaction for 4 hours at 37°C, pH-6.3; cathepsin L 2 hours at 37°C, pH-7.4. At
appropriate times after each reaction, SDS lysis buffer was added and samples were boiled
immediately. The results were subsequently examined by western blot (as above).
3.7 STATISTICS: All error bars show standard error of the mean; where shown in the text Student T
tests were used to determine the significance of results. All statistical analyses were performed
using Graphpad Prism software.
3.8 TECHNICAL ACKNOWLEDGEMENT: The following technical procedures described in this thesis
were carried out under my supervision by students and technicians, or in collaboration with
post-doctoral researchers in the lab of Dr. Subash Sad: (1) Renu Dudani – intravenous injections
66
for ST and LM infection models, (2) Edmund Yao – performed some of the ELISAs for TNF
and IL-6 measurements following BM cell SM treatments, (3) Dr. Nirmal Robinson –
performed in vitro infection of macrophage cells with ST with necroptosis inhibitors (Fig. 28, 29
used with permission of Dr. Robinson), (4) Susan Thurston – performed some of the western
blotting to examine degradation of Rip1 kinase (Fig. 36, 37), (5) Dr. Bojan Shutinoski –
performed molecular biology for generating GST-Rip1280-654, and part of the cell-free cleavage
of Rip1 experiments (Fig. 40), (6) Erin Cessford – aided in the generation of macrophage cell
and zVAD/LPS necroptosis assay in IFNAR-/- macrophages (Fig. 32).
67
4.0 RESULTS
4.1 CASPASE-3 ACTIVATION IN CD8+ T –CELL FUNCTION
4.1.A Caspase-3 is upregulated in proliferating CD8+ T cells: The first goal of this thesis was
to investigate how antigen specific stimulation of CD8+ T cells in vitro would affect caspase-3
activation. OVA-specific CD8+ TCR transgenic mouse (OT-1) splenocytes were isolated and
resuspended in a single cell suspension. Cells were then placed in culture with various
concentrations of OVA peptide (SIINFEKL). The CD8+ T cells began proliferating within 24
hours of initial stimulation, as confirmed by the presence of blasting cell clusters. After allowing
48 hours for activation, CD8+ cells were examined via intracellular staining using fluorescently
labeled antibodies as described in the methods section. Those OT-1 CD8+ T cells that were
stimulated with peptide levels that were greater than ~0.1 nM (10-4 µg/ml) showed active
proliferation, as identified by high expression of the active cell cycle marker Ki67 (Fig. 7A).
Based on calculations, this amount of OVA peptide corresponded with only about 1000 molecules
of SIINFEKL per cell. Proliferation of these cells was also confirmed by the sequential loss of
CFSE staining after activation with OVA peptide (Fig. 7B). In direct correlation with the
increase in CD8+ proliferation, a significant increase in the level of active caspase-3 within the
proliferating CD8+ population was observed (Fig. 7). Co-staining revealed direct correlation
between the level of caspase-3 activation and expression of a marker for cell proliferation, Ki67,
within the CD8+ population (Fig. 7D). I also confirmed that caspase-3 cleavage activity was
upregulated in OVA stimulated CD8+ T cells using the fluorogenic caspase-3 substrate PhiPhiLux
(data not shown).
68
Figure 7: Active caspase-3 is upregulated in proliferating T cells. A single cell suspension of OT1 TCR transgenic splenocytes were placed in culture with varying concentrations of SIINFEKL peptide for 48 hours and analyzed by intracellular flow cytometry (n≥3). Cells were stained with extra- and intra-cellular stains as described in the methods section (A) MFI of active caspase-3 versus Ki67 shows a linear correlation in their expression levels (P<0.05). (B) MFI of CFSE versus active caspase-3 shows a significant inverse correlation (P<0.01). (C) MFI of TUNEL stain versus active caspase-3 shows a significant inverse correlation (P<0.01). (D) Scatterplots show the relative expression of active caspase-3 versus Ki67 in gated CD8+ cells of splenocyte cultures treated for 48 hours with varying concentrations of SIINFEKL peptide as shown. Data shown is representative for two repeated experiments performed in triplicate.
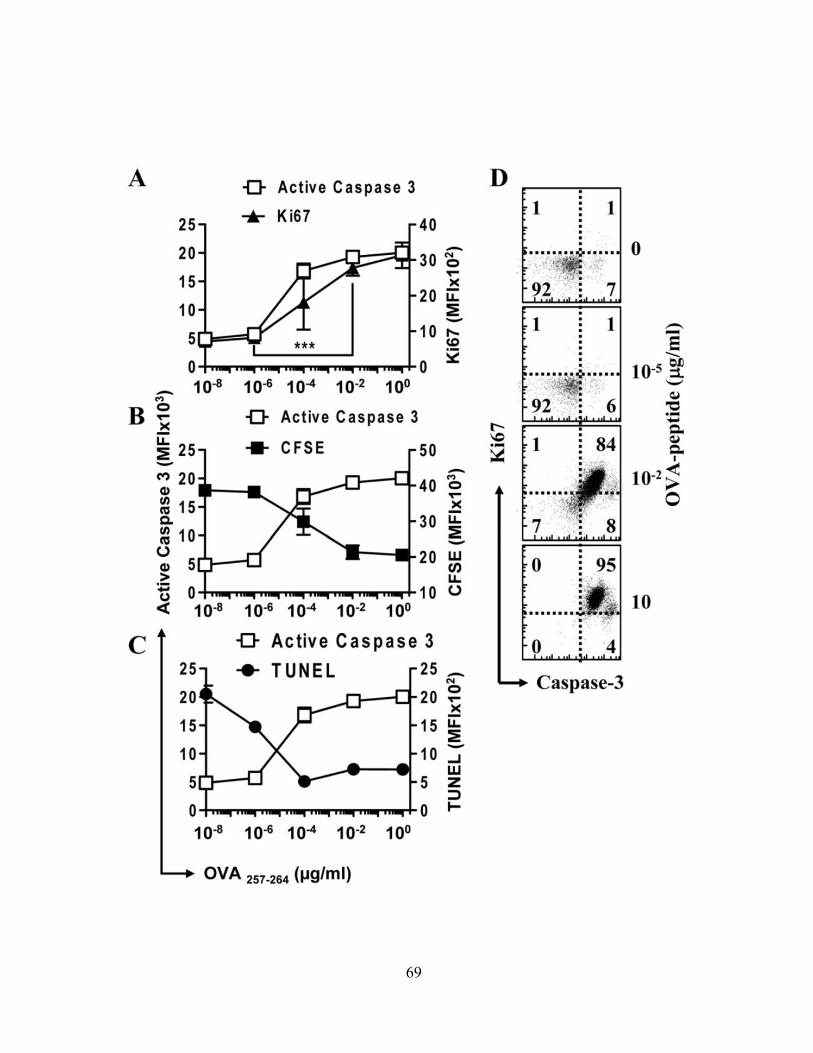
69
4.1.B Active caspase-3 in proliferating CD8+ T cells does not lead to cell death: Next, I
wished to confirm whether this increase in active caspase-3 corresponded with an increase in cell
death in primed CD8+ T cells. The terminal dUTP nick end labeling (TUNEL) assay labels
cleaved DNA by enzymatically conjugating free 3’ ends of DNA molecules with one or more
fluorescently labeled deoxyuridyl molecules. In cells with elevated DNA cleavage due to
apoptosis, TUNEL should show much higher signal. In this case, a drop in the TUNEL signal was
observed following stimulation with OVA peptide (Fig. 7C). Interestingly, CD8+ T cells were
TUNEL-positive only when they were cultured with very low amounts of peptide, a situation
wherein CD8+ T cells are well known to die due to lack of stimulation. OVA-peptide stimulated
active-caspase-3+ cells do not show TUNEL staining by fluorescence microscopy (Fig. 8).
Despite the lower overall decrease in the level of TUNEL staining associated with OVA
peptide stimulation, it remained possible that the rapid proliferation of CD8+ T cells was masking
a concurrent increase in cell death associated with active caspase-3 expression. To address this
possibility, OT1 CD8+ T cells were monitored directly for their death. OT1 spleen cells were first
activated by in vitro infection with OVA expressing Listeria monocytogenes (LM-OVA) as
described in the methods section. After allowing 3 days for proliferation to occur, CD8+ T cells
were confirmed to express a high level of active caspase-3 (Fig. 9A top). In contrast, after 12 days
in culture, the majority of CD8+ proliferation had ceased and cells expressed only a basal level of
active caspase-3 (Fig. 9A bottom).
In order to monitor the absolute level of cell proliferation and cell death on a per-cell basis,
cells were placed in a 96-well plate by limiting dilution to achieve a countable number of cells
70
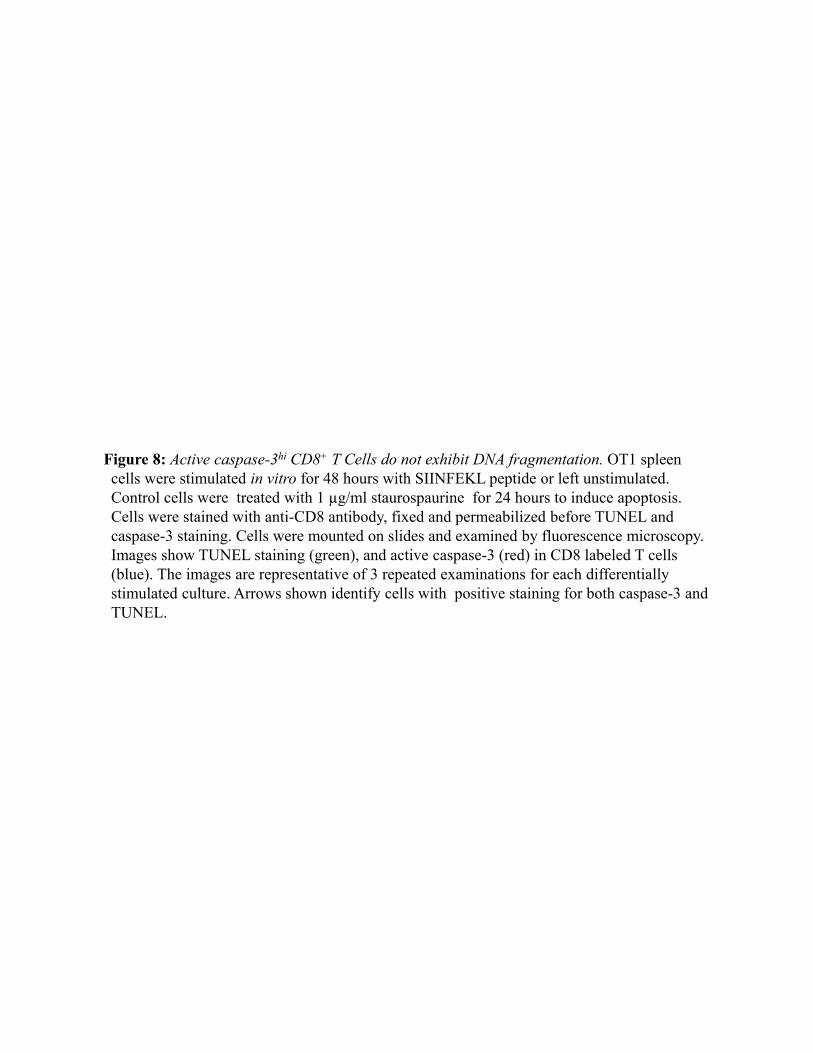
Figure 8: Active caspase-3hi CD8+ T Cells do not exhibit DNA fragmentation. OT1 spleen cells were stimulated in vitro for 48 hours with SIINFEKL peptide or left unstimulated. Control cells were treated with 1 µg/ml staurospaurine for 24 hours to induce apoptosis. Cells were stained with anti-CD8 antibody, fixed and permeabilized before TUNEL and caspase-3 staining. Cells were mounted on slides and examined by fluorescence microscopy. Images show TUNEL staining (green), and active caspase-3 (red) in CD8 labeled T cells (blue). The images are representative of 3 repeated examinations for each differentially stimulated culture. Arrows shown identify cells with positive staining for both caspase-3 and TUNEL.
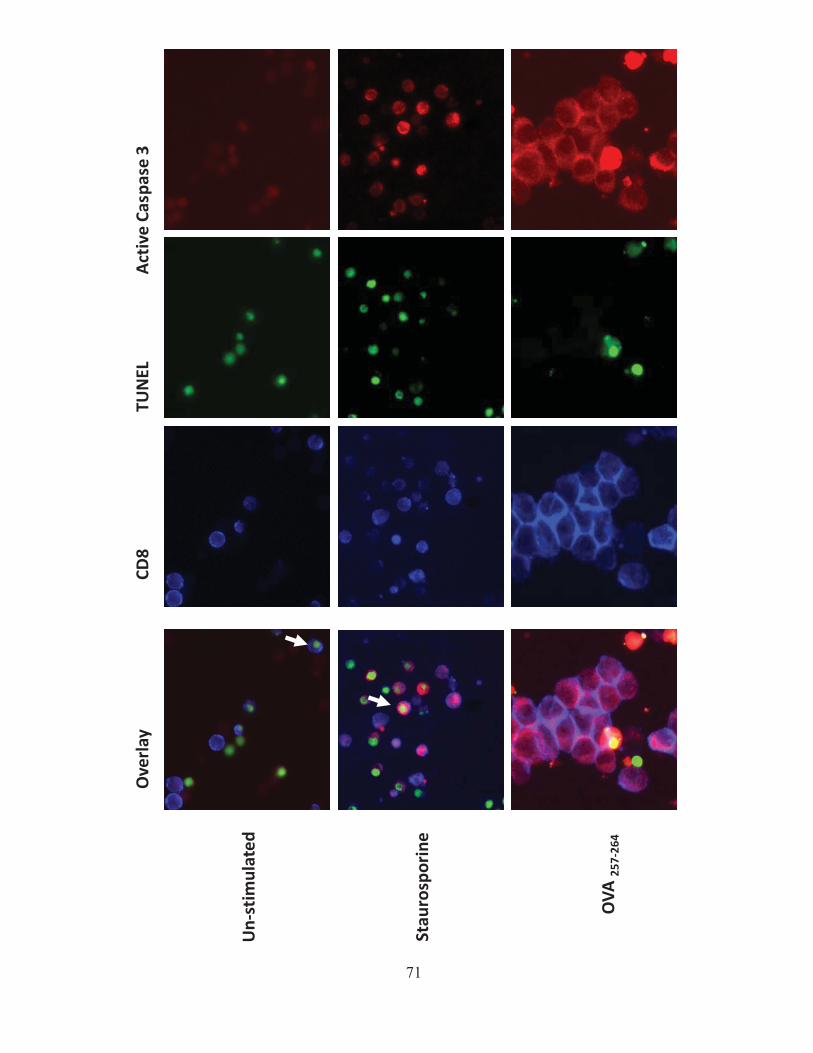
71
Ove
rlay
CD
8
TUN
EL
Act
ive
Cas
pas
e 3
OV
A 2
57
-26
4
Stau
rosp
ori
ne
Un
-sti
mu
late
d
Figure 9: Active Caspase-3 in proliferating CD8 T cells does not lead to cell death. OT1 splenocytes were placed in a flask and infected at low MOI (0.001) in vitro with LM-OVA overnight. Extracellular bacteria were then washed from the culture using a high does of gentamicin. (A) After 3 or 12 days after stimulation with LM-OVA, OT1 cultures were confirmed to be >90% CD8+ cells. The expression of active caspase-3 was also examined. (B) Cells were placed at low numbers in 96-well plates and monitored for cell viability using TMRE staining for mitochondrial activity. (C) Line graphs show the number of live and dead cells in culture over several days.
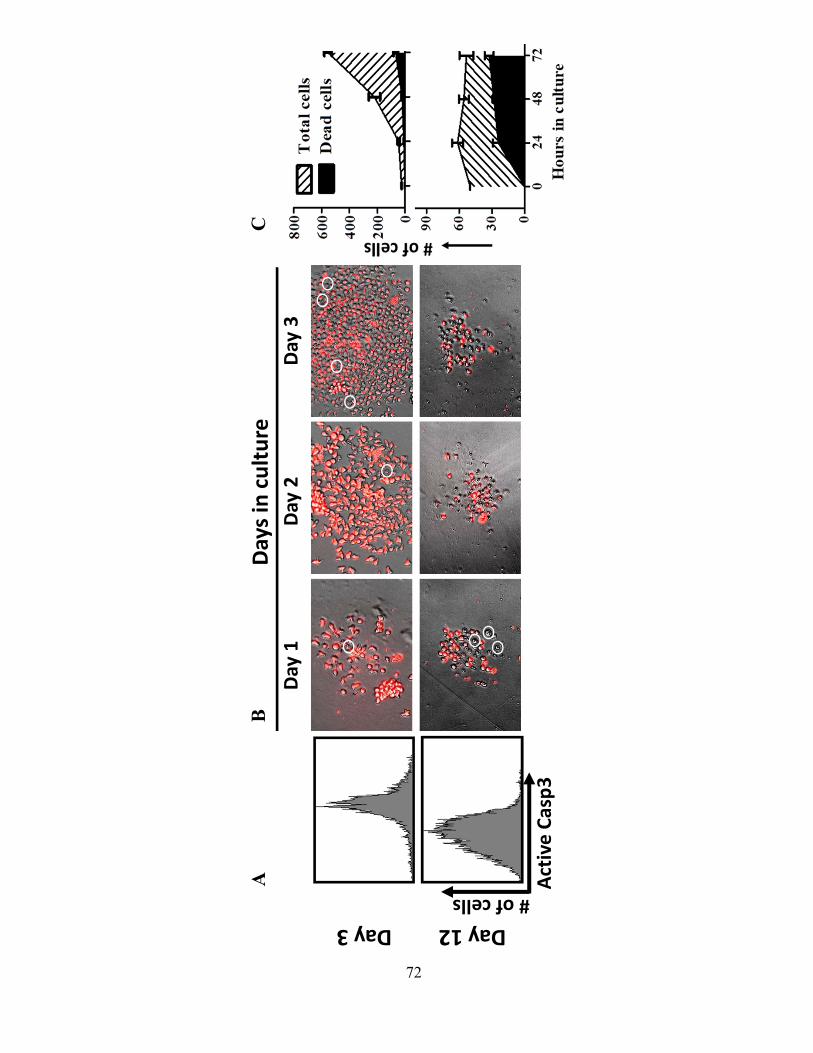
72
Day 3 Day 12
Act
ive C
asp
3
# of cells
AB
CD
ay 1
Day 2
Day 3
Day
s in c
ult
ure

(~25/well). After 24, 48 and 72 hours in sub-culture the total number of cells, and the number of
dead cells was quantified, using the active-mitochondrial stain TMRE to identify the cell
viability. Results clearly show that despite high caspase-3 expression, there is only a very low
level of cell death concurrent with CD8+ proliferation (Fig. 9A-C). Conversely, after 12 days in
culture, CD8+ T cells show low levels of caspase-3, low proliferation, and a steady increase in the
level of cell death when placed in limiting dilution culture (Fig. 9A-C). These data indicate that
proliferating CD8+ T cells express a high level of active caspase-3 without a significant level of
cell death.
4.1.C Proliferating CD8+ T Cells show elevated caspase-3 in vivo: While the above data, as
well as previous work4,107,108 has consistently shown that in vitro stimulation of CD8+ T cells can
drive caspase activation, few studies have examined the activation of caspase-3 in an in vivo
CD8+ T cell response. Thus to accomplish this, OT1 splenocytes were adoptively transferred to
WT recipient mice 7 days before the mice were infected with OVA expressing Listeria
monocytogenes or Salmonella typhimurium (LM-OVA or ST-OVA) as described in the methods
section. Following this, OVA specific CD8+ T cells were examined at various timepoints using
OVA-tetramer and other intracellular stains.
By as early as 3 days after infection with LM-OVA the level of active caspase-3 expression
was elevated within the OVA-specific CD8+ T cell population (Fig. 10A). Specifically, the
population of proliferating OVA-specific CD8+ T cells showed elevated active caspase-3 at 3 and
4 days post-infection. By 7 days post-infection, the OVA-specific CD8+ response was at its peak,
but the active caspase-3 expression had returned to a basal level (Fig. 10B), and remained as such
up to at least 40 days post-infection (Fig. 10A). I also confirmed similar results using a sensor
73

Figure 10: Proliferating CD8+ T Cells show elevated Caspase-3 during in vivo response. Recipient C57/BL6 (LM-OVA) were parked with 106 OT1 T cells After 7 days of equilibration, mice were then challenged intravenously with 104 LM-OVA as shown. At various time points challenged mice were sacrificed and a single-cell suspension obtained from spleens and other organs. Cells were then stained for CD8+, OVA-tetramer binding, active caspase-3 or caspase-3 activity (PhiPhiLux). (A-B) The % OVA-specific and % active caspase-3high in OVA-specific CD8+ T cell population is shown (C) The relative level of caspase-3 activity in OVA-specific CD8+ T cell population is shown. (D) The % OVA-specific CD8+ T cells in various organs, and the caspase-3hi cells in the OVA-specific CD8+ population is shown. n≥3 mice/time point.
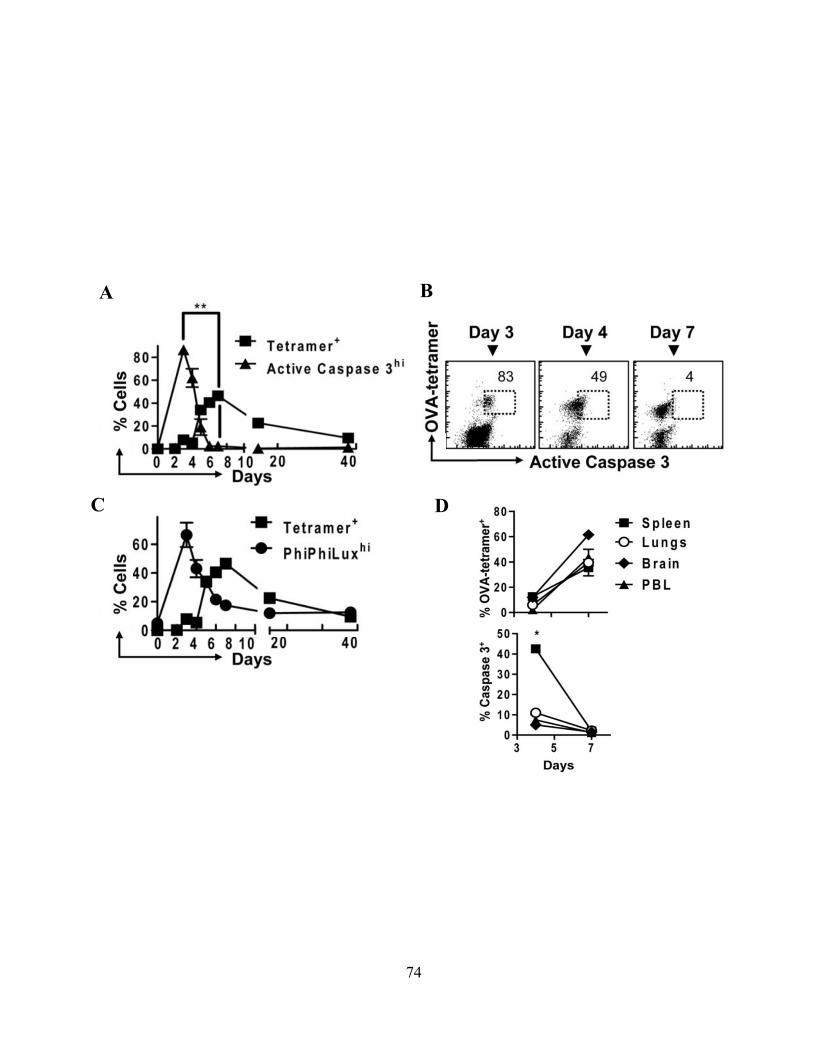
A
C
B
D
74
of caspase-3 cleavage activity PhiPhiLux, which only fluoresces when it is cleaved by caspase-3
type protease activity (Fig. 10C). These results elevated caspase-3 activity coincides with the
proliferation phase of the CD8+ T cell response (day 2-7), and it returns to base line levels of
throughout the contraction and memory phases of the response (day 7-40). It was also observed
that caspase-3high OVA-specific CD8+ T cells are primarily found within the spleen, whereas
OVA-specific CD8+ T cells found in the lungs, brain or blood showed very few active caspase-
3high CD8+ T cells (Fig. 10D). This is also consistent with the view that proliferating CD8+ T cells
specifically express active caspase-3, as T cell proliferation occurs primarily in lymphoid tissues
and not in the periphery9.
4.1.D The timing and magnitude of caspase-3 activation corresponds with the timing and
magnitude of antigen presentation: Next, I was interested to analyze how the magnitude and
timing of antigen presentation in vivo effects the onset of caspase-3 activation. To accomplish this
two OVA expressing bacterial models, each which induce divergent modes of CD8+ T cell
activation, were utilized. In contrast to infection with LM-OVA, ST-OVA infection induces a
muted and protracted proliferation of OVA –specific CD8+ T cells due to a phagosomal lifestyle
and very low levels of antigen expression272,278,279. In this case, it was observed that there was a
significant decrease and delay in the activation of active caspase-3, correlating with the delay and
decrease in the magnitude of the OVA specific CD8+ T cell response in ST-OVA infection
relative to a response to LM-OVA (Fig. 11A,B). I also confirmed that the timing and magnitude
of proliferation in both infection models of OVA-specific CD8+ T cells using Ki67 staining (Fig.
11C). These data indicate that poor antigen presentation in the ST-OVA model drives delayed
and protracted proliferation and activation of caspase-3 in OVA-specific CD8+ T cells.
Furthermore, these results support the connection of active caspase-3 to proliferation specifically.
75
Figure 11: The timing and magnitude of caspase-3 activation corresponds with the timing and magnitude of antigen presentation. Recipient 129xC57 (B6F1) mice were parked with 106
OT1 T cells. After 7 days of equilibration, mice were challenged intravenously with 104 LM-OVA 103 ST-OVA as shown. At various time points post-infection mice were sacrificed and a single-cell suspension of splenic cells was stained for CD8+, OVA-tetramer binding, active caspase-3 or Ki67. (A) The % OVA-specific CD8+ T cells at various time points are shown. (B) The % active caspase-3high in OVA-specific CD8+ T cell population are shown. (C) The %Ki67+ in OVA-specific CD8+ T cells are shown. n≥3 mice/time point.
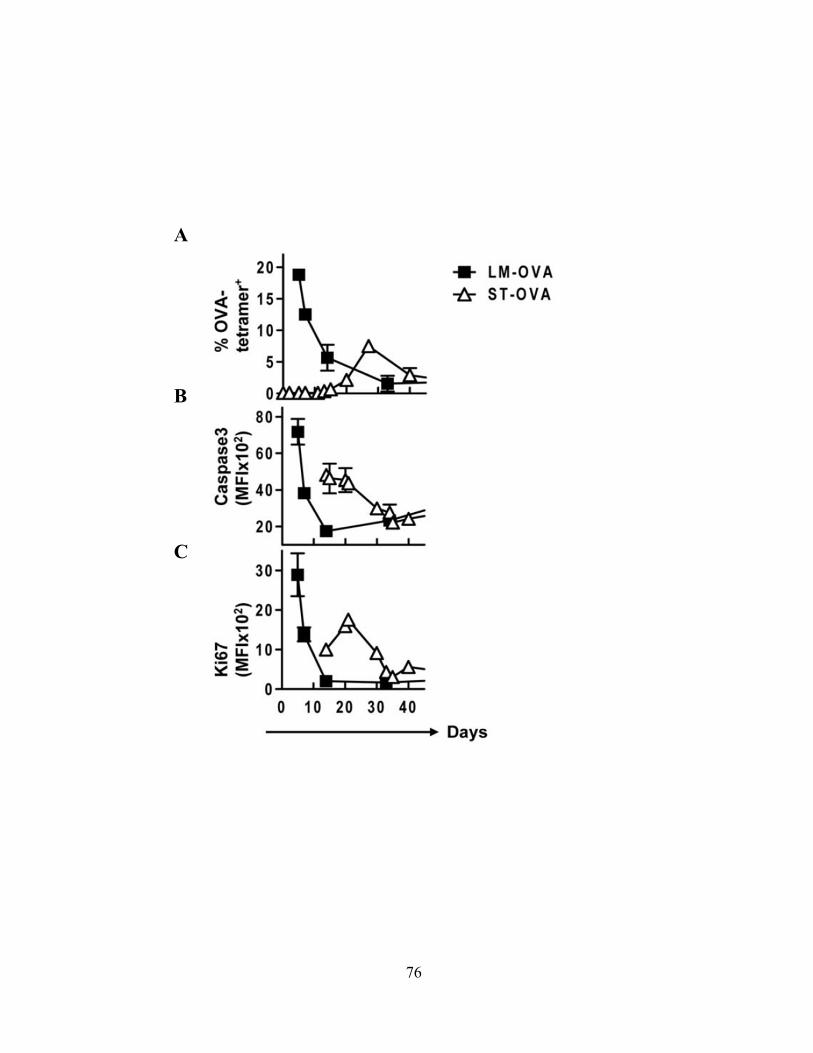
A
B
C
76
4.1.E Proliferating caspase-3+ CD8+ T cells show an apoptotic like phenotype: In vitro
results showed the surprising result that CD8+ T cells expressing active-caspase-3 co-express the
marker for proliferation Ki67, thus I next wanted to confirm similar results in vivo. At day 3 after
infection with LM-OVA, cells showed a high expression of both Ki67 and active caspase-3;
conversely, by the peak of OVA-specific CD8+ numbers at day 7, the population showed low
expression of both Ki67 and active caspase-3 (Fig. 12A). Interestingly, at time points during the
proliferative phase of the CD8+ response, all active-caspase-3+ cells were also high for Ki67
expression, but not all Ki67+ cells were high for active caspase-3 (Fig. 12A, day 4). This data
suggests that active caspase-3 is specifically expressed in proliferating CD8+ T cells early after
antigen stimulation.
In addition to expression of active caspase-3, proliferating CD8+ T cells also showed an
apoptotic like phenotype. At day 3 after infection with LM-OVA, proliferating OVA-specific
CD8+ T cells had elevated exposure of phosphatidylserine as measured by Annexin V binding
(Fig. 12B). Similarly, it was observed that activated OVA-specific CD8+ T cells co-expressed
elevated levels of active caspase-3, annexin binding (Fig. 12C) and programmed death marker 1
(PD1, data not shown). These results indicate that following antigen specific activation, CD8+ T
cells not only express active caspase-3, but also exhibit other hallmarks of apoptosis.
4.1.F Active caspase-3high CD8+ T cells do not progress to cell death: Given the apoptotic-like
phenotype of activated CD8+ T cells in vivo, it was next necessary to confirm whether active
caspase-3high CD8+ T cells were progressing to cell death. During the antigen specific CD8+ T cell
response to LM-OVA infection, a moderate increase in the staining for TUNEL within the active-
caspase-3+ population was observed (Fig. 13A). Similar moderate increases in TUNEL staining
have previously been associated with proliferating cells280. During delayed proliferation
77
Figure 12: Activated antigen specific CD8+ T cells simultaneously display markers for apoptosis and proliferation. Recipient mice were injected with 106 OT1 splenocytes 7 days before challenge with LM-OVA (iv). Infected mice were sacrificed and spleens were examined via flow cytometry at various time points after infection as shown. The co-expression of (A) Ki67 and active caspase-3, (B) OVA-Tetramer binding and annexin-V, or (C) annexin-V binding and active caspase-3 is shown.
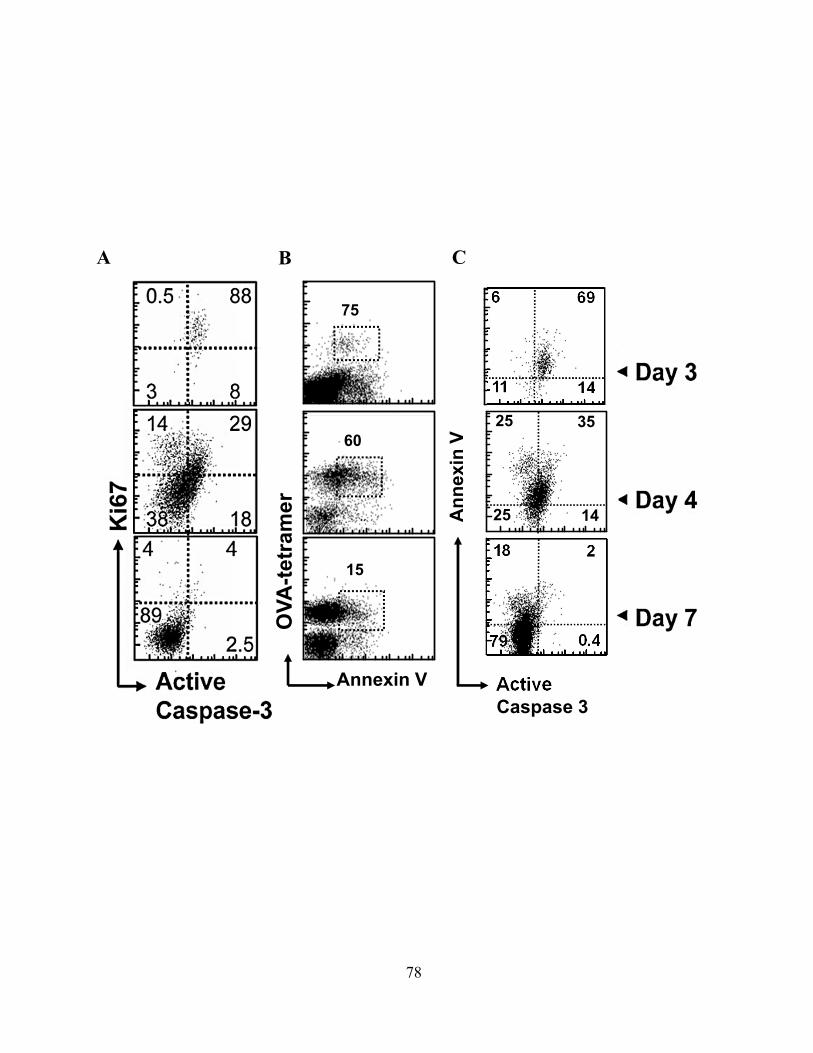
A
69
14
6
11
2
0.4
18
79
ActiveCaspase 3
Ann
exin
V
75
60
15
Annexin V
OVA
-tetr
amer
B C
35
14
25
25
78
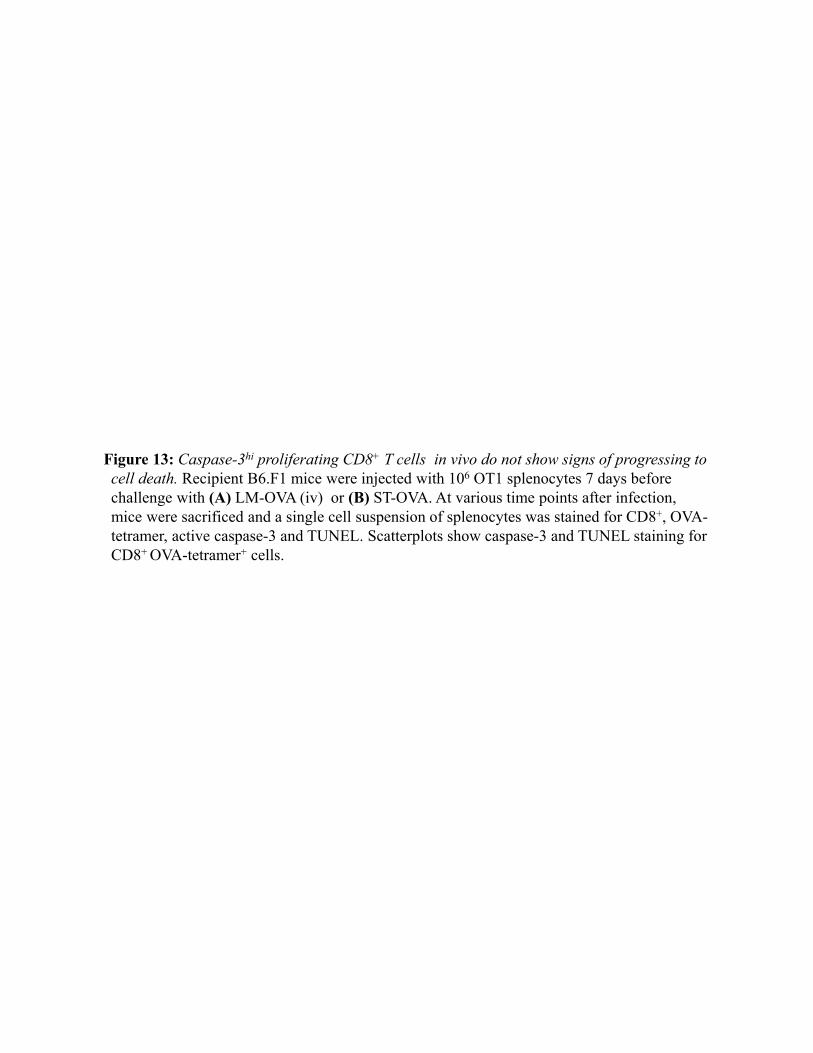
Figure 13: Caspase-3hi proliferating CD8+ T cells in vivo do not show signs of progressing to cell death. Recipient B6.F1 mice were injected with 106 OT1 splenocytes 7 days before challenge with (A) LM-OVA (iv) or (B) ST-OVA. At various time points after infection, mice were sacrificed and a single cell suspension of splenocytes was stained for CD8+, OVA-tetramer, active caspase-3 and TUNEL. Scatterplots show caspase-3 and TUNEL staining for CD8+ OVA-tetramer+ cells.
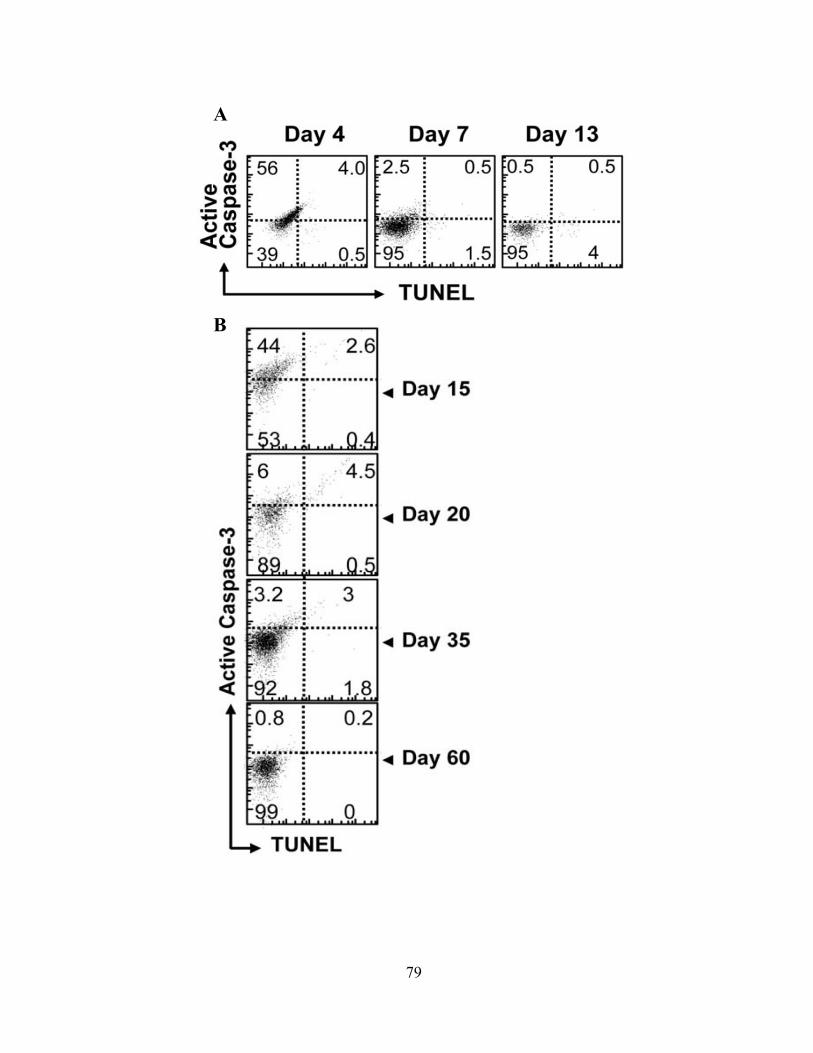
B
A
79
of OVA-specific CD8+ T cells in response to ST-OVA, only a small increase in TUNEL staining
with active caspase-3high population was again observed (Fig. 13B). These results suggest that
there is little ongoing apoptotic DNA fragmentation and cell death in either the proliferating
active caspase-3high CD8+ T cell population or the contracting caspase-3low population in vivo.
The lack of a population of terminally dead TUNEL+ CD8+ T cells in the proliferating
caspase-3high cells may be alternatively explained by rapid clearance of dying cells by phagocytic
cells in the spleen. Thus I employed PhiPhiLux to sort proliferating CD8+ T cells, at day 5 of LM-
OVA infection, into caspase-3 high and low populations (Fig. 14A), which were subsequently
placed in low density culture so as to monitor the absolute level of death and proliferation in vitro.
When placed in culture with supporting IL-7, both caspase-3 high and low populations did not
show a significant difference in capacity to proliferate or the level of cell death (Fig. 14B,C).
Similarly, both populations showed rapid progression to cell death with little proliferation when
no supporting IL-7 was added to the culture (Fig. 14B,C). These results show that the expression
of active caspase-3 during CD8+ T cell expansion is not associated with cell death either in vivo
or in vitro.
4.1.G Active caspase-3 is driven by antigen presentation and not inflammation: Our data thus
far showed that activation of CD8+ T cells drives an increase in active caspase-3, but it remained
unclear what signals regulated this activation of caspase-3. To investigate this purified CD8+ T-
cells were exposed to OVA peptide and/or inflammatory stimulus in the form of heat-killed
Listeria bacteria. I observed that while antigen stimulation led to a significant increase in active
caspase-3high cells, inflammatory stimulus alone did not (Fig. 15A). Furthermore, the addition of
inflammatory stimulus to OVA stimulated cultures did not appreciably alter the level of active
caspase-3 in antigen stimulated cultures (Fig. 15A).
80

Figure 14: Caspase-3hi proliferating CD8+ T cells do not undergo significant cell death when supplemented with supportive cytokine ex vivo. Mice were parked with 104 CD45.1+ OT1 spleen cells and challenged with 104 LM-OVA (iv). Mice were sacrificed at day 5 post LM-OVA infection and CD8+ T cells were magnetically isolated by negative selection. Cells were stained with anti-CD45.1 antibody and PhiPhiLux. (A) Cells were sorted into CD45.1+ caspase-3 activityhigh and CD45.1+ caspase-3 activitylow fractions. (B) Sorted cells were then plated at low cell densities (~12.5 cells/well) and examined for viability over several days using TMRE staining. (C) The total number and number of dead cells were counted directly in at least 6 replicate wells and the changes observed over 72 hours in the plates. (D) Cells were also maintained at higher concentrations (~100 000/well) and stained for DNA cleavage (TUNEL) after 1 day in culture.
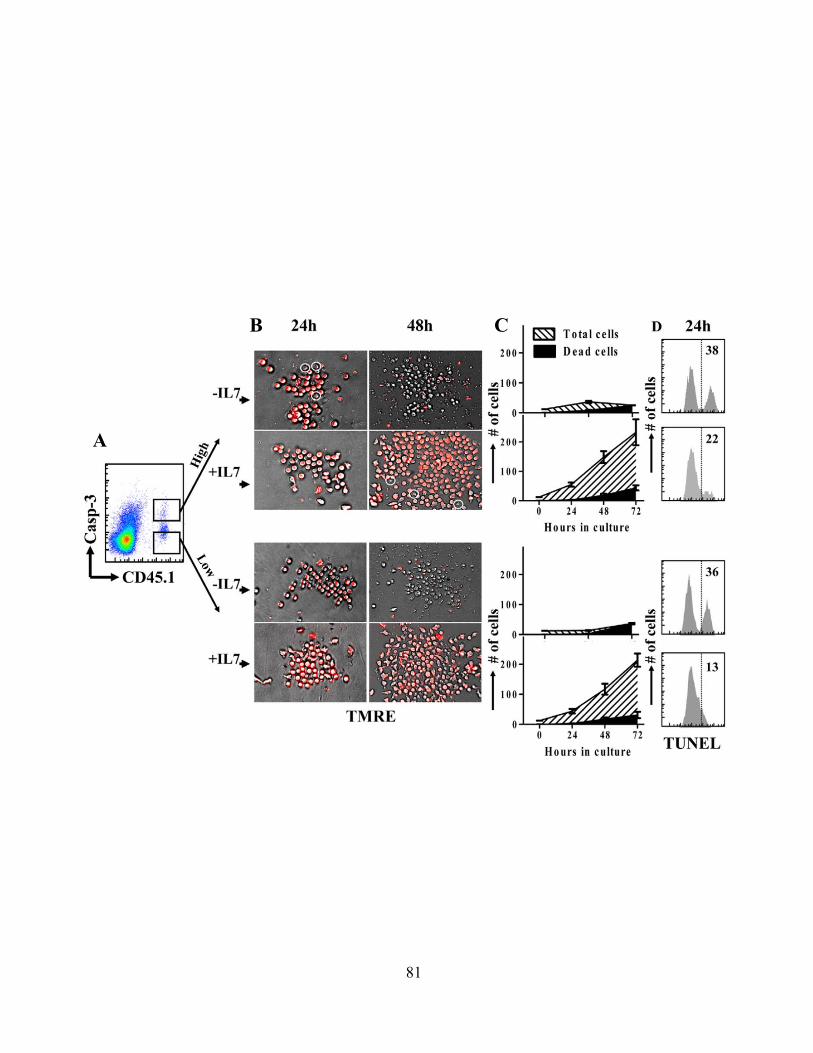
B C
A
81
Figure 15: Active caspase-3 is driven by antigen presentation and not inflammation. (A) OT-1 cells were placed in culture and either stimulated with 1 µg/ml of SIINFEKL peptide or left unstimulated. Additional inflammatory stimulation was added to some cultures by adding 104 heat killed Listeria monocytogenes (HK-LM). After 48 hours in culture cells were intracellular stained for active caspase-3 and Ki67 and examined by FACS. Data is representative of at least 3 repeated experiments. (B) WT mice were injected with 105 CFSE stained OT1 cells concurrent with PBS, LM-OVA, or ST-OVA (104, iv). Four days later mice were sacrificed and spleen cell suspensions stained with anti-CD8 antibody, OVA-tetramer, followed by intracellular staining with anti-caspase-3 antibody. (C) Rag1-/- mice were injected with 104 CFSE stained OT1 cells. The expression of active caspase-3 was examined at 4 days after adoptive transfer as described above. All scatterplots show data is obtained from gated OVA specific CD8+ T cells and is representative of 3 mice per group
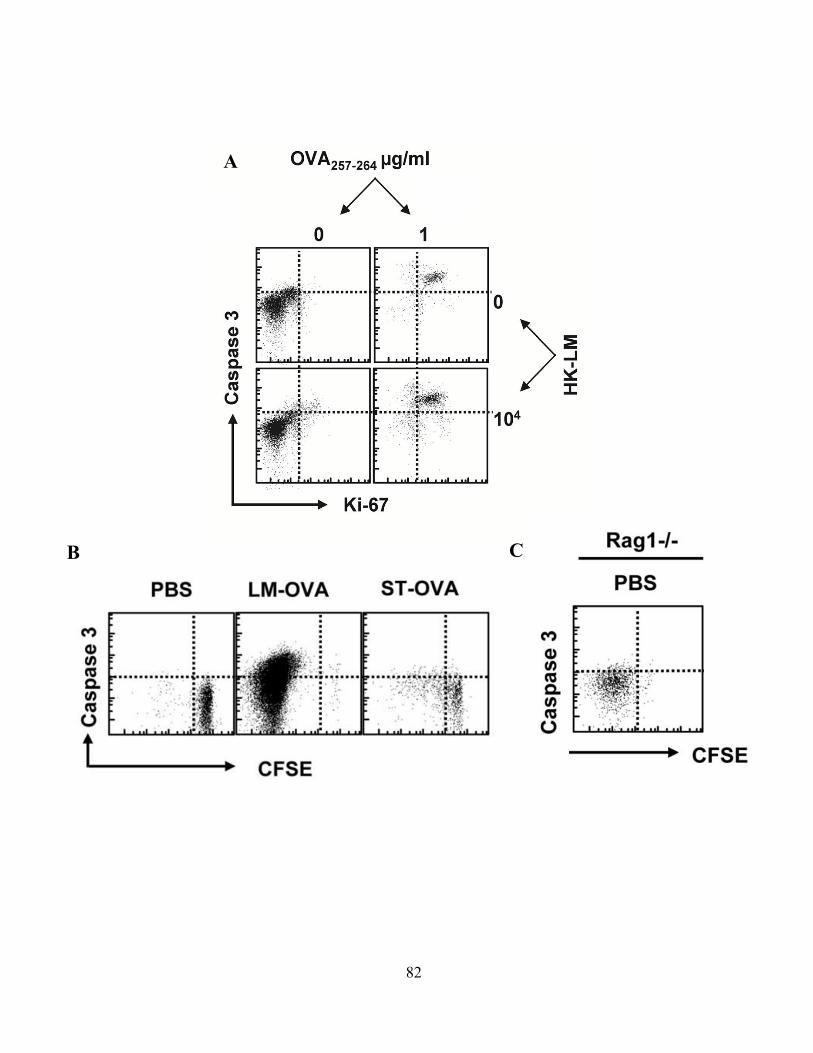
A
B C
82
Similar results were also confirmed in vivo, where mice parked with CFSE-labeled OT1 T
cells were challenged with LM-OVA, ST-OVA, or a vehicle control. Within our lab, we have
observed that ST-OVA presents little antigen early on in infection, despite significant induction of
inflammation278. At day 5 after infection, ST-OVA stimulated cells showed some low level
proliferation but had little induction of active caspase-3, whereas those cells which received
strong antigenic stimulus from LM-OVA infection showed significant proliferation and induction
of active caspase-3 (Fig. 15C). Thus, these results show that both in vitro and in vivo, the strength
of antigenic stimulation and not inflammation corresponds with the increase in active caspase-3
within proliferating T cells.
Given the correlation between activation of caspase-3 and T cell proliferation, I was also
interested to examine whether antigen independent, homeostatic proliferation of CD8+ T cells
also led to an increase in active caspase-3. To test this I adoptively transferred CFSE-stained OT1
CD8+ T cells into Rag1-/- animals, which lack T cells. After 4 days in this lymphopenic
environment, a significant “homeostatic expansion” of CD8+ T cells was observed, but there was
no significant increase in the level of active caspase-3 within these cells (Fig. 15D). These data
show that it antigenic stimulation specifically drives increased expression of caspase-3 within
proliferating CD8+ T cells.
4.1.H Caspase-3 activation occurs before the emergence of differentiated CD8+ effector
cells: I next wanted to further probe the phenotype of active caspase-3 expressing CD8+ T cells.
To do this, I examined the expression of markers of CD8+ T cell differentiation, CD62L and
IL7Rα. CD62L and IL7R are lymphoid homing markers that aid in retaining proliferating CD8+ T
cells in secondary lymphoid tissue. Effector CD8+ T cells have low expression of these markers to
allow their T cell emigration to peripheral sites281. Examining cells at day 3 and 4 of LM-OVA
83
infection in vivo, proliferating OVA specific CD8+ cells displayed an activated
CD62Lhigh/IL7Rαhigh phenotype, while also being active caspase-3high (Fig. 16A). By day 7 of
infection, the majority of cells showed a CD62Llow/IL7Rαlow effector phenotype, but active
caspase-3 expression had returned to a basal level.
To further investigate the relationship of expression of active caspase-3 and lymphoid
homing markers kinetically, I next examined CFSE-stained adoptively transferred OT1 CD8+ T
cells as they were proliferating in response to LM-OVA. At day 4 of infection, those cells that
retained the most CFSE, and thus had undergone less division, also showed the highest levels of
active caspase-3 and CD62L (Fig. 16B,C). Conversely, those cells which had undergone the most
proliferation had the lowest levels of CD62L and active caspase-3 (Fig. 16B,C). These data show
that proliferating CD8+ T cells rapidly upregulate active caspase-3 in the earliest cell divisions
following antigenic stimulus, and then progressively lose both active caspase-3 and lymphoid
homing markers as proliferation proceeds.
4.1.I Active caspase-3 promotes CD8+ T cell proliferation: Given the clear evidence that
antigenic stimulation drives early activation of caspase-3 without cell death in proliferating CD8+
T cells, the question remained as to what the function of caspase-3 is in this context. To probe this
question, CFSE-stained CD8+ T cells were treated with antigen, or left unstimulated for control
cells, with the caspase-3 specific inhibitor z-DQMD-FMK. After 48 hours, those cells treated
with a caspase-3 inhibitor showed significantly less proliferation compared to control cells (Fig.
17A). It was also observed that caspase-3 inhibited cells showed significantly more cell death
when compared to stimulated control cells (Fig. 17B). It should be noted that because death was
not significantly different than observed in unstimulated cells, this death cannot be specifically
ascribed to either inhibition of cytokine production in activated T cells4 or induction of an
84
Figure 16: Caspase-3 activation occurs before the emergence of differentiated CD8+ effector T cells. C57BL/6 mice were initially parked with 104 OT1 spleen cells. After infection with 104 LM-OVA, mice were sacrificed at various time points and spleens were harvested. Single cell suspensions were co-stained for CD8+, OVA-Tetramer, CD62L, IL7Ra and active caspase-3. (A) Scatter plots show the relative staining of OVA-tetramer+ CD8+ cells for activation markers and active caspase-3. (B) 106 CFSE stained OT1 splenocytes were injected concurrently with 104 LM-OVA. Scatterplots show expression of active caspase-3 versus CFSE and CD62L in OVA-tetramer+ CD8+ T cells after 4 days in vivo. (C) OVA specific CD8+ T cells at specific division number were examined for expression of active caspase-3 and CD62L/IL7Ra as cell proliferation proceeds (**P<0.01, *P<0.05, n = 3 per time point)
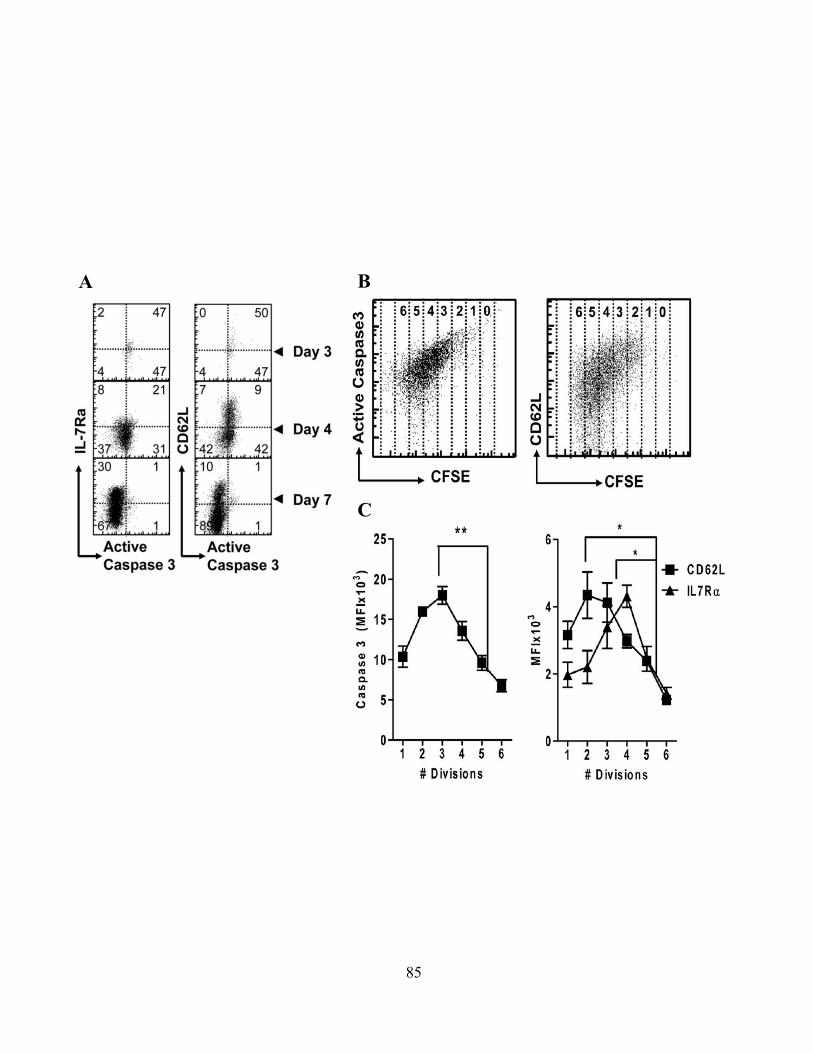
A
C
B
85
Figure 17: Caspase-3 inhibition slows CD8+ T cell proliferation and enhances cell death. 105
CFSE stained OT1 cells were stimulated in vitro with SIINFEKL peptide in the presence or absence of 50 µM caspase-3 inhibitor (z-DQMD-FMK) and examined for proliferation after 48 hours. Proliferation was examined by FACS staining for Ki67. (A) There is a significant decrease in proliferation induced by OVA peptide in the presence of caspase-3 inhibitor. (B) Cells were also examined for viability using loss of propidium iodide exclusion as a marker for loss of plasma membrane integrity (* P<0.05). Experiments shown are representative of at least 3 repeated experiments.
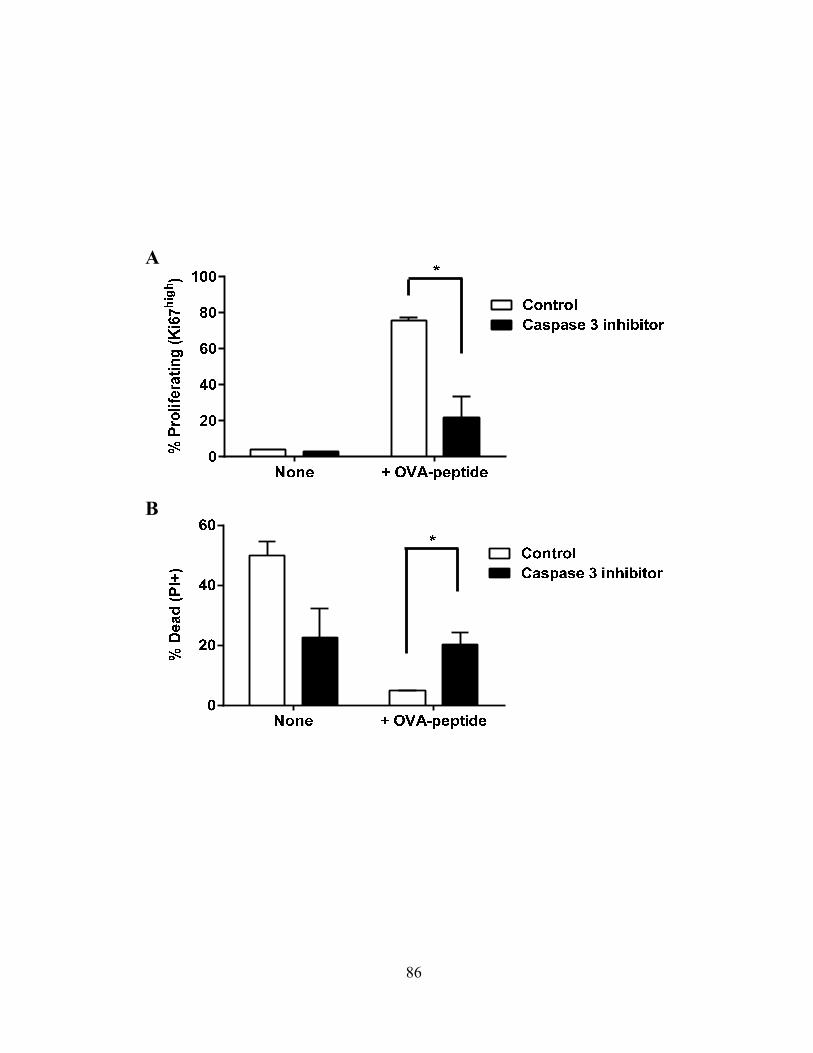
A
B
86
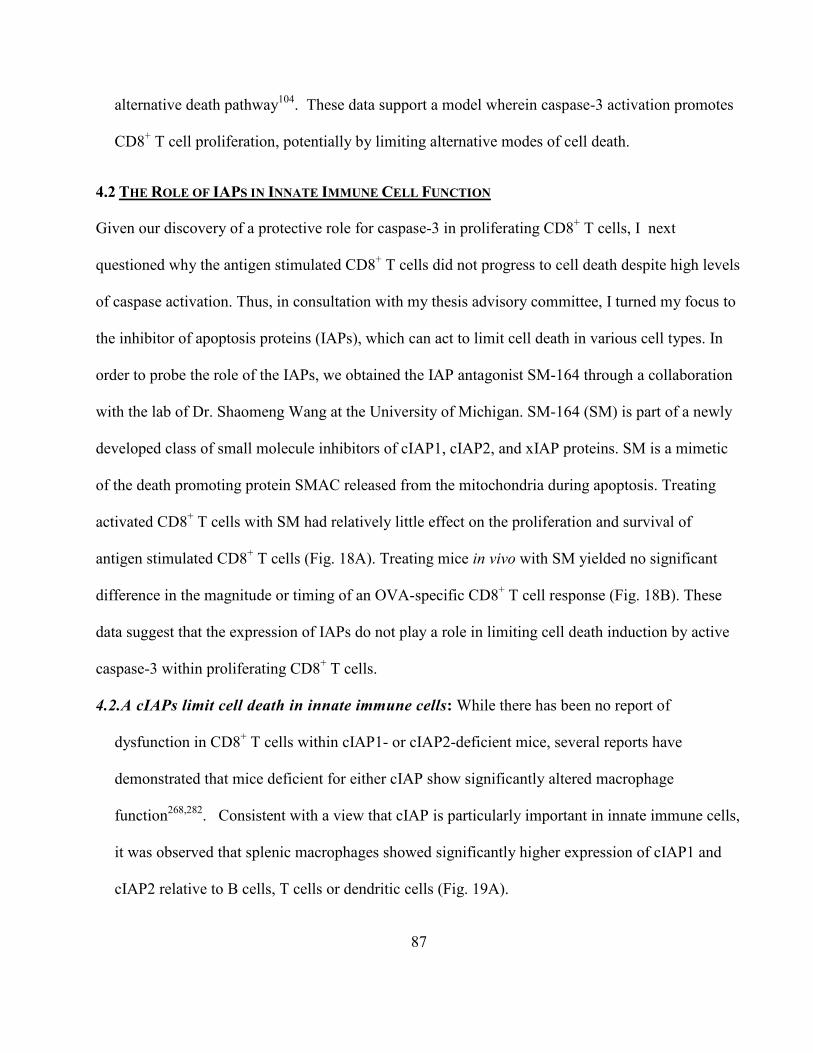
alternative death pathway104. These data support a model wherein caspase-3 activation promotes
CD8+ T cell proliferation, potentially by limiting alternative modes of cell death.
4.2 THE ROLE OF IAPS IN INNATE IMMUNE CELL FUNCTION
Given our discovery of a protective role for caspase-3 in proliferating CD8+ T cells, I next
questioned why the antigen stimulated CD8+ T cells did not progress to cell death despite high levels
of caspase activation. Thus, in consultation with my thesis advisory committee, I turned my focus to
the inhibitor of apoptosis proteins (IAPs), which can act to limit cell death in various cell types. In
order to probe the role of the IAPs, we obtained the IAP antagonist SM-164 through a collaboration
with the lab of Dr. Shaomeng Wang at the University of Michigan. SM-164 (SM) is part of a newly
developed class of small molecule inhibitors of cIAP1, cIAP2, and xIAP proteins. SM is a mimetic
of the death promoting protein SMAC released from the mitochondria during apoptosis. Treating
activated CD8+ T cells with SM had relatively little effect on the proliferation and survival of
antigen stimulated CD8+ T cells (Fig. 18A). Treating mice in vivo with SM yielded no significant
difference in the magnitude or timing of an OVA-specific CD8+ T cell response (Fig. 18B). These
data suggest that the expression of IAPs do not play a role in limiting cell death induction by active
caspase-3 within proliferating CD8+ T cells.
4.2.A cIAPs limit cell death in innate immune cells: While there has been no report of
dysfunction in CD8+ T cells within cIAP1- or cIAP2-deficient mice, several reports have
demonstrated that mice deficient for either cIAP show significantly altered macrophage
function268,282. Consistent with a view that cIAP is particularly important in innate immune cells,
it was observed that splenic macrophages showed significantly higher expression of cIAP1 and
cIAP2 relative to B cells, T cells or dendritic cells (Fig. 19A).
87

Figure 18: cIAPs inhibition does not have a signifiant impact on CD8+ T cell proliferation. OT1 cells were stimulated in vitro with OVA peptide in the presence or absence of 1µM of SM-164 SMAC mimetic. After 48 hours, cell proliferation was evaluated by Ki67 staining and cell death by propidium iodide staining. (A) No significant impact on the number of proliferating cells or cell death was observed with SMAC mimetic treatment. (B) Mice were parked with 106 CD45.1+OT1 splenocyte 7 days before challenge with LM-OVA (104, iv). Mice were bled and the blood was examined by flow cytometry for the number of CD45.1+ CD8+ T cells at various time points after infection as shown (n≥3 mice/treatment group).
A
B
0 4 7 18
% C
D45
.1+
88
Figure 19: cIAPs limit cell death in bone marrow derived macrophages and dendritic cells. (A) Spleen cells were obtained from WT C57BL6/J mice and a single cell suspension was prepared. Cells were sequentially isolated via positive magnetic selection of CD11b+ macrophages, B220+ B cells, CD3+ T cells and CD11c+ dendritic cells as described in the methods section. Isolated cells were then examined for cIAP expression via western blot. (B) Bone-marrow derived dendritic cells (BMDC) and macrophages (BMDM) cells were differentiated for 7 days as described in the methods. Cells were then plated in 96 well plates and treated with various doses of SM as shown. Viability was determined 24 hours after treatment using MTT. (C) BMDM cells treated with SM for 1 hour were examined for expression of cIAPs via western blot. (D) BMDM cells were derived from WT, cIAP1-/- or cIAP2-/- mice and treated for 1 or 4h with SM, then examined for expression of cIAPs or XIAP via western blot. Experiments are representative of at least 3 repeated experiments.

Viab
ility
(MTT
OD
)0.0 0.2 0.5 1.0 5.0
A B
C
cIAP1
WTSM (h):
cIAP1-/- cIAP2-/-
62
83
kDa0 1 4 0 1 4 0 1 4
cIAP2
48
62XIAP
actin33
48
D
89
To probe the function of cIAP expression within innate immune cells, I treated bone marrow
derived dendritic cells (BMDCs) and bone marrow derived macrophages (BMDMs) with varying
concentrations of SM. Both BMDMs and BMDCs showed a concentration dependent loss of
viability in response to treatment with SM-164 (Fig. 19B). SM-164 is known to function by
inducing the proteasomal degradation of cIAP1 and cIAP2283, thus the dose-dependent
degradation of cIAP expression with SM treatment was confirmed (Fig. 19C). Finally, cIAP1- or
cIAP2-deficient macrophages were employed to confirm that treatment with SM-164 was able to
target and deplete both cIAPs (Fig. 19D). It was noted that there was only a very modest effect
on the expression level of xIAP (Fig. 19D), but this is not necessarily indicative of xIAP function,
as SM has been shown to impact xIAP function in a non-degradative fashion283.
4.2.B SM-induced death is associated with increased inflammatory cytokine production: In
addition to their role in various cell death pathways, cIAPs have also been extensively implicated
in various inflammatory signaling pathways, for instance in TNF-α induced NF-κβ signaling189
(see introduction). Thus, in order to investigate the role of cIAPs in the production of
inflammatory cytokines, BMDCs or BMDMs were treated with SM and/or varying amounts of
the TLR4 agonist, LPS. In response to LPS, both BMDC and BMDM cells increased their
production of IL-6 and TNF cytokines (Fig. 20A,B). Furthermore, the addition of SM treatment
resulted in a significant increase in LPS-induced production of both IL-6 and TNF, although SM
treatment alone resulted in only a low level of TNF production (Fig. 20A,B). It is of note that
treatment with LPS did not have a significant impact on the sensitivity of macrophages to SM-
induced loss of cell viability (unpublished results from our lab). These results indicate that cIAP
inhibition increases pro-inflammatory signaling within innate immune cells.
90
Figure 20: SM-induced death is associated with increased inflammatory cytokine production. (A) BMDC and (B) BMDM cells were examined for inflammatory cytokine production in response to SM treatment and/or LPS. Cells were plates at 50 000 cells/well in 96 well plates and treated for 24 hours with varying concentrations of SM and LPS as shown. The level of TNF in the supernatant was evaluated by a bioassay and IL-6 was determined by a sandwich ELISA as described in the methods section. Results show the mean of at least 3 experiments performed in duplicate.
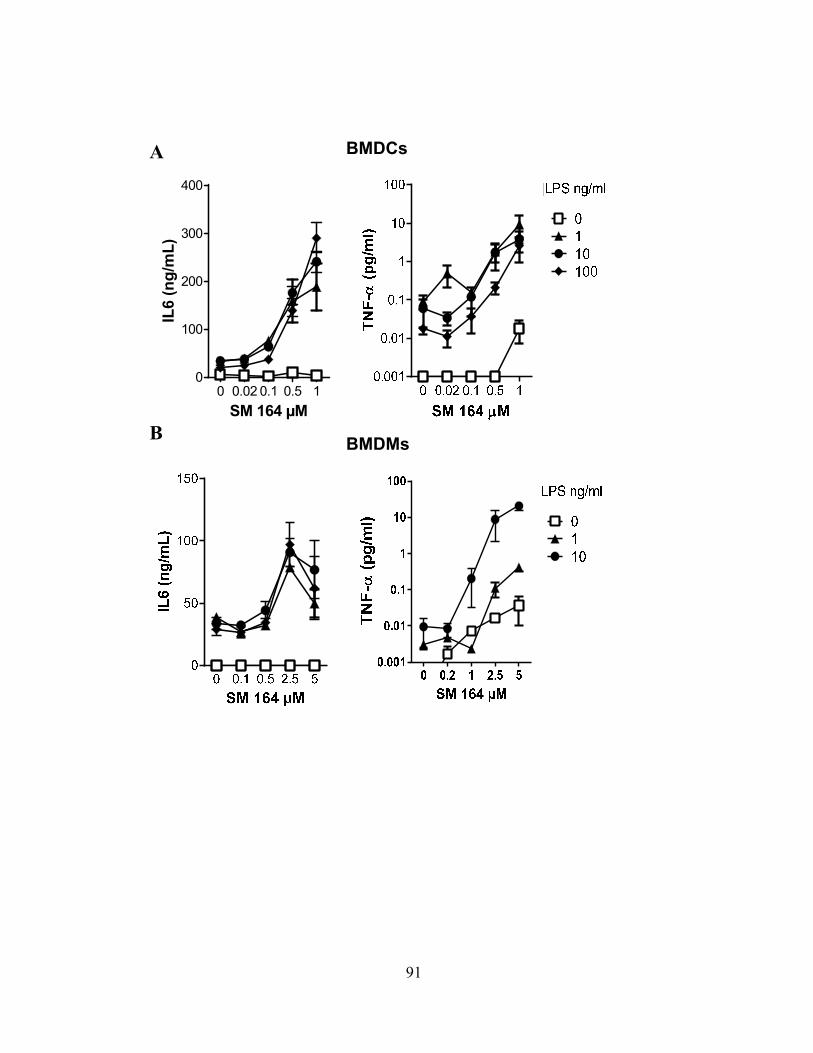
A
B
0 0.02 0.1 0.5 10
100
200
300
400
SM 164 µM
IL6
(ng/
mL)
BMDMs
BMDCs
91
4.2.C SM induces programmed necrosis in macrophages: Due to the highly similar results
obtained between BMDM and BMDC cell types thus far, I decided to examine only macrophages
for the remainder of experiments. In order to probe the exact mode of cell death induced by SM,
I next combined SM-treatment with inhibitors of death pathways. Addition of the pan-caspase
inhibitor z-VAD-FMK (zVAD) resulted in a significant increase in sensitivity of cIAP inhibition
at lower concentrations of SM (Fig. 20A,B). Notably, treatment with high levels of SM (~2.5-
5µM) alone was a potent inducer of cell death and was not significantly affected by the addition
of zVAD (Fig. 21A,B).
In contrast to caspase inhibition, treatment with the specific inhibitor of necroptosis,
necrostatin, resulted in a consistent rescue of SM-induced cell death (Fig. 21A, B). Necrostatin
functions by specifically inhibiting the kinase function of Rip1, preventing the downstream
phosphorylation of Rip3, which in turn drives necroptotic cell death205. Thus to confirm our
results, the response of necroptosis deficient Rip3-/- macrophages were also examined 253. Indeed,
results showed that Rip3-/- were highly resistant to SM-induced cell death (Fig. 21C), implicating
the pathway of necroptosis as the specific death pathway induced by SM treatment.
4.2.D cIAP1 and cIAP2 additively limit macrophage necroptosis: In order to delineate possible
differences in the function of cIAPs, the relative response to SM treatment of WT, cIAP1-/-, and
cIAP2-/- macrophages was next examined. A significant increase in sensitivity of cIAP1-/- and
cIAP2-/- macrophages to a sub-lethal dose of SM-164 (1µM) was observed (Fig. 22A). Rescue by
necrostatin was similar to WT in the cIAP1 and 2 knockout macrophages (Fig. 22A). These
results indicate that cIAP1 and cIAP2 can function redundantly in an additive fashion to limit
necroptosis.
92
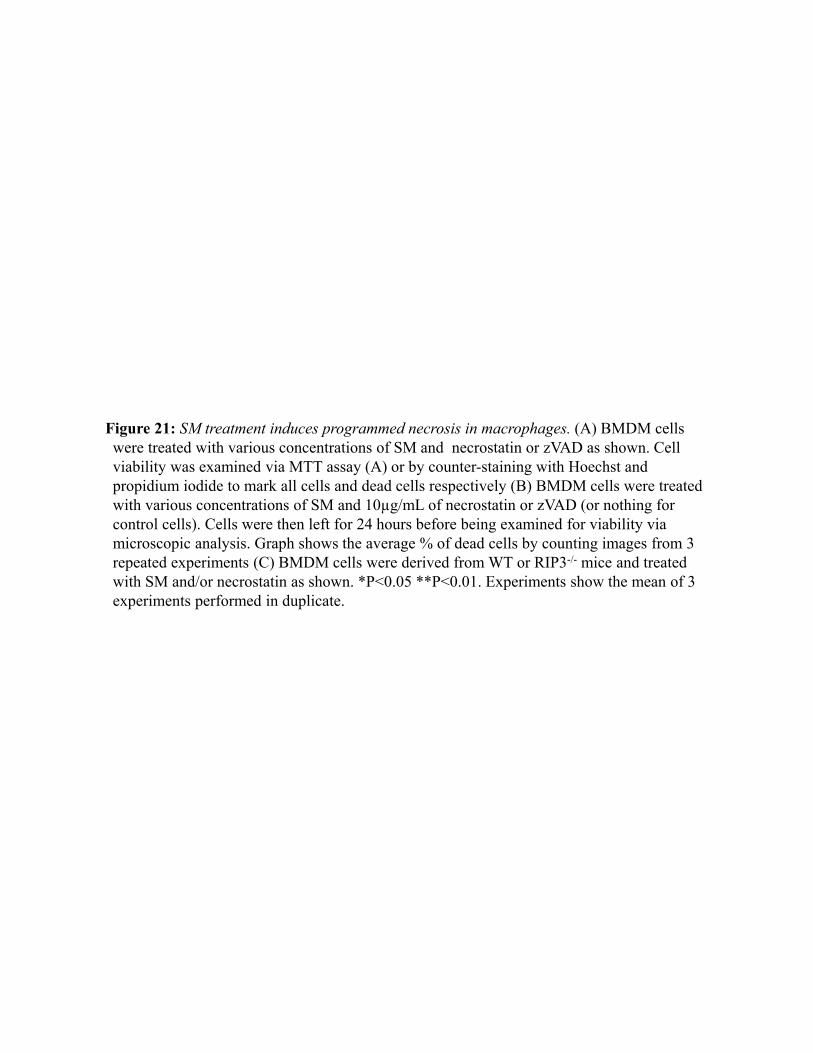
Figure 21: SM treatment induces programmed necrosis in macrophages. (A) BMDM cells were treated with various concentrations of SM and necrostatin or zVAD as shown. Cell viability was examined via MTT assay (A) or by counter-staining with Hoechst and propidium iodide to mark all cells and dead cells respectively (B) BMDM cells were treated with various concentrations of SM and 10µg/mL of necrostatin or zVAD (or nothing for control cells). Cells were then left for 24 hours before being examined for viability via microscopic analysis. Graph shows the average % of dead cells by counting images from 3 repeated experiments (C) BMDM cells were derived from WT or RIP3-/- mice and treated with SM and/or necrostatin as shown. *P<0.05 **P<0.01. Experiments show the mean of 3 experiments performed in duplicate.
5000
2500
10000
0
25
50
75
100
Control+Nec-1+zVAD
**
*
SM (nM)
% C
ell-v
iabi
lity
(MTT
)
50 µm
SM SM +Nec-1 SM +zVAD
0
1
5
SM (µ
M)
A
B
WT Rip3-/-0
25
50
75
100
Untreated+SM+SM +Nec
**
% C
ell-v
iabi
lity
(Rel
ativ
e to
Unt
reat
ed)
C
93
Figure 22: cIAP1 and cIAP2 are functionally redundant and additive in limiting macrophage necroptosis, while XIAP limits SM-induced apoptosis. (A) BMDM cells derived from WT, cIAP1-/- and cIAP2-/- mice were treated with 5µM SM and/or necrostatin as shown. 24 hours after treatment cells were examined for viability using the MTT assay. (B) BMDM cells derived from XIAP and WT mice were treated with various concentrations of SM and necrostatin as shown. 24 hours after treatment cells were examined for viability using MTT. *P<0.05 **P<0.01 ***P<0.001. Results show the average result of 3 experiments performed in duplicate.
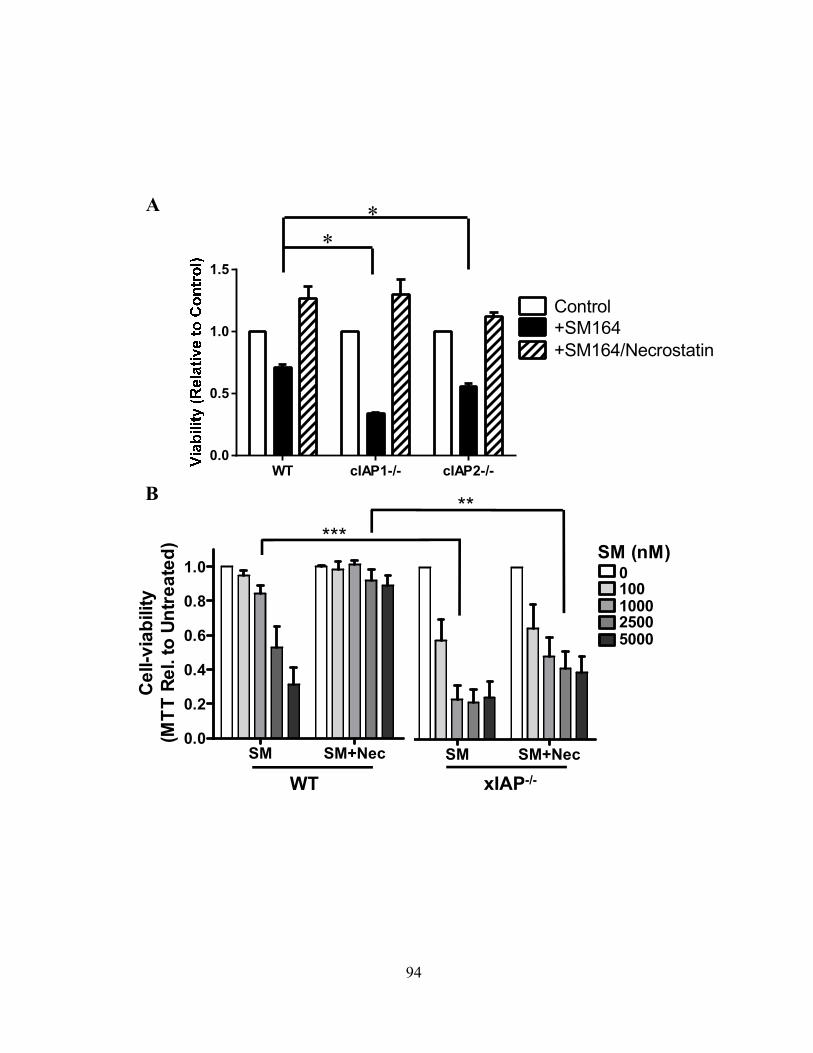
SM SM+Nec0.0
0.2
0.4
0.6
0.8
1.0
Cel
l-via
bilit
y(M
TT R
el. t
o Un
trea
ted)
SM SM+Nec
5000250010001000
SM (nM)***
**
xIAP-/-WT
A
BWT cIAP1-/- cIAP2-/-
0.0
0.5
1.0
1.5
Control+SM164+SM164/Necrostatin
**
94

4.2.E xIAP limits SM-induced apoptosis: While both cIAPs have been previously demonstrated
to ubiquitinate Rip1 and thus limit the induction of necroptosis188, the role of xIAP in the
programmed necrosis has remained enigmatic. Thus, I next treated macrophages deficient in xIAP
with SM. It was observed that xIAP-deficient macrophages showed a significant increase in
sensitivity to SM treatment, and more importantly these cells could not be rescued by the addition
of necrostatin (Fig. 22B). Unlike the cIAPs, xIAP is thought to be a bona fide inhibitor of
caspases284. Taking this combination, our data supports a view that xIAP may act to limit SM-
induced apoptosis and allow the alternative necroptotic pathway to be revealed.
4.2.F Loss of cIAPs increases Rip1 activation: In order to more directly investigate how cIAPs
specifically regulate necroptosis, the expression of Rip1 and Rip3 kinases over the timecourse of
cIAP degradation were next investigated. Consistent with its reported activity275, SM-164 induced
the rapid degradation of cIAPs within 10 minutes following treatment (Fig. 23A). As
macrophages lost their cIAP expression, a coincident increase in a secondary slightly slower-
migrating form of Rip1 was observed (Fig. 23A). It has been previously reported that this slower
migrating band is the phosphorylated form of Rip1 kinase248. I also confirmed this by
dephosphorylating Rip1 with λ-phosphatase, causing it to resolve as a single band (Fig. 23B).
These results indicate that the loss of cIAP expression causes Rip1 to become phosphorylated.
4.2.G Loss of cIAPs reduces constitutive degradation of Rip1 and Rip3 kinases: In addition
to increased expression of Rip1 kinase, it was also observed that a significant increase in the
expression of Rip3 kinase (Fig. 23A). Densitometry measurements averaged over 3 repeated
experiments show a greater then 15-fold increase in the expression of Rip3 kinase, and an
approximately 4- to 5-fold increase in Rip1 expression (Fig. 23C). To investigate whether this
increase in expression might be transcriptional, the transcript levels for Rip1 and Rip3 following
95
Figure 23: Loss of cIAPs increases Rip1 and Rip3 expression and activation. BMDMs were placed in a 24-well plate at 30 000 cells/well. Cells were then stimulated for various time with SM and/or Nec-1 as indicated. (A) Cell lysates were analyzed or expression of cIAP, Rip1, and Rip3 via western blot. (B) Cell lysates were also treated with λ phosphatase as shown to confirm that phosphorylated Rip1 can be resolved as a secondary band. (C) Three separate western blot experiments were performed (as described in A) and examined by densitometry using ImageJ software. The mean expression level of Rip1 and Rip3 normalized to actin and relative to untreated control is shown. *P<0.05. (D) BMDM cells were stimulated with SM for 1 or 4 h as indicated. mRNA levels for Rip1 and Rip3 were then quantified by qRT-PCR analysis. The average relative transcript level of Rip1 and Rip3 relative to untreated control and normalized to actin is shown from three separate experiments performed in duplicate (E) BMDM cells were treated with zVAD or lactacystin for 1h and examined for the level of Rip1 and Rip3 expression via western blot.

Con
trol
SM (1
h)SM
(4h)
Con
trol
SM (1
h)SM
(4h)
0.0
0.5
1.0
1.5
2.0Rip1Rip3
Rela
tive
tran
scrip
t lev
el(n
orm
aliz
ed to
ß-a
ctin
)
Con
trol
SM (1
h)SM
(4h)
Con
trol
SM (1
h)SM
(4h)
0
10
20
30Rip3Rip1
Rela
tive
prot
ein
expr
essi
on(D
ensi
ty n
orm
aliz
ed to
ß-a
ctin
)
*SM (min) 0 1 5 10 60 120 240 240
Nec
Rip3
Actin
Rip1pRip1
cIAP-1cIAP-2
60
50
75
75
kDa37
Rip3
Rip1
Actin
A
B
E
D
C
96
treatment with SM were next examined. While results showed a small increase in mRNA levels at
1 hour following SM treatment, this was consistently much smaller than the increase observed in
protein levels (Fig. 23C,D). To test whether constitutive degradation of Rip1 and Rip3 kinase
might be occurring, macrophages were next treated with either the 20S proteasome inhibitor,
lactacystin, or the caspase inhibitor, zVAD. Treatment with either inhibitor resulted in a small
increase in both Rip1 and Rip3 protein levels (Fig. 23E). In total these data suggest that cIAPs
may function to promote constitutive degradation of both Rip1 and Rip3 kinases.
4.2.H Autocrine TNFR1 or 2 signaling is necessary for SM-induced necroptosis: Generally,
studies have shown that necroptosis requires exogenous death receptor signaling211, although it
has been shown that autocrine production of TNF can fill this role in some cell types256. Given
that I had identified the production of TNF in response to SM treatment (Fig. 20), I wished to
investigate what role this might play in the ultimate induction of macrophage necroptosis.
TNFR1/2-deficient (TNFR-/-) macrophages showed almost complete resistance to TNFR-induced
cell death (Fig. 24A). Upon examining Rip1 directly by western blot, it was observed that no SM-
induced phosphorylation occurred in TNFR-/- macrophages (Fig. 24B). Interestingly, there also
appeared to be no changes in the expression levels of Rip1 or Rip3 following SM treatment in
TNFR-deficient macrophages, suggesting that the receptor may play a role in the degradation of
Rip1 and Rip3.
I also wished to probe the role of TNFR signaling within WT cells by confirming association
of Rip1 with the receptor following SM treatment. Confocal fluorescence microscopy also
showed increased colocaliztion of both Rip1 and Rip3 with the TNFR following treatment with
SM (Fig. 24C). In addition, I was also able to immunoprecipitate Rip1 along with the TNFR (Fig.
24D). Interestingly, only the phosphorylated form of Rip1 appeared to precipitate with TNFR,
97

Figure 24: Autocrine TNFR1 signaling is necessary for SM-induced necroptosis. (A) The viability of WT and TNF-R-/- cells after SM treatment was measured using MTT assay. (B) Bone marrow macrophages from WT and TNFR1/2-/- mice were exposed to SM and/or Nec for varying time intervals as indicated. Cell lysates were then examined for Rip1 and Rip3 expression via western blot. (C) BMDM cells were grown on cover slips in six-well plates and exposed to SM for 4 h. After staining with primary and secondary antibodies for TNF-R (blue), Rip1 (red) and Rip3 (green), cells were examined via fluorescent confocal microscopy. (D) WT macrophages were treated with SM and Nec for various time intervals as shown. Cells were then lysed using RIPA buffer and co-immunoprecipitation was then performed using Protein-G sepharose beads and an antibody targeting TNF-R1 (E) TNFR-deficient and WT BMDM cells were treated with zVAD, zVAD/SM, or zVAD/SM/Nec as shown. Viability was assessed after 24 hours by MTT assay. All graphs show the average result for at least 3 experiments performed in duplicate. ***P<0.001
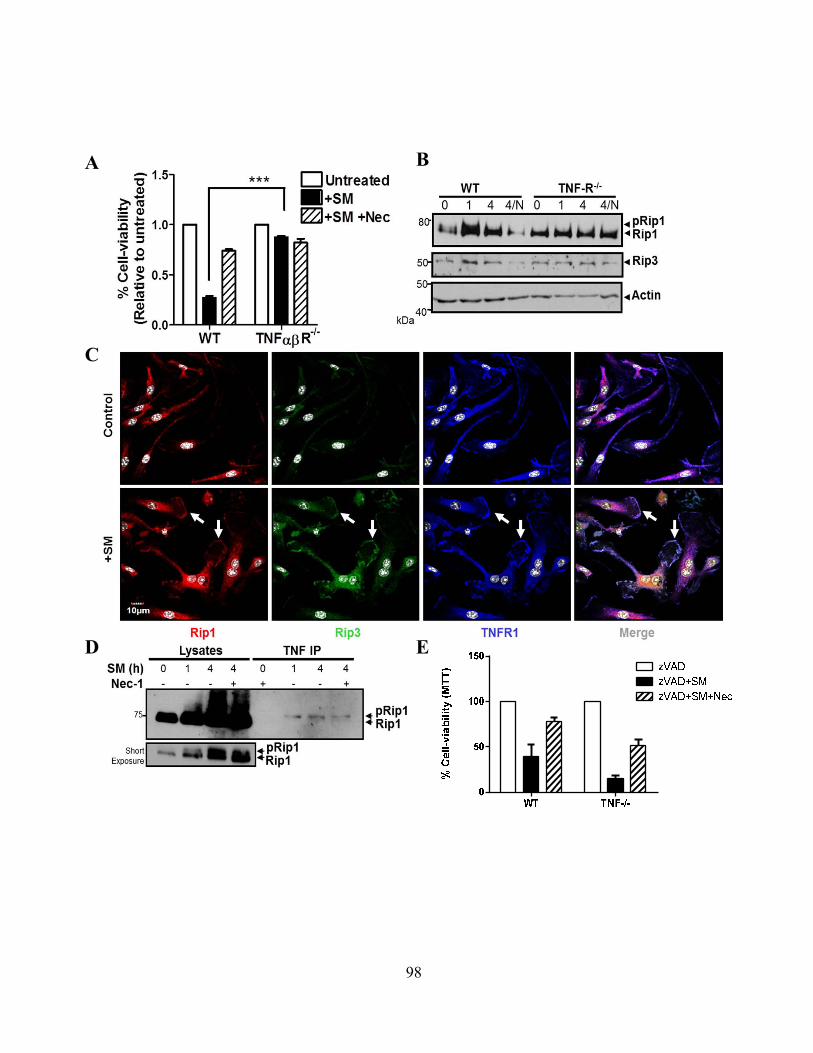
A B
C
D E
98
supporting a model wherein phosphorylation of Rip1 occurs at the receptor. Unfortunately, the
size of Rip3 precluded visualization by western blot following immunoprecipitation using our
system, as it migrates very closely to the immunoprecipitation antibody heavy chain.
Taken together, these results show that autocrine TNF signaling is necessary for SM-induced
necroptosis. However, I was interested in whether additional pro-necroptotic stimuli could push
TNF-receptor 1 and 2-deficient (TNFR-/-) macrophages to undergo programmed necrosis. By
combining zVAD with SM, a significant induction of necroptosis within TNFR-/- macrophages
was induced. This data demonstrates that TNF receptor signaling is not strictly necessary for the
induction of necroptosis if multiple necroptosis inhibitors are simultaneously targeted (Fig. 24E).
4.2.I In vivo administration of SM results in macrophage cell death: Given the discovery that
SM treatment of macrophages results in cell death in vitro, I next wanted to investigate what
effect SM treatment would have in vivo. Intraperitoneal injection of SM results in a rapid loss of
cIAP expression in both the peritoneum and the spleen (Fig. 25A). Staining of cells obtained by
peritoneal lavage 6 hours after injection of SM164 or vehicle showed a significant increase in
macrophage death, as measured by uptake of propidium iodide (Fig. 25B). Furthermore, daily
injections of SM over 4 days resulted in a significant depletion of the macrophage pool (Fig.
25C). These data show that SM treatment can also drive increased death of macrophages in vivo.
4.2.J Loss of cIAP function in vivo decreases control of Listeria monocytogenes: To assess
what effect the depletion of macrophages by SM treatment might have upon immune function,
mice were next challenged intraperitoneally with the intracellular bacterial pathogen, Listeria
monocytogenes (LM), concurrent with daily injections of SM. At day 3 of infection, significantly
higher bacterial loads in both the spleen and peritoneum of mice treated with SM relative to
vehicle treated mice were observed (Fig. 26A). Examining the cells within the peritoneum of
99

Figure 25: In vivo administration of SM results in cIAP degradation and macrophage cell death. C57BL/6J mice were injected intraperitoneally with 100 µg of SM164. After 6 h, control and treated mice were sacrificed and peritoneal lavage was performed. (A) An equal number of spleen and peritoneal cells were lysed and analyzed by western blot for expression of cIAP. (B) Peritoneal cells were stained for macrophage cell markers and cell death (propidium iodide). Histograms show gated populations of F4/80+CD11b+ macrophages or CD3+ T cells as labeled. Results are representative of at least three mice analyzed per treatment group. The mean percentages of dead cells for three mice per group (±S.E.M.) are shown. (C) Mice were injected daily (IP) with 100 µg (85mg/kg) of SM164. At day 4, mice were killed and peritoneal lavage was performed. Cells were stained and analyzed by flow cytometry. Graphs show the average number of F4/80+ and CD3+ cells within these populations. Similar results were obtained in two experiments each with n≥3 mice per group. ***P<0.001
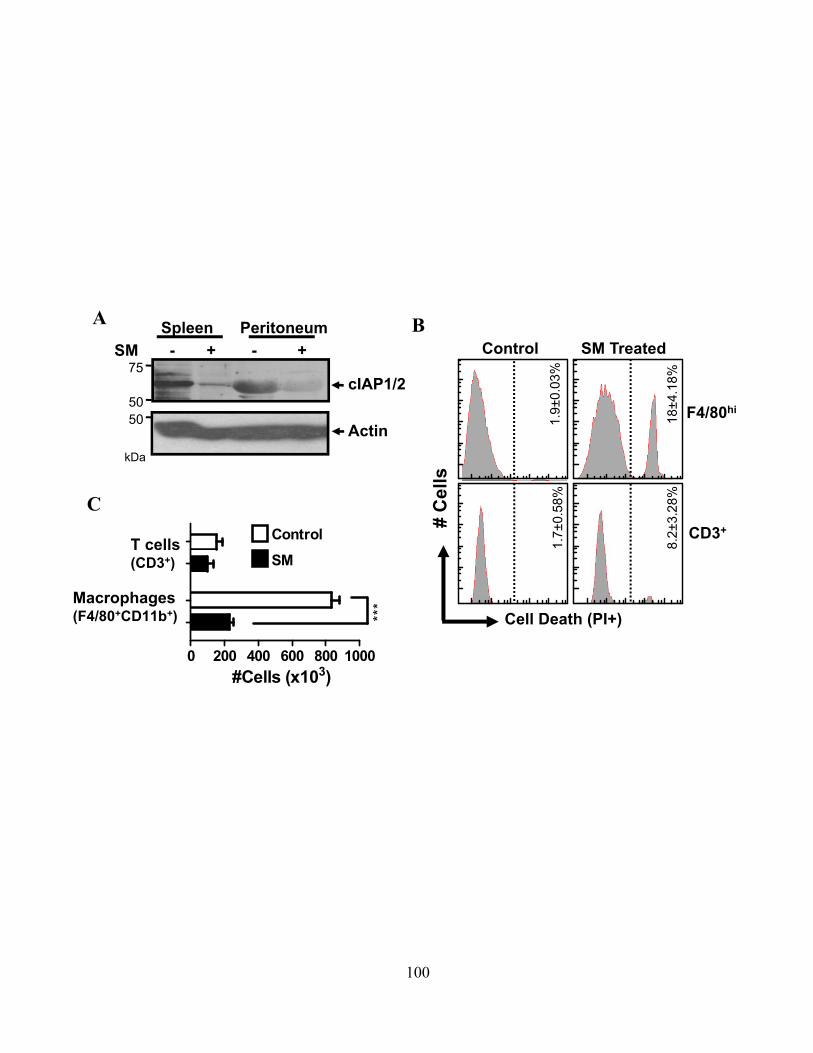
kDa
SM - + - +
cIAP1/2
Spleen Peritoneum
Actin
75
5050
Cell Death (PI+)
Control SM Treated
F4/80hi
18±4
.18%
1.9±
0.03
%CD3+
1.7±
0.58
%
8.2±
3.28
%
# C
ells
Macrophages(F4/80+CD11b+)
T cells(CD3+)
0 200 400 600 800 1000
***
SMControl
#Cells (x103)
A B
C
100

Figure 26: Decreased cIAP function in vivo decreases control of Listeria monocytogenes. C57BL/6J mice were injected intraperitoneally with 104 LM bacteria. Mice were also injected intraperitoneally with 100 µg (~5mg/kg) of SM or vehicle control daily. At day 4 post infection, mice were killed and peritoneal lavage was performed. (A) Bacterial burden in the spleen and peritoneum of mice was assessed. (B) Peritoneal cells were also stained for F4/80 and CD3 expression as well as cell death (propidium iodide). (C) The percentage of cell death (PI+) in the macrophage and T-cell populations from peritoneum as assessed by flow cytometry is shown. (D) Similarly as described, WT, cIAP1-/- and cIAP2-/- mice were challenged with 106 LM intravenously. Numbers of macrophages and T cells in the peritoneum (E), and their commitment to cell death (F, propidium iodide) were assessed at day 3 post-infection. The mean values of five mice per group are shown. *P<0.05; **P<0.01, ***P<0.001, n≥3 mice/group
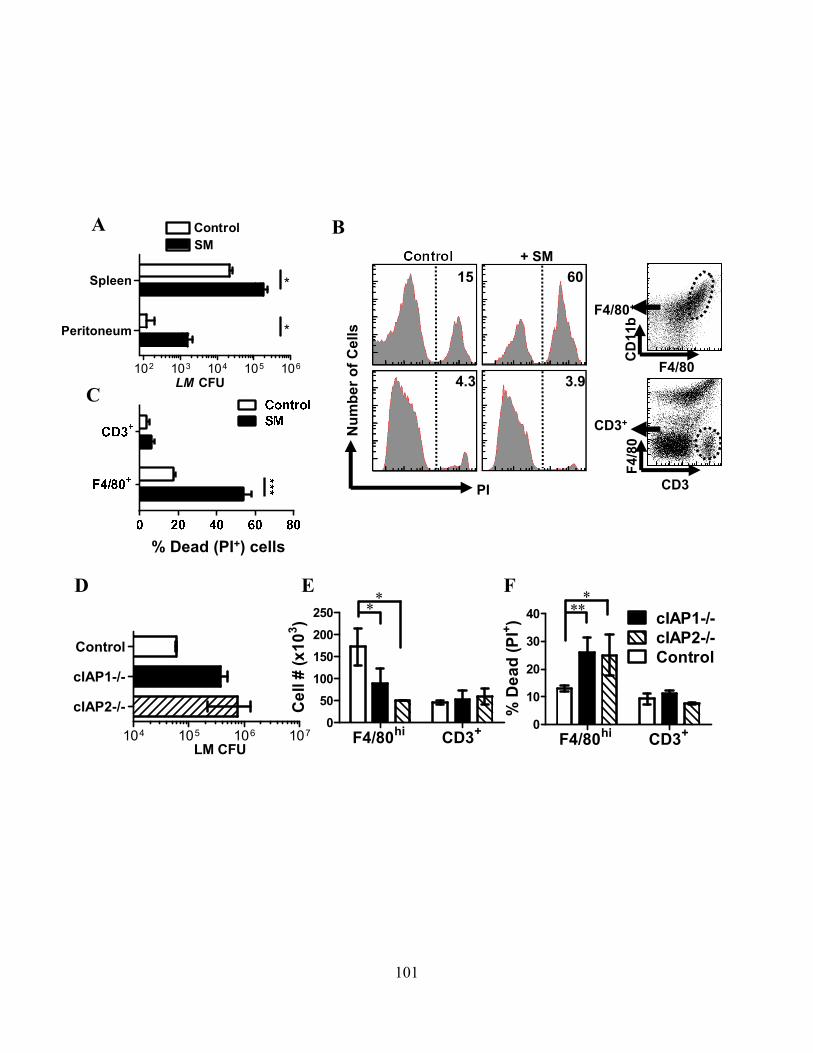
102 103 104 105 106
Peritoneum
Spleen **
**
LM CFU
SMControl
*
*F4/80+
CD3+
Control + SM15 60
4.3 3.9F4/80
CD
11b
CD3
F4/8
0
PI
Num
ber o
f Cel
ls
% Dead (PI+) cells
A B
C
104 105 106 107
cIAP2-/-
cIAP1-/-
Control
LM CFUF4/80hi CD3+0
50100150200250 *
*
Cel
l # (x
103 )
F4/80hi CD3+0
10
20
30
40 cIAP1-/-cIAP2-/-Control
***
% D
ead
(PI+ )
D E F
101
treated mice also showed a significant increase in cell death of macrophages (F4/80+CD11b+) in
SM-treated mice relative to control mice (Fig. 26B,C).
Next, mice deficient in either cIAP1 or cIAP2 were challenged with LM. Consistent with
our observations using SM, genetic deficiency for either cIAP1 or cIAP2 also resulted in a
significantly higher burden of LM bacteria (Fig. 26D). These mice also showed significantly
lower numbers of macrophages (Fig. 26E) and elevated cell death within the macrophage
population (Fig. 26F). Overall this data showed that cIAP1 and cIAP2 expression act redundantly
and additively to regulate cell death in macrophages, with decreased activity of either cIAP
leading to a deficient immune response to intracellular bacterial infection.
4.3 SALMONELLA INDUCES INTERFERON DEPENDENT NECROPTOSIS
4.3.A cIAP1-/- or cIAP2-/- mice are more susceptible to Salmonella typhimurium: Having
identified that a defect in cIAP function leads to overactive necroptosis and less control of LM
infection, I next wanted to test whether a similar effect occurs in infection with Salmonella
typhimurium (ST). Thus, cIAP1-/- and WT mice were injected with 103 CFU of ST intravenously.
At day 3 after infection, mice deficient in cIAP1 expression showed significantly more splenic
CFUs compared to WT mice (Fig. 27). Based on this and our previous work demonstrating that
cIAPs regulate macrophage necroptosis, it was inferred that death of macrophages by necroptosis
might be driving a deficient immune response to ST infection similar to LM.
4.3.B ST infection of macrophages leads to delayed necroptosis: In order to further probe
whether ST infection indeed leads to necroptosis, in vitro infections of macrophages were next
performed. Unstimulated bone marrow-derived macrophages (BMDMs) were plated in round
bottom plates and allowed 24 hours for cells to adhere. Infections were then performed as
102
Figure 27: cIAP1 Deficient mice are more susceptible to infection with Salmonella Typhimurium. WT and cIAP1-/- mice (C57BL/6J background) were challenged with 103 ST bacteria intraperitoneally. At 3 days post-infection mice were sacrificed and the bacterial CFU in the peritoneum was assessed as described in the methods section. n=3 mice/group.
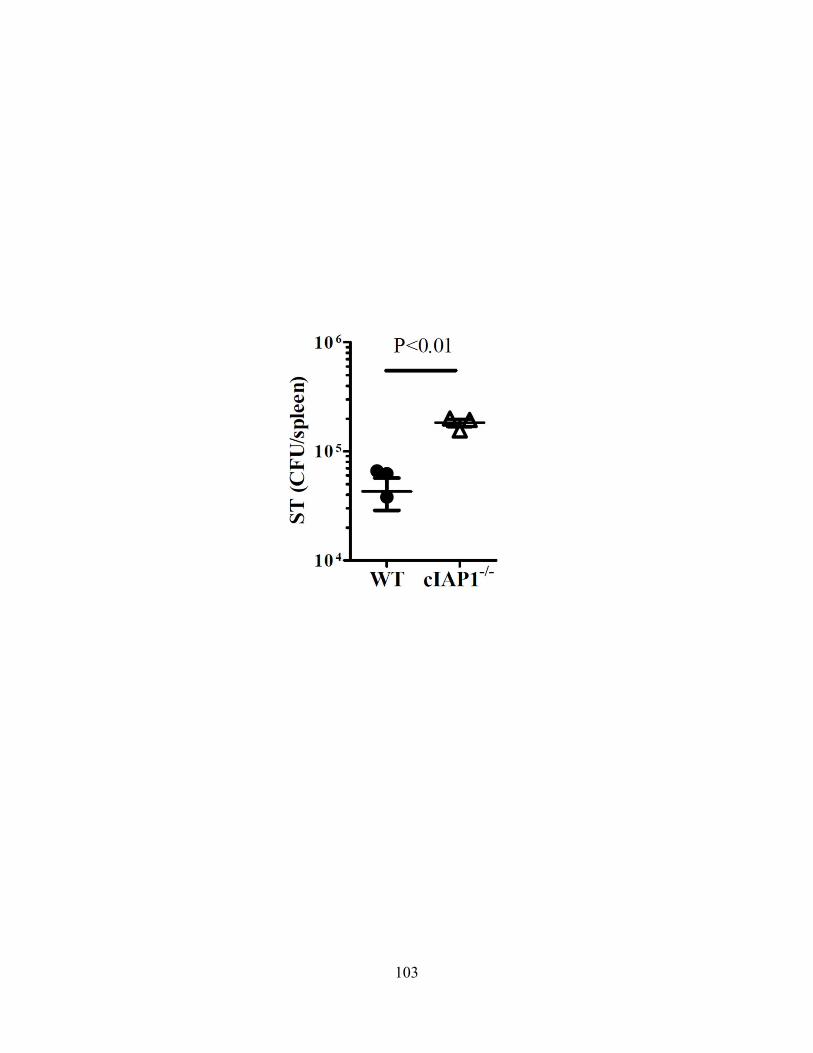
103
described in the materials and methods section at an MOI of 10. In this model, it was observed
that delayed death of infected macrophages occurred after 24-48 hours. Macrophages have
previously been shown to undergo an inflammatory caspase-1 dependent form of cell death
known as pyroptosis. At 48 hours after infection, a significant rescue of ST infected cells with a
caspase-1 specific inhibitor was noted (Fig. 28A). However, the addition of necrostatin resulted in
a significantly better rescue of macrophage viability (Fig. 28A). The involvement of necroptotic
mechanisms in ST-induced macrophage cell death was also confirmed through an siRNA
knockdown of Rip3 (Fig. 28B), which resulted in significantly less ST-induced macrophage cell
death (Fig. 28C). This evidence indicates that infection with ST induces necroptotic cell death
within macrophages.
4.3.C ST induces necroptosis in macrophages in vivo: I next wanted to confirm whether death
of macrophages following ST infection in vivo was occurring by necroptosis. Thus, WT and
Rip3-deficient were infected mice intravenously with 103 CFU of ST and examined the numbers
of macrophages in the spleen at day 3 of infection. Consistent with an induction of necroptosis by
ST infection, significantly less death of Rip3-deficient than WT macrophages was observed, as
determined by uptake of propidium iodide (Fig. 29A). Importantly, there was no significant
change in the survival of Rip3-deficient mice (Fig. 29B), signifying a complex phenotype of ST
pathogenesis occurring within these mice. Overall, this data supports the model that ST induces
macrophage necroptosis in vivo, but resistance to this effect alone is inadequate to protect from
infection.
4.3.D Type-I interferon signaling is required for ST-induced necroptosis: At this time, several
members of the lab were studying the role of type-I interferon in ST pathogenesis. In their work,
they had observed that interferon receptor alpha-deficient (IFNAR-/-) mice showed significantly
104

Figure 28: Infection of BMDM cells with ST induces delayed necroptotic cell death. BMDM cells were plated in round bottom 96-well plates at 50 000 cells/well and infected with ST at 10 MOI. After 30 minutes of infection, cells were washed with high concentration of gentamicin (50 micrograms/ml) to remove extracellular bacteria. Infected cultures were also treated with various inhibitors (at 10µg/mL) as shown. (A) 48 hours after infection BMDM viability was assessed using neutral red assay (for lysosomal activity). (B) WT BMDM cells were transfected with control or Rip3 target siRNA as shown. After 24 hours, knockdown of Rip3 was assessed by western blot. (C) Following siRNA knockdown cells were challenged with ST bacteria as described above, and assessed for viability after an additional 48 hours of infection. All experiments are representative of at least 3 experiments performed in duplicate. **P<0.01
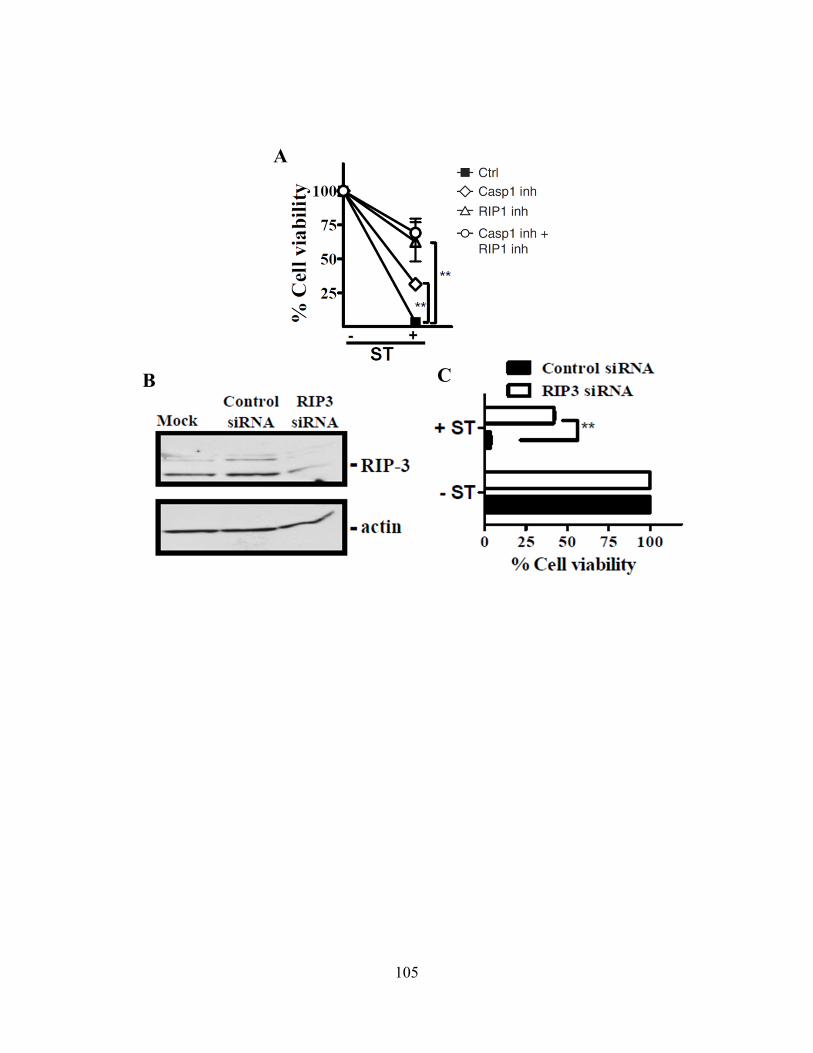
A
B C
105
Figure 29: Rip3-deficient mice show less macrophage cell death during ST infection in vivo. WT and Rip3-/- mice (C57BL background) were challenged with 103 ST intraperitoneally. (A) At day 3 post-infection mice were sacrificed and the number of macrophages in the spleen was assessed. The level of cell death within the macrophage population was also assessed by propidium iodide staining (n=3 mice per group) (B) Survival or WT and Rip3-/-
mice during ST-infection was also examined. (n=4 mice per group)

A B
106
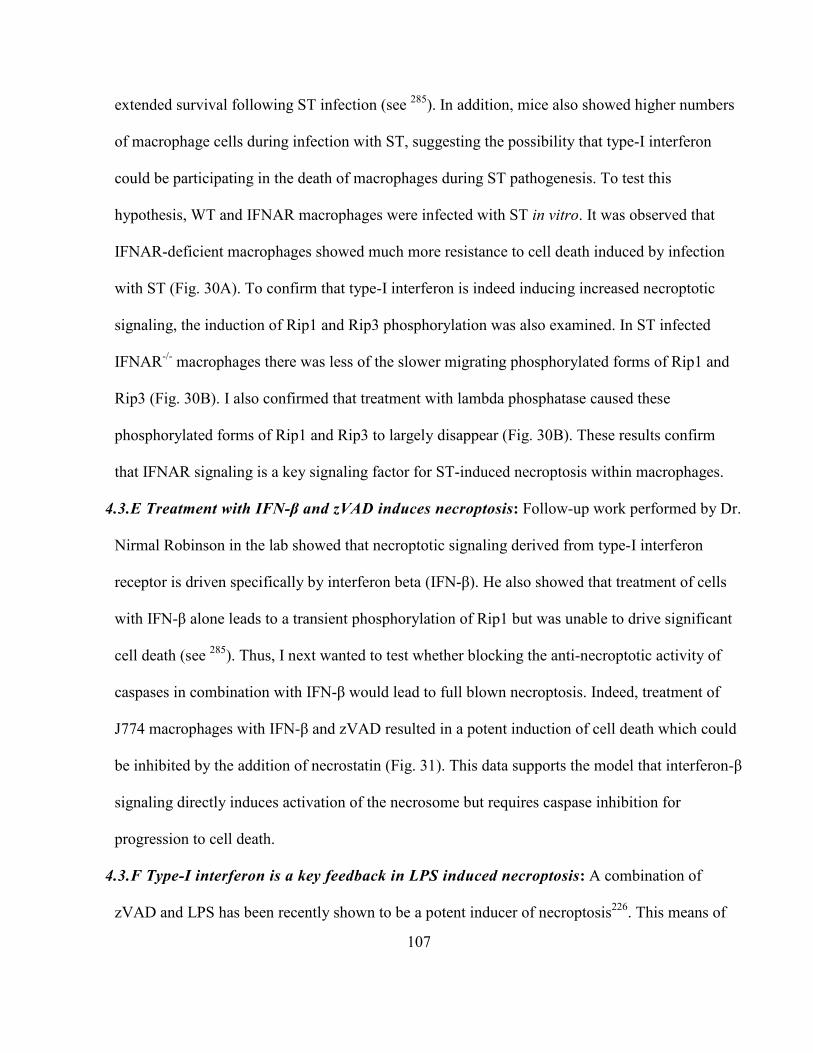
extended survival following ST infection (see 285). In addition, mice also showed higher numbers
of macrophage cells during infection with ST, suggesting the possibility that type-I interferon
could be participating in the death of macrophages during ST pathogenesis. To test this
hypothesis, WT and IFNAR macrophages were infected with ST in vitro. It was observed that
IFNAR-deficient macrophages showed much more resistance to cell death induced by infection
with ST (Fig. 30A). To confirm that type-I interferon is indeed inducing increased necroptotic
signaling, the induction of Rip1 and Rip3 phosphorylation was also examined. In ST infected
IFNAR-/- macrophages there was less of the slower migrating phosphorylated forms of Rip1 and
Rip3 (Fig. 30B). I also confirmed that treatment with lambda phosphatase caused these
phosphorylated forms of Rip1 and Rip3 to largely disappear (Fig. 30B). These results confirm
that IFNAR signaling is a key signaling factor for ST-induced necroptosis within macrophages.
4.3.E Treatment with IFN-β and zVAD induces necroptosis: Follow-up work performed by Dr.
Nirmal Robinson in the lab showed that necroptotic signaling derived from type-I interferon
receptor is driven specifically by interferon beta (IFN-β). He also showed that treatment of cells
with IFN-β alone leads to a transient phosphorylation of Rip1 but was unable to drive significant
cell death (see 285). Thus, I next wanted to test whether blocking the anti-necroptotic activity of
caspases in combination with IFN-β would lead to full blown necroptosis. Indeed, treatment of
J774 macrophages with IFN-β and zVAD resulted in a potent induction of cell death which could
be inhibited by the addition of necrostatin (Fig. 31). This data supports the model that interferon-β
signaling directly induces activation of the necrosome but requires caspase inhibition for
progression to cell death.
4.3.F Type-I interferon is a key feedback in LPS induced necroptosis: A combination of
zVAD and LPS has been recently shown to be a potent inducer of necroptosis226. This means of
107

Figure 30: IFNAR-deficient BMDMs show less phosphorylation of Rip1 and Rip3 kinases and less necroptosis upon infection with ST. (A) WT and IFNAR-/- mice were challenged with ST in vitro as described in the methods section. At 24 and 48 hours after infection the viability of cells was examined using the neutral red assay. Results show the average % viability for at least 3 experiments performed in duplicate. (B) After 24 hours of infection as described, WT and IFNAR macrophages were examined for Rip1 and Rip3 phosphorylation as shown. Some lysates were also treated with λ phosphatase to confirm phosphorylation bands for Rip1 and Rip3.
Experiments presented in this figure were performed in collaboration with N. Robinson.
37
50
75 Rip1pRip1
Rip3pRip3
Actin
WT IFNAR-/-
kDa
A
B
λ
IFNAR-/-
IFNAR-/- + STWT + ST
WT
108
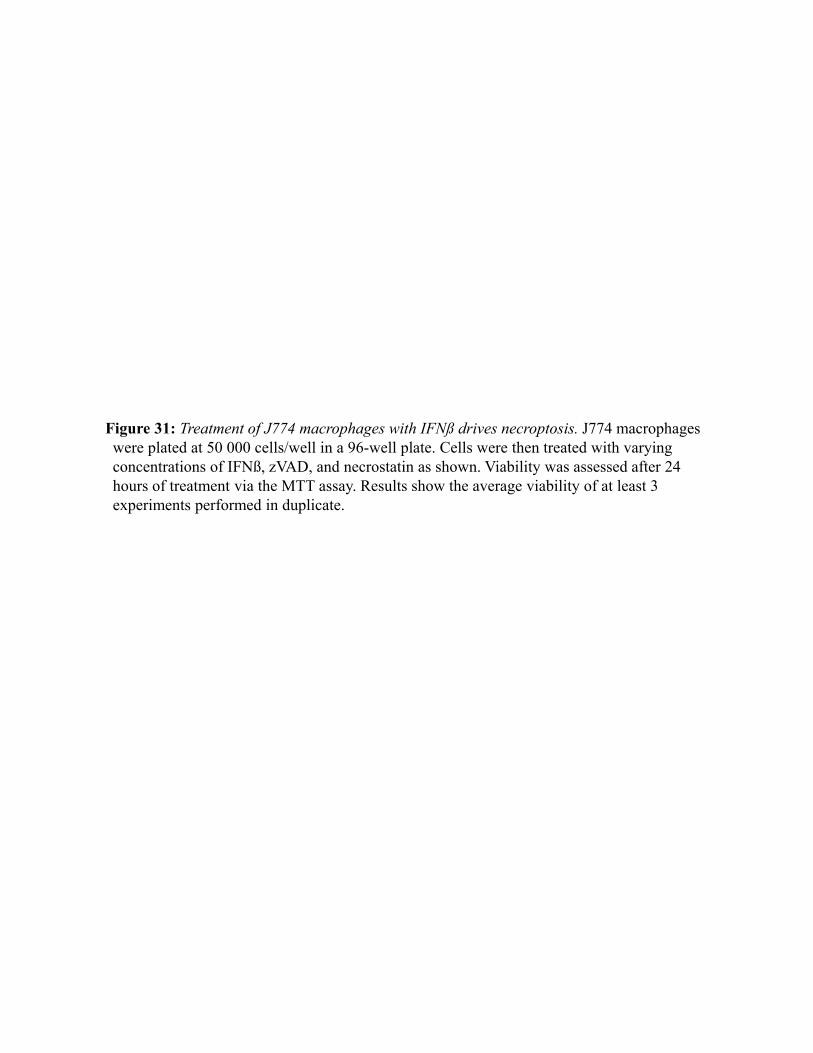
Figure 31: Treatment of J774 macrophages with IFNß drives necroptosis. J774 macrophages were plated at 50 000 cells/well in a 96-well plate. Cells were then treated with varying concentrations of IFNß, zVAD, and necrostatin as shown. Viability was assessed after 24 hours of treatment via the MTT assay. Results show the average viability of at least 3 experiments performed in duplicate.
109
inducing necroptosis by stimulating PAMP receptors recapitulates some elements of ST infection,
and is known to induce release of type-I interferon286. Thus, I was interested to test whether
induction of necroptosis by this method is also dependent upon IFNAR signaling. Whereas WT
macrophages showed a significant loss of viability 24 hours after treatment with zVAD and LPS,
IFNAR-/- macrophages were highly resistant to this effect (Fig. 32). This result supports the
highly novel conclusion that type-I interferon signaling is a key feedback for the induction of
macrophage cell death by LPS/zVAD-induced necroptosis.
4.3.G Type-I interferon induced death drives systemic shock in vivo: Next, I wished to
confirm the role of interferon in zVAD/LPS induced necroptosis within an in vivo setting.
Following injection with a combination of zVAD and LPS, WT mice displayed a hunched posture
and were moribund by 18 hours after injection. In stark contrast, IFNAR mice appeared relatively
normal. At this time, all mice were sacrificed and a peritoneal lavage was performed. Both
IFNAR and WT mice showed a drop on the total number of peritoneal macrophage cells (Fig.
33A,B), although IFNAR mice had significantly less cell death occurring within the macrophage
pool (Fig. 33C). These results support the view that interferon-induced macrophage necroptosis
may exacerbate the effects of LPS induced shock within mice.
4.4 CATHEPSINS REGULATE NECROPTOSIS
4.4.A zVAD alone can induce macrophage necroptosis: Next, a further investigation of how
Rip1 and Rip3 kinases are regulated to within macrophages was initiated. To accomplish this, I
wished to examine how the canonical inducer of necroptosis, zVAD, drives changes in Rip1 and
Rip3 expression, and results in necroptosis of macrophages. High doses of zVAD have been
previously documented to induce cell death within macrophage cell lines287. In our model, we
110
Figure 32: Autocrine production of type-I interferon is a key mechanism in the induction of necroptosis through the zVAD/LPS pathway. WT and IFNAR-/- BMDM cells were plated at 50 000 cells/well in 96-well plates. Cells were then treated with LPS (100 ng/mL) and various doses of zVAD as shown. After 24 hours cell viability was assessed using the MTT assay. Results show the mean of at least 3 experiments performed in duplicate. ***P<0.001
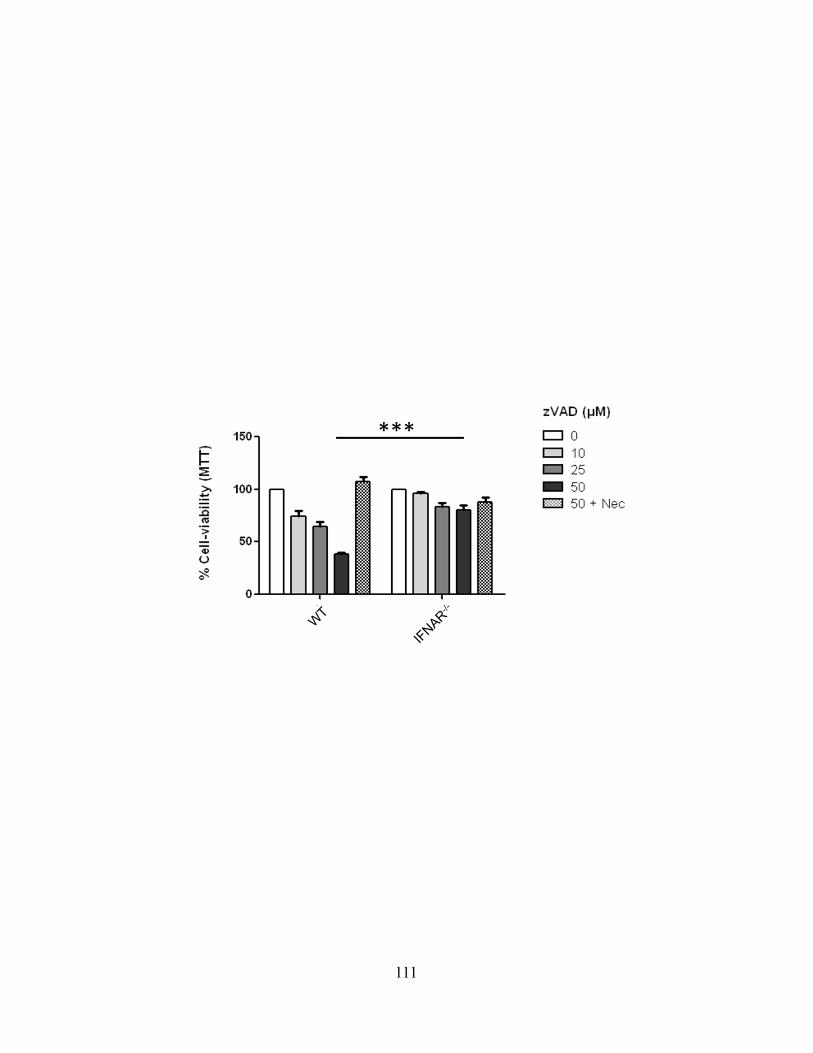
***
111

Figure 33: Macrophages in INAR-deficient mice undergo less death following LPS/zVAD injection in vivo. WT and IFNAR-/- mice were injected with 10mg/kg of LPS and 50 µg of zVAD suspended in PBS. After 18 hours, mice were sacrificed and a peritoneal lavage was performed. (A) FACS staining for CD11b and F4/80 expression was utilized to assess the number of macrophages in the peritoneal lavage. (B) The average % of macrophages is shown. (C) The viability of macrophages in the peritoneal lavage was also assessed using propidium iodide staining. n=3 mice/group, *P<0.05
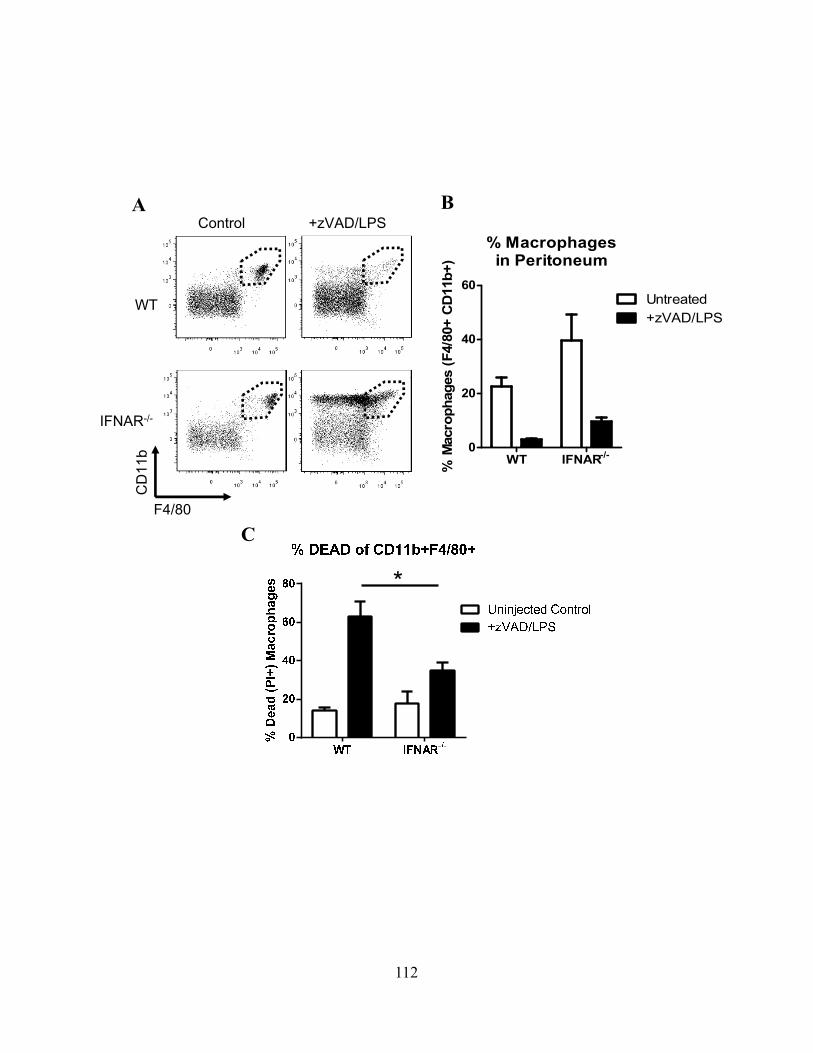
% Macrophagesin Peritoneum
WT IFNAR-/-0
20
40
60Untreated+zVAD/LPS
% M
acro
phag
es (F
4/80
+ C
D11
b+)
F4/80
CD
11b
IFNAR-/-
WT
Control +zVAD/LPSBA
C
112
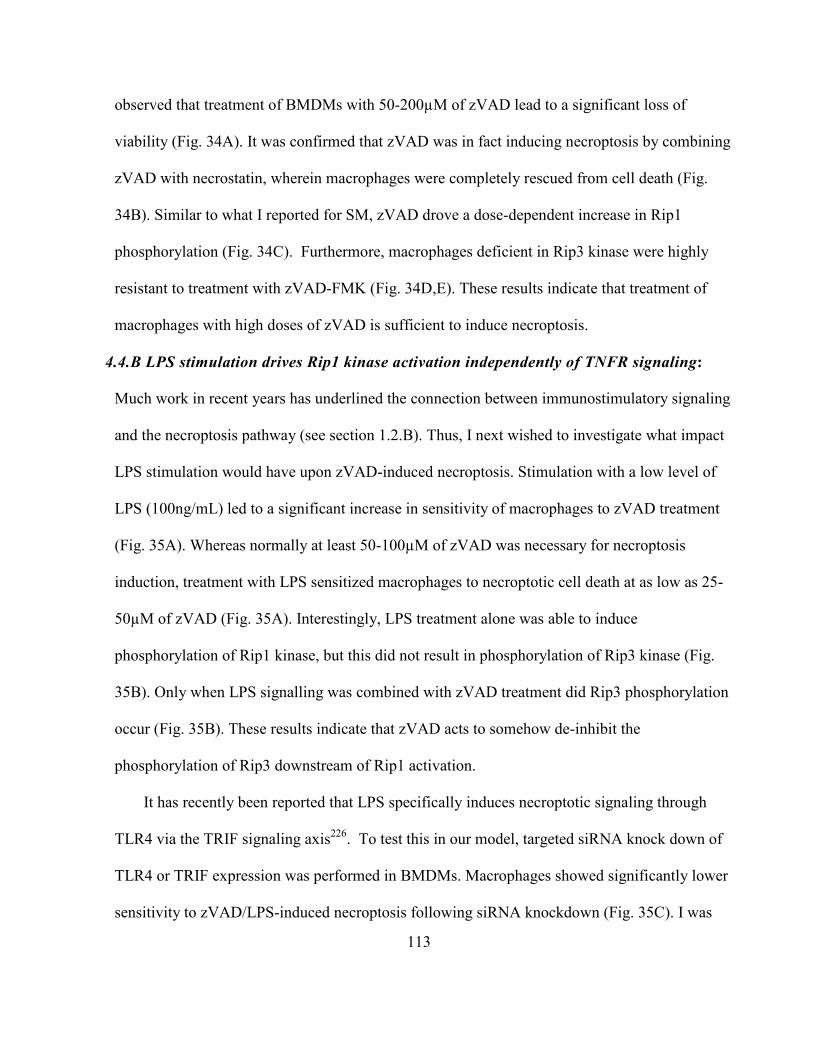
observed that treatment of BMDMs with 50-200µM of zVAD lead to a significant loss of
viability (Fig. 34A). It was confirmed that zVAD was in fact inducing necroptosis by combining
zVAD with necrostatin, wherein macrophages were completely rescued from cell death (Fig.
34B). Similar to what I reported for SM, zVAD drove a dose-dependent increase in Rip1
phosphorylation (Fig. 34C). Furthermore, macrophages deficient in Rip3 kinase were highly
resistant to treatment with zVAD-FMK (Fig. 34D,E). These results indicate that treatment of
macrophages with high doses of zVAD is sufficient to induce necroptosis.
4.4.B LPS stimulation drives Rip1 kinase activation independently of TNFR signaling:
Much work in recent years has underlined the connection between immunostimulatory signaling
and the necroptosis pathway (see section 1.2.B). Thus, I next wished to investigate what impact
LPS stimulation would have upon zVAD-induced necroptosis. Stimulation with a low level of
LPS (100ng/mL) led to a significant increase in sensitivity of macrophages to zVAD treatment
(Fig. 35A). Whereas normally at least 50-100µM of zVAD was necessary for necroptosis
induction, treatment with LPS sensitized macrophages to necroptotic cell death at as low as 25-
50µM of zVAD (Fig. 35A). Interestingly, LPS treatment alone was able to induce
phosphorylation of Rip1 kinase, but this did not result in phosphorylation of Rip3 kinase (Fig.
35B). Only when LPS signalling was combined with zVAD treatment did Rip3 phosphorylation
occur (Fig. 35B). These results indicate that zVAD acts to somehow de-inhibit the
phosphorylation of Rip3 downstream of Rip1 activation.
It has recently been reported that LPS specifically induces necroptotic signaling through
TLR4 via the TRIF signaling axis226. To test this in our model, targeted siRNA knock down of
TLR4 or TRIF expression was performed in BMDMs. Macrophages showed significantly lower
sensitivity to zVAD/LPS-induced necroptosis following siRNA knockdown (Fig. 35C). I was
113

Figure 34: zVAD alone can induce macrophage necroptosis. (A) BMDM cells were treated with various concentrations of zVAD (as shown) for 24 hours and viability was assessed using the MTT assay. (B) Macrophages were treated with 100 µM of zVAD with or without the addition of necrostatin for 24 hours and stained with Hoechst, dead cells were identified using propidium iodide staining. The % of dead cells was obtained using automated counting of Propidium Iodide+ cells versus Hoechst+ cells (top bar graph). An MTT assay was also performed in parallel to confirm inverse correlation of cell death and viability results. (bottom bar graph) (C) Macrophages were treated with various concentrations of zVAD for 1 hour and examined via western blot for Rip1 protein expression. (D) Bone marrow macrophages were derived from WT and Rip3-/- mice. Cells were treated with 100µM zVAD for 24 hours and cell death was assessed via MTT assay. (E) WT and Rip3 BMDMs were examined for viability as described for (B). All experiments were performed a minimum of 3 times in duplicate. ***P<0.0001 **P<0.005
200100502000
50
100
***
zVAD (µM)
% V
iabi
lity
(rel
ativ
e to
con
trol
)Cell Death
Control
+zVAD
+zVAD +Nec
0
20
40
60
80
100
%D
ead
Cel
ls (P
I+/T
otal
) **
Cell Viability
Control
+zVAD
+zVAD +Nec
0.00
0.05
0.10
0.15
0.20
0.25***
MTT
(OD
)
Co
n+z
VA
D+z
VA
D+N
ec
Cell Viability
WT RIP3-/-0.0
0.1
0.2
0.3
0.4
0.5
+zVADControl
***
MTT
(O
D)
zVAD µM 0 25 50 100
Rip1
Actin
pRip175
50
37kDa
A B
C
D E WT Rip3‐/‐
Co
n+z
VA
D
WT Rip3-/-0
10
20
30
40
50Control+zVAD
Cell Death
%D
ead
Cel
ls (P
I+/T
otal
)
114
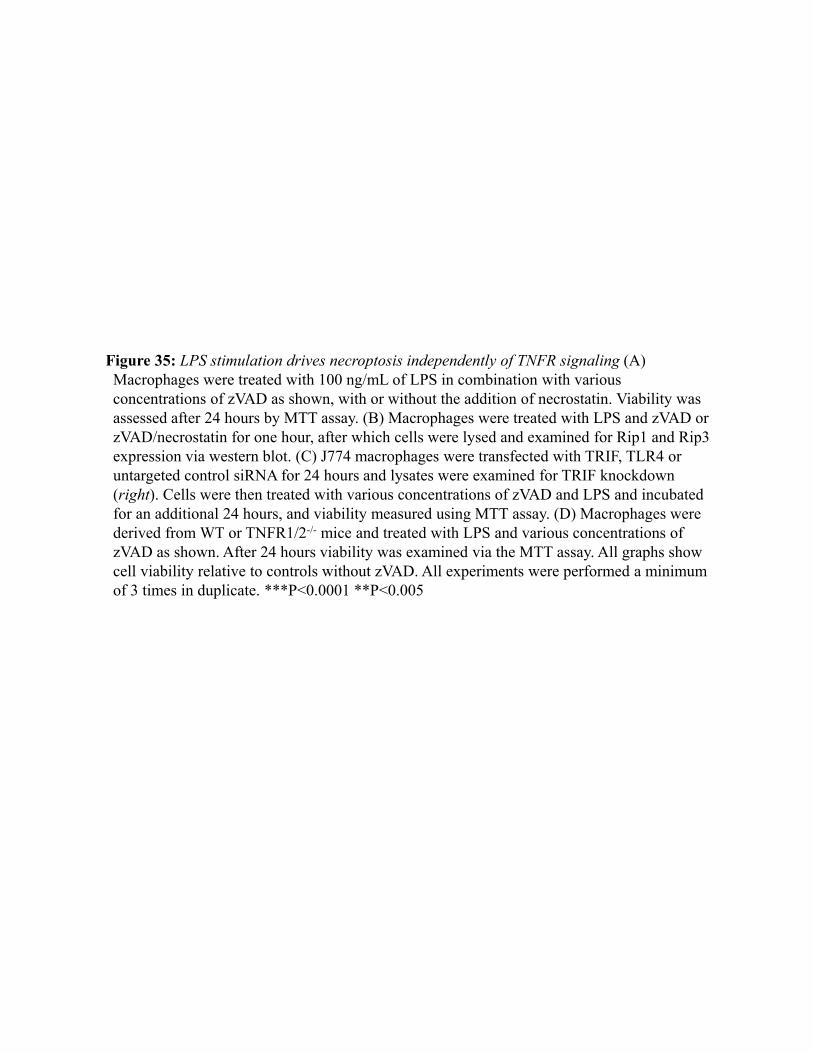
Figure 35: LPS stimulation drives necroptosis independently of TNFR signaling (A) Macrophages were treated with 100 ng/mL of LPS in combination with various concentrations of zVAD as shown, with or without the addition of necrostatin. Viability was assessed after 24 hours by MTT assay. (B) Macrophages were treated with LPS and zVAD or zVAD/necrostatin for one hour, after which cells were lysed and examined for Rip1 and Rip3 expression via western blot. (C) J774 macrophages were transfected with TRIF, TLR4 or untargeted control siRNA for 24 hours and lysates were examined for TRIF knockdown (right). Cells were then treated with various concentrations of zVAD and LPS and incubated for an additional 24 hours, and viability measured using MTT assay. (D) Macrophages were derived from WT or TNFR1/2-/- mice and treated with LPS and various concentrations of zVAD as shown. After 24 hours viability was examined via the MTT assay. All graphs show cell viability relative to controls without zVAD. All experiments were performed a minimum of 3 times in duplicate. ***P<0.0001 **P<0.005
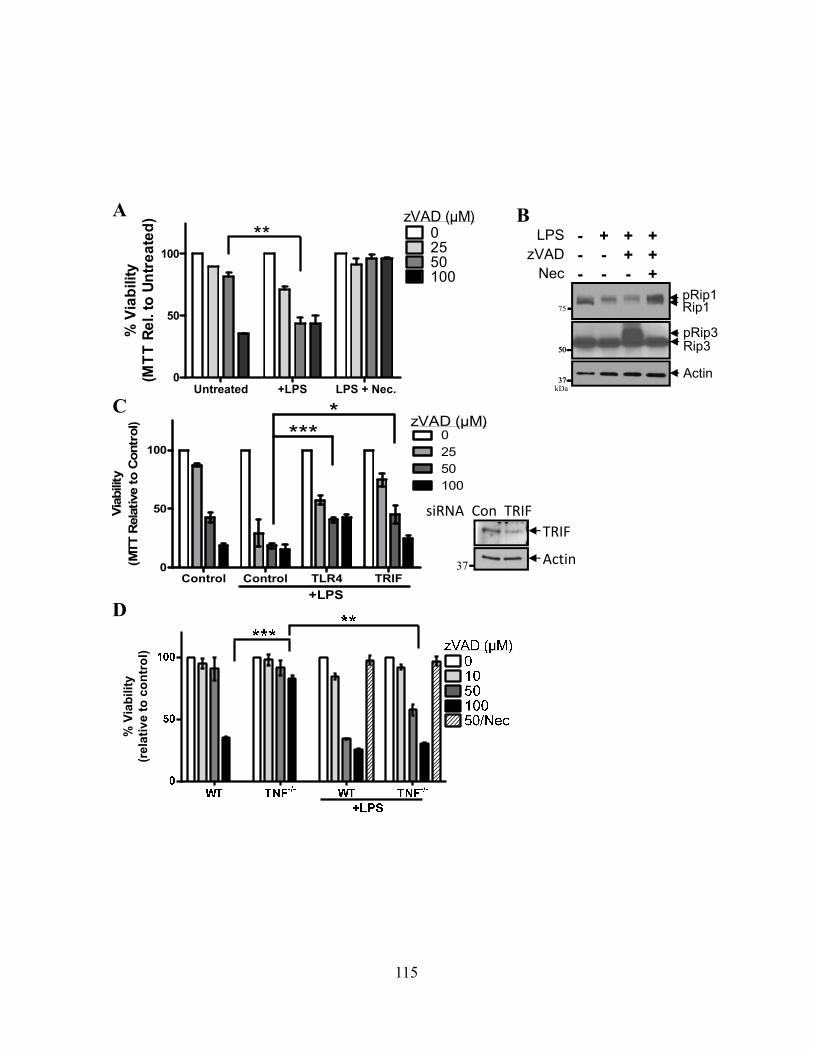
Untreated +LPS LPS + Nec.0
50
100** 0
2550100
% V
iabi
lity
(MTT
Rel
. to
Untr
eate
d)
zVAD (µM)
% V
iabi
lity
(rel
ativ
e to
con
trol
)
TRIF
Actin
siRNA Con TRIF
37Control Control TLR4 TRIF
0
50
100 2550100
+LPS
0**** zVAD (µM)
Viab
ility
(MTT
Rel
ativ
e to
Con
trol
)
LPS - + + +zVAD - - + +
Nec - - - +
Rip1pRip1
Actin
Rip3pRip3
50
37
50
37
75
kDa
A B
C
D
115
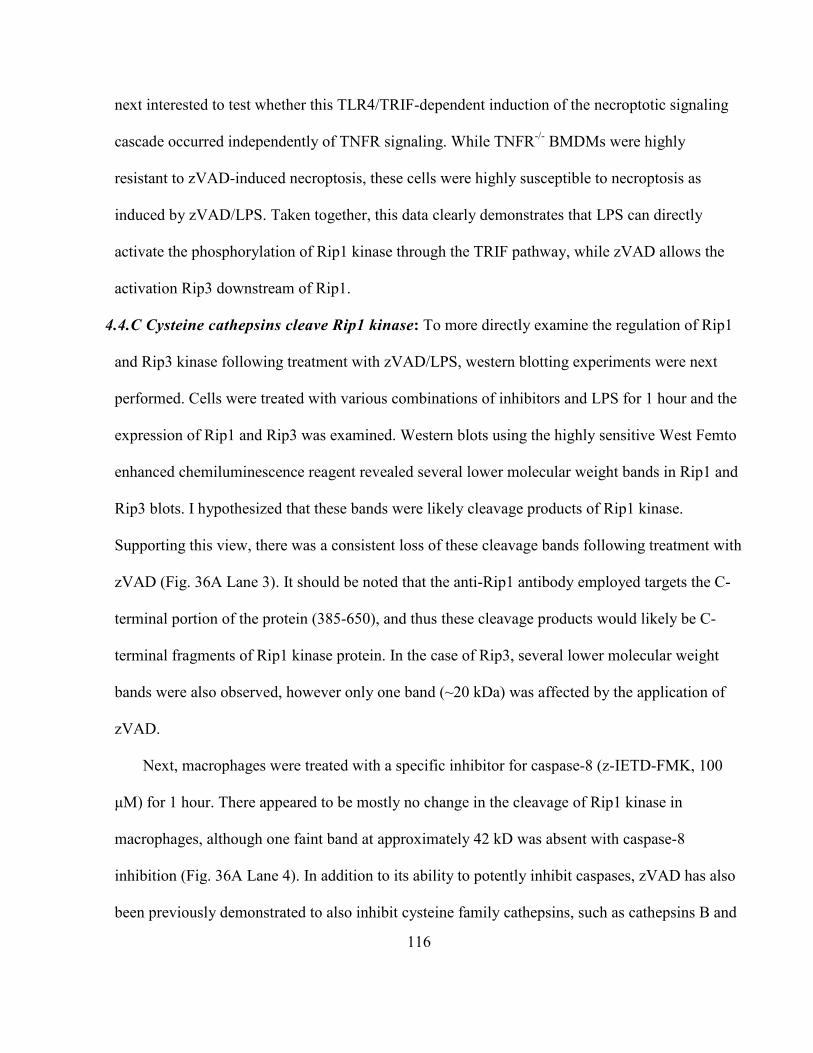
next interested to test whether this TLR4/TRIF-dependent induction of the necroptotic signaling
cascade occurred independently of TNFR signaling. While TNFR-/- BMDMs were highly
resistant to zVAD-induced necroptosis, these cells were highly susceptible to necroptosis as
induced by zVAD/LPS. Taken together, this data clearly demonstrates that LPS can directly
activate the phosphorylation of Rip1 kinase through the TRIF pathway, while zVAD allows the
activation Rip3 downstream of Rip1.
4.4.C Cysteine cathepsins cleave Rip1 kinase: To more directly examine the regulation of Rip1
and Rip3 kinase following treatment with zVAD/LPS, western blotting experiments were next
performed. Cells were treated with various combinations of inhibitors and LPS for 1 hour and the
expression of Rip1 and Rip3 was examined. Western blots using the highly sensitive West Femto
enhanced chemiluminescence reagent revealed several lower molecular weight bands in Rip1 and
Rip3 blots. I hypothesized that these bands were likely cleavage products of Rip1 kinase.
Supporting this view, there was a consistent loss of these cleavage bands following treatment with
zVAD (Fig. 36A Lane 3). It should be noted that the anti-Rip1 antibody employed targets the C-
terminal portion of the protein (385-650), and thus these cleavage products would likely be C-
terminal fragments of Rip1 kinase protein. In the case of Rip3, several lower molecular weight
bands were also observed, however only one band (~20 kDa) was affected by the application of
zVAD.
Next, macrophages were treated with a specific inhibitor for caspase-8 (z-IETD-FMK, 100
μM) for 1 hour. There appeared to be mostly no change in the cleavage of Rip1 kinase in
macrophages, although one faint band at approximately 42 kD was absent with caspase-8
inhibition (Fig. 36A Lane 4). In addition to its ability to potently inhibit caspases, zVAD has also
been previously demonstrated to also inhibit cysteine family cathepsins, such as cathepsins B and
116

Figure 36: A non-caspase-8 cysteine protease cleaves Rip1 Kinase. BMDM cells were treated with various combinations of LPS, zVAD, caspase-8 inhibitor (C8I), and/or cathepsin inhibitor (E64D) as shown. After 1 hour of treatment, cells were lysed and examined for expression of Rip1 and Rip3 via western blot. Short (1 min.) and long (15 min.) exposures were utilized in order to identify Rip1 expression by western blots. Actin expression was used as a loading control. Results are representative of at least 3 repeated experiments.
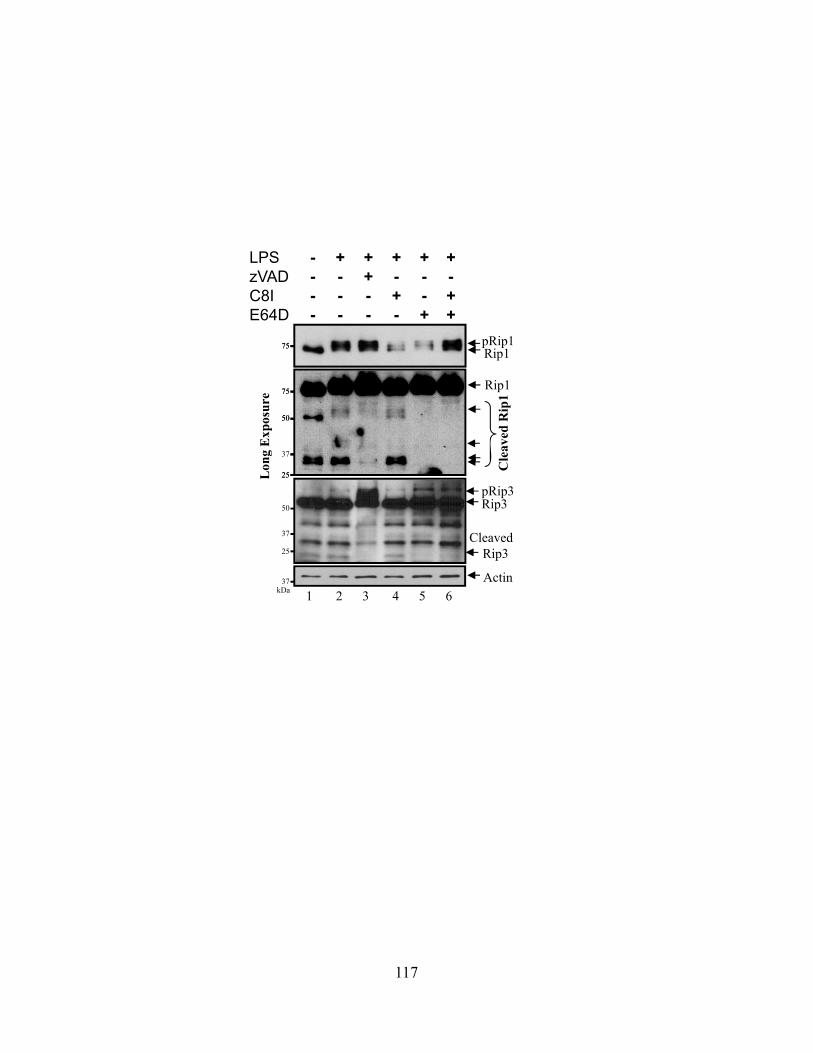
LPS - + + + + +zVAD - - + - - -C8I - - - + - +E64D - - - - + +
75
50
25
75 pRip1Rip1
75
50
37
25
75
Rip1
Actin
Rip3pRip3
1 2 3 4 5 6
Lon
g E
xpos
ure
50
37
25
37kDa
Cleaved Rip3
Cle
aved
Rip
1
117
S, at the concentration ranges which were necessary to induce necroptosis (~50-100 μM)288.
Based on this, I hypothesized that cathepsins may also cleave Rip1 and Rip3. Application of a
cell-permeable cysteine cathepsin/calpain inhibitor, E64-D, completely abrogated the cleavage
bands of Rip1 kinase, similar to zVAD treatment (Fig. 36A Lane 5). Also similar to zVAD,
possible cleavage of Rip3 kinase was only effected for the ~20kDa band. Finally, a caspase-8
inhibitor was combined with the cathepsin inhibitor, where I observed elevated Rip1
phosphorylation and expression along with a decrease in cleavage bands (Fig. 36A Lane 6). Thus,
these data imply that the inhibition of cathepsins by zVAD may be a considerable factor in the
induction of necroptosis.
4.4.D Cathepsin S and B both cleave Rip1 kinase: To further confirm cathepsin mediated
cleavage of Rip1, an siRNA knockdown targeting two key members of the cysteine cathepsin
family was next performed289. Knockdown of either cathepsin S or cathepsin B resulted in less
cleavage of Rip1 kinase (Fig. 37A), as well as a small but significant increase in the sensitivity of
macrophages to zVAD-induced cell death (Fig. 37B). Importantly, siRNA knockdown of an
alternative cysteine protease, calpain-1, actually resulted in less necroptosis of macrophages (Fig.
37C). Based on this, it was hypothesized that cysteine cathepsins may have a redundant role in
regulating Rip1 activity. Consistent with this, there was no significant differences in the induction
of necroptosis in macrophages specifically deficient in either cathepsin S or cathepsin B (Fig.
38A,B). We also attempted combined siRNA knockdown of multiple cathepsin family members.
Unfortunately, I was unable to achieve efficient simultaneous knockdown of both cathepsins,
potentially due to deleterious effects on cell viability. Thus, these data suggest that cysteine
family cathepsins may act redundantly to cleave Rip1 kinase and limit necroptosis within
macrophages.
118

Figure 37: Cathepsin S and B can cleave Rip1 kinase. (A) BMDM cells were transfected using the Lonza system (as described in the methods section) with untargeted, cathepsin S, or cathepsin B targeting siRNA via electroporation for 24 hours. Cells were then treated with LPS for 2 hours and examined via western blot for Rip1, cathepsin S (CatS), and cathepsin B (CatB) expression. Actin was used as a loading control. (B) Macrophages transfected for 24 hours with untargeted control, cathepsin S, or cathepsin B targeted siRNA were treated with LPS and varying concentration of zVAD as shown. After an additional 24 hours, cells were tested for viability using MTT assay. Similar experiments were repeated at least 3 times. (C) To confirm the role of cathepsins specifically, BMDM cells were also transfected with control or calpain siRNA and examined for sensitivity to zVAD/LPS induced necroptosis as described in (B) **P<0.01 All graphs show the average cell viability relative to untreated control from at least 3 experiments performed in duplicate.
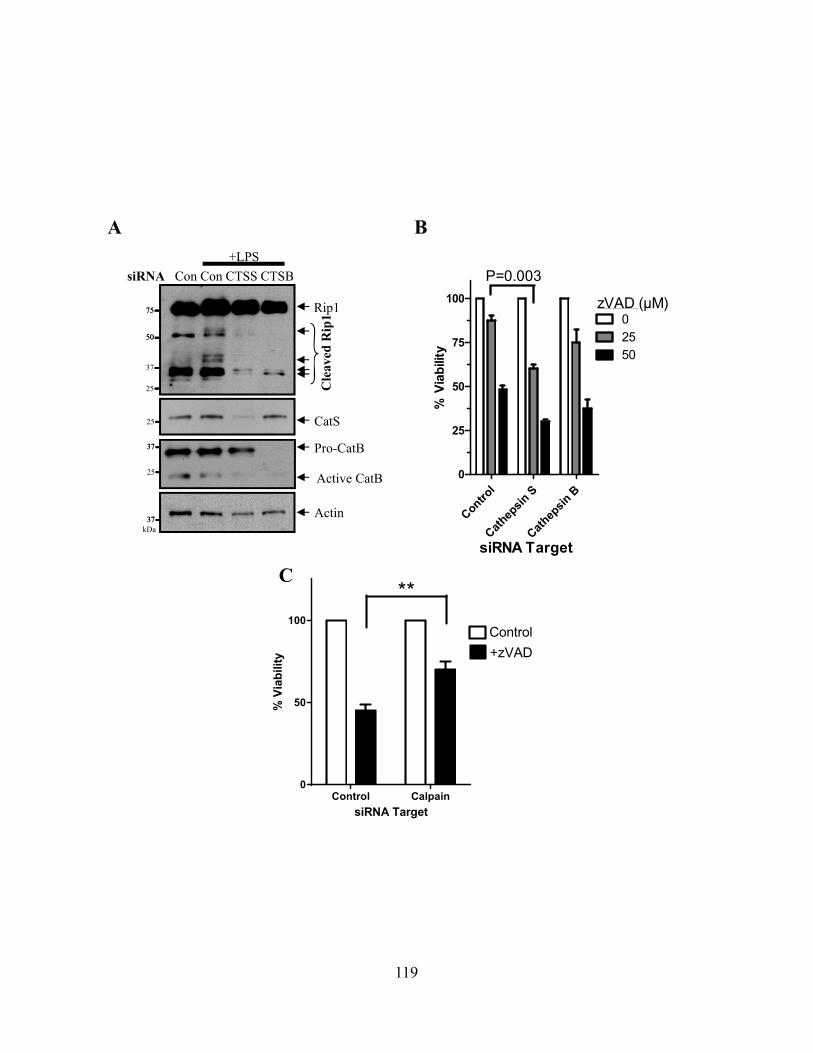
Control
Cathep
sin S
Cathep
sin B
0
25
50
75
100
02550
P=0.003
siRNA Target
zVAD (µM)
% V
iabi
lity
siRNA Con Con CTSS CTSB
CatS
Rip1
+LPS
Pro-CatB
Actin
Active CatB
75
50
75
50
37
25
25
3737
25
3737kDa
Cle
aved
Rip
1
A B
Control Calpain0
50
100Control+zVAD
siRNA Target
% V
iabi
lity
**C
119

Figure 38: Single knockouts for cathepsin S or cathepsin B show no change in susceptibility to necroptosis. BMDM cells were generated from WT, CTSS- (A) and CTSB-(B) deficient mice as described in the methods section. Cells were then plated at 50 000 cells/well in 96-well plates and treated for 24 hours with LPS (100ng/mL) and various concentrations of zVAD and necrostatin as shown. Graphs show the average viability relative to untreated control from 3 repeated experiments performed in duplicate.
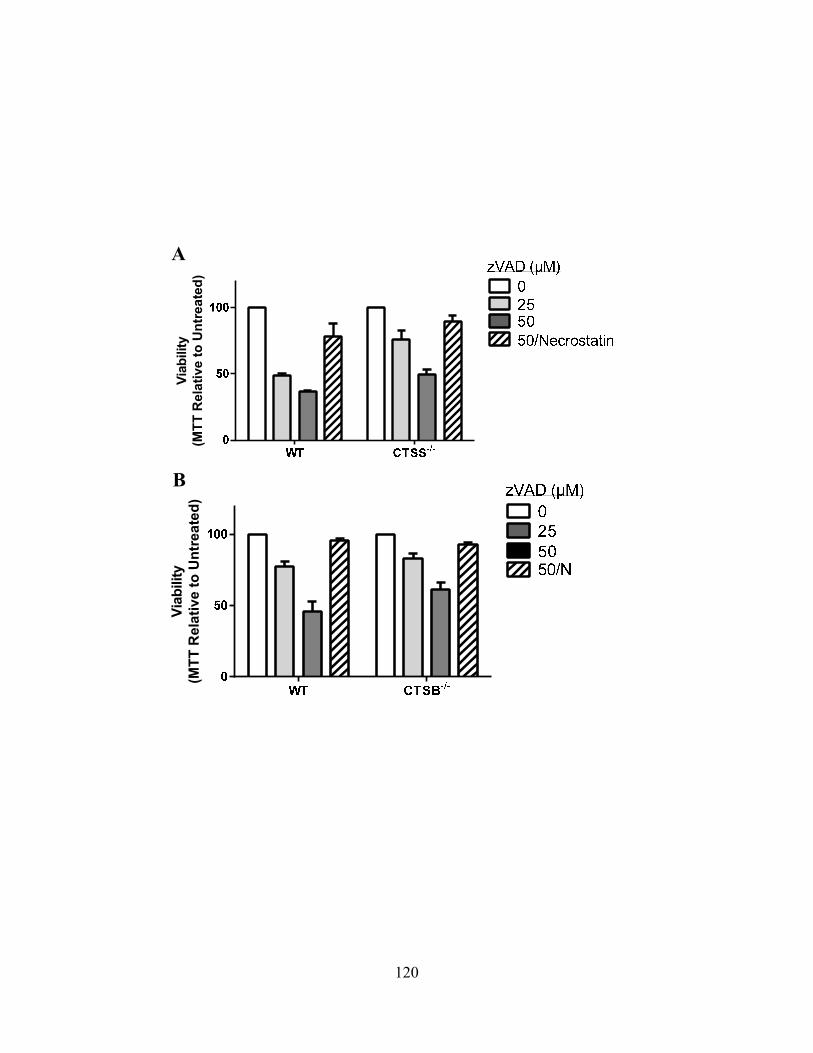
Viab
ility
(MTT
Rel
ativ
e to
Unt
reat
ed)
Viab
ility
(MTT
Rel
ativ
e to
Unt
reat
ed)
A
B
120
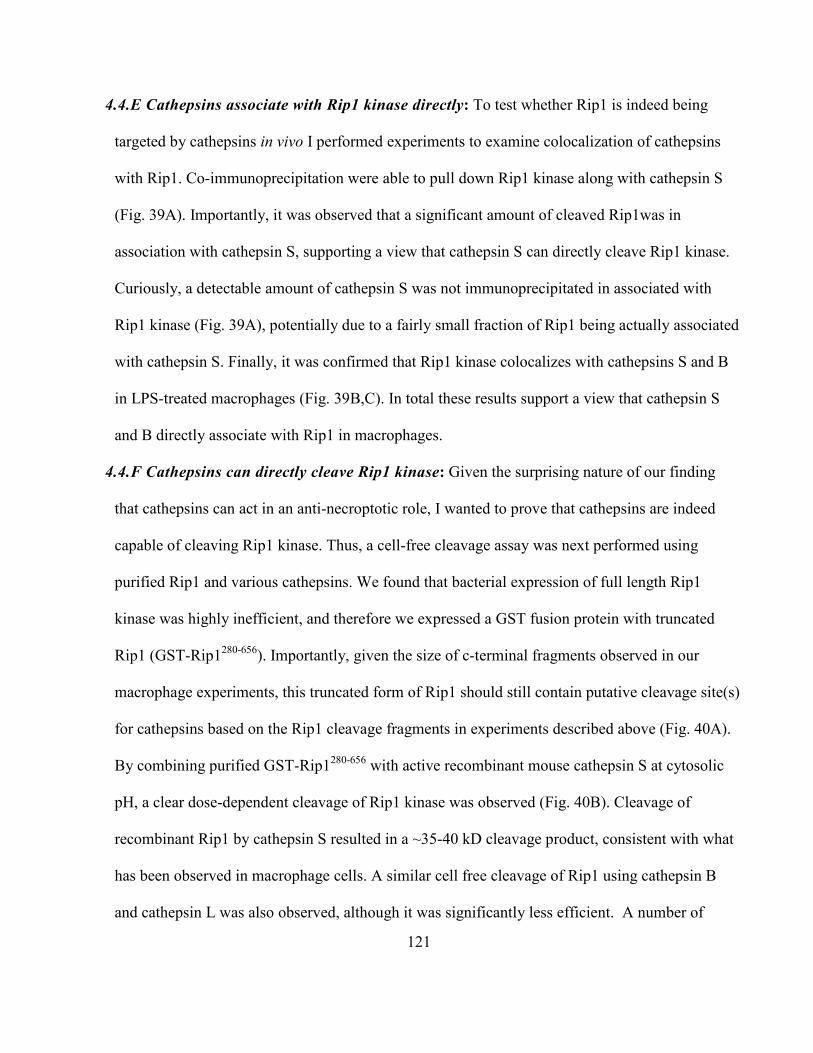
4.4.E Cathepsins associate with Rip1 kinase directly: To test whether Rip1 is indeed being
targeted by cathepsins in vivo I performed experiments to examine colocalization of cathepsins
with Rip1. Co-immunoprecipitation were able to pull down Rip1 kinase along with cathepsin S
(Fig. 39A). Importantly, it was observed that a significant amount of cleaved Rip1was in
association with cathepsin S, supporting a view that cathepsin S can directly cleave Rip1 kinase.
Curiously, a detectable amount of cathepsin S was not immunoprecipitated in associated with
Rip1 kinase (Fig. 39A), potentially due to a fairly small fraction of Rip1 being actually associated
with cathepsin S. Finally, it was confirmed that Rip1 kinase colocalizes with cathepsins S and B
in LPS-treated macrophages (Fig. 39B,C). In total these results support a view that cathepsin S
and B directly associate with Rip1 in macrophages.
4.4.F Cathepsins can directly cleave Rip1 kinase: Given the surprising nature of our finding
that cathepsins can act in an anti-necroptotic role, I wanted to prove that cathepsins are indeed
capable of cleaving Rip1 kinase. Thus, a cell-free cleavage assay was next performed using
purified Rip1 and various cathepsins. We found that bacterial expression of full length Rip1
kinase was highly inefficient, and therefore we expressed a GST fusion protein with truncated
Rip1 (GST-Rip1280-656). Importantly, given the size of c-terminal fragments observed in our
macrophage experiments, this truncated form of Rip1 should still contain putative cleavage site(s)
for cathepsins based on the Rip1 cleavage fragments in experiments described above (Fig. 40A).
By combining purified GST-Rip1280-656 with active recombinant mouse cathepsin S at cytosolic
pH, a clear dose-dependent cleavage of Rip1 kinase was observed (Fig. 40B). Cleavage of
recombinant Rip1 by cathepsin S resulted in a ~35-40 kD cleavage product, consistent with what
has been observed in macrophage cells. A similar cell free cleavage of Rip1 using cathepsin B
and cathepsin L was also observed, although it was significantly less efficient. A number of
121

Figure 39: Cathepsins associate with Rip1 kinase directly. (A) BMDM cells were plated at 2.5×10⁵ cells/well in 24-well plates. Cells were then treated for 1h with LPS and/or zVAD as shown. Cells were then lysed and immunoprecipitations were performed as described in the methods section. Lysates and immunoprecipitates were then examined by western blot for Rip1 and CTSS. (B-C) BMDM cells were treated with LPS for 1h and stained with CTSS or CTSB, and Rip1 specific antibodies as described in the methods section. Cells were then examined using confocal microscopy.
LPS - + + + + + +zVAD - - + - + - +
LC
HC
Cleaved Rip1
Rip1
LCCTSS
IP:Rip1 IP:CTSSLysates
75
50
37
25
50
37
25
kDa
Rip1 Merge20µM CTSS
Rip1CTSB Merge20µM
A
B
C
122
Figure 40: Cathepsins can directly cleave Rip1 kinase in a cell free environment. (A) Diagram showing the domains of Rip1 kinase as identified in the conserved domain database. The approximate sites for cathepsin B cleavage were identified using online SitePrediction tool (Tool can be found at: http://www.dmbr.ugent.be/prx/bioit2-public/SitePrediction/). Diagram showing the recombinant GST fusion of Rip1 we employed in our cell free cleavage assays. (B) Recombinant GST-Rip1280-656 was exposed under cell free conditions to CTSS, CTSB, and CTSL as described in the methods section. After treatment, the cleavage of recombinant Rip1 was examined by western blot as shown. Results are representative of at least 3 repeated experiments.
Experiments shown in this figure were performed in collaboration with B. Shutinoski

GST-Rip1280-656
Cleaved Rip1
Cathepsin S
806050403025
RecombinantCTSS
40
kDa
Con
GST-Rip1280-656
Cleaved Rip1
Cathepsin B
806050403025
kDa
ConCathepsin L
806050403025
kDa
GST-Rip1280-656
Cleaved Rip1
B C D
Caspase‐8 Cleavage Site
1
Kinase Domain RHIM DD
23 287 493 539 568 652 656
287‐292330‐335
Predicted Cathepsin BCleavage Sites
Rip1 Kinase
325
RHIM DD
280 493 539 568 652 656GST‐Rip1280‐656
GST
A
123

bands were visible which were generally consistent with those observed in LPS treated
macrophages (Fig. 40C,D). Importantly, at the neutral pH utilized for cleavage experiments,
cathepsin B has been reported to cleave targets much more selectively than at acidic pH290. These
data provide clear evidence that cysteine cathepsins can directly cleave Rip1 kinase.
4.4.G Cathepsins and caspase-8 cooperate to limit necroptosis: Finally, I wanted to directly
assess the role cathepsin mediated cleavage of Rip1 might play in regulating necroptosis of
macrophages. This was accomplished by applying various cathepsin inhibitors in combination
with zVAD/LPS. The addition of cathepsin inhibitors E64D, Ca-074-Me or calpeptin resulted in a
small but significant increase in sensitivity of macrophages to zVAD/LPS (Fig. 41A). The
relatively minor effect of cathepsin inhibitors is likely due to overlapping effects of cathepsins
and zVAD/LPS in terms of protease inhibition. Cathepsin inhibition alone did not result in any
significant loss of viability of macrophages (Fig. 41A-D). These results indicate that, within
macrophages, the induction of necroptosis by zVAD treatment occurs via its inhibition of
cathepsins as well as caspase 8.
Previous work has clearly demonstrated that Rip1 is cleaved directly by caspase-8 106. Thus,
to confirm the role of both caspase-8 and cathepsins in the regulation of necroptosis, macrophages
were treated with LPS and a caspase-8 specific inhibitor, z-IETD-FMK (C8I). While treatment
with C8I and/or LPS alone did not induce significant cell death, when it was combined with
cathepsin inhibitors treatment resulted in increased macrophage necroptosis (Fig. 41B-D). Similar
results were obtained with a number of different cathepsin inhibitors in combination with C8I
(Fig. 41B-D). Consistent with necroptosis, this death was abrogated by the addition of necrostatin
(Fig. 41B-D). Finally, other caspase inhibitors were utilized to confirm the specific role of
caspase-8. Combined inhibition of cathepsins and caspase-9 or -3 inhibitors resulted in no
124
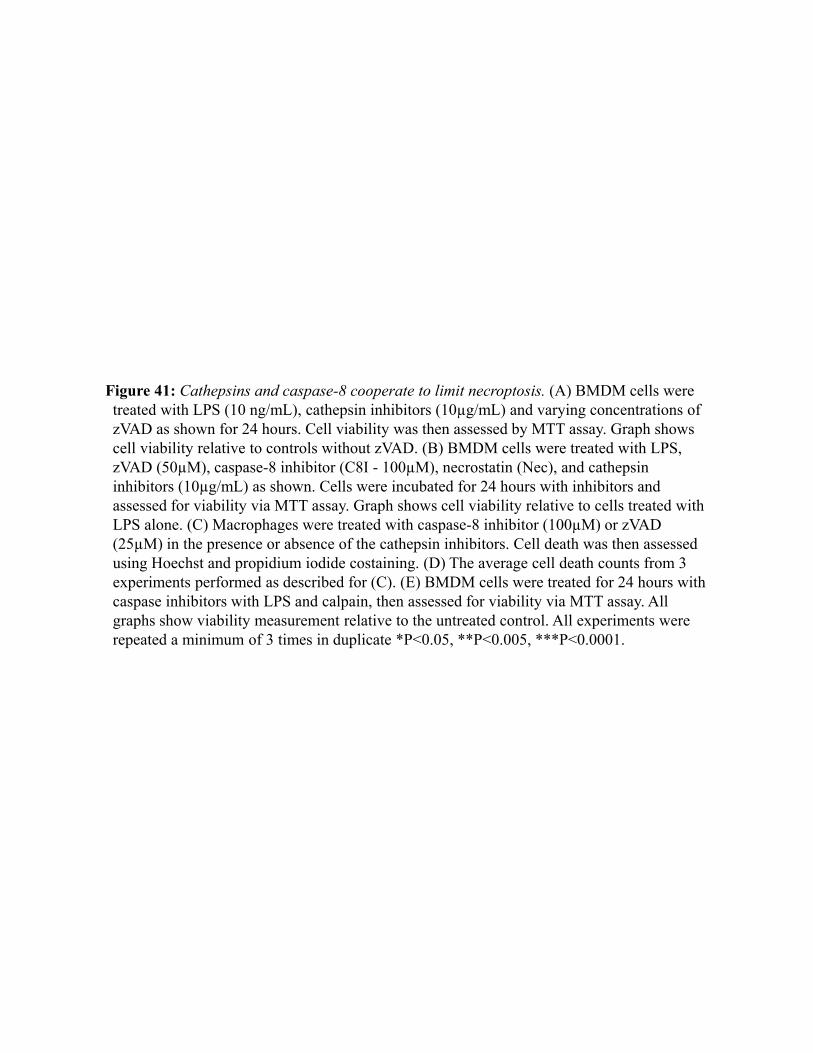
Figure 41: Cathepsins and caspase-8 cooperate to limit necroptosis. (A) BMDM cells were treated with LPS (10 ng/mL), cathepsin inhibitors (10µg/mL) and varying concentrations of zVAD as shown for 24 hours. Cell viability was then assessed by MTT assay. Graph shows cell viability relative to controls without zVAD. (B) BMDM cells were treated with LPS, zVAD (50µM), caspase-8 inhibitor (C8I - 100µM), necrostatin (Nec), and cathepsin inhibitors (10µg/mL) as shown. Cells were incubated for 24 hours with inhibitors and assessed for viability via MTT assay. Graph shows cell viability relative to cells treated with LPS alone. (C) Macrophages were treated with caspase-8 inhibitor (100µM) or zVAD (25µM) in the presence or absence of the cathepsin inhibitors. Cell death was then assessed using Hoechst and propidium iodide costaining. (D) The average cell death counts from 3 experiments performed as described for (C). (E) BMDM cells were treated for 24 hours with caspase inhibitors with LPS and calpain, then assessed for viability via MTT assay. All graphs show viability measurement relative to the untreated control. All experiments were repeated a minimum of 3 times in duplicate *P<0.05, **P<0.005, ***P<0.0001.

Control
+zVAD
+C8I
+C8I + E64
D
+ E64
D Cal
+C8I
+ Cal
+C8I + Cal
+ Nec0
50
100 ****
Rel
ativ
e Vi
abili
ty (t
o un
trea
ted)
E64D
Caspase-8 Inhibitor II (µM)
Ca-074-Me
Con
0 25 100 25
zVAD (µM)
Calpeptin
Con E64D Ca-074-Me Calpeptin0
50
100Untreated25 µM C8I100 µM C8I25 µM zVAD
Inhibitors
% D
ead
Cel
ls (P
I+)
**
**
B
C
D
A
E
125

significant increase in necroptosis (Fig. 41E). Together, these results point to the novel conclusion
that cathepsins and caspase-8 cooperate to regulate necroptosis in macrophages.
126
5.0 DISCUSSION
5.1 THE ROLE OF CASPASE-3 IN CD8+ T CELLS
CD8+ T cell responses are vital for effective clearance of intracellular pathogens, as well as long-
term protection against re-infection9. Depletion of the CD8+ T cell population in mice greatly
enhances their susceptibility to infection with viruses such as LCMV291 and HIV292, as well as
intracellular bacteria such as Mycobacterium tuberculosis293, Salmonella typhimurium294 (ST) and
Listeria monocytogenes295 (LM). It is thought that breakdown of normal CD8+ T cell surveillance in
the central nervous system is responsible for the re-emergence of latent viruses in
leukoencephalopathy296,297. Despite the clear importance of CD8+ T cells in immune response to
many infections, the mechanisms that govern the highly dynamic processes of T cell proliferation,
contraction and memory formation remain unclear. By better understanding the intricate interaction
of the biochemical signaling pathways that control life and death of T cells during their
differentiation, we may be better able to improve responses to vaccines, or to prevent or reverse
undesirable T cell responses in cases of autoimmunity.
Previous work has revealed an unexpected and paradoxical link between the activation of the
canonical regulators of apoptosis, the caspases, and cell proliferation100. In T cells specifically, work
has connected caspase activation to both proliferation107 and contraction6,7 of primed CD8+ T cells.
While a link between T cell activation and apoptotic mechanisms has been repeatedly reported,
previous studies have not specifically addressed what stimulatory mechanisms drive caspase
activation. Furthermore, to our knowledge no study has yet confirmed that activation of caspases
occurs in activated CD8+ T cells during an in vivo response to bacterial infection. Thus, in this study
I have used two divergent infection models, which differ in intensity and timing of antigen-
127
presentation, to evaluate the induction of caspase-3 activation in antigen-specific CD8+ T cells
during their proliferation, differentiation and contraction.
Caspase-3 cleavage is often referred to as the key downstream apoptotic event preceding cell
death, and can be activated by a variety of pathways including death receptor driven caspase-8
cleavage, or mitochondrial driven caspase-9 cleavage (see section 1.2 of introduction). Our data
clearly demonstrates that caspase-3 can also be activated downstream of antigen specific stimulation,
while excluding a role for inflammation in regulating this process (Fig. 7, 14). This adds to previous
work showing that caspase-3 mRNA is increased following TCR stimulation108. The question
remains as to how caspase-3 is activated downstream of the TCR? Work in other cell types has
shown that in some cases calcium flux can activate calpains which in turn can cleave and activate
caspase-3298,299. It seems possible that activation of caspase-3 could be mediated by the high levels
of calcium flux within activated T cells300.
Probably the most interesting questions in regards to caspase-3 in T cell activation pertain to
what function caspase-3 might have in a proliferating cell. Using targeted inhibitors of caspases, it
has been shown that caspase activity is actually necessary for efficient T cell proliferation in
response to anti-CD3 stimulation4,107. This suggests that caspase activation actually promotes T cell
proliferation. In contrast to this, it has also been shown that caspase activation can function to cleave
important TCR signaling mediators such as Vav and Grb2, and thus can drive T cell anergy in some
cases301,302. In the data presented here, treatment of antigen stimulated CD8+ T cells with a selective
caspase-3 inhibitor led to less proliferation of CD8+ T cells (Fig. 17). Furthermore, I show that cells
expressing active caspase-3 consistently also show elevated levels of the cell cycling marker, Ki67
(Fig. 7). Taken together, these data indicate that caspase-3 plays a role in promoting T cell
proliferation, but the molecular mechanism of this activity remains elusive.
128
While several careful studies of caspase activation in CD8+ T cells have been performed in vitro,
most have employed anti-CD3 stimulation with relatively few examining bona fide antigen
presentation, and fewer still looking at caspases in T cell proliferation in vivo. In only one study was
it previously observed that antigen specific CD8+ T cells upregulate caspase-3 during proliferation in
response to LCMV303. In this case, the authors suggest that this activation of caspase-3 might
somehow prepare cells for a delayed form of apoptosis, which could occur during contraction. Given
the fact that caspase-3 is known to be a terminal step in the process of apoptosis171, this type of
delayed cell death seems highly unlikely. In my observations, I saw that caspase-3 was most active
during the proliferative activation of CD8+ T cells in response to similar antigen in the context of
two divergent infection models, and remained low during contraction phases of the response (Fig.
11). I also observed little evidence that these caspase-3hi CD8+ T cells are undergoing cell death in
vitro or in vivo (Fig. 9, 11). These data support a model wherein caspase-3 likely plays a non-
apoptotic role in the proliferative phases of CD8+ T cell activation.
Several reports have previously indicated that caspase-3 induction does not drive the death of
activated CD8+ T cells in vitro4,107, yet the possibility that a vigorous outgrowth of small population
of caspase-3low cells was masking a significant level of cell death remained a possibility. Thus, I
diluted activated CD8+ T cells to very low cell numbers ex vivo, greatly reducing the possibility of a
minority contaminating population being responsible for significant outgrowth. In this case, there
were few signs of cell death (cell debris, or TMRE-ve cells) in the active caspase-3hi activated CD8+
T cells (Fig. 9). I also confirmed these findings in vivo, where despite the relatively high level of
active caspase-3, I was unable to detect a significant population of TUNEL+CD8+ T cells (Fig. 12).
Even purified caspase-3hi CD8+ T cells ex vivo did not exhibit significantly elevated number of dead
cells (TMRE-ve) when compared to those cells with the lowest level of caspase-3 (Fig. 14). I
129

conclude that caspase-3 activation does not result in a significant amount of cell death concurrent
with CD8+ T cell proliferation.
Although early inflammation is an important determinant of CD8+ T cell contraction89,304, no
programmed death mechanisms have yet come to light to explain the mechanism of contraction of
the antigen specific population. Apoptosis might seem to be a likely candidate for the removal of
activated cells following resolution of an infection, but in previous work the in vivo application of
caspase inhibitors during T cell contraction had little effect on the dramatic drop in T cell numbers
following the peak of the CD8+ response109. Consistent with this, I also observed that active caspase-
3 actually remained at basal levels throughout the contraction phases of the OVA-specific response
to two divergent intracellular bacterial pathogens (Fig. 10). These data indicate that caspase-
dependent apoptosis may not play an important role in T cell contraction. It should be noted that
recent work in Bim, Bid, and/or Fas deficient mice indicates that redundant pro-death mediators
cooperate to remove activated T cells during contraction7,305,306. It is an interesting possibility that
these upstream activators of apoptosis might drive caspase-independent death mechanisms in
contracting T cells, but more work will be necessary to address this possibility.
Following the realization that caspases do not seem to play a significant role in T cell death, it
has been suggested that the alternative programmed death pathway of necroptosis might function to
remove activated cells. Supporting this view, it has been shown that specific deficiency in caspase-8
in T cells or its adapter, FADD, leads to dysfunctional T cell responses97, which was later shown to
be due to overactive necroptosis307,308. Pharmacological or genetic ablation of the necroptosis
pathway by targeting either Rip1 or Rip3 rescued the ability of these T cells to proliferate in
response to stimulation104,105,140. These observations indicate that expression of caspase-8 is required
in order to limit necroptosis in activated T cells.
130
While the findings that caspase-8 is needed to reign in Rip3 dependent death in activated T cells
might point to necroptosis as the means of T cell contraction, it is important to note that deficiency
for Rip3 alone does not seem to have any appreciable effect on the T cell activation or
contraction105,253. I confirmed similar lack of any effect of Rip3-deficiency on the CD8+ T cell
response to LM-OVA (unpublished results from our lab). In addition, T cells with concurrent
deficiency for Rip3 and caspase-8 show a normal contraction of CD8+ T cells following an antigen
specific response105. In contrast to the antigen specific contraction, these mice do suffer a
progressive accumulation of dysfunctional T cells, although these cells seem to be restricted to an
abnormal population of non-functional T cells 106,150. This is highly reminiscent of what is seen in lpr
or gld mutations of the Fas pathway96. Based on these observations, it seems that necroptosis likely
is not an important factor in contraction of an antigen specific T cell response under normal caspase-
8 sufficient conditions.
Though the role of caspase-8 in limiting necroptosis has been well documented309, the potential
activity of caspase-3 in this process has not been thoroughly investigated. Unlike caspase-8 knockout
which is embryonic lethal due to overactive necroptosis106, caspase-3 knockout animals remain
viable with no documented T cell defects. This may be due to significant redundancy between
caspase-3 and caspase-7, as double knockout caspase-3/7 animals die immediately after birth172.
Whether caspases-3 or -7 can inhibit necroptosis through cleavage of Rip1 kinase or other means
remains to be investigated. Supporting this possibility, I saw both less proliferation and somewhat
increased cell death in antigen stimulated T cells with the addition of a caspase-3 inhibitor (Fig. 15).
One intriguing possibility may be that caspase-3 could also function to promote or maintain caspase-
8 activation, as this type of retrograde activation of caspase-8 by caspase-3 has recently been
131

demonstrated310,311. Further work will be needed to investigate the role that effector caspases might
play in the regulation of necroptotic cell death.
Interestingly, I have observed that in addition to elevated levels of active caspase-3, antigenic
stimulation of CD8+ T cells also led to more exposure of phosphatidylserine (Fig. 18), another
cardinal signal of apoptotic cell death. This type of reversible exposure of phosphatidylserine in
activated T cells has been previously reported312. The question remains as to how these cells, which
show many of the hallmarks of apoptosis, manage to escape actual cell death. One possible
explanation might be differential subcellular localization of caspase-3 in activated T cells versus
apoptotic cells. In previous work, it has been shown that active caspase-3 preferentially localizes to
the membrane in activated CD8+ T cells301,313,314, whereas caspase-3 would normally need to
translocate to the nucleus to induce apoptotic death315. Consistent with this, immunofluorescent
staining for active caspase-3 appeared to localize at the cell membrane in activated CD8+ T cells,
whereas it appeared more cytosolic in cells stimulated to undergo apoptosis by staurosporine
exposure (Fig. 8).
In addition to the importance of controlled localization of caspases, I felt that the expression of
inhibitors of apoptosis proteins (cIAP1, cIAP2, xIAP) might also have a significant impact on CD8+
T cell function. Thus, I also attempted treating cells with a small molecule mimetic of SMAC, which
would normally inhibit IAP function in apoptotic cells. SMAC mimetic (SM) treatment had little
impact on CD8+ T cell responses both in vitro and in vivo. Consistent with this, mice with single
gene deficiencies for cIAP1, cIAP2 or xIAP do not appear to have significant defects in T cell
responses189,268,316. Based on this, I conclude that IAP expression likely does not play a significant
role in controlling caspase function within proliferating T cells in mice. Despite this, it should be
noted that there is significant evidence supporting a role for IAPs in regulating T cell responses in
132
humans, with particular note to the X-linked lymphoproliferative disorder associated with xIAP
muations317.
Thus, by studying OVA specific CD8+ T cell responses in a variety of in vitro and in vivo
contexts, I have provided new evidence to support a model by which caspase-3 becomes activated
and promotes CD8+ T cell proliferation and precedes differentiation to effector cells (Fig. 16).
Similarly, caspase-3 cleavage has been implicated in the normal differentiation of skeletal muscle
cells101, macrophages102, erythroblasts103, as well as others. The promiscuity of caspase-3 as a
protease has hampered attempts to specifically dissect the molecular mechanisms by which caspase-
3 affects its function in differentiation. This frustrating property of the apoptotic proteases to target
many proteins173 must surely be relevant to its function. Perhaps the ability of caspase-8 to cleave
and limit the function of the pro-necrotic Rip1 kinase offers us a glimpse at a more general function
of caspases to break down signaling networks. By targeting many proteins for cleavage, caspases
could aid in degrading the established signaling pathways and precipitate change in the cellular
signaling program from a naive latent state to one of active proliferation and differentiation.
Taken together, these results resolve some controversies surrounding caspases in CD8+ T cell
activation by providing strong evidence that active caspase-3 is: (a) directly stimulated by antigen,
(b) expressed transiently and lost progressively during proliferation and differentiation of CD8+ T
cells, (c) not associated with contraction of the response, (d) coupled with activation of other
canonical apoptotic mediators, and (e) does not lead to cell death (see Figure 42 for model). Our data
using a specific inhibitor also indicates that caspase-3 activation plays some role in limiting death
during T cell activation. This supports a model wherein the activation of caspases is key in limiting
necroptosis during T cell proliferation104, perhaps as a mechanism to remove activated T cells if they
133
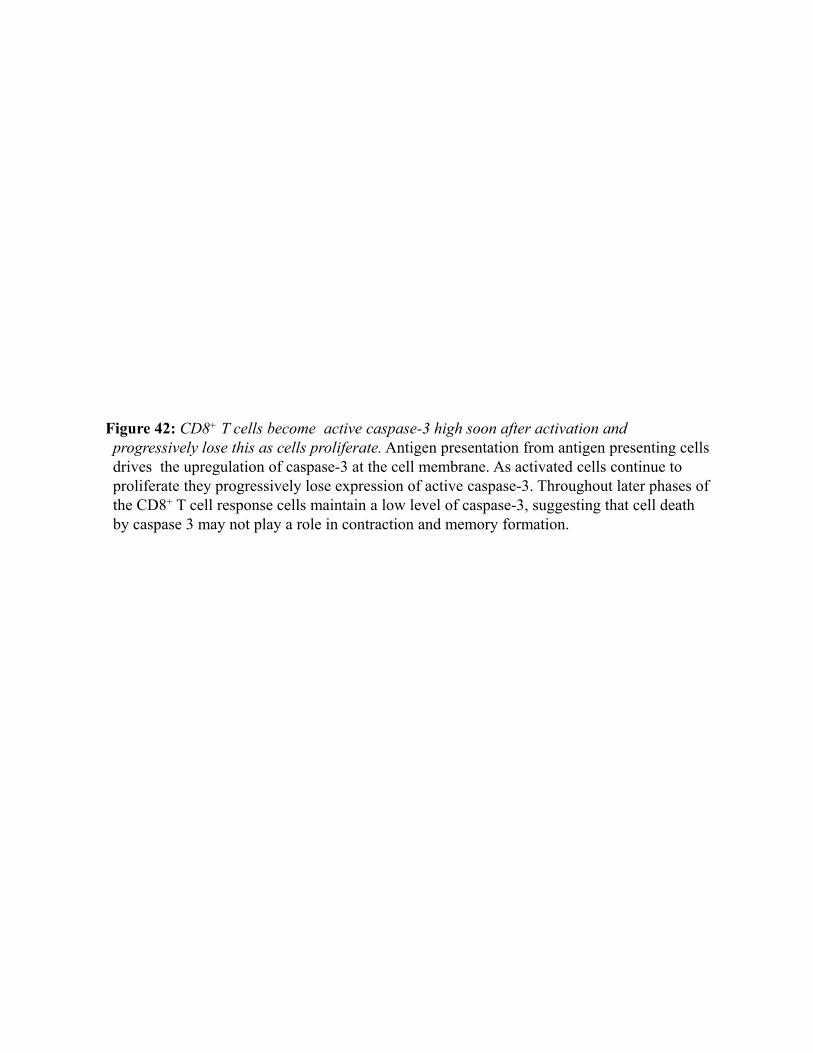
Figure 42: CD8+ T cells become active caspase-3 high soon after activation and progressively lose this as cells proliferate. Antigen presentation from antigen presenting cells drives the upregulation of caspase-3 at the cell membrane. As activated cells continue to proliferate they progressively lose expression of active caspase-3. Throughout later phases of the CD8+ T cell response cells maintain a low level of caspase-3, suggesting that cell death by caspase 3 may not play a role in contraction and memory formation.
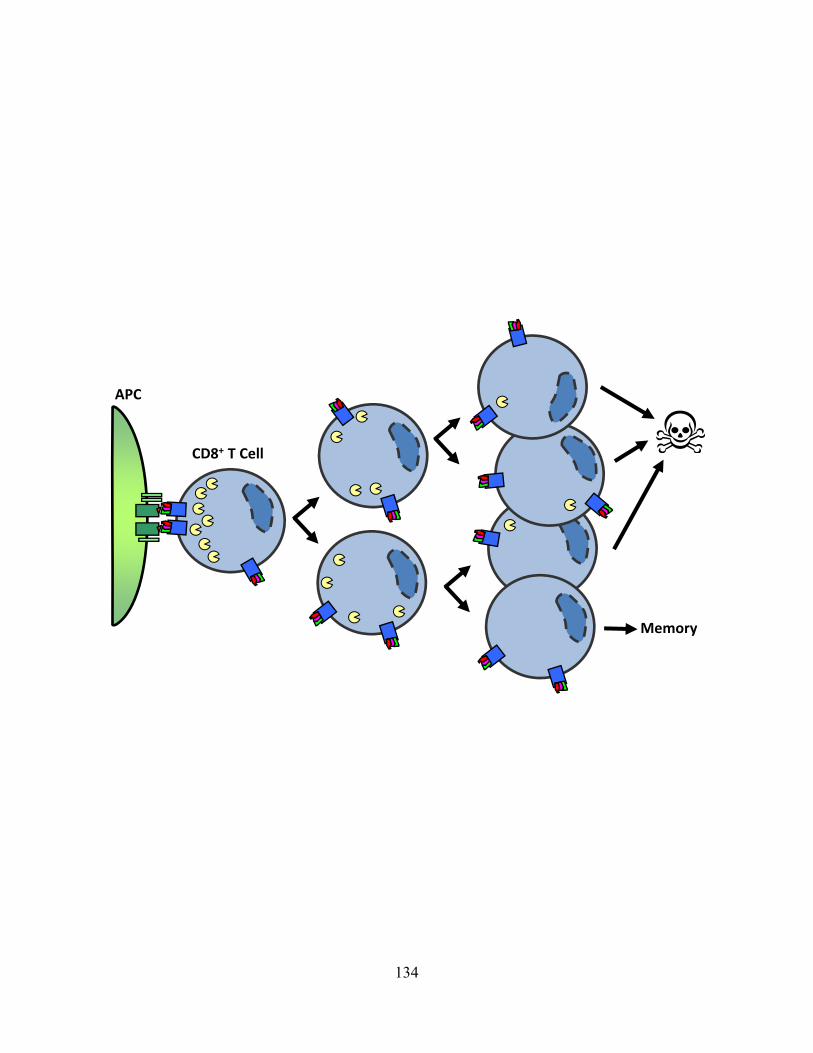
Memory
CD8+ T Cell
APC
134
fail to receive sustained stimulation. Further work will be necessary to fully characterize the role of
caspase-3 in regulating T cell death and proliferation.
5.2 THE ROLE OF IAPS IN INNATE IMMUNE CELL FUNCTION
As discussed above, there is no evidence that expression of inhibitor of apoptosis proteins
(IAPs) such as cIAP1, cIAP2, and xIAP have a significant role in regulating T cell survival. In
contrast, there have been several reports to show that expression of IAPs is important in regulating
the survival of innate immune cells. For example, it is known that innate immune cells upregulate
cIAP expression during differentiation and activation318–320. Furthermore, the inflammatory immune
response to LPS and bacterial infection has been shown to be significantly altered in mice deficient
for cIAP1282, cIAP2268, or xIAP321 expression. Consistent with a key role in macrophage function in
particular, I observed that purified macrophages expressed significantly higher levels of cIAPs than
B cells or T cells (Fig. 19A). Despite the apparent importance of IAPs in regulating innate immune
responses, the signaling mechanisms behind this function are not yet well understood. Thus, in this
thesis I have employed a newly available SMAC mimetic (SM) as an inhibitor of IAPs, SM-164. In
addition, I use genetically-deficient mice to explore the in vitro and in vivo role of cIAPs in
protecting innate immune cells from programmed cell death.
Our data clearly demonstrates that treatment of bone marrow derived macrophages (BMDMs) or
dendritic cells (BMDCs) treated with SM results in a dose dependent loss of viability (Fig. 19B, 20).
These results seem to contradict a recent paper examining human innate immune cells, wherein it
was found that monocytes were susceptible to SM-induced death but that macrophage cells were
highly resistant to this effect322. The differences between our results and those presented by Muller-
Sienerth et al. can potentially be explained by differences between human and mouse immune cells
135
in IAP function, as is exemplified by xIAP associated immunodeficiency observed in humans317 but
not mouse models316. In addition, in collaboration with other Sad lab members, I have recently
examined the susceptibility of macrophage cells over several weeks of differentiation using M-CSF.
In this case we observed a consistent loss of susceptibility to SM over time, with macrophages
differentiated for 15 days being completely non-responsive to SM treatment (unpublished results
from our lab). This data indicates that SM inhibition of cIAPs in freshly derived (~day 7)
macrophages and dendritic cells drives a potent induction of cell death. It is likely that persistent
culture of cells with M-CSF modulates pro- and anti-apoptotic mechanisms, and this may have
significant influence on their resistance to cell death. This may provide an interesting avenue for
future work in the Sad lab.
In most studies examining the effects of SMs in cancer cell lines, it has been shown that SM will
induce apoptosis which can be inhibited by zVAD treatment143,255. In BMDM cells, I saw that co-
treatment with zVAD in addition to SM actually resulted in a significant increase in loss of viability
(Fig. 21). In contrast, necrostatin completely rescued SM treated macrophages, pinpointing the
mechanism of death to be necroptosis (Fig. 21). Similar papers showing SM-induced necroptosis in
cell lines have mostly also employed a caspase inhibitor, zVAD-FMK (zVAD), to allow robust
activation of the programmed necrotic cell death pathway148. Interestingly, necroptosis induced by
SM has also been reported to occur without addition of a caspase inhibitor323. Our data shows that
cIAP inhibition through SM treatment alone is adequate to activate necroptotic cell death, but this
can be further enhanced by the application of zVAD.
Many reports have implicated cIAPs in the evasion of programmed death within cancer
cells143,192, but results have been conflicting as to the roles of cIAP1 or cIAP2 specifically. In
pancreatic cancer cells, it was shown that the knockdown both cIAP1 and cIAP2, through either
136
combined siRNA targeting or SM treatment, was necessary to sensitize pancreatic cancer cells to
TNF-α/zVAD-induced cell death148. In contrast to this, work in L929 fibroblasts showed that
knockdown of cIAP1 but not cIAP2 led to significantly increased sensitivity to TNF-α-induced cell
death, although it was not tested whether simultaneous knockdown of cIAP1 and cIAP2 could
further enhance cell death323. In this case primary macrophages lacking either cIAP1 or cIAP2
displayed increased sensitivity to SM-induced necroptosis; although this sensitization effect was
more prominent cIAP1- than cIAP2-deficient cells (Fig. 22A). Based on this, our data supports a
model whereby cIAP1 and cIAP2 act redundantly to limit the activation of necroptosis.
Similar to what has been observed in necroptosis, it was recently revealed that cIAP1, cIAP2
and xIAP function jointly to suppress the formation of a pro-apoptotic ripoptosome, a cell death
signaling platform containing both Rip1 and caspase-8 which is similar to the necrosome207,213.
Interestingly, these two simultaneous reports revealing the existence of the ripoptosome signaling
complex differed in terms of their observed importance of Rip1 kinase activity. While the TLR3-
induced ripoptosome required both zVAD and necrostatin (nec) for rescue207, the genotoxic stress
(etoposide)-induced ripoptosome was inhibited by necrostatin alone213. In my observations, I saw
that xIAP knockout animals showed significantly elevated sensitivity to SM-induced cell death, but
could not be rescued by necrostatin treatment alone (Fig. 22B). The addition of both zVAD and nec
resulted in a somewhat increased but still incomplete rescue of SM-induced cell death (data not
shown). These data suggest that in macrophages xIAP specifically functions to block the apoptotic
axis of SM-induced death, although further work will be needed to confirm if this involves the
formation of a ripoptosome. Importantly, this also suggests a qualitative difference between the
inhibition of xIAP-induced by SM-164275 and that achieved by complete genetic-deficiency.
137
Reports have previously implicated cIAPs in limiting cell death thorough their E3 ligase activity
in the ubiquitination of Rip1 kinase188,324. Correspondingly, the deubiquitinating enzyme
cylindromatosis has been shown to promote Rip1 dependent death pathways148,323. Importantly,
although cIAP ubiquitination of Rip1 is generally associated with non-degradative K63-linked
ubiquitin chains139,189, it has been recently reported that cIAPs can participate in the ubiquitination of
both Rip1 and Rip3 with degradative K48 as well as K63 ubiquitin chains325. Herein I report that
SM-induced loss of cIAPs corresponds with an increased expression of both Rip1 and Rip3 (Fig.
23A), which appears to be mediated by post-translational mechanisms (Fig. 23C,D). Furthermore, I
show that treatment of cells with the 20S proteasome inhibitor, lactacystin, results in an increase in
expression of Rip1 and Rip3 (Fig. 23E). Taken together this data indicates that cIAPs increase the
degradative turnover of Rip1 and Rip3 kinases, potentially through K48 ubiquitination.
In addition to the increased expression of Rip1 and Rip3 kinases associated with SM
treatment, I also observed a consistent increase in a secondary slightly slower migrating form of
Rip1 (Fig. 23A), which I confirmed to be phosphorylated Rip1 (Fig. 23B). It has been shown
repeatedly that TNF-receptor (TNFR) signaling drives the activation (phosphorylation) of Rip1194.
While exogenous TNF-α can serve this function, it has also been demonstrated that SM treatment of
some cell lines can induce the autocrine production of TNF-α necessary for cell death255. BMDM
cells appear to be no exception to this, as macrophage death was dependent upon the expression of
TNFR1/2 (TNFR-/-) (Fig. 24A). Interestingly, the addition of both zVAD and SM resulted in a potent
induction of necroptosis even within TNFR-/- macrophages (Fig. 24E), suggesting that alternative
pathways to necroptosis may become activated under conditions where multiple necroptosis
inhibitors are blocked.
138

At first glance, an increase in TNF-α production in response to SM might seem somewhat
confusing given that cIAPs have been reported to act in pro-inflammatory NF-κβ signaling189. It
should be kept in mind however that the reported NF-κβ promoting effects of cIAPs apply primarily
to signaling downstream of TNFR signaling and should not be generally applied to all pro-
inflammatory signaling. Indeed, spontaneous production to cytokines has recently been reported to
actually increase with application of a SM326. Furthermore, it has been shown that inhibition of Rip1
kinase activity through nec-1 can also inhibit the production of TNF-α229,249. Production of IL-1β has
also been linked to SM-induced activation of the necrosome, although it appears to be Rip3 rather
than Rip1 specific254. In my case, I observed increased inflammatory cytokine production in BMDM
and BMDC cells in response to SM treatment, with a much more potent effect in combination with
LPS (Fig. 20). This data supports a model whereby Rip1 activation promotes increased pro-
inflammatory signaling and cytokine production.
Interestingly, I also observed no increase in Rip1/3 expression in TNFR1/2-deficient
macrophages treated with SM (Fig. 24B), perhaps suggesting that the TNFR may itself participate in
this turnover of Rip1 and Rip3. It seems plausible that cIAP1 and cIAP2 could function to
specifically promote the degradation of Rip1 and Rip3 as they become associated with the TNFR
complex, and thus limit downstream signaling. A similar effect of IAPs to limit the recruitment of
Rip1 to the FAS receptor was recently reported327, although the authors do not provide evidence to
suggest whether degradation of Rip1 may be involved. Taken with our observations here I propose a
model wherein cIAPs selectively degrade Rip1 and Rip3 as they become activated by the TNFR.
Furthermore, given the lack of a plausible mechanism to explain spontaneous TNF-α production in
the absence of TNF production, I speculate that this TNFR activation of the necrosome occurs
constitutively at a low level which is kept in check cIAPs.
139
The extensive in vitro analysis of cIAPs and SMs has clearly shown that their expression is
often important in preventing programmed cell death in cancer cells, but the role of cIAPs within
normal immune cells has been much less clear. Recently, one study showed that cIAP1-deficient
mice have higher C. pneumoniae burden282, but the in vivo viability of macrophages was not
assessed. Their finding of reduced macrophage numbers in infected lungs of knockout mice is
compatible with increased cell death. Another study has shown that cIAP2-deficient mice are highly
resistant to LPS-induced shock due to elevated macrophage cell death268. In this data, I show that
loss of cIAP activity, either through genetic ablation or using a specific inhibitor, results in
significantly increased necroptosis of macrophages (Fig. 26). This increased death of macrophages
in vivo, led to poorer control of an intracellular bacterial pathogen (Fig. 26A,D). Thus, I conclude
that cIAPs function to limit necroptosis in macrophages in vivo.
Based on recent data showing that mice deficient in Rip3 expression are significantly more
susceptible to infection with vaccinia virus206, it has been suggested that necroptosis provides an
important means to eliminate infected cells. Furthermore, it is thought that necroptosis will cause the
release of important DAMPs, driving acute inflammation which may be beneficial in initiating an
immune response247. Consistent with this, cytomegalovirus has also been demonstrated to evade
immune response by inhibiting Rip3; mutants of cytomegalovirus which lack this ability to inhibit
Rip3 exhibit severely attenuated pathogenesis328. In contrast to this view, I show that overactive
necroptosis associated with loss of cIAP activity leads to impaired control of Listeria
monocytogenes. Taken together, these data underline the complexity of cell death regulation in
immune cells, and the need for an appropriate balance between too little and too much cell death.
In conclusion, I have provided novel mechanistic insights into how cIAPs protect macrophages
from cell death, through direct interaction with key members of the necrosome. I propose that
140
because activated macrophages can carry elevated levels of ROS and other cytotoxic inflammatory
mediators, it is possible that the action of caspases and cIAPs may represent an important
mechanism to counteract a natural predisposition toward necrotic cell death. In addition, as I have
observed in SM treated cells, and has been reported by others, Rip1 phosphorylation seems to be an
important driver of necroptosis249. Based on this I propose the following model: (1) Preclustering of
the TNFR complex, or low level TNF release drives low level activation of the necrosome, (2)
Constitutive necrosome activation is kept in check by cIAP mediated degradation of Rip1 and Rip3
kinase, (3) SM driven degradation of cIAPs leads to elevated necrosome activation, (4) Rip1 kinase
activity drives increased release of TNF-α, (5) TNFR signaling results in a potent induction of both
necroptosis and apoptosis, (6) xIAP prevents the induction of apoptosis, resulting in necroptotic cell
death (see Figure 43 for model). Given the increasing push for clinical application of SMAC
mimetics, it represents an interesting possibility that the pathway I have revealed here may also
operate in some tumor cells.
5.3 NECROPTOSIS AND INTERFERON
I next wished to address the issue of necroptotic cell death in Salmonella infection. Our initial
investigations into the infection of mice with Salmonella typhimurium (ST) somewhat mirrored the
results of LM infection, namely that cIAP1-deficent animals had much worse control of ST infection
(Fig. 27). Based on this, I formulated a hypothesis that necroptosis might play a significant role in
the pathogenesis of ST.
Previous work investigating cell death of macrophages associated with ST infection has
revealed two divergent forms of death. The faster of the two forms of cell death, pyroptosis, occurs
within as little as 1 hour after infection and is dependent upon the activation of caspase-185. This
141

Figure 43: Activation of Rip1 is kept in check by cIAP mediated degradation. Our data indicates that loss of cIAP expression following SM treatment leads to increased expression of Rip1 and Rip3. Loss of constitutive inhibition of necrosome activity leads to increased expression of inflammatory cytokines, including TNF. Ligation of the TNFR leads to high level activation of the necrosome and drives cell death through both apoptotic and necroptotic pathways. Expression of xIAP is necessary to dampen the TNFR induced apoptosis pathway.
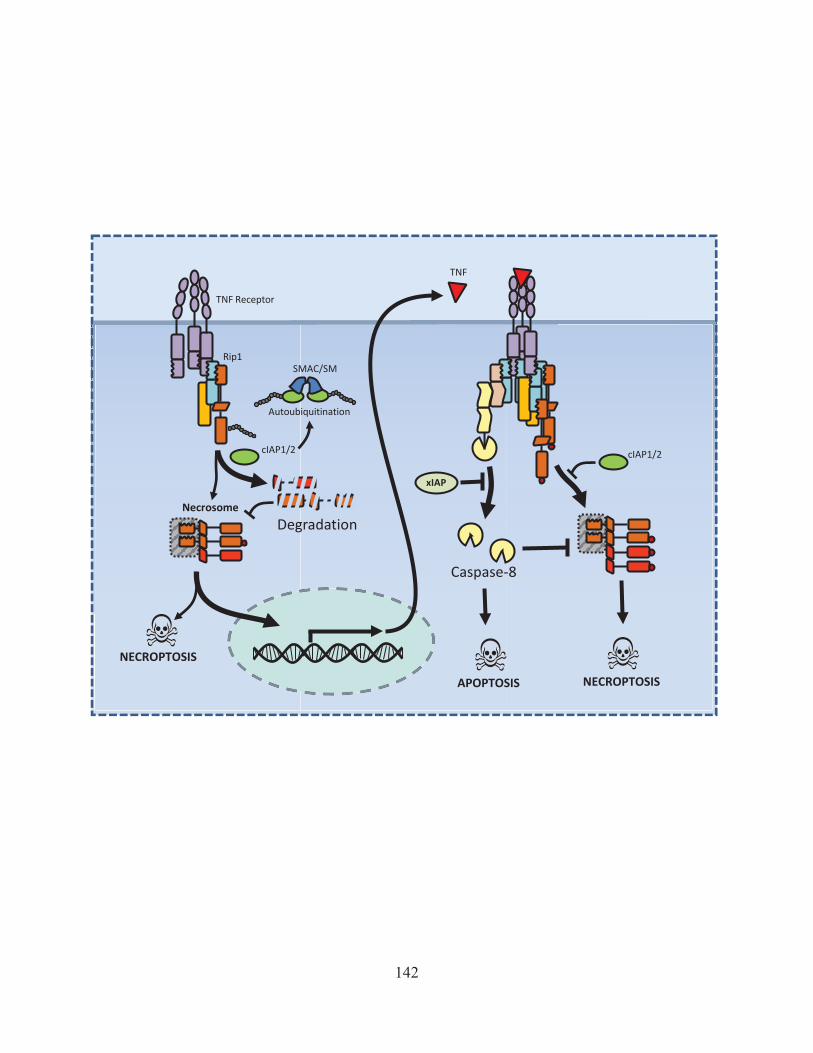
TNF Receptor
Necrosome
cIAP1/2
NECROPTOSIS
SMAC/SM
Autoubiquitination
Degradation
TNF
Rip1
NECROPTOSIS APOPTOSIS
xIAP
Caspase-8
cIAP1/2
142
form of death was proposed to be to be a key mechanism for systemic dissemination of ST, as
caspase-1-deficient mice were resistant to oral infection79. More recent studies have contrasted this
earlier work however, instead showing that caspase-1-dependent inflammasome activation resistance
to oral ST infection329. Caspase-1-deficient mice have also been shown to have higher susceptibility
to intravenous delivery of ST80,81. While these conflicting results yielded from groups testing
Salmonella infection have are still somewhat unresolved, the prevailing model now views caspase-1
as an inflammatory mechanism which aids the immune response to ST. In addition to pyroptosis, ST
has also been demonstrated to elicit a delayed form of cell death occurring 6-18 hours or more after
infection of macrophages85. This form of cell death appears to be primarily revealed in infections
with Salmonella pathogenicity island-1 (SPI-1) deficient mutant strains330,331. Interestingly, this
delayed macrophage cell death has also been reported to rely on activation of TLR4 signaling and
protein kinase R86.
In contrast to these previous reports, our lab had observed that cell death of infected
macrophages primarily occurred between 24 and 48 hours of infection, more consistent with the
delayed phenotype of ST-induced death. It is not entirely clear why rapid pyroptosis was not seen in
our model, but it should be noted that pyroptosis has been previously induced by infecting either
LPS-primed macrophages or using very high multiplicities of infection (MOI) of ST84. Consistent
with such an explanation, it was observed that LPS pre-treatment of macrophages significantly
accelerated cell death induced by ST (unpublished results from our lab).
Despite the delayed kinetics of macrophage death induced by ST in our infection model, cell
death was significantly reduced using a specific inhibitor of caspase-1 (Fig. 28A). Interestingly, we
found that the application of the Rip1 inhibitor, necrostatin, was significantly more effective at
rescuing macrophages from delayed ST-induced cell death (Fig. 28A). I also confirmed that cell
143
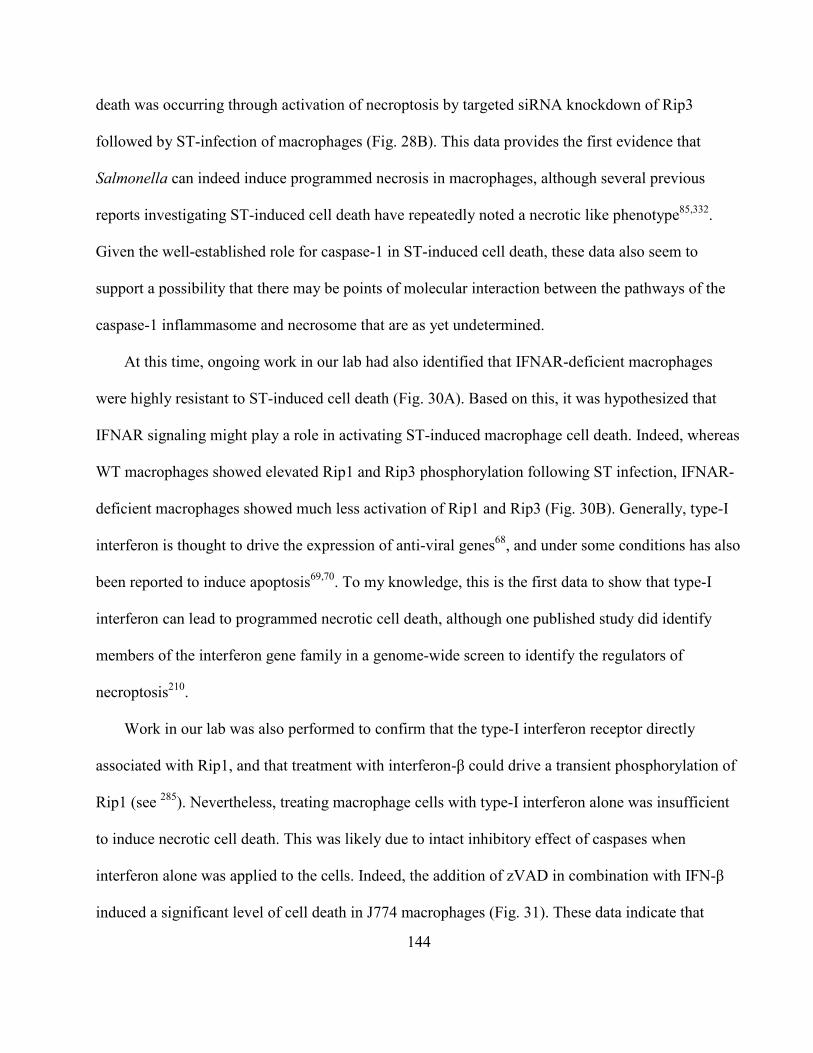
death was occurring through activation of necroptosis by targeted siRNA knockdown of Rip3
followed by ST-infection of macrophages (Fig. 28B). This data provides the first evidence that
Salmonella can indeed induce programmed necrosis in macrophages, although several previous
reports investigating ST-induced cell death have repeatedly noted a necrotic like phenotype85,332.
Given the well-established role for caspase-1 in ST-induced cell death, these data also seem to
support a possibility that there may be points of molecular interaction between the pathways of the
caspase-1 inflammasome and necrosome that are as yet undetermined.
At this time, ongoing work in our lab had also identified that IFNAR-deficient macrophages
were highly resistant to ST-induced cell death (Fig. 30A). Based on this, it was hypothesized that
IFNAR signaling might play a role in activating ST-induced macrophage cell death. Indeed, whereas
WT macrophages showed elevated Rip1 and Rip3 phosphorylation following ST infection, IFNAR-
deficient macrophages showed much less activation of Rip1 and Rip3 (Fig. 30B). Generally, type-I
interferon is thought to drive the expression of anti-viral genes68, and under some conditions has also
been reported to induce apoptosis69,70. To my knowledge, this is the first data to show that type-I
interferon can lead to programmed necrotic cell death, although one published study did identify
members of the interferon gene family in a genome-wide screen to identify the regulators of
necroptosis210.
Work in our lab was also performed to confirm that the type-I interferon receptor directly
associated with Rip1, and that treatment with interferon-β could drive a transient phosphorylation of
Rip1 (see 285). Nevertheless, treating macrophage cells with type-I interferon alone was insufficient
to induce necrotic cell death. This was likely due to intact inhibitory effect of caspases when
interferon alone was applied to the cells. Indeed, the addition of zVAD in combination with IFN-β
induced a significant level of cell death in J774 macrophages (Fig. 31). These data indicate that
144
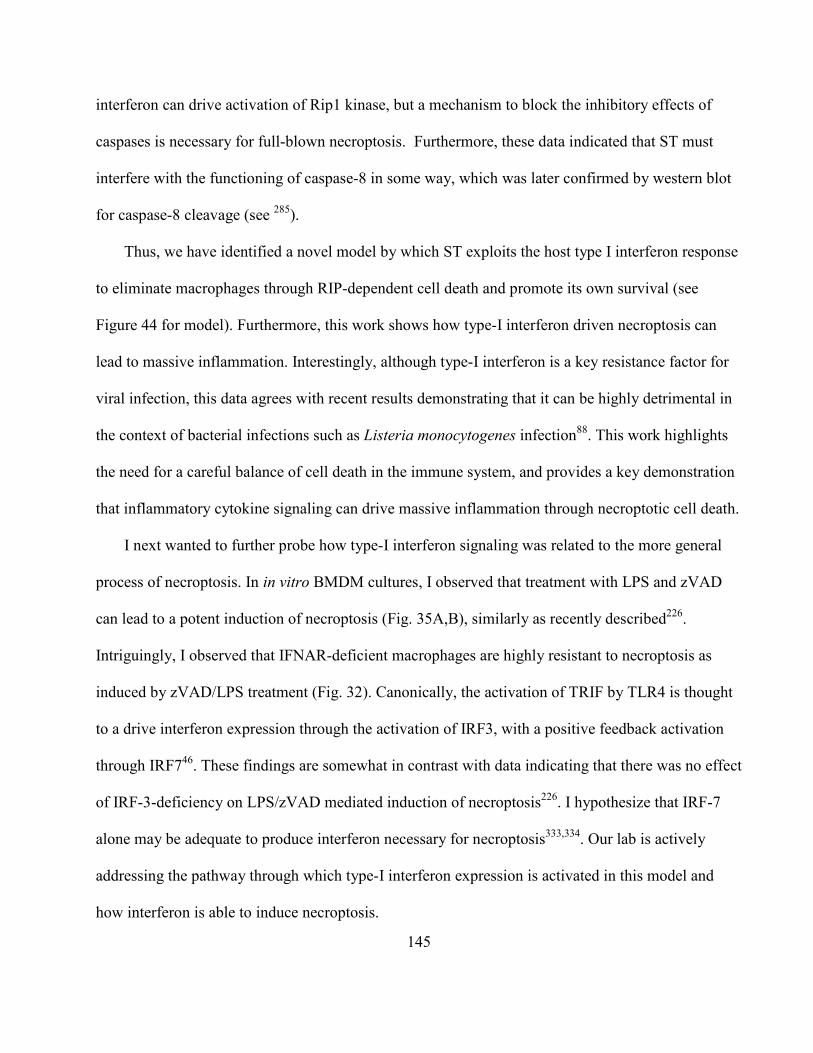
interferon can drive activation of Rip1 kinase, but a mechanism to block the inhibitory effects of
caspases is necessary for full-blown necroptosis. Furthermore, these data indicated that ST must
interfere with the functioning of caspase-8 in some way, which was later confirmed by western blot
for caspase-8 cleavage (see 285).
Thus, we have identified a novel model by which ST exploits the host type I interferon response
to eliminate macrophages through RIP-dependent cell death and promote its own survival (see
Figure 44 for model). Furthermore, this work shows how type-I interferon driven necroptosis can
lead to massive inflammation. Interestingly, although type-I interferon is a key resistance factor for
viral infection, this data agrees with recent results demonstrating that it can be highly detrimental in
the context of bacterial infections such as Listeria monocytogenes infection88. This work highlights
the need for a careful balance of cell death in the immune system, and provides a key demonstration
that inflammatory cytokine signaling can drive massive inflammation through necroptotic cell death.
I next wanted to further probe how type-I interferon signaling was related to the more general
process of necroptosis. In in vitro BMDM cultures, I observed that treatment with LPS and zVAD
can lead to a potent induction of necroptosis (Fig. 35A,B), similarly as recently described226.
Intriguingly, I observed that IFNAR-deficient macrophages are highly resistant to necroptosis as
induced by zVAD/LPS treatment (Fig. 32). Canonically, the activation of TRIF by TLR4 is thought
to a drive interferon expression through the activation of IRF3, with a positive feedback activation
through IRF746. These findings are somewhat in contrast with data indicating that there was no effect
of IRF-3-deficiency on LPS/zVAD mediated induction of necroptosis226. I hypothesize that IRF-7
alone may be adequate to produce interferon necessary for necroptosis333,334. Our lab is actively
addressing the pathway through which type-I interferon expression is activated in this model and
how interferon is able to induce necroptosis.
145
Figure 44: Model of how ST induces necroptosis. (1) ST is rapidly phagocytosed by macrophage cells, where it remains in the phagosome (2) Exposure to ST induces a immune stimulation through PRRs leading to (3) the release of inflammatory cytokines such as IL-6, TNF and type-I interferon. (4) Type-I interferon induces an up-regulation of IFNAR signaling which (5) leads to activation of Rip1 kinase. It remains unclear what other factors such as JAKs and STATs might play in the activation of Rip1 kinase (6) Activation of Rip1 leads to formation and activation of the necrosome (7) Ultimately, this leads to necroptotic cell death and release of ST bacteria.
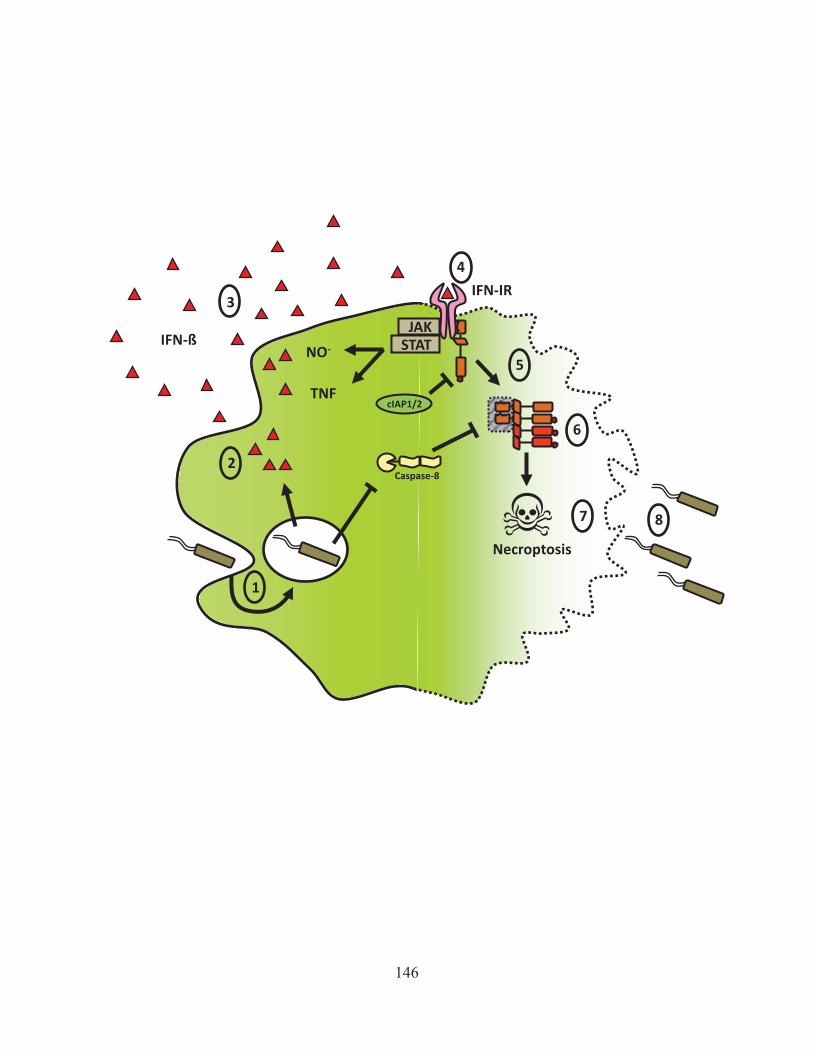
IFN-IR
IFN-ß
1
2
4
5
6
7 8
Necroptosis
STAT JAK
NO-
TNF
3
cIAP1/2
Caspase-8
146
The in vivo relevance of necroptosis has been an important question since its identification of
the specific mechanisms behind this cell death pathway. Newly published data shows that Rip3-
deficient mice are resistant to systemic shock as induced by TNF injection or caecal ligation and
puncture258. Given this view of necroptosis as a driver of systemic shock, I wanted to probe what
role interferon might play in this effect. Intraperitoneal injection of LPS/zVAD led to significantly
more cell death of macrophages in WT than IFNAR-/- mice (Fig. 33C). In addition, while WT mice
were largely moribund, IFNAR mice showed drastically reduced symptoms at 18 hours after
LPS/zVAD injection. These results lead to the highly novel conclusion that type-I interferon-induced
necroptosis may constitute a significant factor in the pathology of acute systemic shock.
While work in our lab has recently confirmed Rip1 association with the IFNAR receptor
complex (see 285), it remains unclear what signaling component of the type-I interferon signaling
complex might be responsible for the induction of Rip1 phosphorylation and necroptosis. To our
knowledge, none of the key signaling kinases (JAK, Tyk2, STATs) have been previously found in
association with Rip1 kinase. Several of these downstream mediators of IFNAR have however been
implicated in the induction of sepsis. Mice deficient in the signaling components Tyk2 or STAT1
have been shown to be somewhat protected against septic shock335. JAK inhibitors have also been
shown to have an inhibitory effect on septic shock336. STAT1 has previously been shown to be
involved in a form of LPS-induced caspase-independent cell death within macrophages337. We are
currently addressing which specific component(s) of IFNAR signaling machinery may be involved
in the phosphorylation of Rip1 kinase.
There is strong evidence to support a role for type-I interferon in septic shock. Several
publications have for instance shown that IFNAR-deficient mice are highly resistant to injection of
TNF-α338 or LPS339,340. Signaling components upstream of the production of type-I interferon, such
147
as IRF3341 or TRIF342, have also been shown to protect against LPS endotoxemia. TNFR1 deficient
mice are not similarly protected from endotoxemia343, underlining the importance of type-I
interferon signaling specifically. Despite the abundance of evidence implicating type-I IFN signaling
in endotoxic shock, a viable mechanism has not yet emerged to explain how interferon mediates this
effect344.
Fascinatingly, mice deficient in IFNAR signaling do not appear to have any significant defects
in the early production of the inflammatory mediators (IL-6, IL1β, IL-12, NO or TNF) which occurs
in response to LPS injection, despite their strong protection from death335. Recently, IFN-β-induced
JAK signaling has been implicated in LPS-induced release of another key player in sepsis,
HMGB1336. Elevated serum levels of HMGB1 are commonly seen in septic patients345, and blocking
HMGB1 has been shown to be somewhat protective in the mouse LPS injection model346. While
HMGB1 is generally accepted as a key component in acute inflammation induced during sepsis233, a
mechanism for such massive release of this intracellular DAMP following endotoxic shock has also
not yet been identified. The ability of interferon to induce necroptosis, which I have identified here,
represents a highly novel mechanism by which such a release of HMGB1 could be occurring. Given
the ability of HMGB1 released from necrotic cells to signal through TLR4, I speculate that it may be
possible that HMGB1 itself acts to feedback and promote activation of necroptosis.
The discovery that type-I interferon signaling can directly induce Rip1 phosphorylation and
necroptotic cell death potentially represents an important paradigm shift in the understanding of
systemic shock. Based on this I propose the following temporal model of endotoxic shock: (1)
exposure of innate immune cells to LPS initiates necroptotic pathway by inducing phosphorylation
of Rip1 kinase, (2) activation of TRIF dependent signaling drives release of interferon-beta, (3)
signaling through IFNAR directly activates Rip1 phosphorylation, potentially through as of yet
148
unknown mediators, (4) prolonged activation of the Rip1/Rip3 necrosome drives necroptotic cell
death, (5) this leads to the extracellular release of inflammatory DAMPs such as HMGB1, driving
intense inflammatory feedback (see Figure 45 for model).
Sepsis is clinically a highly significant disease. In Canada, approximately 9300 people die every
year from sepsis, making up approximately 10% of all hospital deaths347. Despite this, there exist
few effective strategies to deal with sepsis. Currently, standard protocol dictates that intravenous
antibiotics should be administered as soon as a diagnosis of sepsis is made348. To date, no effective
anti-inflammatory intervention has been developed to treat sepsis, although many are in
development349. Targeting type-I interferon signaling has been suggested as a candidate for
treatment of sepsis344. The identification of the molecular mechanism by which type-I interferon can
induce inflammatory necrotic cell death may lead to novel treatment strategies for sepsis. For
instance, significant synergistic effect might be achieved by combinatorial targeting of both the
interferon pathway and the necrosome.
This novel mechanism of action of interferon may also lead to understanding of the clinical
action of interferon therapy. Type-I interferon is utilized in a wide variety of diseases, ranging from
Hepatitis C infection, to multiple sclerosis, and cancer350. Examining the possibility that type-1
interferon-induced necroptosis may play a therapeutic role in treatment of these diseases could lead
to an improved understanding of these diseases more generally. For instance, is the induction of
necroptosis a viable strategy for the removal of cancer cells? Perhaps this alternative form of
inflammatory death may be desirable for cells that have escaped the normal processes of apoptotic
death. In this case, combining interferon therapy with zVAD or SMAC mimetics may be a viable
strategy to improve this type of cell death. Similarly, these types of strategies could potentially be
employed to improve clearance of viral infection.
149
Figure 45: The role of interferon in LPS/zVAD induced necroptosis. Similarly to ST infection, induction of necroptosis via LPS/zVAD requires the release of type-I interferon for the activation of necroptosis. Upstream release of inflammatory cytokines is required for induction of necroptotic cell death.
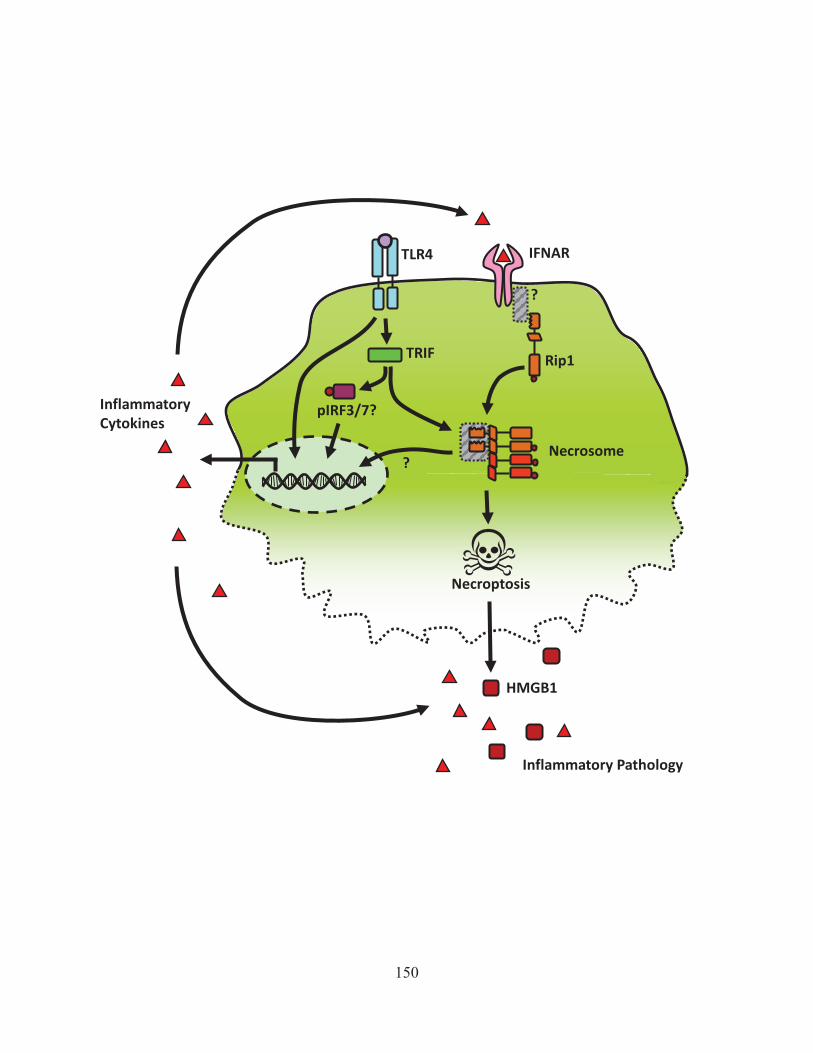
TRIF
pIRF3/7? Inflammatory Cytokines
Necrosome
?
Rip1
IFNAR
Necroptosis
HMGB1
Inflammatory Pathology
?
TLR4
150
5.4 THE REGULATION OF NECROPTOSIS BY CATHEPSINS
Innate immune cells, such as macrophages, must strike a careful balance between the need for
cell death to prevent propagation of an infectious agent and the need to limit inflammatory cell
death. Because necrotic cell death can lead to the release of potent intracellular danger signals,
understanding the regulation of necroptosis may have important implications for the understanding
of inflammation211. Currently, the prevailing model of inhibitory dampening of necroptotic
signaling focuses on caspase-8 mediated cleavage of Rip1 kinase as the central mechanism209,211. As
a novel addition to this, I have found that cysteine family cathepsins are also able to cleave Rip1 and
regulate necroptosis in macrophages. Our data thus reveals that the dual-inhibitory effects of zVAD
on both cathepsins and caspase-8 may explain why zVAD is such a potent inducer of necroptosis,
while other caspase inhibitors fail to do so. Cathepsins acting as a backup mechanism to limit
necroptosis makes biological sense, since redundant mechanisms to limit acute inflammation would
likely be advantageous.
The process of zVAD-induced necroptosis has been observed in a number of different cell lines.
A potent induction of necroptosis generally requires either exogenous 351 or autocrine TNFα
signaling 256. In macrophages specifically, zVAD has been shown to induce cell death in the
RAW264.1 cell line, although the mechanism of death was not clear 287. In bone marrow
macrophages, I observe that zVAD alone drives necroptosis, which was dependent on autocrine
TNF-α signaling (Fig. 34). I go on to show that LPS/zVAD stimulation is able to stimulate TNFR-
independent necroptosis in macrophages (Fig. 35), as has recently been reported226.
Stimulation of macrophages with LPS was able to initiate phosphorylation of Rip1
independently of zVAD. However, the addition of zVAD was necessary to drive downstream
151
phosphorylation of Rip3 and lead to necroptosis. I also demonstrate that the LPS-TRIF pathway
specifically drives Rip1 activation, similarly to what has been described in the literature226. This
indicates that caspase-8 does not appear to regulate the upstream activation of Rip1, but specifically
inhibits the activation of the necrosome complex and phosphorylation of Rip3.
Interestingly, while zVAD was able to induce necroptosis, I found that a caspase-8 specific
inhibitor, z-IETD-FMK (zIETD), did not result in cell death. A similar observation in L929 cells was
previously ascribed to a lack of stimulation of autocrine TNF-α production with caspase 8 inhibitor
(zIETD) relative to pan-caspase inhibitor (zVAD)256. Inconsistent with this explanation, the addition
of LPS is able to drive necroptosis independently of TNF-α in our model. Even in combination with
this exogenous signaling from LPS, zIETD fails to induce necroptosis. Given this fact, I questioned
whether the lack of induction of necroptosis by zIETD indicates that alternative targets are being
inhibited by zVAD in addition to caspase-8.
In examining the expression of Rip1 during necroptosis, I consistently observed smaller bands,
which reacted with our anti-Rip1 antibody. Upon treatment with zVAD I saw a significant reduction
in these bands, leading us to conclude that they were likely cleavage fragments of Rip1 kinase. In
contrast to zVAD, treatment with zIETD did not affect the cleaved Rip1 forms. In addition to its
effects on caspases, zVAD has been demonstrated to also inhibit cysteine protease family cathepsins,
such as cathepsin B and S352. Thus I tested the application of targeted cathepsin inhibitors to
macrophages. While zIETD failed to affect the level of cleaved Rip1, the addition of a pan cysteine
cathepsin/calpain inhibitor, E64D, resulted in a total abrogation of cleaved Rip1 (Fig. 36). This data
indicated that cathepsins could potentially be cleaving Rip1 kinase in macrophages.
Confirming the role of cathepsins in Rip1 cleavage, I also observed decreased cleavage of Rip1
using siRNA knockdown of either cathepsin S or B (Fig. 37A). Knockdown also resulted in a small
152
but significant increase in sensitivity to zVAD-induced necroptosis, whereas knockdown of calpain
resulted in reduced necroptotic response (Fig. 37B). I also treated cathepsin S- or cathepsin B-
deficient macrophages with zVAD and LPS, wherein I observed no significant change in the
sensitivity to necroptosis induced by zVAD (Fig. 38). This data suggests that cysteine cathepsins
may act redundantly to regulate Rip1 kinase. Consistent with such a model, single knockout mice for
either cathepsin S or B show no defects in development or immune response290. Interestingly, double
knockout mice for cathepsin B and cathepsin L die in the second to fourth week of postnatal due to
overactive cell death in the brain353.
Cell-free cleavage experiments, in collaboration with Dr. Shutinoski within the Sad lab, clearly
show that at neutral pH, cysteine family cathepsins are able to directly cleave Rip1, producing
fragments consistent with those observed in macrophages. I also observed some cleavage of Rip1
kinase with cathepsin L, but it was relatively inefficient in comparison to that observed with
cathepsin S or B. Given the size of the Rip1 kinase fragments observed, I estimate that the most
prominent cleavage of Rip1 likely occurs in the 310-340 amino acid range. This may be consistent
with a predicted cathepsin B site at position 330-335 (Fig. 40A) 354. Prediction for cathepsin S sites
was unavailable. At this time it is unclear exactly how cleavage of Rip1 effects necroptotic
signaling given that the pool of full-length Rip1 remains relatively unchanged.
Cathepsins have previously been thought of as aggressive proteases, which once released from
the lysosomes will mediate rapid proteolytic breakdown of the cell355. While, massive cathepsin
release may result in necrosis under some conditions356, slow release of cathepsins actually results in
selective cleavage of few targets357. Specifically, controlled lysosomal breakdown enhances
apoptotic cell death via cathepsin-mediated cleavage of Bid into its pro-apoptotic form358,359. In the
case of necroptosis, cathepsins have been proposed to aid in rapid cellular disintegration230, but
153
specific data supporting this assertion is limited. In contrast with this, I show that inhibition of
cysteine cathepsins actually drove a subtle but significant increase in necroptosis within
macrophages. The minimal effect observed in zVAD necroptosis is likely due to the fact that zVAD
already inhibits cathepsins352, and this may not be a limiting factor in the cell death observed. In
contrast to the subtle effects on zVAD-induced death, cathepsin inhibitors resulted in significant
macrophage necroptosis when combined with a specific caspase-8 inhibitor. Taken together, these
data lead to the surprising conclusion that cathepsins function to actively suppress necroptosis
through cleavage of Rip1 kinase.
In our western blot analysis, Rip1 cleavage products appear to be predominantly formed by
cathepsins, raising the question of how caspase-8 contributes to regulating necroptosis in
macrophages. Caspase-8 is undoubtedly linked to control of necroptosis in hematopoiesis during
fetal development 106. Cleavage of Rip1-kinase by caspase-8 was identified before the role of Rip1 in
non-apoptotic cell death was discovered 309, and has since been repeatedly confirmed360. Given that
FADD is thought to recruit caspase-8 to the necrosome after activation150, I hypothesize that
caspase-8 may act as more downstream regulator of necroptosis after Rip1 phosphorylation. In
contrast, I observe cathepsin mediated cleavage in macrophages under steady-state conditions,
indicating that this may be a more upstream mode of regulating Rip1 activity. Given that the
cleavage sites are after the kinase domain and that these cleaved forms persist within the cells, it
seems plausible that Rip1 cleaved forms may interact with and inhibit the formation of the
necrosome. Further work will be needed to elucidate how proteolysis by cathepsins and caspase-8
regulates necroptosis (see Figure 46 for model).
The idea of cathepsins acting as anti-necroptotic factors is a surprising finding, yet given a
newly defined role of cathepsins in the apoptotic program, it seems to fit well into the paradigm of
154
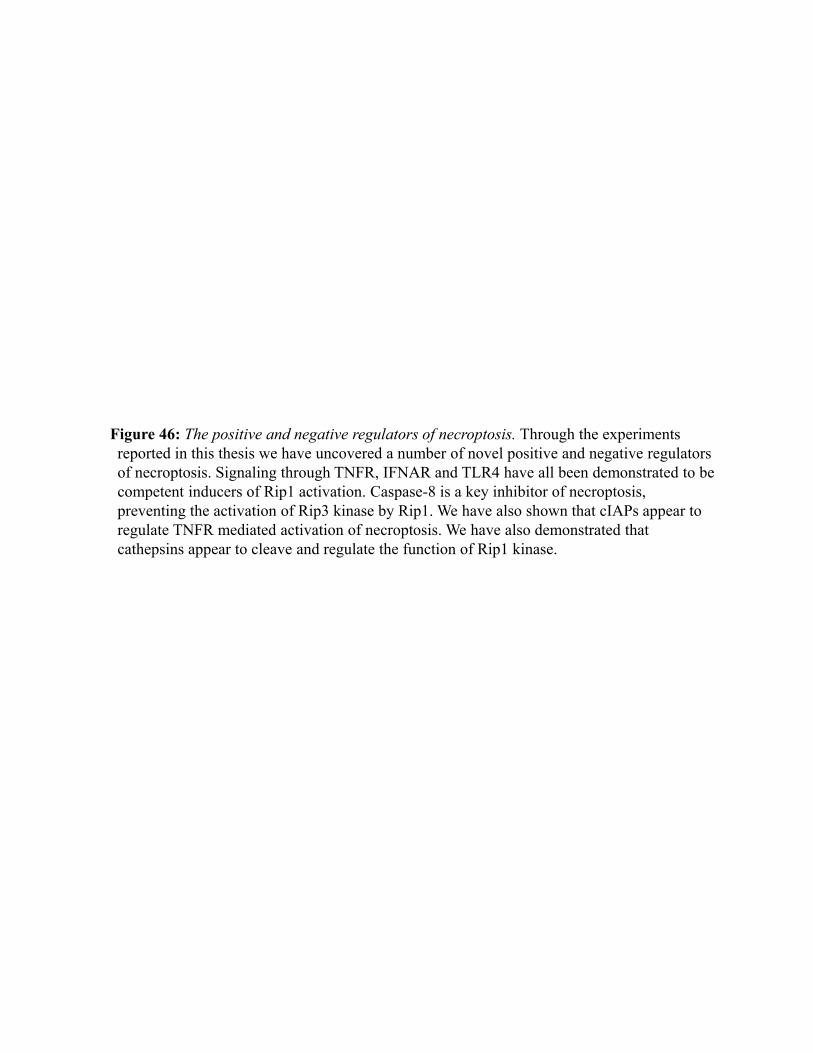
Figure 46: The positive and negative regulators of necroptosis. Through the experiments reported in this thesis we have uncovered a number of novel positive and negative regulators of necroptosis. Signaling through TNFR, IFNAR and TLR4 have all been demonstrated to be competent inducers of Rip1 activation. Caspase-8 is a key inhibitor of necroptosis, preventing the activation of Rip3 kinase by Rip1. We have also shown that cIAPs appear to regulate TNFR mediated activation of necroptosis. We have also demonstrated that cathepsins appear to cleave and regulate the function of Rip1 kinase.
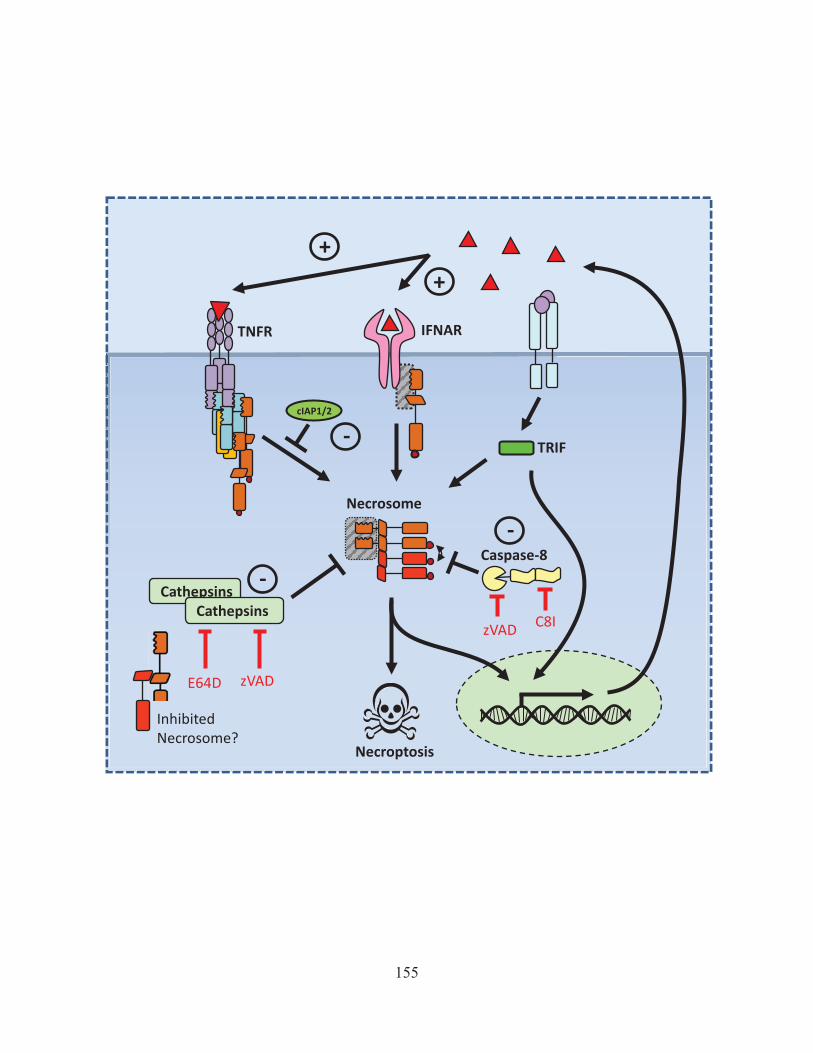
Necrosome
Cathepsins Cathepsins
E64D zVAD
Inhibited Necrosome?
zVAD
TRIF
IFNAR
Caspase-8
+
+
cIAP1/2
Necroptosis
TNFR
-
-
-
C8I
155
pro-apoptotic factors acting to inhibit necroptosis. Interestingly, expression of both cathepsin S and
B has been well documented at inflammatory sites in various disease models including pancreatitis
361, inflammatory bowel disease362, and atherosclerosis363. It seems plausible that cathepsin mediated
cleavage of Rip1 kinase could play a role in perpetuating macrophage survival and function within
inflammatory sites. In addition to this, elevated expression of cathepsins has repeatedly been shown
to be a marker for enhanced tumourigenicity and poor prognosis289. Given the novel role I have
identified for cathepsins in cleaving Rip1 kinase and limiting macrophage necroptosis, it is an
exciting possibility that cathepsins may function similarly to enhance resistance to necrotic cell
death within cancer cells. Furthermore, using cathepsin inhibition to target macrophage function may
represent a novel treatment modality for both cancer and inflammatory diseases.
156
6.0 CONCLUSION
In this doctoral work I have presented novel insights into the regulation of cell death mechanisms
across different cell types, and different models of cell death in vivo and in vitro. In CD8+ T cells, we
show that caspase-3 is activated by antigen presentation. We also show that elevated expression of
active caspase-3 is progressively lost throughout proliferation and differentiation of antigen
stimulated CD8+ T cells both in vitro and in vivo. We also support a model wherein caspase-3 does
not play a significant role in the removal of antigen specific T cells during contraction. At this time,
it remains unclear what the exact purpose of caspase activation is in the process of T cell activation,
but it appears that inhibition of caspases does lead to increased cell death. This work was published
in 2010 in PLoS One364. While we realized that interaction with necroptosis was likely an important
factor at the time, understanding of the mechanisms that regulated necroptosis were relatively naïve
at the time, and still remain somewhat so.
Thus, in order to learn more about how Rip1 and Rip3 were regulated, we launched a project to
investigate necroptosis in the much better characterized system of macrophage cell death. In
studying this model, we provided novel evidence for the regulation of the necrosome by cIAPs. We
show that cIAP1 and cIAP2 redundantly regulate necroptosis in macrophage cells. Through inducing
a constitutive degradation of Rip1 and Rip3, the cIAPs limit the activation of the necrosome,
cytokine production and cell death. We finally showed that loss of cIAP1 or cIAP2 activity leads to
enhanced death of macrophages in vivo, and compromises immune responses to intracellular
bacteria. This work was published in Cell Death and Differentiation in 2012365. This work has
important implications for the understanding of SMAC mimetics, which are being hotly pursued as
157
cancer therapies. Better understanding of how cIAPs regulate the necrosome may lead to new
synergistic strategies to kill cancer cells.
We next investigated the role of necroptosis in Salmonella typhimurium, quickly realizing that
necroptotic cell death of macrophages might be a significant consideration in this infection model as
well. Rebecca Mulligan and Dr. Nirmal Robinson were working on the role of IFNAR in Salmonella
infection at this time. The realization that type-I interferon can induce necroptosis in macrophages
was instantly a very exciting proposition. Key work to show the specific role of IFNAR in activating
Rip1 phosphorylation was performed in collaboration with Dr. Robinson. We published the paper
“Type I interferon induces necroptosis in macrophages during infection with Salmonella
enterica serovar typhimurium” in 2012 in Nature Immunology285.
The work showing that IFNAR is also required for LPS/zVAD-induced necroptosis is very recent
work. In vivo work showing a stark difference in reaction to LPS/zVAD treatment in IFNAR and
WT mice led us to recognize that interferon-induced necroptosis may be a key mechanism in the
pathology of septic shock. This work is currently ongoing in collaboration with Justyna Startek and
Erin Cessford, graduate students in the lab of Dr.Sad. We have made several key discoveries in
regards to the regulation of necrosome activity by type-I interferon signaling, and we hope to publish
this work in the near future. This work not only has the exciting potential to transform the current
understanding of sepsis, but will also lead to new understanding of the mechanism of type-I
interferons in general, as outlined in the discussion section.
The final section of the project was initiated in late 2011, following my observation of key
cleavage bands of Rip1, which disappeared with zVAD treatment. We provide highly novel
evidence that cysteine cathepsins are implicated in the regulatory cleavage of Rip1 kinase activity.
Only by inhibiting both caspase-8 and cathepsins can necroptosis be-induced efficiently within
158
macrophages. The work to show that recombinant Rip1 can be directly cleaved by cathepsins was
performed in collaboration with Dr. Bojan Shutinoski. Significant technical help was also received
from Susan Thurston for this project. We are currently making efforts to identify the specific
cleavage sites targeted by the cathepsin proteases. We have prepared the manuscript for this project
and hope to submit it soon. This work may have important implications for the understanding of
inflammation and cancer, as elevated expression of cathepsins has been consistently associated with
these pathologies.
In follow up to the project presented here, I feel it would be highly interesting to return to the
model of CD8+ T cell activation. Having become relatively adept at identifying the phosphorylation
states of Rip1 and Rip3 kinases, it would be intriguing to examine what effect various stimuli have
on Rip activity within CD8+ T cells. The application of specific inhibitors of caspases and other
pathways could also be helpful in interrogating the glaring question – Why are caspases activated in
proliferating and differentiating cells? There are also interesting connections between caspases, the
necrosome and cellular metabolism, which could lead to interesting work.
Immune cells have the ability to rapidly proliferate in response to pathogens or cellular damage.
At the same time immune cells must maintain a balance to prevent their own overgrowth, and
remove cells if and when they are no longer needed. This is why immune cells have evolved a
specialized balance of cell death, not typically seen in other cells of the body. It is for this reason that
my own study of cell death in immune cells has so often led to unexpected and surprising results.
While this paradoxical nature has often been confounding, it has also made for an exciting scientific
project. Through my work with Dr. Sad, I hope that we have been able to add some small pieces to
scientific understanding of cell death and immune function.
159
REFERENCES
1. Engelberg-Kulka, H., Amitai, S., Kolodkin-Gal, I. & Hazan, R. Bacterial Programmed Cell Death and Multicellular Behavior in Bacteria. PLoS Genet 2, e135 (2006).
2. Lewis, K. Programmed Death in Bacteria. Microbiol. Mol. Biol. Rev. 64, 503–514 (2000). 3. Rock, K. L. & Kono, H. The inflammatory response to cell death. Annu Rev Pathol 3, 99–126
(2008). 4. Falk, M. et al. Caspase inhibition blocks human T cell proliferation by suppressing appropriate
regulation of IL-2, CD25, and cell cycle-associated proteins. Journal of Immunology 173, 5077–5085 (2004).
5. Lamkanfi, M., Festjens, N., Declercq, W., Berghe, T. V. & Vandenabeele, P. Caspases in cell survival, proliferation and differentiation. Cell Death and Differentiation 14, 44–55 (2007).
6. Badovinac, V. P., Porter, B. B. & Harty, J. T. Programmed contraction of CD8+ T cells after infection. Nature Immunology 3, 619–626 (2002).
7. Weant, A. E. et al. Apoptosis Regulators Bim and Fas Function Concurrently to Control Autoimmunity and CD8+ T Cell Contraction. Immunity 28, 218–230 (2008).
8. Janeway, C. A. & Medzhitov, R. Innate Immune Recognition. Annu. Rev. Immunol. 20, 197–216 (2002).
9. Murphy, K. P., Travers, P., Walport, M. & Janeway, C. Janeway’s immunobiology. (Garland Science, 2008).
10. Champion, J. A., Walker, A. & Mitragotri, S. Role of particle size in phagocytosis of polymeric microspheres. Pharm. Res. 25, 1815–1821 (2008).
11. Aderem, A. & Underhill, D. M. Mechanisms of Phagocytosis in Macrophages. Annual Review of Immunology 17, 593–623 (1999).
12. Takeuchi, O. & Akira, S. Pattern Recognition Receptors and Inflammation. Cell 140, 805–820 (2010).
13. Murray, P. J. & Wynn, T. A. Protective and pathogenic functions of macrophage subsets. Nat Rev Immunol 11, 723–737 (2011).
14. Soehnlein, O. & Lindbom, L. Phagocyte partnership during the onset and resolution of inflammation. Nature Reviews Immunology 10, 427–439 (2010).
15. LeVine, A. M., Reed, J. A., Kurak, K. E., Cianciolo, E. & Whitsett, J. A. GM-CSF-deficient mice are susceptible to pulmonary group B streptococcal infection. J. Clin. Invest. 103, 563–569 (1999).
16. Zhan, Y., Lieschke, G. J., Grail, D., Dunn, A. R. & Cheers, C. Essential roles for granulocyte-macrophage colony-stimulating factor (GM-CSF) and G-CSF in the sustained hematopoietic response of Listeria monocytogenes-infected mice. Blood 91, 863–869 (1998).
17. Burnett, S. H. et al. Conditional macrophage ablation in transgenic mice expressing a Fas-based suicide gene. J Leukoc Biol 75, 612–623 (2004).
18. O’Brien, A. D., Metcalf, E. S. & Rosenstreich, D. L. Defect in macrophage effector function confers Salmonella typhimurium susceptibility on C3H/HeJ mice. Cellular Immunology 67, 325–333 (1982).
19. O’Brien, A. D., Scher, I. & Formal, S. B. Effect of silica on the innate resistance of inbred mice to Salmonella typhimurium infection. Infect. Immun. 25, 513–520 (1979).
20. Hamano, S. et al. Role of macrophages in acute murine cytomegalovirus infection. Microbiol. Immunol. 42, 607–616 (1998).
160
21. Roscic-Mrkic, B. et al. Roles of Macrophages in Measles Virus Infection of Genetically Modified Mice. J Virol 75, 3343–3351 (2001).
22. Fink, K. et al. Depletion of macrophages in mice results in higher dengue virus titers and highlights the role of macrophages for virus control. Eur. J. Immunol. 39, 2809–2821 (2009).
23. Mishalian, I. et al. Recruited macrophages control dissemination of group A Streptococcus from infected soft tissues. J. Immunol. 187, 6022–6031 (2011).
24. Salcedo, S. P., Noursadeghi, M., Cohen, J. & Holden, D. W. Intracellular replication of Salmonella typhimurium strains in specific subsets of splenic macrophages in vivo. Cell. Microbiol. 3, 587–597 (2001).
25. Drevets, D. A. Dissemination of Listeria monocytogenes by infected phagocytes. Infect. Immun. 67, 3512–3517 (1999).
26. Moazed, T. C., Kuo, C. C., Grayston, J. T. & Campbell, L. A. Evidence of systemic dissemination of Chlamydia pneumoniae via macrophages in the mouse. J. Infect. Dis. 177, 1322–1325 (1998).
27. Kimura, T., Sasaki, M., Okumura, M., Kim, E. & Sawa, H. Flavivirus Encephalitis Pathological Aspects of Mouse and Other Animal Models. Vet Pathol 47, 806–818 (2010).
28. Short, K. R., Brooks, A. G., Reading, P. C. & Londrigan, S. L. The fate of influenza A virus after infection of human macrophages and dendritic cells. J. Gen. Virol. 93, 2315–2325 (2012).
29. Koppensteiner, H., Brack-Werner, R. & Schindler, M. Macrophages and their relevance in Human Immunodeficiency Virus Type I infection. Retrovirology 9, 82 (2012).
30. Monack, D. M., Bouley, D. M. & Falkow, S. Salmonella typhimurium persists within macrophages in the mesenteric lymph nodes of chronically infected Nramp1+/+ mice and can be reactivated by IFNgamma neutralization. J. Exp. Med. 199, 231–241 (2004).
31. Peyron, P. et al. Foamy Macrophages from Tuberculous Patients’ Granulomas Constitute a Nutrient-Rich Reservoir for M. tuberculosis Persistence. PLoS Pathog 4, e1000204 (2008).
32. Cailhier, J. F. et al. Conditional Macrophage Ablation Demonstrates That Resident Macrophages Initiate Acute Peritoneal Inflammation. J Immunol 174, 2336–2342 (2005).
33. Stoneman, V. et al. Monocyte/Macrophage Suppression in CD11b Diphtheria Toxin Receptor Transgenic Mice Differentially Affects Atherogenesis and Established Plaques. Circulation Research 100, 884–893 (2007).
34. Sone, Y., Serikov, V. B. & Staub, N. C., Sr. Intravascular macrophage depletion attenuates endotoxin lung injury in anesthetized sheep. J. Appl. Physiol. 87, 1354–1359 (1999).
35. Salkowski, C. A. et al. Effect of liposome-mediated macrophage depletion on LPS-induced cytokine gene expression and radioprotection. J Immunol 155, 3168–3179 (1995).
36. Barrera, P. et al. Synovial macrophage depletion with clodronate-containing liposomes in rheumatoid arthritis. Arthritis Rheum. 43, 1951–1959 (2000).
37. Ren, W. et al. Macrophage depletion diminishes implant-wear-induced inflammatory osteolysis in a mouse model. J Biomed Mater Res A 85, 1043–1051 (2008).
38. Monie, T. P. Activating immunity: lessons from the TLRs and NLRs. Trends in Biochemical Sciences 34, 553–561 (2009).
39. Wesche, H., Henzel, W. J., Shillinglaw, W., Li, S. & Cao, Z. MyD88: an adapter that recruits IRAK to the IL-1 receptor complex. Immunity 7, 837–847 (1997).
40. Li, S., Strelow, A., Fontana, E. J. & Wesche, H. IRAK-4: A novel member of the IRAK family with the properties of an IRAK-kinase. PNAS 99, 5567–5572 (2002).
161
41. Sun, L., Deng, L., Ea, C.-K., Xia, Z.-P. & Chen, Z. J. The TRAF6 ubiquitin ligase and TAK1 kinase mediate IKK activation by BCL10 and MALT1 in T lymphocytes. Mol. Cell 14, 289–301 (2004).
42. Bettermann, K. et al. TAK1 Suppresses a NEMO-Dependent but NF-κB-Independent Pathway to Liver Cancer. Cancer Cell 17, 481–496 (2010).
43. Perkins, N. D. Integrating cell-signalling pathways with NF-κB and IKK function. Nature Reviews Molecular Cell Biology 8, 49–62 (2007).
44. Akira, S., Uematsu, S. & Takeuchi, O. Pathogen Recognition and Innate Immunity. Cell 124, 783–801 (2006).
45. Smale, S. T. Hierarchies of NF-κB target-gene regulation. Nature Immunology 12, 689–694 (2011).
46. Honda, K. & Taniguchi, T. IRFs: master regulators of signalling by Toll-like receptors and cytosolic pattern-recognition receptors. Nature Reviews Immunology 6, 644–658 (2006).
47. Hanada, T. & Yoshimura, A. Regulation of cytokine signaling and inflammation. Cytokine Growth Factor Rev. 13, 413–421 (2002).
48. Feldmann, M. & Saklatvala, J. Proinflammatory cytokines. Cytokine Ref 1, 291–305 (2001). 49. Yoshimura, A., Naka, T. & Kubo, M. SOCS proteins, cytokine signalling and immune
regulation. Nature Reviews Immunology 7, 454–465 (2007). 50. Murdoch, C., Muthana, M. & Lewis, C. E. Hypoxia Regulates Macrophage Functions in
Inflammation. The Journal of Immunology 175, 6257 –6263 (2005). 51. Dehne, N. & Brüne, B. HIF-1 in the inflammatory microenvironment. Experimental Cell
Research 315, 1791–1797 (2009). 52. Ando, M. et al. Interleukin 6 enhances glycolysis through expression of the glycolytic enzymes
hexokinase 2 and 6-phosphofructo-2-kinase/fructose-2,6-bisphosphatase-3. J Nippon Med Sch 77, 97–105 (2010).
53. Berg, S., Sappington, P. L., Guzik, L. J., Delude, R. L. & Fink, M. P. Proinflammatory cytokines increase the rate of glycolysis and adenosine-5’-triphosphate turnover in cultured rat enterocytes. Crit. Care Med 31, 1203–1212 (2003).
54. Ben-Shlomo, I. et al. Interleukin (IL)-1beta increases glucose uptake and induces glycolysis in aerobically cultured rat ovarian cells: evidence that IL-1beta may mediate the gonadotropin-induced midcycle metabolic shift. Endocrinology 138, 2680–2688 (1997).
55. Kominsky, D. J., Campbell, E. L. & Colgan, S. P. Metabolic Shifts in Immunity and Inflammation. The Journal of Immunology 184, 4062 –4068 (2010).
56. Matarese, G. & La Cava, A. The intricate interface between immune system and metabolism. Trends in Immunology 25, 193–200 (2004).
57. Vander Heiden, M. G., Cantley, L. C. & Thompson, C. B. Understanding the Warburg Effect: The Metabolic Requirements of Cell Proliferation. Science 324, 1029–1033 (2009).
58. Buchakjian, M. R. & Kornbluth, S. The engine driving the ship: metabolic steering of cell proliferation and death. Nat Rev Mol Cell Biol 11, 715–727 (2010).
59. Forman, H. J. & Torres, M. Reactive Oxygen Species and Cell Signaling: Respiratory Burst in Macrophage Signaling. Am. J. Respir. Crit. Care Med. 166, S4–8 (2002).
60. Thannickal, V. J. & Fanburg, B. L. Reactive oxygen species in cell signaling. American Journal of Physiology - Lung Cellular and Molecular Physiology 279, L1005 –L1028 (2000).
61. Halliwell, B. in eLS (John Wiley & Sons, Ltd, 2001). at <http://onlinelibrary.wiley.com/doi/10.1038/npg.els.0003913/abstract>
162
62. Naik, E. & Dixit, V. M. Mitochondrial reactive oxygen species drive proinflammatory cytokine production. J Exp Med 208, 417–420 (2011).
63. Wen, H., Ting, J. P.-Y. & O’Neill, L. A. J. A role for the NLRP3 inflammasome in metabolic diseases—did Warburg miss inflammation? Nature Immunology 13, 352–357 (2012).
64. Henninger, D. D. et al. Cytokine-induced VCAM-1 and ICAM-1 expression in different organs of the mouse. J Immunol 158, 1825–1832 (1997).
65. Osiak, A., Utermöhlen, O., Niendorf, S., Horak, I. & Knobeloch, K.-P. ISG15, an interferon-stimulated ubiquitin-like protein, is not essential for STAT1 signaling and responses against vesicular stomatitis and lymphocytic choriomeningitis virus. Mol. Cell. Biol. 25, 6338–6345 (2005).
66. Lenschow, D. J. et al. Identification of interferon-stimulated gene 15 as an antiviral molecule during Sindbis virus infection in vivo. J. Virol. 79, 13974–13983 (2005).
67. Silverman, R. H. Viral encounters with 2’,5’-oligoadenylate synthetase and RNase L during the interferon antiviral response. J. Virol. 81, 12720–12729 (2007).
68. Sadler, A. J. & Williams, B. R. G. Interferon-inducible antiviral effectors. Nat. Rev. Immunol. 8, 559–568 (2008).
69. Chawla-Sarkar, M. et al. Apoptosis and interferons: role of interferon-stimulated genes as mediators of apoptosis. Apoptosis 8, 237–249 (2003).
70. Fuertes Marraco, S. A. et al. Type I Interferon Drives Dendritic Cell Apoptosis via Multiple BH3-Only Proteins following Activation by PolyIC In Vivo. PLoS ONE 6, e20189 (2011).
71. Lokshin, A., Mayotte, J. E. & Levitt, M. L. Mechanism of Interferon Beta-Induced Squamous Differentiation and Programmed Cell Death in Human Non—Small—Cell Lung Cancer Cell Lines. JNCI J Natl Cancer Inst 87, 206–212 (1995).
72. Juang, S.-H. et al. IFN-beta induces caspase-mediated apoptosis by disrupting mitochondria in human advanced stage colon cancer cell lines. J. Interferon Cytokine Res. 24, 231–243 (2004).
73. Zychlinsky, A. & Sansonetti, P. Perspectives series: host/pathogen interactions. Apoptosis in bacterial pathogenesis. J Clin Invest 100, 493–495 (1997).
74. Hilbi, H., Zychlinsky, A. & Sansonetti, P. J. Macrophage apoptosis in microbial infections. Parasitology 115 Suppl, S79–87 (1997).
75. Sansonetti, P. J. et al. Caspase-1 activation of IL-1beta and IL-18 are essential for Shigella flexneri-induced inflammation. Immunity 12, 581–590 (2000).
76. Monack, D. M., Detweiler, C. S. & Falkow, S. Salmonella pathogenicity island 2-dependent macrophage death is mediated in part by the host cysteine protease caspase-1. Cell. Microbiol. 3, 825–837 (2001).
77. Franchi, L., Eigenbrod, T., Muñoz-Planillo, R. & Nuñez, G. The inflammasome: a caspase-1-activation platform that regulates immune responses and disease pathogenesis. Nat Immunol 10, 241–247 (2009).
78. Fink, S. L. & Cookson, B. T. Apoptosis, Pyroptosis, and Necrosis: Mechanistic Description of Dead and Dying Eukaryotic Cells. Infect Immun 73, 1907–1916 (2005).
79. D M Monack, D. H. Salmonella exploits caspase-1 to colonize Peyer's patches in a murine typhoid model. The Journal of experimental medicine 192, 249–58 (2000).
80. Lara-Tejero, M. et al. Role of the caspase-1 inflammasome in Salmonella typhimurium pathogenesis. J. Exp. Med. 203, 1407–1412 (2006).
163
81. Raupach, B., Peuschel, S.-K., Monack, D. M. & Zychlinsky, A. Caspase-1-Mediated Activation of Interleukin-1? (IL-1?) and IL-18 Contributes to Innate Immune Defenses against Salmonella enterica Serovar Typhimurium Infection. Infect Immun 74, 4922–4926 (2006).
82. Bergsbaken, T., Fink, S. L. & Cookson, B. T. Pyroptosis: host cell death and inflammation. Nat Rev Microbiol 7, 99–109 (2009).
83. Ichinohe, T., Lee, H. K., Ogura, Y., Flavell, R. & Iwasaki, A. Inflammasome recognition of influenza virus is essential for adaptive immune responses. J Exp Med 206, 79–87 (2009).
84. Broz, P. et al. Caspase-11 increases susceptibility to Salmonella infection in the absence of caspase-1. Nature 490, 288–291 (2012).
85. Hueffer, K. & Galán, J. E. Salmonella-induced macrophage death: multiple mechanisms, different outcomes. Cellular Microbiology 6, 1019–1025 (2004).
86. Hsu, L.-C. et al. The protein kinase PKR is required for macrophage apoptosis after activation of Toll-like receptor 4. Nature 428, 341–345 (2004).
87. Stockinger, S. et al. Production of type I IFN sensitizes macrophages to cell death induced by Listeria monocytogenes. J. Immunol. 169, 6522–6529 (2002).
88. Rayamajhi, M., Humann, J., Penheiter, K., Andreasen, K. & Lenz, L. L. Induction of IFN-αβ enables Listeria monocytogenes to suppress macrophage activation by IFN-γ. J Exp Med 207, 327–337 (2010).
89. Haring, J. S., Badovinac, V. P. & Harty, J. T. Inflaming the CD8+ T cell response. Immunity 25, 19–29 (2006).
90. Russell, J. H. & Ley, T. J. Lymphocyte-Mediated Cytotoxicity. Annual Review of Immunology 20, 323–370 (2002).
91. Porter, B. B. & Harty, J. T. The Onset of CD8+-T-Cell Contraction Is Influenced by the Peak of Listeria monocytogenes Infection and Antigen Display. Infect Immun 74, 1528–1536 (2006).
92. Harrington, L. E., Most Rv, R. van der, Whitton, J. L. & Ahmed, R. Recombinant vaccinia virus-induced T-cell immunity: quantitation of the response to the virus vector and the foreign epitope. J. Virol. 76, 3329–3337 (2002).
93. Flynn, K. J. et al. Virus-specific CD8+ T cells in primary and secondary influenza pneumonia. Immunity 8, 683–691 (1998).
94. Butz, E. A. & Bevan, M. J. Massive expansion of antigen-specific CD8+ T cells during an acute virus infection. Immunity 8, 167–175 (1998).
95. Huster, K. M. et al. Unidirectional development of CD8+ central memory T cells into protective Listeria-specific effector memory T cells. Eur. J. Immunol. 36, 1453–1464 (2006).
96. Cohen, P. L. & Eisenberg, R. A. Lpr and gld: single gene models of systemic autoimmunity and lymphoproliferative disease. Annu. Rev. Immunol. 9, 243–269 (1991).
97. Salmena, L. et al. Essential role for caspase 8 in T-cell homeostasis and T-cell-mediated immunity. Genes Dev. 17, 883–895 (2003).
98. Zhang, J., Kabra, N. H., Cado, D., Kang, C. & Winoto, A. FADD-deficient T cells exhibit a disaccord in regulation of the cell cycle machinery. J. Biol. Chem. 276, 29815–29818 (2001).
99. Chun, H. J. et al. Pleiotropic defects in lymphocyte activation caused by caspase-8 mutations lead to human immunodeficiency. Nature 419, 395–399 (2002).
100. Kuranaga, E. & Miura, M. Nonapoptotic functions of caspases: caspases as regulatory molecules for immunity and cell-fate determination. Trends in Cell Biology 17, 135–144 (2007).
164
101. Fernando, P., Kelly, J. F., Balazsi, K., Slack, R. S. & Megeney, L. A. Caspase 3 activity is required for skeletal muscle differentiation. PNAS 99, 11025–11030 (2002).
102. Sordet, O. et al. Specific involvement of caspases in the differentiation of monocytes into macrophages. Blood 100, 4446–4453 (2002).
103. Zermati, Y. et al. Caspase Activation Is Required for Terminal Erythroid Differentiation. J Exp Med 193, 247–254 (2001).
104. Ch’en, I. L. et al. Antigen-mediated T cell expansion regulated by parallel pathways of death. Proceedings of the National Academy of Sciences of the United States of America 105, 17463–17468 (2008).
105. Ch’en, I. L., Tsau, J. S., Molkentin, J. D., Komatsu, M. & Hedrick, S. M. Mechanisms of necroptosis in T cells. J Exp Med 208, 633–641 (2011).
106. Kaiser, W. J. et al. RIP3 mediates the embryonic lethality of caspase-8-deficient mice. Nature 471, 368–372 (2011).
107. Kennedy, N. J., Kataoka, T., Tschopp, J. & Budd, R. C. Caspase activation is required for T cell proliferation. J. Exp. Med. 190, 1891–1896 (1999).
108. Sabbagh, L., Bourbonnière, M., Sékaly, R.-P. & Cohen, L. Y. Selective up-regulation of caspase-3 gene expression following TCR engagement. Mol. Immunol. 42, 1345–1354 (2005).
109. Nussbaum, A. K. & Whitton, J. L. The contraction phase of virus-specific CD8+ T cells is unaffected by a pan-caspase inhibitor. J. Immunol. 173, 6611–6618 (2004).
110. Prlic, M. & Bevan, M. J. Exploring regulatory mechanisms of CD8+ T cell contraction. PNAS 105, 16689–16694 (2008).
111. Pellegrini, M., Belz, G., Bouillet, P. & Strasser, A. Shutdown of an acute T cell immune response to viral infection is mediated by the proapoptotic Bcl-2 homology 3-only protein Bim. PNAS 100, 14175–14180 (2003).
112. Erlacher, M. et al. Puma cooperates with Bim, the rate-limiting BH3-only protein in cell death during lymphocyte development, in apoptosis induction. J Exp Med 203, 2939–2951 (2006).
113. Hughes, P. D. et al. Apoptosis Regulators Fas and Bim Cooperate in Shutdown of Chronic Immune Responses and Prevention of Autoimmunity. Immunity 28, 197–205 (2008).
114. Hutcheson, J. et al. Combined Deficiency of Proapoptotic Regulators Bim and Fas Results in the Early Onset of Systemic Autoimmunity. Immunity 28, 206–217 (2008).
115. Majno, G. & Joris, I. Apoptosis, oncosis, and necrosis. An overview of cell death. Am J Pathol 146, 3–15 (1995).
116. Oke, W. S. Practical Observations on Necrosis in the Long Bones. Prov Med Surg J 8, 248–250 (1844).
117. Partington, C. F. The British cyclopædia of the arts and sciences. (Orr & Smith, 1835). 118. Heubner, O. Experimental diphtheria. (G.S. Davis, 1885). 119. Majno, G. & Joris, I. Apoptosis, oncosis, and necrosis. An overview of cell death. Am J Pathol
146, 3–15 (1995). 120. Flemming, W. Flemming W: Uber die Bildung von Richtungsfiguren in Saugethiereiern beim
Untergang Graaf’scher Follikel. Arch Anat EntwGesch 221–244 (1885). 121. Kerr, J. F. R., Wyllie, A. H. & Currie, A. R. Apoptosis: A Basic Biological Phenomenon with
Wide-ranging Implications in Tissue Kinetics. Br J Cancer 26, 239–257 (1972). 122. Festjens, N., Vanden Berghe, T. & Vandenabeele, P. Necrosis, a well-orchestrated form of cell
demise: signalling cascades, important mediators and concomitant immune response. Biochim. Biophys. Acta 1757, 1371–1387 (2006).
165
123. Kroemer, G. et al. Classification of cell death: recommendations of the Nomenclature Committee on Cell Death 2009. Cell Death Differ 16, 3–11 (2008).
124. Elmore, S. Apoptosis: A Review of Programmed Cell Death. Toxicol Pathol 35, 495–516 (2007).
125. Zhang, J. H. & Xu, M. DNA fragmentation in apoptosis. Cell Research 10, 205–211 (2000). 126. Silva, M. T. Secondary necrosis: The natural outcome of the complete apoptotic program.
FEBS Letters 584, 4491–4499 (2010). 127. Guicciardi, M. E. & Gores, G. J. Life and death by death receptors. FASEB J 23, 1625–1637
(2009). 128. Ashkenazi, A. Targeting death and decoy receptors of the tumour-necrosis factor superfamily.
Nature Reviews Cancer 2, 420–430 (2002). 129. Valmiki, M. G. & Ramos, J. W. Death effector domain-containing proteins. Cell. Mol. Life Sci.
66, 814–830 (2009). 130. Scott, F. L. et al. The Fas–FADD death domain complex structure unravels signalling by
receptor clustering. Nature 457, 1019–1022 (2008). 131. Dickens, L. S., Powley, I. R., Hughes, M. A. & MacFarlane, M. The ‘complexities’ of life and
death: Death receptor signalling platforms. Experimental Cell Research 318, 1269–1277 (2012).
132. Varfolomeev, E. et al. Molecular determinants of kinase pathway activation by Apo2 ligand/tumor necrosis factor-related apoptosis-inducing ligand. J. Biol. Chem. 280, 40599–40608 (2005).
133. Kang, T.-B. et al. Mutation of a Self-Processing Site in Caspase-8 Compromises Its Apoptotic but Not Its Nonapoptotic Functions in Bacterial Artificial Chromosome-Transgenic Mice. J Immunol 181, 2522–2532 (2008).
134. Yang, S., Thor, A. D., Edgerton, S. & Yang, X. Caspase-3 mediated feedback activation of apical caspases in doxorubicin and TNF-α induced apoptosis. Apoptosis 11, 1987–1997 (2006).
135. Kominami, K. et al. In Vivo Imaging of Hierarchical Spatiotemporal Activation of Caspase-8 during Apoptosis. PLoS ONE 7, e50218 (2012).
136. Baud, V. & Karin, M. Signal transduction by tumor necrosis factor and its relatives. Trends Cell Biol. 11, 372–377 (2001).
137. Micheau, O. & Tschopp, J. Induction of TNF Receptor I-Mediated Apoptosis via Two Sequential Signaling Complexes. Cell 114, 181–190 (2003).
138. Festjens, N., Vanden Berghe, T., Cornelis, S. & Vandenabeele, P. RIP1, a kinase on the crossroads of a cell’s decision to live or die. Cell Death Differ 14, 400–410
139. Ea, C.-K., Deng, L., Xia, Z.-P., Pineda, G. & Chen, Z. J. Activation of IKK by TNFalpha requires site-specific ubiquitination of RIP1 and polyubiquitin binding by NEMO. Mol. Cell 22, 245–257 (2006).
140. Zhang, H. et al. Functional complementation between FADD and RIP1 in embryos and lymphocytes. Nature 471, 373–376 (2011).
141. Wong, W. W.-L. et al. RIPK1 is not essential for TNFR1-induced activation of NF-kappaB. Cell Death Differ 17, 482–487 (2010).
142. Varfolomeev, E. et al. IAP Antagonists Induce Autoubiquitination of c-IAPs, NF-[kappa]B Activation, and TNF[alpha]-Dependent Apoptosis. Cell 131, 669–681 (2007).
143. Vince, J. E. et al. IAP Antagonists Target cIAP1 to Induce TNFα-Dependent Apoptosis. Cell 131, 682–693 (2007).
166
144. Petersen, S. L. et al. Autocrine TNFα Signaling Renders Human Cancer Cells Susceptible to Smac-Mimetic-Induced Apoptosis. Cancer Cell 12, 445–456 (2007).
145. Gyrd-Hansen, M. & Meier, P. IAPs: from caspase inhibitors to modulators of NF-kappaB, inflammation and cancer. Nat. Rev. Cancer 10, 561–574 (2010).
146. Annunziata, C. M. et al. Frequent Engagement of the Classical and Alternative NF-κB Pathways by Diverse Genetic Abnormalities in Multiple Myeloma. Cancer Cell 12, 115–130 (2007).
147. Zhang, S. Q., Kovalenko, A., Cantarella, G. & Wallach, D. Recruitment of the IKK signalosome to the p55 TNF receptor: RIP and A20 bind to NEMO (IKKgamma) upon receptor stimulation. Immunity 12, 301–311 (2000).
148. Wang, L., Du, F. & Wang, X. TNF-α Induces Two Distinct Caspase-8 Activation Pathways. Cell 133, 693–703 (2008).
149. Chang, D. W. et al. c-FLIPL is a dual function regulator for caspase-8 activation and CD95-mediated apoptosis. EMBO J 21, 3704–3714 (2002).
150. Dillon, C. P. et al. Survival function of the FADD-CASPASE-8-cFLIPL complex. Cell Rep 1, 401–407 (2012).
151. Oberst, A. et al. Inducible Dimerization and Inducible Cleavage Reveal a Requirement for Both Processes in Caspase-8 Activation. Journal of Biological Chemistry 285, 16632–16642 (2010).
152. Roos, W. P. & Kaina, B. DNA damage-induced cell death by apoptosis. Trends in Molecular Medicine 12, 440–450 (2006).
153. Amaral, J. D., Xavier, J. M., Steer, C. J. & Rodrigues, C. M. The Role of p53 in Apoptosis. Discovery Medicine 9, 145–152 (2010).
154. Tissue and cell-specific expression of the p53-target genes: bax, fas, mdm2 and waf1/p21, before and following ionising irradiation in mice. Oncogene 19, (2000).
155. Reed, J. C. et al. BCL-2 family proteins: Regulators of cell death involved in the pathogenesis of cancer and resistance to therapy. Journal of Cellular Biochemistry 60, 23–32 (1996).
156. Taylor, R. C., Cullen, S. P. & Martin, S. J. Apoptosis: controlled demolition at the cellular level. Nat Rev Mol Cell Biol 9, 231–241 (2008).
157. Nomura, M. et al. 14-3-3 Interacts Directly with and Negatively Regulates Pro-apoptotic Bax. J. Biol. Chem. 278, 2058–2065 (2003).
158. Strasser, A. The role of BH3-only proteins in the immune system. Nature Reviews Immunology 5, 189–200 (2005).
159. Walensky, L. D. et al. A Stapled BID BH3 Helix Directly Binds and Activates BAX. Molecular Cell 24, 199–210 (2006).
160. Martinez-Caballero, S. et al. Assembly of the Mitochondrial Apoptosis-induced Channel, MAC. Journal of Biological Chemistry 284, 12235–12245 (2009).
161. Chipuk, J. E. & Green, D. R. How do BCL-2 proteins induce mitochondrial outer membrane permeabilization? Trends Cell Biol 18, 157–164 (2008).
162. Jiang, X. CYTOCHROME C -MEDIATED APOPTOSIS. Annual Review of Biochemistry 73, 87–106 (2004).
163. Qin, H. et al. Structural basis of procaspase-9 recruitment by the apoptotic protease-activating factor 1. Nature 399, 549–557 (1999).
164. Stennicke, H. R. et al. Caspase-9 Can Be Activated without Proteolytic Processing. J. Biol. Chem. 274, 8359–8362 (1999).
167
165. Malladi, S., Challa-Malladi, M., Fearnhead, H. O. & Bratton, S. B. The Apaf-1•procaspase-9 apoptosome complex functions as a proteolytic-based molecular timer. EMBO J 28, 1916–1925 (2009).
166. Ellis, H. M. & Horvitz, H. R. Genetic control of programmed cell death in the nematode C. elegans. Cell 44, 817–829 (1986).
167. Yuan, J., Shaham, S., Ledoux, S., Ellis, H. M. & Horvitz, H. R. The C. elegans cell death gene ced-3 encodes a protein similar to mammalian interleukin-1β-converting enzyme. Cell 75, 641–652 (1993).
168. Alnemri, E. S. et al. Human ICE/CED-3 Protease Nomenclature. Cell 87, 171 (1996). 169. Le, D. A. et al. Caspase activation and neuroprotection in caspase-3- deficient mice after in
vivo cerebral ischemia and in vitro oxygen glucose deprivation. Proc. Natl. Acad. Sci. U.S.A. 99, 15188–15193 (2002).
170. Leonard, J. R., Klocke, B. J., D’Sa, C., Flavell, R. A. & Roth, K. A. Strain-dependent neurodevelopmental abnormalities in caspase-3-deficient mice. J. Neuropathol. Exp. Neurol. 61, 673–677 (2002).
171. Zheng, T. S. et al. Caspase-3 controls both cytoplasmic and nuclear events associated with Fas-mediated apoptosis in vivo. PNAS 95, 13618–13623 (1998).
172. Lakhani, S. A. et al. Caspases 3 and 7: key mediators of mitochondrial events of apoptosis. Science 311, 847–851 (2006).
173. Fischer, U., Jänicke, R. U. & Schulze-Osthoff, K. Many cuts to ruin: a comprehensive update of caspase substrates. Cell Death Differ. 10, 76–100 (2003).
174. Enari, M. et al. A caspase-activated DNase that degrades DNA during apoptosis, and its inhibitor ICAD. Nature 391, 43–50 (1998).
175. Chay, K.-O., Park, S. S. & Mushinski, J. F. Linkage of caspase-mediated degradation of paxillin to apoptosis in Ba/F3 murine pro-B lymphocytes. J. Biol. Chem. 277, 14521–14529 (2002).
176. Mashima, T. et al. Actin cleavage by CPP-32/apopain during the development of apoptosis. Oncogene 14, 1007–1012 (1997).
177. Yi, C. H. & Yuan, J. The Jekyll and Hyde Functions of Caspases. Dev Cell 16, 21–34 (2009). 178. D’Amelio, M., Cavallucci, V. & Cecconi, F. Neuronal caspase-3 signaling: not only cell death.
Cell Death & Differentiation 17, 1104–1114 (2010). 179. Snigdha, S., Smith, E. D., Prieto, G. A. & Cotman, C. W. Caspase-3 activation as a bifurcation
point between plasticity and cell death. Neurosci. Bull. 28, 14–24 (2012). 180. Du, C., Fang, M., Li, Y., Li, L. & Wang, X. Smac, a Mitochondrial Protein that Promotes
Cytochrome c–Dependent Caspase Activation by Eliminating IAP Inhibition. Cell 102, 33–42 (2000).
181. Verhagen, A. M. et al. Identification of DIABLO, a Mammalian Protein that Promotes Apoptosis by Binding to and Antagonizing IAP Proteins. Cell 102, 43–53 (2000).
182. Hay, B. A., Wassarman, D. A. & Rubin, G. M. Drosophila homologs of baculovirus inhibitor of apoptosis proteins function to block cell death. Cell 83, 1253–1262 (1995).
183. Chai, J. et al. Structural and biochemical basis of apoptotic activation by Smac/DIABLO. Nature 406, 855–862 (2000).
184. Yang, Q.-H. & Du, C. Smac/DIABLO Selectively Reduces the Levels of c-IAP1 and c-IAP2 but Not That of XIAP and Livin in HeLa Cells. J. Biol. Chem. 279, 16963–16970 (2004).
168
185. Roy, N., Deveraux, Q. L., Takahashi, R., Salvesen, G. S. & Reed, J. C. The c-IAP-1 and c-IAP-2 proteins are direct inhibitors of specific caspases. EMBO J 16, 6914–6925 (1997).
186. Deveraux, Q. L., Takahashi, R., Salvesen, G. S. & Reed, J. C. X-linked IAP is a direct inhibitor of cell-death proteases. Nature 388, 300–304 (1997).
187. Wei, Y., Fan, T. & Yu, M. Inhibitor of apoptosis proteins and apoptosis. Acta Biochimica et Biophysica Sinica 40, 278–288 (2008).
188. Bertrand, M. J. M. et al. cIAP1 and cIAP2 Facilitate Cancer Cell Survival by Functioning as E3 Ligases that Promote RIP1 Ubiquitination. Molecular Cell 30, 689–700 (2008).
189. Mahoney, D. J. et al. Both cIAP1 and cIAP2 regulate TNFα-mediated NF-κB activation. PNAS 105, 11778–11783 (2008).
190. Huang, H. k et al. The inhibitor of apoptosis, cIAP2, functions as a ubiquitin-protein ligase and promotes in vitro monoubiquitination of caspases 3 and 7. J. Biol. Chem. 275, 26661–26664 (2000).
191. Lin, W.-W. & Karin, M. A cytokine-mediated link between innate immunity, inflammation, and cancer. Journal of Clinical Investigation 117, 1175–1183 (2007).
192. LaCasse, E. C. et al. IAP-targeted therapies for cancer. Oncogene 27, 6252–6275 (2008). 193. Gaither, A. et al. A Smac Mimetic Rescue Screen Reveals Roles for Inhibitor of Apoptosis
Proteins in Tumor Necrosis Factor-α Signaling. Cancer Res 67, 11493–11498 (2007). 194. Christofferson, D. E. & Yuan, J. Necroptosis as an alternative form of programmed cell death.
Curr. Opin. Cell Biol 22, 263–268 (2010). 195. Proskuryakov, S. Y., Konoplyannikov, A. G. & Gabai, V. L. Necrosis: A specific form of
programmed cell death? Experimental Cell Research 283, 1–16 (2003). 196. Slee, E. A. et al. Benzyloxycarbonyl-Val-Ala-Asp (OMe) fluoromethylketone (Z-VAD.FMK)
inhibits apoptosis by blocking the processing of CPP32. Biochem J 315, 21–24 (1996). 197. Vercammen, D. et al. Inhibition of Caspases Increases the Sensitivity of L929 Cells to Necrosis
Mediated by Tumor Necrosis Factor. J Exp Med 187, 1477–1485 (1998). 198. Matsumura, H. et al. Necrotic death pathway in Fas receptor signaling. J. Cell Biol. 151, 1247–
1256 (2000). 199. Chautan, M., Chazal, G., Cecconi, F., Gruss, P. & Golstein, P. Interdigital cell death can occur
through a necrotic and caspase-independent pathway. Current Biology 9, 967–S1 (1999). 200. Khwaja, A. & Tatton, L. Resistance to the cytotoxic effects of tumor necrosis factor alpha can
be overcome by inhibition of a FADD/caspase-dependent signaling pathway. J. Biol. Chem. 274, 36817–36823 (1999).
201. Lüschen, S., Ussat, S., Scherer, G., Kabelitz, D. & Adam-Klages, S. Sensitization to death receptor cytotoxicity by inhibition of fas-associated death domain protein (FADD)/caspase signaling. Requirement of cell cycle progression. J. Biol. Chem. 275, 24670–24678 (2000).
202. Mocarski, E. S., Upton, J. W. & Kaiser, W. J. Viral infection and the evolution of caspase 8-regulated apoptotic and necrotic death pathways. Nature Reviews Immunology 12, 79–88 (2012).
203. Holler, N. et al. Fas triggers an alternative, caspase-8-independent cell death pathway using the kinase RIP as effector molecule. Nat. Immunol. 1, 489–495 (2000).
204. Degterev, A. et al. Chemical inhibitor of nonapoptotic cell death with therapeutic potential for ischemic brain injury. Nature chemical biology 1, 112–119 (2005).
205. Degterev, A. et al. Identification of RIP1 kinase as a specific cellular target of necrostatins. Nature Chemical Biology 4, 313–321 (2008).
169
206. Cho, Y. et al. Phosphorylation-Driven Assembly of the RIP1-RIP3 Complex Regulates Programmed Necrosis and Virus-Induced Inflammation. Cell 137, 1112–1123 (2009).
207. Feoktistova, M. et al. cIAPs Block Ripoptosome Formation, a RIP1/Caspase-8 Containing Intracellular Cell Death Complex Differentially Regulated by cFLIP Isoforms. Mol Cell 43, 449–463 (2011).
208. O’Donnell, M. A. et al. Caspase 8 inhibits programmed necrosis by processing CYLD. Nature Cell Biology 13, 1437–1442 (2011).
209. Declercq, W., Vanden Berghe, T. & Vandenabeele, P. RIP Kinases at the Crossroads of Cell Death and Survival. Cell 138, 229–232 (2009).
210. Hitomi, J. et al. Identification of a Molecular Signaling Network that Regulates a Cellular Necrotic Cell Death Pathway. Cell 135, 1311–1323 (2008).
211. Vandenabeele, P., Galluzzi, L., Vanden Berghe, T. & Kroemer, G. Molecular mechanisms of necroptosis: an ordered cellular explosion. Nat Rev Mol Cell Biol 11, 700–714 (2010).
212. Vanlangenakker, N., Bertrand, M. J. M., Bogaert, P., Vandenabeele, P. & Vanden Berghe, T. TNF-induced necroptosis in L929 cells is tightly regulated by multiple TNFR1 complex I and II members. Cell Death Dis 2, e230 (2011).
213. Tenev, T. et al. The Ripoptosome, a Signaling Platform that Assembles in Response to Genotoxic Stress and Loss of IAPs. Molecular Cell 43, 432–448 (2011).
214. Moujalled, D. M. et al. TNF can activate RIPK3 and cause programmed necrosis in the absence of RIPK1. Cell Death Dis 4, e465 (2013).
215. Moquin, D. & Chan, F. K.-M. The molecular regulation of programmed necrotic cell injury. Trends Biochem. Sci. 35, 434–441 (2010).
216. Li, J. et al. The RIP1/RIP3 necrosome forms a functional amyloid signaling complex required for programmed necrosis. Cell 150, 339–350 (2012).
217. Wang, Z., Jiang, H., Chen, S., Du, F. & Wang, X. The Mitochondrial Phosphatase PGAM5 Functions at the Convergence Point of Multiple Necrotic Death Pathways. Cell 148, 228–243 (2012).
218. Temkin, V., Huang, Q., Liu, H., Osada, H. & Pope, R. M. Inhibition of ADP/ATP Exchange in Receptor-Interacting Protein-Mediated Necrosis. Mol. Cell. Biol. 26, 2215–2225 (2006).
219. Nakagawa, T. et al. Cyclophilin D-dependent mitochondrial permeability transition regulates some necrotic but not apoptotic cell death. Nature 434, 652–658 (2005).
220. Schinzel, A. C. et al. Cyclophilin D is a component of mitochondrial permeability transition and mediates neuronal cell death after focal cerebral ischemia. PNAS 102, 12005–12010 (2005).
221. Berghe, T. V. et al. Necroptosis, necrosis and secondary necrosis converge on similar cellular disintegration features. Cell Death Differ 17, 922–930 (2010).
222. Xu, X. et al. Necrostatin-1 protects against glutamate-induced glutathione depletion and caspase-independent cell death in HT-22 cells. J. Neurochem. 103, 2004–2014 (2007).
223. Lin, Y. et al. Tumor necrosis factor-induced nonapoptotic cell death requires receptor-interacting protein-mediated cellular reactive oxygen species accumulation. J. Biol. Chem. 279, 10822–10828 (2004).
224. He, S. et al. Receptor Interacting Protein Kinase-3 Determines Cellular Necrotic Response to TNF-[alpha]. Cell 137, 1100–1111 (2009).
225. Jouan-Lanhouet, S. et al. TRAIL induces necroptosis involving RIPK1/RIPK3-dependent PARP-1 activation. Cell Death Differ. 19, 2003–2014 (2012).
170
226. He, S., Liang, Y., Shao, F. & Wang, X. Toll-Like Receptors Activate Programmed Necrosis in Macrophages Through a Receptor-Interacting Kinase-3–Mediated Pathway. PNAS 108, 20054–20059 (2011).
227. Rebsamen, M. et al. DAI/ZBP1 recruits RIP1 and RIP3 through RIP homotypic interaction motifs to activate NF-[kappa]B. EMBO Rep 10, 916–922 (2009).
228. Upton, J. W., Kaiser, W. J. & Mocarski, E. S. DAI/ZBP1/DLM-1 Complexes with RIP3 to Mediate Virus-Induced Programmed Necrosis that Is Targeted by Murine Cytomegalovirus vIRA. Cell Host & Microbe 11, 290–297 (2012).
229. Biton, S. & Ashkenazi, A. NEMO and RIP1 control cell fate in response to extensive DNA damage via TNF-α feedforward signaling. Cell 145, 92–103 (2011).
230. Vanlangenakker, N., Vanden Berghe, T. & Vandenabeele, P. Many stimuli pull the necrotic trigger, an overview. Cell Death Differ 19, 75–86 (2012).
231. Andersson, U. & Erlandsson-Harris, H. HMGB1 is a potent trigger of arthritis. Journal of Internal Medicine 255, 344–350 (2004).
232. Pisetsky, D. S. HMGB1: A Dangerous Player in Lupus Pathogenesis. J Rheumatol 37, 689–691 (2010).
233. Andersson, U. & Tracey, K. J. HMGB1 in sepsis. Scand. J. Infect. Dis. 35, 577–584 (2003). 234. Raucci, A., Palumbo, R. & Bianchi, M. E. HMGB1: A signal of necrosis. Autoimmunity 40,
285–289 (2007). 235. Zwaferink, H., Stockinger, S., Reipert, S. & Decker, T. Stimulation of Inducible Nitric Oxide
Synthase Expression by Beta Interferon Increases Necrotic Death of Macrophages upon Listeria monocytogenes Infection. Infect. Immun. 76, 1649–1656 (2008).
236. Amantea, D., Nappi, G., Bernardi, G., Bagetta, G. & Corasaniti, M. T. Post-ischemic brain damage: pathophysiology and role of inflammatory mediators. FEBS Journal 276, 13–26 (2009).
237. Kim, J.-B. et al. HMGB1, a Novel Cytokine-Like Mediator Linking Acute Neuronal Death and Delayed Neuroinflammation in the Postischemic Brain. J. Neurosci. 26, 6413–6421 (2006).
238. Liu, K. et al. Anti-high mobility group box 1 monoclonal antibody ameliorates brain infarction induced by transient ischemia in rats. FASEB J 21, 3904–3916 (2007).
239. Smith, C. et al. Necrostatin: A Potentially Novel Cardioprotective Agent? Cardiovascular Drugs and Therapy 21, 227–233 (2007).
240. Andrassy, M. et al. High-Mobility Group Box-1 in Ischemia-Reperfusion Injury of the Heart. Circulation 117, 3216–3226 (2008).
241. Yu, M. et al. HMGB1 SIGNALS THROUGH TOLL-LIKE RECEPTOR (TLR) 4 AND TLR2. Shock 26, 174–179 (2006).
242. Yang, H. et al. A critical cysteine is required for HMGB1 binding to Toll-like receptor 4 and activation of macrophage cytokine release. Proc. Natl. Acad. Sci. U.S.A. 107, 11942–11947 (2010).
243. Andersson, U. et al. High mobility group 1 protein (HMG-1) stimulates proinflammatory cytokine synthesis in human monocytes. J. Exp. Med. 192, 565–570 (2000).
244. Schiraldi, M. et al. HMGB1 promotes recruitment of inflammatory cells to damaged tissues by forming a complex with CXCL12 and signaling via CXCR4. J Exp Med 209, 551–563 (2012).
245. Yang, D. et al. High mobility group box-1 protein induces the migration and activation of human dendritic cells and acts as an alarmin. J. Leukoc. Biol. 81, 59–66 (2007).
171
246. Bianchi, M. E. DAMPs, PAMPs and alarmins: all we need to know about danger. J Leukoc Biol 81, 1–5 (2007).
247. Kaczmarek, A., Vandenabeele, P. & Krysko, D. V. Necroptosis: The Release of Damage-Associated Molecular Patterns and Its Physiological Relevance. Immunity 38, 209–223 (2013).
248. Lee, T. H., Shank, J., Cusson, N. & Kelliher, M. A. The kinase activity of Rip1 is not required for tumor necrosis factor-alpha-induced IkappaB kinase or p38 MAP kinase activation or for the ubiquitination of Rip1 by Traf2. J. Biol. Chem. 279, 33185–33191 (2004).
249. Christofferson, D. E. et al. A novel role for RIP1 kinase in mediating TNFα production. Cell Death & Disease 3, e320 (2012).
250. Cusson-Hermance, N., Khurana, S., Lee, T. H., Fitzgerald, K. A. & Kelliher, M. A. Rip1 Mediates the Trif-dependent Toll-like Receptor 3- and 4-induced NF-κB Activation but Does Not Contribute to Interferon Regulatory Factor 3 Activation. J. Biol. Chem. 280, 36560–36566 (2005).
251. Kang, T.-B., Yang, S.-H., Toth, B., Kovalenko, A. & Wallach, D. Caspase-8 Blocks Kinase RIPK3-Mediated Activation of the NLRP3 Inflammasome. Immunity 38, 27–40 (2013).
252. Meylan, E. et al. RIP1 is an essential mediator of Toll-like receptor 3-induced NF-[kappa]B activation. Nat Immunol 5, 503–507 (2004).
253. Newton, K., Sun, X. & Dixit, V. M. Kinase RIP3 is dispensable for normal NF-kappa Bs, signaling by the B-cell and T-cell receptors, tumor necrosis factor receptor 1, and Toll-like receptors 2 and 4. Mol. Cell. Biol. 24, 1464–1469 (2004).
254. Vince, J. E. et al. Inhibitor of apoptosis proteins limit RIP3 kinase-dependent interleukin-1 activation. Immunity 36, 215–227 (2012).
255. Petersen, S. L. et al. Autocrine TNFα Signaling Renders Human Cancer Cells Susceptible to Smac-Mimetic-Induced Apoptosis. Cancer Cell 12, 445–456 (2007).
256. Wu, Y.-T. et al. zVAD-induced necroptosis in L929 cells depends on autocrine production of TNFα mediated by the PKC-MAPKs-AP-1 pathway. Cell Death Differ. 18, 26–37 (2011).
257. Wallach, D., Kovalenko, A. & Kang, T.-B. ‘Necrosome’-induced inflammation: must cells die for it? Trends in Immunology 32, 505–509 (2011).
258. Duprez, L. et al. RIP Kinase-Dependent Necrosis Drives Lethal Systemic Inflammatory Response Syndrome. Immunity 35, 908–918 (2011).
259. Linkermann, A. et al. Dichotomy between RIP1- and RIP3-Mediated Necroptosis in Tumor Necrosis Factor-α–Induced Shock. Mol Med 18, 577–586 (2012).
260. Yang, H. et al. Reversing established sepsis with antagonists of endogenous high-mobility group box 1. PNAS 101, 296–301 (2004).
261. Qin, S. et al. Role of HMGB1 in apoptosis-mediated sepsis lethality. J Exp Med 203, 1637–1642 (2006).
262. Lin, J. et al. A Role of RIP3-Mediated Macrophage Necrosis in Atherosclerosis Development. Cell Rep 3, 200–210 (2013).
263. Andrassy, M. et al. HMGB1 Is Associated with Atherosclerotic Plaque Composition and Burden in Patients with Stable Coronary Artery Disease. PLoS ONE 7, e52081 (2012).
264. Kalinina, N. et al. Increased Expression of the DNA-Binding Cytokine HMGB1 in Human Atherosclerotic Lesions Role of Activated Macrophages and Cytokines. Arterioscler Thromb Vasc Biol 24, 2320–2325 (2004).
172
265. Chan, F. K.-M. et al. A role for tumor necrosis factor receptor-2 and receptor-interacting protein in programmed necrosis and antiviral responses. J. Biol. Chem. 278, 51613–51621 (2003).
266. Mack, C., Sickmann, A., Lembo, D. & Brune, W. Inhibition of proinflammatory and innate immune signaling pathways by a cytomegalovirus RIP1-interacting protein. PNAS 105, 3094–3099 (2008).
267. Conze, D. B. et al. Posttranscriptional downregulation of c-IAP2 by the ubiquitin protein ligase c-IAP1 in vivo. Mol. Cell. Biol. 25, 3348–3356 (2005).
268. Conte, D. et al. Inhibitor of Apoptosis Protein cIAP2 Is Essential for Lipopolysaccharide-Induced Macrophage Survival. Mol. Cell. Biol. 26, 699–708 (2006).
269. Kolumam, G. A., Thomas, S., Thompson, L. J., Sprent, J. & Murali-Krishna, K. Type I interferons act directly on CD8 T cells to allow clonal expansion and memory formation in response to viral infection. J Exp Med 202, 637–650 (2005).
270. Müller, U. et al. Functional role of type I and type II interferons in antiviral defense. Science 264, 1918–1921 (1994).
271. Shen, L., Sigal, L. J., Boes, M. & Rock, K. L. Important role of cathepsin S in generating peptides for TAP-independent MHC class I crosspresentation in vivo. Immunity 21, 155–165 (2004).
272. Luu, R. A. et al. Delayed expansion and contraction of CD8+ T cell response during infection with virulent Salmonella typhimurium. J. Immunol. 177, 1516–1525 (2006).
273. Dudani, R. et al. Multiple mechanisms compensate to enhance tumor-protective CD8(+) T cell response in the long-term despite poor CD8(+) T cell priming initially: comparison between an acute versus a chronic intracellular bacterium expressing a model antigen. J. Immunol. 168, 5737–5745 (2002).
274. Monnack, D. Preparation of Bone-marrow-derived macrophages. at <http://monacklab.stanford.edu/protocols.html#bmd>
275. Lu, J. et al. SM-164: A Novel, Bivalent Smac Mimetic That Induces Apoptosis and Tumor Regression by Concurrent Removal of the Blockade of cIAP-1/2 and XIAP. Cancer Research 68, 9384–9393 (2008).
276. Wu, C.-J., Conze, D. B., Li, T., Srinivasula, S. M. & Ashwell, J. D. Sensing of Lys 63-linked polyubiquitination by NEMO is a key event in NF-kappaB activation [corrected]. Nat. Cell Biol. 8, 398–406 (2006).
277. Unger, T., Jacobovitch, Y., Dantes, A., Bernheim, R. & Peleg, Y. Applications of the Restriction Free (RF) cloning procedure for molecular manipulations and protein expression. J. Struct. Biol. 172, 34–44 (2010).
278. Albaghdadi, H., Robinson, N., Finlay, B., Krishnan, L. & Sad, S. Selectively reduced intracellular proliferation of Salmonella enterica serovar typhimurium within APCs limits antigen presentation and development of a rapid CD8 T cell response. J. Immunol. 183, 3778–3787 (2009).
279. Sad, S. et al. Pathogen proliferation governs the magnitude but compromises the function of CD8 T cells. J. Immunol. 180, 5853–5861 (2008).
280. Wrone-Smith, T. et al. Keratinocytes derived from psoriatic plaques are resistant to apoptosis compared with normal skin. Am. J. Pathol. 151, 1321–1329 (1997).
281. Kaech, S. M., Wherry, E. J. & Ahmed, R. Effector and memory T-cell differentiation: implications for vaccine development. Nat Rev Immunol 2, 251–262 (2002).
173
282. Prakash, H. et al. cIAP-1 Controls Innate Immunity to C. pneumoniae Pulmonary Infection. PLoS ONE 4, e6519 (2009).
283. Lu, J. et al. SM-164: A Novel, Bivalent Smac Mimetic That Induces Apoptosis and Tumor Regression by Concurrent Removal of the Blockade of cIAP-1/2 and XIAP. Cancer Research 68, 9384–9393 (2008).
284. Suzuki, Y., Nakabayashi, Y., Nakata, K., Reed, J. C. & Takahashi, R. X-linked Inhibitor of Apoptosis Protein (XIAP) Inhibits Caspase-3 and -7 in Distinct Modes. Journal of Biological Chemistry 276, 27058 –27063 (2001).
285. Robinson, N. et al. Type I interferon induces necroptosis in macrophages during infection with Salmonella enterica serovar Typhimurium. Nature Immunology 13, 954–962 (2012).
286. Vadiveloo, P. K., Vairo, G., Hertzog, P., Kola, I. & Hamilton, J. A. Role of type I interferons during macrophage activation by lipopolysaccharide. Cytokine 12, 1639–1646 (2000).
287. Sung Ouk Kim & Jiahuai Han. Pan-caspase inhibitor zVAD enhances cell death in RAW246.7 macrophages. Journal of Endotoxin Research 7, 292 –296 (2001).
288. Rozman-Pungercar, J. et al. Inhibition of papain-like cysteine proteases and legumain by caspase-specific inhibitors: when reaction mechanism is more important than specificity. Cell Death Differ. 10, 881–888 (2003).
289. Mohamed, M. M. & Sloane, B. F. Cysteine cathepsins: multifunctional enzymes in cancer. Nature Reviews Cancer 6, 764–775 (2006).
290. Chwieralski, C., Welte, T. & Bühling, F. Cathepsin-regulated apoptosis. Apoptosis 11, 143–149 (2006).
291. Matloubian, M., Concepcion, R. J. & Ahmed, R. CD4+ T cells are required to sustain CD8+ cytotoxic T-cell responses during chronic viral infection. J. Virol. 68, 8056–8063 (1994).
292. Gorantla, S. et al. CD8+ cell depletion accelerates HIV-1 immunopathology in humanized mice. J Immunol 184, 7082–7091 (2010).
293. Serbina, N. V. & Flynn, J. L. CD8(+) T cells participate in the memory immune response to Mycobacterium tuberculosis. Infect. Immun. 69, 4320–4328 (2001).
294. Mastroeni, P., Villarreal-Ramos, B. & Hormaeche, C. E. Role of T cells, TNF alpha and IFN gamma in recall of immunity to oral challenge with virulent salmonellae in mice vaccinated with live attenuated aro- Salmonella vaccines. Microb. Pathog. 13, 477–491 (1992).
295. Harty, J. T., Schreiber, R. D. & Bevan, M. J. CD8 T cells can protect against an intracellular bacterium in an interferon gamma-independent fashion. Proc Natl Acad Sci U S A 89, 11612–11616 (1992).
296. Perez-Liz, G., Del Valle, L., Gentilella, A., Croul, S. & Khalili, K. Detection of JC virus DNA fragments but not proteins in normal brain tissue. Ann. Neurol. 64, 379–387 (2008).
297. White, F. A., 3rd, Ishaq, M., Stoner, G. L. & Frisque, R. J. JC virus DNA is present in many human brain samples from patients without progressive multifocal leukoencephalopathy. J. Virol. 66, 5726–5734 (1992).
298. Blomgren, K. et al. Synergistic Activation of Caspase-3 by m-Calpain after Neonatal Hypoxia-Ischemia A MECHANISM OF ‘PATHOLOGICAL APOPTOSIS’? J. Biol. Chem. 276, 10191–10198 (2001).
299. Sharma, A. K. & Rohrer, B. Calcium-induced calpain mediates apoptosis via caspase-3 in a mouse photoreceptor cell line. J. Biol. Chem. 279, 35564–35572 (2004).
300. Berridge, M. J., Lipp, P. & Bootman, M. D. The versatility and universality of calcium signalling. Nat Rev Mol Cell Biol 1, 11–21 (2000).
174
301. Puga, I., Rao, A. & Macian, F. Targeted Cleavage of Signaling Proteins by Caspase 3 Inhibits T Cell Receptor Signaling in Anergic TÂ Cells. Immunity 29, 193–204 (2008).
302. Ma, S., Ochi, H., Cui, L. & He, W. FasL-induced downregulation of CD28 expression on jurkat cells in vitro is associated with activation of caspases. Cell Biol. Int. 27, 959–964 (2003).
303. Grayson, J. M., Laniewski, N. G., Lanier, J. G. & Ahmed, R. Mitochondrial Potential and Reactive Oxygen Intermediates in Antigen-Specific CD8+ T Cells During Viral Infection. J Immunol 170, 4745–4751 (2003).
304. Harty, J. T. & Badovinac, V. P. Shaping and reshaping CD8+ T-cell memory. Nat Rev Immunol 8, 107–119 (2008).
305. Snow, A. L. et al. Critical role for BIM in T cell receptor restimulation-induced death. Biology Direct 3, (2008).
306. Masson, F., Kupresanin, F., Mount, A., Strasser, A. & Belz, G. T. Bid and Bim collaborate during induction of T cell death in persistent infection. J. Immunol. 186, 4059–4066 (2011).
307. Osborn, S. L. et al. Fas-associated death domain (FADD) is a negative regulator of T-cell receptor–mediated necroptosis. Proceedings of the National Academy of Sciences 107, 13034 –13039 (2010).
308. Lu, J. V. et al. Complementary roles of Fas-associated death domain (FADD) and receptor interacting protein kinase-3 (RIPK3) in T-cell homeostasis and antiviral immunity. PNAS 108, 15312–15317 (2011).
309. Lin, Y., Devin, A., Rodriguez, Y. & Liu, Z. Cleavage of the death domain kinase RIP by Caspase-8 prompts TNF-induced apoptosis. Genes Dev 13, 2514–2526 (1999).
310. Zhu, L. et al. Real-time monitoring of caspase cascade activation in living cells. J Control Release 163, 55–62 (2012).
311. Ferreira, K. S. et al. Caspase-3 feeds back on caspase-8, Bid and XIAP in type I Fas signaling in primary mouse hepatocytes. Apoptosis 17, 503–515 (2012).
312. Fischer, K. et al. Antigen recognition induces phosphatidylserine exposure on the cell surface of human CD8+ T cells. Blood 108, 4094–4101 (2006).
313. Koenig, A. et al. Proliferating γδ T cells manifest high and spatially confined caspase-3 activity. Immunology 135, 276–286 (2012).
314. Koenig, A., Russell, J. Q., Rodgers, W. A. & Budd, R. C. Spatial differences in active caspase-8 defines its role in T-cell activation versus cell death. Cell Death and Differentiation 15, 1701–1711 (2008).
315. Kamada, S., Kikkawa, U., Tsujimoto, Y. & Hunter, T. Nuclear Translocation of Caspase-3 Is Dependent on Its Proteolytic Activation and Recognition of a Substrate-like Protein(s). J. Biol. Chem. 280, 857–860 (2005).
316. Harlin, H., Reffey, S. B., Duckett, C. S., Lindsten, T. & Thompson, C. B. Characterization of XIAP-Deficient Mice. Mol Cell Biol 21, 3604–3608 (2001).
317. Rigaud, S. et al. XIAP deficiency in humans causes an X-linked lymphoproliferative syndrome. Nature 444, 110–114 (2006).
318. Mangan, D. & Wahl, S. Differential regulation of human monocyte programmed cell death (apoptosis) by chemotactic factors and pro-inflammatory cytokines. J Immunol 147, 3408–3412 (1991).
319. Busca, A., Saxena, M., Kryworuchko, M. & Kumar, A. Anti-Apoptotic Genes in the Survival of Monocytic Cells During Infection. Curr Genomics 10, 306–317 (2009).
175
320. Cui, X. et al. Lipopolysaccharide induces the expression of cellular inhibitor of apoptosis protein-2 in human macrophages. Biochim. Biophys. Acta 1524, 178–182 (2000).
321. Prakash, H., Albrecht, M., Becker, D., Kuhlmann, T. & Rudel, T. Deficiency of XIAP Leads to Sensitization for Chlamydophila pneumoniae Pulmonary Infection and Dysregulation of Innate Immune Response in Mice. Journal of Biological Chemistry 285, 20291 –20302 (2010).
322. Müller-Sienerth, N. et al. SMAC Mimetic BV6 Induces Cell Death in Monocytes and Maturation of Monocyte-Derived Dendritic Cells. PLoS ONE 6, e21556 (2011).
323. Vanlangenakker, N. et al. cIAP1 and TAK1 protect cells from TNF-induced necrosis by preventing RIP1/RIP3-dependent reactive oxygen species production. Cell Death Differ 18, 656–665 (2011).
324. Choi, Y. E. et al. The E3 Ubiquitin Ligase cIAP1 Binds and Ubiquitinates Caspase-3 and -7 via Unique Mechanisms at Distinct Steps in Their Processing. Journal of Biological Chemistry 284, 12772 –12782 (2009).
325. Bertrand, M. J. M. et al. cIAP1/2 Are Direct E3 Ligases Conjugating Diverse Types of Ubiquitin Chains to Receptor Interacting Proteins Kinases 1 to 4 (RIP1–4). PLoS ONE 6, e22356 (2011).
326. Kearney, C. J. et al. IAPs and their Antagonists Regulate Spontaneous and TNF-Induced Pro-Inflammatory Cytokine and Chemokine production. J. Biol. Chem. (2012). doi:10.1074/jbc.M112.422410
327. Geserick, P. et al. Cellular IAPs inhibit a cryptic CD95-induced cell death by limiting RIP1 kinase recruitment. J Cell Biol 187, 1037–1054 (2009).
328. Upton, J. W., Kaiser, W. J. & Mocarski, E. S. Virus inhibition of RIP3-dependent necrosis. Cell host & microbe 7, 302–313 (2010).
329. Lara-Tejero, M. et al. Role of the caspase-1 inflammasome in Salmonella typhimurium pathogenesis. J Exp Med 203, 1407–1412 (2006).
330. Velden, A. W. M. van der, Lindgren, S. W., Worley, M. J. & Heffron, F. Salmonella Pathogenicity Island 1-Independent Induction of Apoptosis in Infected Macrophages bySalmonella enterica Serotype Typhimurium. Infect. Immun. 68, 5702–5709 (2000).
331. Guilloteau, L. A. et al. The Salmonella virulence plasmid enhances Salmonella-induced lysis of macrophages and influences inflammatory responses. Infect. Immun. 64, 3385–3393 (1996).
332. Brennan, M. A. & Cookson, B. T. Salmonella induces macrophage death by caspase-1-dependent necrosis. Mol. Microbiol 38, 31–40 (2000).
333. Sato, M. et al. Distinct and essential roles of transcription factors IRF-3 and IRF-7 in response to viruses for IFN-alpha/beta gene induction. Immunity 13, 539–548 (2000).
334. Lazear, H. M. et al. IRF-3, IRF-5, and IRF-7 Coordinately Regulate the Type I IFN Response in Myeloid Dendritic Cells Downstream of MAVS Signaling. PLoS Pathog 9, e1003118 (2013).
335. Karaghiosoff, M. et al. Central role for type I interferons and Tyk2 in lipopolysaccharide-induced endotoxin shock. Nat Immunol 4, 471–477 (2003).
336. Pena, G., Cai, B., Deitch, E. A. & Ulloa, L. JAK2 inhibition prevents innate immune responses and rescues animals from sepsis. J Mol Med (Berl) 88, 851–859 (2010).
337. Kim, H. S. & Lee, M.-S. Essential role of STAT1 in caspase-independent cell death of activated macrophages through the p38 mitogen-activated protein kinase/STAT1/reactive oxygen species pathway. Mol. Cell. Biol. 25, 6821–6833 (2005).
176
338. Huys, L. et al. Type I interferon drives tumor necrosis factor-induced lethal shock. J. Exp. Med. 206, 1873–1882 (2009).
339. Kelly-Scumpia, K. M. et al. Type I interferon signaling in hematopoietic cells is required for survival in mouse polymicrobial sepsis by regulating CXCL10. J. Exp. Med. 207, 319–326 (2010).
340. Mahieu, T. et al. The wild-derived inbred mouse strain SPRET/Ei is resistant to LPS and defective in IFN-beta production. Proc. Natl. Acad. Sci. U.S.A. 103, 2292–2297 (2006).
341. Sakaguchi, S. et al. Essential role of IRF-3 in lipopolysaccharide-induced interferon-β gene expression and endotoxin shock. Biochemical and Biophysical Research Communications 306, 860–866 (2003).
342. Hoebe, K. et al. Identification of Lps2 as a key transducer of MyD88-independent TIR signalling. Nature 424, 743–748 (2003).
343. Amiot, F., Fitting, C., Tracey, K. J., Cavaillon, J. M. & Dautry, F. Lipopolysaccharide-induced cytokine cascade and lethality in LT alpha/TNF alpha-deficient mice. Mol. Med. 3, 864–875 (1997).
344. Mahieu, T. & Libert, C. Should We Inhibit Type I Interferons in Sepsis? Infect Immun 75, 22–29 (2007).
345. Sundén-Cullberg, J. et al. Persistent elevation of high mobility group box-1 protein (HMGB1) in patients with severe sepsis and septic shock. Crit. Care Med. 33, 564–573 (2005).
346. Lamkanfi, M. et al. Inflammasome-dependent release of the alarmin HMGB1 in endotoxemia. J. Immunol. 185, 4385–4392 (2010).
347. Husak, L. et al. National analysis of sepsis hospitalizations and factors contributing to sepsis in-hospital mortality in Canada. Healthc Q 13 Spec No, 35–41 (2010).
348. Gaieski, D. F. et al. Impact of time to antibiotics on survival in patients with severe sepsis or septic shock in whom early goal-directed therapy was initiated in the emergency department. Crit. Care Med. 38, 1045–1053 (2010).
349. Okazaki, Y. & Matsukawa, A. Pathophysiology of sepsis and recent patents on the diagnosis, treatment and prophylaxis for sepsis. Recent Pat Inflamm Allergy Drug Discov 3, 26–32 (2009).
350. Friedman, R. M. Clinical uses of interferons. Br J Clin Pharmacol 65, 158–162 (2008). 351. Zhang, D.-W. et al. RIP3, an Energy Metabolism Regulator That Switches TNF-Induced Cell
Death from Apoptosis to Necrosis. Science 325, 332–336 (2009). 352. Rozman-Pungercar, J. et al. Inhibition of papain-like cysteine proteases and legumain by
caspase-specific inhibitors: when reaction mechanism is more important than specificity. Cell Death Differ. 10, 881–888 (2003).
353. Felbor, U. et al. Neuronal loss and brain atrophy in mice lacking cathepsins B and L. PNAS 99, 7883–7888 (2002).
354. Verspurten, J., Gevaert, K., Declercq, W. & Vandenabeele, P. SitePredicting the cleavage of proteinase substrates. Trends Biochem. Sci. 34, 319–323 (2009).
355. Guicciardi, M. E., Leist, M. & Gores, G. J. Lysosomes in cell death. Oncogene 23, 2881–2890 (2004).
356. Yamashima, T. & Oikawa, S. The role of lysosomal rupture in neuronal death. Prog. Neurobiol. 89, 343–358 (2009).
357. Repnik, U., Stoka, V., Turk, V. & Turk, B. Lysosomes and lysosomal cathepsins in cell death. Biochim. Biophys. Acta 1824, 22–33 (2012).
177
358. Guicciardi, M. E. et al. Cathepsin B contributes to TNF-alpha-mediated hepatocyte apoptosis by promoting mitochondrial release of cytochrome c. J. Clin. Invest. 106, 1127–1137 (2000).
359. Cirman, T. et al. Selective disruption of lysosomes in HeLa cells triggers apoptosis mediated by cleavage of Bid by multiple papain-like lysosomal cathepsins. J. Biol. Chem. 279, 3578–3587 (2004).
360. Rajput, A. et al. RIG-I RNA Helicase Activation of IRF3 Transcription Factor Is Negatively Regulated by Caspase-8-Mediated Cleavage of the RIP1 Protein. Immunity 34, 340–351 (2011).
361. Lyo, V. et al. Active cathepsins B, L, and S in murine and human pancreatitis. Am J Physiol Gastrointest Liver Physiol 303, G894–G903 (2012).
362. Menzel, K. et al. Cathepsins B, L and D in inflammatory bowel disease macrophages and potential therapeutic effects of cathepsin inhibition in vivo. Clin. Exp. Immunol. 146, 169–180 (2006).
363. Li, X., Liu, Z., Cheng, Z. & Cheng, X. Cysteinyl Cathepsins: Multifunctional Enzymes in Cardiovascular Disease. Chonnam Med J 48, 77–85 (2012).
364. McComb, S., Mulligan, R. & Sad, S. Caspase-3 Is Transiently Activated without Cell Death during Early Antigen Driven Expansion of CD8+ T Cells In Vivo. PLoS ONE 5, e15328 (2010).
365. McComb, S. et al. cIAP1 and cIAP2 limit macrophage necroptosis by inhibiting Rip1 and Rip3 activation. Cell Death Differ. 19, 1791–1801 (2012).
178
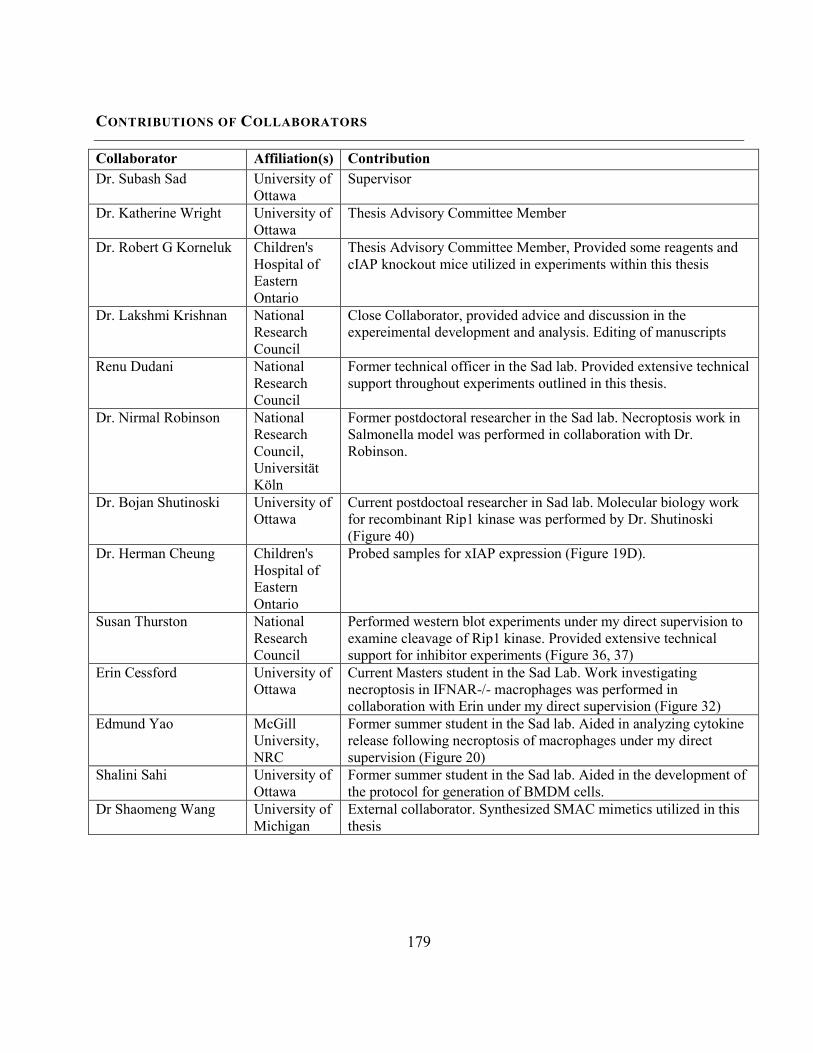
CONTRIBUTIONS OF COLLABORATORS
Collaborator Affiliation(s) Contribution Dr. Subash Sad University of
Ottawa Supervisor
Dr. Katherine Wright University of Ottawa
Thesis Advisory Committee Member
Dr. Robert G Korneluk Children's Hospital of Eastern Ontario
Thesis Advisory Committee Member, Provided some reagents and cIAP knockout mice utilized in experiments within this thesis
Dr. Lakshmi Krishnan National Research Council
Close Collaborator, provided advice and discussion in the expereimental development and analysis. Editing of manuscripts
Renu Dudani National Research Council
Former technical officer in the Sad lab. Provided extensive technical support throughout experiments outlined in this thesis.
Dr. Nirmal Robinson National Research Council, Universität Köln
Former postdoctoral researcher in the Sad lab. Necroptosis work in Salmonella model was performed in collaboration with Dr. Robinson.
Dr. Bojan Shutinoski University of Ottawa
Current postdoctoal researcher in Sad lab. Molecular biology work for recombinant Rip1 kinase was performed by Dr. Shutinoski (Figure 40)
Dr. Herman Cheung Children's Hospital of Eastern Ontario
Probed samples for xIAP expression (Figure 19D).
Susan Thurston National Research Council
Performed western blot experiments under my direct supervision to examine cleavage of Rip1 kinase. Provided extensive technical support for inhibitor experiments (Figure 36, 37)
Erin Cessford University of Ottawa
Current Masters student in the Sad Lab. Work investigating necroptosis in IFNAR-/- macrophages was performed in collaboration with Erin under my direct supervision (Figure 32)
Edmund Yao McGill University, NRC
Former summer student in the Sad lab. Aided in analyzing cytokine release following necroptosis of macrophages under my direct supervision (Figure 20)
Shalini Sahi University of Ottawa
Former summer student in the Sad lab. Aided in the development of the protocol for generation of BMDM cells.
Dr Shaomeng Wang University of Michigan
External collaborator. Synthesized SMAC mimetics utilized in this thesis
179
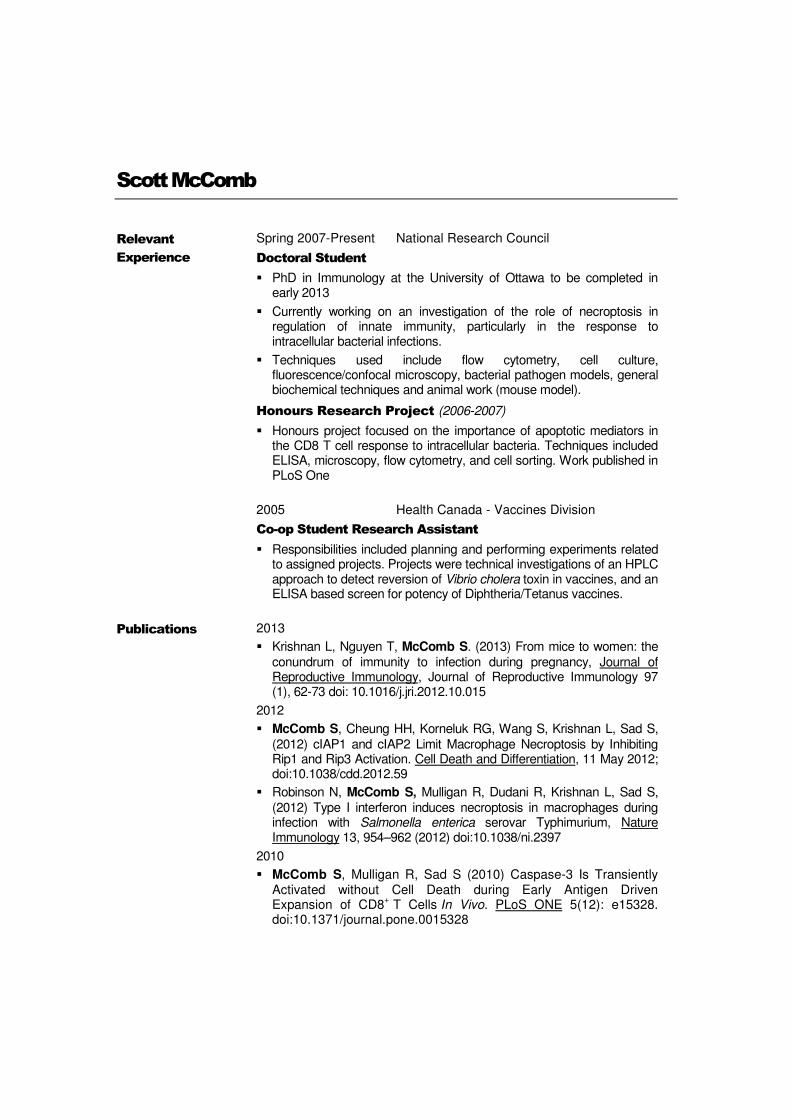
������������
��� ����
�����������
Spring 2007-Present National Research Council
������������������
� PhD in Immunology at the University of Ottawa to be completed in early 2013
� Currently working on an investigation of the role of necroptosis in regulation of innate immunity, particularly in the response to intracellular bacterial infections.
� Techniques used include flow cytometry, cell culture, fluorescence/confocal microscopy, bacterial pathogen models, general biochemical techniques and animal work (mouse model).
������������������������(2006-2007)�
� Honours project focused on the importance of apoptotic mediators in the CD8 T cell response to intracellular bacteria. Techniques included ELISA, microscopy, flow cytometry, and cell sorting. Work published in PLoS One
2005 Health Canada - Vaccines Division
��������������������������������
� Responsibilities included planning and performing experiments related to assigned projects. Projects were technical investigations of an HPLC approach to detect reversion of Vibrio cholera toxin in vaccines, and an ELISA based screen for potency of Diphtheria/Tetanus vaccines.
������������ 2013
� Krishnan L, Nguyen T, McComb S. (2013) From mice to women: the conundrum of immunity to infection during pregnancy, Journal of Reproductive Immunology, Journal of Reproductive Immunology 97 (1), 62-73 doi: 10.1016/j.jri.2012.10.015
2012
� McComb S, Cheung HH, Korneluk RG, Wang S, Krishnan L, Sad S, (2012) cIAP1 and cIAP2 Limit Macrophage Necroptosis by Inhibiting Rip1 and Rip3 Activation. Cell Death and Differentiation, 11 May 2012; doi:10.1038/cdd.2012.59
� Robinson N, McComb S, Mulligan R, Dudani R, Krishnan L, Sad S, (2012) Type I interferon induces necroptosis in macrophages during infection with Salmonella enterica serovar Typhimurium, Nature Immunology 13, 954–962 (2012) doi:10.1038/ni.2397
2010
� McComb S, Mulligan R, Sad S (2010) Caspase-3 Is Transiently Activated without Cell Death during Early Antigen Driven Expansion of CD8
+ T Cells In Vivo. PLoS ONE 5(12): e15328.
doi:10.1371/journal.pone.0015328
�
�
���������������
������������
�
�
��������������
� McComb S, Cessford E, Startek J, Sad S (2013) Autocrine Type-I Interferon Signaling is a Key Inducer of Inflammatory Necroptosis Manuscript in Preparation
� McComb S, Shutinoski B, Thurston S, Sad, S. (2013) Cathepsins Limit Macrophage Necroptosis through Cleavage of Rip1 Kinase Manuscript in Preparation
2013
� Poster presentation at Canadian Society for Immunology conference held in Whistler, BC. Title: “Cathepsins Limit Macrophage Necroptosis through Cleavage of Rip1 Kinase”
2012
� Poster presentation at Keystone conference Pathways of Cell Death: Beyond apoptosis held in Banff Ab. Title: “cIAP1 and cIAP2 Limit Macrophage Necroptosis By Inhibiting Rip1 And Rip3 Activation”
2011
� Oral presentation in the Innate Immunity workshop at the Canadian Society for Immunology conference held in Banff, Ab. Title: “cIAP1 and cIAP2 Limit Macrophage Cell Death by Inhibiting Necrosome Formation”
2010
� Poster presentation at the Canadian Society for Immunology Annual Conference at Niagara Falls, On. Title: “cIAP-1 and cIAP-2 Protect Antigen Presenting Cells from Inflammatory Rip1 Dependent Necroptotic Cell Death”
2008
� Poster presentation at the Canadian Society for Immunology Annual Conference at Mt Tremblant, QC. Title: “Intensity of Antigen-Presentation Influences the Up-Regulation of Apoptotic Mediators During Activation of CD8+ T-Cells”
2006-2013
� Numerous poster and oral presentations at the University of Ottawa
�����������������
���� � �� ������
� Served as the student representative of the Animal Care Committee for the Institute for Biological Sciences (NRC)
� Mentored multiple graduate and undergraduate students in the Sad lab 2008-2013
� Tasks included teaching technical and academic skills, experimental design, delegation, and managing work for multiple students
� 2+ years as Laboratory Teaching Assistant
� Teaching classes on a range of biochemistry topics for both practical and theoretical skills
� Grade students and provide feedback to aid in their development
���������� Fall 2007-Present University of Ottawa
� Currently pursuing a Doctoral degree in Immunology under the BMI department. Transfer from Masters to PhD program in 2009
2002-2007 University of Ottawa
� B. Sc in Biopharmaceutical Science (Genomics Option) with Honours and Co-op
� Graduated cum laude.
�!����
� Ontario Graduate Scholarship - Doctoral Student Scholarship
� Ontario Graduate Student Scholarship in Master’s Scholarship 2008
� Travel Award CSI Conference 2013
� Microbiology and Immunology Program Award of Excellence 2012
� Travel Award Keystone Cell Death Conference 2012
� Microbiology and Immunology Program Award of Excellence 2011
� Travel Award CSI Conference 2011
� University of Ottawa Graduate Admission Scholarship (May 2009)
� Winner – BMIGSA Award for Best Poster – PhD Poster Competition
� Award Winner Graduate Poster Competition - Immunology 2008
� NRC Teamwork and Group Achievement Award
� Dean’s List for final 2 years of Undergraduate Degree
� Award Winner Honours Poster Competition Immunology section
� University of Ottawa undergraduate entrance scholarship - $2500
� Lo-Ellen Secondary School Graduation Faculty Award