Embed Size (px)
Citation preview

1
EAST ASIAN DEVELOPMENT NETWORK
EADN WORKING PAPER No. 71 (2013)
Pantawid Pamilyang Pilipino Program (4Ps): Examining Gaps and Enhancing
Strategies in Cebu City, Philippines
Adrian Boyett D. Agbon
Fiscalina Amadora-Nolasco
Elmira Judy T. Aguilar
Rhoderick John S. Abellanosa
Lauren Ligaton
University of San Carlos
Cebu City, Philippines

2
Pantawid Pamilyang Pilipino Program (4Ps):
Examining Gaps and Enhancing Strategies in
Cebu City, Philippines*
Adrian Boyett D. Agbon, Fiscalina Amadora-Nolasco, Elmira Judy T. Aguilar,
Rhoderick John S. Abellanosa, and Lauren Ligaton
*This work was carried out via a grant from the Global Development Network/East Asian
Development Network (GDN/EADN), which was administered by the Philippine Institute for
Development Studies as EADN Secretariat and University of San Carlos (USC), Cebu City,
Philippines. The views expressed in this paper are those of the author(s) and do not necessarily
reflect the views or policies of the EADN and USC.

3
Acknowledgements
We would like to thank
- The East Asia Development Network (EADN) for the financial support extended to this
project as part of their research capacity building;
- - Dr. Josef Yap, President of Philippine Institute of Development Studies (PIDS) and
regional coordinator of the East Asia Development Network (EADN);
- Our mentor, Dr. Fernando T. Aldaba of Ateneo de Manila University, Department of
Economics, for his comments and suggestions;
- The research participants during the EADN regional conference in Manila last July 2012
for their insights during the conference;
- Christian Mina, research associate of PIDS, for helping us with our econometric analyses,
and to Maureen Rosellon and Renier de Guzman, both also from PIDS, who served as
our point persons during the course of the project;
- DSWD Central Office Secretary Corazon “Dinky” Soliman; and DSWD Regional Office-
Cebu Dir. Evelyn Macapobre;
- The accommodating personnel and staff of DSWD 7: Anthony G. Arcenal, Raquel Daria,
James Pardillo, Christopher Tanate, Janice N. Beltran, Johannah A. Lunor, Donald Rey
Dejatco, Maria Ivy Aguilar and Rachelle Cuizon, for their help in providing us data on
Pantawid and verifying the NHTS-PR database;
- Fr. Dionisio M. Miranda, SVD, USC President; Dr. Danilo B. Largo, Research Director,
Office of Research; Dr. Ramon S. del Fierro, and CAS Dean, Dr. Fiscalina Amadora-
Nolasco, Coordinator, Social Science Research Center for the logistical support for the
study;

4
- Our field interviewers Sonia Tongco, Bong Caballero, Dennis Mendoza, Leonor
Comendador, Alicia M. Estillore; field supervisor Brenette Abrenica; and key informant
specialist Rhoderick John Abellanosa;
- The office of Mayor Michael Rama, the focal persons and other officials of the 10
barangays for accommodating us during our visit; and
- The Department of Education and Department of Health for granting us the interviews.

5
Abstract
The study looks into the set 1 beneficiaries of Pantawid Pamilya in Cebu City, Philippines,
where a survey was done to compare the beneficiaries and non-beneficiaries in the ten program
sites. The basic socio-economic and demographic characteristics of the two groups are similar in
many respects. The National Household Targeting System for Poverty Reduction Data (NHTS-
PR) data complements the survey data of the socio-economic profile of the beneficiaries and
non-beneficiaries in the 10 program sites. Results of the regression analysis strengthen the need
for the beneficiary households to be in the Pantawid program.
Moreover, the regression coefficients provide clearer insights on the variables that determine the
participation of the poor in social protection programs such as Pantawid. The significant factors--
-i.e., those with higher marginal effects---are: house ownership, type of water source, ownership
of an electric fan, ownership of a DVD/CD player, and number of bed rooms.
It is interesting to note that the poorest of the poor may not be encouraged to participate in the
program as the cost of compliance may be greater than their expected benefits. Nonetheless,
based on the beneficiaries’ impressions, such target group is satisfied with the implementation
process of the program. They appreciate the seminars and trainings, particularly those on
responsible parenthood, and family development and planning. Focus group discussions and key
informant interviews provided the venues for further discussions on the relevant issues and
challenges faced by different agencies implementing the 4Ps.
Overall, the case of Cebu City is considerably a success, particularly in terms of targeting the
beneficiaries and the crucial role of citilink and focal persons of each barangay. However, there
are areas for improvements that need to be recognized such as how to limit the information
asymmetry among program implementers. The non-compliance in the community verification
system (CVS), although there is limited data available, must be seriously noted and taken into
consideration by various stakeholders implementing the program.
Key words; Conditional Cash Transfers, 4Ps, Cebu City, Participation model

6
Pantawid Pamilyang Pilipino Program (4Ps): Examining
Gaps and Enhancing Strategies in Cebu City, Philippines Adrian Boyett D. Agbon
1, Fiscalina Amadora-Nolasco
2, Elmira Judy T. Aguilar
3,
Rhoderick John S. Abellanosa4 and Lauren Ligaton
5
Introduction
Governments in many developing countries adopted the conditional cash transfer (CCT) scheme
at a prodigious rate to alleviate short-term poverty and reduce the intergenerational transmission
of poverty6. The programs grant low-income families the opportunity to receive financial support,
provided they keep their children in school and maintain their health through regular check-ups.
The extensive body of literature shows that such programs positively drive poor families to
1 MA, Faculty, Department of Economics, School of Business and Economics, University of San Carlos, Cebu City, Philippines;
[email protected] 2 PhD, Full Professor, Department of Sociology, Anthropology and History, Social Science Research Coordinator (SSRC),
College of Arts and Sciences, University of San Carlos, Cebu City, Philippines 3 PhD, Full Professor, Department of Sociology, Anthropology and History, College of Arts and Sciences, University of San
Carlos, Cebu City, Philippines.
4 MA, Faculty, Department of Political Science, School of Law and Governance, University of San Carlos, Cebu City,
Philippines.
5 MA, Faculty, Department of Sociology, Anthropology and History, College of Arts and Sciences, University of San Carlos,
Cebu City, Philippines.
6 The comprehensive list of CCT programs are summarized by Fieszben et al (2009): Burkina Faso-Orphans and Vulnerable
Children, Kenya- CT-OVC; Nigeria-COPE; Cambodia – CESSP, JFPR; Indonesia- JPS , PKH; Turkey- SRMP; Argentina-
Programa Familias; Bolivia- Juancito Pinto; Brazil- Bolsa Escola, Bolsa Alimentacao, PETI; Chile- Chile Solidario, SUF;
Colombia- Familias en Accion, SCAE-Bogota; Dominican Republic- Solidaridad, TAE/ILAE; Ecuador- BDH; El Salvador- Red
Solidaria; Guatemala- Mi Familia Progresa; Honduras- PRAF; Jamaica- PATH, Mexico- Oportunidades; Nicaragua- Atencion a
Crisis, RPS; Panama- Red de Oportunidades; Paraguay- Tekopora/PROPAIS II; Peru- Juntos; Yemen- BEDP; Bangladesh-
FSSAP, PESP, ROSC; India- Haryana- Apni Beti Apna Dhan; Pakistan- CSP, Participation in Education through Innovative
Scheme for the Excluded Vulnerable, PESRP.

7
invest more in human capital.7 This approach is considered both as an alternative to more
traditional social assistance programs and a demand-side complement to the supply of health and
education services (Rawlings and Rubio 2005). Results of the impact evaluation conducted in
different countries, including Brazil, Cambodia, Colombia, El Salvador, Honduras, Jamaica,
Malawi, Mexico, Nicaragua, Pakistan, and Turkey indicate that, by and large, CCTs lead to
immediate increases in school enrollment and attendance (Rawlings and Rubio 2003). In the
Philippines, the Pantawid Pamilyang Pilipino Program (4Ps)8, also referred to as Pantawid
Pamilya, is the government’s version of the CCT launched sometime in 2007. The Philippine
government employed the 4Ps as a poverty reduction and social development strategy that
provides conditional cash grants to extremely poor households so that they can improve their
health, nutrition, and education, particularly of their children aged 0-14.
The 4Ps has dual objectives:
(1) Social assistance: To provide cash assistance to the poor to alleviate their immediate
needs (short-term poverty alleviation); and
(2) Social development: To break the intergenerational poverty cycle through investments in
human capital.
The program helps to fulfill the country’s commitment to meet the Millennium Development
Goals; namely, to eradicate extreme poverty and hunger; to achieve universal primary education;
to promote gender equality; to reduce child mortality; and to improve maternal health (DSWD
2011).
According to the Department of Social Welfare and Development (DSWD), the 4Ps provides
conditional cash grants to beneficiaries consisting of PhP6,000 a year (or PhP500 per month) per
household for health and nutrition expenses; and PhP3,000 for one school year----or to be exact,
10 months---(or PhP300/month) per child for educational expenses. A maximum of three
children per household is allowed. A household with three qualified children receives a subsidy
7 These studies include Schultz (2000a, b, c,), Behrman and others (2000), IFRI (2002b), and Bourguinon et. al (2003).
8 DSWD explains that this is a right-based and social development program of the national government that aims to contribute to
poverty reduction. This is patterned after the CCT program in Latin American and African countries that have had some success
in their poverty reduction and social development measures.

8
of PhP1,400/month during the school year or PhP15,000 annually as long as they comply with
the conditionalities.
In exchange, low-income families need to comply with a set of conditionalities:
1) Pregnant women must avail of pre- and post-natal care and be attended during
childbirth by a trained health professional;
2) Parents must attend family development sessions;
3) 0-5 year-old children must receive regular preventive health check-ups and vaccines;
4) 3-5 year-old children must attend daycare or preschool classes at least 85 percent of
the time;
5) 6-14 year-old children must enroll in elementary or high school and must attend at
least 85 percent of the time.
6) 6-14 year-old children must receive de-worming pills twice a year.
The time is now ripe to take stock of the situation in 10 Cebu City program sites9 where the 4Ps
had been implemented since 2008. Currently, the Pantawid Set 1 beneficiaries are included in
the governments’ extension program. After half-a-decade of its implementation in the same city,
there is a need to assess the program using scientific and qualitative means and thus create spaces
for further analysis, discussion and (eventually) improvement in the area of policy-making. This
requires, among others, eliciting information regarding member-beneficiaries’ views and
impressions toward the Philippine government’s 4Ps and the extent to which it has fulfilled the
dual objectives of social assistance and social development. To complement this, a survey
among households of non-beneficiaries in the same barangays is also needed. Such will allow
this study to compare the characteristics of beneficiaries and non-beneficiaries.
Literature Review
9 The 10 program sites, used interchangeably with the word barangay, are the upland, considerably rural Sudlon I, Sudlon II and
Tagbao. The other seven barangays are lowland/urban areas: Mambaling, Kalunasan, Sawang Calero, Tejero, T. Padilla, Duljo
Fatima and Inayawan.

9
An extensive body of literature that evaluated CCT programs found that participation in such
brings positive effects on families’ use of education and health services while concurrently
reducing poverty and child labor. The World Bank, after reviewing several evaluation studies,
was able to conclude that CCTs have improved the lives of poor people. Transfers generally have
been well targeted toward poor households, raised consumption levels, and reduced poverty by a
substantial amount in some countries. These rigorous impact evaluations have successfully
convinced political leaders in Latin America, Africa, Asia, and the Middle East to invest in CCT
programs and investigate how they can be made more effective. In a number of countries, those
impact studies have also persuaded their political leadership that when outcomes are uncertain
and budgets limited, random assignment to treatment and control among eligible poor
households is a more transparent and fairer selection procedure than political handpicking.
However, the World Bank panel of experts reviewed the existing evidence of the real impacts of
CCT programs in 2009 found some mixed results. While the programs helped reduce extreme
poverty rates, the increase in school attendance did not necessarily result in better learning
outcomes, nor did improved utilization of public health services translate into better health. The
analysis of Chaudhury and Okamura (2012) on CCT and school enrollment in the Philippines
found an almost 9 percent increase in the enrollment among the younger cohort aged 9-12 (as of
2011) who were eligible for grants under the program throughout 2008 and 2011. The program
was able to help address the education gap between beneficiary and non-beneficiary households
in a short amount of time. However, no statistically significant impact was found for the older
cohort of children aged 13-17 (as of 2011), most of whom were no longer eligible for grants due
to the age limit (14 years) set by the program. The researchers suggested that additional measures
(e.g., raising the age limit, increasing the grant amount for older children, parallel supply-side
interventions in the education sector) are required to improve educational outcomes for older
children.
Continuing policy debates concerning design of anti-poverty programs in both developed and
developing countries frequently include the question of whether or not transfers should be
conditioned on school enrollment or medical checkups of children. The conditionality of
transfers raises enforcement problems (i.e., verifying that required conditions are being met), as
well as administrative problems of coordinating schooling, medical and anti-poverty programs.

10
These would be justified only if there were substantial benefits of retaining these conditionalities.
Yet, there appears to be no clear demonstration of the nature of these benefits, either
theoretically or empirically (Mookherjee and Ray 2008).
Among literature on the determinants of participation in anti-poverty programs, most empirical
works analyzes the linear relationship between CCT program participation and household
income as a first-stage regression strategy to estimate impacts on outcomes using the propensity
score models of Chaudhury and Okamura (2012), Berhman et al. (2005, 2010). These studies
find that participation is inversely related to individual wealth, and that key correlates of poverty
(such as few assets, no land ownership, dirt floors in the home, etc.) are associated with a higher
probability of participation in welfare programs. Moffitt (1983) was one of the first to model
non-participation in social programs as a utility-maximization decision. His model emphasizes
stigma as the main cost of participation in means-tested programs, but can easily be extended to
include other types of costs such as transaction costs. However, Fiszbein and Schady (2009)
suggest that in assessing whether or not to send their children to school in response to a CCT
program, parents take into account the quality of local schools. That is, parents would more
likely enroll their children in school if the latter’s quality is higher. Llanto (2008) explains that
cash transfers have an intuitive appeal because poor households are given the choice on the
composition of their consumption bundles. They can choose what they think is best for them in
contrast to a price subsidy for commodities such as rice or other staple food, where the state
assumes it knows what the poor needs. Interestingly, Son and Florentino (2008) strongly argue
that it is imperative to have conditionalities in CCT programs, especially in increasing
significantly the school attendance. They maintain that the quality of schooling would have to be
improved when administering cash transfers aimed at sustaining poverty reduction. Targeting
children from poor households leads to greater poverty reduction at the national level since the
per-capita benefits received by the poor recipients’ families are likely to be higher under targeted
programs than universal ones. Nevertheless, the total benefits of the transfer under the targeted
programs will be partly offset by administrative costs of identifying the poor. Llanto (2008)
argues that while it is too early to make an in-depth assessment of this program because it is still
in its initial stages of design, an assessment of the program should be periodically done during its
lifetime. In Latin America, evaluation studies were done on enrolment participation vis-a-vis
performance level, health, and nutrition components while dynamics of family consumption and

11
expenditure patterns were rarely evaluated. The distribution of cash grants directly to mothers
may have an effect on resource allocations within households and on power relations. Cash
transfers may crowd out remittances and other private transfers to households or affect
households’ work incentives.
Household-level targeting may also affect community relations when not all members of a
community are covered by the program. Llanto (2008) further stresses that it is important to
monitor and evaluate the program’s impact, and make adjustments in the life of the program so
as to develop guidelines or policies on how beneficiaries are to graduate from the program.
In another study by Fernandez and Olfindo (2011), the cash transfer to beneficiary households,
which increases their household income, is estimated to reduce poverty incidence in these areas
by as much as 2.6 percentage points. Manasan (2011), in her concluding remarks, mentions that
4Ps has some early indication of success in improving school attendance. The author further
argues that the initial effect on school attendance is not as rigorous as other impact evaluation
techniques. If the 4Ps would be effective, then in some future time, some households should be
eventually graduating from the program. Whether or not the 4Ps will lead to behavioral change
and ultimately to the expected human capital impact, is an empirical matter.
In 2012, the budget allocation for the DSWD increased by PhP15.1 billion (i.e., from PhP34.4
billion in 2011 to PhP49.5 billion in 2012). This will make the DSWD the third largest gainer
among the various departments in the 2012 National Expenditure Program. The large increase in
the DSWD budget for 2012 is primarily due to the 4Ps, with the allocation for the program alone
increasing by PhP18.3 billion (or 86% of its 2011 level). This amount is meant to fund the
planned expansion in the number of families benefited by the 4Ps from 2.3 million by the end of
2011 to 3 million by the end of 2012 (Manasan 2011).
Thus, as Llanto (2008) puts it: “Taxpayers will naturally be interested to know whether the 4Ps is
a worthy use of public funds or not.” Taxpayers should, thus, be assured that the expected
benefits would be realized and that ignoring programs such as the 4Ps would lead to a great
opportunity loss in the lives of poor households. The end goal, therefore, is for this study to
determine policy implications, particularly on whether the 4Ps is an alternative or an efficient

12
and effective way of giving subsidies to low-income families, and whether the expected
outcomes for education, health, and nutrition can be achieved.
The Research Problem
This study examined the 4Ps in 10 barangays in Cebu City. Specifically, it sought to:
1) Describe the socio-demographic characteristics of 265 households, both beneficiaries and
non-beneficiaries, in different barangays in Cebu City;
2) Gauge views and impressions of 4Ps’ member-households regarding program
implementation;
3) Analyze possible determinants of the inclusion and exclusion of the beneficiaries and non-
beneficiaries of the program;
4) Solicit suggestions from beneficiaries on how best to improve the implementation of the
program at the barangay and household levels.
Limitations of the Study. The study is limited only to set 1 of the 4Ps beneficiaries in 10 program
sites in Cebu City. Data constraints on outcome variables limit the study from conducting a
rigorous impact evaluation. Moreover, this study only used limited explanatory variables found
in both survey questionnaires for beneficiaries and non-beneficiaries.
Methodology
Survey. This paper makes use of data on two groups: (1) households that participated in the
program (beneficiaries); and (2) households that were not enrolled but eligible for the program,
and lived in intervention areas (non-beneficiaries). The 10 barangays in Cebu City had a total of
2,665 beneficiaries when the program was implemented. A total of 265 households, both
beneficiaries and non-beneficiaries from 10 sites, was targeted (Table 1). This sample included
10 percent of the total number of beneficiaries. Both data groups were randomly selected.
Moreover, structured interviews (comprising of open and closed questions) were administered
using a survey instrument designed to capture socio-economic and demographic data, program

13
enrollment data, criteria for selection, program implementation information, acceptability and
level of satisfaction, impressions, benefits obtained, and issues and concerns.
Table 1: Cebu Barangays and Number of Beneficiaries.
10 Cebu City
4Ps
Barangays
Total Number of Target Number of
Households
Actual
Beneficiary-
Households
@10% only Beneficiaries Non-
beneficiaries
Duljo Fatima 253 25 13 12
Inayawan 414 41 21 20
Kalunasan 324 32 16 16
Mambaling 795 79 40 39
SawangCalero 159 16 8 8
Sudlon I 135 13 7 6
Sudlon II 188 19 10 9
T. Padilla 77 8 4 4
Tagbao 132 13 7 6
Tejero 188 19 10 9
Total 2,665 265 136 129
Key Informant Interviews and Focus Group Discussions. These components were carried out to
supplement the data generated from the survey. Semi-structured guide questions were designed
to gather qualitative data from key informants characterized by consensus, depth, and detail. For
this component, participants were purposively selected and categorized into (1) local government
unit (LGU) through the Gender and Development (GAD) focal (one from each barangay),
citilink and media officer of the Department of Social Welfare Services (DSWS); (2)
Department of Social Welfare and Development; (3) Department of Education; and (4)
Department of Health. Consent was obtained from the discussion participants and interviewees.
Furthermore, they were informed of the need to record the interview or proceedings. Data were
culled from the transcription of the proceedings particularly when qualitative data were needed
to enrich the research.
Documents Review. Secondary data analyses were carried out using the reports of the monitoring
information system of the 4Ps, to wit: (1) results of the household assessment; (2) household
beneficiary update system; (3) compliance verification system; (4) grievance redress system; and
(5) payment system.
Empirical Approach. Logistic regression analysis was employed to specifically address
objective number three in the study. A model of participation in Mexico’s CCT was adopted for

14
this study. The independent variable is participation in the program while the independent
variables used are profile of household head and spouse, household composition, asset ownership,
type of construction materials used in the house, type of water source, monthly expenditure on
electricity, and barangay-level characteristics.
Data Processing and Plan for Analysis. The survey data was processed using statistical software,
and analyzed using simple frequency distributions. Qualitative results were analyzed according
to identified themes. A comparison between the two groups of households-beneficiaries; and
households who were not enrolled but eligible for the program and lived in intervention areas
(i.e., the non-beneficiaries) were done using descriptive statistics.
Discussions
SOCIO-DEMOGRAPHIC CHARACTERISTIC OF 265 HOUSEHOLDS
(Beneficiaries and Non-Beneficiaries) from Cebu City’s Barangays
Household survey
This section provides selected socio-economic information on both beneficiary and non-
households from 10 target sites to give some context to their views and impressions on the
implementation of the 4Ps in their respective barangay. Data will serve as guide when assessing
the extent the 4Ps has contributed to achieving the government’s expected outcomes on the
education, health, and nutrition of low-income families. The level of acceptability and
satisfaction toward the 4Ps as well as the problems encountered during the project’s
implementation will be presented herein. Beneficiaries’ suggestions for improvement will also be
considered. Results are based on structured and semi-structured interviews with household heads
or their spouses.
Background characteristics
Table 1 presents the distribution of households per barangay. A total of 265 (composed of 136
beneficiaries and 129 non-beneficiaries) randomly selected households were visited and

15
interviewed. These represent 10 percent of the total number of beneficiaries in each of the 10
barangays where 4Ps were implemented. The most number of respondents were from
Mambaling, Cebu City, and the program site where the Badjao community resides. A total of 79
households were interviewed from this barangay alone. This is followed by Inayawan, another
densely populated area in Cebu City with a total of 41 households interviewed. Completing the
list of sites with the top three households interviewed is Kalunasan (32 households).
Table 2 compares beneficiaries and non-beneficiaries in terms of level of education. Among the
beneficiary households, there were considerably greater female respondents (98%) than male
(2%), owing perhaps to the fact that women-mothers are those primarily involved in the 4Ps
activities. Hence, it is also presumed that the women possess more knowledge about the program.
While Sawang Calero, Mambaling, T. Padilla, and Sudlon II registered the lowest mean age, at
37, Sudlon I registered the highest mean age, at 44, followed by Inayawan and Tagbao, at 43.
The mean age of respondents in all the 10 barangays is 40.
Table 2: Respondents’ Level of Education.
Table 2 also shows the schooling levels of the sample population. A little over 50 percent of
beneficiaries had reached or finished elementary education; more than a third have reached or
TOTAL
Code SC DF M INA TP TEJ KALU SUD1 SUD2 TAG N %
Beneficiaries
Gender
Male - - - 14.3 - - - - - - 3 2.2
Female 100 100 100 85.7 100 100 100 100 100 100 133 97.8
Education
None - - 17.5 - - - 6.3 - - 14.3 9 6.6
Elementary 37.5 53.8 45 52.4 - 30 68.8 57.1 90 57.1 70 51.5
High School 62.5 46.2 37.5 42.9 75 60 25 14.3 10 28.6 52 38.2
College - - - 4.8 25 10 - 28.6 - - 5 3.7
Mean h.s. elem. elem. h.s. h.s. h.s. elem. h.s. elem. Elem. elem.
Non-
Beneficiaries
Male - - - 10 - - - - - - 2 1.6
Female 100 100 100 90 100 100 100 100 100 100 127 98.4
Education
None
Elementary 25 8.3 20.5 35 25 11.1 18.8 100 44.4 50 36 27.9
High School 62.5 66.7 66.7 60 75 77.8 81.3 - 55.6 50 82 63.6
College 12.5 25 12.8 5 - 11.1 - - - - 11 8.5
Mean h.s. h.s. h.s. h.s. h.s. h.s. h.s. elem. h.s. h.s. high school
Mean h.s. h.s. h.s. h.s. h.s. h.s. h.s. elem. h.s. h.s. high school

16
graduated from high school; and close to 4 percent have had some years in college (See also
Figure 1). Those who have never been to school account for 7 percent of the sample. These
results show that respondents generally have low educational attainment.
On the side of the non-beneficiary households, except in Inayawan, all of the respondents are
female (98%). Barangays that registered the lowest mean age (at 32) are Sawang Calero,
Mambaling, and Kalunasan, while Sudlon I registered the highest mean age, at 47 (Table 3). On
the whole, the mean age of respondents in the 10 barangays is 36, a figure lower than that of the
beneficiary group. In reference to the schooling levels, results show that, just like in the case of
the beneficiary group, respondents generally have low educational attainment, with more than 60
percent having reach the high school level only.
Table 3 shows that 59 percent of the 136 beneficiary-respondents were born in Cebu City and 18
percent were born in other areas in Cebu Province. While 9 percent of respondents came from
other places in the Visayas region, the remaining 15 percent of them were born in other places in
the Philippines. On average, households in the 10 target sites have lived in the barangay for more
than seven years. Across all sites, households have an average of seven members.
Table 3: Respondent’s Age, Place of Origin, Length of Stay in the Barangay, Household Size
(Average), Number Age of Children (0-14). Code TOTAL
SC DF M INA TP TEJ KALU SUD1 SUD2 TAG N %
Beneficiaries Mean Age 37 39 37 43 37 41 42 44 37 43 40
Place of
Origin
Cebu City 50 69.2 55 38.1 50 70 50 85.7 70 100 80 58.8
Other places
Cebu Prov.
37.5 7.7 12.5 23.8 - 10 43.8 14.3 10 - 24 17.6
Figure 2. Level of Education, Non beneficiary
Respondent
Figure 1. Level of Education, Beneficiary Respondent

17
The proportion of children age 1-3 years and 4-6 years stands at 52 percent and 42 percent,
respectively. Children who are between the ages of seven and nine, account for 6 percent of the
sample households. Data suggest a rather large proportion of young people who will need
education and sources of employment in the future.
Most (61%) of the 129 respondents were born in Cebu City while 14 percent were born in other
places in Cebu Province. While 19 percent of respondents came from other places in the Visayas
region, the remaining 6 percent were born in other places in the Philippines. On average,
households in the 10 target sites have lived in their barangay for more than seven years. Mean
non-beneficiary households size across all 10 sites is six, which is lower compared to that of the
beneficiary group.
Other places
Visayas
12.5 - 15 9.5 25 10 - - 10 - 12 8.8
Other places
in the Phils.
- 23.1 17.5 28.6 25 10 6.3 - 10 - 20 14.7
Mean Length of
>7 yrs >7 yrs >7 yrs
>7 yrs >7 yrs >7 yrs >7 yrs >7 yrs >7 yrs >7 yrs >7 yrs
Stay in
Barangay Mean HH
Size
9 8 8 8 6 8 8 6 8 5 7
Children 0-14 yrs
1-3 25 53.8 50 61.9 50 40 50 57.1 60 71.4 71 52.2
4-6 37.5 30.8 45 38.1 50 50 50 42.9 40 28.6 57 41.9 7-9 37.5 15.4 5 - - 10 - - - - 8 5.9
N of cases 8 13 40 21 4 10 16 7 10 7 136 100
Non
Beneficiaries
Mean Age 32 35 32 39 39 41 32 47 38 33 36
Place of
Origin
Cebu City 50 75 61.5 65 50 66.7 56.3 66.7 33.3 83.3 79 61.2
Other places
Cebu Prov.
12.5 16.7 23.1 20 - - - 16.7 - 16.7 16 14
Other places
Visayas
37.5 - 7.7 15 50 33.3 37.5 - 44.4 - 24 18.6
Other places
in the Phils.
- 8.3 7.7 - - - 6.3 16.7 22.2 - 8 6.2
Mean Length of
>7yrs >7yrs >7yrs >7yrs 5-7yrs >7yrs >7yrs >7yrs >7yrs >7yrs >7yrs
Stay in
Barangay Mean HH
Size
6 6 6 7 6 6 5 8 5 5 6
Children 0-14 yrs
1-3 62.5 58.3 69.2 85 100 77.8 75 100 88.9 83.3 98 76
4-6 37.5 41.7 30.8 10 - 22.2 25 - 11.1 16.7 30 23.3 7-9 - - - 5 - - - - - - 1 0.8
N of cases 8 12 39 20 4 9 16 6 9 6 129 100

18
Households with children of age 1-3 years old account for 76 percent of the interviewed non-
beneficiaries. A little over a fifth of the households have children between the ages of 4 and 6
years. Inayawan is the only barangay whose non-beneficiary households have children aged 7-9
years (5%).
Employment and Income10
Table 4 presents the distribution of respondents and their spouses, by type of employment and
barangay. Self-employed beneficiary-respondents account for 61 percent of the sample, while 37
percent say they have no work at all. A mere 2 percent of respondents are employed. Similarly,
Figure 3b shows that majority of the spouses are self-employed (74%). Households derive
income from multiple self-employed activities such as: vending, operating a small business
(retailing: sari-sari stores), contractual services, or engaging in the transportation business (e.g.
habal-habal and jeepneys). Clearly, the data reveal that there are more unemployed respondents
in Sudlon2 (60%), T. Padilla (50%), Mambaling (47%), Kalunasan (44%) and Sawang Calero
(37%) when compared to the other areas.
Table 4. Beneficiaries and Non-Beneficiaries’ Type of Employment by Barangay
10 Table for APIS are shown in the appendix with different income deciles.
Beneficiaries TOTAL
SC DF M INA TP TEJ KALU SUD1 SUD2 TAG N %
Occupation:
Respondent
Unemployed 37.5 23.1 47.5 14.3 50 30 43.8 28.6 60 28.6 50 36.8
Employed - - - 4.8 - - 12.5 - - 3 2.2
Self-Employed 62.5 76.9 52.5 81 50 70 43.8 71.4 40 71.4 83 61
Occupation:
Spouse
Unemployed - 15.4 7.5 4.8 25 - - - 10 - 8 5.9
Employed 12.5 7.7 7.5 19 - 30 18.8 14.3 10 - 17 12.5
Self-Employed 75 76.9 77.5 66.7 75 60 68.8 71.4 80 100 101 74.3
Widow/er 12.5 - 7.5 9.5 - 10 12.5 14.3 - - 10 7.4
N of cases 8 13 40 21 4 10 16 7 10 7 136 100
Non-
Beneficiaries
Occupation:
Respondent
Unemployed 75 41.7 64.1 25 25 333 87.5 16.7 33.3 - 63 48.8

19
Figure 3a. Beneficiaries, Employment & Unemployment of
Respondent Figure 3b. Beneficiaries, Employment & Unemployment of
Spouse
Employed 12.5 16.7 - 10 - - - - - 16.7 6 4.7
Self-Employed 12.5 41.7 35.9 65 75 66.7 12.5 83.3 66.7 83.3 60 46.5
Occupation:
Spouse
Unemployed - - 2.6 5 - - 6.3 - - - 3 2.3
Employed 25 25 20.5 5 50 33.3 18.8 - 11.1 16.7 24 18.6
Self-Employed 75 41.7 76.9 65 25 33.3 75 100 66.7 66.7 86 66.7
NA (single
parent)
- 33.3 - 25 25 33.3 - - 22.2 16.7 16 12.4
N of cases 8 12 39 20 4 9 16 6 9 6 129 100
Figure 4a. Non-Beneficiaries, Employment &
Unemployment of Respondent
Figure 4b. Non-Beneficiaries, Employment &
Unemployment of Spouse

20
An overwhelming majority of respondents and their spouses do not have other sources of income
(Table 5). The income data in the same table reveal that beneficiary-households in three
barangays (Sawang Calero, Duljo Fatima, and Tejero) earn a relatively higher mean income
(between PhP5,000 to PhP8,999) than those in other areas (i.e., income of less than PhP5,000).
Table 5: Beneficiaries and Non-Beneficiaries Other Sources of income and Mean Income by
Barangay.
Nonetheless, the family income across all the 10 sites is still insufficient to meet members’ daily
needs. Only in Mambaling (2%) and Inayawan (5%) were some households found to have a
mean income of between PhP9,000 to PhP11,999. In Tejero, 10 percent of households have an
Beneficiaries TOTAL
SC DF M INA TP TEJ KALU SUD1 SUD2 TAG N %
Other sources of income,
Respondent
Yes 40 - 9.5 - - 28.6 - 60 - 40 11 13
No 60 100 90.5 100 100 71.4 100 40 100 60 75 87
N of cases 5 10 21 18 2 7 9 5 4 5 86 100
Other sources of income, Spouse
Yes 28.6 - 23.5 - 33.3 22.2 - 33.3 12.5 28.6 18 15
No 71.4 100 76.5 100 66.7 77.8 100 66.7 87.5 71.4 100 85
N of cases 7 12 34 18 3 9 14 6 8 7 118 100
Est. monthly family income
<5,000 37.5 23.1 62.5 57.1 75 60 62.5 85.7 80 100 83 61
5,000-8999 62.5 76.9 35 38.1 25 30 37.5 14.3 20 - 50 37
9,000-11,999 - - 2.5 4.8 - - - - - - 2 1.5
>12,000 - - - - - 10 - - - - 1 0.7
Mean income 5k-
8998
5k-
8998
<5000 <5000 <5000 5k-
8998
<5000 <5000 <5000 <5000 <5,000
N of cases 8 13 40 21 4 10 16 7 10 7 136 100
Non- beneficiaries
Other sources of income, Respondent
Yes - 42.9 7.1 20 - 16.7 - 20 16.7 50 13 20
No 100 57.1 92.9 80 100 83.3 100 80 83.3 50 53 80
N of cases 2 7 14 15 3 6 2 5 6 6 66 100
Other sources of income, Spouse
Yes - 25 10.5 14.3 - - 13.3 16.7 14.3 20 13 12
No 100 75 89.5 85.7 100 100 86.7 83.3 85.7 80 97 88
N of cases 8 8 38 14 3 6 15 6 7 5 110 100
Est. monthly family income
<5,000 50 33.3 71.8 60 25 55.6 75 100 100 83.3 86 67
5,000-8999 50 33.3 25.6 15 75 33.3 25 - - 16.7 32 25
9,000-11,999 - 33.3 - 20 - 11.1 - - - - 9 7
>12,000 - - 2.6 5 - - - - - - 2 1.6
Mean income 5k-
8998
5k-
8998
<5,000 5k-
8998
5k-
8998
5k-
8998
<5,000 <5,000 <5,000 <5,000 <5,000
N of cases 8 12 39 20 4 9 16 6 9 6 129 100

21
average family income of PhP12,000. The bar graph for the estimated monthly income for all 10
sites is reproduced here as Figures 5a and 5b below. Data validate that the sample beneficiary-
households are poor. As to the non-beneficiaries group, there are more unemployed (49%) than
self-employed (46%) respondents (Table 4), which is in contrast to that of the beneficiary group.
Those who say they are employed account for only 5 percent of the sample (Figures 4a and 4b).
On the other hand, the figures here also show that majority of their spouses, who are generally
males, are self-employed (67%), and close to a fifth have some form of employment. A mere 2
percent of the spouses are not engaged in any economic activity at all. Table 4 presents the
distribution of non-beneficiary respondents and their spouses, by type of employment and
barangay. Similar to the case of the beneficiary group, an overwhelming majority of non-
beneficiary respondents and their spouses do not have other sources of income (Table 5). Across
all sites, the mean monthly family income is less than PhP5,000. Hence, like the beneficiary
group, the households interviewed for this group are generally poor. The results of a comparison
between the beneficiaries and non-beneficiaries’ average income and employment are, at glance,
against one’s economic logic as they show more self-employed households in the beneficiaries
group than in the non-beneficiaries set. From the interviews, beneficiaries revealed that they
have become more entrepreneurial or have become conscious of the way they spent their money.
Aside from schooling allowances, some beneficiaries have tried investing their money in sari-
sari stores or purchasing a pig as a form of savings.
Figure 5b. Estimated Monthly Income: Non-
Beneficiaries Figure 5a. Estimated Monthly Income: Beneficiaries

22
Housing, Monthly Electricity and Water Bills, and Appliances Owned
House owners comprise 76 percent of beneficiary-respondents, but only 7 percent own the lot on
which their dwelling unit is built (Table 6). Figures 6a and 6b are graphical representations of the
house and lot ownership of the sample households. Materials used in the construction of the
houses are predominantly made of light materials (67%), but there are also mixed (29%)
structures. A mere 4 percent of the sample, live in houses made of cemented or concrete
materials. The mean number of bedroom is one, an indication that the houses are meant only for
one family. Households with electricity account for more than 60 percent of the entire
beneficiary-household sample. Barangay Tagbao, understandably because it is situated in an
upland area, registered the lowest proportion of households with electricity.
Table 6: Beneficiaries and Non-beneficiaries Housing and Monthly Electricity and Water Bills
by Barangay.
Beneficiaries TOTAL
SC DF M INA TP TEJ KALU SUD1 SUD2 TAG N %
Own House
Yes 62.5 61.5 80 71.4 - 70 93.8 85.7 80 100 103 76
No 37.5 38.5 20 28.6 100 30 6.3 14.3 20 - 33 24
Own Lot
Yes 25 7.7 2.5 4.8 - - - 28.6 10 14.3 9 6.6
No 75 92.3 97.5 95.2 100 100 100 71.4 80 85.7 127 93
Type of House
Light
materials
62.5 53.8 62.5 85.7 50 70 50 85.7 60 100 91 67
Mixed 37.5 38.5 32.5 14.3 50 20 43.8 14.3 30 - 39 29
Concrete - 7.7 5 - - 10 6.3 - 10 - 6 4.4
Mean # of 1 1 1 1 1 1 1 1 1 1 1
Bedrooms
w/ Electricity
Yes 37.5 76.9 52.5 57.1 75 100 81.3 85.7 70 14.3 86 63
No 62.5 23.1 47.5 42.9 25 - 18.8 14.3 30 85.7 50 37
Mean: 262 611 302 235 212 310 270 115 166 141 285
Electricity bill
Mean: 373 356 443 247 287 481 273 99 128 85 316
water bill
N of cases 8 13 40 21 4 10 16 7 10 7 136 100
Non-
beneficiaries
Own House
Yes 50 66.7 64.1 60 75 44.4 81.3 66.7 88.9 50 84 65
No 50 33.3 35.9 40 25 55.6 18.8 33.3 11.1 50 45 35
Own Lot
Yes - - - 10 - 11.1 6.3 - 11.1 - 5 3.9
No 100 100 100 90 100 88.9 93.8 100 88.9 100 124 96
Type of House
Light 87.5 41.7 76.9 65 100 55.6 75 83.3 100 66.7 94 73

23
The mean monthly electricity bill among the beneficiary-households is PhP285, while the mean
monthly water bill is PhP316.
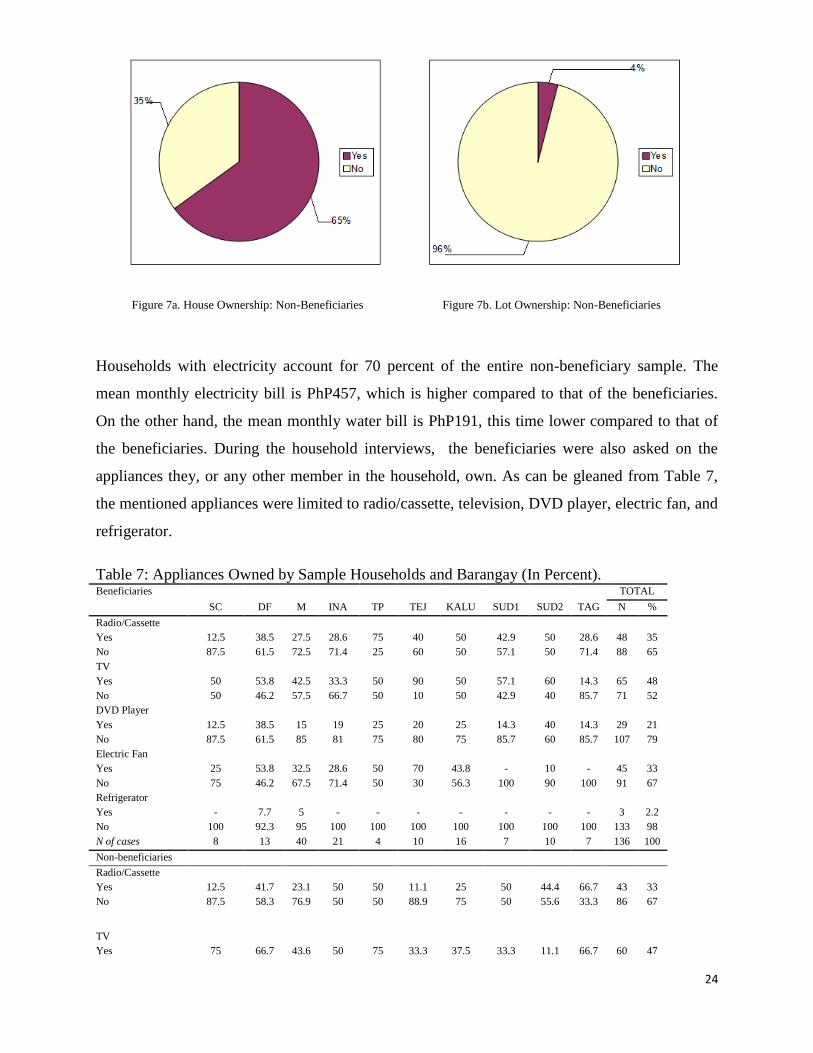
Non-beneficiary households who own their house account for 65 percent of the sample, but only
4 percent also own the lot on which their house is built (Table 7). Figures 7a and 7b are graphical
representations of the house-and-lot ownership of the non-beneficiary households. Dwelling
units are predominantly made of light materials (73%), but there are also some mixed structures
(26%). Less than 2 percent of the non-beneficiaries live in houses made of cement or concrete
materials. The mean number of bedrooms is one.
Materials
Semi- 12.5 58.3 23.1 35 - 33.3 18.8 16.7 - 33.3 33 26
Concrete
Concrete - - - - - 11.1 6.3 - - - 2 1.6
Mean # of 1 1 1 1 1 1 1 1 1 1 1
Bedrooms
w/ Electricity
Yes 87.5 91.7 61.5 70 100 44.4 62.5 50 77.8 100 90 70
No 12.5 8.3 38.5 30 - 55.6 37.5 50 22.2 - 39 30
Mean monthly 500 815 467 550 502 875 289 112 72 88 457
Electricity bill
Mean monthly 306 335 238 94 208 304 201 0 13 27 191
water bill
N of cases 8 12 39 20 4 9 16 6 9 6 129 100
Figure 6a. House Ownership: Beneficiaries Figure 6b. Lot Ownership: Beneficiaries
24
Households with electricity account for 70 percent of the entire non-beneficiary sample. The
mean monthly electricity bill is PhP457, which is higher compared to that of the beneficiaries.
On the other hand, the mean monthly water bill is PhP191, this time lower compared to that of
the beneficiaries. During the household interviews, the beneficiaries were also asked on the
appliances they, or any other member in the household, own. As can be gleaned from Table 7,
the mentioned appliances were limited to radio/cassette, television, DVD player, electric fan, and
refrigerator.
Table 7: Appliances Owned by Sample Households and Barangay (In Percent). Beneficiaries TOTAL
SC DF M INA TP TEJ KALU SUD1 SUD2 TAG N %
Radio/Cassette
Yes 12.5 38.5 27.5 28.6 75 40 50 42.9 50 28.6 48 35
No 87.5 61.5 72.5 71.4 25 60 50 57.1 50 71.4 88 65
TV
Yes 50 53.8 42.5 33.3 50 90 50 57.1 60 14.3 65 48
No 50 46.2 57.5 66.7 50 10 50 42.9 40 85.7 71 52
DVD Player
Yes 12.5 38.5 15 19 25 20 25 14.3 40 14.3 29 21
No 87.5 61.5 85 81 75 80 75 85.7 60 85.7 107 79
Electric Fan
Yes 25 53.8 32.5 28.6 50 70 43.8 - 10 - 45 33
No 75 46.2 67.5 71.4 50 30 56.3 100 90 100 91 67
Refrigerator
Yes - 7.7 5 - - - - - - - 3 2.2
No 100 92.3 95 100 100 100 100 100 100 100 133 98
N of cases 8 13 40 21 4 10 16 7 10 7 136 100
Non-beneficiaries
Radio/Cassette
Yes 12.5 41.7 23.1 50 50 11.1 25 50 44.4 66.7 43 33
No 87.5 58.3 76.9 50 50 88.9 75 50 55.6 33.3 86 67
TV
Yes 75 66.7 43.6 50 75 33.3 37.5 33.3 11.1 66.7 60 47
Figure 7a. House Ownership: Non-Beneficiaries Figure 7b. Lot Ownership: Non-Beneficiaries

25
No 25 33.3 56.4 50 25 66.7 62.5 66.7 88.9 33.3 69 54
DVD Player
Yes 25 33.3 25.6 30 - 22.2 18.8 16.7 11.1 - 29 23
No 75 66.7 74.4 70 100 77.8 81.3 83.3 88.9 100 100 78
Electric Fan
Yes 50 91.7 38.5 40 50 33.3 31.3 - - 16.7 49 38
No 50 8.3 61.5 60 50 66.7 68.8 100 100 83.3 80 62
Refrigerator
Yes - 16.7 2.6 15 25 11.1 - - - - 8 6.2
No 100 83.3 97.4 85 75 88.9 100 100 100 100 121 94
Computer
Yes - - - - - 11.1 - - - - 1 0.8
No 100 100 100 100 100 88.9 100 100 100 100 128 99
N of cases 8 12 39 20 4 9 16 6 9 6 129 100
Data thus suggest that majority do not have specific items in their household, particularly a
refrigerator (98%) and a DVD player (79%). On the other hand, television (48%) registered the
highest frequency of mentions, followed by radio/cassette (35%) and electric fan (33%).
Table 7 also presents the appliances that the non-beneficiary households own. These appliances
are similar to the items mentioned by the beneficiary group: radio/cassette, television, DVD
player, electric fan, and refrigerator. Of these items, television (47%) registered the highest
frequency of mentions, followed by electric fan (38%) and radio/cassette (33%). Unlike the
beneficiary group, a non-beneficiary household residing in Tejero owns a computer (11%). Only
6 percent across all sites have a refrigerator.
Source of Water, Garbage Disposal and Toilet Facility
On the area of health and environment, the source of water, garbage disposal system, and toilet
facility were also looked into (Table 8). Close to 40 percent of households obtain water from an
independent or private/small-scale water distributor, and this is more pronounce among Duljo
Fatima (54%), Inayawan (52%) and Sawang Calero (50%) households. The proportion of
Metropolitan Cebu Water District (or MCWD, the franchised water utility in Cebu) users stands
at 35 percent. These users are more pronounced among the T. Padilla (100%), Tejero (80%), and
Mambaling (52%) households. Some 24 percent of households in the 10 barangays get water
either from a deep well or rainwater. Only a small proportion gets water from other sources such
as rivers (2%).

26
Table 8: Source of Water, Garbage Disposal and Toilet Facility by Barangay (In Percent).
Beneficiaries TOTAL
SC DF M INA TP TEJ KALU SUD1 SUD2 TAG N %
Source of Water
MCWD 50 46.2 52.5 19 100 80 - - - - 47 35
Independent or
private
50 53.8 42.5 52.4 - 20 43.8 14.3 30 14.3 53 39
Deep well and rainwater
- - 5 28.6 - - 50 85.7 60 71.4 33 24
Other sources - - - - - - 6.3 - 10 14.3 3 2.2
Garbage
Disposal
Dumped in - - 20 14.3 - - 12.5 - 10 42.9 17 13
some corner
Burned - - 5 19 - - 12.5 28.6 40 57.1 18 13
Dug pit - - - - - - 6.3 - 20 - 3 2.2
Placed in 100 100 75 66.7 100 100 68.8 71.4 30 - 98 72
Collection
area
Toilet Facility
None/bush/ - 23.1 22.5 38.1 - - 31.3 57.1 20 100 38 28
Field
Open pit/ - 15.4 25 4.8 25 20 - 14.3 - - 17 13
Antipolo
Flush/ water- 100 61.5 52.5 57.1 75 80 68.8 28.6 80 - 81 60
Sealed
N of cases 8 13 40 21 4 10 16 7 10 7 136 100
Non-
beneficiaries
Source of Water
MCWD 12.5 66.7 12.8 - 50 77.8 12.5 - - - 25 19
Independent or
private
87.5 25 69.2 40 25 11.1 56.3 - - 16.7 57 44
Deep well and rainwater
- 8.3 17.9 15 - - 25 16.7 55.6 - 21 16
Other sources - - - 45 25 11.1 6.3 83.3 44.4 83.3 26 20
Garbage
Disposal
Dumped in - 16.7 7.7 5 - - - - - 16.7 7 5.4
Some corner
Burned - - 5.1 25 - - 31.3 66.7 44.4 83.3 25 19
Dug pit - - - - - - - - 33.3 - 3 2.3
Placed in 100 83.3 87.2 70 100 100 68.8 33.3 22.2 - 94 73
Collection
area
Toilet Facility
None/bush/ 25 - 15.4 5 - 22.2 12.5 50 11.1 - 17 13
Field
Open pit/ 12.5 16.7 41 - - - 6.3 - 11.1 - 21 16
antipolo
Flush/ water- 62.5 83.3 43.6 95 100 77.8 81.3 50 77.8 100 91 71
Sealed
N of cases 8 12 39 20 4 9 16 6 9 6 129 100
Across all sites, 72 percent of beneficiary-households dispose of garbage by placing these in the
collection area or in the designated area away from their homes. Only 13 percent dispose of their
garbage by burning or composting. While some 12 percent dump garbage in some corner, a mere
2 percent of households throw their garbage in a dug pit.

27
Meanwhile, majority (60%) of households use a sanitary (water-sealed) toilet. Close to 30
percent have no toilet facilities in their homes, but the percentage of which is worse in Tagbao
(100%) and Sudlon I (57%). The remaining 12 percent of the households use an open pit or
antipolo type.
As with the beneficiaries’ case, many non-beneficiaries obtain water from an independent or
private/small-scale water distributor (44%). It therefore appears that, whether beneficiaries or
non-beneficiaries, residents have recognized the role of small-scale water distributors in their
areas. The MCWD users account for less than one-fifth of the sample. Meanwhile, some 16
percent of the households across all 10 sites get water either from a deep well or rainwater, and a
little over 20 percent get water from other sources such as rivers. Garbage is mostly placed in the
collection area (73%), and households generally use a water-sealed type of toilet. In this group,
some 13 percent do not have any toilet facility (Table 8).
The National Household Targeting System for Poverty Reduction Data (NHTS-PR) and
Monitoring and Information System
This section discusses the results of the National Household Targeting System for Poverty
Reduction Data (NHTS-PR) in relation to the survey data earlier discussed. This complements
the results of the primary data collected in the study from the database in the NHTS-PR website.
The NHTS-PR is an information management system that identifies who and where the poor are
and is spearheaded by the Department of Social Welfare and Development (DSWD). The
system aims to establish a socio-economic database of households that will be used in identifying
the beneficiaries of national social protection programs. Households are assessed through
interviews using the household assessment form (HAF)11
. The HAFs are then encoded into a
web-based data entry application and undergo validation and checks before being subjected to
Proxy Means Test (PMT)12
, a statistical model that predicts income of the households based on
11 The HAF is a two-page questionnaire with 34 variables such as family composition, employment, education of household members, housing condition, and access to basic services.
12 PMT is a statistical method that estimates household income using observable and verifiable indicators. These variables were identified through the R-Square test, which computes the percentage strength of a variable as an indicator of income. The PMT allows accurate measures
of income without using long questionnaires and easily manipulated variables. It is proven to be an effective targeting mechanism in countries
such as Chile, Colombia, Costa Rica, Brazil, and Mexico.

28
proxy variables in HAF. More importantly, the system seeks to reduce the problems of leakage
or inclusion of non-poor as well as to lessen the exclusion or under-coverage of the poor in social
protection programs.
From the 10 program sites (or sometimes termed as barangays in this study), a total of 4,477
households13
are considered poor by the NHTS-PR database. Consistent with this study’s survey
on respondents by barangay, Mambaling garnered the highest percentage with 31 percent,
followed by Inayawan (16%), Duljo Fatima (12%), and Kalunasan (11%) (Figure 8 below).
The study then disaggregated the poor households by the following categories: urban poor,
women, youth, children and senior citizens. Findings showed that a total of 16,057 are classified
as poor children in the earlier-mentioned barangays. Mambaling, with 5,183 poor children
(31%), has the highest number (Figure 9). This is followed by Inayawan with 2,436 (or 16% of
the total number of poor children). Duljo Fatima comes next with 2,011 (12%), followed by
Kalunasan with 1,877 (11%). The rest of the sites each comprises less than 10 percent: Tejero
(7.42%), Sawang Calero (5.82%), Sudlon II (5.47%), T. Padilla (3.49%), Sudlon I (3.32%) and
Tagbao (2.81%).
13 These households are assessed through house-to-house interviews using household assessment form (HAF). Then, all encoded data undergo
validation and checking before being subjected to Proxy Means Test (PMT).
Figure 8. Poor Households in Selected Barangays in Cebu City

29
Youth poverty is another face of poverty common in developing countries. A total of 6,953
youths who reside in the 10 barangays are considered poor. Mambaling again has the highest
youth poverty at 2,145 (or 30.85% of the 10 barangays). Inayawan ranks second with 1,058 poor
youths (15.22%). Third is Kalunasan with 792 (11.39%). Completing the list of sites with
double-digit percentage numbers is Duljo Fatima with 791 individuals (11.38%). Sites with
more than 5 percent poor youths are Tejero (7.25%), Sawang Calero (6.11%), and Sudlon II
(6.03%). Meanwhile, Tagabao (4.26%), Sudlon I (3.93%) and T. Padilla (3.60%) have less than
5 percent share of the youth poverty.
Crucial to issues and policy debates is the role of women in development. Poverty of women is
also another dimension of poverty, almost true of all developing economies. The 10 barangays in
this study have a total of 13,653 poor women. Again, Mambaling has the highest number of
poor women identified by the NHTS-PR database at 4,356 (31.91% of the total number
identified). Inayawan’s 2,068 (15.15%) poor women comprise almost half of Mambaling’s
number. Next is Kalunasan, with 1,582 (11.59%) identified as poor women. This is followed by
Duljo Fatima with 4,356 (11.90%) and Kalunasan with 1,582 individuals (11.59%). Barangays
Figure 9. Share of Poor Individuals, Selected Cebu City Barangays (%)

30
with less than 10 percent share each are Tejero (7.48%), Sudlon II (5.84%), Sawang Calero
(5.82%), T. Padilla (3.51%), Tagbao (3.44%), and Sudlon I (3.37%).
Another vulnerable sector of the society is the senior citizens. In the study’s 10 barangays, there
were 563 individuals identified as senior citizens. Mambaling has the highest identified number
of senior of citizens at 193 or (34.28% of 563). Kalunasan ranks second with 63 individuals
(11.19%) while Duljo Fatima ranks third at 62 (11.01%). Fourth is Inayawan with 58 (10.30%).
The rest of the barangays each has below 10 percent of the share: Tejero (9.41%), Tagbao
(6.57%), Sudlon II (5.86%), Sawang Calero (4.26%), T. Padilla (3.91%), and Sudlon I (3.20%).
In the same barangays mentioned earlier, there is a total 28,080 urban poor. Mambaling has the
highest number of urban poor at 8,888 (31.65% of the total urban poor in 10 selected barangays).
Inayawan is next with 5,284 (15.26%), followed by Duljo Fatima, which has 3,414 women
(12.16%). Completing the list of sites with double-digit shares is Kalunasan with 3,231 urban
poor (11.56%). Below 10 percent each are Tejero, 2,099 (7.48%); Sawang Calero, 1,631
(5.81%); Sudlon II, 1,563 (5.57%); T. Padilla, 998 (3.55%); Sudlon I, 994 (3.54%) and Tagbao,
978 (3.48%).
Access to or having electricity is another indicator of households’ welfare. Among the 10
barangays, it is notable that the upland/rural areas have less access to electricity---e.g., 95.63
percent of households in Tagbao do not have electricity (Figure 10). This is also true in Sudlon I,
another upland/rural barangay, and Sudlon II, where 76.67 percent and 52.43 percent,
respectively, are poor households without electricity. On the other hand, it is the urban barangays
(lowland) in Cebu City that have access to electricity. Duljo Fatima has the highest percentage of
poor households with electricity (72.96%), followed by Tejero (70.48%), T. Padilla (66.89%),
Sawang Calero (62.07%), and Mambaling (61.64%).

31
Relatedly, households’ welfare is also determined via ownership of some form of durable assets
such as electrical appliances: television, electric fan or even air conditioning units. Ownership of
these appliances indicates a certain level of income and/or wealth in a family.
In general, roofs of poor households in sample barangays in Cebu City are made of light
materials (type A). This is the case in T. Padilla (64.19%), Tejero (53.02%), Inayawan (49.08%),
Tagbao (46.99%), Duljo Fatima (44.36%), Sawang Calero (39.85%), and Sudlon I (31.67%).
On the other hand, Type B roofs, which consisted of salvaged materials, are prevalent in Tagbao
(42.70%), Kalunasan (39. 26%), and Mambaling (37.79%).
Type C, or those made of strong materials, is relatively common in Mambaling and Sudlon I,
while type D ones (mixed but predominantly light) can be found in Duljo Fatima and T. Padilla.
Both Type E (mixed but predominantly salvaged) and Type F (mixed but predominantly strong)
can be found more in Sawang Calero and Sudlon (Figure 11).
Figure 10. Poor Households in selected barangays in Cebu
City, %

32
Notes: Type A- Light Materials Type B- Salvage Materials, Type C- Strong Materials, Type D- Mixed but
Predominantly Light, Type E- Mixed but Predominantly Salvage, Type F- Mixed but Predominantly Strong
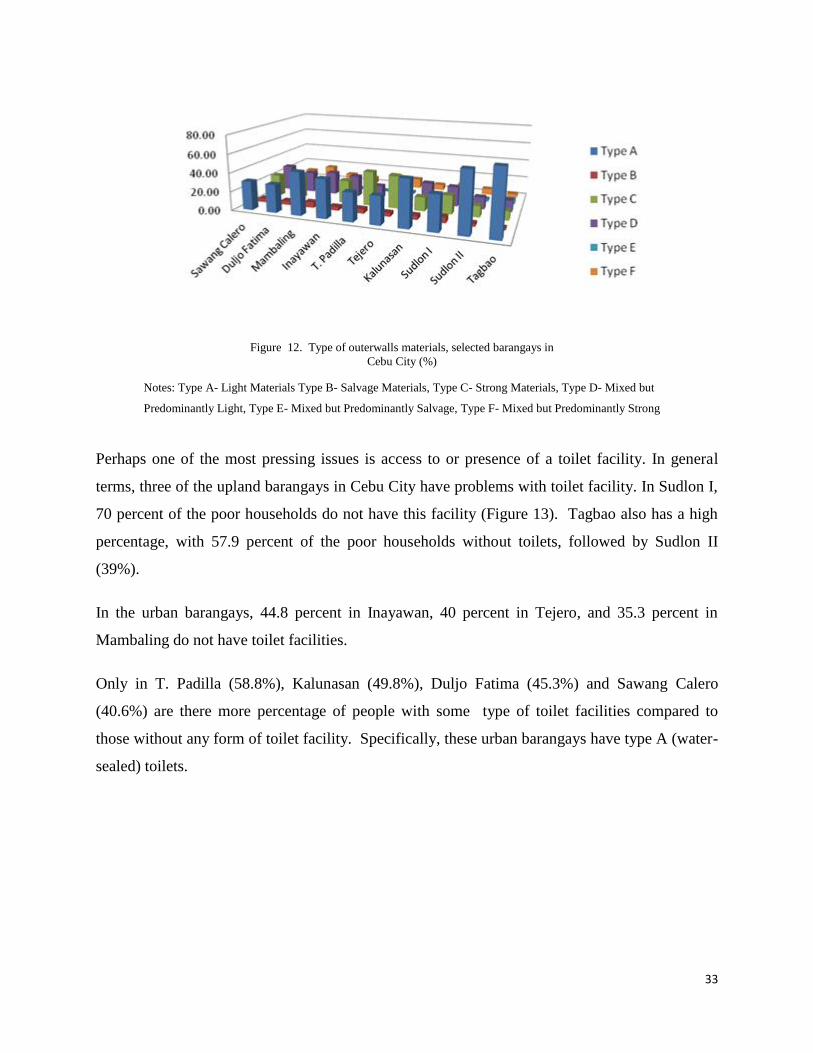
Aside from the roofing materials, another housing characteristic is the materials used for outer
walls. Type A or light materials are the commonly used materials in the walls of households in
the 10 selected barangays in Cebu City. Among these barangays, 68.31 percent of the housing
walls of Tagbao’s poor households are made of light materials (Figure 12). This is followed by
Sudlon II and Kalunasan with 63.30 percent and 49.41 percent, respectively. Likewise, the outer
walls of most poor households in Mambaling (45.69%) are made of light materials. This is also
true in Inayawan (41.13%), Sudlon I (37.22%), Sawang Calero (30.65%), and Duljo Fatima
(29.96%). Only in barangays T. Padilla (37.16%) and Tejero (34.92%) are poor households’
outer walls made of type C (strong) materials. Although it comprises less than the majority, type
C is common in Sawang Calero (23.37%), Duljo Fatima (24.71%), Inayawan (24.68%), and
Sudlon I (20%).
It is also notable that type B (salvaged materials) outer walls comprise less than 5 percent of the
majority of the barangay households, except in Sudlon I (6.11%). Type D (mixed but
predominantly light) is common in Sawang Calero (27.20%), Mambaling (24.98%), Inayawan
(22.70%), Kalunasan (22.66%), Duljo Fatima (21.98%), and Sudlon I (21.11%).
Figure 11. Type of roof materials, selected barangays in Cebu
City (%)
33
Notes: Type A- Light Materials Type B- Salvage Materials, Type C- Strong Materials, Type D- Mixed but
Predominantly Light, Type E- Mixed but Predominantly Salvage, Type F- Mixed but Predominantly Strong
Perhaps one of the most pressing issues is access to or presence of a toilet facility. In general
terms, three of the upland barangays in Cebu City have problems with toilet facility. In Sudlon I,
70 percent of the poor households do not have this facility (Figure 13). Tagbao also has a high
percentage, with 57.9 percent of the poor households without toilets, followed by Sudlon II
(39%).
In the urban barangays, 44.8 percent in Inayawan, 40 percent in Tejero, and 35.3 percent in
Mambaling do not have toilet facilities.
Only in T. Padilla (58.8%), Kalunasan (49.8%), Duljo Fatima (45.3%) and Sawang Calero
(40.6%) are there more percentage of people with some type of toilet facilities compared to
those without any form of toilet facility. Specifically, these urban barangays have type A (water-
sealed) toilets.
Figure 12. Type of outerwalls materials, selected barangays in
Cebu City (%)

34
The increase in the number of children attending school can perhaps be considered a part of the
program’s outcome indicators. As per the NHTS-PR database, there is a total of 8,398 children in
school whereas 4,049 are not attending school. Figure 14 below shows an indicative increase in
percentage of children between 3-18 years old who are attending school versus those not in
schools. Among the 10 barangays, Barangay T. Padilla has the highest percentage of children
attending school (77.8%) as opposed to those who are not (22.2%). This is followed by Sudlon I,
where 73.5 percent of the children are in school while 26.5 percent are not. Tejero also has a
higher percentage of children in school (73.8% versus 26.5% that are not attending school).
Figure 13. Type of toilet facility, selected barangays in Cebu
City (%)
Figure 14. Attending and not attending School, selected barangays in
Cebu City (%)

35
Conversely, the barangays with a higher percentage of children not attending school are Sudlon
II (40.1%), Mambaling 36.2%, and Tagbao (34.6%). The DSWD’s community verification
system (CVS) provides updates with regard to the beneficiaries’ details on complaints,
compliance and non-compliance on attendance in school, de-worming and attendance on family
development sessions. Figure 15 shows that most of the complaints lodged by beneficiaries
pertain to the payment system. From 2011 up to third quarter of 2012, there were 80 complaints
on payments. These complaints stem from some beneficiaries’ inability to comply with the
conditionalities imposed upon them. In Cebu City, beneficiaries have cash cards. Automated
Teller Machines are likewise accessible in the city. This is, however, not the case in the upland
areas, where the barangay vehicles are needed and utilized by the focal person and beneficiaries
to travel to the city proper so as to withdraw their funds.
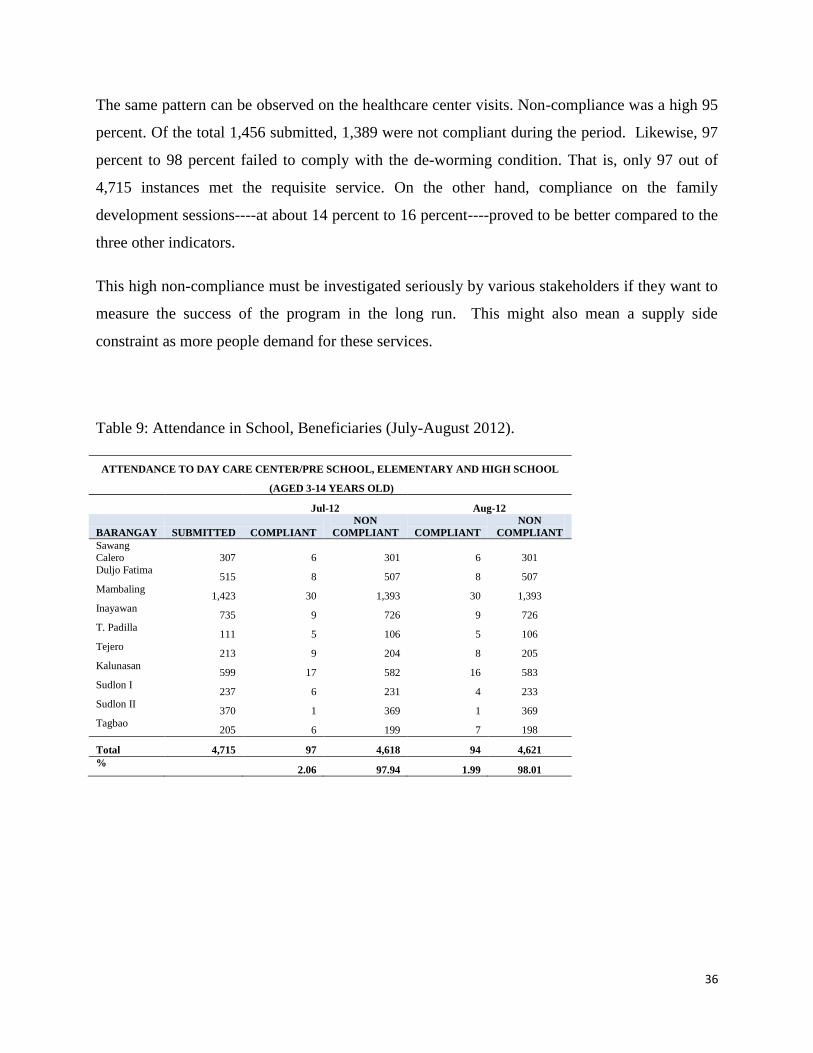
Tables 9, 10 and 11 show the percentage of compliance and non-compliance of the beneficiaries.
Table 9 presents the attendance of children from July to August 2012. There were 4,618 (July
2012) and 4,621 (August 2012) non-compliant instances during the mentioned periods. Non-
compliance for the two-month period was around 97 percent to 98 percent; conversely, the
compliance rate was very minimal at 2 percent to 3 percent only. Although the data is very
limited, this is enough to give one a sense of the compliance; after all, non-compliance of the
conditionalities means deductions on the monthly cash grant.
Figure 15. Grievance System and category of complaints,
2011-2012 (3rd Q)
36
The same pattern can be observed on the healthcare center visits. Non-compliance was a high 95
percent. Of the total 1,456 submitted, 1,389 were not compliant during the period. Likewise, 97
percent to 98 percent failed to comply with the de-worming condition. That is, only 97 out of
4,715 instances met the requisite service. On the other hand, compliance on the family
development sessions----at about 14 percent to 16 percent----proved to be better compared to the
three other indicators.
This high non-compliance must be investigated seriously by various stakeholders if they want to
measure the success of the program in the long run. This might also mean a supply side
constraint as more people demand for these services.
Table 9: Attendance in School, Beneficiaries (July-August 2012).
ATTENDANCE TO DAY CARE CENTER/PRE SCHOOL, ELEMENTARY AND HIGH SCHOOL
(AGED 3-14 YEARS OLD)
Jul-12 Aug-12
BARANGAY SUBMITTED COMPLIANT
NON
COMPLIANT COMPLIANT
NON
COMPLIANT
Sawang Calero 307 6 301 6 301
Duljo Fatima 515 8 507 8 507
Mambaling 1,423 30 1,393 30 1,393
Inayawan 735 9 726 9 726
T. Padilla 111 5 106 5 106
Tejero 213 9 204 8 205
Kalunasan 599 17 582 16 583
Sudlon I 237 6 231 4 233
Sudlon II 370 1 369 1 369
Tagbao 205 6 199 7 198
Total 4,715 97 4,618 94 4,621
% 2.06 97.94 1.99 98.01

37
Table 10: Health Center Visits, Beneficiaries (July-August 2012).
HEALTH CENTER VISITS (SET 1-5)
Jul-12 Aug-12
BARANGAY SUBMITTED COMPLIANT
NON
COMPLIANT COMPLIANT
NON
COMPLIANT
Sawang Calero 98 0 98 0 98
Duljo Fatima 134 0 134 0 134
Mambaling 467 17 450 17 450
Inayawan 226 9 217 9 217
T. Padilla 49 9 40 9 40
Tejero 98 0 98 0 98
Kalunasan 177 14 163 14 163
Sudlon I 63 4 59 4 59
Sudlon II 103 13 90 12 91
Tagbao 41 1 40 1 40
Total 1,456 67 1,389 66 1,390
% 4.60 95.40 4.53 95.47
Table 11: Attendance to Family Development Sessions (July-August 2012).
ATTENDANCE TO FAMILY DEVELOPMENT SESSIONS (SET 1-5)
Jul-12 Aug-12
BARANGAY SUBMITTED COMPLIANT
NON
COMPLIANT COMPLIANT
NON
COMPLIANT
Sawang
Calero 148 57 91 12 136
Duljo Fatima 248 70 178 13 235
Mambaling 761 49 712 38 723
Inayawan 398 25 373 95 303
T. Padilla 74 19 55 21 53
Tejero 182 2 180 32 150
Kalunasan 306 131 175 32 274
Sudlon I 128 7 121 18 110
Sudlon II 181 23 158 82 99
Tagbao 115 30 85 17 98
Total 2,541 413 2,128 360 2,181
% 16.25 83.75 14.17 85.83

38
VIEWS AND IMPRESSIONS OF 4PS MEMBER-HOUSEHOLDS
ON THE PROGRAM’S IMPLEMENTATION
Enrolment in the Program and Seminars Attended
In Table 12 and Figure 16, one can see that there is an almost equal proportion of beneficiary-
households in this study who have been enrolled in and accepted to the 4Ps in 2009 (49%) and
2010 (51%).
Table 12: Year Enrolled in the Program (In Percent). N %
2009 67 49.3
2010 69 50.7
N of cases 136 100
N of cases 136 100
Table 13 presents the 4Ps-related seminars that participants or their spouses had attended as part
of their obligation to the program. Topics mentioned include: the 4Ps, values formation, family
development, empowerment, responsible parenthood, domestic violence, family planning, and
immunization and healthcare.
Figure 16. Year of Enrollment to the Program

39
Table 13: Seminars Attended by Barangay (In Percent).
SC
DF
M
INA
TP
TEJ
KAL
U
SUD1
SUD2
TAG
TOTAL
N %
The 4 Ps
Program
Yes
100.0 100.0 95.0 95.2 100.
0
50.0 100.0 100.0 100.0 71.4 12
6
92.6
No
- - 5.0 4.8 - 50.0 - - - 28.6 10 7.4
Values
Formation
Yes
25.0 38.5 27.5 38.1 25.0 20.0 50.0 14.3 20.0 28.6 42 30.9
No
75.0 61.5 72.5 61.9 75.0 80.0 50.0 85.7 80.0 71.4 94 69.1
Family
Developme
nt
Yes
37.5 61.5 55.0 52.4 50.0 50.0 75.0 42.9 40.0 42.9 73 53.7
No
62.5 38.5 45.0 47.6 50.0 50.0 25.0 57.1 60.0 57.1 63 46.3
Empowerm
ent
Yes
12.5 15.4 5.0 4.8 - - 6.3 14.3 - - 8 5.9
No
87.5 84.6 95.0 95.2 100.
0
100.0 93.8 85.7 100.0 100.0 12
8
94.1
Responsibl
e
Parenthood
Yes
25.0 76.9 65.0 76.2 50.0 30.0 75.0 57.1 40.0 28.6 81 59.6
No
75.0 23.1 35.0 23.8 50.0 70.0 25.0 42.9 60.0 71.4 55 40.4
Domestic
Violence
Yes
12.5 53.8 12.5 19.0 - - 25.0 14.3 10.0 - 23 16.9
No
87.5 46.2 87.5 81.0 100.
0
100.0 75.0 85.7 90.0 100.0 11
3
83.1
Family
Planning
Yes
37.5 69.2 65.0 47.6 75.0 10.0 68.8 57.1 30.0 14.3 71 52.2
No
62.5 30.8 35.0 52.4 25.0 90.0 31.3 42.8 70.0 85.7 65 47.8
Immunizati
on &
Healthcare
Yes
12.5 76.9 47.5 47.6 - - 81.3 71.4 - - 58 42.6
No
87.5 23.1 52.5 52.4 100.
0
100.0 18.8 28.6 100.0 100.0 78 57.4
Mean:
Attendance
in seminars
some-times Alway
s
alway
s
alway
s
Alw
ays
some-
times
alway
s
alway
s
alway
s
some-
times
always
N of cases 8 13 40 21 4 10 16 7 10 7 136 100

40
It appears that, other than the meeting/seminar that discusses the conditions of the 4Ps (93%),
topics that garnered the most mention from participants relate to family concerns such as
responsible parenthood (60%), family development (54%), and family planning (52%). Other
seminars that registered higher frequency of mentions are those on immunization and healthcare
(43%), and values formation (31%). On the other hand, issues/topics related to domestic violence
(17%) and empowerment (6%) were seldom mentioned.
Table 13 shows that when asked about the frequency of attendance in seminars, respondents in
Sawang Calero, Tejero, and Tagbao, on average, “sometimes” did not attend and therefore had not
participated in the activities of the program. In general, however, respondents in the 10 target sites
had “always” attended the required seminars.
Perceived reasons why recruited and accepted to the program
Table 14 below shows that when asked about the reasons their household was recruited and
accepted to the program, most answers given were “very poor household” (92%), followed by
“have children age 0-14” (49%). This implies that beneficiary-households are aware that the 4Ps
is primarily for low-income families, particularly those with children age 0-14 years.
Table 14: Perceived Reasons Why Recruited and Accepted to the Program by the Barangay (In
Percent).
SC
DF
M
INA
TP
TEJ
KALU
SUD1
SUD2
TAG
TOTAL
N %
Very poor HH
Yes 100.0 69.2 97.5 95.2 100.0 70.0 87.5 100.0 100.0 100.0 125 91.9
No - 30.8 2.5 4.8 - 30.0 12.5 - - - 11 8.1
Have children 0-
14 years
Yes 25.0 46.2 67.5 38.1 75.0 30.0 62.5 42.9 40.0 14.3 67 49.3
No 75.0 53.8 32.5 61.9 25.0 70.0 37.5 57.1 60.0 85.7 69 50.7
Agreed to meet
conditions
Yes 12.5 - 2.5 - - - - - - - 2 1.5
No 87.5 100.0 97.5 100.0 100.0 100.0 100.0 100.0 100.0 100.0 134 98.5
N of cases 8 13 40 21 4 10 16 7 10 7 136 100

41
As can be gleaned from Table 14 and Figure 17, a significantly high proportion of beneficiary-
respondents across sites did not mention anything about agreeing to comply with or meeting the
conditions of the program as a reason their application was accepted. Households that said they
were accepted to the program because they have children ages 0-14 are prominently from T.
Padilla (75%), Mambaling (67%), and Kalunasan (62%).
Education-related information
On average, the estimated education-related expense for all 10 sites is PhP204 per month. This
includes the child’s (or children’s) daily allowance, transportation (if any) expenses, and school
supplies. Data presented in Table 15 show that, in all target sites, majority of respondents (93%)
claimed that their children go to school “everyday”.
Table 15: Mean Expenses Per Week and Frequency of School Attendance by Barangay.
SC
DF
M
INA
TP
TEJ
KALU
SUD1
SUD2
TAG
TOTAL
N %
Estimated
expenditures per
week (Mean)
229
202
229
184
202
243
169
186
207
131
204.00
Frequency of
school
attendance in a
week
Everyday 87.5 92.3 90.0 90.5 100.0 100.0 93.8 100.0 100.0 85.7 126 92.6
4x a week - - 5.0 - - - - - - 14.3 3 2.2
3x a week 12.5 - - 4.8 - - - - - - 2 1.5
Figure 17. Perceived Reasons Respondents Were Accepted
42
drop out - 7.7 5.0 4.8 - - 6.3 - - - 5 3.7
N of cases 8 13 40 21 4 10 16 7 10 7 136 100
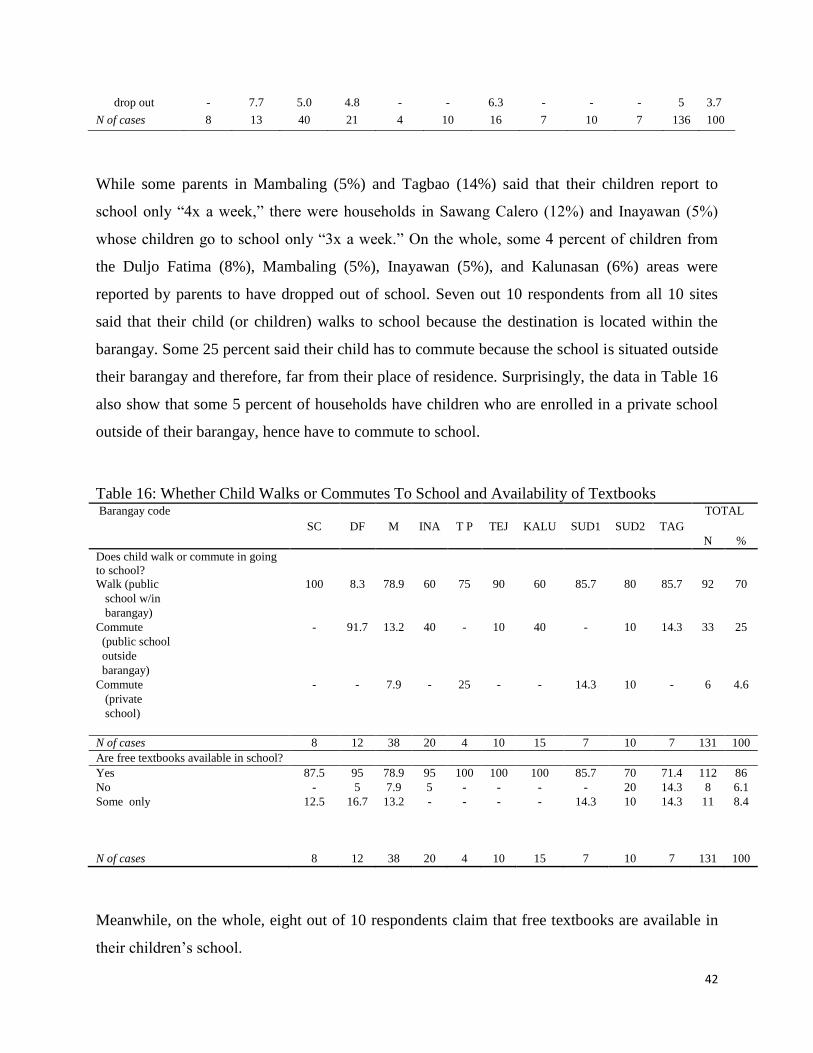
While some parents in Mambaling (5%) and Tagbao (14%) said that their children report to
school only “4x a week,” there were households in Sawang Calero (12%) and Inayawan (5%)
whose children go to school only “3x a week.” On the whole, some 4 percent of children from
the Duljo Fatima (8%), Mambaling (5%), Inayawan (5%), and Kalunasan (6%) areas were
reported by parents to have dropped out of school. Seven out 10 respondents from all 10 sites
said that their child (or children) walks to school because the destination is located within the
barangay. Some 25 percent said their child has to commute because the school is situated outside
their barangay and therefore, far from their place of residence. Surprisingly, the data in Table 16
also show that some 5 percent of households have children who are enrolled in a private school
outside of their barangay, hence have to commute to school.
Table 16: Whether Child Walks or Commutes To School and Availability of Textbooks Barangay code TOTAL
SC DF M INA T P TEJ KALU SUD1 SUD2 TAG
N %
Does child walk or commute in going
to school?
Walk (public 100 8.3 78.9 60 75 90 60 85.7 80 85.7 92 70
school w/in
barangay)
Commute - 91.7 13.2 40 - 10 40 - 10 14.3 33 25
(public school
outside
barangay)
Commute - - 7.9 - 25 - - 14.3 10 - 6 4.6
(private
school)
N of cases 8 12 38 20 4 10 15 7 10 7 131 100
Are free textbooks available in school?
Yes 87.5 95 78.9 95 100 100 100 85.7 70 71.4 112 86
No - 5 7.9 5 - - - - 20 14.3 8 6.1
Some only 12.5 16.7 13.2 - - - - 14.3 10 14.3 11 8.4
N of cases 8 12 38 20 4 10 15 7 10 7 131 100
Meanwhile, on the whole, eight out of 10 respondents claim that free textbooks are available in
their children’s school.
43
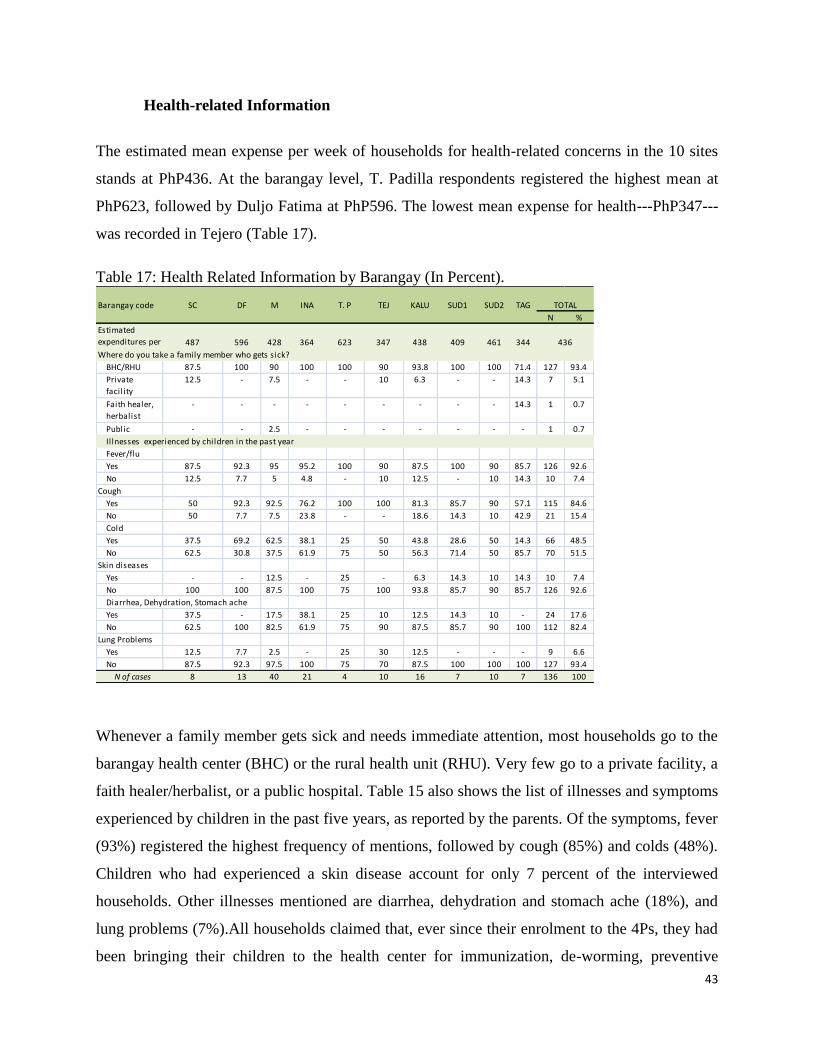
Health-related Information
The estimated mean expense per week of households for health-related concerns in the 10 sites
stands at PhP436. At the barangay level, T. Padilla respondents registered the highest mean at
PhP623, followed by Duljo Fatima at PhP596. The lowest mean expense for health---PhP347---
was recorded in Tejero (Table 17).
Table 17: Health Related Information by Barangay (In Percent).
Barangay code SC DF M INA T. P TEJ KALU SUD1 SUD2 TAG
N %
487 596 428 364 623 347 438 409 461 344
Where do you take a family member who gets sick?
BHC/RHU 87.5 100 90 100 100 90 93.8 100 100 71.4 127 93.4
Public
Hospital
- - 2.5 - - - - - - - 1 0.7
Illnesses experienced by children in the past year
Fever/flu
Yes 87.5 92.3 95 95.2 100 90 87.5 100 90 85.7 126 92.6
No 12.5 7.7 5 4.8 - 10 12.5 - 10 14.3 10 7.4
Cough
Yes 50 92.3 92.5 76.2 100 100 81.3 85.7 90 57.1 115 84.6
No 50 7.7 7.5 23.8 - - 18.6 14.3 10 42.9 21 15.4
Cold
Yes 37.5 69.2 62.5 38.1 25 50 43.8 28.6 50 14.3 66 48.5
No 62.5 30.8 37.5 61.9 75 50 56.3 71.4 50 85.7 70 51.5
Skin diseases
Yes - - 12.5 - 25 - 6.3 14.3 10 14.3 10 7.4
No 100 100 87.5 100 75 100 93.8 85.7 90 85.7 126 92.6
Diarrhea, Dehydration, Stomach ache
Yes 37.5 - 17.5 38.1 25 10 12.5 14.3 10 - 24 17.6
No 62.5 100 82.5 61.9 75 90 87.5 85.7 90 100 112 82.4
Lung Problems
Yes 12.5 7.7 2.5 - 25 30 12.5 - - - 9 6.6
No 87.5 92.3 97.5 100 75 70 87.5 100 100 100 127 93.4
N of cases 8 13 40 21 4 10 16 7 10 7 136 100
Private
facil ity
12.5 - 7.5 -
Estimated
expenditures per
week (mean)436
TOTAL
14.3 7 5.1
Faith healer,
herbalist
- - - - - - - - - 14.3 1 0.7
- 10 6.3 - -
Whenever a family member gets sick and needs immediate attention, most households go to the
barangay health center (BHC) or the rural health unit (RHU). Very few go to a private facility, a
faith healer/herbalist, or a public hospital. Table 15 also shows the list of illnesses and symptoms
experienced by children in the past five years, as reported by the parents. Of the symptoms, fever
(93%) registered the highest frequency of mentions, followed by cough (85%) and colds (48%).
Children who had experienced a skin disease account for only 7 percent of the interviewed
households. Other illnesses mentioned are diarrhea, dehydration and stomach ache (18%), and
lung problems (7%).All households claimed that, ever since their enrolment to the 4Ps, they had
been bringing their children to the health center for immunization, de-worming, preventive

44
health check-ups, and other health concerns. Many households also said that medicines were
available at the barangay health center.
Table 18, which lists the type of services at the health facility, shows that majority go for
consultations (98%) and treatment (60%).
Table 18: Immunization, Availability of Medicine, and Type of Services Availed of at the
Barangay ‘s Facility (In Percent).
Impressions on the Pantawid Program
Table 19 enumerates the responses obtained from participants on what drove them to enroll in
the program. Here, some replied that it was their inclusion in the list that had prompted them to
enrol in the program. Nonetheless, the data also show that respondents knew the 4Ps program
was primarily to assist low-income households, particularly on children’s education, health, and
other basic needs. Interestingly, the respondents mentioned as well the learning experiences they
could gain from the seminars.
Barangay code SC DF M INA T. P TEJ KALU SUD1 SUD2 TAG
N %
Yes 100 100 100 100 100 100 100 100 100 100 136 100
No - - - - - - - - - - - -
Yes 75 100 85 95.2 75 70 93.8 71.4 60 14.3 110 80.9
No 12.5 - 15 4.8 25 30 6.3 28.6 40 85.7 25 18.4
Sometimes 12.5 - - - - - 1 0.7
Type of services availed of the RHU/BHU?
Consultations
Yes 100 100 100 90.5 100 100 93.8 100 100 100 133 97.8
No - - - 9.5 - - 6.3 - - - 3 2.2
Counseling
Yes 50 30.8 10 23.8 25 10 6.3 - - - 20 14.7
No 50 69.2 90 76.2 75 90 93.8 100 100 100 116 85.3
Treatment
Yes - 100 50 66.7 25 10 93.8 71.4 80 71.4 82 60.3
No 100 - 50 33.3 75 90 6.3 28.6 20 28.6 54 39.7
Information
Yes - - - 4.8 25 20 - - - 14.3 5 3.7
No 100 100 100 95.2 75 80 100 100 100 85.7 131 96.3
N of cases 8 13 40 21 4 10 16 7 10 7 136 100
Children brought to HC for immunization, de-worming, preventive health check-ups, etc
Are medicines available at the BHC?
TOTAL

45
Table 19: Reasons that Prompted Households to Enroll in the Program and Level of Satisfaction
By Barangay (In Percent).
In Table 19, one can see that the overwhelming majority responded in the affirmative when
asked whether they were satisfied with the way the 4Ps program was handled in their barangay.
More than 50 percent of respondents gave a rating of 10, and almost all said that the 4Ps
provided an important and fair assistance package to families who are in need.
Reasons respondents were satisfied with the 4Ps are shown in Table 20. For one, the program
had helped them as well as their children’s education. Only 3.3 percent agreed that the program
helped them in terms of their children’s healthcare and had provided knowledge via the seminars
Barangay code SC DF M INA T. P TEJ KALU SUD1 SUD2 TAG
N %
To avail of education assistance
Mentioned 12.5 23.1 30 42.9 0 10 56.3 42.9 20 42.9 43 31.6
To avail of assistance for basic HH needs
Mentioned 37.5 7.7 50 28.6 25 30 43.8 28.6 30 57.1 50 36.8
To avail of assistance for children’s needs
Mentioned - 38.5 10 4.8 - - 12.5 - 10 - 13 9.6
To avail of assistance from government to poor HHs
Mentioned - 15.4 2.5 9.5 - - 6.3 - - - 6 4.4
To learn from the seminars
Mentioned - 7.7 5 4.8 - - - 14.3 - - 5 3.7
Good for children’s health
Mentioned - - 5 - - - - - - - 2 1.5
Was included in the list
Mentioned 62.5 15.4 20 19 75 70 12.5 28.6 40 14.3 38 27.9
N of cases 8 13 40 21 4 10 16 7 10 7 136 100
Are you satisfied with the way the 4Ps Program has been handled?
Yes 87.5 92.3 97.5 95.2 100 100 93.8 100 100 71.4 129 94.9
No 12.5 7.7 2.5 4.8 - 6.3 - - 28.6 7 5.1
On a scale of 1-10, How would you rate the program?
5 12.5 - 2.5 - 50 - - - - 50 5 3.7
6 - - - 4.8 - - 6.3 - - - 2 1.5
7 - 7.7 5 14.3 - 20 - - - - 9 6.6
8 12.5 23.1 17.5 33.3 - - 31.3 28.6 20 - 28 20.6
9 12.5 23.1 5 4.8 - - 25 14.3 20 - 15 11
10 62.5 46.2 70 42.9 50 80 37.5 57.1 60 50 77 56.6
Do you feel that the 4Ps Program provides an important & fair assistance package to families in need?
Yes 100 84.6 95 81 100 90 81.3 100 100 85.7 123 90.4
No - 15.4 5 9.5 - 10 18.8 - - 14.3 11 8.1
DK/NR - - - 9.5 - - - - - - 2 1.5
N of cases 8 13 40 21 4 10 16 7 10 7 136 100
TOTAL

46
they attended. Among those who responded in the negative, there was either the perception that
the selection was unfair; or the sentiment that their monetary allowance was not enough or did
not reach them at all.
Table 20: Reasons the 4Ps Provides an Important and Fair Assistance Package, by Barangay.
Participants were also asked whether there were venues for their complaints. Seven out of 10
said “yes.” Table 21 shows further details on their responses. Thirty-six percent mentioned that
“consultations with the leaders are done whenever a problem arises”. One can see in the same
table, however, that there were more participants who answered otherwise (64%). Close to 90
percent also said that either the DSWD or the GAD focal person does not ask if the beneficiaries
encountered problems with the implementation. Other complaints include: forms/”grievance
paper” not handed out to them (87%); and complainants are not called to a meeting (88%).
Barangay code SC DF M INA T. P TEJ KALU SUD1 SUD2 TAG
N %
Affirmative answers
Has helped many poor HHs
Mentioned 62.5 90.9 57.9 35.3 75 88.9 46.2 57.1 40 33.3 70 56.9
Fair in the selection of members
Mentioned 12.5 36.4 15.8 11.8 25 - 15.4 14.3 10 - 18 14.6
Has provided many inputs in the seminars
Mentioned - - - 17.6 - - 7.7 - - - 4 3.3
Has helped children’s education
Mentioned 62.5 18.2 50 47.1 75 77.8 69.2 57.1 80 83.3 70 56.9
Has helped in the health care of children
Mentioned - 9.1 - 5.9 - 11.1 7.7 - - - 4 3.3
Received allowance as promised
Mentioned - - 2.6 - - - - - - - 1 0.8
N of cases 8 11 38 17 4 9 13 7 10 6 123 100
Negative answers
NOT fair in the selection
Mentioned - 100 50 50 - 100 33.3 - - - 6 54.5
Lacking allowance/ did not receive at all
Mentioned - 100 50 50 - - 33.3 - - 100 5 45.5
N of cases 0 2 2 2 0 1 3 0 0 1 11 100
TOTAL

47
Table 21: Avenues for Complaints by Barangay (In Percent).
When asked about the specific benefits obtained from the project, responses included school fees,
school supplies, uniform and shoes, health services, seminars, good food, and medicine (Table
22).
Barangay code SC DF M INA T. P TEJ KALU SUD1 SUD2 TAG
N %
Yes 75 76.9 77.5 57.1 100 90 50 71.4 60 100 98 72.1
No - 23.1 12.5 33.3 - - 31.3 28.6 20 - 24 17.6
DK/NR 25 - 10 9.5 - 10 18.8 - 20 - 14 10.3
N of cases 8 13 40 21 4 10 16 7 10 7 136 100
REASONS
Consultation with Leaders about the problems
Mentioned 50 10 51.6 41.7 25 22.2 25 40 16.7 28.6 35 35.7
No 50 90 48.4 58.3 75 77.8 75 60 83.3 71.4 63 64.3
Are asked about our problems by the DSWD or GAD focal person
Mentioned - 20 3.2 16.7 75 11.1 12.5 20 - 14.3 12 12.2
No 100 80 96.8 83.3 25 88.9 87.5 80 100 85.7 86 87.8
Provided a form, “grievance paper”
Mentioned 16.7 30 6.5 - - 33.3 25 - 33.3 - 13 13.3
No 83.3 70 83.3 100 100 66.7 75 100 66.7 100 85 86.7
Those w/ complaints are called to a meeting
Mentioned 16.7 - 9.7 8.3 - 22.2 12.5 20 50 - 12 12.2
No 83.3 100 90.3 91.7 100 77.8 87.5 80 50 100 86 87.8
We do not complain
Mentioned 16.7 40 25.8 33.3 - 11.1 25 20 - 57.1 25 25.5
N of cases 6 10 31 12 7 9 8 5 6 7 98 100
TOTAL
42.9 73 74.5100 88.9 75 80 100No 83.3 60 74.2 66.7
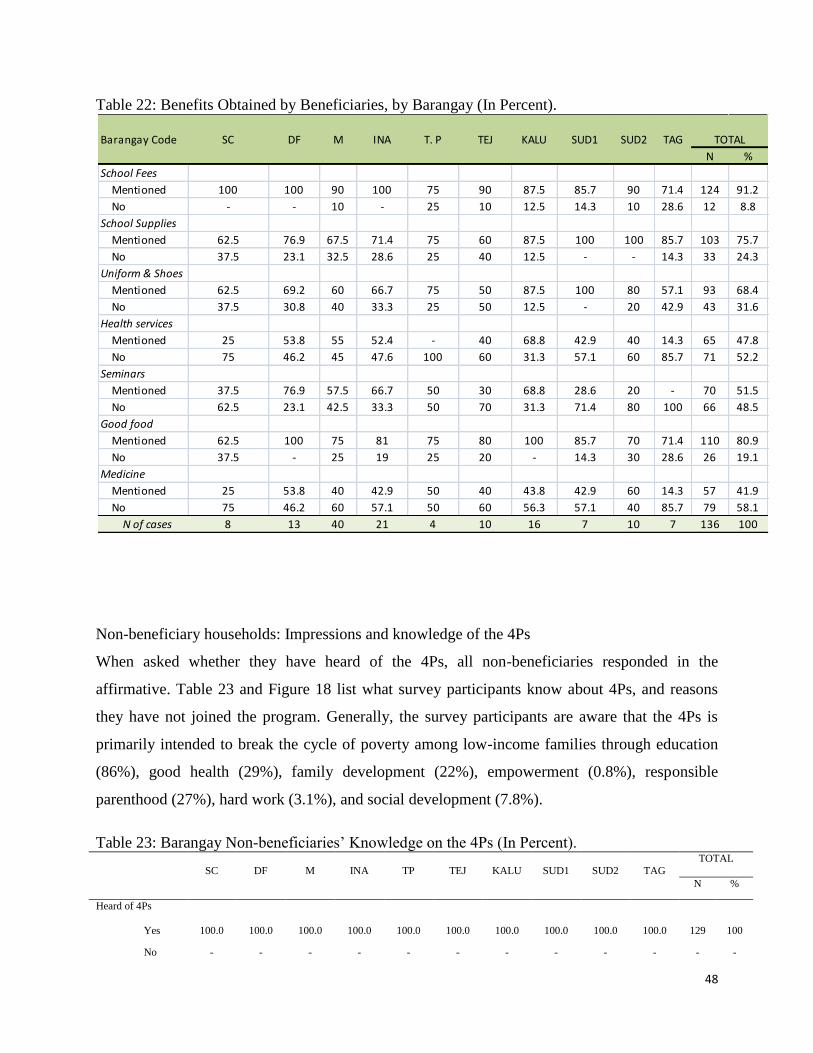
48
Table 22: Benefits Obtained by Beneficiaries, by Barangay (In Percent).
Non-beneficiary households: Impressions and knowledge of the 4Ps
When asked whether they have heard of the 4Ps, all non-beneficiaries responded in the
affirmative. Table 23 and Figure 18 list what survey participants know about 4Ps, and reasons
they have not joined the program. Generally, the survey participants are aware that the 4Ps is
primarily intended to break the cycle of poverty among low-income families through education
(86%), good health (29%), family development (22%), empowerment (0.8%), responsible
parenthood (27%), hard work (3.1%), and social development (7.8%).
Table 23: Barangay Non-beneficiaries’ Knowledge on the 4Ps (In Percent).
SC
DF
M
INA
TP
TEJ
KALU
SUD1
SUD2
TAG
TOTAL
N %
Heard of 4Ps
Yes 100.0 100.0 100.0 100.0 100.0 100.0 100.0 100.0 100.0 100.0 129 100
No - - - - - - - - - - - -
Barangay Code SC DF M INA T. P TEJ KALU SUD1 SUD2 TAG
N %
School Fees
Mentioned 100 100 90 100 75 90 87.5 85.7 90 71.4 124 91.2
No - - 10 - 25 10 12.5 14.3 10 28.6 12 8.8
School Supplies
Mentioned 62.5 76.9 67.5 71.4 75 60 87.5 100 100 85.7 103 75.7
No 37.5 23.1 32.5 28.6 25 40 12.5 - - 14.3 33 24.3
Uniform & Shoes
Mentioned 62.5 69.2 60 66.7 75 50 87.5 100 80 57.1 93 68.4
No 37.5 30.8 40 33.3 25 50 12.5 - 20 42.9 43 31.6
Health services
Mentioned 25 53.8 55 52.4 - 40 68.8 42.9 40 14.3 65 47.8
No 75 46.2 45 47.6 100 60 31.3 57.1 60 85.7 71 52.2
Seminars
Mentioned 37.5 76.9 57.5 66.7 50 30 68.8 28.6 20 - 70 51.5
No 62.5 23.1 42.5 33.3 50 70 31.3 71.4 80 100 66 48.5
Good food
Mentioned 62.5 100 75 81 75 80 100 85.7 70 71.4 110 80.9
No 37.5 - 25 19 25 20 - 14.3 30 28.6 26 19.1
Medicine
Mentioned 25 53.8 40 42.9 50 40 43.8 42.9 60 14.3 57 41.9
No 75 46.2 60 57.1 50 60 56.3 57.1 40 85.7 79 58.1
N of cases 8 13 40 21 4 10 16 7 10 7 136 100
TOTAL

49
SC
DF
M
INA
TP
TEJ
KALU
SUD1
SUD2
TAG
TOTAL
N %
Break the Cycle of
Poverty THRU:
Education
Mentioned 62.5 100.0 74.4 100.0 100.0 100.0 87.5 83.3 88.9 83.3 111 86.0
Good Health
Mentioned - 16.7 53.8 15.0 - - 50.0 16.7 22.2 16.7 38 29.5
Family
Development
Mentioned 25.0 8.3 46.2 5.0 - 11.1 12.5 33.3 11.1 - 28 21.7
Empowerment
Mentioned - - - - - - - 16.7 - - 1 0.8
Responsible
Parenthood
Mentioned 37.5 - 51.3 10.0 - - 37.5 16.7 11.1 33.3 35 27.1
Hard Work
Mentioned - 8.3 5.1 5.0 - - - - - - 4 3.1
Social Development
Mentioned - - 20.5 - - - 12.5 - - - 10 7.8
N of cases 8 12 39 20 4 9 16 6 9 6 129 100
Figure 18. Knowledge of the 4Ps: Non-Beneficiaries

50
POSSIBLE DETERMINANTS OF THE INCLUSION AND EXCLUSION OF THE
BENEFICIARIES AND NON-BENEFICIARIES OF THE PROGRAM
Empirical approach
Data presented above is complemented with an analysis of the determinants of the inclusion and
exclusion of beneficiaries and non-beneficiaries in the program. Inspired by Castelan’s (2010)
model of participation, the researchers contend that household incomes as well as other
economic factors significantly determine a family’s inclusion in the CCT program. In this light,
this part of the research aims: (1) to determine the set of household- and community-level
characteristics that have significant effect on the probability of being included in the program;
and (2) to predict the households’ eligibility.The estimation for this research’s model, however,
is limited when compared to Castelan’s analyses, specifically in terms of the distinction between
conditional and unconditional aspects of the transfers.14
Furthermore, this research makes a
distinction between participation and inclusion. The former pertains to the term used by
Castelan whose context is the Mexican CCT while the latter is the preferred term of this research,
which is conducted in the Philippine context.
Based on the concept of utility maximization, which if it holds true in this case, a household is
eligible for the 4Ps when the utility associated with receiving the cash transfer or subsidy minus
the cost of compliance to the conditions, is greater than the utility derived from non-inclusion.15
The preferences of parents in a household can be represented by a utility function
Eq. 1
where is a quasi concave and a continuous function representing a strongly monotone
preference relation defined on the consumption of bundle of goods , so that and
are normal goods and denote the demand for schooling and the composite of other good,
14 Castelan (2010) extended his analysis with a scenario on unconditional transfers and compares it with conditional cash
transfers in his policy implications. This paper limits only its analysis to the participation model and building the model based on
his equations.
15 Another limitation is that this study did not calculate the pre-transfer income as the survey was done only after the program
was implemented.

51
respectively. Parameters and represent parent’s preference for schooling and all other
goods. The parents maximize subject to the constraint
Eq. 2
where denotes income, represents the cost of schooling and is the price of the
composite good. Assuming an interior optimum, combining the first order conditions
/ Eq. 3
Equation 3 establishes that household marginal rate of substitution between schooling and
the composite good must be equal to the relative price of schooling, . After solving for a
household’s demand for schooling, one gets the function that is increasing in income and
parent’s preferences, and decreasing in the relative price of schooling.
Eq. 4
Now, assume that the household is offered a cash transfer , conditional upon consuming a
schooling quantity greater than or equal to and is predetermined at 85% of the attendance in
school. The parents maximize equation subject to new budget constraint
if, Eq. 5
+ if, Eq. 6
So when household demand for schooling exceeds the minimum required for the 4Ps rules,
the new demand for schooling will be an increasing function of the transfer or subsidy
Eq. 7

52
So, the decision of the parents to send their child to school depends on the utility derived from
being in the program. They choose to join in the program if the difference between the utility of
joining and non-joining defined as is greater than zero. This difference on the pre-transfer
income, , the expected cash transfer , , the relative price of schooling, , and other
characteristics which might independently affect eligibility, ( economic status and
preference). Thus
Eq. 8
where is not directly observed and one only observes the final decision of inclusion, ,
which is an indicator variable equal to “1” if household participates in the program and “0” if it
does not. Therefore
1 if Eq. 9
0 otherwise.
In the present study, the non-beneficiaries are denoted as “0” while the beneficiaries are denoted
with “1”. The linearization of the Castelan’s model described in equation 8 can be represented by
equation 10 below
Eq. 10
where parameters and β, and the vectors of parameters and represent coefficients to be
estimated while is assumed to be normally distributed error term and (same as equation 8
above) where is not directly observed, is the household income, is the expected
income transfer, and is the proxy variables that might affect the eligiblity in the program.
Thus, the probability of being included in the 4Ps can be written as equation 11 below.

53
Eq. 11
where the errors are independently distributed according to the unit normal distribution,
is the probability density associated to the normal distribution function
. The parameter estimates of α and β, and the vector of parameters θ and δ are those
coefficients that maximize the log-likelihood function:
Eq. 12
54
The expected symbols of the independent variables and the definitions used in the study are:
Profile of head and spouse
>0, Head is male
>0, Education of head
(base category: No formal schooling)
>0, Elementary level
<0, High school level
<0, Head is employed
Head's spouse is employed
Household composition
>0, No. of children aged 0-14
Asset ownership
>0, House
<0, Lot
>0, Television set
>0, DVD/CD player
>0, Electric fan
<0, No. of bedrooms
Type of materials used in house construction (base category: Light materials)
>0, Light materials (base category)
>0, Semi-concrete
<0, Concrete
Type of water source
(base category: Other sources)
>0, Independent/private provider
>0, MCWD
>0, Deep well or rainwater
Monthly expenditures on utilities
>0, Electricity
Barangay-level characteristics
>0, Rural/urban classification
>0, No. of schools
Discussion of estimation results
Table 24 reports the average marginal effect of each variable on the probability of inclusion in
4Ps, and whether the variables are statistically significant in the logistic regression model. This
model is presented in column 1, where the independent variables are enumerated. These are
standard household and barangay-level characteristics that may affect the participation in the
program. The variables are profiles of household head and spouse, household composition, asset
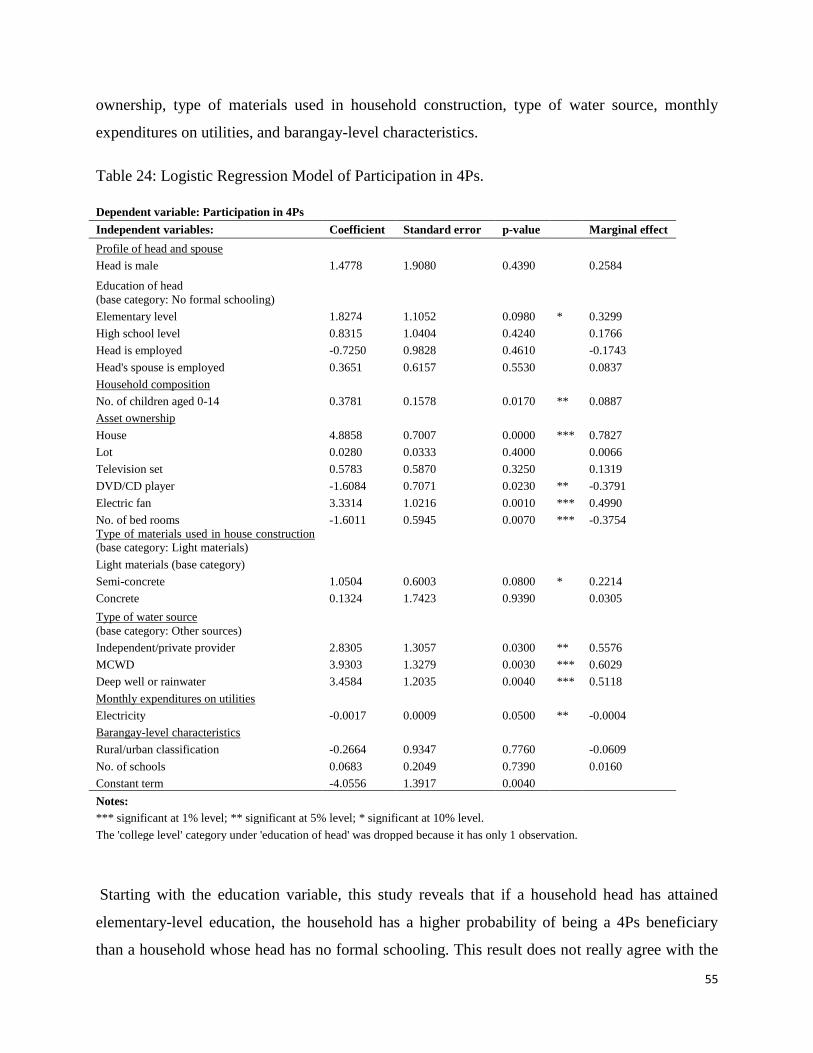
55
ownership, type of materials used in household construction, type of water source, monthly
expenditures on utilities, and barangay-level characteristics.
Table 24: Logistic Regression Model of Participation in 4Ps.
Dependent variable: Participation in 4Ps
Independent variables: Coefficient Standard error p-value Marginal effect
Profile of head and spouse
Head is male 1.4778 1.9080 0.4390 0.2584
Education of head
(base category: No formal schooling)
Elementary level 1.8274 1.1052 0.0980 * 0.3299
High school level 0.8315 1.0404 0.4240 0.1766
Head is employed -0.7250 0.9828 0.4610 -0.1743
Head's spouse is employed 0.3651 0.6157 0.5530 0.0837
Household composition
No. of children aged 0-14 0.3781 0.1578 0.0170 ** 0.0887
Asset ownership
House 4.8858 0.7007 0.0000 *** 0.7827
Lot 0.0280 0.0333 0.4000 0.0066
Television set 0.5783 0.5870 0.3250 0.1319
DVD/CD player -1.6084 0.7071 0.0230 ** -0.3791
Electric fan 3.3314 1.0216 0.0010 *** 0.4990
No. of bed rooms -1.6011 0.5945 0.0070 *** -0.3754
Type of materials used in house construction
(base category: Light materials)
Light materials (base category)
Semi-concrete 1.0504 0.6003 0.0800 * 0.2214
Concrete 0.1324 1.7423 0.9390 0.0305
Type of water source
(base category: Other sources)
Independent/private provider 2.8305 1.3057 0.0300 ** 0.5576
MCWD 3.9303 1.3279 0.0030 *** 0.6029
Deep well or rainwater 3.4584 1.2035 0.0040 *** 0.5118
Monthly expenditures on utilities
Electricity -0.0017 0.0009 0.0500 ** -0.0004
Barangay-level characteristics
Rural/urban classification -0.2664 0.9347 0.7760 -0.0609
No. of schools 0.0683 0.2049 0.7390 0.0160
Constant term -4.0556 1.3917 0.0040
Notes:
*** significant at 1% level; ** significant at 5% level; * significant at 10% level.
The 'college level' category under 'education of head' was dropped because it has only 1 observation.
Starting with the education variable, this study reveals that if a household head has attained
elementary-level education, the household has a higher probability of being a 4Ps beneficiary
than a household whose head has no formal schooling. This result does not really agree with the

56
hypothesis (since it is hypothesized that the head with lower level of education tends to be poorer
and thus, has a higher probability of being eligible in social protection programs), although it is
not highly significant since it has p-value of 0.0980 (significant only at 10%). If the default
significance level (0.05) only is considered, this particular result will no longer be significant.
Interestingly, this result may support the claims of Castelan (2010) that what appears to be the
most important reason the poorest households do not enroll in CCT programs is that the
conditionality is imposed on the consumption of normal goods, such as education and healthcare
that relatively richer households---rather than the poorer households----are more likely to avail of
themselves. Castelan further discussed that very poor families with significantly lower level of
income and/or weak aspirations for the schooling level for their children will have few incentives
to participate in the program even though they know they are eligible.
The variable household size confirms the study’s hypothesis that households with a certain
number of children within the ages 0-14 are highly significant at 5 percent with a p-value of
0.0170. This is one of the most important criteria set by those who designed the 4Ps in selecting
the household beneficiaries. The finding implies that if a household has a higher number of
children below 15 years old, the higher the probability of being selected into the program. This
result is also in agreement with findings of Behrman et. al (2010) using Mexico’s
Oportunidades Urban Evaluation study, which states that the number of children within the
primary-and secondary-school ages increases the probability of program inclusion. This is quite
expected because the number of children increases the household’s potential benefits from the
school enrolment transfers.
House ownership as variable showed very significant results, implying that if a household owns
a housing unit or has an owner-like possession16
of it, then it has a higher probability of being a
4Ps beneficiary. In the case of the upland barangays of Sudlon I, Sudlon II and Tagbao
households own the house while they either rent or have a tenant-like arrangement on their lot.
The same pattern was observed in lowland barangays or within the city proper. Thus, one can
infer that many of those who said that they own the structure but not the lot can be classified as
informal settlers.
16 Ownership of house does not necessarily mean that the lot is also owned.

57
In the other study that uses the urban component of Oportunidades, Behrman et al. (2010)
estimate a first-stage discrete choice model of participation. Their results show that key
correlates of poverty such as dirt floor, walls or ceilings made of provisional materials, and the
need for certain assets, increase the probability of participation in Oportunidades. As discussed
previously in the NHTS-PR data section of this study, most of the roofs and outer walls of
housing units in all 10 program sites were made of light materials. Another view is that those
who do not own a housing unit or those classified as renters of housing unit or rooms in the city
proper tend to be better off financially. This could be because during the interview process, field
enumerators preferred those with houses since they assign household control numbers to
households when interviewed.
The ownership of DVD/CD player has a negative relationship (-1.6084 and p-value of 0.0230)
with 4Ps inclusion, which means that if a household owns this particular asset, it is more likely to
be wealthier and thus not eligible to the program. On the other hand, the beneficiaries are more
likely to have electric fans than would the non-beneficiaries. That is, perhaps the non-
beneficiaries in the more urbanized barangays tend to substitute air conditioning units for electric
fans. Having an air conditioning unit signifies higher income as this denotes higher electricity
bills as well.
As expected, the variable electricity bill seems to support the earlier two findings. The non-
beneficiaries tend to have higher electricity bills since they have relatively more assets,
particularly appliances and/or durable assets such as DVD/CD players, air conditioning units,
and refrigerators.
It was also expected that the higher the number of bedrooms owned by a household, the lower
the probability of being eligible into the program (i.e., the higher the chances of being excluded).
Again, this particular variable is a clear indicator of wealth. A bigger house tends to have more
bedrooms. Thus, the more the family becomes ineligible for any social protection program.
Results on the house type (semi-concrete construction materials or light materials as described in
the NHTS-PR data) as a variable are quite interesting. These results imply that a household
whose housing unit is made of semi-concrete materials tends to have a higher probability of
inclusion in 4Ps than those whose houses are made of light materials. This result is unexpected,

58
although not statistically significant based on its default level of significance (0.05). This might
be due to selection bias during the field visits. This result may support the assumption that
although the households are mostly informal settlers, the fact that most of them remembered they
have been living in the area since their birth signifies that, over time, they were able to construct
houses that tend to be more durable than expected. Probing further reveals that in most urban
dwellers in the study sites, they regularly pay sort of rental to the lot where their abode is
constructed. The administrator or descendants of the owner of the lot will collect the lot rental.
This has been practiced for several decades already and they are hoping that these lots will be
distributed to them in the future.
Meanwhile, results on water source as a variable show that more non-beneficiaries water from
other sources, while more 4Ps beneficiaries source their water supply from any of the following:
independent/private provider, MCWD, deep well, or rainwater.
The marginal effect measures the elasticity or the percent change in the probability of inclusion
of a household to a 1 percent change in each independent variable. The higher the marginal
effects, the more sensitive the probability of inclusion into the program is to a particular
independent variable. Among the significant factors, those with higher marginal effects are:
house ownership, type of water source, ownership of electric fan, ownership of DVD/CD player
and number of bedrooms.
Model validation
The performance of the program inclusion model can be assessed by computing for the percent
of correct classification of the sample. Table 25 explains that the performance of the estimated
model of program inclusion is quite good in terms of accuracy measures. Specifically, only 10.29
percent is the exclusion rate (or the number of eligible households that were not included in the
program), while only 6.15 percent is the leakage rate (or the number of ineligible households that
were included in the program). In general, the model was able to correctly predict the eligibility
status of the households 91.7 percent of the time.

59
Table 25: Model Validation, Participation Status Between Participant and Non-participant.
Frequency
Predicted participation status Actual participation status
non-participant Participant Total
non-participant 121 14 135
participant 8 122 130
Total 129 136 265
Percent
Predicted participation status Actual participation status
non-participant Participant Total
non-participant 45.66 5.28 50.94
participant 3.02 46.04 49.06
Total 48.68 51.32 100.00
Exclusion rate: 10.29%
Leakage rate: 6.15%
% Correctly classified non-participants: 93.80%
% Correctly classified participants: 89.71%
% Correctly classified: 91.70%
Model diagnostics
The estimated model was able to satisfy the linktest or the model specification test. This implies
that the estimated model was correctly specified. Moreover, all of the explanatory variables are
not highly correlated. None among the pair-wise correlations of all of the explanatory variables
has reached 0.70. In fact, all of the correlations are below 0.60 (See Pair-wise Correlation Table
in Appendix B).
It is interesting to note from the results that there are a few sample household beneficiaries who
reported total yearly family income of more than PhP100,000. After estimating the total annual
family income and then comparing with the income deciles from the Annual Poverty Indicators
Survey (APIS) 2011, the sample households in this study actually belong to approximately decile
5 and above. This finding somehow supports the findings of Reyes (2012)17
, which noted that
17 Reyes, C.M. 2012. Regional economic integration: creating employment opportunities for the poor. Presentation at the PIDS
Forum on Regional Integration, Inclusive Growth and Poverty, 25 September 2012, Carlos P. Romulo Hall, Philippine Institute
for Development Studies, Makati City, Philippines.

60
4Ps beneficiaries are found in every income decile, even in the richest decile. This can be clearly
seen if the income categories are further refined.

61
SUGGESTIONS FROM BENEFICIARIES ON HOW TO
IMPROVE THE IMPLEMENTATION OF THE PROGRAM AT THE
BARANGAY AND HOUSEHOLD LEVELS
Key informant interviews and focus group discussions results
Like other CCT programs, the 4Ps requires (at minimum) the means to establish the eligibility of
clients and enroll them in the program, a mechanism to pay their benefits, and preferably a strong
monitoring and evaluation systems. Furthermore, 4Ps needs a means to monitor compliance with
co-responsibilities and to coordinate among the several institutions involved in operating the
program. This section discusses the results of the key informant interviews and focus group
discussions among the implementers of the 4Ps. A total of three key informant interviews were
conducted among representatives of the Department of Social Work and Development (DSWD),
Department of Health (DOH), and Department of Education (DepEd). Likewise, two focus group
discussions among the barangay volunteers were done. These volunteers came from the 10
barangays (set 1) of this study.
Involvement in the program
The DSWD is tasked as the overall program implementer of the 4Ps. At the onset, it has been
involved in the National Targeting System for Poverty Reduction. It is tasked to handle the
verification of the beneficiaries’ compliance, grievances, and monitoring. It also oversees the
implementation of the family development sessions, and collaborates with other government
agencies such as the Department of Health (DOH) and the Department of Education (DepEd) in
assisting beneficiaries.
The DOH takes charge of the women of reproductive age with children ages 0 to 14 years old.
Of the PhP1,400 monthly allowance given to the beneficiaries, PhP500 is intended for health
expenditures. In return, pregnant women are required to submit themselves to pre-natal and post-
natal care. Women should also avail of the services of a skilled health attendant during delivery.
Within six weeks after delivery, they have to submit themselves to at least one post-natal care.

62
Families with children 0-5 years old are required to visit the health center for immunization,
monthly weight monitoring and nutrition counseling (for those with children 0-2 years old),
quarterly weight monitoring, and management of childhood illnesses.
The ability of beneficiaries, especially pregnant mothers, to comply is monitored through a
monitoring booklet provided by the health center. In recent years, however, the DOH has made
use of the community health teams (CHTs) at the barangay level. This relatively new strategy is
meant to ensure that beneficiaries are not only compliant but also aware of the program’s
purpose. The CHT operates in such a way that five teams are formed with 20 members per team.
However, note that such CHT members are not exclusively composed of 4Ps beneficiaries
because the CHTs serve as the barangay implementing arm of DOH’s Kalusugang
Pangkalahatang Program.
The DepEd ensures that children of beneficiary-families have 85 percent attendance every month.
Specifically, families with children 0-3 years old are expected to enroll the children in a day care
or pre-school program and maintain an attendance rate of at least 85 percent per month. Those
with children from 6 to 14 years old are required to enroll them in elementary and secondary
schools and hit an attendance rate of at least 85 percent per month. Principals, through the
designated class advisers, are tasked to monitor the grantees’ required 85 percent attendance.
The DSWD has a standard form (Form 3) that must be filled-out and signed by the classroom
adviser and school principal.
The Citilink officers oversee the activities conducted in the barangay, especially the continued
eligibility of the household beneficiaries. They also link up with focal persons tasked to monitor
the beneficiaries’ program involvement, aside from handling complaints lodged by beneficiaries
with the focal persons. They coordinate the activities conducted at the barangay level with that of
the local government agencies, especially the city government. There are three Citilink officers
in Cebu City who closely work with the focal persons in all the 10 pilot barangays. On a monthly
basis, they regularly conduct family development seminars.
The focal persons appointed in Cebu City are a unique case. Cebu City is the only area in the
region where a person (in most cases, the gender and development officer or the nutrition officer)
in every barangay is oriented and trained by DSWD as well as appointed to specifically monitor

63
the beneficiaries. The work of focal persons is voluntary and without remuneration. They have
been given the task to make sure beneficiaries comply. Thus, they conduct home visits and, if
there are problems, try to investigate first if the beneficiary has indeed been remiss with his/her
responsibilities before elevating such to the barangay level.
Moreover, focal persons also ensure that these beneficiaries attend the family development
seminars (FDS). At times, when speakers are unavailable, they themselves facilitate the
discussion of certain FDS topics, especially those where they had been trained on. Since they are
familiar with the situations at the barangay level, they were the ones who suggested that parent-
leaders from among the beneficiaries be appointed to coordinate the activities where parents are
required to attend.
Focal persons underwent an orientation of the entire program to ensure that they have a full grasp
of its operations. These orientation sessions were on the grievance redress system, beneficiary
data management, and compliance verification system. To be able to handle the family
development seminars in the absence of the citilink officers, they attended trainings on speaking
and facilitation skills enhancement. Other trainings were on program implementation review,
consultation dialogue, and disaster preparedness.
Challenges faced during program implementation
The following were the challenges faced by program implementers:
Inclusion and exclusion errors: Some families included in the program were actually not
supposed to be there or should not have been prioritized. This error came to be because at the
time the surveys were conducted in the 10 barangays, some households refused to be interviewed
since they thought that this was a mere government “census” that would not translate into
concrete benefits to them.
Wala magpainterview kay hadlok paninglon sa utang. Wala mangabli kay some of them
are wary of the government nga sige og census kunu, walay nadawat. (They refused to be
interviewed because they thought that the interviewer will collect their debt. They did not

64
open their doors because they were wary of the government, which keeps on conducting
censuses but in the end, they [the households] would not get anything out of it.)
Some of those interviewed were also not truthful about their real economic status. For instance, a
farmer interviewed did not reveal that aside from a nipa hut in his farmland, he also has another
house somewhere.
The enumeration was done from 2007 to 2008, but the grant was released in 2009. There were
families whose economic status changed (e.g., from being unemployed at the time of the
interview to being employed at the time the funds were released). Moreover, during the
enumeration period, there were poor people who were not residing in Cebu City yet . Thus, on
the year the program was implemented, these poor from the provinces were excluded as
beneficiaries even if they would have been qualified.
Interference of local officials: The DSWD has repeatedly publicized that in no way is the 4Ps
subject to the control and direct manipulation of politicians. Nevertheless, there have been
recurring issues of its politicization due to the unavoidable engagement between the DSWD and
local government officials, particularly at the barangay level. At the onset, this was a problem
faced by implementers because politicians made it appear that had it not been through their
efforts, the beneficiaries would not be receiving a monthly allowance of PhP1,400. At some
point, some officials had threatened to remove those who will not vote for them from the list of
beneficiaries. To neutralize this wrong message, one DSWD source confirmed that the
implementers have been exerting efforts to educate the people about the non-political nature of
the 4Ps. The focal persons have substantiated DSWD’s claim, stressing that, in principle, the
beneficiaries know that the money did not come from politicians.
However, certain events could unavoidably reinforce people’s impression on politicians’
contributions to the program’s success in some ways. For example, DSWD personnel and focal
persons cannot but ask for the barangay’s assistance in finding a decent venue (e.g., barangay
multi-purpose center) for their meetings. In the case of one upland barangays, a barangay
captain lends his public vehicles to transport the beneficiaries to a Land Bank branch located
miles from their barangay so that the latter could withdraw their cash grants. These and many
other similar circumstances still leave the 4Ps vulnerable to some form of politicization.

65
Allowance spent on gambling and alcoholic beverages: Some beneficiaries were reported to
have spent their monthly allowance on gambling (tong-its) and alcoholic beverages. At times,
couples would quarrel over such misspending as this could cause them to be removed from the
list of 4Ps beneficiaries. In one interview researchers had with focal persons, it was revealed that
the availability of extra income from ad-hoc or “sideline” jobs (e.g., carpentry, plumbing) was a
reason the allowance was used for gambling on certain occasions.
Beneficiaries demanding that their forms be filled-up immediately: For fear that they would
be unable to pass the required documents and comply with deadlines (and, thus, be delisted as
4Ps beneficiaries), parents at the onset would demanding that their forms be signed immediately.
Such has created conflicts between the applicants and the implementers. After all, implementers
are burdened with other tasks aside from their responsibilities related to the 4Ps.
Pawned automatic teller machine (ATM) cards: Some beneficiaries resort to pawning of
ATM cards at the early part of the program. For instance, when a beneficiary borrows PhP500
from a private lender, the lender holds the former’s ATM card and sets an interest of 25 percent
per month. Such a practice, however, was a source of many conflicts. Take for instance a case
where the debtor borrows PhP1,000 but the amount deposited for the month by the program is
PhP500 only due to certain deductions arising from non-compliance with certain program
conditions. The amount that the lender is to collect falls short of what he had expected to receive.
Delays in the scheduled releases: The program guidelines clearly state that beneficiaries will
get a subsidy of PhP1,400 every month if the family has been compliant. However, actual
releases would be made every three months, which makes it challenging for beneficiaries who
need the money immediately for their family’s health and education expenses. Such a situation
also leads them to borrow money for the interim.
Today, the releases are made every two months instead of three. Delays in the releases are either
due to beneficiaries’ failure to submit the necessary compliance forms on time or failure of
authorized signatories (e.g., a school principal) to sign on time:
Karon nasulbad naman na nila. Sa una every three months mahatag, mao ni problema
nila makautang guihapon sila. Karon irelease kada duha ka bulan. Usahay sad sila ang
nakalangay diba gani kay usahay ang principal dugay mupirma, labi na kanang

66
principal nga bag-o pa. (Now, this has been solved. Releases were previously made
every three months, which caused beneficiaries to borrow money in the interim. But now,
releases are done every two months. At times, the beneficiaries caused the delay. At other
times, new principals who are unfamiliar with the forms caused the delay.)
Program is perceived to encourage people to be lazy: There is a persistent perception that the
4Ps is encouraging people to be lazy since this makes them wholly reliant on the government’s
subsidy. This statement especially came from the non-beneficiaries who believe that they need
more assistance than the identified beneficiaries.
Focal persons faced with budgetary constraints: Focal persons are tasked to monitor and
follow-up the beneficiaries at the barangay level. For this, they do not receive any allowance---
not even for communication. Having a communication allowance is crucial in their monitoring
activities since they get in touch with the beneficiaries through their mobile phones.
Moreover, local officials sometimes question requests to include the 4Ps expenses in the local
site’s Gender and Development budget since they assert that the program is aalready getting its
funding from the DSWD. Focal persons reasoned that activities, specifically at the barangay
level, still need financial support because the DSWD funds are not enough. In fact, some focal
persons ended up relying on their personal resources to carry out certain activities.
Program is too short: A five-year support from the government is perceived to be too short,
particularly since the early phase of the novel program experienced challenges. It took a while
for both the beneficiaries and implementers alike to get a better grasp of the program, and by the
time they were able to do so, it was already in the second or third year of implementation. In
addition, there is no strong program component that teaches income-generating skills to
beneficiaries. The inclusion of a livelihood program could give beneficiaries an opportunity to
augment their existing income.
Relatedly, the support given to families with children up to the age of 14 years old is perceived
as inadequate because these children would still have not graduated from high school at that age.
Interviewees think it would be better if the support continues up to such time that children
graduate from high school and are enrolled in vocational courses. Such will allow these children

67
to be eligible for employment if the family does not have the resources to send them through
college.
With the challenges mentioned above, the monitoring scheme instituted by the program helped
lessened, if not eradicated, the problems faced. Government agencies had quarterly meetings to
look into the problems encountered and introduced ways to improve the implementation. One
such move was to appoint focal persons in the different barangays to coordinate with the
different agencies when solving problems. These focal persons usually receive reports from
community residents regarding the compliance of the beneficiaries. Such reports would prompt
them to verify the truthfulness of the facts mentioned. They visit homes and discuss the issues
with the beneficiary. This is also an opportunity to reach out to beneficiaries regarding problems
encountered and to discuss ways for the latter to avoid further complications such as deductions
on their monthly subsidy or worse, removal from the list of beneficiaries.
Improvements seen on the beneficiaries
Empowered to take charge of their lives: Beneficiaries have learned how to take care of their
children, especially their basic needs, and not to inflict physical harm on them. They have also
learned to manage their funds: i.e., priority is given to the needs of the family rather than on
gambling and other vices:
Na-empowered sila. For example kahibalo na sila mohandle sa ilang mga bata, kahibalo
na sila mohandle sa ilang finances, kahibalo na sila mohandle sa ilang temper nga dili
na manapat sa ilang mga bata kay naa man na, apil man na sila sa among FDS. So mao
nay akong nakita karon sa ilaha duna man attitude ang tao nga dili madali-dali og
change magsugal na gyud na siya, kanang musuyup na gyud na siya, naa na siya pero na
minimize na siya dili pareha sa una nga patuyang lang og buhat nga walay nag tan-aw,
walay nag-guide nila so ang ilang pamilya nasamot ka rambol samot ka walay nada. So
pagtunga sa 4Ps mao nay naka develop nila. (They have been empowered. For example,
they now know how to handle their children, their finances and even their temper so they
do not resort to hurting their children. These have been taken up in our FDS. There are

68
negative attitudes that cannot be changed overnight but at least these have been
minimized. In the past, when they were not guided, the family was chaotic. Today, with
the 4Ps, they have at least improved.
Improvement in the health status: Sawang Calero and Duljo used to belong to the top 10
barangays with the highest number of malnourished children. Such is not the case anymore,
thanks to the success of the 4Ps in their area. Moreover, more births are attended now by skilled
health workers delivered in the health center, some of which are already PhilHealth-accredited.
Children are also regularly submitted for immunizations and weighing. Minors who are sick are
prioritized in terms of medicines to be distributed.
Improvement in school attendance: Children consistently attend their classes since they have
food for breakfast, which provides them the energy to attend school. They also have funds for
transportation and school projects. There are even cases where beneficiaries’ children have been
part of their school’s list of honors.
Sa Tejero, every year mi naay recognition day sa mga bata sa 4Ps. Para inig graduate
nila amu iremind sa ilaha nga these people with honors are product of 4Ps. Wala mana
sila ma recognize before kay tungod dili sila kapalit aning mga butanga sa ilang mga
experiments pero karon daghan na kaayo ming mga bata nga gikan sa regular class nga
nabutang na karon sa science class. Mao nang amu irecognize every year nga kining
mga bataa gikan sa beneficiaries sa 4Ps. (Every year in Tejero, we have a recognition
day for children who are beneficiaries of the 4Ps. In the past, they have not been part of
the honors’ list because they did not have the resources to buy materials for their
experiments and other school requirements. From just being part of the regular class, they
are now in the science class. We have the recognition day to remind everyone that these
children are beneficiaries of the 4Ps.)
Strengthening institutional partnerships
This part discusses the mechanisms that different government agencies involved in the 4Ps
implementation have in place to strengthen their contributions toward the 4Ps goals.

69
Quarterly meetings headed by the DSWD are conducted among its partner-agencies to discuss
the progress of the program’s implementation. Challenges faced by implementers are also taken
up to immediately respond to these in a coordinated manner. Even prior to the quarterly meetings,
the different agencies would already schedule smaller meetings among themselves.
Every month, the Cebu City Advisory Committee meets. The Citilink officer as well as the other
government agencies and barangay captains come together to discuss problems encountered,
grievances and compliance issues of beneficiaries. The Citilink officer then feeds the meeting
minutes back to the regional DSWD so that appropriate actions will be taken.
Kay kung di pud na itrabaho sa Citilink didto sa area, ang region maningil ni Citilink
nga nganong suwatan man gyud sa region si Mayor, “Your compliance is very low due to
education and we found out nga low siya because you don’t have timbangan. You don’t
have a nurse. “ So in that way, aware si mayor. Dili pana aksyonan ni mayor, then ma-
aware si DILG. (The Citilink officer coordinates with the regional office of DSWD,
which is then tasked to write to the mayor, “Your area’s compliance is very low due to
problems in the aspect of education,” or “We found out that compliance is low because
there is no weighing scale or nurse assigned.” If the mayor does not act on the problems,
then the DILG is informed of his or her inaction.)
As per the DSWD’s assessment, they have the best linkage with the Cebu City government. The
city extends trainings and educational discussions beyond what is required by the 4Ps. For
instance, beneficiaries have been taught about composting, disaster management, and effective
communication.Resources allocated for the 4Ps are supplemented by contributions from other
government offices. For instance, the DepEd receives support from the Cebu City government
through its feeding program:
These kids who go to public schools are really poor and have problems on food, projects,
and transportation. Transportation could be excluded, but what really draws attention
are the students in the classroom who have not had breakfast or even ate for days. And
most of them end up not going to school anymore. The Cebu City Nutrition Council
extended its help to us by financing our feeding program for the kids.

70
In the case of DepEd, the department has a focal person assigned to seek assistance from civic
organizations, the Philippine Amusement and Gaming Corporation (PAGCOR), businessmen
and other individuals who can extend additional help in implementing the 4Ps.
The Technical Education and Skills Development Authority (TESDA) also conduct skills
trainings to prepare other members of the family for employment. The Department of Science
and Technology (DOST) has actually trained the beneficiaries on hydrophonics, which is fitted
in the urban area where arable land is relatively scarce.
Summary and Implications
This study interviewed two groups of respondents, the beneficiaries and non-beneficiaries, using
standardized questionnaires. Based on basic socio-economic and demographic characteristics of
the two groups, the impression is that there is no difference between the two groups.
Most of the respondents who answered the survey were mothers. The average ages are 40 and
35 years old for beneficiaries and non-beneficiaries, respectively. Non-beneficiary mothers tend
to have a higher educational level, having reached and/or finished high school as compared to the
beneficiaries, who are at or have completed only their elementary schooling. Migration patterns
indicate that only a few respondents from both groups were born outside of Cebu. Both groups
are either unemployed or earn their income as non-professionals or self-employed individuals.
Forms of self-employment include but are not limited to street vending, ownership of a sari-sari,
buhi og baboy (pig raising) and driving of motorcycle transportation known locally as habal-
habal. Many non-beneficiaries declare that they were unemployed at the time of the survey.
Although both groups can be considered relatively poor based on their average income, the non-
beneficiaries showed lower average income (less than PhP5,000 per month) than the
beneficiaries (who earn an average of PhP5,000 to PhP8,000).
This last finding would seem ironic to many. A closer analysis, however, may better explain the
picture. First, there is the probability that the beneficiaries included the government subsidy in

71
the computation of their monthly income. Second, the study has not and cannot yet rule out the
probability that a number of families who live below the poverty line were not chosen as 4Ps
beneficiaries. This redounds to the issue of targeting which, admittedly, was one of the concerns
of the program during the first few years of its implementation. The persistence of this issue is
validated during the focus group discussions conducted. As mentioned earlier (cf. inclusion and
exclusion errors), “Some families included in the program were actually not supposed to be there
or should not have been prioritized.”
The study also looks into respondents’ type of dwelling units. Majority in both groups
mentioned that they own the structure where they live but not the lot. Since this study’s
researchers did not delve deeper into the issue of property rights given its typically sensitive
nature, one can only surmise or infer from the available data that some of the respondents and
participants are informal settlers. Generally, the houses are made up of light materials although
most have access to electricity. In this regard, there are slightly more non-beneficiaries who
have access to electricity than the beneficiaries. Non-beneficiaries also reported a higher average
electricity consumption of PhP457 per month compared to the beneficiaries, who pay PhP285
per month only. As to their water consumption, beneficiaries have a higher bill (PhP316 per
month) compared to non-beneficiaries (PhP191 per month). Both groups mentioned that their
source of water is the independent provider in Cebu. In terms of garbage disposal, majority
place their garbage in identified areas for collection by the city government. Only a few---
specifically, those in the rural barangays Tagbao, Sudlon I, and Sudlon II---resort to composting
and the dug-type disposal system. Although most respondents have their water-sealed type toilet,
there are households in the rural barangays that do not yet have sanitary toilets.
On the overall, the beneficiaries are satisfied with the program’s implementation. They
appreciate the seminars and trainings set by the program implementers. Responsible parenthood,
and family development and planning were perceived as the most important topics. Other
seminars/topics mentioned were values formation, domestic violence laws, and healthcare and
immunization programs.
According to the respondents, they know they were accepted because they are considerably poor.
Beneficiaries had an average school expenditure of PhP204 per month and a higher expenditure

72
of PhP436 per month for their healthcare. On the supply side of healthcare, most mentioned that
medicines were readily available in their respective healthcare facilities.
Respondents were also satisfied with the way their concerns were handled by program
implementers. Consultations, mini-conferences, and available personnel were ready options
when concerns and issues arise. Meanwhile, the focus group discussions and key informant
interviews brought out the relevant issues and challenges faced by the program’s various
implementing agencies.
The NHTS-PR data complemented the survey data in many respects of the socio-economic
profile of the beneficiaries and non-beneficiaries. The result of the regression analysis further
confirmed that beneficiary households deserve to be in the 4Ps. Moreover, the regression
coefficients provided insights on the variables that determine the eligibility of the poor for social
protection programs such as the 4Ps.
It is, however, interesting to note that the poorest of the poor might not be encouraged to
participate in the program as the cost of compliance might be greater than their expected benefits.
Overall, Cebu City’s 10 beneficiary barangays are compliant to the conditionalities of the
program. Nonetheless, there remain areas for improvement. First, limiting the information
asymmetry among program implementers should be considered if only so as to streamline the
program. Second, although the existing survey data are still limited, the compliance and non-
compliance records in the CVS must be seriously taken into consideration by the program
implementers. After all, these personnel who closely monitor the beneficiaries’ compliance have
the biggest responsibility on the ground in making sure the program will be a success.
Administering a very large program like 4Ps to thousands of households with various co-
responsibilities would require a systematic organization. Consequently, there is a need to
gradually create structural adjustments, given the palliative nature of the CCT.
Fourth, the program acknowledges that focus on health, education, and nutrition is not sufficient
on its own to move people out of poverty. There is a need for additional programs that
complement and link the demand side to the supply of educational and health services.

73
Although the program is still on-going, results of the study indicate that Pantawid Cebu City has
greatly helped beneficiaries attain the program’s basic objectives in the short run. The challenge,
however, lies on what will happen to the beneficiaries after the program ends. During the survey
and focus group discussions, most participants lamented that just as when they have started to
fully understand and comprehend the program, they find that it will end soon.
Fifth, a limited data set may hinder a rigorous evaluation on the outcomes of the 4Ps. In Latin
America, very rigorous impact studies were possible because there were large data sets available
before and after implementation of the conditional cash transfer grants.
In this Philippine study, however, only a single survey was done in areas where beneficiaries and
non-beneficiaries live. Government agencies in charge of implementing the 4Ps should take this
first step forward by conducting their own regular surveys and opening up their databases for
impact evaluation studies. If done properly, research like this will surely aid policymakers in
improving the programs and achieving the long-run objective of breaking the intergenerational
cycle of poverty.
At this point, one has yet to see how far the current 4Ps has achieved its aim of alleviating
intergenerational poverty. The return of investment in the areas of health and education are yet
to be translated into human and social capital and this cannot be accomplished overnight.

74
Appendix A: Comparison APIS 2011 and EADN study income deciles.
APIS 2011,Total Annual Family Income Deciles EADN Study APIS 2011
First decile: PhP50,040.00 and below Estimated annual family income
Second decile: PhP50,040.01 to PhP68,464.00 1 – below PhP60,000.00 ' Decile 1 to 2
Third decile: PhP68,464.01 to PhP85,360.00 2 - PhP60,000.00 to PhP107,988.00 ' Decile 2 to 5
Fourth decile: PhP85,360.01 to PhP103,600.00 3 - PhP108,000.00 to PhP143,988.00 ' Decile 5 to 6
Fifth decile: PhP103,600.01 to PhP125,600.00 4 – above PhP144,000.00 ' Decile 6 to 10
Sixth decile: PhP125,600.01 to PhP155,040.00
Seventh decile: PhP155,040.01 to PhP198,000.00
Eighth decile: PhP198,000.01 to PhP269,420.00
Ninth decile: PhP269,420.01 to PhP407,180.00
Tenth decile: above PhP407,180.00

75
Appendix B: Pair-wise Correlation Matrix
children own_house own_lot ebill bedrm tv dvd efanhhead_empl
oyed
spouse_e
mployedhurb
num_school
s
hhead_m
ale
hhead_edu
c2
hhead_ed
uc3water2 water3 water4
house_t
ype2
house_ty
pe3
children 1.00
own_house 0.12 1.00
own_lot 0.02 -0.04 1.00
ebill -0.10 0.02 -0.10 1.00
bedrm 0.03 -0.04 0.06 -0.19 1.00
tv 0.18 0.22 -0.13 0.33 -0.01 1.00
dvd -0.01 -0.11 -0.13 0.38 -0.07 0.32 1.00
efan 0.08 0.20 0.03 0.47 0.01 0.50 0.17 1.00
hhead_employed -0.05 0.12 -0.05 0.02 -0.07 -0.04 -0.05 0.02 1.00
spouse_employed 0.09 0.05 0.06 0.01 0.10 -0.02 -0.10 0.04 -0.38 1.00
hurb 0.14 -0.07 -0.04 0.19 0.05 0.06 0.14 0.20 -0.02 -0.11 1.00
num_schools -0.01 0.04 -0.09 0.06 0.08 0.02 0.09 0.07 -0.15 -0.03 0.22 1.00
hhead_male -0.04 0.00 0.01 0.04 -0.08 -0.04 -0.03 0.00 0.23 -0.09 0.06 -0.07 1.00
hhead_educ2 0.01 0.15 0.03 -0.01 -0.01 -0.06 -0.14 -0.03 0.57 -0.27 -0.06 -0.10 0.09 1.00
hhead_educ3 0.04 -0.04 -0.08 0.04 -0.05 0.12 0.16 0.10 0.52 -0.27 0.05 -0.12 0.17 -0.18 1.00
water2 -0.13 0.13 0.04 -0.09 0.01 -0.04 -0.10 -0.14 -0.09 0.01 -0.35 0.09 -0.07 -0.04 -0.14 1.00
water3 0.11 0.10 -0.05 0.12 -0.02 0.11 0.03 0.10 0.05 -0.01 0.28 -0.08 0.04 0.02 0.11 -0.31 1.00
water4 0.11 -0.06 -0.01 0.00 0.00 0.02 0.13 0.08 -0.08 0.01 0.26 0.06 0.00 -0.09 0.00 -0.43 -0.51 1.00
house_type2 0.17 0.08 -0.07 0.24 0.05 0.28 0.10 0.35 -0.01 0.01 0.09 0.09 -0.07 -0.05 0.05 0.05 0.01 -0.02 1.00
house_type3 -0.03 0.04 0.02 0.18 0.08 0.10 0.06 0.07 -0.01 -0.10 0.05 0.00 -0.03 0.01 0.01 -0.02 0.03 -0.04 -0.12 1.00

76
References
Attanasio, Orazio P., C. Meghir, A. Santiago, and A. Shepard. 2008. Improving the education
component of conditional cash transfers in urban settings. Retrieved from:
http://idbdocs.iadb.org/wsdocs/getdocument.aspx?docnum=2051185. October 4, 2011.
Behrman, J. R., S. Parker, W. Todd, and A. Petra. 2005. Medium-term impacts of the
oportunidades conditional cash transfer program on rural youth in Mexico. Retrieved
from: http://athena.sas.upenn.edu/~petra/papers/mitpressbook.pdf. October 5, 2011.
Behrman, J.R., J. Gallardo-Garcia, S.W. Parker, P.E. Todd, and V. Velez-Grajales. 2010. How
conditional cash transfers impact schooling and work for children and youth in urban
Mexico. http://athena.sas.upenn.edu/~petra/papers/ejedurban9.pdf. October 5, 2011.
Castelán, C. R. 2010. Participation of the poorest and distributional effects of conditional cash
transfer programs. Working paper, Cornell University.
Chaudhury, N. and Y. Okamura. 2012. Conditional cash transfers and school enrollment: Impact
of the conditional cash transfer program in the Philippines. Philippine social protection
note no. 6. Washington, D.C. - The World Bank.
http://documents.worldbank.org/curated/en/2012/07/16619713/conditional-cash-
transfers-school-enrollment-impact-conditional-cash-transfer-program-philippines.
November 1, 2012.
Department of Social Welfare and Development. 2011. Building human capital for social
resiliency. Retrieved from: http://pantawid.dswd.gov.ph/images/stories/briefernew.pdf.
October 5, 2011.
Fernandez, L. and R. Olfindo. 2011. Overview of the Philippines' conditional cash transfer
program: The Pantawid Pamilyang Pilipino Program (Pantawid Pamilya). Philippine
Social Protection Note, May 2011, No. 2. Washington, D.C. - The World Bank.

77
http://documents.worldbank.org/curated/en/2011/05/16357930/overview-philippines-
conditional-cash-transfer-program-pantawid-pamilyang-pilipino-program-pantawid-
pamilya. November 2, 2012.
Fiszbein, A., N. R. Schady, and F. H. Ferreira. 2009. Conditional cash transfers: Reducing
present and future poverty. World Bank Publications.
Janvry, A. D., F. Finan, and E. Sadoulet. 2006. Evaluating Brazil's Bolsa Escola program: Impact
on schooling and municipal roles. Retrieved from :
http://www.depeco.econo.unlp.edu.ar/cedlas/ien/pdfs/meeting2009/papers/jaramillo.pdf.
October 5, 2011.
Llanto, G.M. 2008. Make ‘deliberate’ haste in rolling out the 4Ps. Retrieved from:
http://dirp4.pids.gov.ph/ris/pn/pidspn0809.pdf. October 5, 2011.
Manasan, R. 2011. Pantawid Pamilyang Pilipino Program and school attendance: Early
indications of success. PIDS Policy Notes. November 2011. Retrieved from:
http://dirp4.pids.gov.ph/ris/pn/pidspn1119.pdf. October 26, 2012.
Moffitt, R. 1983. An economic model of welfare stigma. American Economic Review. Vol. 73,
pp. 1023-1035.
Morley, S. and D. Coady. 2003. From social assistance to social development: Targeted
education subsidies in developing countries. Washington, DC: Center for Global
Development - International Food Policy Research Institute. Retrieved from:
http://www.ifpri.org/sites/default/files/pubs/pubs/cp/socialassist/socialassistfront.pdf.
October 6, 2011.
Pacqueo, V.B. 2010. The International pedigree of CCT: Origin and evidence. Retrieved from:
www.econ.upd.edu.ph/wp.../Paqueo_Talk.pdf. October 6, 2011

78
Rawlings, L.B. and G.M. Rubio. 2005. Evaluating the impact of conditional cash transfer
programs. The World Research Observer 20:1. Retrieved from:
http://www.crin.org/docs/Evaluating%20the%20Imapact%20of%20Cash%20Transfer%2
0Programs.pdf . October 3, 2011.
Rawlings, L.B. and G.M. Rubio. 2003. Evaluating the impact of conditional cash transfer
programs lessons from Latin America. Retrieved from : http://www-
wds.worldbank.org/external/default/WDSContentServer/IW3P/IB/2003/09/30/00009494
6_0309160409264/Rendered/PDF/multi0page.pdf. October 6, 2011.
Reyes, C.M. 2012. Regional economic integration: Creating employment opportunities for the
poor. Presentation at the PIDS Forum on Regional Integration, Inclusive Growth and
Poverty, September 25, 2012, Carlos P. Romulo Hall, Philippine Institute for
Development Studies, Makati City, Philippines.
Son, H.H. and J. Florentino. 2008. Ex-ante impact evaluation of conditional cash transfer
program on school attendance and poverty: The case of the Philippines. Retrieved from:
http://www.adb.org/sites/default/files/pub/2008/Economics-WP142.pdf. October 26,
2012.
Skoufias, E. 2005. Progresa and its impacts on the welfare of rural households in Mexico.
Research Report 139. Washington D.C.: International Food Policy Research Institute.
Retrieved from: http://citeseerx.ist.psu.edu/.../download?doi. October 6, 2011.