Embed Size (px)
Citation preview
27 Jun 2005 15:9 AR AR246-MR35-08.tex XMLPublishSM(2004/02/24) P1: KUV10.1146/annurev.matsci.35.101503.091652
Annu. Rev. Mater. Res. 2005. 35:167–207doi: 10.1146/annurev.matsci.35.101503.091652
Copyright c© 2005 by Annual Reviews. All rights reserved
THE OXIDATION OF NiAl: What Can We Learnfrom Ab Initio Calculations?
M.W. Finnis,1 A.Y. Lozovoi,1 and A. Alavi2
1School of Mathematics and Physics, Queen’s University Belfast, Belfast BT7 1NN,Northern Ireland, United Kingdom; email: [email protected], [email protected] Department, University of Cambridge, Lensfield Road,Cambridge CB2 1EW, United Kingdom; email: [email protected]
Key Words ordered compounds, selective oxidation, point defects, environmentalparameters
■ Abstract We review here the theory of the early stages of oxidation of the (110)surface of Ni1−x Alx , based on ab initio calculations using a plane-wave pseudopoten-tial method. The clean surface and several oxidized surfaces have been investigated,with oxygen coverages up to 2 ML of oxygen (1 ML = 3 O atoms per 2 surface Alatoms). The theory to date is a description in terms of equilibrium thermodynamics,with a comparison of the free energies of several surfaces of different composition,implemented at the atomic scale. Three environmental parameters are singled out ascontrol variables in this treatment, namely the alloy composition x (assumed to be near0.5), the temperature T and the partial pressure of oxygen pO2 . With certain reasonableapproximations an analytic formula for the surface energy σ is derived in terms ofthese variables and some constants that are calculated ab initio together with othersthat are derived from experimental thermodynamic tables. At oxygen pressures justabove the threshold for bulk oxidation of NiAl, the calculations explain the observedformation of a thin film of alumina in place of NiAl surface layers, with the consequentdissolution of Ni into the bulk. Ab initio calculations illustrate how the energetics ofsupplying Al to the surface depends on bulk stoichiometry, which alters the relativestability of different surface oxidation states so as to favour oxidation more if the alloyis Al-rich than if it is Ni-rich.
INTRODUCTION
We now recognize that the oxidation of materials, once considered a problemsimilar to other kinds of corrosion, can sometimes be a process of enormousvalue. Silicon dioxide films for example are still at the heart of the electronicsindustry and will be for many years to come because they are the simplest usefulgate oxides. One might well ask where that industry would be if silicon oxi-dized in the uncontrollable manner of iron. At the another extreme, aluminumoxide films occur spontaneously, not only on aluminum itself, but on many useful
0084-6600/05/0804-0167$20.00 167
Ann
u. R
ev. M
ater
. Res
. 200
5.35
:167
-207
. Dow
nloa
ded
from
arj
ourn
als.
annu
alre
view
s.or
gby
CA
MB
RID
GE
UN
IVE
RSI
TY
on
07/2
1/05
. For
per
sona
l use
onl
y.

27 Jun 2005 15:9 AR AR246-MR35-08.tex XMLPublishSM(2004/02/24) P1: KUV
168 FINNIS � LOZOVOI � ALAVI
aluminum-containing alloys, including NiAl. These films are protective becausethey are relatively stable and continuous, and hence they are desirable, for exam-ple on turbine blades in power generation, or other components subject to hightemperature corrosive environments (1). Their morphology and rate of growth arestill rather poorly understood from a fundamental point of view. Such films canalso play a quite different role, by acting as substrates for deposited films of other,catalytic materials (2). In this review we focus on NiAl as a well studied example.
Our purpose here is to illustrate how ab initio calculations can be used effectivelyto predict the relative stability of various oxidized surface structures as a functionof externally imposed thermodynamic parameters (referred to here as environ-mental parameters), such as temperature, oxygen partial pressure, and chemicalcomposition of the substrate. This latter aspect, in particular, adds considerablerichness to the problem. Unlike elemental systems, our chosen substrate, being atwo-component compound, has the freedom to vary the chemical composition ofthe surface layer (and more generally the surface region) as the oxidation proceeds:The compound will do so if it can lower its free energy (i.e., its surface excess freeenergy). This can lead to enrichment of the surface region with one of the com-ponents, thus exhibiting selective oxidation. This enrichment, in turn, requires themass transport of material to and from the bulk. Therefore, the oxidation processat the surface becomes intimately related to bulk thermodynamics and kinetics ina manner whose description goes well beyond the standard treatment of oxidationprocesses of elemental systems. In particular, we show that the bulk point-defectbehavior of NiAl is an essential physical ingredient. Furthermore, we show thatthe extension of the ab initio thermodynamic formalism, combined with the theoryof point defects in NiAl, is a framework in which this selective oxidation processcan be studied.
Considering oxidation at an atomistic level, one would hope to address at leastthree questions: (a) How would the oxidation proceed? (b) What is the rate ofoxidation? (c) What is the final structure at which the system arrives? It is generallyassumed that there is an initial, transient phase during which the first layer orlayers of oxide are created, merging into a steady-state phase during which bulkdiffusion events and interface reactions can be distinguished, one of which maybe rate-determining. In steady state, the presence of grain boundaries in the oxidefilm and interface roughness, as well as the development and relief of stressesin the oxide film are complications that would make a fully atomistic simulationout of reach of current techniques, and thus continuum mechanics and diffusiontheory would be the tools of choice. By studying the early stages of oxidation,however, or investigating particular events at any stage, ab initio calculations cannow contribute to our understanding.
To answer the first question, an extreme and naive approach would be to tryto monitor the evolution of the System, for example, by running a molecular dy-namics (MD) simulation. Some accelerated way to do this (3) would be necessary,otherwise it would take unacceptably long for a single vacancy simply to jumpinto a neighboring site. Nevertheless, such an approach would be a formidable
Ann
u. R
ev. M
ater
. Res
. 200
5.35
:167
-207
. Dow
nloa
ded
from
arj
ourn
als.
annu
alre
view
s.or
gby
CA
MB
RID
GE
UN
IVE
RSI
TY
on
07/2
1/05
. For
per
sona
l use
onl
y.

27 Jun 2005 15:9 AR AR246-MR35-08.tex XMLPublishSM(2004/02/24) P1: KUV
AB INITIO CALCULATIONS 169
challenge to present computational resources, unless one used such a drasticallysimplified model of interatomic interactions that the computed outcomes would beof questionable value. This is not to say that the MD technique is of no value forany oxidation studies at present; on the contrary, in specific cases it might lead toresults that would be hard to achieve in any other way. An impressive example is thestudy of the oxidation of Al(111) (4), which demonstrated that the energy releasedduring the adsorption and dissociation of an O2 molecule is sufficient to initiatethe local precursor of an oxide phase, at an oxygen coverage as low as 0.5 ML.
An alternative approach, which is the method of choice in most oxidation stud-ies, is to identify a number of consecutive atomic structures through which thesystem proceeds during the oxidation process. This approach relies on our intu-ition and even luck in selecting structures worth considering, so it is very muchmodeling rather than simulation, but it offers a much better ratio of insight to com-putation than does brute force MD. Given that the number of possible structuresgrows exponentially with the number of atoms in the model, the final result canbe no more than a best-educated guess, no matter how accurate the calculations.The studies of oxidation based on first-principles calculations, which have startedto appear in recent years, have therefore concentrated on low-index surfaces ofsingle-component crystals. The systems considered are either late transition andnoble metals (5–15), where the formation enthalpy of the oxides is relatively low,or metals that form highly stable oxides such as Mg (16, 17) and Al (18, 19). In theformer, the oxidation typically proceeds through a number of ordered structuresof the adsorbed oxygen (14, 20) and eventually begins introducing oxygen sub-surface (15). Soon after that the surface oxide starts to resemble a stack of orderedoxygen-metal layers, which continues to thicken as more oxygen atoms arrive,subject to kinetic restrictions. On Mg(0001), on the other hand, oxygen atoms gostraight under the surface layer (16). Oxygens tend to group together forming oxideislands (17), which grow laterally until the whole surface is covered. Oxidation ofAl(111) is a little more complicated. The introduction of subsurface oxygens be-comes energetically favorable only after 1 ML of oxygen atoms has settled on thesurface. However, the same tendency of oxygen atoms to cluster together promotesoxide nucleation long before an average oxygen coverage of 1 ML is reached (18,19). The oxide islands then continue to grow laterally, as on Mg(0001). In order toidentify the system’s oxidation path and the rate of oxidation (the second question),one needs not only to find out the sequence of surface structures through which theoxidizing system might pass, but also to calculate the energetic barriers separatingthese structures from each other. The search for saddle points on the energy sur-face is a time-consuming task, and to our knowledge has not been accomplishedfor the oxidation process for any metals. Fortunately, the elucidation of the exactsequence of atomic jumps occurring at and near the particular oxidizing surface isnot really the only answer in which one is interested. It is also useful to understandthe energy differences that drive the system through a particular path.
Recent groundbreaking work on calculating energy barriers for the oxidationof Si (21) illustrates the current state of the art in ab initio simulation. This study
Ann
u. R
ev. M
ater
. Res
. 200
5.35
:167
-207
. Dow
nloa
ded
from
arj
ourn
als.
annu
alre
view
s.or
gby
CA
MB
RID
GE
UN
IVE
RSI
TY
on
07/2
1/05
. For
per
sona
l use
onl
y.

27 Jun 2005 15:9 AR AR246-MR35-08.tex XMLPublishSM(2004/02/24) P1: KUV
170 FINNIS � LOZOVOI � ALAVI
also shows the difficulties that still must be overcome even for single-componentsubstrates. The authors created an ensemble of amorphous oxide structures on Siusing classical interatomic potentials, and they relaxed these structures with an abinitio (density functional) code. They then studied in detail how a single oxygenmolecule arriving at the interface would dissociate, breaking open the Si latticeand bonding to the Si. This was achieved by dragging the molecule to the interface,relaxing all the atomic positions to their minimum energy configuration at eachstage on the journey. Note that a fully dynamic simulation of the inward diffusion ofthe molecule would have been too time consuming. Despite its size limitations, thismodel was clearly able to provide new insights, notably that oxygen dissociationand incorporation presents no significant energy barrier and is spontaneous whenthe molecule has arrived at the interface. Such a procedure for a multicomponentsubstrate, even for NiAl, would be considerably more difficult, because oxygennot only must diffuse to the interface, aluminum must be there to meet it, so asequence of processes, or cooperative processes, must be identified. However, thatis not to say it would be impossible, and this process represents another generalstrategy for future consideration.
The answer to the third question is again a matter of kinetics. Unless the tem-perature is very high or the partial pressure of oxygen is very low, thermodynamicequilibrium is not attained until the entire metal has become an oxide or a combina-tion of oxides. This can be easily appreciated by comparing the heat of formationof NiAl, Hf (NiAl) = −61.8 kJ/mol (22) with those of the respective oxides,Hf (NiO) = −489.5 kJ/mol, and Hf (Al2O3) = −1675.7 kJ/mol (23). For somenoble and late transition metals, a thin oxide film may appear to be of lower en-ergy than the equivalent amount of bulk oxide (6, 10, 13); however, the metal isstill unstable against further oxidation. In practical terms this means that for anymodel of an oxidized surface constructed in the laboratory, another structure withlower free energy always exists, which could be created by adding more oxygenatoms. However, the timescale for further oxidation may be much longer than thetimescale for attaining and equilibrating the oxide layer at its current thickness.Hence, any particular structure is at best metastable, but this is the normal situationin thermodynamics; one can make satisfactory predictions by excluding any statesthat are inaccessible on the timescales of interest. With this in mind, the generalstrategy we and others (10–14) have followed for predicting equilibrium config-urations and free energies can be stated as follows: One calculates the interfacialexcess Gibbs free energy for each structure of a finite set, which must be locallystable; that is, all the atomic coordinates are relaxed to equilibrium, although glob-ally the system is only metastable. This set contains a manageable number of trialstoichiometries and atomic configurations, of order perhaps 10–100. It cannot beexhaustive but it should be representative. The best prediction of the structure willbe the one in this set having the lowest excess Gibbs free energy. A key role inthis analysis is played by the chemical potentials of the components, upon whichthe excess Gibbs free energies depend. Chemical potential is inherently a nonlocalproperty; that is, the chemical potential of a species of atom does not depend on
Ann
u. R
ev. M
ater
. Res
. 200
5.35
:167
-207
. Dow
nloa
ded
from
arj
ourn
als.
annu
alre
view
s.or
gby
CA
MB
RID
GE
UN
IVE
RSI
TY
on
07/2
1/05
. For
per
sona
l use
onl
y.

27 Jun 2005 15:9 AR AR246-MR35-08.tex XMLPublishSM(2004/02/24) P1: KUV
AB INITIO CALCULATIONS 171
any atom’s immediate environment but on the system as a whole. The chemicalpotentials are computed separately from bulk calculations, and therefore they enterthe expression for the excess Gibbs energy of a surface film a posteriori, after thedetailed and time-consuming atomistic simulations of the surface have been made.This greatly extends the analysis because approximate calculations of excess Gibbsfree energy versus temperature and versus chemical potential of the componentscan be made easily to reveal the limits of stability of a particular structure.
In the case of NiAl(110), the initial oxidation results in a continuous thin alu-minum oxide film. According to the suggested structural model of the film (24,25), it consists of two O–Al bilayers with every 3 oxygen atoms in each bilayerroughly corresponding to 2 aluminum atoms in a layer of the substrate. Hence,to model the initial oxidation of a NiAl(110) surface it suffices to consider theoxygen coverage up to 2 ML (1 ML = 3 O atoms per every 2 surface Al atoms).The following sections describe how the excess Gibbs free energy of the surface inits early stages of oxidation has been calculated as a function of the temperature,the stoichiometry of the metal, and the pO2 . We hope to make clear how the sameapproach can be applied to other systems and how it can be improved and extendedto make use of faster computers.
THEORY
In the following sections we outline the theory of the excess Gibbs free energy(for short: the surface energy) σ of a planar surface of arbitrary thickness at theatomistic level and explain how σ can be calculated by making use of ab initiototal energy results for internal energies at 0 K. Surface energies of oxidizedsurfaces are very sensitive to temperature, and to the chemical potentials of thecomponents including oxygen itself, which is why the ab initio internal energiesare just one part of the story. Vibrational contributions are usually neglected insurface energy calculations, as they have been in studies of oxidation to date.On the other hand more important variations with temperature occur owing tothe temperature dependence of the chemical potentials of the components, andthese can be included analytically. The chemical potential of each componentcan be expressed in terms of its partial pressure (most appropriate for oxygen,or other naturally gaseous species) or solid concentration (most appropriate foralloy components or impurities). The latter step requires proper acknowledgmentof the fact that the zero of chemical potential in atomistic models of the energy isdifferent to the zero employed in chemistry.
The advantages of the approach just summarized have been widely appreciated.It has been referred to as ab initio thermodynamics (26–28) or first-principles atom-istic thermodynamics (29), and it is currently used by a number of independentresearch groups. For example, the oxidation of the Ag, Rh, Pt, and Pd surfaces hasrecently been investigated using the above technique (10–14). It has now been ap-plied for studying the equilibrium structure of several oxide surfaces: Cr2O3(0001)
Ann
u. R
ev. M
ater
. Res
. 200
5.35
:167
-207
. Dow
nloa
ded
from
arj
ourn
als.
annu
alre
view
s.or
gby
CA
MB
RID
GE
UN
IVE
RSI
TY
on
07/2
1/05
. For
per
sona
l use
onl
y.

27 Jun 2005 15:9 AR AR246-MR35-08.tex XMLPublishSM(2004/02/24) P1: KUV
172 FINNIS � LOZOVOI � ALAVI
(30), Fe2O3(0001) (28), V2O5(0001) (31), ZnO(0001) (32), RuO2(110) (33), andvarious surfaces of PdO (29) and α–Al2O3 (34–38).
Below we outline the approach in terms of surface excesses of the compo-nents (39), which makes the effect of non-stoichiometry at the surface explicit.Throughout we refer to NiAl as an illustration. For more detailed descriptions inother contexts the reader is referred to these references (5–19, 26–38, 40, 41). Theformulae are readily applied to other systems.
Thermodynamics at the Atomic Scale
Our formulation of the surface energy is based on that of Cahn’s (39) for homoge-neous substances, which was generalized previously to multi-component crystals(42). The system we consider is always an infinite slab some tens of atomic planesin thickness, which is the kind of atomistic system that is simulated in most cal-culations. Three-dimensional periodic boundary conditions are applied to a pieceof the slab, with a vacuum separating it typically by one nanometer from its peri-odically repeated parallel images. The basic repeat unit is called a supercell. Howcan we justify modeling the vapor phase as a vacuum? The point here is that thevacuum within the supercell does actually represent a vapor phase; however, thedensity of atoms in it is low. By regarding the supercell as a member of a grandcanonical ensemble of systems at constant temperature and pressure, the chance offinding a gas molecule in such a small volume is indeed low, and does not signifi-cantly effect the internal thermodynamic variables Es or Gs of the supercell. Wemention that interfaces between crystals are treated in the same way as surfaces,except that a second crystal slab takes the place of the vacuum. We begin with thegeneral thermodynamic formula for σ :
σ = 1
As
(Gs −
∑i
µi Ni
). 1.
Here Gs denotes the total Gibbs free energy of the contents of the supercell, As isthe surface area of the slab within the supercell, index i runs over all the componentspecies: Ni, Al, and O; µi is the chemical potential of these species, and Ni is thenumber of atoms of each species contained within the supercell. We are assuminghere for simplicity that the surfaces of the slab are identical. Recasting Equation(1) in terms of excesses �i ,
σ = 1
As
(Gs − NA
N bA
Gb
)−
∑i �=A
µi �i . 2.
Here A represents the component with respect to which excesses are measured.This is possible at an interface with only one condensed phase; if there were twodifferent condensed phases, two reference components would be required (42).N b
A and Gb are the number of atoms of species A within an arbitrary representativequantity of the bulk phase and the Gibbs free energy of that quantity, respectively.
Ann
u. R
ev. M
ater
. Res
. 200
5.35
:167
-207
. Dow
nloa
ded
from
arj
ourn
als.
annu
alre
view
s.or
gby
CA
MB
RID
GE
UN
IVE
RSI
TY
on
07/2
1/05
. For
per
sona
l use
onl
y.

27 Jun 2005 15:9 AR AR246-MR35-08.tex XMLPublishSM(2004/02/24) P1: KUV
AB INITIO CALCULATIONS 173
The surface excess �i is given by
�i = 1
As
(Ni − NA
νbi
νbA
), 3.
where νbi is the atomic fraction of component i in the bulk phase.
Now let us be more specific about the degrees of freedom under our control. Weassume that the oxidized surface of the NiAl crystal (not necessarily stoichiometric)is in equilibrium with Ni1−x Alx bulk and with oxygen gas at a certain partialpressure pO2 . The equilibrium is
Ni1−x Alx (bulk) ⇀↽ {NiAl + O} (surface) ⇀↽ O2 (gas).
How many phases are there in the equilibrium? It would be incorrect to think abouteven several layers of the surface oxide as a separate phase, as the system does nothave a well-defined bulk oxide region. Fortunately, it does not matter how thickthe surface region of the oxidized metal is as long as there is some well-definedbulk metal. As there are r = 2 phases with c = 3 components (Ni, Al, and O)in equilibrium, one has f = 3 degrees of freedom according to the Gibbs phaserule:
f = c − r + 2 = 3 − 2 + 2 = 3.
Hence, pO2 , T , and x can be chosen as three variables fully characterizing thesystem. We call them the environmental parameters because in a sense they providean environment for the surface.
If, for example, Ni is chosen as the reference component, the above equationsbecome
σ (x, T, pO2 ) = 1
As
(Gs−NNi
gNiAl(x, T )
2(1 − x)
)−µAl(x, T )�Al−µO(pO2 , T )�O, 4.
with the surface excesses of Al and O given by
�Al = 1
As
(NAl − NNi
x
1 − x
), �O = 1
AsNO, 5.
and where gNiAl is the Gibbs free energy of the bulk Ni1−x Alx per formulaunit:
gNiAl(x, T ) = 2 {(1 − x)µNi(x, T ) + xµAl(x, T )} . 6.
Equations (4)–(6) are helpful for discussing which approximations need to beemployed to make this a practical scheme. Recall that we intend to define a set ofatomic configurations and stoichiometries of the supercell, calculate σ for each,and declare the one with the lowest σ to be our predicted equilibrium structureand corresponding surface energy. The most expensive part of the calculationsis to obtain Gs because this involves the search for the atomic positions that
Ann
u. R
ev. M
ater
. Res
. 200
5.35
:167
-207
. Dow
nloa
ded
from
arj
ourn
als.
annu
alre
view
s.or
gby
CA
MB
RID
GE
UN
IVE
RSI
TY
on
07/2
1/05
. For
per
sona
l use
onl
y.

27 Jun 2005 15:9 AR AR246-MR35-08.tex XMLPublishSM(2004/02/24) P1: KUV
174 FINNIS � LOZOVOI � ALAVI
minimize the free energy of a slab containing from several tens to hundreds ofatoms, and we want to use an ab initio method in order to properly account for thestrength of chemical bonds. If Gs can be assumed to be independent of the threeenvironmental parameters, it needs to be calculated only once for each member ofthe pre-selected set of atomic configurations. First of all, we assume that the effectof the pressure on Gs is negligible. In practice we set the external pressure to zero.Second, we consider the oxygen pressure to be low enough such that no oxygenatoms need to appear in the vacuum part of the supercell; and third, we assume thatthe concentration of oxygen atoms dissolved in the bulk is sufficiently small so thatno oxygens need to be introduced explicitly into the interior of the slab. All theseapproximations are reasonable given that pO2 will never exceed 1 atm. Similarly,one can neglect the dependence of Gs on x if the deviation of the alloy compositionfrom the exact stoichiometry is of the order or less than 1/N , where N is the numberof metal atoms in the supercell. This condition places an upper limit on the range ofcompositions, which is important to keep in mind in dealing with compounds suchas Ni1−xAlx , which exists as a homogenous phase in the range 0.40 < x < 0.55.The most serious approximation is to neglect the temperature dependence of Gs .This dependence comes through both the vibrations of the atoms and the expansionof the lattice constant of the underlying bulk crystal. As such, it can be evaluatedby means of explicit ab initio calculations; a number of studies of this type alreadyexist (43–45). On the other hand, the variation of the chemical potential of oxygenwith temperature is much stronger and thus dominates in the σ (T ) dependence.In other words, the assumption that Gs is just the zero-temperature total energystill gives reasonably accurate results. There is considerable cancellation of thebulk contributions to Gs with the second purely bulk term in the parenthesis ofEquation (2).
In practical calculations then, the dependence of surface energy on x, pO2 , andT in Equation (4) enters through the chemical potentials of the species, which,as the equilibrium condition is assumed, are equal to the respective chemicalpotentials in the bulk phases. As such, they can be calculated separately. With afew additional assumptions, their dependence on the environmental parameters canthus be estimated. In particular, for µO we can make use of accurate experimentaldata, so the main uncertainties are found in the chemical potentials of the speciesin the solid. This whole scheme is illustrated in Figure 1.
Chemical Potentials
SOLID PHASE Let us assume that the oxidized surface of NiAl is in chemicalequilibrium with the underlying crystal so that the chemical potentials of Ni andAl, µNi and µAl, are equal to those of the bulk phase. These chemical potentialsdepend on the composition x of the bulk phase Ni1−x Alx , as well as on temperatureT and external pressure p. The pressure dependence of chemical potentials in solidscan, of course, be neglected under normal conditions. Before proceeding with thediscussion of how chemical potentials can be obtained in actual calculations, some
Ann
u. R
ev. M
ater
. Res
. 200
5.35
:167
-207
. Dow
nloa
ded
from
arj
ourn
als.
annu
alre
view
s.or
gby
CA
MB
RID
GE
UN
IVE
RSI
TY
on
07/2
1/05
. For
per
sona
l use
onl
y.

27 Jun 2005 15:9 AR AR246-MR35-08.tex XMLPublishSM(2004/02/24) P1: KUV
AB INITIO CALCULATIONS 175
Figure 1 Schematic diagram describing the flow of data to obtain the surfaceenergy σ as a function of the temperature T, partial pressure of oxygen gas pO2 ,and the composition x of the substrate Ni1−x Alx .
comment about their reference states is appropriate. It may be the case that chemicalpotentials used in semi-empirical calculations are not comparable with those usedin ab initio calculations, and the latter in turn differ by orders of magnitude betweenall-electron and pseudopotential calculations. This is simply because in a semi-empirical calculation, isolated atoms (at rest) are taken to have a chemical potentialof zero. On the other hand, in all-electron ab initio calculations, isolated nucleiand electrons may be assigned a zero value of chemical potential. In ab initiopseudopotential schemes the reference state would be isolated ions and valenceelectrons, and none of these corresponds to the chemical convention, which takesthe enthalpy of an element at standard temperature and pressure as zero. Suchdependence on the reference state should cancel out in the calculation of anyphysical observable such as σ , but it matters if data are transferred to one model
Ann
u. R
ev. M
ater
. Res
. 200
5.35
:167
-207
. Dow
nloa
ded
from
arj
ourn
als.
annu
alre
view
s.or
gby
CA
MB
RID
GE
UN
IVE
RSI
TY
on
07/2
1/05
. For
per
sona
l use
onl
y.

27 Jun 2005 15:9 AR AR246-MR35-08.tex XMLPublishSM(2004/02/24) P1: KUV
176 FINNIS � LOZOVOI � ALAVI
from another or from experiment. The chemical potentials of components in asolid may depend very sensitively on small concentrations of point defects. NiAlis a good example of this because it is a strongly ordered alloy, which if slightlyNi-rich, will support a population of Ni antisite defects (rather than Al vacancies).On the other hand if it is slightly Al-rich, this compound supports a population ofNi vacancies (rather than Al antisites). If we add one Al atom to an Al-rich alloy,it will create on average one more Ni vacancy, whereas if we add one Al atomto a Ni-rich alloy it will fill on average one Al vacancy. The energy required forthe second process will be much less than for the first (at constant T). But thisenergy is precisely the chemical potential of Al in the alloy, which is thereforea sensitive function of stoichiometry near the stoichiometric composition. Thechemical potentials in the case of NiAl have been estimated theoretically by thefollowing procedure.
One assumes a dilute or ideal solution model, in which interactions betweenpoint defects can be neglected and they are randomly distributed. This is oftenreferred to as the Wagner-Schottky model (46). Within this model, the Gibbs freeenergy g(x, T ) of a compound A1−x Bx is the sum of two kinds of terms. Thefirst terms are linear in each defect and host atom concentration, and representthe point defect energies and vibrational entropies. The second terms describethe configurational entropy of the point defects. If only substitutional defects andvacancies are considered (which is a very reasonable approximation for NiAl),then the Gibbs free energy per formula unit is given by (47)
g(x, T ) =∑i, j
ci j gi j (x, T ) + kB T∑i, j
ci j log ci j , 7.
where ci j denotes the concentration (per sublattice site) of species I (A, B, orvacancy V ) on sublattice J (A or B), gi j are partial defect energies to be found fromab initio calculations, and kB is Boltzmann’s constant. Equilibrium concentrationsceq
i j are those that minimize g(x, T ) given by (7), subject to some natural constraints:The sum of all the concentrations on each sublattice is unity, and the ratio of totalconcentrations of the A and B species is prescribed by the fixed composition x ofthe compound. If the defect parameters gi j are known, the ceq
i j can be obtainedeither by finding roots of a fourth-order polynomial (47) or by solving numericallythe set of mass-action equations (48–50). Then the chemical potentials in questioncan be obtained directly. They are given by (47)
µa = gaa − gva + kB T log
(ceq
aa
ceqva
)8.
µb = gbb − gvb + kB T log
(ceq
bb
ceqvb
). 9.
As T → 0 K these chemical potentials as a function of x approach constants witha step at x = 0.5. The defect parameters gi j can be assembled from total energycalculations for perfect supercells and for supercells containing a single defect, in
Ann
u. R
ev. M
ater
. Res
. 200
5.35
:167
-207
. Dow
nloa
ded
from
arj
ourn
als.
annu
alre
view
s.or
gby
CA
MB
RID
GE
UN
IVE
RSI
TY
on
07/2
1/05
. For
per
sona
l use
onl
y.

27 Jun 2005 15:9 AR AR246-MR35-08.tex XMLPublishSM(2004/02/24) P1: KUV
AB INITIO CALCULATIONS 177
the approximation that the supercells are large enough for interactions betweendefects to be neglected. For example, if G N
va is the Gibbs free energy of the supercellcontaining N unit cells with one vacancy on sublattice A, and g0 is the free energyper unit cell of the ideal stoichiometric compound AB, then
gva(T ) − gaa(T ) = G Nva(T ) − Ng0(T ). 10.
Note that the above Gibbs free energies might include the vibrations, but notthe configurational entropy; the latter is already accounted for in Equation (7).Equations similar to Equation (10) can be obtained for all four types of pointdefects. Finally, we arbitrarily assign some value to gaa and gbb such that
gaa(T ) + gbb(T ) = g0(T ) 11.
to complete the system of linear equations, which is sufficient to calculate all gi j . Itcan be shown that arbitrary division of g0 between gaa and gbb does not affect anyphysical properties of the system (47). In particular, µa and µb are well defined.If the supercell Gibbs free energies are approximated by zero-temperature totalenergies, the partial defect energies are also temperature independent.
So far, it has been demonstrated that the chemical potentials of a compoundare unambiguously defined by the reference state chosen and by the energies ofpoint defects. The alternative approach is to put natural bounds on the chemicalpotentials (51, 52) and to study a particular problem either over the whole rangeof chemical potentials specified by these bounds or simply for the maximum andminimum values of the allowed interval. In our case of the AB compound, thismethod works as follows. If µa , the chemical potential of component A, were toexceed that of the pure A crystal, µ0
a , component A would start to precipitate outof the compound. Hence
µa ≤ µ0a ; µb ≤ µ0
b. 12.
We also need the expression for the Gibbs energy g0 of bulk alloy, which is givenby Equation (6) for Ni1−x Alx , but which for the present purpose is sufficientlyaccurate if we take x = 0.5.
g0 = µa + µb. 13.
From Equations (12) and (13), one gets{g0 − µ0
b ≤ µa ≤ µ0a
µb = g0 − µa, 14.
in which only one of two chemical potentials is an independent variable. The aboveinequality is often recast in the equivalent form:
�G f ≤ �µa ≤ 0, 15.
where �µa = µa − µ0a and �G f is the Gibbs free energy of formation of the
compound AB. The method of bounds is often used in dealing with insulators or
Ann
u. R
ev. M
ater
. Res
. 200
5.35
:167
-207
. Dow
nloa
ded
from
arj
ourn
als.
annu
alre
view
s.or
gby
CA
MB
RID
GE
UN
IVE
RSI
TY
on
07/2
1/05
. For
per
sona
l use
onl
y.
27 Jun 2005 15:9 AR AR246-MR35-08.tex XMLPublishSM(2004/02/24) P1: KUV
178 FINNIS � LOZOVOI � ALAVI
semiconductors where either the ab initio calculation of point defect statistics orthe ideal solution model is more problematic than in metals.
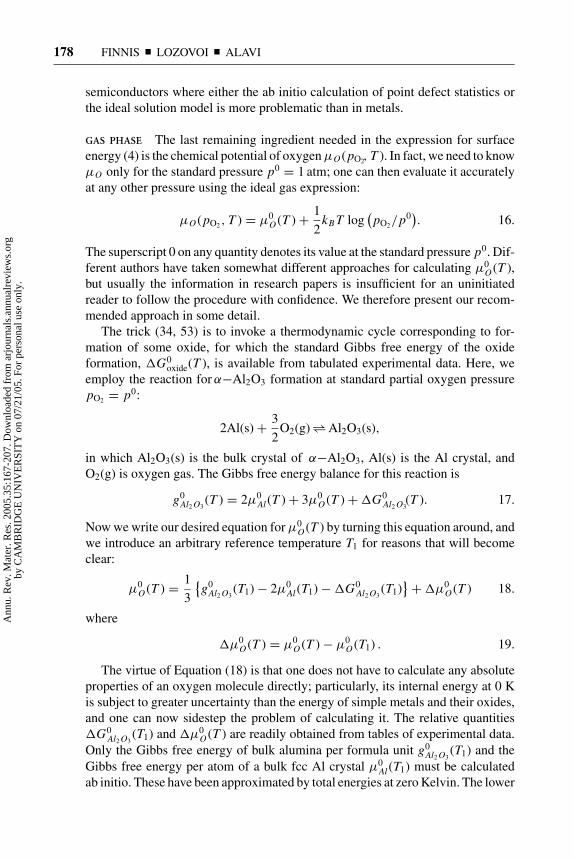
GAS PHASE The last remaining ingredient needed in the expression for surfaceenergy (4) is the chemical potential of oxygen µO (pO2, T ). In fact, we need to knowµO only for the standard pressure p0 = 1 atm; one can then evaluate it accuratelyat any other pressure using the ideal gas expression:
µO (pO2 , T ) = µ0O (T ) + 1
2kB T log
(pO2/p0
). 16.
The superscript 0 on any quantity denotes its value at the standard pressure p0. Dif-ferent authors have taken somewhat different approaches for calculating µ0
O (T ),but usually the information in research papers is insufficient for an uninitiatedreader to follow the procedure with confidence. We therefore present our recom-mended approach in some detail.
The trick (34, 53) is to invoke a thermodynamic cycle corresponding to for-mation of some oxide, for which the standard Gibbs free energy of the oxideformation, �G0
oxide(T ), is available from tabulated experimental data. Here, weemploy the reaction for α−Al2O3 formation at standard partial oxygen pressurepO2 = p0:
2Al(s) + 3
2O2(g) ⇀↽ Al2O3(s),
in which Al2O3(s) is the bulk crystal of α−Al2O3, Al(s) is the Al crystal, andO2(g) is oxygen gas. The Gibbs free energy balance for this reaction is
g0Al2 O3
(T ) = 2µ0Al(T ) + 3µ0
O (T ) + �G0Al2 O3
(T ). 17.
Now we write our desired equation for µ0O (T ) by turning this equation around, and
we introduce an arbitrary reference temperature T1 for reasons that will becomeclear:
µ0O (T ) = 1
3
{g0
Al2 O3(T1) − 2µ0
Al(T1) − �G0Al2 O3
(T1)} + �µ0
O (T ) 18.
where
�µ0O (T ) = µ0
O (T ) − µ0O (T1) . 19.
The virtue of Equation (18) is that one does not have to calculate any absoluteproperties of an oxygen molecule directly; particularly, its internal energy at 0 Kis subject to greater uncertainty than the energy of simple metals and their oxides,and one can now sidestep the problem of calculating it. The relative quantities�G0
Al2 O3(T1) and �µ0
O (T ) are readily obtained from tables of experimental data.Only the Gibbs free energy of bulk alumina per formula unit g0
Al2 O3(T1) and the
Gibbs free energy per atom of a bulk fcc Al crystal µ0Al(T1) must be calculated
ab initio. These have been approximated by total energies at zero Kelvin. The lower
Ann
u. R
ev. M
ater
. Res
. 200
5.35
:167
-207
. Dow
nloa
ded
from
arj
ourn
als.
annu
alre
view
s.or
gby
CA
MB
RID
GE
UN
IVE
RSI
TY
on
07/2
1/05
. For
per
sona
l use
onl
y.

27 Jun 2005 15:9 AR AR246-MR35-08.tex XMLPublishSM(2004/02/24) P1: KUV
AB INITIO CALCULATIONS 179
T1, the more accurate will be the result, but standard room temperature T 0 isadequate, which is fortunate because experimental values of �G0
oxide are generallyavailable only at and above T 0. Notice that the value of µ0
O (T ) depends very muchon the implicit reference states of the components in the ab initio calculation,which may be separated electrons and nuclei at rest (if all electrons are treatedexplicitly), or separated ions and nuclei at rest (in a pseudopotential calculation).However, this introduces no error because we are using the same convention forall the terms. Substitution of µ0
O back into Equation (16) completes the scheme:
µO (pO2 , T ) = 1
3
{g0
Al2 O3− 2µ0
Al − �G0Al2 O3
(T 0)}
+ �µ0O (T ) + 1
2kB T log
(pO2/p0
). 20.
One could choose any tabulated oxide instead of Al2O3 to close the thermody-namic cycle. The only requirement is that the chosen oxide and the oxide-formingelement should be amenable to accurate first principles calculations. In theory,different oxides should lead to the same µO (T ), but in practice there are smalldifferences (41). Apart from experimental errors, the obvious reason for µO todiffer from one oxide to another is the neglect of thermal contributions to theGibbs energies of the solids, which are present in the experimental �G0
oxide. Inprinciple this could be corrected by using the experimental data on the entropyand/or specific heat C p of the bulk phases, if such information is at hand. Anothersource of error is intrinsic to density functional theory in which the errors in thetreatment of exchange and correlation may differ from one system to another. Also,if pseudopotentials are used, they are not perfectly transferable.
Some observations on �µ0O (T ) are worth making. The best values of �µ0
O (T )are probably those based on combining experimental data with statistical me-chanics for ideal gases (54). However, one could disregard experimental data andintegrate from µ0
O (T 0) to temperature T, using the formula for an ideal gas of rigiddumbells (41):
�µ0O (T ) = −1
2
{(S0
O2− C0
P
)(T − T 0) + C0
P T ln(T/T0)}, 21.
where C0P (T ) ≡ 7kB/2 and S0
O2(the entropy of oxygen gas at T = T 0 and pO2 =
p0) is the only parameter taken from thermodynamic tables. As seen in Figure 2,this simple formula, Equation (21), predicts the temperature dependence of �µ0
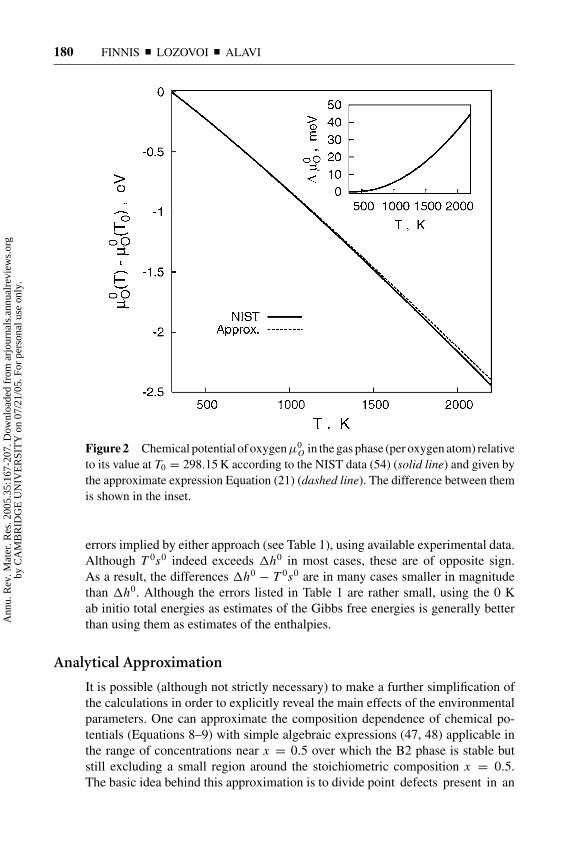
Osurprisingly well; the error at 1000 K is only 0.005 eV rising to 0.036 eV at2000 K.
Finally let us comment on the way ab initio data is used in Equation (20). So farwe have assumed the 0 K total energies are estimates of the Gibbs free energies ofsolid phases (38). What if, instead, we take them to be estimates of the enthalpies(10). It has been suggested (27) that in condensed phases the enthalpy change �h0
between 0 K and T 0 is much smaller than the contribution to the Gibbs energy T 0s0,hence the second option is preferable. To clarify this point, we have compared the
Ann
u. R
ev. M
ater
. Res
. 200
5.35
:167
-207
. Dow
nloa
ded
from
arj
ourn
als.
annu
alre
view
s.or
gby
CA
MB
RID
GE
UN
IVE
RSI
TY
on
07/2
1/05
. For
per
sona
l use
onl
y.
27 Jun 2005 15:9 AR AR246-MR35-08.tex XMLPublishSM(2004/02/24) P1: KUV
180 FINNIS � LOZOVOI � ALAVI
Figure 2 Chemical potential of oxygenµ0O in the gas phase (per oxygen atom) relative
to its value at T0 = 298.15 K according to the NIST data (54) (solid line) and given bythe approximate expression Equation (21) (dashed line). The difference between themis shown in the inset.
errors implied by either approach (see Table 1), using available experimental data.Although T 0s0 indeed exceeds �h0 in most cases, these are of opposite sign.As a result, the differences �h0 − T 0s0 are in many cases smaller in magnitudethan �h0. Although the errors listed in Table 1 are rather small, using the 0 Kab initio total energies as estimates of the Gibbs free energies is generally betterthan using them as estimates of the enthalpies.
Analytical Approximation
It is possible (although not strictly necessary) to make a further simplification ofthe calculations in order to explicitly reveal the main effects of the environmentalparameters. One can approximate the composition dependence of chemical po-tentials (Equations 8–9) with simple algebraic expressions (47, 48) applicable inthe range of concentrations near x = 0.5 over which the B2 phase is stable butstill excluding a small region around the stoichiometric composition x = 0.5.The basic idea behind this approximation is to divide point defects present in an
Ann
u. R
ev. M
ater
. Res
. 200
5.35
:167
-207
. Dow
nloa
ded
from
arj
ourn
als.
annu
alre
view
s.or
gby
CA
MB
RID
GE
UN
IVE
RSI
TY
on
07/2
1/05
. For
per
sona
l use
onl
y.

27 Jun 2005 15:9 AR AR246-MR35-08.tex XMLPublishSM(2004/02/24) P1: KUV
AB INITIO CALCULATIONS 181
TABLE 1 Comparison of the errors (in meV per oxygen atom) generated if oneassumes that total energies at 0 K approximate either enthalpies (Method H) orGibbs free energies (Method G) of crystalline oxide An Om and oxide-formingelement A in Equation (17). The errors are calculated as [�h0
An Om− n�h0
A]/m(Method H) and [�h0
An Om− n�h0
A− T0(s0An Om
− ns0A)]/m (Method G), where
�h0 = h0(T0) − h0(0 K) is the enthalpy change and s0 = s0(T0) is the entropychange between 0 K and standard temperature T0 = 298.15 K. The data are takenfrom References (54–57)
Oxide ∆h0An Om
, ∆h0A, s0
An Om, s0
A, Error, meV/atAm On kJ/mol kJ/mol J/(mol K) J/(mol K) Method H Method G
Al2O3 10.02 4.54 50.92 28.30 3.23 9.08
B2O3 9.30 1.22 53.97 5.90 23.69 −19.73
BaO 9.98 6.91 72.05 62.48 31.83 2.27
BeO 2.84 1.95 13.77 9.50 9.19 −4.00
CaO 6.75 5.74 38.1 41.59 10.51 21.29
CdO 8.41 6.25 54.85 51.80 22.42 13.00
Cr2O3 15.28 4.06 80.65 23.62 24.76 −9.64
GeO2 7.23 4.64 39.71 31.09 13.44 0.13
MgO 5.16 5.00 26.95 32.67 1.68 19.35
NbO2 9.27 5.26 54.50 36.46 20.81 −7.05
Nb2O5 22.29 5.26 137.30 36.46 24.41 −15.35
SiO2 6.92 3.22 41.46 18.81 19.17 −15.81
SnO 8.74 6.32 57.17 51.18 25.01 6.51
SnO2 8.38 6.32 49.04 51.18 10.68 13.99
SrO 8.67 6.36 55.42 55.68 23.98 24.78
Ta2O5 23.04 5.68 142.86 41.48 24.21 −12.80
TiO2 8.68 4.82 50.62 30.72 19.98 −10.75
ThO2 10.56 6.35 65.23 51.8 21.82 1.08
UO2 11.28 6.36 77.03 50.20 25.48 −15.96
UO3 14.59 6.36 96.11 50.20 28.40 −18.86
U3O8 42.74 6.36 282.55 50.20 30.64 −20.31
VO 6.91 4.64 39.10 28.93 23.50 −7.91
V2O3 17.48 4.64 98.16 28.93 28.32 −13.17
V2O4 18.10 4.64 103.52 28.93 22.85 −12.41
V2O5 21.51 4.64 130.40 28.93 25.34 −19.47
ZnO 6.93 5.66 43.65 41.63 13.22 6.99
Ann
u. R
ev. M
ater
. Res
. 200
5.35
:167
-207
. Dow
nloa
ded
from
arj
ourn
als.
annu
alre
view
s.or
gby
CA
MB
RID
GE
UN
IVE
RSI
TY
on
07/2
1/05
. For
per
sona
l use
onl
y.

27 Jun 2005 15:9 AR AR246-MR35-08.tex XMLPublishSM(2004/02/24) P1: KUV
182 FINNIS � LOZOVOI � ALAVI
ordered A1−x Bx compound into thermal and structural defects. The former are theresult of thermal disorder; they disappear as T → 0 K. The latter defects necessar-ily exist in the compound even at T = 0 K to maintain the given composition. Theconcentration of structural defects thus depends on the composition x but not onthe temperature, and in a stoichiometric compound they are entirely absent. Theratio of thermal defects to structural defects is a small parameter, unless the com-position is very close to stoichiometry; in real alloys the structural defects usuallyoutnumber the thermal defects by orders of magnitude. The first term of a Taylorexpansion of the chemical potentials with respect to this small ratio already turnsout to be a good approximation. For NiAl in particular, there is good agreementwith the exact formulae up to around 1400 K, as demonstrated in Reference (47)to which we refer the reader for more details. These expressions explicitly takeinto account that the constitutional defects in NiAl are Ni antisite atoms on theNi-rich side and Ni vacancies on the Al-rich side, as found experimentally (58)and confirmed in a number of independent ab initio calculations (48, 49, 59, 60).Explicitly (47), on the Ni-rich side (x < 0.5):
µa = 1
2{eaa + eab + kB T log(1 − 2x)}, 22.
µb = ebb + 1
2{eaa − eab − kB T log(1 − 2x)}, 23.
and on the Al-rich side (x > 0.5):
µa = eaa − eva − kB T log2x − 1
x, 24.
µb = ebb + eva + kB T log2x − 1
x, 25.
where a stands for Ni, b stands for Al, and x is the composition of the Ni1−x Alx
compound. In effect, Equations (22)–(25) approximate the dependence of chemicalpotentials on composition as being exclusively the result of the ideal configura-tional disorder of the structural defects on their own sublattices.
Another approximation used in Equations (22)–(25) is the neglect of terms oforder kBTδ, compared with the kBT log δ terms, where δ = |x−0.5| is the deviationof the composition of NiAl from the exact stoichiometry. We do not lose anyessential physics in making this approximation, as the temperature dependenceof surface energy σ is mainly from the oxygen chemical potential, even whencompared with kBT log δ terms which we keep. To this order the formula for thesurface energy Equation (4) simplifies to
σ (x, T, pO2 ) = 1
As(Gs − NNi g0) − µAl(x, T )�′
Al − µO (pO2 , T )�O , 26.
where g0 is the (free) energy of the unit cell of bulk stoichiometric NiAl,Equation (11), the aluminum surface excess is now the stoichiometry of the
Ann
u. R
ev. M
ater
. Res
. 200
5.35
:167
-207
. Dow
nloa
ded
from
arj
ourn
als.
annu
alre
view
s.or
gby
CA
MB
RID
GE
UN
IVE
RSI
TY
on
07/2
1/05
. For
per
sona
l use
onl
y.

27 Jun 2005 15:9 AR AR246-MR35-08.tex XMLPublishSM(2004/02/24) P1: KUV
AB INITIO CALCULATIONS 183
supercell itself:
�′Al = 1
As(NAl − NNi ) , 27.
and �O = NO/As , as before. To make the surface energy dependence on all threeenvironmental parameters explicit, we rewrite Equation (26) in the form
σ (x, T, pO2 ) = σ0 + �σ0θ (x − 0.5) − 1
2kB T
{�O log
(pO2/p0
)+ �′
Alη(x)} − �µ0
O (T )�O , 28.
where σ0 and �σ0 absorb all ab initio numbers, θ (x) is the step function and η(x)is defined by
η(x) =[
− log(1 − 2x), x < 0.5 (Ni-rich NiAl)
2 log[(2x − 1)/x] , x >0.5 (Al-rich NiAl),29.
and �µ0O (T ) can be parameterized as discussed above.
Stability Limits
Before we proceed with looking at the relative stability of various structures of athin oxide film formed on the surface of NiAl, it is useful to estimate the rangeof stability of the respective bulk oxide phases. For example, if in the ab initiocalculations we find a particular oxide layer to be stable at some pO2 at which theNiAl substrate turns out to be unstable with respect to the formation of bulk Al2O3,then the predicted surface structure is at best metastable with respect to furtheroxidation. It might still take much longer than the experimental timescale for thematerial to convert itself into a bulk oxide, e.g., because the oxide film itself is abarrier to further oxidation.
To find the pO2 above which NiAl starts decomposing to form some bulk oxidephase, or equivalently, the pressure below which any bulk oxide would be unstablein contact with NiAl, we take the following approach. Imagine a system comprisinga large sample of NiAl in contact with some bulk oxide surrounded by its vapor.The amount of the oxide phase is assumed to be large enough to consider it as a bulkphase and to neglect any surface or interface effects, but small in comparison tothat of NiAl such that one could think of NiAl as a reservoir of Ni and Al atoms. Wenext check, in turn, three possible oxides to derive the pO2 at which the equilibriumin the system is established at given temperature T and NiAl composition x andthen choose the smallest of these pressures, pmin, as the pO2 in question. This leavesus with only three representative situations to examine. The first one correspondsto NiAl releasing Al atoms to form Al2O3:
2Al(from Ni1−x Alx ) + 3
2O2(g) ⇀↽ Al2O3(s). 30.
Ann
u. R
ev. M
ater
. Res
. 200
5.35
:167
-207
. Dow
nloa
ded
from
arj
ourn
als.
annu
alre
view
s.or
gby
CA
MB
RID
GE
UN
IVE
RSI
TY
on
07/2
1/05
. For
per
sona
l use
onl
y.

27 Jun 2005 15:9 AR AR246-MR35-08.tex XMLPublishSM(2004/02/24) P1: KUV
184 FINNIS � LOZOVOI � ALAVI
The pressure pa corresponding to the above equilibrium can be found as in (53):
log[
pa(x, T )/p0] = 2
3kB T
[�G0
Al2O3(T ) − 2�GAl(x, T )
], 31.
where �GAl is the partial Gibbs free energy of Al atoms in NiAl. It can be takenfrom experiment (61), or calculated ab initio as �G Al(x, T ) = µAl(x, T ) − µ0
Al .The values of pa at 1273 K obtained in both ways are compared in Figure 3.The rather good agreement between them mirrors the similar level of consistency
Figure 3 Composition dependence of pa , Equation (31), pn , Equation (34), and ps ,Equation (35) at T = 1273 K according to experiment (symbols) and ab initio calcu-lations (solid lines) (62). The gaps on the curves in the vicinity of the stoichiomet-ric composition appear because the analytical approximation for Ni and Al chemicalpotentials (Equations (22)–(25)), is not applicable there. Horizontal dotted lines indi-cate the boundary of the absolute stability of α−Al2O3, pst
a , Equation (37); NiO, pstn ,
Equation (38); and NiAl2O4, psts , Equation (40). Experimental data are from Reference
(23) (�G0Al2O3
and �G0NiO), Reference (63) (�G0
NiAl2O4), and Reference (61) (�GAl and
�GNi).
Ann
u. R
ev. M
ater
. Res
. 200
5.35
:167
-207
. Dow
nloa
ded
from
arj
ourn
als.
annu
alre
view
s.or
gby
CA
MB
RID
GE
UN
IVE
RSI
TY
on
07/2
1/05
. For
per
sona
l use
onl
y.

27 Jun 2005 15:9 AR AR246-MR35-08.tex XMLPublishSM(2004/02/24) P1: KUV
AB INITIO CALCULATIONS 185
between theoretical and experimental �GAl explicitly shown in Reference(53).
The second and third reactions are similar to Equation (30) and describe theformation of nickel oxide NiO, and the spinel NiAl2O3, respectively:
Ni(from Ni1−x Alx ) + 1
2O2(g) ⇀↽ NiO(s), 32.
2Al(from Ni1−x Alx ) + Ni(from Ni1−x Alx ) + 2O2(g) ⇀↽ NiAl2O4(s). 33.
The pressures pn and ps corresponding to the equilibrium in Equations (32) and(33) are given by
log[
pn(x, T )/p0] = 2
kB T
[�G0
NiO(T) − �GNi(x, T)], 34.
log[
ps(x, T )/p0] = 1
2kB T
[�G0
Ni Al2 O4(T )
− 2�GAl(x, T) − �GNi(x, T)]. 35.
These pressures are also plotted in Figure 3, which shows that pa is lowest overthe whole range of B2 compositions: pmin = pa .
To complete our analysis, let us check that at the pressures found the respectiveoxides would not decompose into their constituents. The pressure pst
a below whichAl2O3 decomposes into Al(s) and oxygen gas
Al2O3(s) → 2Al(s) + 3
2O2(g), 36.
is defined by Equation (34):
log[
psta (T )/p0
] = 2
3kB T�G0
Al2O3(T). 37.
Similarly, NiO decomposes into Ni(fcc) and oxygen below pressure pstn given by
log(
pstn /p0
) = 2
kB T�G0
NiO(T). 38.
Finally, at an oxygen partial pressure below psts , NiAl2O4 becomes unstable with
respect to decomposition into Al2O3 and Ni (64):
NiAl2O4(s) → Al2O3(s) + Ni(s) + 1
2O2(g). 39.
where
log[
psts (T )/p0
] = 2
kB T
[�G0
Ni Al2 O4− �G0
Al2 O3
]. 40.
Ann
u. R
ev. M
ater
. Res
. 200
5.35
:167
-207
. Dow
nloa
ded
from
arj
ourn
als.
annu
alre
view
s.or
gby
CA
MB
RID
GE
UN
IVE
RSI
TY
on
07/2
1/05
. For
per
sona
l use
onl
y.

27 Jun 2005 15:9 AR AR246-MR35-08.tex XMLPublishSM(2004/02/24) P1: KUV
186 FINNIS � LOZOVOI � ALAVI
The pressures psta , pst
s and pstn are shown in Figure 3 as horizontal lines. Impor-
tantly, psta is lower than pa over the whole composition range (which simply means
that it is harder to extract an Al atom from NiAl than from pure Al). Hence, thepa(x) curve represents the equilibrium between NiAl and alumina; above pa(x),NiAl starts shedding Al atoms to form Al2O3. At pO2 = ps , NiAl might con-ceivably be in equilibrium with NiAl2O4 spinel, but because ps is smaller thanpst
s , any NiAl2O4 formed should decompose into Ni and Al2O3. We observe thatincreasing the pO2 above pa appears to activate more channels for NiAl oxidation.However, a mixture of products (including perhaps more metastable phases notconsidered here) is conceivable only if the local concentration of Al is depleteddown to the Ni3Al phase boundary and beyond by the slow bulk diffusion in theNiAl. Another way of looking at this is to consider the sequence of solid phasesthat would be in equilibrium under increasing pO2 if the NiAl were completelyexhausted, assuming it remains homogeneous. The sequence, both according toFigure 3 and the experimental phase diagram (65), would be
NiAl → NiAl + Al2O3 → Ni3Al + Al2O3 → Ni + Al2O3
→ Ni + NiAl2O4 → NiO + NiAl2O4.
Note that NiAl2O4 does appear as a transient phase in some experimental studiesof NiAl oxidation (66).
The pressure pmin is estimated here by assuming that bulk α−Al2O3 is the oxidephase formed reversibly by NiAl. α−Al2O3 is the most stable form of alumina,hence it is plausible to suggest that the pressure at which a thin oxide layer on topof NiAl starts to form could not be less than pmin. Clearly, a thin Al2O3 layer alonecannot be of lower energy than the bulk phase, otherwise the bulk α−aluminawould decompose into such layers. However, one cannot rule out the theoreticalpossibility that the interaction of the layer with the substrate strongly stabilizes thesystem. This can be tested by ab initio calculations; so far the situation in which athin oxide layer is more stable than bulk oxide has been found only for some nobleand late transition metals: Ag (10), Ru (6), and Pd (13).
THE PATH OF NiAl OXIDATION
NiAl is a popular substrate for growing alumina films. It suits this purpose bet-ter than pure Al because the temperature required to convert the initially de-posited oxygen atoms into an ordered film exceeds the melting temperature ofAl. The experimental procedure to produce a 5 A alumina film on NiAl(110) iswell established (24). One must expose clean NiAl(110) to a dose 1000–1200 L(1 L = 10−6 Torr s) of oxygen at a temperature of about 600 K, after which the sur-face is annealed in ultra-high vacuum (UHV) at a temperature in excess of 1000 K.After the first stage, a layer of amorphous alumina is formed, which is believed to belocally ordered but which does not produce any diffraction spots (hence the name).
Ann
u. R
ev. M
ater
. Res
. 200
5.35
:167
-207
. Dow
nloa
ded
from
arj
ourn
als.
annu
alre
view
s.or
gby
CA
MB
RID
GE
UN
IVE
RSI
TY
on
07/2
1/05
. For
per
sona
l use
onl
y.

27 Jun 2005 15:9 AR AR246-MR35-08.tex XMLPublishSM(2004/02/24) P1: KUV
AB INITIO CALCULATIONS 187
During the second stage, the well-ordered film of Al2O3 is formed. The questionas to which of the allotropic modifications of Al2O3 most closely corresponds tothe structure of the film is still being debated. Some experimental data suggestit is γ -Al2O3 (25, 67), although according to a very recent study (68), κ-Al2O3
reproduces experimental results even better. In either case, the structure of the filmcan be viewed as two distorted hexagonal layers of oxygens alternating with twoaluminum layers, such that the film terminates with oxygen on the vacuum side.
Investigation into the influence of the above experimental conditions on thequality of the alumina film brings some surprising findings. It was shown thatlowering the oxygen pressure from 5 × 10⁻⁷ Pa down to 5 × 10⁻⁸ Pa results in abetter ordering of the film (69). This might indicate that the diffusion processes inNiAl are important, as the lower the pressure the longer the exposure time requiredto deposit the same amount of oxygen (1200 L) in (69). The effect of the temper-ature at the initial deposition stage is even more interesting: In going from 570 Kto 670 K, the crystallinity of the film improves. A further rise in temperature to720 K, however, makes the film worse again (70). The first observation apparentlysupports the previous diffusion argument, whereas for the second the authors of(70) find no reasonable explanation. Also puzzling remains the observation thatafter the initial deposition performed at relatively low-temperature 370 K, evensubsequent high-temperature UHV annealing does not produce the expected formof the oxide film (71).
To rationalize the results of such experiments, or even to give some guidancefor future experimental work, a model of surface oxidation of NiAl at the atomisticlevel would be helpful. More generally, oxidation of a perfectly ordered compoundin which only one of the components participates in the formation of the oxidefilm, sometimes referred to as selective oxidation, is not unusual. Elucidating themain rules governing the much-studied NiAl may help to understand the oxidationof other compounds, such as CoAl (72) and CoGa (Ga2O3 film) (73). What isknown about the mechanism of NiAl oxidation? Evidently oxygen should some-how initiate the segregation of aluminum to the surface, where aluminum oxidizes.In the later stages of oxidation, i.e., after the formation of a continuous oxide layer,its further growth occurs by means of diffusion of Al and O atoms through thefilm in opposite directions. Parabolic kinetics of the growth of the thick oxideindicates that the process is diffusion controlled (1). For the early stage at whicha thin film just forms, Al segregation to the surface might proceed by more thanone mechanism. Bulk Ni1−x Alx with Al in excess (x > 0.5) forms a subtractionalsolid solution, in which extra Al atoms stay on their own sublattice thus creatingvacancies on corresponding Ni sites (see above). If this is still the case close tooxidized surfaces, segregation of Al would effectively mean segregation of VNi.Otherwise AlNi atoms should appear at the interface. Such antisite Al defects do notusually appear in NiAl bulk, except in very Al-rich alloys (47, 49). Nevertheless,NiAl actually uses both mechanisms (see below).
A related question is whether the extraction of Al atoms from the NiAl crystalduring oxidation increases the vacancy concentration in the specimen, as Frazer
Ann
u. R
ev. M
ater
. Res
. 200
5.35
:167
-207
. Dow
nloa
ded
from
arj
ourn
als.
annu
alre
view
s.or
gby
CA
MB
RID
GE
UN
IVE
RSI
TY
on
07/2
1/05
. For
per
sona
l use
onl
y.

27 Jun 2005 15:9 AR AR246-MR35-08.tex XMLPublishSM(2004/02/24) P1: KUV
188 FINNIS � LOZOVOI � ALAVI
et al. (74) suggested to explain the growth of voids and dislocation loops in aslowly cooled NiAl crystal that they observed during annealing in 10−7 Torr vac-uum at about 1200 K. Although Eibner et al. (75) noted that Fraser et al.’s resultcould be interpreted without any assumption of vacancy injection by surface ox-idation, the later experiment by Parthasarathi & Fraser (76) seemed to supportthe initial idea. Jaeger et al. (24) suggested that the formation of the Al2O3 filmshould destroy two surface layers of NiAl with subsequent dissolution of Ni atomsinto the bulk, the latter being the reason for the ordering of the Al2O3 overlayerduring annealing at high temperature. In this case, there should be vacancy con-sumption rather than vacancy injection into the bulk. Our analysis supports theview that vacancies are consumed rather than created during the initial stage of theoxidation.
ZERO TEMPERATURE CALCULATIONS: THE ROLE OF POINT DEFECTS It is apparentfrom the above discussion that the creation and annihilation of point defects in thesurface region of NiAl is an essential part of the process. To elucidate a plausiblemechanism for the oxidation we therefore considered a number of different sce-narios, introducing into the NiAl substrate either vacancies or antisite defects, orboth. The simulation cell used in our ab initio calculations consisted of four layerswith two Ni and two Al atoms in each layer. Zero, one, and three O atoms wereadded to the cell; the latter imitates a complete Al + O layer of the oxide film, halfof what is observed experimentally, whereas configurations with one oxygen atomper cell were supposed to model single atom adsorption. For completeness, wealso considered configurations with two Al + O layers, with six oxygen atoms persimulation cell. We denote the configurations with a capital letter and a subscript.The meaning of the former is given in Table 2 in which all the configurations arelisted. The subscript indicates how many O atoms were introduced in the super-cell, which at the same time is the oxygen excess times the surface area, �′
O As .For example, A0 denotes the clean ideal NiAl surface, E3 is the configuration with3 oxygen atoms per 4 surface sites of the substrate, the latter contains a vacancyon the Ni sublattice in the top layer, V (1)
Ni , in addition a Ni atom in the top layerand an Al atom in the second layer are interchanged, Al(1)
Ni + Ni(2)Al (the so-called
exchange defect).In each of the configurations, the atomic positions were adjusted to minimize
the energy of the slab. For oxygen-free configurations this was straightforward. Inconfigurations containing one O atom, we placed it on inequivalent adsorption sites(40) and then compared the respective total energies after atomic relaxation. Forthree and more oxygen atoms we adopted the following strategy: First, a particularconfiguration was brought to the nearest (local) minimum, and then we performeda molecular dynamics simulation at T = 1000 K monitoring the potential energyof the system. After 300–500 MD steps we took the lowest point on the poten-tial energy surface as a starting point for the final zero-temperature optimizationof atomic positions. The advantage of the MD method is that it probes collective
Ann
u. R
ev. M
ater
. Res
. 200
5.35
:167
-207
. Dow
nloa
ded
from
arj
ourn
als.
annu
alre
view
s.or
gby
CA
MB
RID
GE
UN
IVE
RSI
TY
on
07/2
1/05
. For
per
sona
l use
onl
y.

27 Jun 2005 15:9 AR AR246-MR35-08.tex XMLPublishSM(2004/02/24) P1: KUV
AB INITIO CALCULATIONS 189
TABLE 2 Notation for different configurations considered in the present study.Point defects are denoted as X(i)
Y ,which means species X (Al, Ni, or vacancy V)on sublattice Y (Al or Ni) in layer i (layer 1 is the surface). Configuration H wasdesigned to simulate experimentally observed stoichiometry of the oxide (twoAl2O3 layers); it was used in combination with 6 oxygen atoms (H6 in our notation).The last column represents the surface excess of Al atoms �Al (assuming astoichiometric substrate) multiplied by the cross-sectional area of the supercell As
Notation Point defects present ΓAl × As
A none 0
B V(2)Ni 1
C V(1)Ni 1
D V(2)Ni + Ni(2)
Al + Al(1)Ni 1
E V(1)Ni + Ni(2)
Al + Al(1)Ni 1
F V(2)Al + Al(1)
Ni 1
G Ni(2)Al + Al(1)
Ni 0
H V(1)Ni + Ni(2)
Al + Al(1)Ni + Al extra atom 2
I V(1)Al −1
J V(1)Ni + Ni(1)
Al −1
motions of the atoms and can be good at finding natural pathways linkingdifferent basins of the potential energy surface. As a result,we managed to locatenew configurations that would be impossible to guess otherwise. In some cases,these configurations were 1–2 eV/cell lower in energy than those obtained frominitial plausible atomic arrangements. For more details and discussion of the MDsimulations and all ab initio calculations, which were made with the plane-wavepseudopotential method using the CPMD code, the reader is referred to References(40, 53). Below we present only the results obtained within the local density ap-proximation (LDA). The effect of the generalized gradient approximation (GGA)is discussed in (40).
The study of the adsorption of one O atom per supercell, �O As = 1, revealsthat oxygen atoms prefer to adsorb at the threefold hollow site formed by two Aland one Ni atoms. The second oxygen’s preference is the bridge site between Alatoms, which is just 0.2 eV higher in energy. Strong distortion of the substrate wasobserved in both cases. According to structural models of the NiAl(110)/Al2O3
interface (24, 25), configurations with �O As = 3 should correspond to one of thetwo Al + O bilayers of the Al2O3. However, the theoretical structure of the oxygenlayer on the ideal NiAl substrate does not at all resemble any atomic arrangementtypical of Al2O3. O atoms have arranged themselves there in a kind of butterflystructure, occupying an Al–Al bridge site and two (2Al + Ni) hollow sites per
Ann
u. R
ev. M
ater
. Res
. 200
5.35
:167
-207
. Dow
nloa
ded
from
arj
ourn
als.
annu
alre
view
s.or
gby
CA
MB
RID
GE
UN
IVE
RSI
TY
on
07/2
1/05
. For
per
sona
l use
onl
y.

27 Jun 2005 15:9 AR AR246-MR35-08.tex XMLPublishSM(2004/02/24) P1: KUV
190 FINNIS � LOZOVOI � ALAVI
cell (configuration A3 in Figure 4), providing each O atom with two Al neighbors.However, it is problematic to call such a structure an oxide layer because theparallel O–Al chains do not appear to be linked to each other. Configuration G3,in which we exchanged a surface Ni with subsurface Al atoms, would not seemparticularly stable either (see Figure 4). Owing to its larger radius, the extra Alatom has been pushed out of the surface and forms a kind of pyramid with its fournearest-neighbor Al atoms. This pyramid is decorated with oxygens on three of itsfour sides in such a way that each O atom now has three Al neighbors. Nevertheless,the total energy of this structure is almost 2 eV lower, probably because of theincreased number of O–Al bonds.
We checked next the effect of introducing a Ni vacancy in the top layer (con-figuration C3). The energy again significantly decreased (by 1.92 eV for Ni-rich,and by 2.96 eV for Al-rich NiAl). During the MD run, atoms first vibrated abouttheir initial positions, but after about 300 steps (0.36 ps) the Al atoms changedtheir striped structure by forming distorted hexagonal rings around Ni atoms, inwhich each pair of adjacent Al atoms became connected by an oxygen atom. Al-though each oxygen atom in this structure still had only two Al neighbors, theextra space provided by the vacancy allowed the system to form a number of shortO–Al bonds (1.79 A). We thus conclude that the effect of an antisite defect is toexpose more Al atoms to the surface oxygen and thus to increase the number ofAl–O bonds, whereas the vacancy makes space for the system to arrange atoms ina more optimal way.
Finally, trying both the exchange defect and the Ni vacancy in the top layer si-multaneously, we arrived at our lowest energy atomic arrangement, which demon-strates two clearly separated oxygen and aluminum layers (configuration E3 inFigure 4). Al atoms in the top layer arrange themselves in a distorted hexagonalpacking and have almost lost their sublattice individuality, therefore the resultingO–Al bilayer can be considered as the first distinct precursor of the oxide phase.
How does the system arrive at the configuration E3 starting from configurationA3? Would it go through G3 or C3 (Figure 4)? To answer this, we have considered anumber of intermediate configurations listed in Table 2, such that the system’s tripfrom A3 to E3 can be decomposed into elementary steps. The resulting pathwaysare shown in Figure 5 together with the energy change at each step. For example,if a Ni bulk vacancy is initially absorbed by the second layer (A → B), it may thenjump to the surface layer (B → C), and the creation of exchange defect (C → E)completes the path ABCE. Alternatively, having a Ni vacancy in the second layer,the system can first create an exchange defect (B → D) and then either allow theNi vacancy to jump to the first layer immediately (D → E), or first convert V(2)
Ni
and Ni(2)Al defects into V(2)
Al (i.e., the Ni antisite atom returns to its own sublattice,filling a Ni vacancy there). A nearest-neighbor Ni atom from the first layer canthen jump into this vacancy (D → F → E). Another family of pathways arises ifwe assume that the system starts by creating an exchange defect (A → G). Thena Ni vacancy arrives at the second layer (G → D), and the subsequent history isas above.
Ann
u. R
ev. M
ater
. Res
. 200
5.35
:167
-207
. Dow
nloa
ded
from
arj
ourn
als.
annu
alre
view
s.or
gby
CA
MB
RID
GE
UN
IVE
RSI
TY
on
07/2
1/05
. For
per
sona
l use
onl
y.

27 Jun 2005 15:9 AR AR246-MR35-08.tex XMLPublishSM(2004/02/24) P1: KUV
AB INITIO CALCULATIONS 191
We emphasize here the dependence of the relative energies on the substratecomposition. In the zero-temperature limit, the surface energy dependenceon composition is described by the step function, Equation (28). Hence the precisecomposition of the bulk substrate is not important, only whether it is Al- or Ni-rich.Looking at the pathways shown in Figure 5 we see that an additional free-energybarrier of at least 0.5 eV appears on the Ni-rich side compared with that on the Al-rich side (40). This is because configurations containing a Ni vacancy are higherin energy in Ni-rich NiAl simply because on the Al-rich side, these vacancies arethe structural defects (see above).
Our zero-temperature analysis thus shows that the oxidized NiAl substrate triesto get rid of Ni atoms in the top layer(s) by either exchanging them with Al atomsbeneath or absorbing Ni vacancies from the bulk. Both processes seem essential:The first allows the surface to expose more Al atoms to oxygen, whereas thesecond provides more space in the surface layer to accommodate larger Al atomsand subsequently to form a relatively open oxide structure (77). On the Ni-richside, we expect larger barriers for the oxidation. For any substrate composition, theinitial growth of the oxide film invokes the segregation and further consumptionof Ni vacancies, therefore the substrate vacancies are destroyed, not injected.
This picture remains essentially valid in the finite temperature analysis (seebelow). Before proceeding, however, let us discuss how realistic the suggestedmechanism is. In particular, according to the presented scheme one would expectthat the substrate is first locally enriched with Ni near the metal-oxide interface,and this has not been observed experimentally (25). Of course, such enrichmentis a transient effect; the excess Ni atoms should dissolve in the bulk to restore theoverall equilibrium of the system by absorbing Ni vacancies. But is the diffusionin bulk NiAl fast enough to supply all the required vacancies?
To confirm that this is the case, one could make a routine estimate of the dif-fusion rates (24, 69), but we think more direct evidence exists. It comes fromthe elegant work by McCarty et al. (78), who observed the growth and shrinkageof surface steps at the NiAl(110) surface while cycling the temperature around1000 K. The characteristic time of the cycle was of the order of several seconds.This turned out to be sufficient for the surface steps to respond to the temper-ature oscillation by changing their size. The essential point is that the size ofthe steps changed because they were emitting or absorbing vacancies to maintainthe temperature-dependent equilibrium concentration of vacancies in the NiAlbulk.
Even more direct confirmation of the model comes from the X-ray study ofthe NiAl(110)/Al2O3 interface by Stierle et al. (71). The exposure of the NiAlspecimen to oxygen gas at two different temperatures, 370 K and 570 K, followedby a 4 min annealing at 1020 K, resulted in drastically different concentrationsof point defects in the first few layers of the substrate. At the lower exposuretemperature, almost half of the aluminum sublattice was occupied by vacanciesin the first two layers. In addition, the Ni sublattice of the top layer containedNi and Al atoms in almost equal proportion. We understand that the temperature
Ann
u. R
ev. M
ater
. Res
. 200
5.35
:167
-207
. Dow
nloa
ded
from
arj
ourn
als.
annu
alre
view
s.or
gby
CA
MB
RID
GE
UN
IVE
RSI
TY
on
07/2
1/05
. For
per
sona
l use
onl
y.

27 Jun 2005 15:9 AR AR246-MR35-08.tex XMLPublishSM(2004/02/24) P1: KUV
192 FINNIS � LOZOVOI � ALAVI
of 370 K was insufficient to activate the diffusion, and the oxidation removed asignificant fraction of the Al atoms from the substrate leaving Al vacancies; the veryopen structure that resulted induced major chemical disorder on the sublattices.Some structural disorder is to be expected in such open structures, especially in thevicinity of the incommensurate oxide phase. At the higher temperature, T = 570 K,on the contrary, no vacancies were found in the top two layers, and only 18% of Alantisite atoms was observed. These atoms were significantly displaced outwards(by half of the NiAl(110) interplanar spacing). We consider the above result asevidence of some diffusion exchange already in operation at 570 K. The antisiteAl atoms are probably the consequence of the strong chemical interaction betweenthe oxide layer and the NiAl substrate. Surprisingly, introduction of 11% of Niatoms in a Ni-Ni bridge site in the surface layer led to significant improvement ofthe fit to X-ray data (71). This might be a consequence of the above mentionedlateral distortion of the substrate atoms induced by the oxide film. Somewhatdifferent results have been reported by Torrelles (79). In this study (1200 L at600 K, then annealing to 1200 K for few minutes), neither structural nor additionalchemical disorder in the top substrate layer was detected after the formation ofthe Al2O3 overlayer. The intermixing of the species between sublattices in the toplayer of about 4% was the same as for the pure NiAl(110) surface. Such resultsare interpreted in (79) as the result of the diffusion of Al to the surface and Ni tothe bulk.
Overall, we conclude that the point defect–mediated oxidation mechanism (40,53), controlled by defect mobility as a function of temperature, is fairly welldocumented in NiAl. The rate of diffusion required for this mechanism is alreadynoticeable at temperatures of about 600 K, and is surely sufficient at 1000–1200 K.
Surface Energy Dependence on the Environmental Parameters
In this section, we expand the analysis made above to finite temperatures. Indoing this, we neglect any vibrational contributions to the Gibbs free energy,thus simply converting each of the previously calculated zero-temperature surfaceenergies into a function of pO2 , x , and T by using Equation (28). We concentrateon the following two issues: What is the lowest energy configuration at a givenset of environmental parameters? Do any oxidation barriers appear in addition tothose previously discussed? Notice in the following that a classical treatment ofsurface energies would distinguish the surface of the film from its interface withthe substrate, and attribute a separate interface energy to the latter. We recognizethat this distinction has no meaning when the films are too thin for their surface tobe decoupled from the interface with the substrate, and we note that our surfaceenergies include this coupling implicitly, together with the surface and interfacecontributions.
We plot in Figure 6 the surface energies σ of our configurations as a function ofpO2 at T = 1273 K, separately for a Ni-rich (x = 0.45) and an Al-rich (x = 0.55)composition. In this way we can determine the behavior of σ at all intermediate
Ann
u. R
ev. M
ater
. Res
. 200
5.35
:167
-207
. Dow
nloa
ded
from
arj
ourn
als.
annu
alre
view
s.or
gby
CA
MB
RID
GE
UN
IVE
RSI
TY
on
07/2
1/05
. For
per
sona
l use
onl
y.

27 Jun 2005 15:9 AR AR246-MR35-08.tex XMLPublishSM(2004/02/24) P1: KUV
AB INITIO CALCULATIONS 193
compositions, as it should change smoothly from Figure 6a to Figure 6b as x goesfrom 0.45 to 0.55. The observation widely used in similar studies [(see, for example,References (26, 29)] is that changing the temperature roughly corresponds torescaling the pressure axis if the latter is plotted in units of log(pO2/p0) (34). Thisis because the composition-dependent term is small compared with the oxygenpressure term in curly brackets in Equation (28). The last term in Equation (28)defines the pressure about which the rescaling should be performed. For NiAl, thisis a large pressure of about 1011 atm (53). Therefore, all essential information isalready contained in Figure 6.
In Figure 6 we show only configurations A, C, E , and H as this is sufficient tocapture the overall picture. Different configurations are shown by different colors,whereas the oxygen excess �O As = 1, 3, or 6, is indicated by numbers on theplot. Horizontal lines correspond to zero oxygen excess, meaning an oxygen-freesurface. Let us start with the Ni-rich system (Figure 6a). The structure of thisbusy plot is in fact quite simple. One can distinguish three regions indicated abovethe plot. Region I corresponds to the pressures at which the clean surface (A0) ismost stable. These are the pressures below ∼10−24 atm. Region III is the region inwhich the oxidation can proceed without any additional barriers. It corresponds tothe pressures above ∼10−14 atm. Indeed, it is easy to appreciate that the followingsequence decreases the surface energy at each step: A0 → A1 (an O atom adsorbs atthe clean surface), A1 → A3 (two more O atoms adsorb), A3 → C3 (a Ni vacancyarrives at the top layer), C3 → E3 (an exchange defect is created), E3 → E6 (threemore O atoms adsorb), and E6 → H6 (an Al atom is extracted from the substrate).
Correspondingly, Region II is the region in which an additional barrier for theoxidation appears owing to the non-monotonic dependence of surface energies onoxygen coverage. This situation arises if, for example, configurations with threeoxygen atoms per cell are lower in energy than configurations with one oxygenatom, but clearly the surface cannot adsorb three atoms before it adsorbs one!This behavior is discussed below. The paths that the system can choose in suchcircumstances are A0 A1C1C3 E3 E6 H6 or A0C0C1C3 E3 E6 H6 (Figure 6a).
If we look only at the lines representing the lowest σ , these are A0 below thepressure 10−24 atm, and H6 above it. Therefore, there is a range of pressures be-tween pmin and 10−24 atm. in which the substrate should already be oxidizing (seeabove), but this does not happen according to the calculations of surface energy.There might be two reasons for this. First, the estimate refers to the formation ofbulk α−Al2O3 by oxidation of NiAl, and the thin oxide film that forms on the sur-face may be less stable than bulk alumina. Second, in calculations, we can consideronly a limited number of configurations; there might be a configuration of lowerenergy than H6, which would intersect A0 at a lower pressure. The low-energyconfigurations for each coverage for which calculations are available (A0, A1, E3,and H6) form a sequence in which configurations with progressively higher oxygencontent intersect A0 at lower and lower pressure. They should tend to a vertical linein the limit of infinite oxygen excess (a thick Al2O3 layer). Without extrapolatingfrom the present configurations, we note that at a pressure of ∼10−21 atm, the H6
Ann
u. R
ev. M
ater
. Res
. 200
5.35
:167
-207
. Dow
nloa
ded
from
arj
ourn
als.
annu
alre
view
s.or
gby
CA
MB
RID
GE
UN
IVE
RSI
TY
on
07/2
1/05
. For
per
sona
l use
onl
y.
27 Jun 2005 15:9 AR AR246-MR35-08.tex XMLPublishSM(2004/02/24) P1: KUV
194 FINNIS � LOZOVOI � ALAVI
line intersects the zero axis, which signals the instability of the system to catas-trophic oxidation. We interpret σ < 0 to mean that the whole system is unstableto fragmentation into oxidized surfaces.
For the Al-rich substrate (Figure 6b), the situation is similar, except the vacancy-containing configurations (C, E , and H) are of lower energies because they haveAl in excess. As a result, the boundaries for Regions I, II, and III shift slightly to theleft: 10−26 and 10−16 atm instead of 10−24 and 10−14 atm, respectively. Also, thenominal barriers for paths A0 A1C1C3 E3 E6 H6 and A0C0C1C3 E3 E6 H6 in RegionII are lowered on the Al-rich side. This is the same trend we observed for transitionsat fixed oxygen coverage (see above).
According to Figure 6, the experimental conditions under which the oxidefilm on NiAl is grown (for the initial oxygen deposition and even for the high-temperature annealing) fall into Region III for both Ni-rich and Al-rich substrate.Although the metal is already unstable with respect to oxidation (configurationH6 gives a negative surface energy), surprisingly, a thin oxide film can still beproduced. This is likely due to kinetic limitations: The diffusion of oxygen and/oraluminum through the compact oxide film is sufficiently slow to prevent its furthergrowing. However, it remains unclear how to explain the following experimentalobservation: If the annealing temperature exceeds 1300 K, the oxide film starts todisintegrate (80). According to Figure 6, in order for the oxide film to dissolveat 1300 K, the pO2 must be of the order of 10−24 atm or even lower. We can onlyspeculate that lower values than this might prevail at the oxide–metal interface ifthe diffusion gradient is sufficiently steep.
‘Inverted’ Surface Energy Behavior and Relationto the Oxide Growth Mode
Previously, we pointed out a surprising feature of σ (pO2 ) lines as the pO2 is raised:At the point where a configuration with oxygen excess �O As = 1 becomes stable,i.e., crosses the clean surface line A0, a configuration with �O As = 3 is alreadymore stable. We call this behavior inverted. Similarly, when �O As = 3 becomesmore stable than A0, a �O As = 6 configuration is already more stable. This isopposite to the picture that one would naively expect, thinking of adsorbed oxygenatoms as negatively charged ions that repel each other. Indeed, a monotonic de-crease of binding energy per adatom as the coverage increases is often observed forother systems such as O/Ru(0001) and O/Rh(111) (6, 7), up to a monolayer cover-age. A normal pattern would correspond to σ (pO2 ) plots shown on the left graph inFigure 7, in which the lines with higher oxygen content intersect the pure surfaceline at higher pressures. For NiAl(110), the situation is reversed, and this invertedbehavior is shown on the right graph in Figure 7. Why do surface energies ofoxidized NiAl show this counterintuitive trend? The answer is rather simple, butbefore we explain it, let us make one more observation. The lowest energy con-figurations for each oxygen coverage, A0, A1, E3, and H6 on the Ni-rich side, andA0, C1, E3, and H6 on the Al-rich side, both form the inverted sequence (Figure 6).
Ann
u. R
ev. M
ater
. Res
. 200
5.35
:167
-207
. Dow
nloa
ded
from
arj
ourn
als.
annu
alre
view
s.or
gby
CA
MB
RID
GE
UN
IVE
RSI
TY
on
07/2
1/05
. For
per
sona
l use
onl
y.

27 Jun 2005 15:9 AR AR246-MR35-08.tex XMLPublishSM(2004/02/24) P1: KUV
AB INITIO CALCULATIONS 195
Figure 7 Schematic illustration of the normal and inverted dependence of surfaceenergy on coverage. In this example, we show surface energies corresponding to cover-ages 0 ML, 1 ML, and some fractional coverage of 1/n ML, where n > 1. The normaltype corresponds to σ1 crossing σ0 at higher oxygen partial pressure than σ1/n ; the typeis inverted if this is the other way round. The normal (inverted) type is indicated by thepositive (negative) sign of �σ defined by Equation (42) and has a simple geometricinterpretation, as shown in the Figure.
However, by comparing only Ai configurations in which no point defects are al-lowed (Figure 6), we see that they form a normal sequence. Hence, it is the pointdefects created in the substrate that invert the surface energies. Now the picturewe have is thus. Because of the strong attraction between adsorbed oxygen atomsand substrate Al atoms, the adsorbate tries to re-arrange the substrate to createthe local configuration that would resemble stable alumina as closely as possi-ble. Apart from simple atomic relaxation (which is also present in configurationsAi ), such a rearrangement requires absorption of vacancies and interchange ofAl and Ni atoms. If these movements can be achieved, the more oxygen atomsthat combine forces, the lower the energy of the structure they create. The gainin energy overcomes the above mentioned mutual repulsion and the disadvantageof sharing substrate atoms. In other words, if point defects are available, the oxy-gen atoms can work together to design the substrate that suits them best. If pointdefects are not available, then the ability of the adsorbed oxygens to cooperate isreduced.
There is a direct relation between inverted versus normal behavior of the surfaceenergies and the the stability of islands versus a continuous film, illustrated inFigure 8. Consider two configurations with surface energies σm and σn , wherethe subscript is an integer that measures the oxygen excess �O , and m < n. Themonolayer corresponds to n = 1, the double layer to n = 2 and so on. σ0 denotesthe energy of the pure surface. The islands in Figure 8 contain the same materialas the continuous layer, but have a relative thickness n/m. They therefore occupya fraction m/n of the surface and the combination of exposed surface and islands
Ann
u. R
ev. M
ater
. Res
. 200
5.35
:167
-207
. Dow
nloa
ded
from
arj
ourn
als.
annu
alre
view
s.or
gby
CA
MB
RID
GE
UN
IVE
RSI
TY
on
07/2
1/05
. For
per
sona
l use
onl
y.

27 Jun 2005 15:9 AR AR246-MR35-08.tex XMLPublishSM(2004/02/24) P1: KUV
196 FINNIS � LOZOVOI � ALAVI
Figure 8 Illustration of the island growth and layer-by-layer growth modesof the surface oxide.
has an effective surface energy of
σislands = m
nσn +
(1 − m
n
)σ0. 41.
Compare this with the surface energy σlayer of the continuous layer on the right ofFigure 8 and define
�σ (x, T ) = σislands − σlayer = m ×{
1
nσn(x, T, pO2 )
+(
1
m− 1
n
)σ0(x, T ) − 1
mσm(x, T, pO2 )
}. 42.
All surface energies depend on three environmental parameters, except for σ0,which does not depend on pO2 . However, the dependence of σn/n and σm/m onpO2 cancels out in Equation (42). Therefore, �σ does not depend on pO2 , which weexplicitly indicate in Equation (42). Now it is easy to see that the normal (inverted)regime corresponds to positive (negative) �σ : one just needs to substitute intoEquation (42) the pressure at which σm = σ0. The theory we have just presentedis a discrete version of a phenomenon known in the theory of adsorption, namelythat if the surface energy as a function of coverage is convex, it is favorable for theadsorbate to partition into areas or phases of unequal coverage, and conversely.Our set of inclined lines of surface energy versus pO2 are sampled from a muchlarger set of such lines, from which, in principle, a continuous curve of surfaceenergy versus coverage could be constructed. That this curve would be convex canbe seen by noting just the three lines drawn in the right hand graph of Figure 7.
Of course, there should be some additional penalty owing to the boundariesof the islands. This affects the minimum size of the islands beyond which such aphase separation lowers the surface energy. We conclude that the inverted behavior,which is demonstrated by the calculated surface energies of oxidized NiAl, shouldfavor the oxide initially appearing as isolated islands, and not the layer-by-layer
Ann
u. R
ev. M
ater
. Res
. 200
5.35
:167
-207
. Dow
nloa
ded
from
arj
ourn
als.
annu
alre
view
s.or
gby
CA
MB
RID
GE
UN
IVE
RSI
TY
on
07/2
1/05
. For
per
sona
l use
onl
y.
27 Jun 2005 15:9 AR AR246-MR35-08.tex XMLPublishSM(2004/02/24) P1: KUV
AB INITIO CALCULATIONS 197
growth mode (Figure 8). The layer-by-layer mode would, however, be energeticallyfavored if the supply of point defects from the substrate were suppressed, such asby lowering the temperature.
The above conjectures have some experimental support, although it is probablynot conclusive. Recall here that the fabrication of the oxide layer on NiAl(110) isa two-step process (see above): 1200 L of oxygen is initially deposited at about600 K, which results in a layer of amorphous alumina (α-Al2O3) covering thewhole surface. In a second step, high-temperature annealing leads to the formationof well-ordered crystalline Al2O3 on top of NiAl. During the first step, the brightdiffraction spots caused by the substrate gradually disappear, and no diffractionpattern is observed by the end of the process. No oxide islands are observed at thisstage (80). In the second step, holes revealing clean surface re-appear (80), as theordered crystalline alumina is more compact than α–Al2O3. Hence, another cycleof oxidation is required to fill these holes (81). The formation of the patches ofclean surface is more likely related to the crystallization of the α–Al2O3 than to thegrowth mode, but the driving force would be the same. Direct observation of thegrowth of an ordered alumina film on an otherwise clean NiAl(110) would resolvethis question. Perhaps, the most relevant observation is that of McCarty (80), whoinitially exposed a Ni57Al43 sample to a low dose of oxygen (360 L) at 325◦C,after which low-energy electron microscopy (LEEM) micrographs showed thatthe oxygen adsorbed uniformly. After annealing at 925◦C, most of the substratebecame oxide free, with relatively few oxide islands being formed at terraces andstep edges. (Interestingly, some of these oxide patches were of a type differentfrom those produced by the standard procedure, an observation similar to that inReference (71)). Thus McCarty’s results suggest that the high-temperature, orderedAl2O3 does prefer to form islands rather than to spread itself over the surface, andthat a transition between these two types of behavior should occur somewherebetween 600 K and 1200 K. According to our interpretation, the transition tem-perature is the temperature at which diffusion mass-transport should be sufficientto supply the substrate surface with point defects, which are responsible for theinverted behavior. This complements our earlier observation drawn from Stierle’sresults (71) according to which at 570 K some diffusion in stoichiometric NiAl isalready in operation. Note in passing that oxide islands were also observed at theNiAl(100) surface after incomplete oxidation and subsequent annealing at 1200 K(82).
FUTURE STUDIES
Structural Model of the Al2O3/NiAl(110) Oxide Film
The atomic structure of the interface between the Al2O3 film and the NiAl(110)surface is of major interest. However, even the question as to which of the Al2O3
polymorphs corresponds to the structure of the film is still under debate (see
Ann
u. R
ev. M
ater
. Res
. 200
5.35
:167
-207
. Dow
nloa
ded
from
arj
ourn
als.
annu
alre
view
s.or
gby
CA
MB
RID
GE
UN
IVE
RSI
TY
on
07/2
1/05
. For
per
sona
l use
onl
y.

27 Jun 2005 15:9 AR AR246-MR35-08.tex XMLPublishSM(2004/02/24) P1: KUV
198 FINNIS � LOZOVOI � ALAVI
above). Another issue is the atomic structure of the NiAl substrate, including itspoint defects (71). A number of point defects (oxygen vacancies, for instance)are also suspected in the oxide layer (2). This is exactly the type of problem forwhich ab initio calculations have been helpful. To go beyond the early oxidationcalculations described here, the obstacles are largely technical. The oxide filmis incommensurate with the substrate, hence a large simulation cell is needed.Otherwise, additional constraints imposed by a small periodic supercell can easilychange the structure of alumina and its orientation. Nevertheless, our feeling isthat the power of modern computers has reached a level sufficient to tackle theproblem. Taking the structural model of Jaeger et al. (24) as a guide, about 200–250 atoms of the substrate and 100 atoms of the oxide film would be a reasonablestarting size for the system. We envisage a calculation in which the oxide filmis of either γ - or κ-alumina type, and point defects are introduced into the twoor three surface layers of the NiAl substrate. The bulk composition of Ni1−x Alx
should make its impact indirectly through the Ni and Al chemical potentials, butotherwise it need not be modeled explicitly. Given that even slight deviation fromthe stoichiometry in ordered alloys affects the composition of their surfaces (83,84), one might expect the effect to show up in our case as well. In addition, therehave recently appeared calculations of free surfaces of γ –Al2O3 (85) and κ–Al2O3
(86), thus a more comprehensive investigation of NiAl oxidation, or a similar studyfor other alloys, seems feasible if computationally demanding.
If the atomic structures of the growing oxide film, the substrate, and the interfacebetween them have been established, an even more ambitious project would be asimilar study of the boundaries formed between neighboring domains of the oxidefilm, in which there is much interest at present (67, 87, 88). The observed reflectionand antiphase domain boundaries represent the simplest cases of crystal defects,namely special twin grain boundaries and stacking faults, which are straightforwardto study in isolation but pose much more difficult problems for simulation wherethey meet the metal.
Film Thickness
The reason for the original oxide film on NiAl(110) to be exactly 5 A thick isstill a matter of speculation. It cannot be solely because the film, once formed,covers the whole surface and effectively stops the oxidation, for which two Al–O bilayers are sufficient. Indeed, on NiAl(100), the oxide film is twice as thick.It could be reasoned that there is some competition between the chemical en-ergy gain owing to the film formation and the penalty from the elastic energy,which a strained film maintains to remain coherent with the substrate. Indeed,the lattice constants observed for the oxide film are noticeably larger than thosein the bulk oxide (by 9.5% and 6.7% compared with bulk γ -alumina (24)). Thismight explain the dependence of the film thickness on the substrate orientation(the lattice mismatch for the NiAl(100)/γ –Al2O3 interface is only 3% (25)). A re-finement of the elastic strain argument is the suggestion that the Madelung energy
Ann
u. R
ev. M
ater
. Res
. 200
5.35
:167
-207
. Dow
nloa
ded
from
arj
ourn
als.
annu
alre
view
s.or
gby
CA
MB
RID
GE
UN
IVE
RSI
TY
on
07/2
1/05
. For
per
sona
l use
onl
y.

27 Jun 2005 15:9 AR AR246-MR35-08.tex XMLPublishSM(2004/02/24) P1: KUV
AB INITIO CALCULATIONS 199
in thin two-dimensional films favors larger lattice constants. Thus the thickeningof the film leads to an increase in the effective strain. The verification of such ap-parently reasonable arguments requires ab initio calculations, as the charges on theatoms at surfaces and interfaces do not correspond to their nominal ionic charges(89).
Stability of the Oxide Film
Another intriguing observation is the disappearance of the oxide film at about1300 K. Is it because of enhanced diffusion, with the film growing so thick thatit becomes too expensive to maintain the registry with the substrate, and thuspieces of the film spall? Such an effect is indeed observed during cyclic oxidationexperiments. It is usually exploited to prepare a clean NiAl surface, free fromimpurities (a NiAl sample is heated up to 1500 K and than cooled). However, thealumina film was actually observed to gradually disappear, starting from the stepedges, which hints at some sort of thermodynamic instability of the film rather thanat any mechanical event (80). This is indeed puzzling because the calculations donot show any signs of the film instability at reported experimental temperature andoxygen partial pressure if static equilibrium is assumed. Resolving this paradoxremains a challenge for both theoreticians and experimentalists working on thethermodynamics and kinetics of oxidation. Note in passing that the decompositionof the oxide film at sufficiently high temperature seems to be a rather general effect:It occurs at 1500 K for the Al2O3 film on NiAl(100) (90), whereas the Ga2O3 filmformed on CoGa decomposes at 770 K on the (110) surface (91) and at 850 K onthe (100) surface (73).
Free Energy of the Oxidized Surfaces
A significant step forward for simulations of the oxidation process would be a moreexplicit treatment of the finite temperature effects. Nevertheless, as mentionedabove, both the effect of the vibration of substrate atoms and the configurationaldisorder of bulk point defects would likely be cancelled (to a large extent) if theequivalent amount of bulk material in the expression for the surface energy weresubtracted (Equation 4). That is, the remaining effects should be small comparedwith the gas phase contribution to the free energy. Indeed, according to simple es-timations Reference (33) for the RuO2 (110) surface, the vibrational contributionto the surface energy should not exceed 10 meV/A2 at temperatures up to 1000 K.Our own surface energy calculations using the quasi-harmonic approximation forAl2O3(0001) indicated a contribution rising to about 10% at 2000 K. Any moredetailed study of this important issue is still lacking to our knowledge. We doexpect a somewhat larger contribution in less ordered surface structures due toconfigurational entropy of adsorbed species at relatively low coverages, and ow-ing to the vibration of loosely arranged surface atoms at higher coverages. For thelatter, standard harmonic approaches may not be adequate, as the potential energy
Ann
u. R
ev. M
ater
. Res
. 200
5.35
:167
-207
. Dow
nloa
ded
from
arj
ourn
als.
annu
alre
view
s.or
gby
CA
MB
RID
GE
UN
IVE
RSI
TY
on
07/2
1/05
. For
per
sona
l use
onl
y.

27 Jun 2005 15:9 AR AR246-MR35-08.tex XMLPublishSM(2004/02/24) P1: KUV
200 FINNIS � LOZOVOI � ALAVI
surface of such configurations is rich in local minima separated by low barriers.For instance, even during the relatively short MD runs reported here, the A3 con-figuration kept jumping between two closely spaced minima (53). For situationslike this, the harmonic approximation fails and ab initio MD simulations (92) incombination with thermodynamic integration could be considered instead. Evenif simply the entropy S0 at some reference temperature T 0 could be reasonablyestimated in such calculations, a substantial improvement of the estimated Gibbsfree energy is expected by adding the linear (T −T 0)S0 term. More generally, sys-tematic studies of the magnitude and relative importance of various contributionsto the free energy of an oxidizing substrate up to the coverage of a few monolayerswould not only improve the accuracy of estimates of the relative stability of com-peting surface structures, but, more importantly, would provide general guidancefor either neglecting or including particular contributions to the Gibbs free energyof oxidized surfaces.
Other Systems to Study
A large number of first-principles investigations of the oxidation of metallic sur-faces have appeared in the past several years, confirming that this important topicis now within the reach of modern ab initio techniques. However, apart from thecited studies of the NiAl(110) surfaces (40, 53), these studies have been restrictedto the oxidation of elemental crystals. As we have seen for NiAl, oxidation ofmulticomponent systems is a much more complex issue, the main principles ofwhich we are just beginning to understand. It is also a rather common situationin practice. Any attempt to look at other systems would therefore be of interest,to see which of the discussed features are common, and which are peculiar to theoxidation of NiAl(110).
An immediate example would be the oxidation of the other low-index surfacesof NiAl, (100) and (111). Both surfaces can be either Ni- or Al-terminated, unlikethe (110) surface, which contains half Al and half Ni sites. Hence, the compo-sition of the bulk alloy (either Ni-rich, or Al-rich) may be even more importantfor such non-stoichiometric faces. A peculiar property of the oxidized NiAl(100)surface is that the structure of the thin Al2O3 film formed is highly sensitive totemperature. It is twice as thick as the (110) surface and proceeds through sev-eral allotropic modifications with temperature before disappearing at 1500 K (90).NiAl(111) upon oxidation at 1100−1200 K forms (110) facets. The oxide film isfound to be located on the (110) surfaces of these facets, whereas (111) terracesremain oxide free. Upon further annealing at higher temperatures (1500 K), the(111) surface becomes flat again (67). The ab initio approach may throw light onthe mechanism behind this delicate interplay of surface energies. CoAl, FeAl, andCoGa are among other high-temperature-ordered intermetallic compounds thatexhibit selective oxidation and have been extensively studied experimentally (see67, 72 and references therein). It would be interesting to see whether the surfaceenergies in these compounds depend on oxygen coverage in the same inverted way
Ann
u. R
ev. M
ater
. Res
. 200
5.35
:167
-207
. Dow
nloa
ded
from
arj
ourn
als.
annu
alre
view
s.or
gby
CA
MB
RID
GE
UN
IVE
RSI
TY
on
07/2
1/05
. For
per
sona
l use
onl
y.

27 Jun 2005 15:9 AR AR246-MR35-08.tex XMLPublishSM(2004/02/24) P1: KUV
AB INITIO CALCULATIONS 201
as they do for NiAl(110), and whether the transition from layer-by-layer to islandgrowth occurs if point defects are allowed to arrive from the substrate. Charac-teristic temperatures used for initial oxygen deposition and subsequent annealingsteps vary quite significantly from one system to another, which might be helpfulin decoupling the bulk diffusion and film-ordering events.
A valuable next step toward the theory of the oxidation of ordered multicompo-nent crystals would be a study of binary systems in which both components formoxides at comparable rates. TiAl might be an interesting and rather rich system forsuch an investigation. Upon oxidation, Al2O3 and various Ti oxides are formeddepending on the oxidation conditions and the composition of the substrate (see,e.g., 93).
CONCLUSIONS
Oxidation of NiAl is a complex process, characterized by the strong interaction ofoxygen with Al and the highly ordered nature of the alloy with its characteristicpoint defect structure. We have described a theoretical framework within whichthe surface energy of an ordered, but not necessarily stoichiometric, compound canbe calculated as a function of external variables defining the state of the system(environmental parameters). The parameters are the temperature, composition ofthe substrate, and partial pressure of oxygen, with an emphasis in particular onhow the surface energy dependence on the environmental parameters can be wellapproximated with simple analytical expressions.
Oxidation of NiAl proceeds through the arrival and re-arrangement of pointdefects in the substrate, the ultimate goal of which is to expose Al atoms to oxygenat the oxide-substrate interface and to transport Ni atoms away from it. This is doneby exchanging Ni and Al atoms between the surface and subsurface layers and byabsorbing Ni vacancies from the bulk. Thus vacancy injection into the substrateis unlikely to occur during the initial stages of the oxidation. On the contrary, thevacancies must be consumed at the oxide-substrate interface. Vacancy injection,however, might be possible at a later stage, after a mature oxide film has beenformed through which Al atoms diffuse out to form more oxide. Our oxidationscenario is thus an extended version of the one suggested by Jaeger et al. (24),namely, the initial 5 A-thick oxide film replaces the two outermost layers of theNiAl(110), whereas Ni atoms dissolve in the bulk and are partially replaced byAl; the latter together with the Al atoms from the two surface layers combine withoxygen to form the Al2O3 film.
The 5 A-thick oxide film is not in thermodynamic equilibrium under mostexperimental conditions but rather is a transient state in which the system is heldby energy barriers. It seems that thermodynamic barriers must be overcome duringfilm formation, in addition to the energy barriers, in order for mass transport toproceed. These thermodynamic barriers are expected to be larger for Ni-rich thanfor Al-rich NiAl.
Ann
u. R
ev. M
ater
. Res
. 200
5.35
:167
-207
. Dow
nloa
ded
from
arj
ourn
als.
annu
alre
view
s.or
gby
CA
MB
RID
GE
UN
IVE
RSI
TY
on
07/2
1/05
. For
per
sona
l use
onl
y.

27 Jun 2005 15:9 AR AR246-MR35-08.tex XMLPublishSM(2004/02/24) P1: KUV
202 FINNIS � LOZOVOI � ALAVI
Some such thermodynamic barriers are a consequence of the inverted depen-dence of the surface energy σ on coverage: Under conditions where the surfacewith a particular coverage becomes stable, a surface with a higher coverage hasan even lower energy. The opposite, normal type of behavior, is characterizedby a monotonic increase in the adsorbed oxygen with pO2 . We showed that be-cause of the linear dependence of σ on log pO2 (the ideal gas assumption), theinverted behavior of surface energies means the convexity of the dependence ofsurface energy on oxygen coverage. This implies that the differential binding en-ergy of oxygen increases with coverage. The reason lies in the strong interactionbetween oxygen and aluminum atoms: Increasing, locally, the concentration ofoxygen atoms enables them to create a more favorable local environment of alu-minum. This, in turn, favors the oxide film growing as separate islands ratherthan as a uniform layer. Our calculations reveal an interesting link between thedependence of σ on coverage and the point defect mechanism of oxidation. Aninverted behavior is observed as long as point defects are allowed in the im-mediate substrate. If, on the contrary, the immediate substrate is forced to stayperfect, then the surface energies depend on the coverage in a normal way. Inother words, constraining the substrate to remain defect-free is sufficient to reducedramatically the cooperative effect between the oxygen atoms. Whether this is atypical for selective oxidation in ordered compounds or peculiar to NiAl is notyet clear. We look forward to calculations on other systems that could clarify thispoint.
This picture of NiAl oxidation rationalizes a large body of experimental data.For instance, we now understand how the study of lattice point defects in the topsubstrate layers, on the one hand, and monitoring the oxide growth on the otherhand, are looking at two sides of the same coin, namely, whether particular ex-perimental conditions are sufficient to activate mass transport, mediated by pointdefects, in the bulk NiAl. This idea can be used to clarify why the establishedprocedure to grow a thin alumina film with a well-controlled thickness is such as itis. Because no oxide islands were observed during the initial oxygen deposition at600 K (80), we conclude that at this temperature the point defect mobility is too lowto invert the dependence of surface energy on coverage, which would induce theisland growth mode. This means that the type and number of point defects createdat and near the substrate surface are not thermodynamically optimal. Subsequenthigh-temperature annealing, provided that it is long enough and/or the temperatureis sufficiently high, removes this constraint. The difference in the annealing tem-perature might thus explain the apparent discrepancy between the similar studies(71) and (79) regarding the presence of lattice defects in the top substrate layer.The normal behavior of the surface energies is what is needed at the initial depo-sition stage to produce a uniform layer of adsorbed oxygen atoms that will laterbe converted into an ordered film. Therefore, raising the temperature at this stageis undesirable because further enhancement of the point defect mobility may in-duce the island growth mode. Decreasing the deposition temperature, on the otherhand, would be unfavorable for a different reason. We recall here the experiment of
Ann
u. R
ev. M
ater
. Res
. 200
5.35
:167
-207
. Dow
nloa
ded
from
arj
ourn
als.
annu
alre
view
s.or
gby
CA
MB
RID
GE
UN
IVE
RSI
TY
on
07/2
1/05
. For
per
sona
l use
onl
y.

27 Jun 2005 15:9 AR AR246-MR35-08.tex XMLPublishSM(2004/02/24) P1: KUV
AB INITIO CALCULATIONS 203
Isern & Castro (94), showing that during room temperature oxidation, the oxygenuptake saturates after 90 L exposure. If this is insufficient to build a 5 A aluminafilm during the annealing stage, we can understand why low-temperature oxygendeposition results in a different oxide structure (71) and why the reduced doseof oxygen at 600 K leads to similar consequences (80). The reason for this earlysaturation of oxygen coverage may be that even the near-surface exchanges of Niand Al necessary for further uptake of oxygen are too slow at room temperature.The existence of an optimal temperature with respect to the quality of the oxidefilm has been confirmed in experimental work by Lay et al. (70).
We are far from pretending to having reached an exhaustive description ofthe mechanism of the initial oxidation of NiAl. Surely, many points can also beelucidated by future experimental studies. However, we believe that the NiAl casestudy is a good illustration of how ab initio calculations, despite their limitations,can provide useful insight even into such a complex issue as the selective oxidationof ordered compounds.
The Annual Review of Materials Research is online athttp://matsci.annualreviews.org
LITERATURE CITED
1. Miracle DB. 1993. The physical and me-chanical properties of NiAl. Acta Metall.Mater. 41:649–84
2. Baumer M, Freund H-J. 1999. Metal de-posits on well-ordered oxide films. Prog.Surf. Sci. 61:127–98
3. Voter AF, Montalenti F, Germann TC.2002. Extending the time scale in atomisticsimulation of materials. Annu. Rev. Mater.Res. 32:321–46
4. Ciacchi LC, Payne MC. 2004. “Hot-Atom”O2 dissociation and oxide nucleation onAl(111). Phys. Rev. Lett. 92:176104
5. Stampfl C, Scheffler M. 1996. Theoreticalstudy of O adlayers on Ru(0001). Phys.Rev. B 54:2868–72
6. Reuter K, Ganduglia-Pirovano MV,Stampfl C, Scheffler M. 2002. Metastableprecursors during the oxidation of theRu(0001) surface. Phys. Rev. B 65:165403
7. Ganduglia-Pirovano MV, Scheffler M.1999. Structural and electronic propertiesof chemisorbed oxygen on Rh(111). Phys.Rev. B 59:15533–43
8. Bocquet M-L, Michaelides A, Sautet P,
King DA. 2003. Initial stages in the ox-idation and reduction of the 4 × 4 sur-face oxide phase on Ag{111}: A combineddensity-functional theory and STM simula-tion study. Phys. Rev. B 68:075413
9. Li W-X, Stampf C, Scheffler M. 2003. Sub-surface oxygen and surface oxide forma-tion at Ag(111): A density-functional the-ory investigation. Phys. Rev. B 67:045408
10. Li W-X, Stampf C, Scheffler M. 2003. In-sights into the function of silver as an ox-idation catalyst by ab initio atomistic ther-modynamics. Phys. Rev. B 68:165412
11. Gustafson J, Mikkelsen A, Borg M, Lund-gren E, Kohler L, et al. 2004. Self-LimitedGrowth of a Thin Oxide Layer on Rh(111).Phys. Rev. Lett. 92:126102
12. Li WX, Osterlund L, Vestergaard EK, VangRT, Matthiesen J, et al. 2004. Oxidation ofPt(110). Phys. Rev. Lett. 93:146104
13. Lundgren E, Kresse G, Klein C, Borg M,Andersen JN, et al. 2002. Two-dimen-sional oxide on Pd(111). Phys. Rev. Lett.88:246103
14. Lundgren E, Gustafson J, Mikkelsen A,
Ann
u. R
ev. M
ater
. Res
. 200
5.35
:167
-207
. Dow
nloa
ded
from
arj
ourn
als.
annu
alre
view
s.or
gby
CA
MB
RID
GE
UN
IVE
RSI
TY
on
07/2
1/05
. For
per
sona
l use
onl
y.

27 Jun 2005 15:9 AR AR246-MR35-08.tex XMLPublishSM(2004/02/24) P1: KUV
204 FINNIS � LOZOVOI � ALAVI
Andersen JN, Stierle A, et al. 2004. Ki-netic hindrance during the initial oxidationof Pd(100) at ambient pressures. Phys. Rev.Lett. 92:046101
15. Todorova M, Li WX, Ganduglia-PirovanoMV, Stampfl C, Reuter K, Scheffler M.2002. Role of subsurface oxygen in ox-ide formation at transition metal surfaces.Phys. Rev. Lett. 89:096103
16. Schroder E, Fasel R, Kiejna A. 2004. Oadsorption and incipient oxidation of theMg(0001) surface. Phys. Rev. B 69:115431
17. Schroder E, Fasel R, Kiejna A. 2004.Mg(0001) surface oxidation: a two-dimensional oxide phase. Phys. Rev. B 69:193405
18. Kiejna A, Lundqvist BI. 2001. First-principles study of surface and subsur-face O structures at Al(111). Phys. Rev. B63:085405
19. Kiejna A. 2003. Vacancy formation and Oadsorption at the Al(111) surface. Phys.Rev. B 68:235405
20. Tang H, van der Ven A, Trout BL. 2004.Phase diagram of oxygen adsorbed on plat-inum(111) by first-principles investigation.Phys. Rev. B 70:045420
21. Bongiorno A, Pasquarello A. 2004. Reac-tion of the oxygen molecule at the Si(100)-SiO2 interface during silicon oxidation.Phys. Rev. Lett. 93:086102
22. Nash P, Kleppa O. 2001. Compositiondependence of the enthalpies of forma-tion of NiAl. J. Alloys Comp. 321:228–31
23. Lide DR, ed. 1995. CRC Handbook ofChemistry and Physics. Boca Raton, FL:CRC Press. 75th ed.
24. Jaeger RM, Kuhlenbeck H, Freund H-J,Wuttig M, Hoffmann W, et al. 1991. For-mation of a well-ordered aluminium oxideoverlayer by oxidation of NiAl(110). Surf.Sci. 259:235–52
25. Yang JC, Schumann E, Mullejans H, RuhleM. 1996. Chemistry and bonding investiga-tions of NiAl/γ -Al2O3 interfaces. J. Phys.D 29:1716–24
26. Reuter K, Scheffler M. 2003. First-
principles atomistic thermodynamics foroxidation catalysis: surface phase diagramsand catalytically interesting regions. Phys.Rev. Lett. 90:046103
27. Zhang W, Smith JR, Wang X-G. 2004.Thermodynamics from ab initio computa-tions. Phys. Rev. B 70:024103
28. Bergermayer W, Schweiger H, Wimmer E.2004. Ab initio thermodynamics of oxidesurfaces: O2 on Fe2O3(0001). Phys. Rev. B69(19):195409
29. Rogal J, Reuter K, Scheffler M. 2004. Ther-modynamic stability of PdO surfaces. Phys.Rev. B 69:075421
30. Wang X-G, Smith JR. 2003. Surface phasediagram for Cr2O3(0001): ab initio densityfunctional study. Phys. Rev. B 68:201402
31. Ganduglia-Pirovano MV, Sauer J. 2004.Stability of reduced V2O5(001) surfaces.Phys. Rev. B 70:045422
32. Meyer B. 2004. First-principles study of thepolar O-terminated ZnO surface in thermo-dynamic equilibrium with oxygen and hy-drogen. Phys. Rev. B 69:045416
33. Reuter K, Scheffler M. 2002. Composition,structure, and stability of RuO2(110) as afunction of oxygen pressure. Phys. Rev. B65:035406
34. Batyrev IG, Alavi A, Finnis MW. 2000.Equilibrium and adhesion of Nb/sapphire:the effect of oxygen partial pressure. Phys.Rev. B 62:4698–706
35. Wang X-G, Chaka A, Scheffler M.2000. Effect of the environment on α-Al2O3(0001) surface structures. Phys. Rev.Lett. 84:3650–53
36. Lodziana Z, Nørskov JK, Stoltze P. 2003.The stability of the hydroxylated (0001)surface of α-Al2O3. J. Chem. Phys. 118:11179–88
37. Wang X-G, Smith JR. 2004. Hydrogen andcarbon effects on Al2O3 surface phases andmetal deposition. Phys. Rev. B 70:081401
38. Marmier A, Parker SC. 2004. Ab initiomorphology and surface thermodynamicsof α-Al2O3. Phys. Rev. B 69:115409
39. Cahn JW. 1978. Thermodynamics ofsolid and fluid surfaces. In Interfacial
Ann
u. R
ev. M
ater
. Res
. 200
5.35
:167
-207
. Dow
nloa
ded
from
arj
ourn
als.
annu
alre
view
s.or
gby
CA
MB
RID
GE
UN
IVE
RSI
TY
on
07/2
1/05
. For
per
sona
l use
onl
y.

27 Jun 2005 15:9 AR AR246-MR35-08.tex XMLPublishSM(2004/02/24) P1: KUV
AB INITIO CALCULATIONS 205
Segregation, ed. WC Johnson, JM Blakely,pp. 3–23. Ohio: ASM
40. Lozovoi AY, Alavi A, Finnis MW. 2000.Surface stoichiometry and the initial oxida-tion of NiAl(110). Phys. Rev. Lett. 85:610–13
41. Johnston K, Castell MR, Paxton AT, Fin-nis MW. 2004. SrTiO3(001) (2 × 1) re-constructions: first-principles calculationsof surface energy and atomic structure com-pared with scanning tunneling microscopyimages. Phys. Rev. B 70:085415
42. Finnis MW. 1998. Accessing the excess:an atomistic approach to excesses at planardefects and dislocations in ordered com-pounds. Phys. Stat. Solidi 166:397–416
43. Xie J, de Gironcoli S, Baroni S, Schef-fler M. 1999. Temperature-dependent sur-face relaxations of Ag(111). Phys. Rev. B59:970–74
44. Marzari N, Vanderbilt D, de Vita A, PayneMC. 1999. Thermal contraction and disor-dering of the Al(110) Surface. Phys. Rev.Lett. 82:3296–99
45. Lazzeri M, de Gironcoli S. 2002. First-principles study of the thermal expansionof Be(1010). Phys. Rev. B 65:245402
46. Wagner C, Schottky W. 1930. Theorie dergeordneten Mischphasen. Z. Phys. Chem.B 11:163–210
47. Hagen M, Finnis MW. 1998. Point defectsand chemical potentials in ordered alloys.Philos. Mag. A 77:447–64
48. Meyer B, Fahnle M. 1999. Atomic defectsin the ordered compound B2-NiAl: a com-bination of ab initio electron theory and sta-tistical mechanics. Phys. Rev. B 59:6072–82
49. Korzhavyi PA, Ruban AV, Lozovoi AY,Vekilov YuKh, Abrikosov IA, Johansson B.2000. Constitutional and thermal point de-fects in B2 NiAl. Phys. Rev. B 61:6003–18
50. Mishin Y, Herzig C. 2000. Diffusion in theTi-Al system. Acta Mater. 48:589–623
51. Qian G, Martin RM, Chadi DJ. 1988. Sto-ichiometry and surface reconstruction: anab initio study of GaAs(100) surfaces.Phys. Rev. Lett. 60:1962–65
52. Zhang SB, Northrup JE. 1991. Chemicalpotential dependence of defect formationenergies in GaAs: application to Ga self-diffusion. Phys. Rev. Lett. 67:2339–42
53. Lozovoi AY, Alavi A, Finnis MW. 2001.Surface energy and the early stages of oxi-dation of NiAl(110). Comput. Phys. Com-mun. 137:174–94
54. Linstrom PJ, Mallard WG, eds. 2003. NISTChemistry Web Book, NIST Standard Ref-erence Database Number 69. Gaithersburg,MD: Natl. Inst. Standard. Technol., http://webbook.nist.gov
55. Cox JD, Wagman DD, Medvedev VA.1989. CODATA Key Values for Thermody-namics. New York: Hemisphere
56. JANAF Thermochemical Tables. 1974.Suppl. 1974. J. Phys. Chem. Ref. Data 3
57. JANAF Thermochemical Tables. 1975.Suppl. 1975. J. Phys. Chem. Ref. Data 4
58. Bradley AJ, Taylor A. 1937. An X-ray anal-ysis of the nickel-aluminium system. Proc.R. Soc. London Ser. A 159:56–72
59. Fu CL, Ye Y-Y, Yoo MH, Ho KM. 1993.Equilibrium point defects in intermetallicswith the B2 structure: NiAl and FeAl. Phys.Rev. B 48:6712–15
60. Alavi A, Lozovoi AY, Finnis MW. 1999.Pressure-induced isostructural phase tran-sition in Al-rich NiAl alloys. Phys. Rev.Lett. 83:979–82
61. Desai PD. 1987. Thermodynamic proper-ties of selected binary aluminum alloy sys-tems. J. Phys. Chem. Ref. Data 16:109–24
62. In calculating the ab initio curves for pn
and ps shown in Figure 3, we have em-ployed an additional thermodynamic cyclethat allowed us to circumvent explicit cal-culations of Ni(fcc) and NiO crystals (seeReference 53 for details).
63. Brandes EA, Brook GB, eds. 1992.Smithells Metals Reference Book. Oxford,UK: Butterworth-Heinemann. 7th ed.
64. Ustundag E, Clausen B, Bourke MAM.2000. Neutron diffraction study of thereduction of NiAl2O4. Appl. Phys. Lett.76:694–96
Ann
u. R
ev. M
ater
. Res
. 200
5.35
:167
-207
. Dow
nloa
ded
from
arj
ourn
als.
annu
alre
view
s.or
gby
CA
MB
RID
GE
UN
IVE
RSI
TY
on
07/2
1/05
. For
per
sona
l use
onl
y.

27 Jun 2005 15:9 AR AR246-MR35-08.tex XMLPublishSM(2004/02/24) P1: KUV
206 FINNIS � LOZOVOI � ALAVI
65. Elrefaie FA, Smeltzer WW. 1981. Ther-modynamics of nickel-aluminum-oxygensystem between 900 and 1400 K. J. Elec-trochem. Soc. 128:2237–42
66. Doychak J, Smialek JL, Mitchell TE. 1989.Transient oxidation of single-crystal β–NiAl. Metall. Trans. A 253:499–518
67. Franchy R. 2000. Growth of thin, crys-talline oxide, nitride and oxynitride filmson metal and metal alloy surfaces. Surf. Sci.Rep. 38:195–294
68. Stierle A, Renner F, Streitel R, Dosch H,Drube W, Cowie BC. 2004. X-ray diffrac-tion study of the ultrathin Al2O3 layer onNiAl(110). Science 303:1652–56
69. Yoshitake M, Mebarki B, Lay TT. 2002.Crystallinity and thickness control ofwell-ordered ultra-thin Al2O3 film onNiAl(110). Surf. Sci. 511:L313–18
70. Lay TT, Yoshitake M, Mebarki B. 2002.Temperature effect on growth of well-ordered thin Al2O3 film on NiAl(110). J.Vac. Sci. Technol. A 20:2027–31
71. Stierle A, Renner F, Streitel R, Dosch H.2001. Observation of bulk forbidden de-fects during the oxidation of NiAl(110).Phys. Rev. B 64:165413
72. Rose V, Podgursky V, Costina I, FranchyR. 2003. Growth of ultra-thin amorphousAl2O3 films on CoAl(100). Surf. Sci. 541:128–36
73. Pan FM, Pflitsch C, David R, Verheij LK,Franchy R. 2001. Formation of an orderedoxide on the CoGa(100) surface by roomtemperature oxidation and annealing. Surf.Sci. 479:191–200
74. Frazer HL, Loretto MH, Smallman RE,Wasilewski RJ. 1973. Oxidation-induceddefects in NiAl. Philos. Mag. 28:639–50
75. Eibner JE, Engell H-J, Schultz H, JakobiH, Schlatte G. 1975. Annealing of pointdefects in quenched NiAl. Philos. Mag.31:739–42
76. Parthasarathi A, Frazer HL. 1984. The an-nealing of vacancy defects in β–NiAl. II.The role of surface oxidation in vacancyloop growth in slowly cooled crystals. Phi-los. Mag. A 50:101–15
77. Some results presented in Reference 40were misinterpreted in Reference 71, sug-gesting that there is a discrepancy betweenthe results of these studies. The authors ofthe latter paper took the composition of thetop layer in configuration E3 as a predictionfor the defect structure of the first substratelayer. However in Reference 40, the layerin question was treated as part of the oxidefilm, not the substrate. Also, in Reference40, the defect concentration was not opti-mized in any layer, as the supercell is fartoo small for that. Thus there is actually nodiscrepancy between the results of the twostudies.
78. McCarty KF, Nobel JA, Bartelt NC. 2001.Vacancies in solids and the stability of sur-face morphology. Nature 412:622–25
79. Torrelles X, Wendler F, Bikondoa O, Is-ern H, Moritz W, Castro GR. 2001. Struc-ture of the clean NiAl(110) surface andthe Al2O3/NiAl(110) interface by measure-ments of crystal truncation rods. Surf. Sci.487:97–106
80. McCarty KF. 2001. Imaging the crystal-lization and growth of oxide domains on theNiAl(110) surface. Surf. Sci. 474:L165–72
81. Ceballos G, Song Z, Pascual JI, Rust H-P,Conrad H. 2002. Structure investigation ofthe topmost layer of a thin ordered aluminafilm grown on NiAl(110) by low tempera-ture scanning tunneling microscopy. Chem.Phys. Lett. 359:41–47
82. Blum R-P, Ahlbehrendt D, Niehus H. 1998.Growth of Al2O3 stripes in NiAl(001). Surf.Sci. 396:176–88
83. Ruban AV. 2002. Surface composition ofordered alloys: An off-stoichiometric ef-fect. Phys. Rev. B 65:174201
84. Blum V, Hammer L, Schmidt C, Meier W,Wieckhorst O, et al. 2002. Segregation instrongly ordering compounds: a key roleof constitutional defects. Phys. Rev. Lett.89:266102
85. Pinto HP, Nieminen RM, Elliott SD. 2004.Ab initio study of γ -Al2O3 surfaces. Phys.Rev. B 70:125402
86. Ruberto C, Yourdshahyan Y, Lundqvist BI.
Ann
u. R
ev. M
ater
. Res
. 200
5.35
:167
-207
. Dow
nloa
ded
from
arj
ourn
als.
annu
alre
view
s.or
gby
CA
MB
RID
GE
UN
IVE
RSI
TY
on
07/2
1/05
. For
per
sona
l use
onl
y.
27 Jun 2005 15:9 AR AR246-MR35-08.tex XMLPublishSM(2004/02/24) P1: KUV
AB INITIO CALCULATIONS 207
2003. Surface properties of metastable alu-mina: a comparative study of κ- and α-Al2O3. Phys. Rev. B 67:195412
87. Kulawik M, Nilius N, Rust H-P, FreundH-J. 2003. Atomic structure of antiphasedomain boundaries of a thin Al2O3 film onNiAl(110). Phys. Rev. Lett. 91:256101
88. Nilius N, Kulawik M, Rust H-P, FreundH-J. 2004. Defect-induced gap states inAl2O3 thin films on NiAl(110). Phys. Rev.B 69:121401
89. Finnis MW. 1999. Why is InSb(111) recon-structed? CCP3 Newslett. 24:2–11. http://www.Ccp3.Ac.uk/newsletters.Shtml
90. Gassmann P, Franchy R, Ibach H. 1994. In-vestigation on phase transitions within thinAl2O3 layers on NiAl(001)—HREELS on
aluminium oxide films. Surf. Sci. 319:95–109
91. Marz A, Franchy R. 2000. Oxidation ofCoGa(110). Surf. Sci. 466:54–65
92. Walker BG, Molteni C, Marzari N. 2004.Ab initio molecular dynamics of metal sur-faces. J. Phys. Condens. Matter 16:S2575–96
93. Schmiedgen M, Graat PCJ, Baretzky B,Mittemeijer EJ. 2002. The initial stagesof oxidation of γ -TiAl: an X-ray photo-electron study. Thin Solid Films 415:114–22
94. Isern H, Castro GR. 1989. The initial inter-action of oxygen with a NiAl(110) singlecrystal: a LEED and AES study. Surf. Sci.211/212:865–71
Ann
u. R
ev. M
ater
. Res
. 200
5.35
:167
-207
. Dow
nloa
ded
from
arj
ourn
als.
annu
alre
view
s.or
gby
CA
MB
RID
GE
UN
IVE
RSI
TY
on
07/2
1/05
. For
per
sona
l use
onl
y.

AB INITIO CALCULATIONS C-1
Figure 4 The optimized atomic structure of the most characteristic configurationscorresponding to 0.75 ML oxygen coverage. Oxygen atoms are shown in red, Alatoms in cyan, and Ni atoms in green. Configuration A3 corresponds to the perfectNiAl(110) substrate, configuration C3 contains a Ni vacancy in the top layer, VNi
(1),configuration G3 contains the exchange defect, NiAl
(2) � AlNi(1), and configuration
E3 contains both defects (see Table 2 for the notation). At a fixed O coverage of0.75 ML, the oxidation begins with A3 and proceeds to E3 through C3 and/or G3.
HI-RES-MR35-08-Finnis.qxd 6/16/05 10:08 AM Page 1
Ann
u. R
ev. M
ater
. Res
. 200
5.35
:167
-207
. Dow
nloa
ded
from
arj
ourn
als.
annu
alre
view
s.or
gby
CA
MB
RID
GE
UN
IVE
RSI
TY
on
07/2
1/05
. For
per
sona
l use
onl
y.

C-2 FINNIS ■ LOZOVOI ■ ALAVI
Figure 5 Pathways for point defect-mediated optimization of the structure of the surfaceoxide at NiAl(110) at fixed oxygen coverage of 1 ML starting from the defect-free sub-strate, configuration A3, and finishing in configuration E3 containing a Ni vacancy in thetop layer, VNi
(1), and the exchange defect, NiAl(2) + AlNi
(1). Configurations are labeled asin Table 2. The energy changes at each single-step event are given in eV. The differencebetween the Ni-rich and Al-rich systems enters through the chemical potential of the com-ponents, Equations (22)–(25), taken at zero Kelvin.
HI-RES-MR35-08-Finnis.qxd 6/16/05 10:08 AM Page 2
Ann
u. R
ev. M
ater
. Res
. 200
5.35
:167
-207
. Dow
nloa
ded
from
arj
ourn
als.
annu
alre
view
s.or
gby
CA
MB
RID
GE
UN
IVE
RSI
TY
on
07/2
1/05
. For
per
sona
l use
onl
y.

AB INITIO CALCULATIONS C-3
Figure 6 Surface energy �, Equation (26), of configurations A (red lines), C (greenlines), E (light blue lines), and H (dark blue lines) as a function of the oxygen par-tial pressure pO2
at T � 1273 K: (a) assuming the bulk composition of the substrateNi0.55Al0.45; (b, overleaf) assuming the bulk composition of the substrate Ni0.45Al0.55. The thin vertical dotted line indicates the stability limit of bulk �–Al2O3 incontact with NiAl, Equation (31). Horizontal lines correspond to the �OAs � 0 fam-ily; lines corresponding to �OAs � 1, 3, and 6 are marked with the respective num-bers; to convert to oxygen coverage in monolayers, these should be divided by 3.Oxidation regions: I (clean surface), II (oxidation with additional barriers), and III(down-hill oxidation) are indicated above the plot.
HI-RES-MR35-08-Finnis.qxd 6/16/05 10:08 AM Page 3
Ann
u. R
ev. M
ater
. Res
. 200
5.35
:167
-207
. Dow
nloa
ded
from
arj
ourn
als.
annu
alre
view
s.or
gby
CA
MB
RID
GE
UN
IVE
RSI
TY
on
07/2
1/05
. For
per
sona
l use
onl
y.

C-4 FINNIS ■ LOZOVOI ■ ALAVI
Figure 6 (Continued )
HI-RES-MR35-08-Finnis.qxd 6/16/05 10:09 AM Page 4
Ann
u. R
ev. M
ater
. Res
. 200
5.35
:167
-207
. Dow
nloa
ded
from
arj
ourn
als.
annu
alre
view
s.or
gby
CA
MB
RID
GE
UN
IVE
RSI
TY
on
07/2
1/05
. For
per
sona
l use
onl
y.

P1: JRX
June 6, 2005 18:18 Annual Reviews AR246-FM
Annual Review of Materials ResearchVolume 35, 2005
CONTENTS
MATERIALS DESIGN AND CHEMISTRY OF ENVIRONMENTALLY
ACCEPTABLE CATALYSTS
THE PREPARATION AND CHARACTERIZATION OF HIGHLY EFFICIENT
TITANIUM OXIDE–BASED PHOTOFUNCTIONAL MATERIALS,Masakazu Anpo, Satoru Dohshi, Masaaki Kitano, Yun Hu,Masato Takeuchi, and Masaya Matsuoka 1
APPLICATION OF EXAFS TO MOLTEN SALTS AND IONIC LIQUID
TECHNOLOGY, Christopher Hardacre 29
THE PREPARATION OF SKELETAL CATALYSTS, A.J. Smith and D.L. Trimm 127
HETEROGENEOUS ASYMMETRIC CATALYSTS: STRATEGIES FOR ACHIEVING
HIGH ENANTIOSELECTION, Graham J. Hutchings 143
ENGINEERED POROUS CATALYTIC MATERIALS, Ferdi Schuth 209
DESIGNING CATALYSTS FOR CLEAN TECHNOLOGY, GREEN CHEMISTRY,AND SUSTAINABLE DEVELOPMENT, John Meurig Thomasand Robert Raja 315
POROUS ALUMINOPHOSPHATES: FROM MOLECULAR SIEVES TO DESIGNED
ACID CATALYSTS, H.O. Pastore, S. Coluccia, and L. Marchese 351
CHEMICAL DESIGN AND IN SITU CHARACTERIZATION OF ACTIVE
SURFACES FOR SELECTIVE CATALYSIS, Mizuki Tadaand Yasuhiro Iwasawa 397
METAL CATALYST DESIGN AND PREPARATION IN CONTROL OF
DEACTIVATION, Michael S. Spencer and Martyn V. Twigg 427
ELECTRON MICROSCOPY IN THE CATALYSIS OF ALKANE OXIDATION,ENVIRONMENTAL CONTROL, AND ALTERNATIVE ENERGY SOURCES,Pratibha L. Gai and Jose J. Calvino 465
CURRENT INTEREST
THE DIFFUSION-MULTIPLE APPROACH TO DESIGNING ALLOYS,Ji-Cheng (J.-C.) Zhao 51
SPATIAL ORDER AND DIFFRACTION IN QUASICRYSTALS AND BEYOND,Denis Gratias, Lionel Bresson, and Marianne Quiquandon 75
vii
Ann
u. R
ev. M
ater
. Res
. 200
5.35
:167
-207
. Dow
nloa
ded
from
arj
ourn
als.
annu
alre
view
s.or
gby
CA
MB
RID
GE
UN
IVE
RSI
TY
on
07/2
1/05
. For
per
sona
l use
onl
y.

P1: JRX
June 6, 2005 18:18 Annual Reviews AR246-FM
viii CONTENTS
INFLUENCE OF INTERFACE ANISOTROPY ON GRAIN GROWTH AND
COARSENING, Gregory S. Rohrer 99
THE OXIDATION OF NiAl: WHAT CAN WE LEARN FROM AB INITIO
CALCULATIONS? M.W. Finnis, A.Y. Lozovoi, and A. Alavi 167
ANALYTICAL TRANSMISSION ELECTRON MICROSCOPY, Wilfried Sigle 239
COMPOSITE MATERIALS FOR WIND POWER TURBINE BLADES,Povl Brøndsted, Hans Lilholt, and Aage Lystrup 505
MATERIALS CHARACTERIZATION IN THE ABERRATION-CORRECTED
SCANNING TRANSMISSION ELECTRON MICROSCOPE, M. Varela,A.R. Lupini, K. van Benthem, A.Y. Borisevich, M.F. Chisholm,N. Shibata, E. Abe, and S.J. Pennycook 539
ADHESION AND DE-ADHESION MECHANISMS AT POLYMER/METAL
INTERFACES: MECHANISTIC UNDERSTANDING BASED ON IN SITU
STUDIES OF BURIED INTERFACES, G. Grundmeier and M. Stratmann 571
INDEXES
Subject Index 617Cumulative Index of Contributing Authors, Volumes 31–35 655Cumulative Index of Chapter Titles, Volumes 31–35 657
ERRATAAn online log of corrections to Annual Review of Materials Researchchapters may be found at http://matsci.annualreviews.org/errata.shtml
Ann
u. R
ev. M
ater
. Res
. 200
5.35
:167
-207
. Dow
nloa
ded
from
arj
ourn
als.
annu
alre
view
s.or
gby
CA
MB
RID
GE
UN
IVE
RSI
TY
on
07/2
1/05
. For
per
sona
l use
onl
y.