Embed Size (px)
Citation preview
MPRAMunich Personal RePEc Archive
The Overreaction Hypothesis: The Caseof Ukrainian Stock Market
H. R. Mynhardt and Alex Plastun
University of South Africa, National Bank of Ukraine - UkrainianAcademy of Banking
2013
Online at http://mpra.ub.uni-muenchen.de/58941/MPRA Paper No. 58941, posted 28. September 2014 18:27 UTC
Electronic copy available at: http://ssrn.com/abstract=2500961
Corporate Ownership & Control / Volume 11, Issue 1, 2013, Continued - 4
406
THE OVERREACTION HYPOTHESIS: THE CASE OF UKRAINIAN STOCK MARKET
Ronald Henry Mynhardt*, Alexey Plastun**
Abstract
This paper examines the short-term price reactions after one-day abnormal price changes on the
Ukrainian stock market. The original method of abnormal returns calculation is examined. We find
significant evidence of overreactions using the daily data over the period 2008-2012. Our analysis
confirms the hypothesis that after an abnormal price movement the size of contrarian price movement
is usually higher then after normal (typical) daily fluctuation. Comparing Ukrainian data with the
figures from US stock market it is concluded that the Ukrainian stock market is less efficient which
gives rise to opportunities for extra profits obtained from trading based on contrarian strategies. Based
on results of the research we also recommend some rules of trading on short-term market
overreactions.
Keywords: Efficient Market Hypothesis; Overreaction Hypothesis; Abnormal Returns; Contrarian Strategy; Stock Market *Corresponding author. University of South Africa, PO Box 392, Unisa 0003 Tel: +27 12 429 4927 Email: [email protected] **Ukrainian Academy of Banking of the National Bank of Ukraine, 57, Petropavlivska Str., 40000, Sumy, Ukraine Tel: +350509339027 Email: [email protected]
1 Introduction
The hypothesis that provided an analytical framework
for understanding asset prices and their behavior is the
efficient market hypothesis (EMH) (Fama, 1965and
Beechey et al. 2000). According to Jensen (1978)
there is no other proposition in economics which has
more solid empirical evidence supporting it.
EMH points to the fact that all participants of
financial markets are rational economic subjects and
have equal access to information. As the result it is
impossible to get additional profits, since all important
information is already included in price (Fama, 1965).
This means that it is impossible to identify
undervalued assets and/or overvalued assets. Price of
the asset does not depend on its price in the previous
periods. That is why, according to EMH, the study of
past price changes of the asset does not indicate the
future direction of price movements.
However, a number of recent studies furnish
evidence in favor of a certain level of predictability in
price movements. As examples that can be mentioned
are well known market anomalies: firm anomalies
(size, closed-end mutual funds, neglect, institutional
holdings etc), seasonal anomalies (January, weekend,
time of day. end of month, seasonal, holidays etc.),
accounting anomalies (Price/Earnings ratio, earnings
surprises, dividend yield, earnings momentum etc.)
and event anomalies (analysts' recommendations,
insider trading. listings etc) (Levy, 2002).
Another important example of market
inefficiency is market overreactions. Market
overreactions were identified by De Bondt and Thaler
(1985) who showed that investors overvalue the recent
information and undervalue past information. The
result of this is the following anomaly: Portfolios with
the worst (best) dynamics during a three-year period
prefer to show the best (worst) results over the next
three years, the so-called overreaction hypothesis.
A special case of the overreaction hypothesis is
short-term price reactions after one-day abnormal
price changes. There is empirical evidence from
different financial markets that after one-day abnormal
price changes the size of contrarian price movement is
higher than after normal (typical) daily fluctuations
(Atkins and Dyl, 1990, Bremer and Sweeney, 1991,
1996, Cox and Peterson, 1994, and Choi, H.-S. and
Jayaraman, N. 2009).
Despite a considerable amount of research
already conducted on the overreaction theory, there
are still a number of unsolved areas. For example,
usually a single stock market is normally the only
object of research. In our opinion it is important to
research the overreaction hypothesis on different types
of financial markets. In addition, the Ukrainian stock
Electronic copy available at: http://ssrn.com/abstract=2500961
Corporate Ownership & Control / Volume 11, Issue 1, 2013, Continued - 4
407
market has never been the subject of overreaction
hypothesis testing.
This paper aims to expand the overreaction
knowledge by examining the existence of such
anomaly in Ukrainian stock market and testing the
overreaction hypothesis on different financial markets.
The purpose of this study is therefore to confirm
/reject the presence of abnormal counter-reactions
after one-day abnormal price changes on different
financial markets.
To confirm/reject the fact that the size of
counter-reaction that occur after abnormal price
fluctuations differs from the size of typical
countermovement (countermovement after usual,
standard day, without any overreactions) we use t-
statistics. The excess of calculated t-test values over
its critical value indicates that the presented data sets
belong to different general populations. This, in turn,
confirms the overreaction hypothesis.
We analyze data not only from Ukrainian stock
market, but also from the US stock market (Dow
Jones Index), FOREX (EURUSD) and commodity
markets (gold, oil). This allows, on the basis of
common methodology, to test overreaction theory on
different types of markets. This approach also gives a
possibility to compare results from different financial
markets.
The remainder of this paper is organized as
follows: A review of the existing literature on
overreaction hypothesis and reasons for overreactions.
A section that provides the methodology followed in
the study. Next follows a section that presents the
results and key findings of the study. Last there a
section on the conclusions and summary of the paper.
2 Literature review
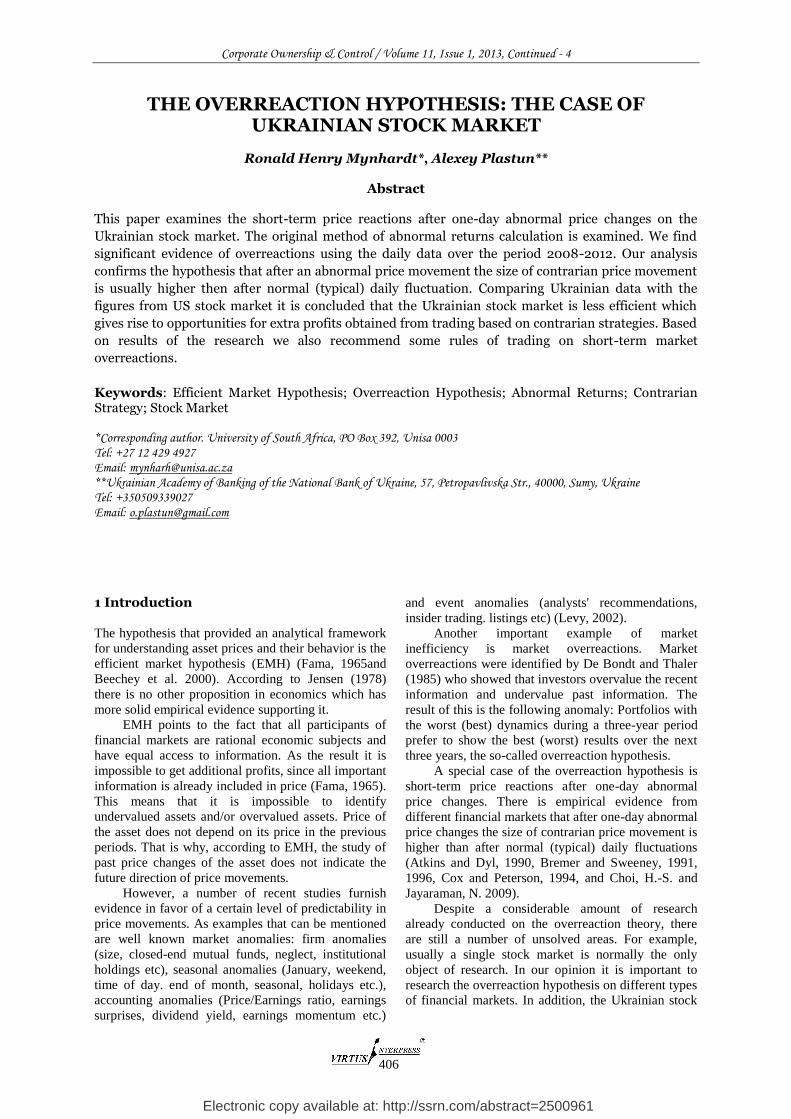
Despite some contradictory of EMH hypothesis (for
example, asset prices have fundamental basis,
existence of market anomalies), the law of random
walk is confirmed both on practical and theoretical
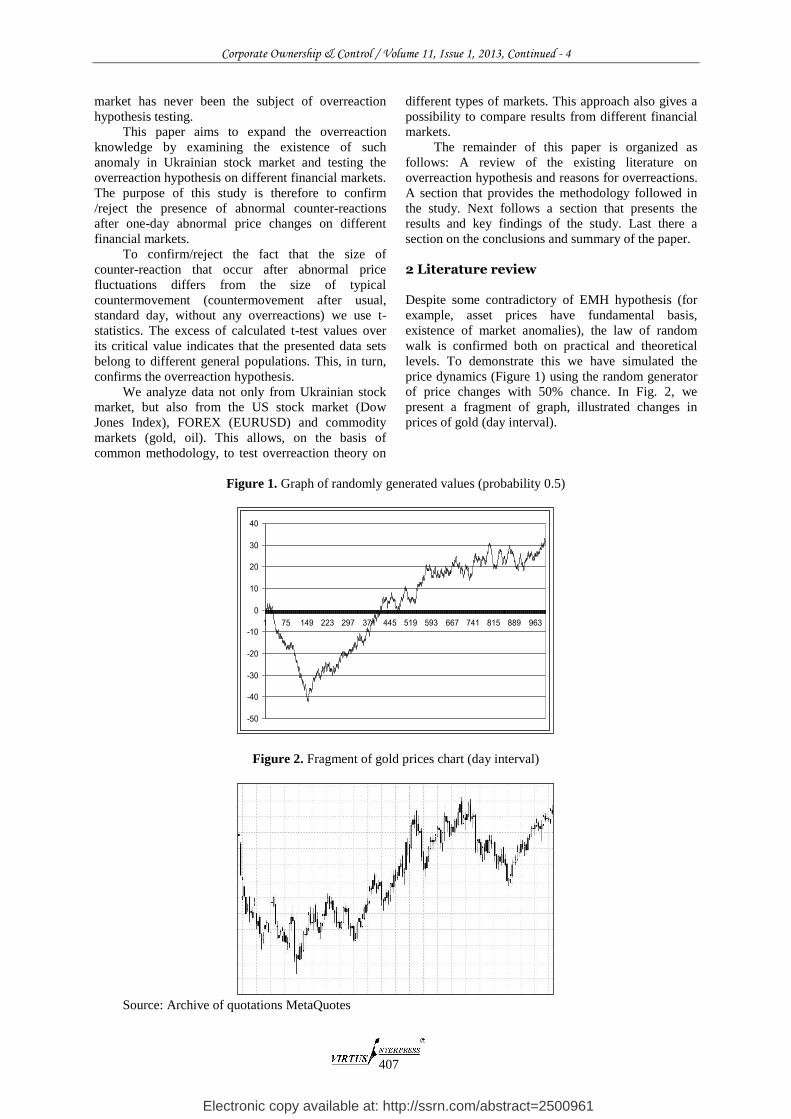
levels. To demonstrate this we have simulated the
price dynamics (Figure 1) using the random generator
of price changes with 50% chance. In Fig. 2, we
present a fragment of graph, illustrated changes in
prices of gold (day interval).
Figure 1. Graph of randomly generated values (probability 0.5)
Figure 2. Fragment of gold prices chart (day interval)
Source: Archive of quotations MetaQuotes
-50
-40
-30
-20
-10
0
10
20
30
40
1 75 149 223 297 371 445 519 593 667 741 815 889 963
Corporate Ownership & Control / Volume 11, Issue 1, 2013, Continued - 4
408
Kothari and Warner (2006) conducted a study of
scientific publications in favor of EMH. According to
their results, there are more than 500 publications in
top economic journals to testify in favor of the rational
behavior of investors and their adequate and efficient
response to new information. Nevertheless, empirical
data from financial markets show that assumptions
underlying the EMH do not always correspond to
reality. The same applies to the main provisions of the
efficient market hypothesis.
Discrepancies between the real life and EMH are
observed in practice and in theory. Ball R. (2009)
notes that the list of EMH inconsistencies is quite long
and includes both market over- and under-reactions to
certain information, volatility explosions and seasonal
yield bursts, yield dependence on different variables
such as market capitalization, dividend rate, and
market factors.
2.1 Overreaction
Researchers pay much attention to the overreactions in
the financial markets - significant deviations in price
changes on assets from their average (typical) values
during certain period of time. In Fig. 1 and 2 we
showed graphs of randomly generated values and
dynamics of real prices and concluded that they are
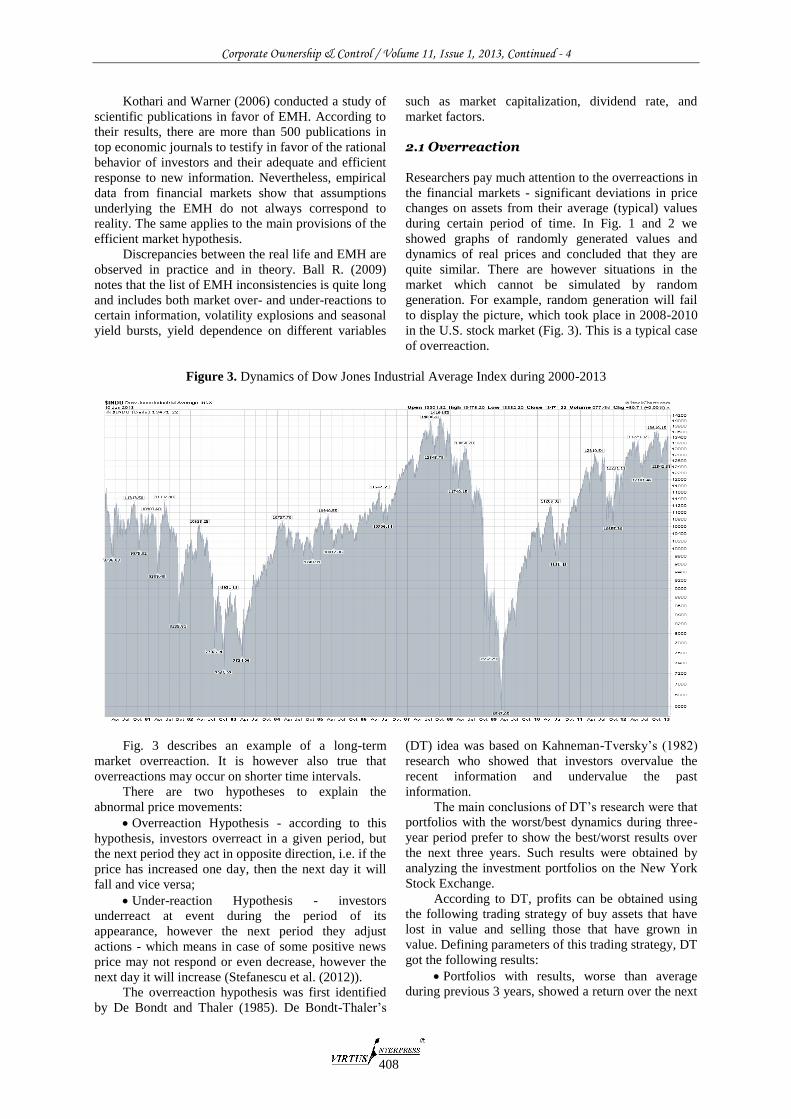
quite similar. There are however situations in the
market which cannot be simulated by random
generation. For example, random generation will fail
to display the picture, which took place in 2008-2010
in the U.S. stock market (Fig. 3). This is a typical case
of overreaction.
Figure 3. Dynamics of Dow Jones Industrial Average Index during 2000-2013
Fig. 3 describes an example of a long-term
market overreaction. It is however also true that
overreactions may occur on shorter time intervals.
There are two hypotheses to explain the
abnormal price movements:
Overreaction Hypothesis - according to this
hypothesis, investors overreact in a given period, but
the next period they act in opposite direction, i.e. if the
price has increased one day, then the next day it will
fall and vice versa;
Under-reaction Hypothesis - investors
underreact at event during the period of its
appearance, however the next period they adjust
actions - which means in case of some positive news
price may not respond or even decrease, however the
next day it will increase (Stefanescu et al. (2012)).
The overreaction hypothesis was first identified
by De Bondt and Thaler (1985). De Bondt-Thaler’s
(DT) idea was based on Kahneman-Tversky’s (1982)
research who showed that investors overvalue the
recent information and undervalue the past
information.
The main conclusions of DT’s research were that
portfolios with the worst/best dynamics during three-
year period prefer to show the best/worst results over
the next three years. Such results were obtained by
analyzing the investment portfolios on the New York
Stock Exchange.
According to DT, profits can be obtained using
the following trading strategy of buy assets that have
lost in value and selling those that have grown in
value. Defining parameters of this trading strategy, DT
got the following results:
Portfolios with results, worse than average
during previous 3 years, showed a return over the next
Corporate Ownership & Control / Volume 11, Issue 1, 2013, Continued - 4
409
36 months that exceeded the average market average
on 19.6%.
Portfolios with profits over-average during next
36 months, earn 5% less than the average market rate
of return. [6]
Overreactions are associated with irrational
behavior of investors who overreact on certain news,
perceiving them too optimistic (pessimistic). This
leads to significant deviations in prices of the asset
from its fundamental value (price). Such overreaction
leads to correction of prices in subsequent periods.
Interesting fact, mentioned by DT, is asymmetry
of overreaction. The size of overreaction is bigger for
undervalued stocks than for overvalued stocks.
Another result of the DT’s work is confirmation of the
"January effect" - overreactions occur mostly in
January.
After DT’s (1985) publication, scientists from
different countries conducted similar studies in terms
of different time periods, markets and countries. Here
are some examples of such researches.
Brown-Harlow (1988) analyzed New York
Stock Exchange data for the period from 1946 to 1983
and reached similar to DT conclusions.
Zarowin (1989) showed the presence of short-
term market overreactions.
Atkins and Dyl (1990) investigated the
behavior of common shares on the New York Stock
Exchange after significant price changes in one
trading day and found overreaction presence,
especially in the case of falling prices.
Ferri and C. Min (1996) confirmed the
overreaction hypothesis on S&P 500 data for the
period 1962-1991.
Larson and Madura (2003) analyzed New York
Stock Exchange data for the period from 1988 to 1998
and showed the presence of overreaction effect.
Clements et al. (2007) also testified in favor of
the overreaction hypothesis. Analysis of data during
1983-2007 showed that manifestations of overreaction
effect become even more obvious nowadays.
Overreaction hypothesis was confirmed in
different international stock markets, including Spain
(Alonso and Rubio (1990)), Canada (Kryzanowsky
and Zhang (1992)), Australian (Brailsford (1992)),
(Clare and Thomas (1995)), Japanese (Chang et al.
(1995)), Hong-Kong (Akhigbe et al. 1998)), Brazilian
(DaCosta and Newton (1994), Richards (1997)), New
Zealand (Bowman and Iverson (1998)), Chinese
(Wang et al. (2004)), Greek (Anthoniou et. al., 2005),
Turkish (Gülin Vardar & Berna Okan, 2008) and
Taiwan (Lin (1988)).
Most of the researchers, as a research object, use
stock markets (see the example above), however
overreaction hypothesis was tested in other markets.
In particular, the gold market (Cutler, Poterba, and
Summers (1991)), option market (Poteshman (2001)).
The efficiency of the overreaction hypothesis
was proved not only on theoretical and empirical
level, but also in the sphere of real trading. For
example, Jegadeesh (1993) developed a trading
strategy based on the main provisions of the
overreaction hypothesis. Strategy algorithm is quite
simple and consists in opening transactions in
direction, opposite to the previous movement. As the
period of analysis Jegadeesh used month. So, after
price on certain asset within a month increases, it
should be sold and short position is held during the
month.
Contrary actions are performed in case of price
decreasing. Profitability of such strategy according to
Jegadeesh is 2% per month. A similar strategy but
with a period of a week, was developed by Lehmann
(1990). The result was 2% return in a week. Such
results indirectly evidence that overreaction
hypothesis is not just a hypothetical construction, but
is actually working and effective.
2.2 Reasons for overreactions
Despite a large number of scientific researches
devoted to the problem of overreactions, there is no
consensus about its causes. According to EMH,
overreactions should not exist because they create
opportunities to obtain extra profits.
However, current evidence is in favor of the
overreaction hypothesis. Summarizing existing
theories we can list the reasons for these overreactions
as Psychological, Technical, Fundamental and other.
2.3 Psychological overreactions
Psychological overreactions are normally associated
with the following:
Overreaction to new information - Instead of
comparing new information with existing information
and taking rational decisions, investors act under
emotions and the herd effect. (Griffin and Tversky
(1992), Madura and Richie (2004)).
Existence of "noise" traders - Irrational
investors take investment decisions on fragmentary
information and current price fluctuations. According
to Aiyagari and Gertler (1999), one of the most
common behavioral signs of noise traders is their
attempt to sell, if current prices fall and buy if prices
increase. Thus, their activity increases the price
fluctuations in the markets.
Developing the idea of presence in the market
different investors, Hong and Stein (1999) note the
existence of two types of investors: those ones who
trade on inside and private information
("newswatchers", investors who use fundamental
analysis are the basis for investment decisions), the
other ones take decisions based on past prices analysis
and extrapolation its results on the future ("momentum
traders", investors who use technical analysis as a base
for decision-making).
Depending on dominating type of investor in the
market, overreaction or under-reaction may occur. For
example, technical analysts react to price fluctuations
Corporate Ownership & Control / Volume 11, Issue 1, 2013, Continued - 4
410
very quickly, that leads to the overreactions, if they
dominate in the market. Conversely, investors who use
fundamental analysis are oriented over a longer time
horizons. They respond to new information slowly.
This can lead to under-reaction of the market for
particular new information.
The representativeness effect – If a particular
market or market sector is growing rapidly for some
time, it forms a positive image among investors.
Accordingly, investors begin to prefer assets of this
sector. In turn it leads to increase in demand and
therefore price growth. Barberis, Shleifer and Vishny
(1998) explain representativeness effect by the fact
that investors often ignore the laws of chance and
behave as if the events, that took place recently, are
typical. However, they are very slow to change their
previous views and beliefs in response to the
emergence of new information.
Psychological characteristics of investor’s
behavior, such as panic and the effect of the crowd -
Typical human psychological flaws can explain why
"rational" investors buy assets higher than their
fundamental value and sell below their fair value.
Overconfidence and biased attitude - Investors
often overestimate their ability to analyze the market
situation. In this regard, they underestimated the
likelihood of errors in the prediction of a certain event.
Usually it is associated with a certain experience
which caused the illusion of market understanding.
Daniel et al. (1998) also names a biased attitude
as a psychological feature. If some information
confirms the predictions of investor, it strengthens his
belief in own rightness. In addition, the investor’s
confidence decreases very slowly even if information
begins to refute their predictions. In other words, there
is a tendency to consider random success as own
achievement and to think that mistakes are caused
totally by the external factors, independent from
investor.
2.4 Technical reasons
An important group of factors that can lead to the
emergence of market overreactions are technical
reasons, i.e. factors associated with the use of
technical analysis by investors in making decisions.
Technical analysis methodology is based on the
previous price fluctuations in forecasts of future
prices. It is widely believed that the current movement
in the price of assets can generate specific trading
signals from various technical indicators that will lead
to massive operations/trading in the current movement
direction and will strengthen it causing overreaction.
Another important technical factor is price
behavior when it approaches "level" (term from
technical analysis that characterizes certain price
values which act as some sort of a barrier to the next
movement, since interest of the market is generally
concentrated in these price zones). “Level”
breakthrough usually leads to massive operations in
direction of current price movement.
One of the most important technical factors
leading to overreactions is the execution of so-called
"stop-losses" (“stops”). These are orders to close open
positions when a certain level of losses is achieved
(see Duran and Caginalp (2007)). Execution of stops
means opening positions in the direction of current
movement (forced closure of the short positions means
opening of the long positions and vice versa). Stops
execution acts as a movement catalyst or accelerator,
and leads to increase in the scale of basic movement
and loss of control over its size. The most typical
example of overreaction caused by stops execution is
the collapse of U.S. stock indexes in 1987 (Black
Monday), when Dow Jones index lost 22.6%.
Analyzing the role of technical factors, Aiyagari-
Gertler (1999) proposed an explanation for the
emergence of overreactions called the margin-call
theory. Its meaning is very close to previously
analyzed stops execution. The bottom line of their idea
is: to open a position on particular asset investors need
cash collateral - margin. To increase clients'
operations, increase their trading opportunities,
brokers usually provide traders with the so-called
leverage (some sort of a loan).
For example, with a $ 10,000 account trader can
open positions on hundreds of thousands dollars.
When position is opened certain amount of margin is
needed and is reserved on the trade account. The
consequence of this practice is an opportunity to make
bigger profits, but bigger risks and losses too. At the
same time, brokers, do not want to risk their own
money (acting as a creditor of client’s operations they
share risks). So they limit the risks of the client using
the margin-call mechanism.
Positions are closed when margin requirements
reach certain level of equity (when trade account is
insufficient to cover existing losses plus a certain level
of margin). In case of large and unexpected movement
in the markets margin-call mechanism often comes
into action, closing the most unprofitable position of
the client to release the margin. Closure of
unprofitable positions means, that opposite positions
are opened, i.e. positions in the direction of current
movement, thus increasing its scale.
Margin-call theory has the right to life, especially
in case of super-movements (as in 1929 or 1987
years), though there are doubts that in the case of
"normal" overreactions this factor can be dominant.
2.5 Fundamental reasons
One more important group of factors is the
fundamental ones such as the so-called "price-ratio
hypothesis", proposed by Dreman (1982). According
to this hypothesis, companies with low P/E ratio are
undervalued. However, usually there are few investors
who wish to buy stocks of these companies. It happens
because past negative still strong in the memory of
Corporate Ownership & Control / Volume 11, Issue 1, 2013, Continued - 4
411
investors. Nevertheless, when negative news on such
companies end and positive news become dominant,
the demand for shares increases dramatically. That
leads to abnormal movements. Opposite situation is
observed for overvalued shares.
2.6 Other reasons
Other reasons include the lack of liquidity in the
market. Even small numbers and amounts of
transactions can lead to significant price fluctuations
(Jegadeesh-Titman (1992)).
Based on the analysis of the causes of market
overreactions, the question arises that if an
overreaction is not the result of achieving a new level
of fair price, but rather a combination of
psychological, technical and other non-rational
factors, in this case at the end of overreaction, should
prices correct to adjust equilibrium level? If it is so,
the result should be that the size of countermovement
in prices should exceed the size of countermovement
for standard (normal, usual) periods.
Bremer and Sweeney (1991) proved the fact that
after a very strong negative price movement positive
price movement occurs. Their size exceeds ordinary
movements. Analysis of negative daily changes which
in size exceeded 10% showed that the next day price
increased on average by 1.77%.
This phenomenon can be explained by:
Fixation of profits - traders who open positions
in the direction of the abnormal movement on the next
day (realizing the fact that the potential of the
movement is exhausted), close their positions to fix
profits. To do this they have to open opposite
positions and that initiates the movement in the
opposite direction to the previous abnormal movement
direction;
Technical factors - after abnormally strong
movements some technical indicators (especially
oscillators) generate signals for transactions in a
direction opposite to the previous abnormal
movement;
Market (rational) factors - investors reassess
information and understand the fact of the previous
movement abnormality, with further actions to return
to its equilibrium level.
3 Research methodology
In this paper t-statistics is used to confirm/reject the
fact that the size of counter-reaction that occurs after
abnormal price fluctuations differs from the size of
typical counter-movements (countermovement after
usual, standard day, without any overreactions). The
excess of the calculated t-test values over its critical
value will indicate that presented data sets belong to
different general populations. In practical terms this
will mean that the size of countermovement that
occurs after abnormal movements statistically differs
from the normal countermovement. This, in turn,
confirms the overreaction theory.
One of the conditions for the use of the t-test is
the normality of the distribution of the analyzed data.
Note that our sample is quite large in size (from a few
hundreds to several thousands values). This allows us
to use the central limit theorem and concludes
compliance data to normal distribution (for details see
Mendenhall et al. (2003)).
However, in order to confirm above-mentioned
logical assumptions, we will analyze the "normality"
of our data using specially designed criterion.
Normal distribution, so-called Gaussian
distribution, is the probability distribution, under
which the resulting value is affected by a large number
of random factors.
Central Limit Theorem: If a random variable is
exposed to an infinite number of infinitely small
random factors, it is normally distributed.
Random variable is a variable which value
results from the measurement of a quantity that is
subject to variations due to chance (i.e. randomness, in
a mathematical sense).
There are many factors that affect the movement
of market prices and their influence is very different.
So the price movement assumes the character of
random fluctuations (usually for a limited period of
time). Thus, financial assets prices can be regarded as
random variables.
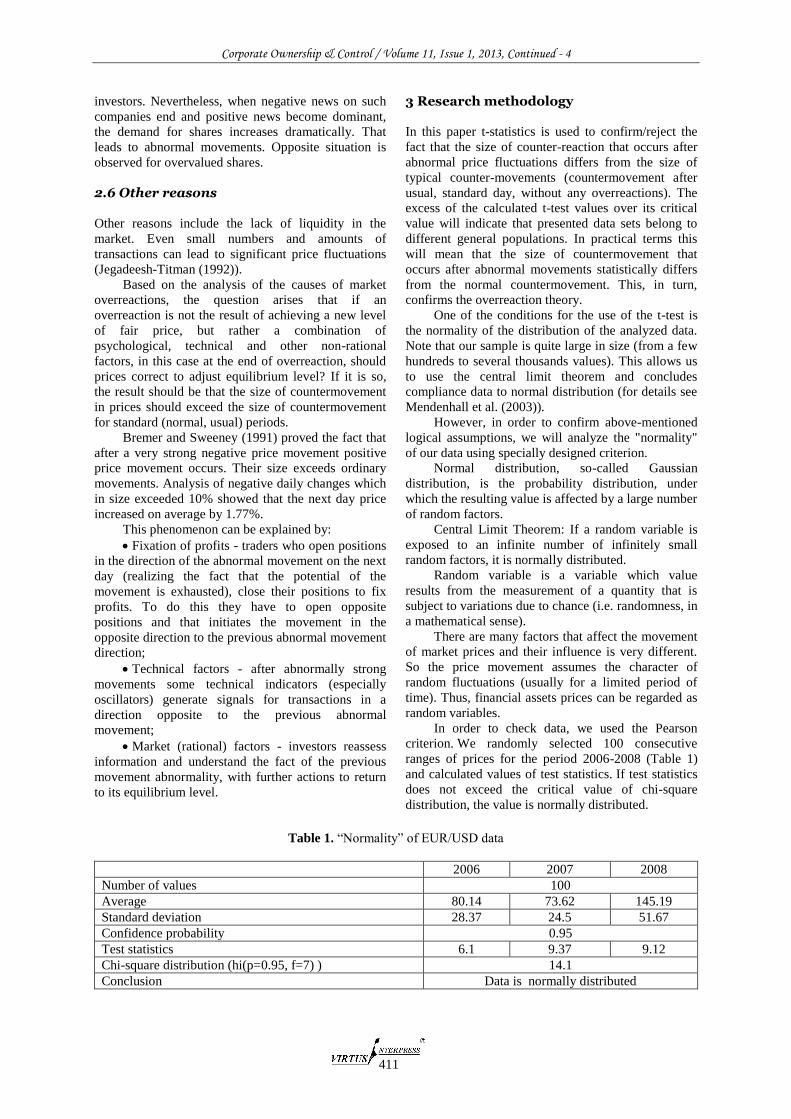
In order to check data, we used the Pearson
criterion. We randomly selected 100 consecutive
ranges of prices for the period 2006-2008 (Table 1)
and calculated values of test statistics. If test statistics
does not exceed the critical value of chi-square
distribution, the value is normally distributed.
Table 1. “Normality” of EUR/USD data
2006 2007 2008
Number of values 100
Average 80.14 73.62 145.19
Standard deviation 28.37 24.5 51.67
Confidence probability 0.95
Test statistics 6.1 9.37 9.12
Chi-square distribution (hi(p=0.95, f=7) ) 14.1
Conclusion Data is normally distributed
Corporate Ownership & Control / Volume 11, Issue 1, 2013, Continued - 4
412
Thus, daily ranges of financial assets prices
changes are normally distributed. So the data is
relevant to use Student's t-test.
The next important thing is data sample
formation. The principal moment here is the
interpretation of overreaction.
We will analyze short-term overreactions, so the
period of analysis will be 1 day (one trading session).
Typical price parameters that characterize the
behavior of prices during one day are: maximum
price, minimum price, open and close price.
In most studies to measure the size of price
movement the difference between the open and close
price is used. This is the final size of price changes
over one day - daily return.
However, we believe this approach is not
adequate enough and does not reflect real events fully.
There are a lot of overreactions (when price during
one day deviates strongly) with small price between
open and close prices. So, we propose to consider
daily return as the size of the fluctuations in price
during the day, i.e. the difference between the
maximum and minimum prices during the day.
It should be noted that in most cases, to calculate
the size of overreaction and daily return relative
values are used. An alternative to this approach is
calculation of the movement size in absolute values.
Anyway, as the use of relative values let us avoid
the impact of changes in absolute size of daily ranges
due to the price changes (for example, when prices
grow the absolute size of fluctuations also increases)
we consider relative values more correct and adequate.
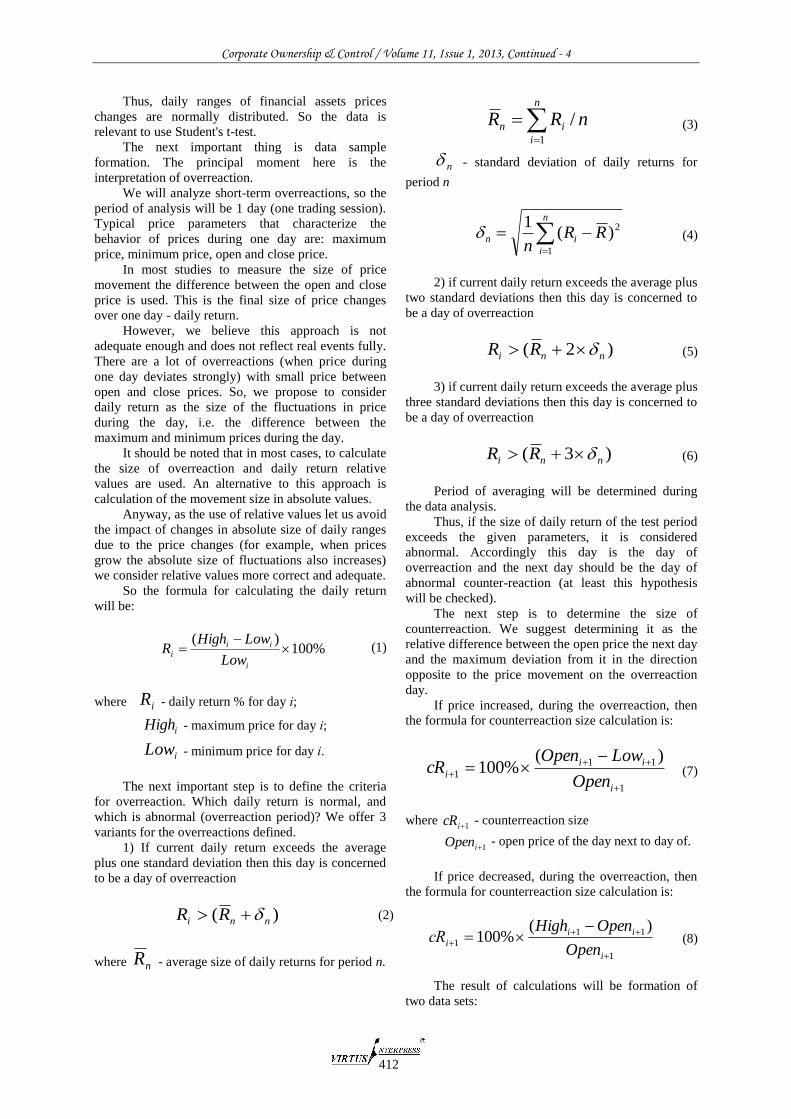
So the formula for calculating the daily return
will be:
%100)(
i
ii
iLow
LowHighR (1)
where iR - daily return % for day і;
iHigh - maximum price for day і;
iLow - minimum price for day і.
The next important step is to define the criteria
for overreaction. Which daily return is normal, and
which is abnormal (overreaction period)? We offer 3
variants for the overreactions defined.
1) If current daily return exceeds the average
plus one standard deviation then this day is concerned
to be a day of overreaction
)( nni RR
(2)
where nR - average size of daily returns for period n.
nRRn
i
in /1
(3)
n - standard deviation of daily returns for
period n
n
i
in RRn 1
2)(1
(4)
2) if current daily return exceeds the average plus
two standard deviations then this day is concerned to
be a day of overreaction
)2( nni RR (5)
3) if current daily return exceeds the average plus
three standard deviations then this day is concerned to
be a day of overreaction
)3( nni RR (6)
Period of averaging will be determined during
the data analysis.
Thus, if the size of daily return of the test period
exceeds the given parameters, it is considered
abnormal. Accordingly this day is the day of
overreaction and the next day should be the day of
abnormal counter-reaction (at least this hypothesis
will be checked).
The next step is to determine the size of
counterreaction. We suggest determining it as the
relative difference between the open price the next day
and the maximum deviation from it in the direction
opposite to the price movement on the overreaction
day.
If price increased, during the overreaction, then
the formula for counterreaction size calculation is:
1
11
1
)(%100
i
ii
iOpen
LowOpencR (7)
where 1icR - counterreaction size
1iOpen - open price of the day next to day of.
If price decreased, during the overreaction, then
the formula for counterreaction size calculation is:
1
11
1
)(%100
i
ii
iOpen
OpenHighсR (8)
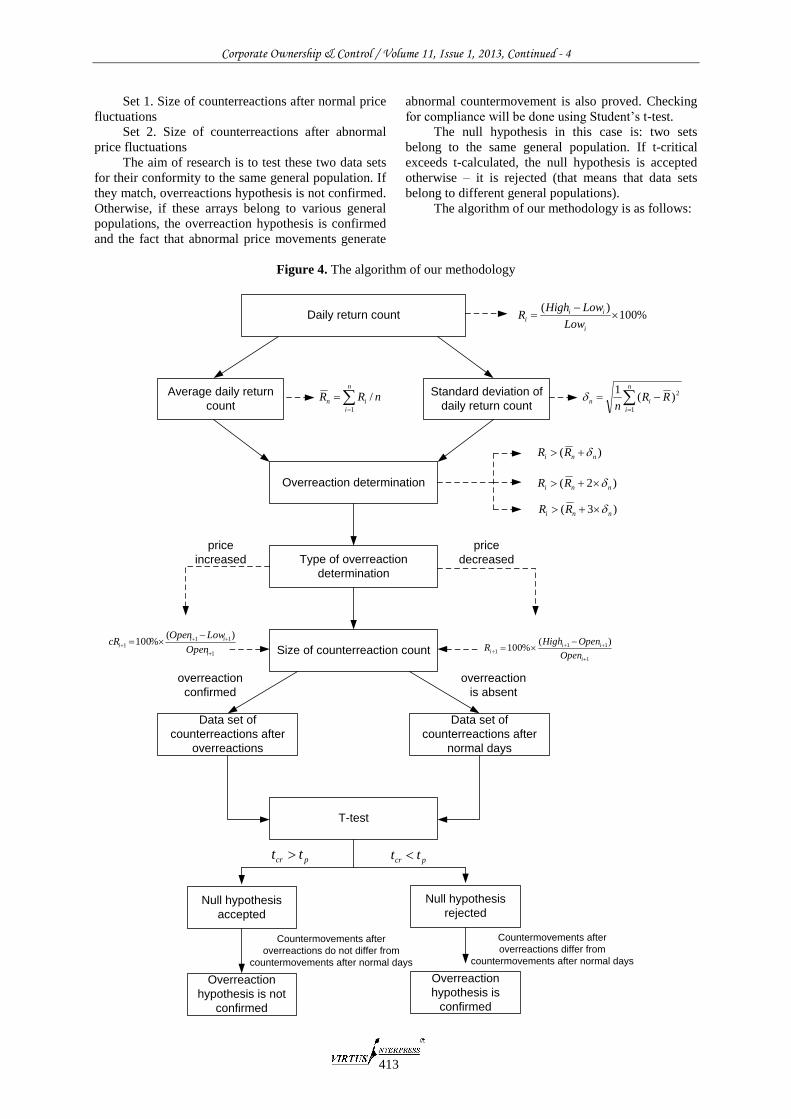
The result of calculations will be formation of
two data sets:
Corporate Ownership & Control / Volume 11, Issue 1, 2013, Continued - 4
413
Set 1. Size of counterreactions after normal price
fluctuations
Set 2. Size of counterreactions after abnormal
price fluctuations
The aim of research is to test these two data sets
for their conformity to the same general population. If
they match, overreactions hypothesis is not confirmed.
Otherwise, if these arrays belong to various general
populations, the overreaction hypothesis is confirmed
and the fact that abnormal price movements generate
abnormal countermovement is also proved. Checking
for compliance will be done using Student’s t-test.
The null hypothesis in this case is: two sets
belong to the same general population. If t-critical
exceeds t-calculated, the null hypothesis is accepted
otherwise – it is rejected (that means that data sets
belong to different general populations).
The algorithm of our methodology is as follows:
Figure 4. The algorithm of our methodology
Daily return count %100)(
i
iii
Low
LowHighR
Average daily return
count
Standard deviation of
daily return countnRR
n
i
in /1
n
i
in RRn 1
2)(1
Overreaction determination
)( nni RR
)2( nni RR
)3( nni RR
Type of overreaction
determination
Size of counterreaction count1
111
)(%100
i
iii
Open
OpenHighR
1
111
)(%100
i
iii
Open
LowOpencR
Data set of
counterreactions after
overreactions
Data set of
counterreactions after
normal days
T-test
pcr tt pcr tt
Null hypothesis
accepted
Null hypothesis
rejected
Overreaction
hypothesis is not
confirmed
Countermovements after
overreactions do not differ from
countermovements after normal days
Countermovements after
overreactions differ from
countermovements after normal days
Overreaction
hypothesis is
confirmed
price
increased
price
decreased
overreaction
confirmed
overreaction
is absent

Corporate Ownership & Control / Volume 11, Issue 1, 2013, Continued - 4
414
4 Findings
As objects of analysis we choose the following
financial assets:
Dow-Jones index (developed stock market);
Currency pair EURUSD (FOREX);
Gold (commodities);
Oil (commodities);
UX index (leading Ukrainian stock market
index - emerging stock market).
Test results for these assets are presented in
Appendices 1-5. Results are rather sensitive to the
parameters of testing (period of averaging and
criterion of normality – the number of standard
deviations that should be added to the mean). That is
why they are mixed.
Interesting result of analysis is conclusion that
increased size of abnormal movement does not
necessary lead to increased size of countermovement.
Let’s discuss results of analysis in details (case
of Dow-Jones index for the period 1987-2012). We
choose Dow-Jones index because US stock market is
the biggest and developed in the world. Plus it has the
biggest number of participants and the highest level of
exchange culture in general.
The number of abnormal returns detections
during 1987-2012 is presented in Table 2.
Table 2. The number of abnormal returns detections in Dow-Jones index during 1987-2012
n 5 10 20 30
Indicator Number % Number % Number % Number %
Overall 6458 100 6454 100 6444 100 6434 100
Number of abnormal returns (criterion -
mean+sigma) 1297 20 1183 18 1123 17 1070 17
Number of abnormal returns (criterion -
mean+2*sigma) 587 9% 474 7 379 6 371 6
Number of abnormal returns (criterion -
mean+3*sigma) 290 4% 194 3 159 2 145 2
As we can see, both parameters (period of
averaging and number of standard deviation added to
mean) make impact on the number of detected
anomalies. It should be mentioned that change of
averaging period causes relatively small deviations of
the number of detected anomalies (difference between
number for the period=5 and period=30 is less than
10%). So period of averaging is not so important from
the position of number of detected anomalies. That is
why selection of averaging period may be depended
on other factors that interest researcher.
Opposite situation is observed for the parameter
that concerns the number of standard deviations
should be added to mean to detect the anomaly.
Each additional standard deviation significantly
decreases the number of observed abnormal returns
(the size of decrease is 50% for each additional
sigma). It creates strong restrictions for the practical
use of this parameter. 2-4% of overall data sample (the
number of abnormal returns in case of 3 sigmas) are
not enough to create a representative population and to
make reasonable conclusions.
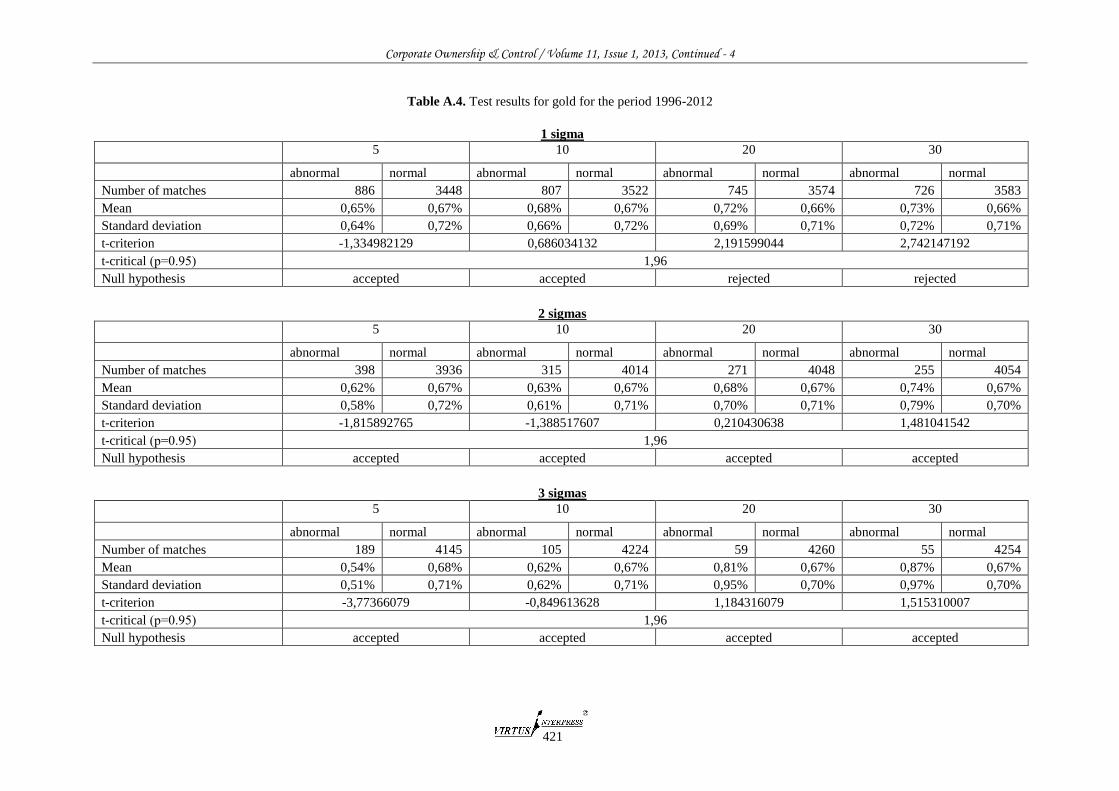
Based on data from Tables A.1-A.4 we selected
the next set of parameters: period of averaging = 30,
the number of sigmas = 1. This selection is caused by
the following reasons:
1) Results for different types of market are close
to each other with this combination of parameters;
2) Small periods of averaging cause serious
fluctuations in values of means and standard
deviations that increases the level of “noise” in data
and results;
3) Increased number of sigmas significantly
reduces the number of detected anomalies;
4) The quality of results is the highest for this
set of parameters (difference between normal
countermovements and countermovements after
abnormal returns).
Results of analysis for this set of parameters are
presented in Table 3.
The results of empirical tests evidence are in
favor of the statistically significant difference between
the size of countermovements after “normal” returns
and the size of countmovements after abnormal
returns. The only exception among analyzed types of
financial markets is foreign exchange market (case of
EURUSD). In case of FOREX difference between the
size of countermovements after “normal” returns and
the size of countermovements after abnormal returns
is statistically insignificant (means are 0,5 and 0,52
accordingly). So for the FOREX null hypothesis is
accepted. These results are consistent with EMH. So it
is impossible to get extra profits from trading on
foreign exchange market using the contrarian trading
strategy based on short-term overreactions.
For other types of financial markets (stock
and commodities) difference between means (let’s call
it “delta”) is nearly 10% and it is statistically
significant (t-criterion is bigger than t-critical).
Nevertheless “delta” is different for each type of
markets and assets. Maximum difference between
“normal” average and “abnormal” was observed in
Ukrainian stock market (1.07% vs 1.79%). “Delta”
exceeds 50%. This gives huge opportunities for
Corporate Ownership & Control / Volume 11, Issue 1, 2013, Continued - 4
415
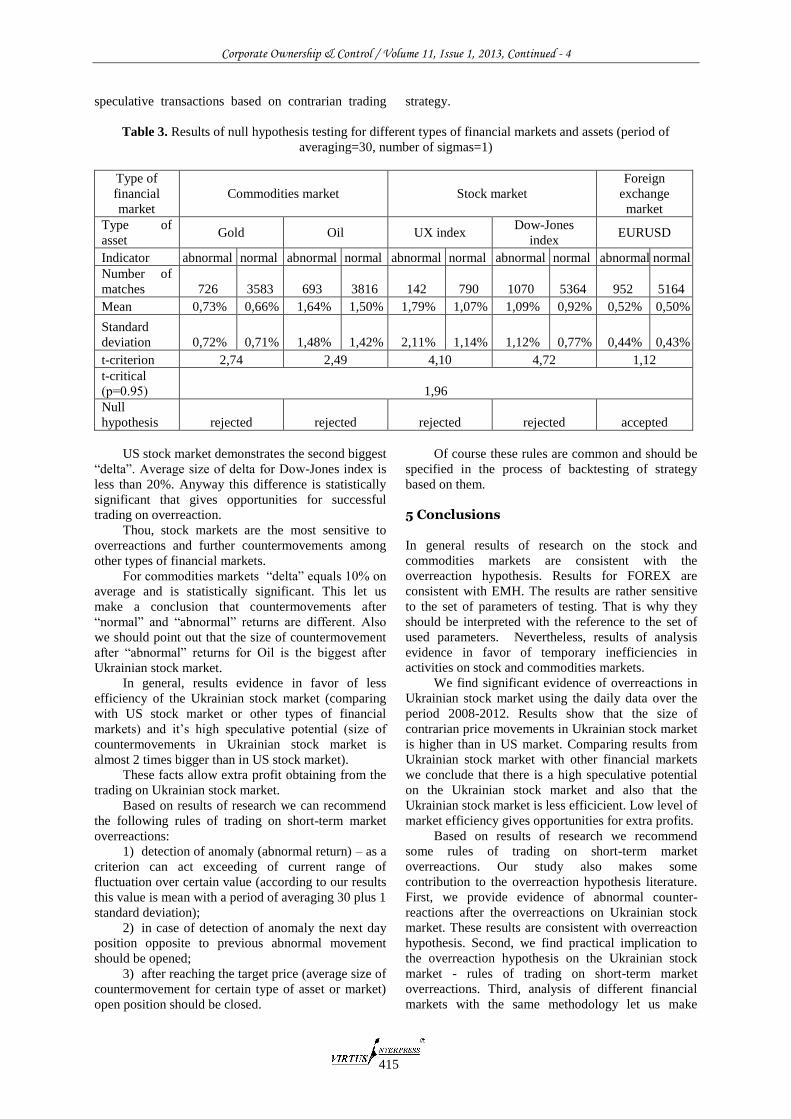
speculative transactions based on contrarian trading strategy.
Table 3. Results of null hypothesis testing for different types of financial markets and assets (period of
averaging=30, number of sigmas=1)
Type of
financial
market
Commodities market Stock market
Foreign
exchange
market
Type of
asset Gold Oil UX index
Dow-Jones
index EURUSD
Indicator abnormal normal abnormal normal abnormal normal abnormal normal abnormal normal
Number of
matches 726 3583 693 3816 142 790 1070 5364 952 5164
Mean 0,73% 0,66% 1,64% 1,50% 1,79% 1,07% 1,09% 0,92% 0,52% 0,50%
Standard
deviation 0,72% 0,71% 1,48% 1,42% 2,11% 1,14% 1,12% 0,77% 0,44% 0,43%
t-criterion 2,74 2,49 4,10 4,72 1,12
t-critical
(р=0.95) 1,96
Null
hypothesis rejected rejected rejected rejected accepted
US stock market demonstrates the second biggest
“delta”. Average size of delta for Dow-Jones index is
less than 20%. Anyway this difference is statistically
significant that gives opportunities for successful
trading on overreaction.
Thou, stock markets are the most sensitive to
overreactions and further countermovements among
other types of financial markets.
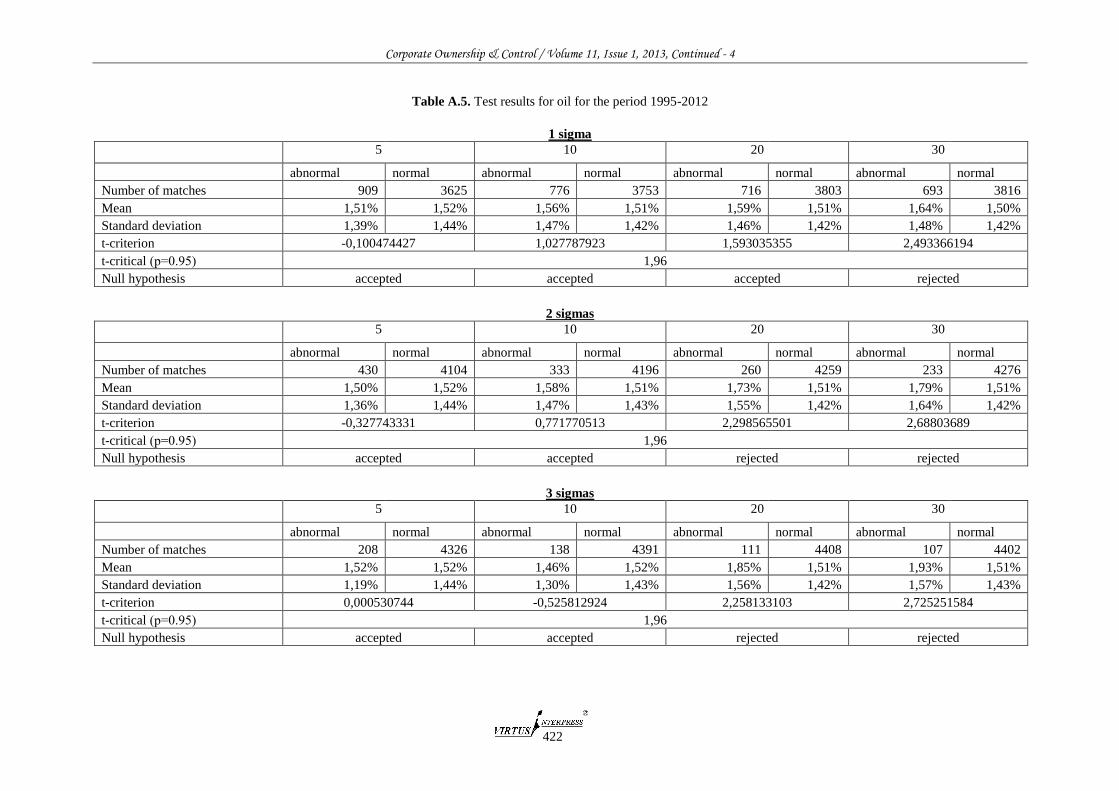
For commodities markets “delta” equals 10% on
average and is statistically significant. This let us
make a conclusion that countermovements after
“normal” and “abnormal” returns are different. Also
we should point out that the size of countermovement
after “abnormal” returns for Oil is the biggest after
Ukrainian stock market.
In general, results evidence in favor of less
efficiency of the Ukrainian stock market (comparing
with US stock market or other types of financial
markets) and it’s high speculative potential (size of
countermovements in Ukrainian stock market is
almost 2 times bigger than in US stock market).
These facts allow extra profit obtaining from the
trading on Ukrainian stock market.
Based on results of research we can recommend
the following rules of trading on short-term market
overreactions:
1) detection of anomaly (abnormal return) – as a
criterion can act exceeding of current range of
fluctuation over certain value (according to our results
this value is mean with a period of averaging 30 plus 1
standard deviation);
2) in case of detection of anomaly the next day
position opposite to previous abnormal movement
should be opened;
3) after reaching the target price (average size of
countermovement for certain type of asset or market)
open position should be closed.
Of course these rules are common and should be
specified in the process of backtesting of strategy
based on them.
5 Conclusions
In general results of research on the stock and
commodities markets are consistent with the
overreaction hypothesis. Results for FOREX are
consistent with EMH. The results are rather sensitive
to the set of parameters of testing. That is why they
should be interpreted with the reference to the set of
used parameters. Nevertheless, results of analysis
evidence in favor of temporary inefficiencies in
activities on stock and commodities markets.
We find significant evidence of overreactions in
Ukrainian stock market using the daily data over the
period 2008-2012. Results show that the size of
contrarian price movements in Ukrainian stock market
is higher than in US market. Comparing results from
Ukrainian stock market with other financial markets
we conclude that there is a high speculative potential
on the Ukrainian stock market and also that the
Ukrainian stock market is less efficicient. Low level of
market efficiency gives opportunities for extra profits.
Based on results of research we recommend
some rules of trading on short-term market
overreactions. Our study also makes some
contribution to the overreaction hypothesis literature.
First, we provide evidence of abnormal counter-
reactions after the overreactions on Ukrainian stock
market. These results are consistent with overreaction
hypothesis. Second, we find practical implication to
the overreaction hypothesis on the Ukrainian stock
market - rules of trading on short-term market
overreactions. Third, analysis of different financial
markets with the same methodology let us make
Corporate Ownership & Control / Volume 11, Issue 1, 2013, Continued - 4
416
complex conclusions about the presence of short-term
market overreactions in modern financial markets and
to highlight markets immune or exposed to
overreactions.
6 Summary
This paper investigates whether counter-movements
after days with abnormal returns are larger than
countermovement after “normal” days.
Our results, based on daily data from US stock
market, FOREX, commodities and Ukrainian stock
market, indicate the following:
Firstly, the behavior of the stocks and
commodities markets is consistent with the
overreaction hypothesis and evidence in favor of
temporary inefficiencies in activities on stock and
commodities markets.
Secondly, the results for FOREX are consistent
with EMH.
Thirdly, the results are rather sensitive to the set
of parameters of testing. That is why they should be
interpreted with the reference to the set of used
parameters.
Fourthly the size of contrarian price movements
in Ukrainian stock market is higher than in the US
market. Comparing results from Ukrainian stock
market with other financial markets we come to
conclusion about the less market efficiency of the
Ukrainian stock market. Low level of market
efficiency gives opportunities for extra profits.
Finally, the important conclusion of this research
is the high speculative potential of the Ukrainian stock
market. Results of this paper can be a good base for
construction a contrarian trading strategy based on
short-term overreactions analysis. Basics of such
strategy were proposed in this paper.
References
1. Aiyagari S.Rao, Gertler Mark Overreaction” of Asset
Prices in General Equilibrium // Review of Economic
Dynamics, Volume 2, Issue 1, January 1999, Pages 3–
35
2. Archive of quotations MetaQuotes [electronic
resource] / - Mode of
access: http://www.metaquotes.net
3. Atkins, A. B., and E. A. Dyl. ”Price Reversals, Bid-
Ask Spreads, and Market Efficiency.” Journal of
Financial and Quantitative Analysis, Vol. 25, No. 4
(Dec 1990), 535 – 547
4. Ball Ray. 2009. The Global Financial Crisis and the
Efficient Market Hypothesis: What Have We Learned?
// Electronic copy available at:
http://ssrn.com/abstract=1502815
5. Ball, R (1990), ‘What Do We Know About Market
Efficiency?’, The University of New South Wales
School of Banking and Finance Working Paper Series
No 31
6. Barberis, N., A. Shleifer, and R.W. Vishny, 1998, A
Model of Investor Sentiment, Journal of Financial
Economics, 49, 307-343.
7. Beechey M, Gruen D, Vickrey J. (2000). The Efficient
Markets Hypothesis: A Survey. Reserve Bank of
Australia.
8. Bremer, M. and Sweeney, R. J.: 1991, The reversal of
large stock price decreases, J. Finance 46, 747-754.
9. Brown, K. C., W.V. Harlow, and S. M. Tinic. ”Risk
Aversion, Uncertain Information, and Market
Efficiency.” Journal of Financial Economics, 22 (Dec
1988), 355 - 385.
10. Choi, H.-S. and Jayaraman, N. (2009), Is reversal of
large stock-price declines caused by overreaction or
information asymmetry: Evidence from stock and
option markets. J. Fut. Mark., 29: 348–376.
doi: 10.1002/fut.20360
11. Clements A., Drew M., Reedman E., Veeraraghavan
M. The Death of the Overreaction Anomaly? A
Multifactor Explanation of Contrarian Returns //
Working/Discussion Paper # 219 May 2007
12. Cutler, D., J. Poterba, and L. Summers (1991).
Speculative dynamics. Review of Economics Studies
58, 529–546.
13. Daniel, K., Hirshleifer, D. & Subrahmanyam, A.
(1998). "Investor Psychology and Security Market
Under- and Overreactions", Journal of Finance, Vol.
53, pp. 1839- 1886.
14. De Bondt W., Thaler R. Does the Stock Market
Overreact? // Journal of Finance. — 1985. — Vol. 40.
— Р. 793—808
15. Dow Jones Industrial Average (2000 - Present Daily)
//
http://stockcharts.com/freecharts/historical/djia2000.ht
ml
16. Dreman D.N. The new contrarian investment strategy.
New York: Random House, 1982
17. Duran, Ahmet and Caginalp,
Gunduz, Overreaction Diamonds: Precursors and
Aftershocks for Significant Price Changes.
Quantitative Finance, 7(3), 2007, pp. 321-342
18. Fama Eugene F. , "The Behavior of Stock-Market
Prices" The Journal of Business, Vol.38, No. 1
(January 1965), p. 90.
19. Ferri, M., G. and C. Min, “Evidence that the Stock
Market Overreacts and Adjusts.” The Journal of
Portfolio Management, 22, 3 (1996), 71-76
20. Griffin, D., Tversky, A., 1992. The weighing of
evidence and the determinants of confidence.
Cognitive Psychology 24, 411-435.
21. Gülin Vardar & Berna Okan, 2008. "Short Term
Overreaction Effect: Evidence on the Turkish Stock
Market," Papers of the Annual IUE-SUNY Cortland
Conference in Economics, in: Proceedings of the
Conference on Emerging Economic Issues in a
Globalizing World, pages 155-165 Izmir University of
Economics
22. Hong, H., and J. C. Stein, 1999, A Unified Theory of
Underreaction, Momentum Trading and Overreaction
in Asset Markets, Journal of Finance, 54, 2143-2184.
23. Jegadeesh, N. and S. Titman. "Returns to Buying
Winners and Selling Losers: Implications for Stock
Market Efficiency.", Journal of Finance, 48 (1993),
65-91.
24. Jegadeesh, Narasimhan and Titman, Sheridan ,
Overreaction, Delayed Reaction, and Contrarian
Profits. REVIEW OF FINANCIAL STUDIES, Vol. 8
No. 4. Available at SSRN:
http://ssrn.com/abstract=7224
Corporate Ownership & Control / Volume 11, Issue 1, 2013, Continued - 4
417
25. Jensen, MC (1978), ‘Some Anomalous Evidence
Regarding Market Efficiency’, Journal of Financial
Economics, 6(2/3), pp 95–101.
26. Kahneman, D., and Tversky, A. 1982. The psychology
of preferences. Scientific American 246: 160-73.
27. Kothari, S. P., Jerold B. Warner. 2006. The
econometrics of event studies. B. Espen Eckbo, ed.,
Handbook in Empirical Corporate Finance. North-
Holland, Amsterdam, forthcoming.
28. Larson, Stephen J. J. and Madura, Jeff, What Drives
Stock Price Behavior Following Extreme One-Day
Returns. Forthcoming in Journal of Financial
Research. Available at SSRN:
http://ssrn.com/abstract=298460
29. Lehmann, Bruce N., Fads, Martingales, and Market
Efficiency (April 1990). NBER Working Paper No.
w2533. Available at SSRN:
http://ssrn.com/abstract=227518
30. Levy Haim. Fundamentals of Investments. Financial
Times/Prentice Hall Books, 2002. – 600 p.
31. Madura, Jeff and Nivine Richie, 2004, Overreaction of
exchange traded funds during the bubble of 1998-
2002, Journal of Behavioral Finance, 5 (2), 91-104
32. Mendenhall, W., Beaver, R. J. and Beaver, B. M.:
2003, Introduction to Probability and Statistics, 11th
edn, Brooks / Cole, Pacific Grove.
33. Poteshman, A. (2001). Underreaction, overreaction
and increasing misreaction to information in the
options market. Journal of Finance 56-3, 851–876
34. Stefanescu, Razvan, Dumitriu, Ramona and Nistor,
Costel, Overreaction and Underreaction on the
Bucharest Stock Exchange (April 23, 2012). Available
at SSRN: http://ssrn.com/abstract=2044459 or
http://dx.doi.org/10.2139/ssrn.2044459
35. Zarowin Paul Does the Stock Market Overract to
Corporate Earnings Information? The Journal of
Finance, Vol. 44. No. 5 (Dec., 1989), 1385-1399.

Corporate Ownership & Control / Volume 11, Issue 1, 2013, Continued - 4
418
Appendix A
Table A.1. Test results for Dow Jones Industrial Average Index for the period 1987-2012
1 sigma
5 10 20 30
abnormal normal abnormal normal abnormal normal abnormal normal
Number of matches 1297 5161 1183 5271 1123 5321 1070 5364
Mean 0,97% 0,95% 1,00% 0,94% 1,06% 0,93% 1,09% 0,92%
Standard deviation 0,97% 0,80% 1,01% 0,80% 1,08% 0,78% 1,12% 0,77%
t-criterion 0,859571855 2,033267584 4,230763317 4,722439164
t-critical (р=0.95) 1,96
Null hypothesis accepted rejected rejected rejected
2 sigmas
5 10 20 30
abnormal normal abnormal normal abnormal normal abnormal normal
Number of matches 587 5871 474 5980 379 6065 371 6063
Mean 1,01% 0,95% 1,07% 0,94% 1,14% 0,94% 1,20% 0,94%
Standard deviation 1,14% 0,81% 1,26% 0,80% 1,39% 0,79% 1,41% 0,79%
t-criterion 1,414756929 2,282117763 2,764405498 3,545822771
t-critical (р=0.95) 1,96
Null hypothesis accepted rejected rejected rejected
3 sigmas
5 10 20 30
abnormal normal abnormal normal abnormal normal abnormal normal
Number of matches 290 6168 194 6260 159 6285 145 6289
Mean 1,07% 0,95% 1,10% 0,95% 1,29% 0,94% 1,52% 0,94%
Standard deviation 1,39% 0,81% 1,57% 0,81% 1,84% 0,80% 1,99% 0,79%
t-criterion 1,477631306 1,384190797 2,367443946 3,482152514
t-critical (р=0.95) 1,96
Null hypothesis accepted accepted rejected rejected
Corporate Ownership & Control / Volume 11, Issue 1, 2013, Continued - 4
419
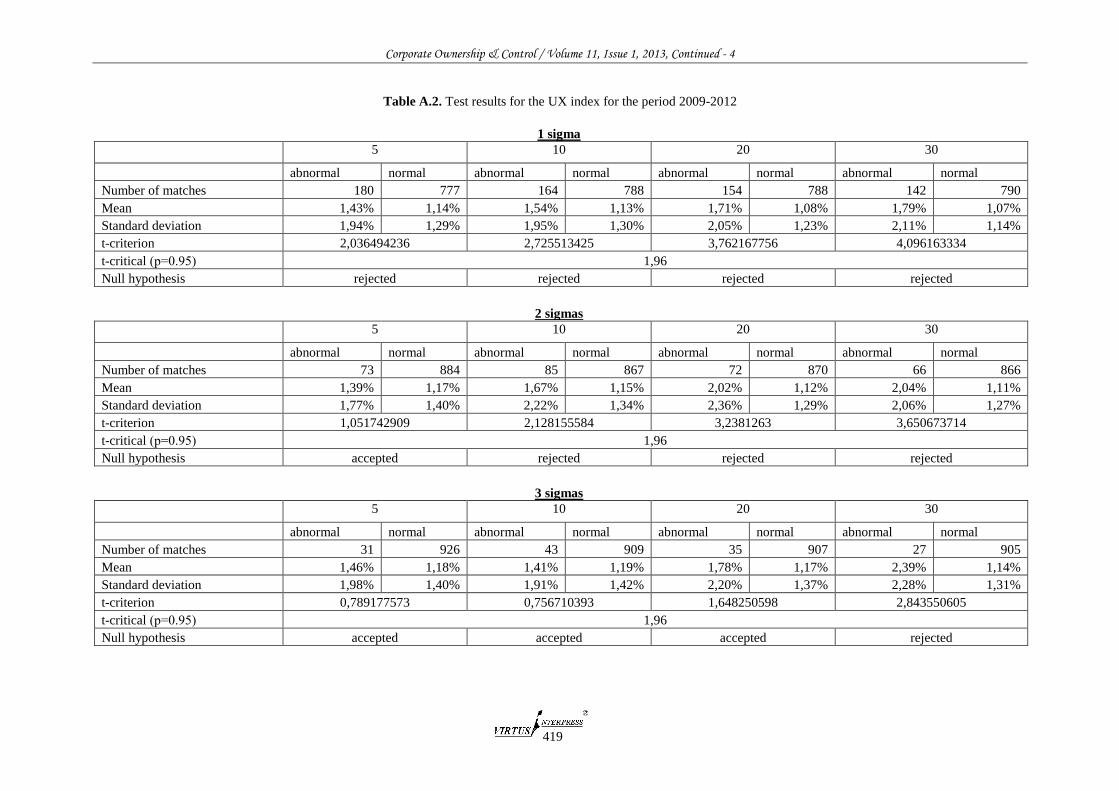
Table A.2. Test results for the UX index for the period 2009-2012
1 sigma
5 10 20 30
abnormal normal abnormal normal abnormal normal abnormal normal
Number of matches 180 777 164 788 154 788 142 790
Mean 1,43% 1,14% 1,54% 1,13% 1,71% 1,08% 1,79% 1,07%
Standard deviation 1,94% 1,29% 1,95% 1,30% 2,05% 1,23% 2,11% 1,14%
t-criterion 2,036494236 2,725513425 3,762167756 4,096163334
t-critical (р=0.95) 1,96
Null hypothesis rejected rejected rejected rejected
2 sigmas
5 10 20 30
abnormal normal abnormal normal abnormal normal abnormal normal
Number of matches 73 884 85 867 72 870 66 866
Mean 1,39% 1,17% 1,67% 1,15% 2,02% 1,12% 2,04% 1,11%
Standard deviation 1,77% 1,40% 2,22% 1,34% 2,36% 1,29% 2,06% 1,27%
t-criterion 1,051742909 2,128155584 3,2381263 3,650673714
t-critical (р=0.95) 1,96
Null hypothesis accepted rejected rejected rejected
3 sigmas
5 10 20 30
abnormal normal abnormal normal abnormal normal abnormal normal
Number of matches 31 926 43 909 35 907 27 905
Mean 1,46% 1,18% 1,41% 1,19% 1,78% 1,17% 2,39% 1,14%
Standard deviation 1,98% 1,40% 1,91% 1,42% 2,20% 1,37% 2,28% 1,31%
t-criterion 0,789177573 0,756710393 1,648250598 2,843550605
t-critical (р=0.95) 1,96
Null hypothesis accepted accepted accepted rejected

Corporate Ownership & Control / Volume 11, Issue 1, 2013, Continued - 4
420
Table A.3. Test results for the currency pair EURUSD for the period 1989-2012
1 sigma
5 10 20 30
abnormal normal abnormal normal abnormal normal abnormal normal
Number of matches 1267 4875 1074 5062 1006 5120 952 5164
Mean 0,97% 0,95% 0,50% 0,51% 0,50% 0,51% 0,52% 0,50%
Standard deviation 0,97% 0,80% 0,42% 0,43% 0,43% 0,43% 0,44% 0,43%
t-criterion 0,849572618 -0,860344841 -0,310513198 1,120110619
t-critical (р=0.95) 1,96
Null hypothesis accepted accepted accepted accepted
2 sigmas
5 10 20 30
abnormal normal abnormal normal abnormal normal abnormal normal
Number of matches 629 5513 454 5682 374 5752 334 5782
Mean 1,01% 0,95% 0,49% 0,51% 0,52% 0,50% 0,55% 0,50%
Standard deviation 1,14% 0,81% 0,43% 0,43% 0,43% 0,43% 0,44% 0,43%
t-criterion 1,464495703 -0,766391672 0,625074255 1,921197517
t-critical (р=0.95) 1,96
Null hypothesis accepted accepted accepted accepted
3 sigmas
5 10 20 30
abnormal normal abnormal normal abnormal normal abnormal normal
Number of matches 355 5787 206 5930 144 5982 126 5990
Mean 0,97% 0,95% 0,54% 0,50% 0,59% 0,50% 0,64% 0,50%
Standard deviation 0,97% 0,80% 0,47% 0,43% 0,45% 0,43% 0,47% 0,43%
t-criterion 0,449703612 1,08240839 2,208156707 3,263013086
t-critical (р=0.95) 1,96
Null hypothesis accepted accepted rejected rejected
Corporate Ownership & Control / Volume 11, Issue 1, 2013, Continued - 4
421
Table A.4. Test results for gold for the period 1996-2012
1 sigma
5 10 20 30
abnormal normal abnormal normal abnormal normal abnormal normal
Number of matches 886 3448 807 3522 745 3574 726 3583
Mean 0,65% 0,67% 0,68% 0,67% 0,72% 0,66% 0,73% 0,66%
Standard deviation 0,64% 0,72% 0,66% 0,72% 0,69% 0,71% 0,72% 0,71%
t-criterion -1,334982129 0,686034132 2,191599044 2,742147192
t-critical (р=0.95) 1,96
Null hypothesis accepted accepted rejected rejected
2 sigmas
5 10 20 30
abnormal normal abnormal normal abnormal normal abnormal normal
Number of matches 398 3936 315 4014 271 4048 255 4054
Mean 0,62% 0,67% 0,63% 0,67% 0,68% 0,67% 0,74% 0,67%
Standard deviation 0,58% 0,72% 0,61% 0,71% 0,70% 0,71% 0,79% 0,70%
t-criterion -1,815892765 -1,388517607 0,210430638 1,481041542
t-critical (р=0.95) 1,96
Null hypothesis accepted accepted accepted accepted
3 sigmas
5 10 20 30
abnormal normal abnormal normal abnormal normal abnormal normal
Number of matches 189 4145 105 4224 59 4260 55 4254
Mean 0,54% 0,68% 0,62% 0,67% 0,81% 0,67% 0,87% 0,67%
Standard deviation 0,51% 0,71% 0,62% 0,71% 0,95% 0,70% 0,97% 0,70%
t-criterion -3,77366079 -0,849613628 1,184316079 1,515310007
t-critical (р=0.95) 1,96
Null hypothesis accepted accepted accepted accepted
Corporate Ownership & Control / Volume 11, Issue 1, 2013, Continued - 4
422
Table A.5. Test results for oil for the period 1995-2012
1 sigma
5 10 20 30
abnormal normal abnormal normal abnormal normal abnormal normal
Number of matches 909 3625 776 3753 716 3803 693 3816
Mean 1,51% 1,52% 1,56% 1,51% 1,59% 1,51% 1,64% 1,50%
Standard deviation 1,39% 1,44% 1,47% 1,42% 1,46% 1,42% 1,48% 1,42%
t-criterion -0,100474427 1,027787923 1,593035355 2,493366194
t-critical (р=0.95) 1,96
Null hypothesis accepted accepted accepted rejected
2 sigmas
5 10 20 30
abnormal normal abnormal normal abnormal normal abnormal normal
Number of matches 430 4104 333 4196 260 4259 233 4276
Mean 1,50% 1,52% 1,58% 1,51% 1,73% 1,51% 1,79% 1,51%
Standard deviation 1,36% 1,44% 1,47% 1,43% 1,55% 1,42% 1,64% 1,42%
t-criterion -0,327743331 0,771770513 2,298565501 2,68803689
t-critical (р=0.95) 1,96
Null hypothesis accepted accepted rejected rejected
3 sigmas
5 10 20 30
abnormal normal abnormal normal abnormal normal abnormal normal
Number of matches 208 4326 138 4391 111 4408 107 4402
Mean 1,52% 1,52% 1,46% 1,52% 1,85% 1,51% 1,93% 1,51%
Standard deviation 1,19% 1,44% 1,30% 1,43% 1,56% 1,42% 1,57% 1,43%
t-criterion 0,000530744 -0,525812924 2,258133103 2,725251584
t-critical (р=0.95) 1,96
Null hypothesis accepted accepted rejected rejected