Embed Size (px)
Citation preview

The Outlook for U.S. EnergyMarkets
presented to theGasification Technologies 2001 Conference
byRobert T. Eynon
Energy Information AdministrationU.S. Department of Energy
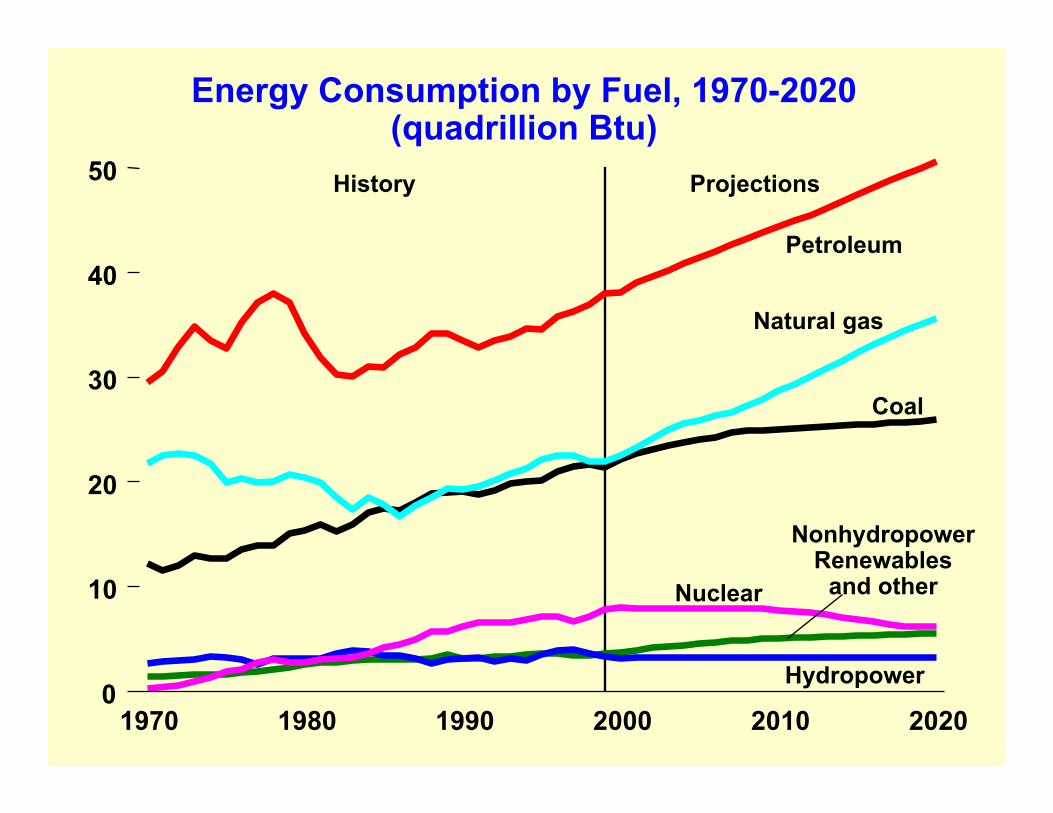
1970 1980 1990 2000 2010 20200
10
20
30
40
50
Coal
Natural gas
Nuclear
Petroleum
History Projections
Hydropower
Energy Consumption by Fuel, 1970-2020(quadrillion Btu)
NonhydropowerRenewables
and other
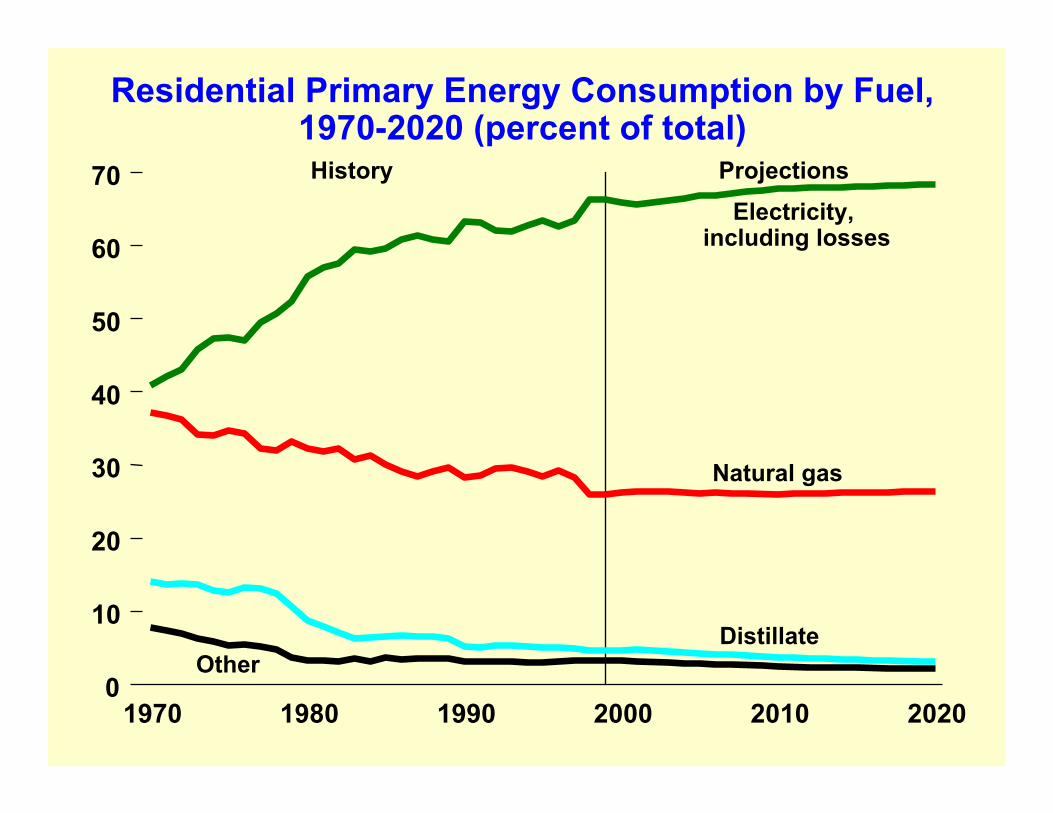
1970 1980 1990 2000 2010 20200
10
20
30
40
50
60
70 History Projections
Distillate
Natural gas
Other
Electricity, including losses
Residential Primary Energy Consumption by Fuel,1970-2020 (percent of total)
0
2
4
6
8
10
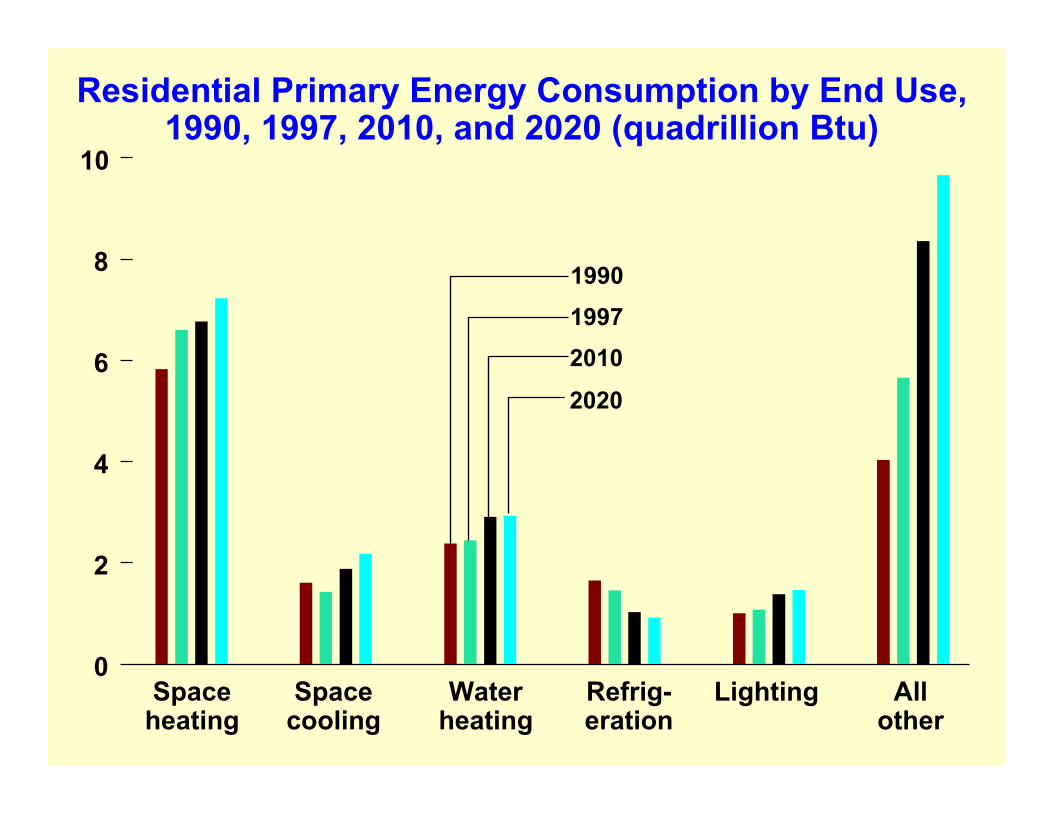
Spaceheating
Spacecooling
Waterheating
Refrig-eration
Lighting Allother
19901997
20202010
Residential Primary Energy Consumption by End Use,1990, 1997, 2010, and 2020 (quadrillion Btu)
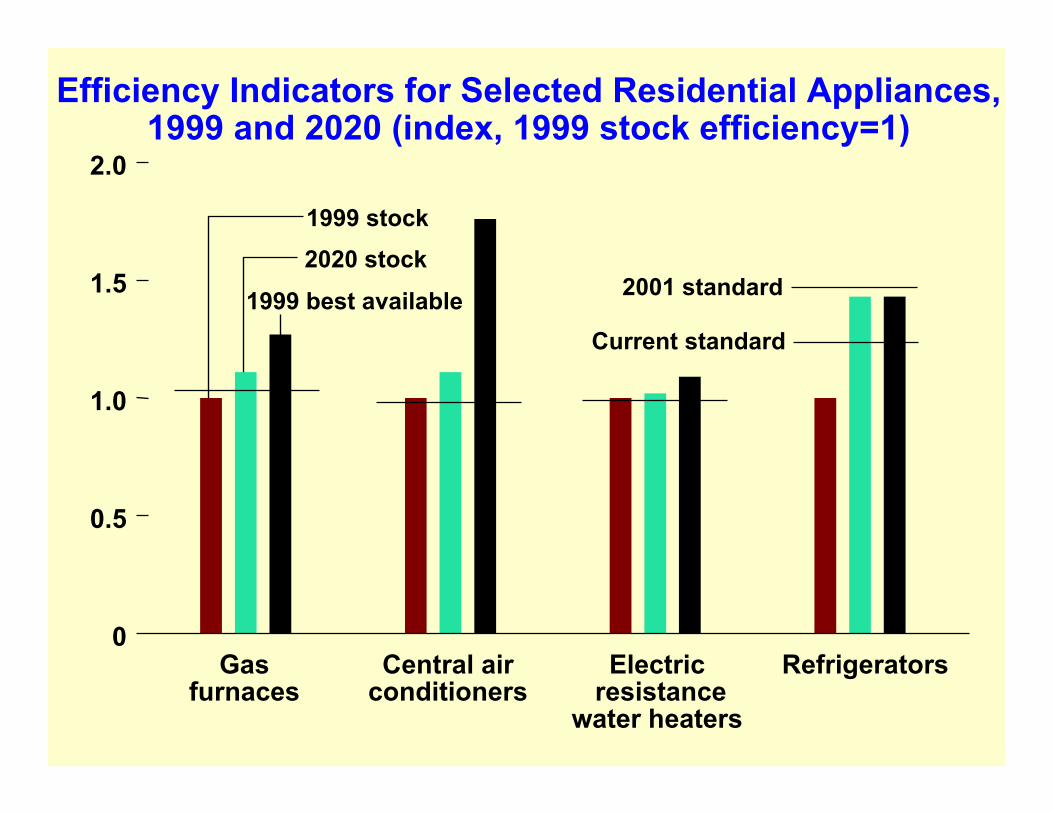
Gasfurnaces
Central airconditioners
Electric resistance
water heaters
Refrigerators0
0.5
1.0
1.5
2.0
Current standard
1999 stock2020 stock
1999 best available 2001 standard
Efficiency Indicators for Selected Residential Appliances,1999 and 2020 (index, 1999 stock efficiency=1)
1970 1980 1990 2000 2010 20200
20
40
60
80
Other
Natural gas
History Projections
Distillate
Electricity, including losses
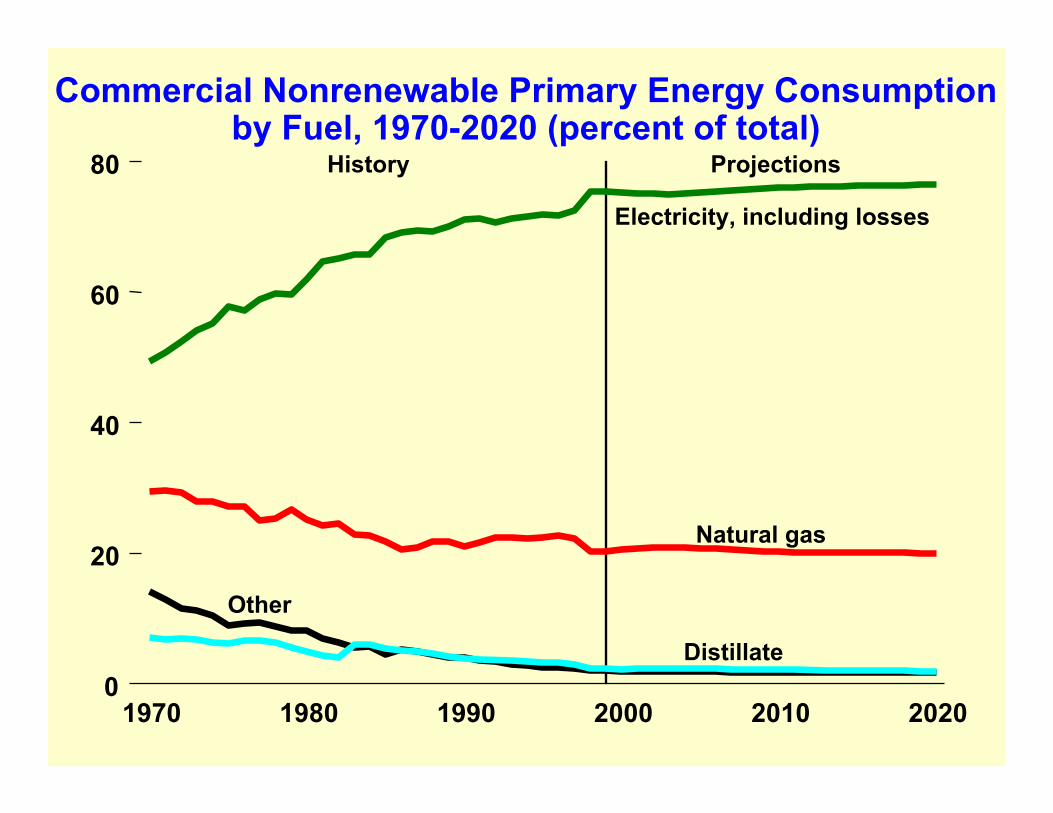
Commercial Nonrenewable Primary Energy Consumptionby Fuel, 1970-2020 (percent of total)
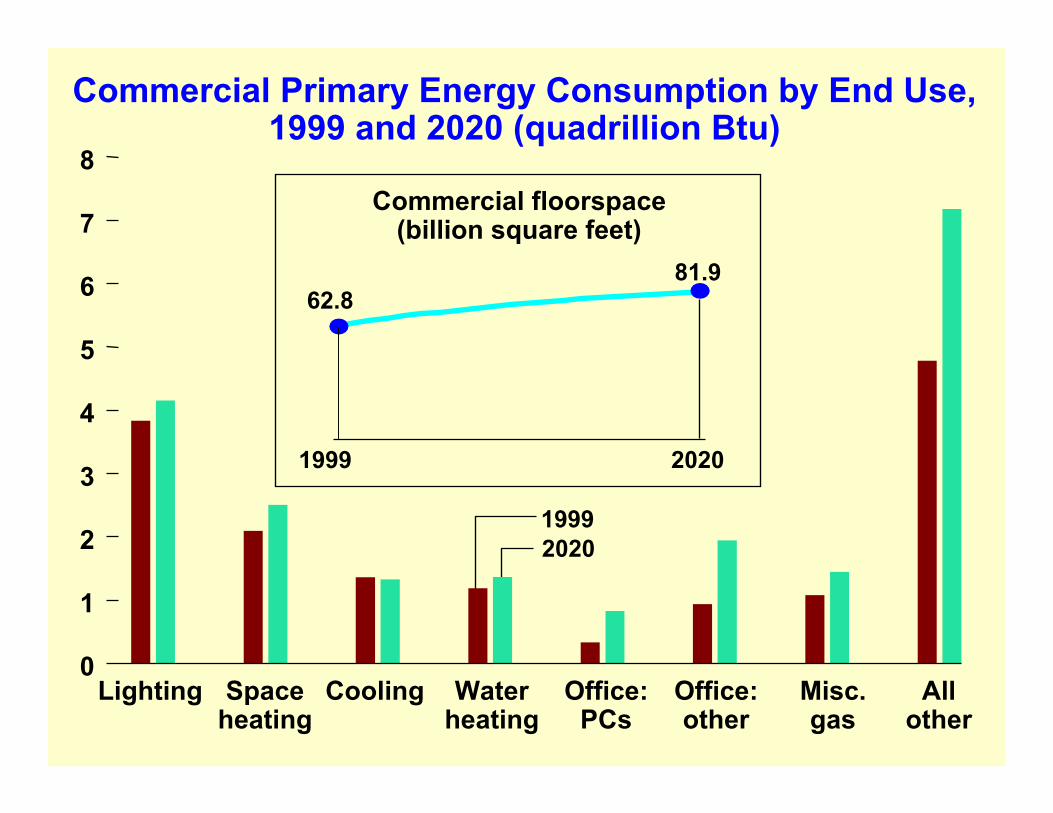
Commercial Primary Energy Consumption by End Use,1999 and 2020 (quadrillion Btu)
Lighting Spaceheating
Cooling Waterheating
Office:PCs
Office:other
Misc.gas
Allother
0
1
2
3
4
5
6
7
8
19992020
1999 2020
62.881.9
Commercial floorspace(billion square feet)
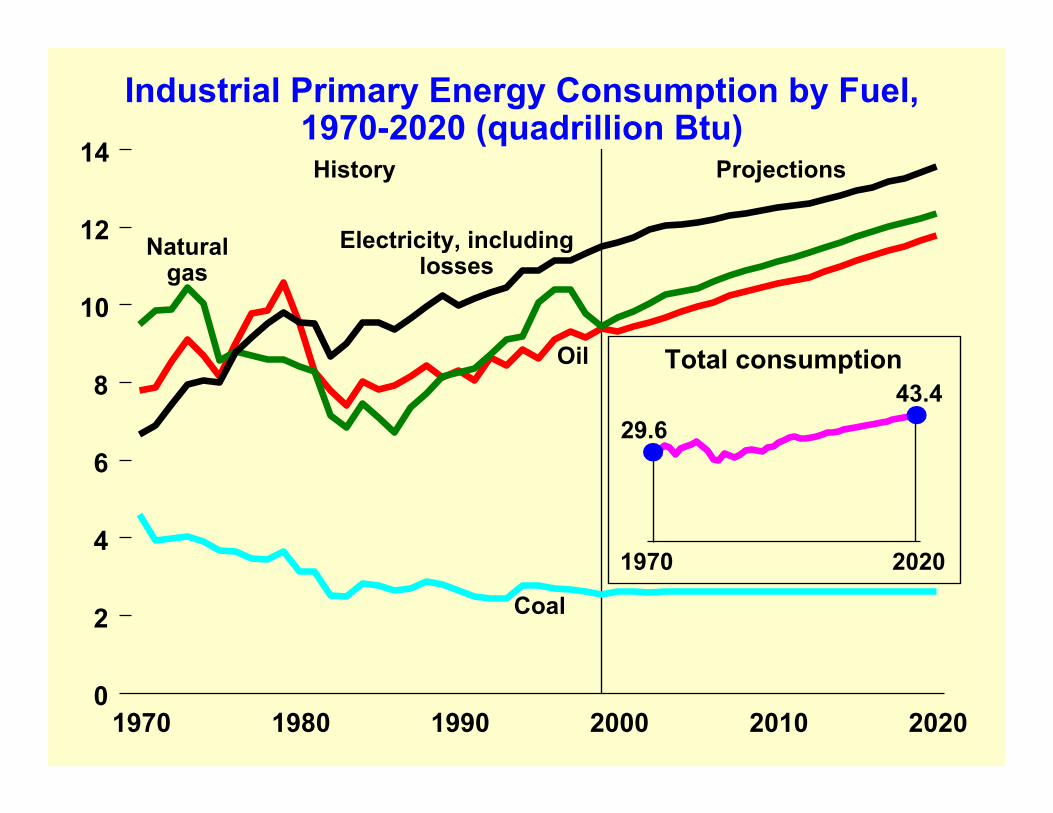
Industrial Primary Energy Consumption by Fuel,1970-2020 (quadrillion Btu)
1970 1980 1990 2000 2010 20200
2
4
6
8
10
12
14
Naturalgas
Oil
Coal
History Projections
1970 2020
Electricity, includinglosses
Total consumption
29.643.4
History
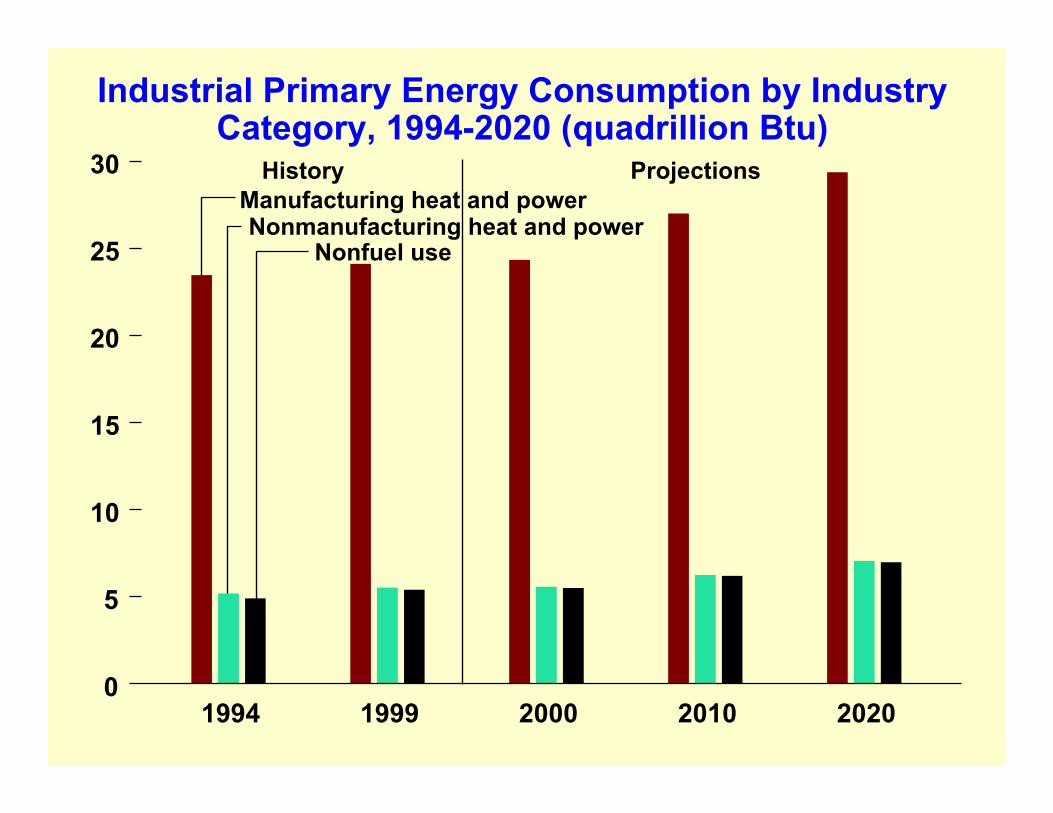
1994 1999 2000 2010 20200
5
10
15
20
25
30
Nonfuel use
Manufacturing heat and powerNonmanufacturing heat and power
Projections
Industrial Primary Energy Consumption by IndustryCategory, 1994-2020 (quadrillion Btu)
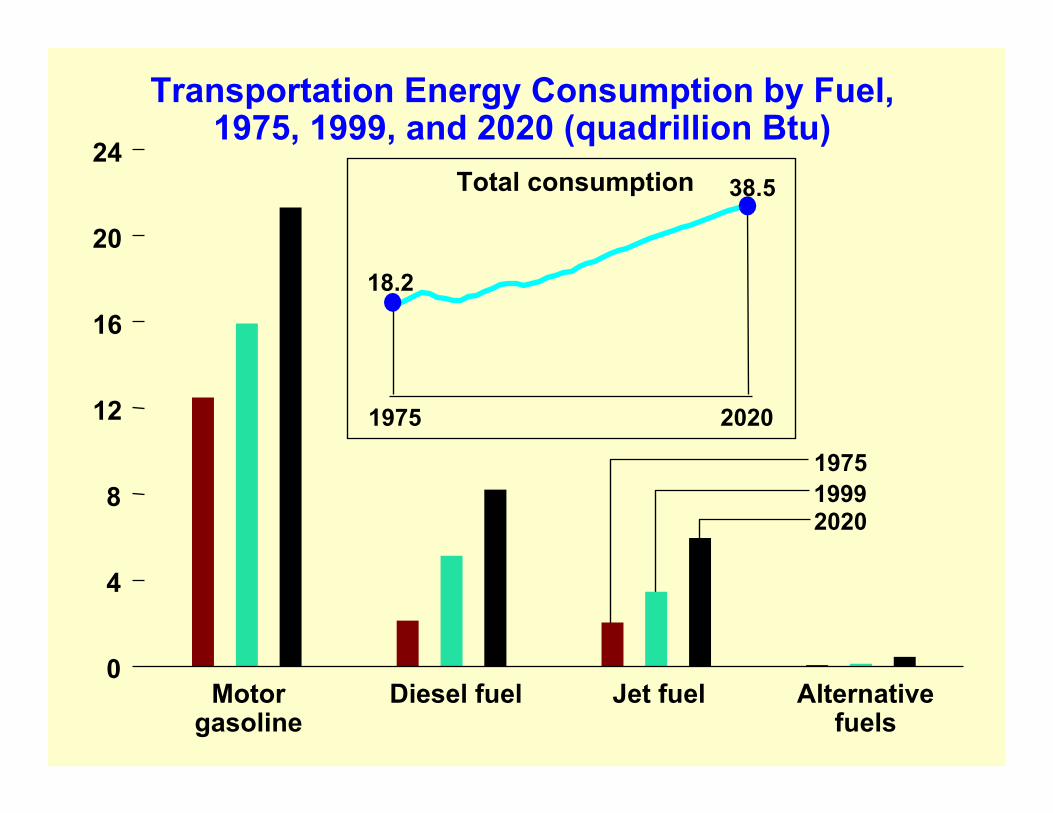
Transportation Energy Consumption by Fuel,1975, 1999, and 2020 (quadrillion Btu)
Motorgasoline
Diesel fuel Jet fuel Alternativefuels
0
4
8
12
16
20
24
197519992020
1975 2020
18.2
38.5Total consumption
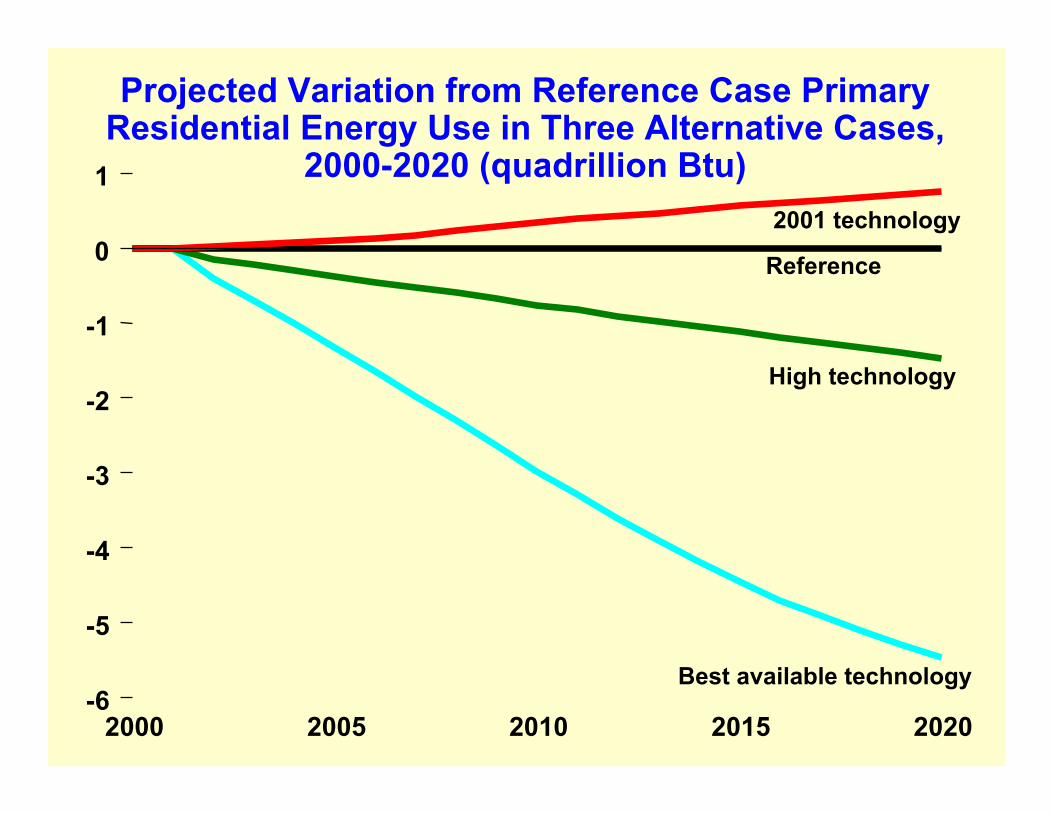
2000 2005 2010 2015 2020
0
1
-1
-2
-3
-4
-5
-6
2001 technology
Best available technology
High technology
Reference
Projected Variation from Reference Case PrimaryResidential Energy Use in Three Alternative Cases,
2000-2020 (quadrillion Btu)
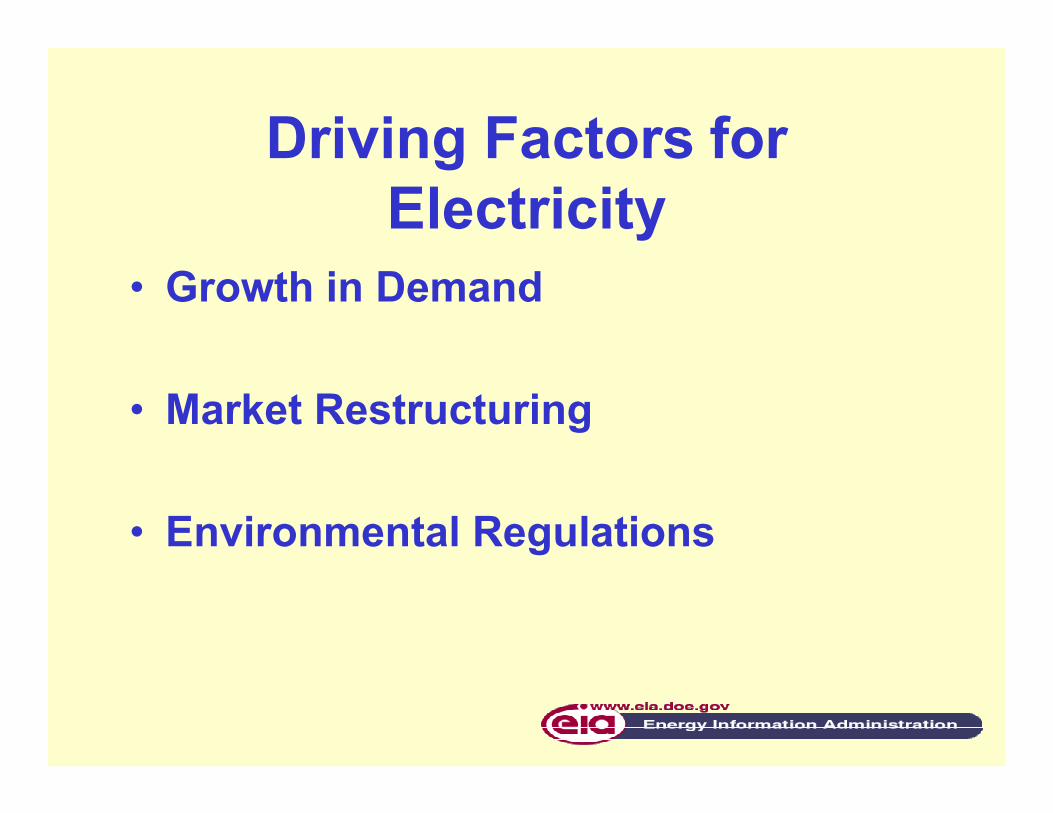
Driving Factors forElectricity
• Growth in Demand
• Market Restructuring
• Environmental Regulations
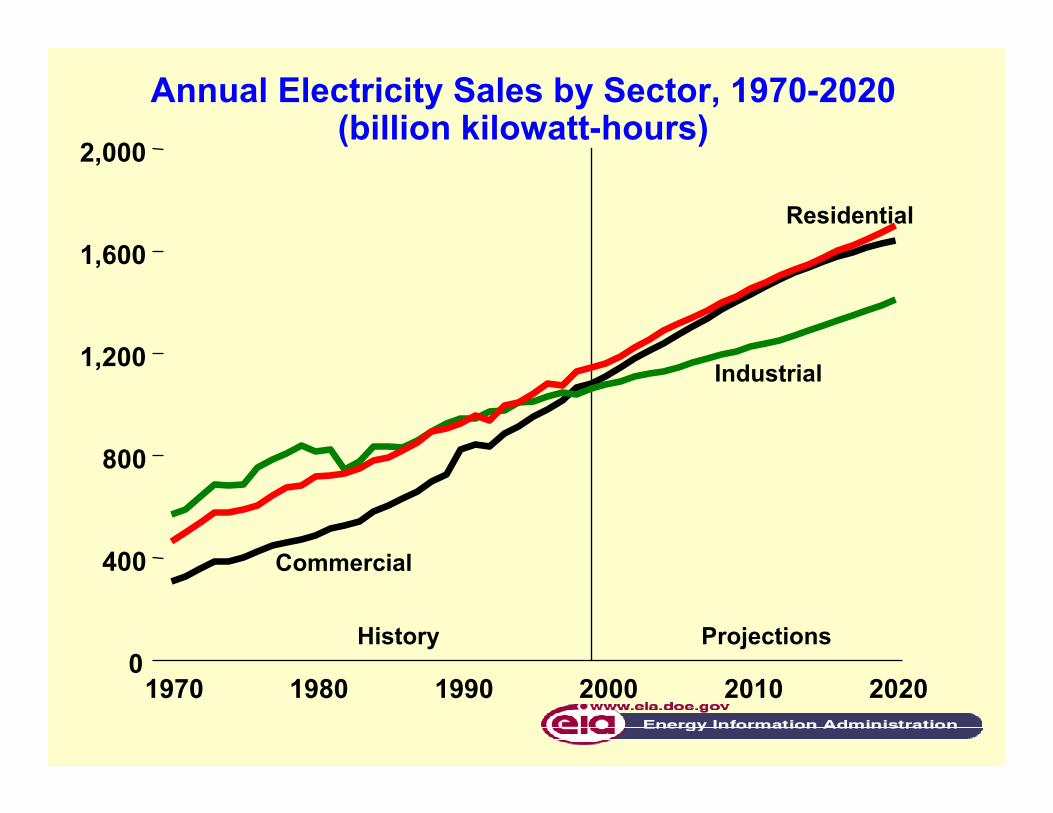
1970 1980 1990 2000 2010 20200
400
800
1,200
1,600
2,000
Commercial
Residential
Industrial
History Projections
Annual Electricity Sales by Sector, 1970-2020(billion kilowatt-hours)
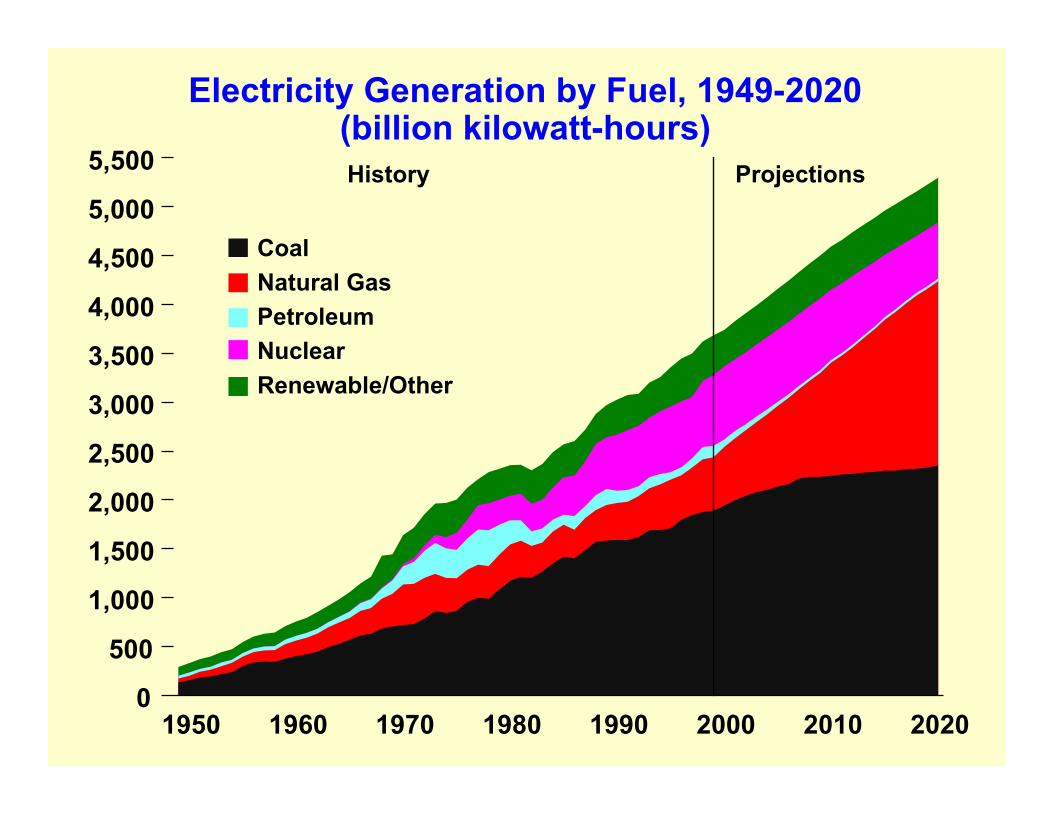
1950 1960 1970 1980 1990 2000 2010 20200
500
1,000
1,500
2,000
2,500
3,000
3,500
4,000
4,500
5,000
5,500
Coal Natural Gas Petroleum Nuclear Renewable/Other
History Projections
Electricity Generation by Fuel, 1949-2020(billion kilowatt-hours)
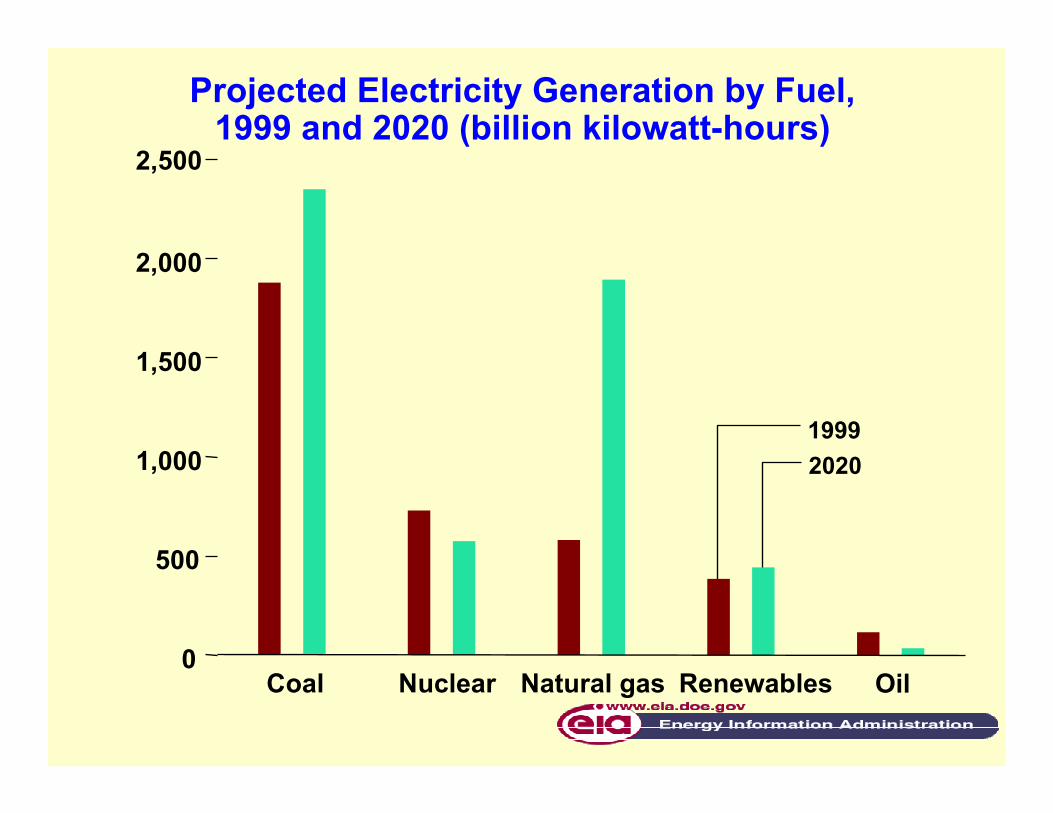
19992020
Coal Nuclear Natural gas Renewables Oil0
500
1,000
1,500
2,000
2,500
Projected Electricity Generation by Fuel,1999 and 2020 (billion kilowatt-hours)
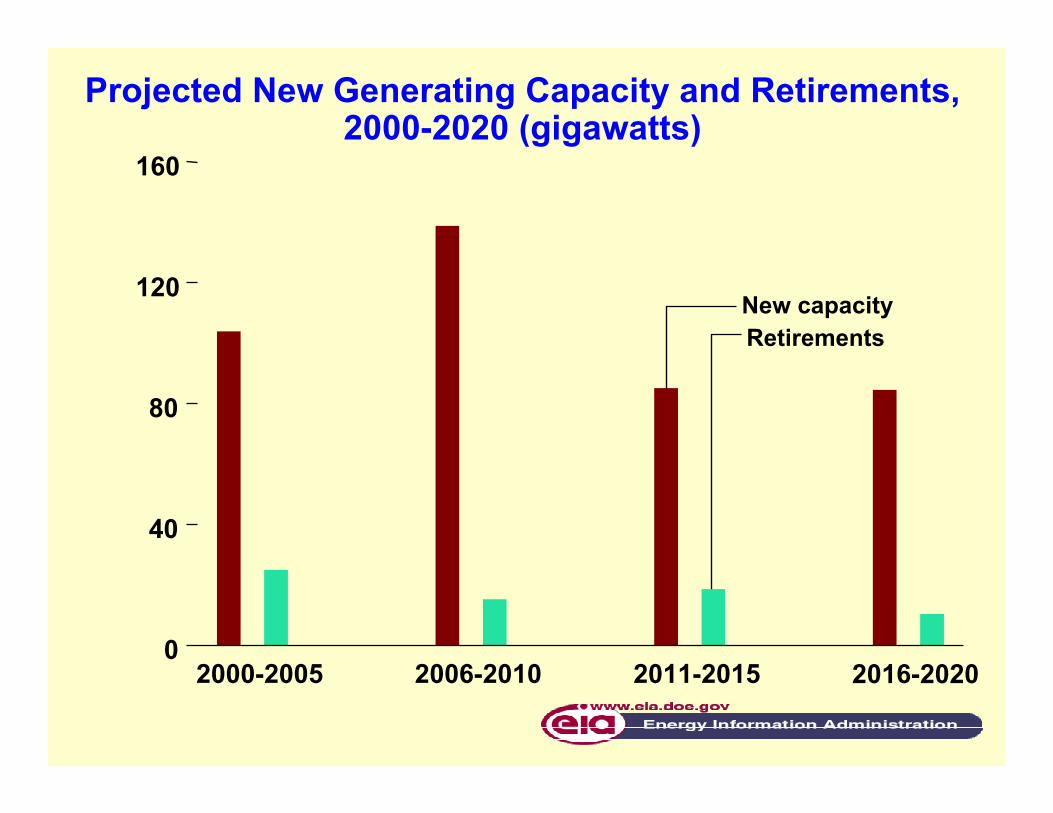
2000-2005 2006-2010 2011-2015 2016-20200
40
80
120
160
New capacityRetirements
Projected New Generating Capacity and Retirements,2000-2020 (gigawatts)
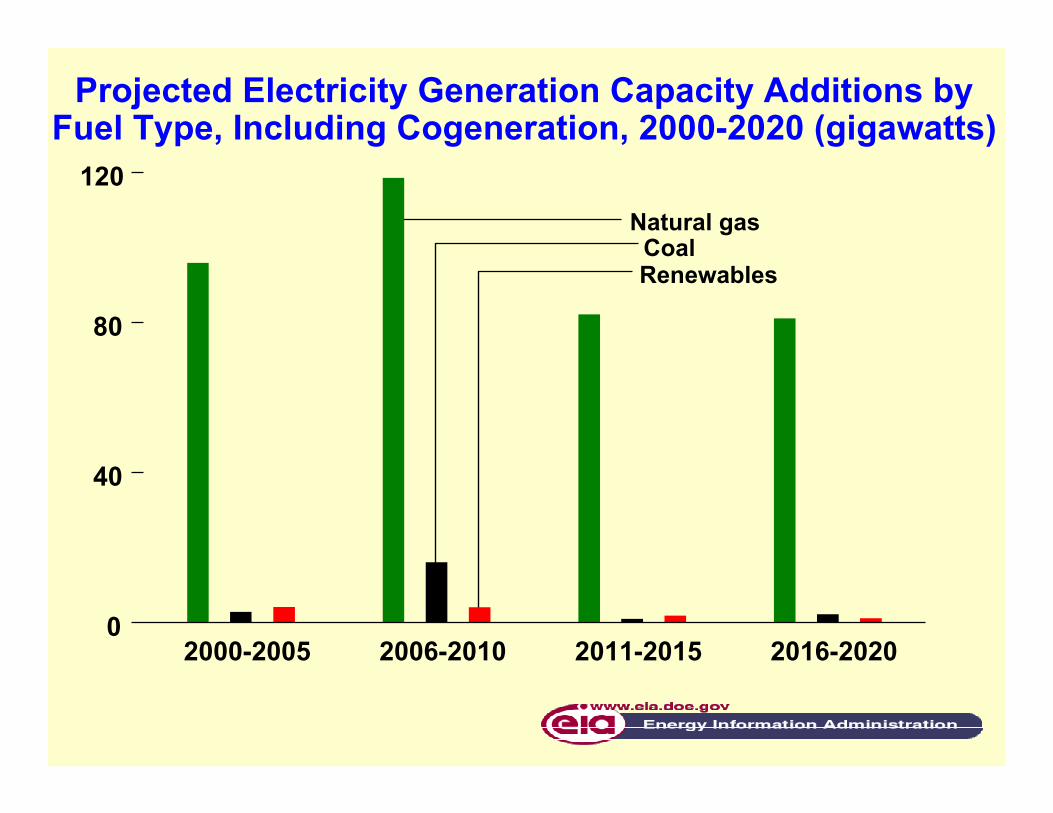
2000-2005 2006-2010 2011-2015 2016-20200
40
80
120Natural gas
CoalRenewables
Projected Electricity Generation Capacity Additions byFuel Type, Including Cogeneration, 2000-2020 (gigawatts)
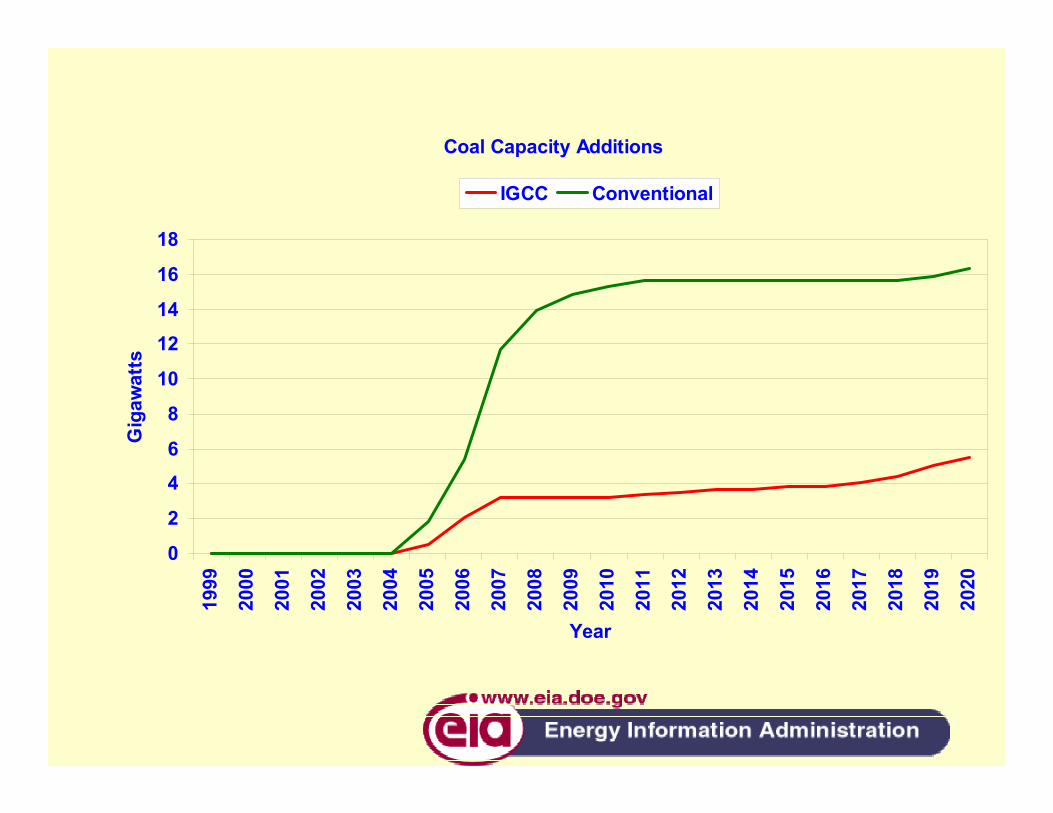
Coal Capacity Additions
0
2
46
8
10
1214
16
1819
99
2000
2001
2002
2003
2004
2005
2006
2007
2008
2009
2010
2011
2012
2013
2014
2015
2016
2017
2018
2019
2020
Year
Gig
awat
ts
IGCC Conventional
2000-2005 2006-20102011-2015 2016-2020
0102030
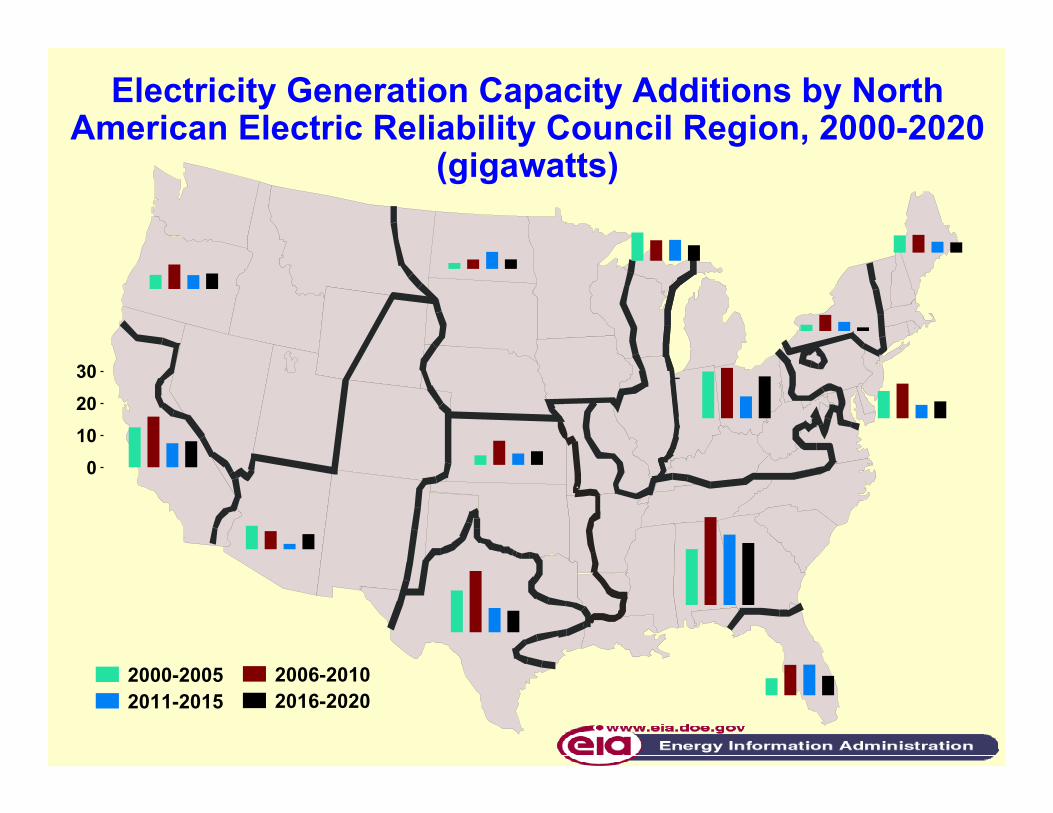
Electricity Generation Capacity Additions by NorthAmerican Electric Reliability Council Region, 2000-2020
(gigawatts)
Low growth Reference High growth0
50
100
150
200
250
Combined cycleTurbines
RenewablesCoal steam
Projected Cumulative New Generating Capacity byTechnology Type in Three Economic Growth Cases,
1999-2020 (gigawatts)
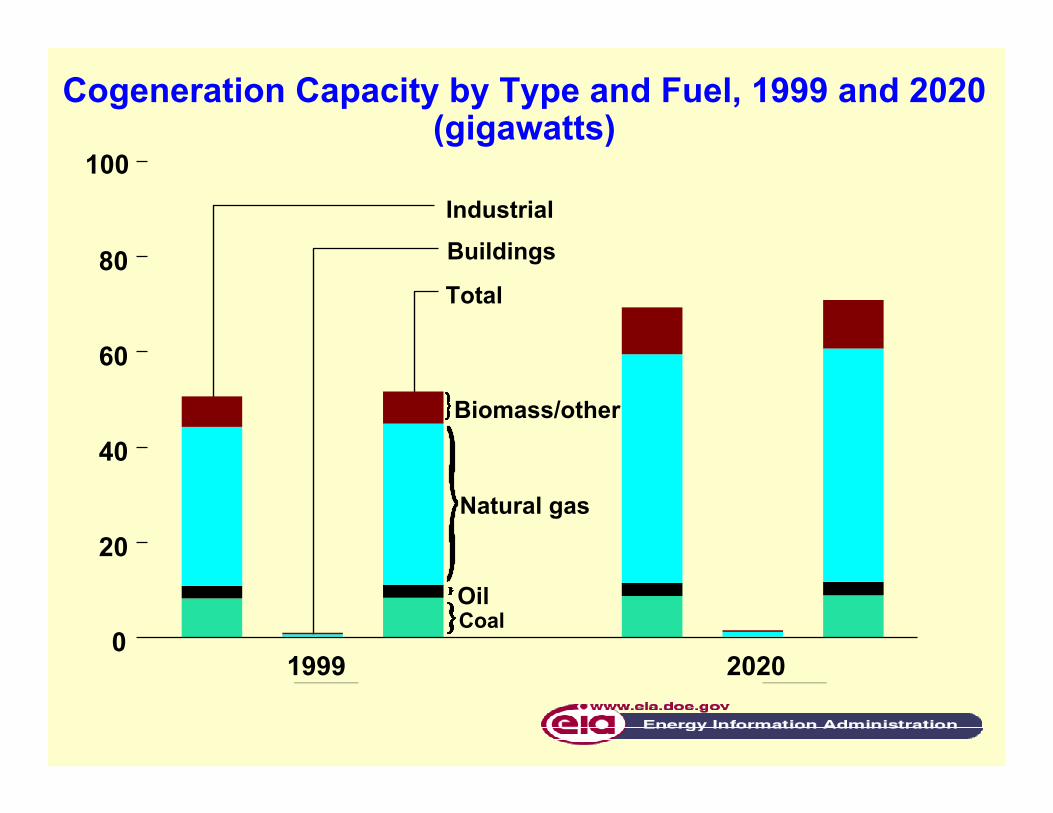
100
1999 20200
20
40
60
80
OilCoal
Natural gas
Biomass/other
IndustrialBuildings
Total
Cogeneration Capacity by Type and Fuel, 1999 and 2020(gigawatts)
10
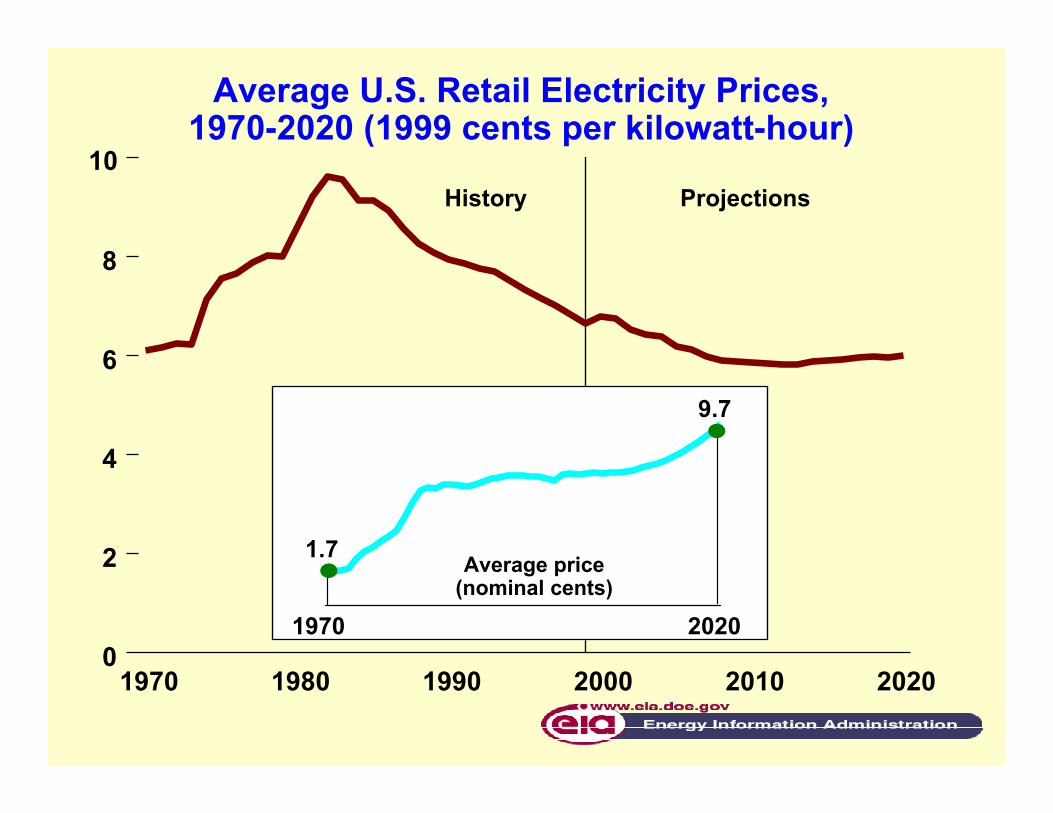
1970 1980 1990 2000 2010 20200
2
4
6
8
History Projections
1970 2020
Average price(nominal cents)
1.7
9.7
Average U.S. Retail Electricity Prices,1970-2020 (1999 cents per kilowatt-hour)
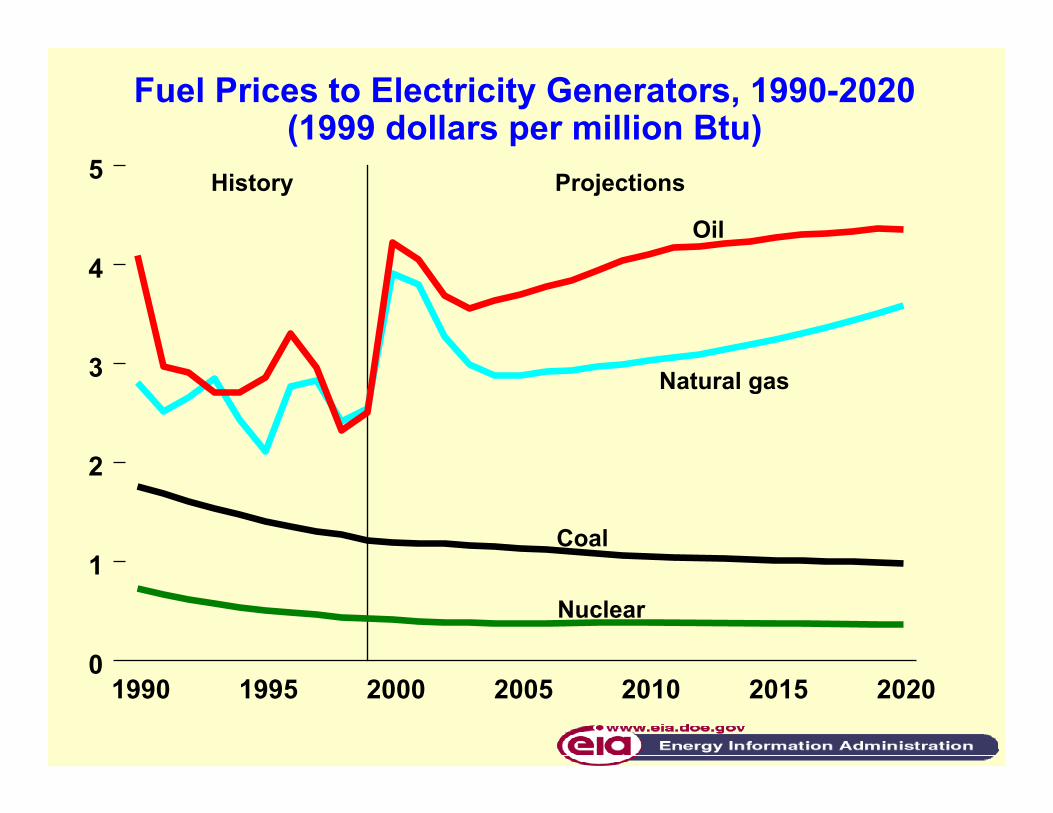
1990 1995 2000 2005 2010 2015 20200
1
2
3
4
5
Coal
Natural gas
History Projections
Oil
Nuclear
Fuel Prices to Electricity Generators, 1990-2020(1999 dollars per million Btu)
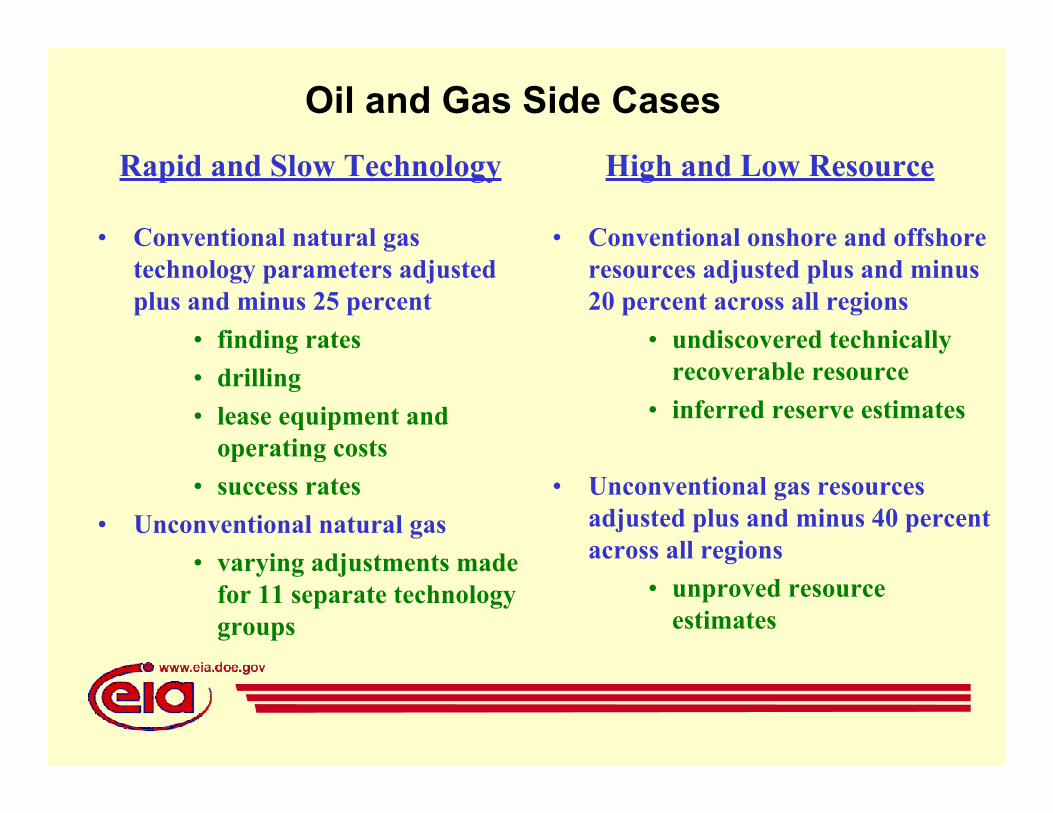
Rapid and Slow Technology High and Low Resource
• Conventional natural gastechnology parameters adjustedplus and minus 25 percent
• finding rates• drilling• lease equipment and
operating costs• success rates
• Unconventional natural gas• varying adjustments made
for 11 separate technologygroups
• Conventional onshore and offshoreresources adjusted plus and minus20 percent across all regions
• undiscovered technicallyrecoverable resource
• inferred reserve estimates
• Unconventional gas resourcesadjusted plus and minus 40 percentacross all regions
• unproved resourceestimates
Oil and Gas Side Cases
$0
$1
$2
$3
$4
$5
0 10 20 30 40$0
$1
$2
$3
$4
$5
0 10 20 30 40$0
$1
$2
$3
$4
$5
0 10 20 30 40$0
$1
$2
$3
$4
$5
0 10 20 30 40$0
$1
$2
$3
$4
$5
0 10 20 30 40$0
$1
$2
$3
$4
$5
0 10 20 30 40
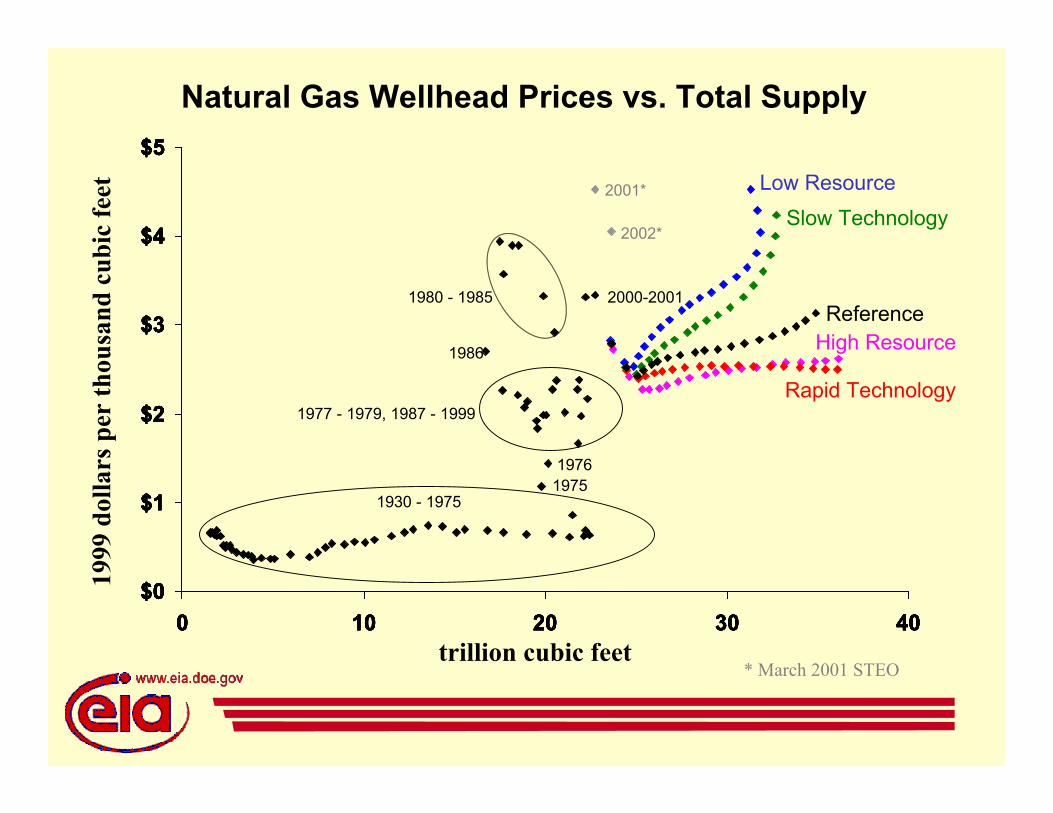
1977 - 1979, 1987 - 1999
Natural Gas Wellhead Prices vs. Total Supply
Slow TechnologyLow Resource
High Resource
Rapid Technology
Reference1980 - 1985
1930 - 19751975
1986
2000-2001
1999
dol
lars
per
thou
sand
cub
ic fe
et
trillion cubic feet
2002*
2001*
* March 2001 STEO
1976
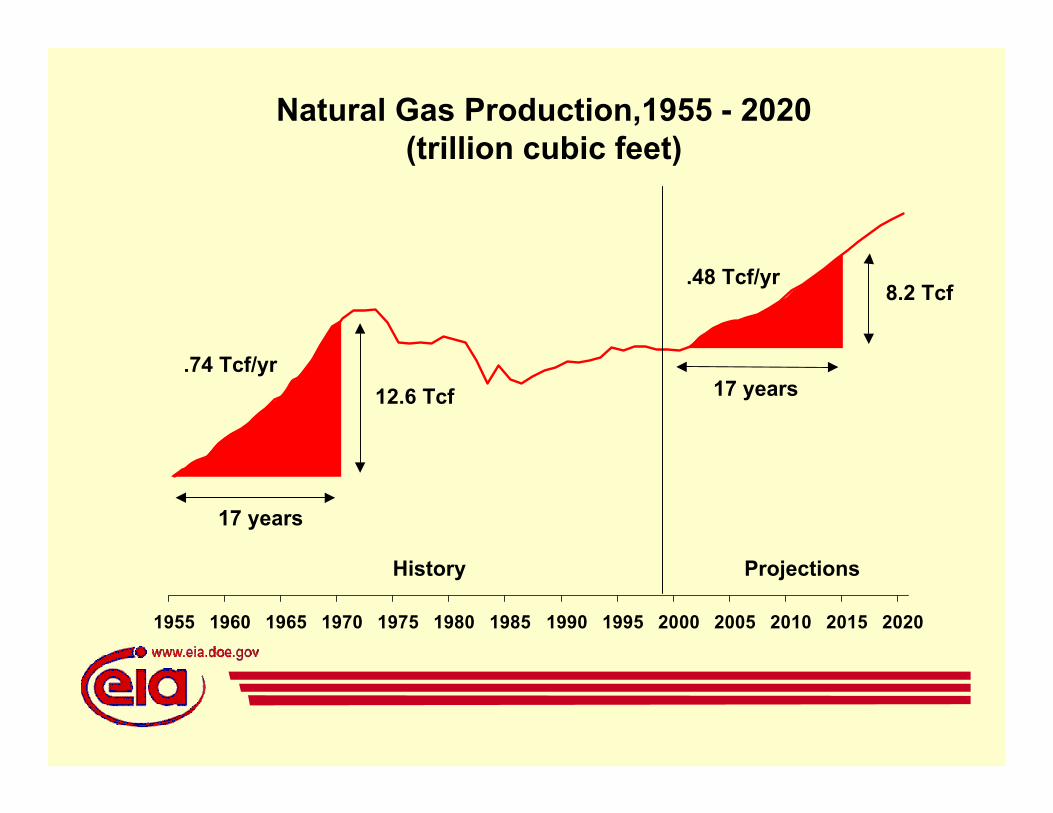
Natural Gas Production,1955 - 2020(trillion cubic feet)
1955 1960 1965 1970 1975 1980 1985 1990 1995 2000 2005 2010 2015 2020
History Projections
17 years
17 years12.6 Tcf
8.2 Tcf
.74 Tcf/yr
.48 Tcf/yr
0
0.5
1
1.5
2
2.5
3
3.5
4
1990 1995 2000 2005 2010 2015 2020
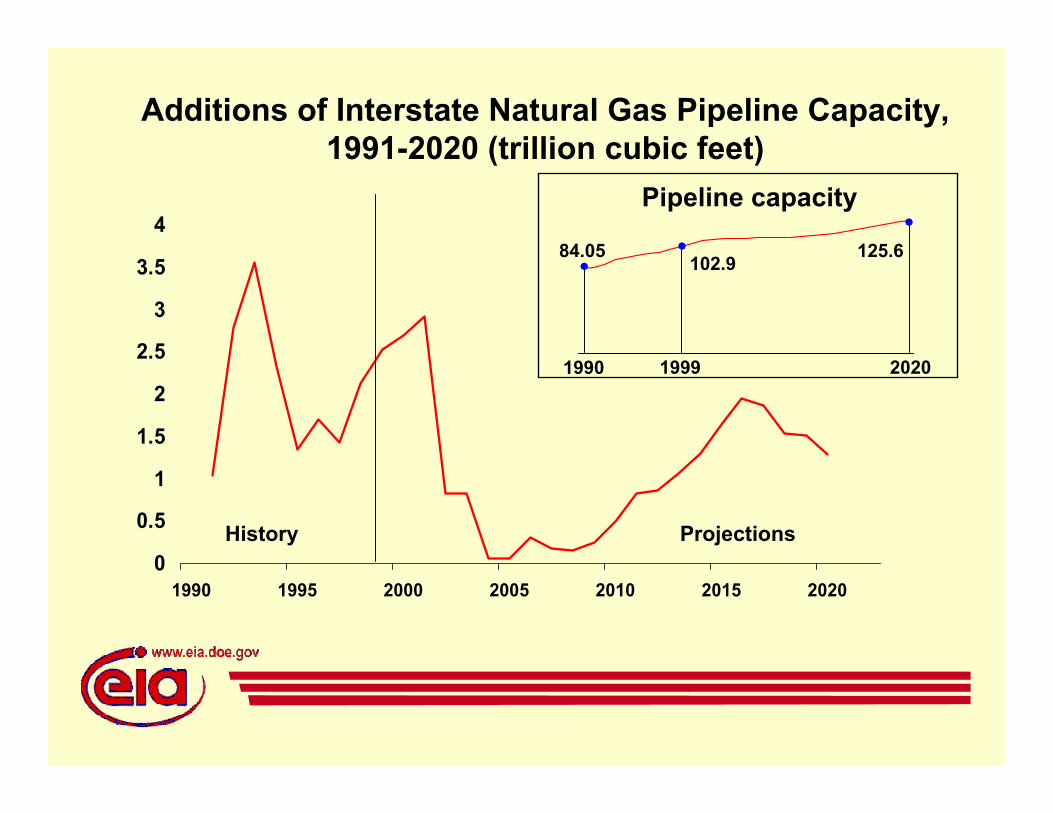
Additions of Interstate Natural Gas Pipeline Capacity,1991-2020 (trillion cubic feet)
History Projections
1990 1999 2020
84.05 102.9 125.6
Pipeline capacity
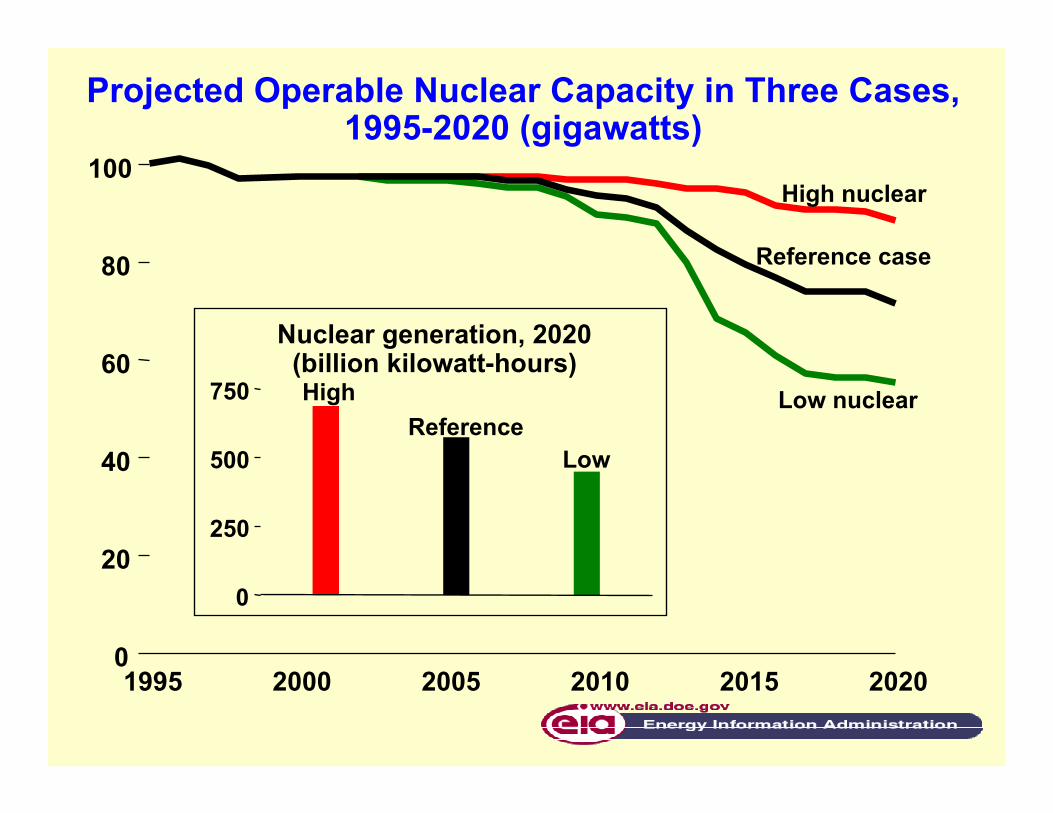
Projected Operable Nuclear Capacity in Three Cases,1995-2020 (gigawatts)
1995 2000 2005 2010 2015 20200
20
40
60
80
100
Reference case
Low nuclear
High nuclear
0
250
500
750
Nuclear generation, 2020(billion kilowatt-hours)
LowReference
High
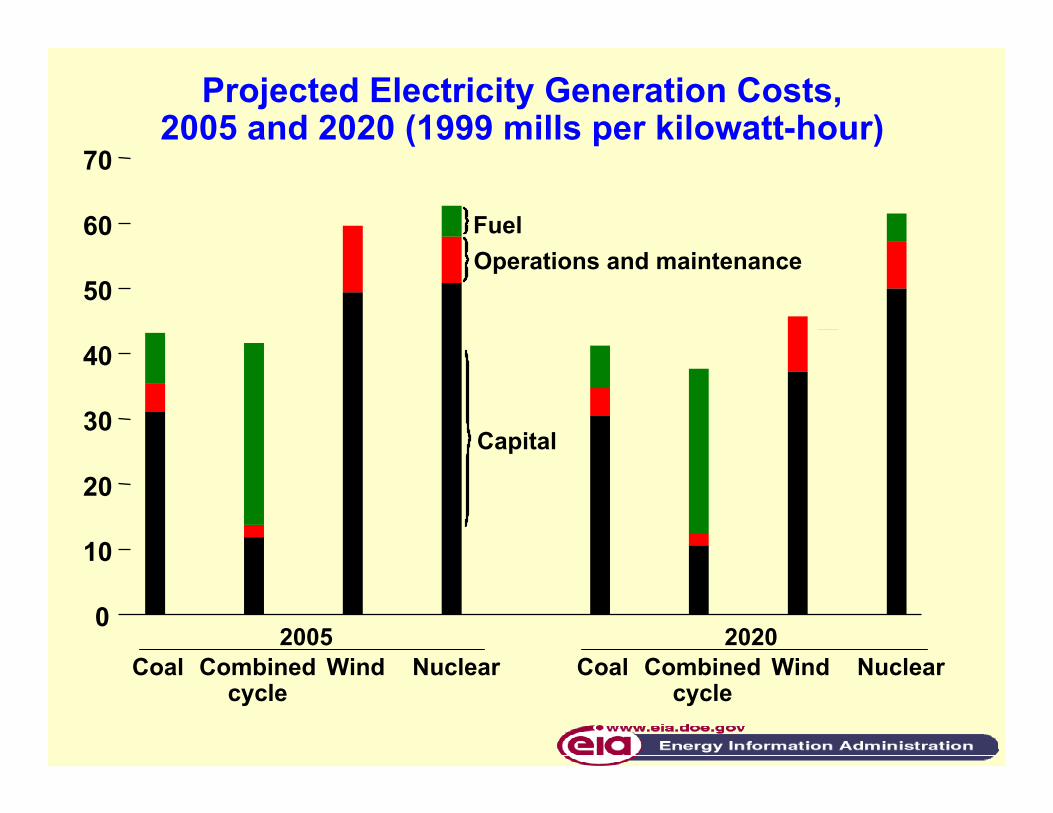
Projected Electricity Generation Costs,2005 and 2020 (1999 mills per kilowatt-hour)
Coal Combinedcycle
2005Wind Nuclear Coal Combined
cycle
2020Wind Nuclear
0
10
20
30
40
50
60
70
Capital
FuelOperations and maintenance
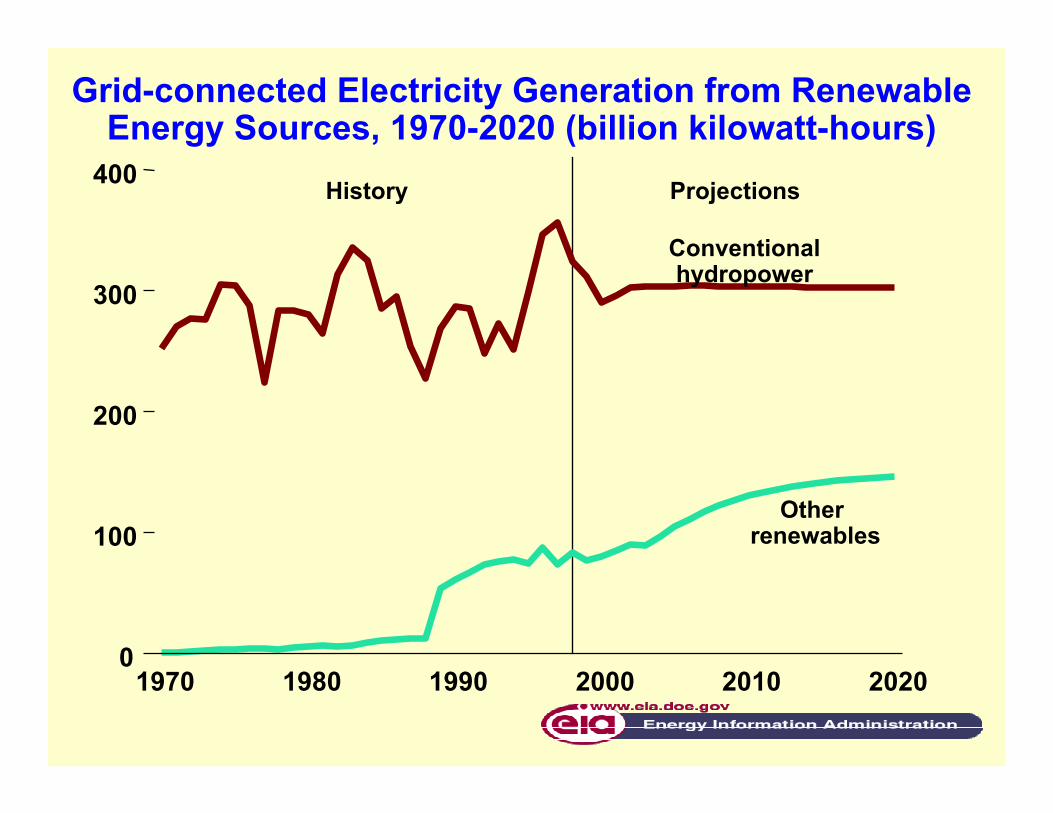
1970 1980 1990 2000 2010 20200
100
200
300
400
Conventionalhydropower
Other renewables
History Projections
Grid-connected Electricity Generation from RenewableEnergy Sources, 1970-2020 (billion kilowatt-hours)
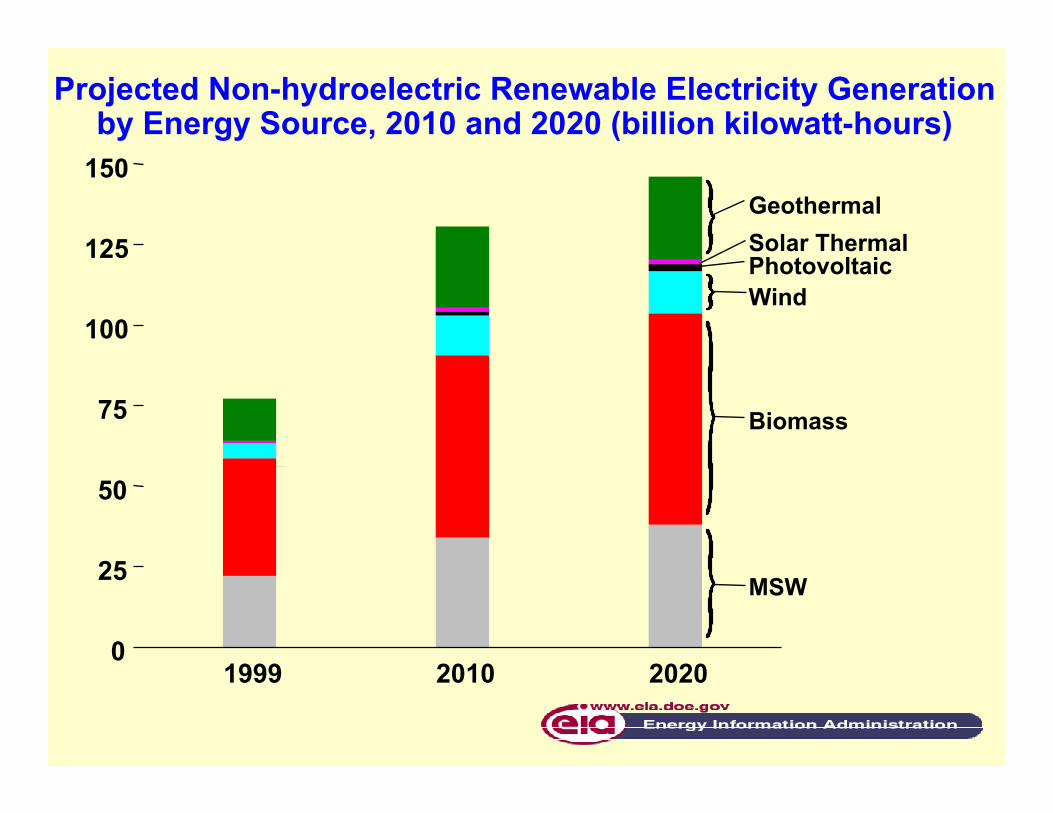
Projected Non-hydroelectric Renewable Electricity Generationby Energy Source, 2010 and 2020 (billion kilowatt-hours)
1999 2010 20200
25
50
75
100
125
150
MSW
Biomass
WindPhotovoltaicSolar ThermalGeothermal
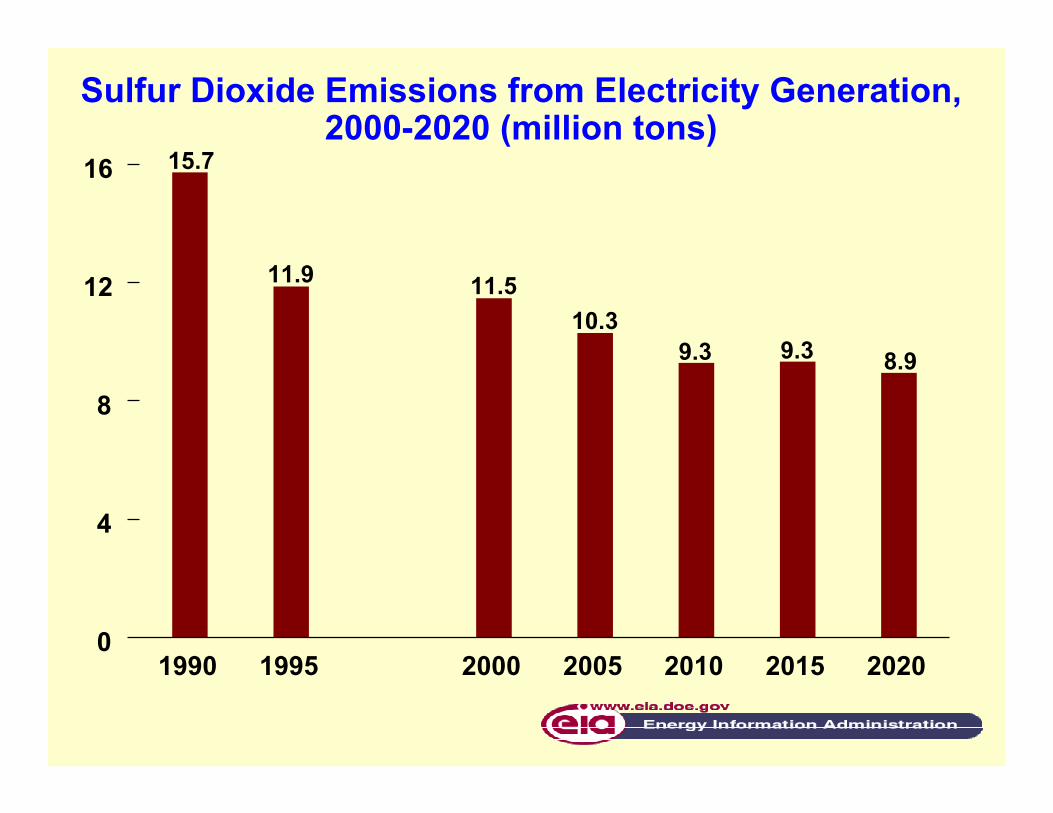
1990 1995 2000 2005 2010 2015 20200
4
8
12
16 15.7
11.9 11.510.3
9.3 9.3 8.9
Sulfur Dioxide Emissions from Electricity Generation,2000-2020 (million tons)
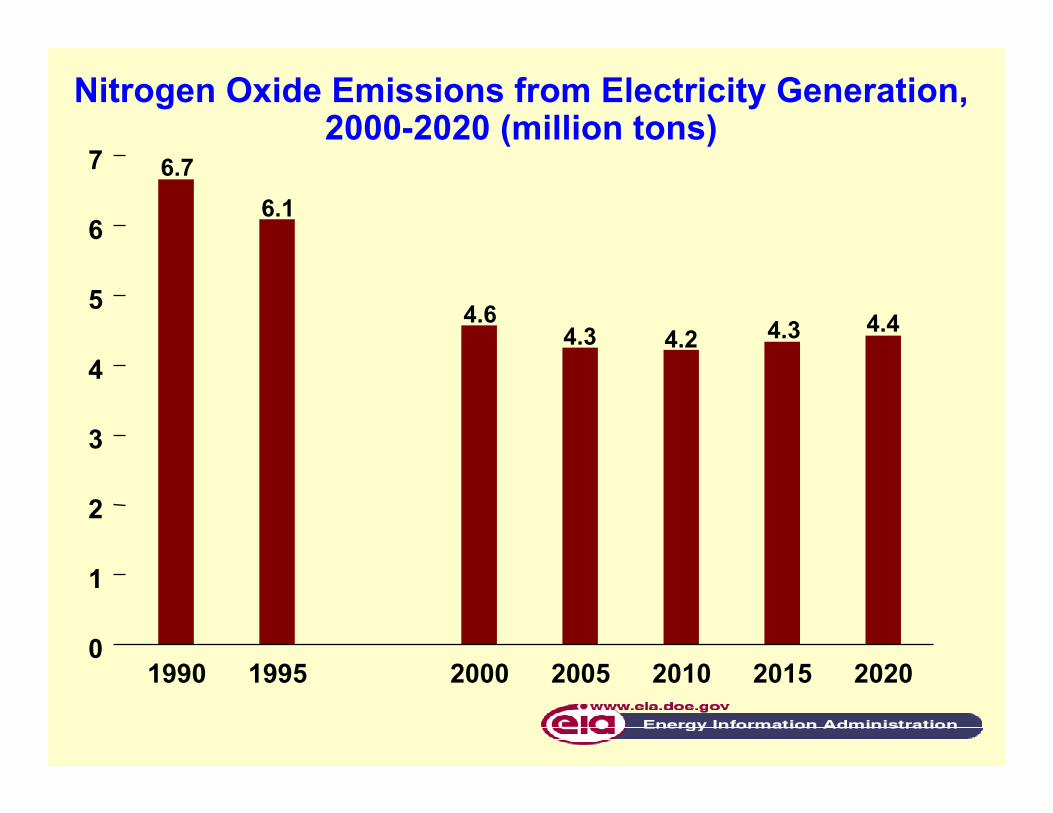
1990 1995 2000 2005 2010 2015 20200
1
2
3
4
5
6
7 6.76.1
4.64.3 4.2 4.3 4.4
Nitrogen Oxide Emissions from Electricity Generation,2000-2020 (million tons)
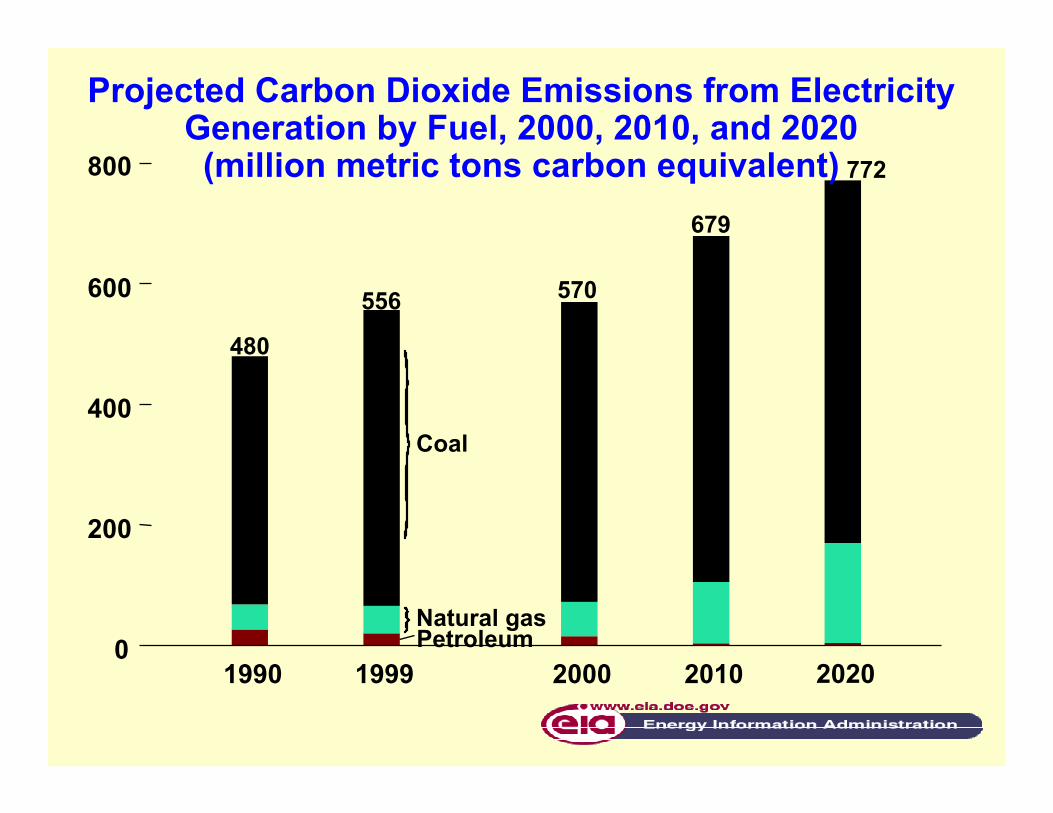
800 772
1990 1999 2000 2010 20200
200
400
600
Coal
Natural gasPetroleum
480
556 570
679
Projected Carbon Dioxide Emissions from ElectricityGeneration by Fuel, 2000, 2010, and 2020(million metric tons carbon equivalent)
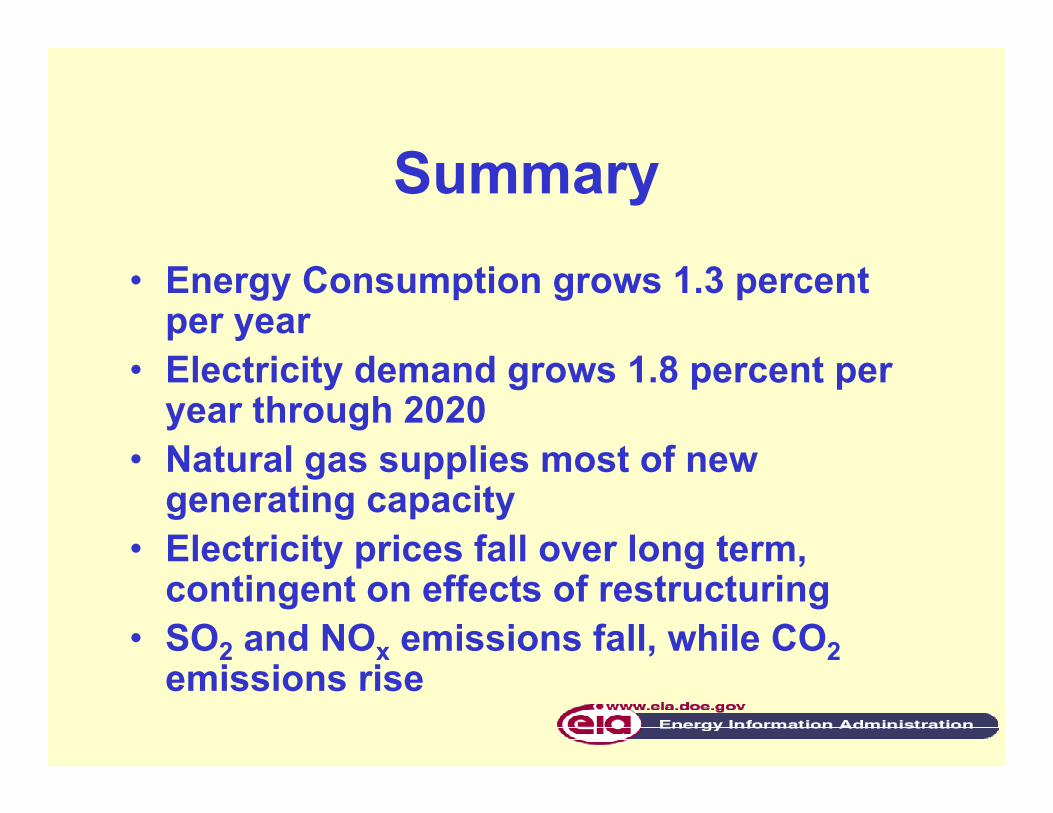
Summary• Energy Consumption grows 1.3 percent
per year• Electricity demand grows 1.8 percent per
year through 2020• Natural gas supplies most of new
generating capacity• Electricity prices fall over long term,
contingent on effects of restructuring• SO2 and NOx emissions fall, while CO2
emissions rise