Embed Size (px)
Citation preview

The outlook for UK mailvolumes to 2023
PwC Strategy & Economics
15 July 2013

PwC
Important notice
This document has been prepared by PricewaterhouseCoopers LLP (“PwC” or “we”) for Royal Mail Group and solely for thepurpose and on the terms agreed with Royal Mail Group. We accept no liability (including for negligence) to anyone else inconnection with this document.
This document has been made publicly available for the purposes of general guidance on matters of interest only, and does notconstitute professional advice. You should not act upon the information contained in this document without obtaining specificprofessional advice.
Information in this document is obtained or derived from a variety of sources. PwC has not sought to establish the reliability ofthose sources or verify all of the information so provided. No representation or warranty of any kind (whether express or implied)is given by PwC to any person (except to Royal Mail Group under the relevant terms of the Engagement) as to the accuracy orcompleteness of the report, and, to the extent permitted by law, PwC, its members, employees and agents do not accept or assumeany liability, responsibility or duty of care for any consequences of anyone else acting, or refraining to act, in reliance on theinformation contained in this document or for any decision based on it.
2Outlook for UK mail volumes to 2023

PwC
Objectives
• Royal Mail Group commissioned PwC to provide anindependent view on the long-term outlook for UK mailvolumes
• Our projections use information and analysis from a varietyof sources, including Royal Mail Group
• However, our conclusions have been reached independently.Our projections are based on our own insights and analysis,supported by an extensive programme of interviews, surveysand industry research
• We have projected mail volumes (letters and parcels) on anannual basis over the period 2013 to 2023
PwC was asked todevelop a view onthe long-termoutlook for UK mailvolumes (lettersand parcels)
Outlook for UK mail volumes to 20233

PwC
We have made a number of simplifying assumptions about thefuture market structure
Key underlying assumptions
We assume that the overall structure of the UK mail market (e.g. delivery chain and model) will not change significantlyover the projection period
We assume that additional regulatory change during the projection period will have a limited impact on the structureand operations of the mail market. We assume there will be no material change to the Universal Service Obligation
We assume price changes will be marginally higher than RPI over the projection period
We have also used a number of macroeconomic assumptions in our modelling
Source 2013 2014 2015-2023
GDP growth, % p.a. Based on PwCeconomic forecasts
1.2 2.1 2.4
Growth in number ofhouseholds, % p.a.
Based on PwC andONS projections
1.0 1.0 1.0
Source: PwC Economic forecasts, Office for National Statistics (ONS)
Outlook for UK mail volumes to 20234
2
1
3
PwC
Our projection incorporates insights gained from extensivecustomer interviews, surveys, independent research andinternational comparisons
Outlook for UK mail volumes to 20235
UsedInternationalbenchmarks
Applied PwCcommercialand economicexpertise andindustry researchfrom a range ofsources
Segmented mailinto majorcategories toidentify keydrivers
Surveyed
consumersandprivate and publicsector organisation
Interviewedmail
senders acrossall major mailsegments
100+
2,000+
1,000+
20

PwC
Executive SummarySection 1
Outlook for UK mail volumes to 20236

PwC
• The mail delivered in the UK is highly varied and the total mailbag is highlyfragmented
• UK total inland letter volumes declined by 3.1% p.a. from 2005 to 2008,and by 6.3% p.a. from 2008-2013, as the economic downturn increased therate of decline
• UK parcel volumes grew by 4.3% p.a. from 2005 to 2008 and by 3.7% p.a.from 2008-2013, mainly reflecting increasing use of online shopping byconsumers
Key messages
Outlook for UK mail volumes to 20237
UK mail volumes have declined since 2004
The main driver of mail declines has been electronicsubstitution of paper communication
We expect the decline of letter volumes to continue but at aslower rate over the projection period
Our projection suggests letter volume declines of c.4% p.a.and parcel growth of c.3% p.a. from 2013 to 2023
• The principal cause of the overall mail volume decline has been thesubstitution of paper communication by electronic methods(e-substitution)
• However, the maturity of this transformation varies widely within differentsegments of the mail bag
- Some segments are already substantially online while others are justbeginning this transition
- The maximum likely level of electronic substitution also varies betweensegments depending on both recipients’ and senders’ attitudes toelectronic communication. This is affected by a range of factors such asinternet access and age (mail recipients) and mail costs (mail senders)
• We expect the rate of e-substitution in letters to slow gradually over thenext 10 years. In the initial years of e-substitution consumers with a highpropensity to switch move rapidly online, as do many lower-valuecommunications
• As time goes on, the remaining base becomes more skewed towards ‘paper-loyal’ consumers and those being sent higher value communications. Weexpect demographic changes and technology evolution to have a lessprominent impact on this segment
• A return to GDP growth as the recession ends is likely to increase overallcommunication volumes, partially offsetting the declining share of lettersin overall communication, particularly for Direct Mail
• Declines in letter volumes will also continue to be partially offset by robustgrowth of parcels traffic, driven by specific categories of online shopping
• We therefore expect the overall UK inland mail volumes to continue todecline albeit more slowly than we have seen historically
- Letters: 5% p.a. decline 2013-18; 4% p.a. decline 2018-23- Parcels: 3% p.a. increase 2013-18; 2% p.a. increase 2018-23- Overall: 4% p.a. decline 2013-18; 3% p.a. decline 2018-23
• Despite the slowing rate of decline in overall mail, these projections imply asignificant reduction from current levels of paper communication by 2023,as well as a substantial change in mix (we believe parcels will double theirshare of the mail bag to c.21%)
• We have identified a number of risks to our projections which mightincrease the rate of mail decline over the projection period. The potentialimpact of these is illustrated in Section 5 of the report
Section 1 – Executive Summary
1
2
3
4

PwC
UK inland letters and parcels market volumes - past, present, andfuture
8Outlook for UK mail volumes to 2023 •
20232005 2012
c.13.8bnitems
Note: International mail volumes not included due to limited data availability for the historical period. Please refer to the later section for projections by mail segmentSource: Royal Mail data, PwC analysis
54%31%
9%6%
56%32%
6%6%
50%
38%
6%6%
Transactional mail
Direct mail
Publishing mail
Social mail
c.1.7bnitems
UK
lett
er
sm
ar
ke
t
c.19.7bnitems
c.1.3bnitems
UK
pa
rc
els
ma
rk
et
c.2.3bnitems
c.8.3bnitems
Section 1 – Executive Summary

PwC
0
50
100
150
200
250
198
1
198
2
198
3
198
4
198
5
198
6
198
7
198
8
198
9
199
0
199
1
199
2
199
3
199
4
199
5
199
6
199
7
199
8
199
9
20
00
20
01
20
02
20
03
20
04
20
05
20
06
20
07
20
08
20
09
20
10
20
11
20
12
Ind
ex
ed
ma
ilv
olu
me
s(1
98
1=10
0)
UK overall inland mail volumes, 1981-2012
From 2004, electronic substitution ofmail began to exceed macro driven mailvolume growth, leading to mail volumedeclines of 2.6% p.a. from 2005 to 2008
Mail volumes peaked in 2004 after longrun growth of 3.7% p.a. between 1981and 2004
Since the recession, macro factors (suchas GDP) have also driven lower mailvolumes with mail declines of 5.3% p.a.from 2008 to 2012
Total inland mail volumes peaked in 2004 and have since declined,with an acceleration in mail declines since the start of the recession
Outlook for UK mail volumes to 20239
Source: Royal Mail data, PwC analysis
1
1
2
2 3
3
Section 1 – Executive Summary

PwCOutlook for UK mail volumes to 2023
10
Section 1 – Executive Summary
Forecast
We expect UK letter volume declines to continue, albeit at a slowerrate, while parcel volumes will continue to grow
• We expect the rate of letter volume declines toreduce over the projection period as a result of:
- A return to the trend rate of GDP growthresulting in increased overall communicationvolumes (this will particularly affect Direct Mailwhich is highly cyclical)
- Slowdown in letter volume declines in othersegments, such as financial statements, as abaseline of non-online users or less willing onlineusers is reached
Note: Total inland letter volumes inclusive of Transactional, Social, Direct Mail and Publishing mail volumes. International letter volumes not included due to limited data availability for the historicalperiod. Please refer to the later section for projections by mail segmentSource: Royal Mail data, PwC analysis
0
20
40
60
80
100
120
20
05
20
06
20
07
20
08
20
09
20
10
20
11
20
12
20
13
20
14
20
15
20
16
20
17
20
18
20
19
20
20
20
21
20
22
20
23
Ind
ex
ed
ma
ilv
olu
me
s(2
00
5=
100
)
Total inland letters historical and projected volumes, 2005-23
CAGR2005-08
CAGR2008-13
CAGR2013-18
CAGR2018-23
(3.1%) (6.3%) (4.9%) (3.8%)
Forecast
0
20
40
60
80
100
120
140
160
180
200
20
05
20
06
20
07
20
08
20
09
20
10
20
11
20
12
20
13
20
14
20
15
20
16
20
17
20
18
20
19
20
20
20
21
20
22
20
23
Ind
ex
ed
ma
ilv
olu
me
s(2
00
5=
100
)
Total inland parcels historical and projected volumes, 2005-23
CAGR2005-08
CAGR2008-13
CAGR2013-18
CAGR2018-23
4.3% 3.7% 3.3% 2.1%
• The growth in parcel volumes is expected to continuethroughout the projection period
• We expect some slow down in the rate of growth inthe later years, mainly due to:
- The continued partial digital substitution of someproduct categories, especially Books
- The gradual slowdown in the growth rate ofonline shopping

PwCOutlook for UK mail volumes to 2023
11
Section 1 – Executive Summary
Our e-substitution scenario analysis suggests that in a negativecase, the total cumulative decline could be 5ppt below our base-caseby 2015, increasing to c.12ppt by 2023
• We have modelled upside and downside e-substitution scenarios to demonstrate thepotential impact on our projection of some of therisks we have identified
• These scenarios are based on changing a numberof assumptions underlying our individual mailsegment projections to create high and low casesfor each mail segment
− These are not ‘worst case’ scenarios, but represent plausible alternative outcomes
− Upside scenarios are based on factors such as a larger baseline of consumers and businessesretaining paper invoicing and slowerGovernment digital uptake while downsidescenarios are based on factors such as fasteradoption of paperless bank statements andslower parcel volume growth
• We have used Monte Carlo analysis to illustratethe range of possible outcomes from combiningthese scenarios (reflecting the fact that it isunlikely that all downsides will occur together)
• The scenarios do not include differing GDPassumptions (illustrated later in the report) andalso exclude large one off events which couldsignificantly affect mail volumes. Examples ofthese events are discussed in the ‘Main risks toprojection’ section of the report
0
20
40
60
80
100
120
2012 2013 2014 2015 2016 2017 2018 2019 2020 2021 2022 2023
Ind
ex
ed
ma
ilv
olu
me
s(2
012
=10
0)
Total inland mail projected scenarios, 2012-23
Source: Royal Mail data, PwC analysis

PwC
Historical trends and contextSection 2
Outlook for UK mail volumes to 202312

PwC
-4.0%
-2.0%
0.0%
2.0%
4.0%
6.0%
8.0%
10.0%
81/
82
82
/83
83
/84
84
/85
85
/86
86
/87
87/
88
88
/89
89
/90
90
/91
91/
92
92
/93
93
/94
94
/95
95
/96
96
/97
97/
98
98
/99
99
/00
00
/01
01/
02
02
/03
03
/04
04
/05
05
/06
06
/07
07/
08
Yo
Yg
ro
wth
(%)
Actual mail growth vs. modelled growth
Modelled growth Actual growth
Historically mail volumes closely correlated with socio-economicdrivers such as GDP growth, but in recent years technology and e-substitution have become important constraints on growth
“Tech
no
log
yw
edg
e”
• Historically econometric models have been good predictors ofmail growth. But from the early 2000s structural changes (such astechnology and e-substitution) have led to a gap between themodelled growth based on socio-economic factors and actual mailgrowth, sometimes referred to as the "technology wedge”
• While we still expect socio-economic factors to be importantdrivers of mail in the future, forecasting models need to makeallowances for these significant and ongoing trends
Outlook for UK mail volumes to 202313
Section 2 – Historical trends and context
Source: Royal Mail data, PwC analysis
Illustrative

PwC
0
100
200
300
400
500
600
700
800
Un
ited
Sta
tes
Net
her
lan
ds
Sw
eden
Un
ited
Kin
gd
om
Fra
nce
Fin
lan
d
Ger
man
y
Can
ada
No
rway
Den
ma
rk
#o
fp
os
tal
ite
ms
pe
rp
er
so
n
Total inland addressed letter volume per person, 2005and 2011
2005 2011
50%
60%
70%
80%
90%
100%
110%
2005 2006 2007 2008 2009 2010 2011
Decline in inland addressed letter volumes per personfrom 2005 to 2011 (2005=100%)
Germany
Finland
Sweden
France
Canada
Netherlands
United States
United Kingdom
Norway
Denmark
Other developed countries have also seen declines in mail volumes,but at widely varying rates...
Note: Mail volumes for each country are submitted by postal operators and therefore may not be entirely comparable depending on survey methodologies, country data forGermany, Sweden and the Netherlands adjusted based on assumed market share of largest postal operatorSource: IPC, PwC analysis
Letter volumes have been declining around the world, with widevariation in rates
Even before the declines started, letter volumes per head and thecomposition sent varied widely
Outlook for UK mail volumes to 202314
Section 2 – Historical trends and context

PwC
• Denmark has seen one of the fastest declines in physicalmail volumes
• The c.50% decline in addressed inland mail between 2005and 2011 was mostly the result of a decline in priority orstandard addressed mail
• The main driver of the decline was the continued push bythe government to move significant volumes ofcommunication online. The government is currently in theprocess of implementing an ambitious digital strategy tomake all government interactions paperless by 2015
• In 2005, Germany had a lower level of mail items per capitathan the UK and has experienced one of the slowest declinesamong developed countries
• The composition of the German mail bag was very differentfrom the UK. In 2005, Germany sent c.84 pieces of directmail per capita vs. 103 per capita in UK. Between 2005 and2011, UK direct mail declined by c.24% while German directmail declined by only c.11%. As a result, in 2011, bothcountries sent c.75 pieces of direct mail per person
• Physical transactional mail also appears to be preferred inGermany as there is lower acceptance of ‘digital signatures’
• In addition, the government has given comparatively lowpriority to the digitisation of government mail
...this reflects different initial mail bags, cultural factors andgovernment policies in each country
Outlook for UK mail volumes to 202315
Source: Royal Mail data, IPC, PwC analysis
Denmark Germany
Section 2 – Historical trends and context

PwC
100% 2%
5%
5%
2% (3%) (6%)
(5%)
(2%) (3%)(15%)
(3%)(1%) 76%
Vo
lum
e2
00
5
Tra
nsa
ctio
na
lm
ail
eco
no
mic
imp
act
Gro
wth
inp
arce
ls
Imp
act
of
gro
wth
inn
um
ber
of
ho
use
ho
lds
Imp
act
of
bu
sin
ess
pri
cech
an
ges
&D
SA
*
Dir
ect
Ma
ilec
on
om
icim
pa
ct
E-s
ub
stit
uti
on
of
dir
ect
mai
l
E-s
ub
stit
uti
on
of
ban
kst
ate
men
ts
E-s
ub
stit
uti
on
of
invo
ices
E-s
ub
stit
uti
on
of
new
slet
ters
Oth
ertr
an
sact
ion
alm
ail
dec
lin
e
Oth
erm
ail
dec
lin
e
Dec
lin
ein
soci
al
mai
l(e
-su
b&
pri
ce)
Vo
lum
e2
012
Estimate of macro and e-substitution factors driving the decrease in mailvolume, 2005-12
The overall decline in mail in the UK has been driven by e-substitution effects in many different mail categories
The UK economy isaround 4% largerthan in 2005driving an increasein transactionalmail
Total advertisingspend is lower thanits 2005 level,reducing spend onDirect Mail
E-substitution has occurred inmost of the mail categories andcannot be fully split into itsconstituent parts
In addition, DirectMail as a proportionof advertising spendhas declined, furtherreducing mailvolumes
Growth in parceldelivery has offsetsome letter volumedecline
The shift ofbusiness volumestowardsDownstream Accessproviders (e.g. UKMail and TNT) hasreduced averageprices and so beenbeneficial foroverall mailvolumes
Despite its highprofile, the impact ofsocial mail declinehas been relativelylow
Indicative
Outlook for UK mail volumes to 202316
Section 2 – Historical trends and context
Note: *Increased usage of downstream access providers has decreased average prices paid over this periodSource: Royal Mail data, PwC analysis
PwC
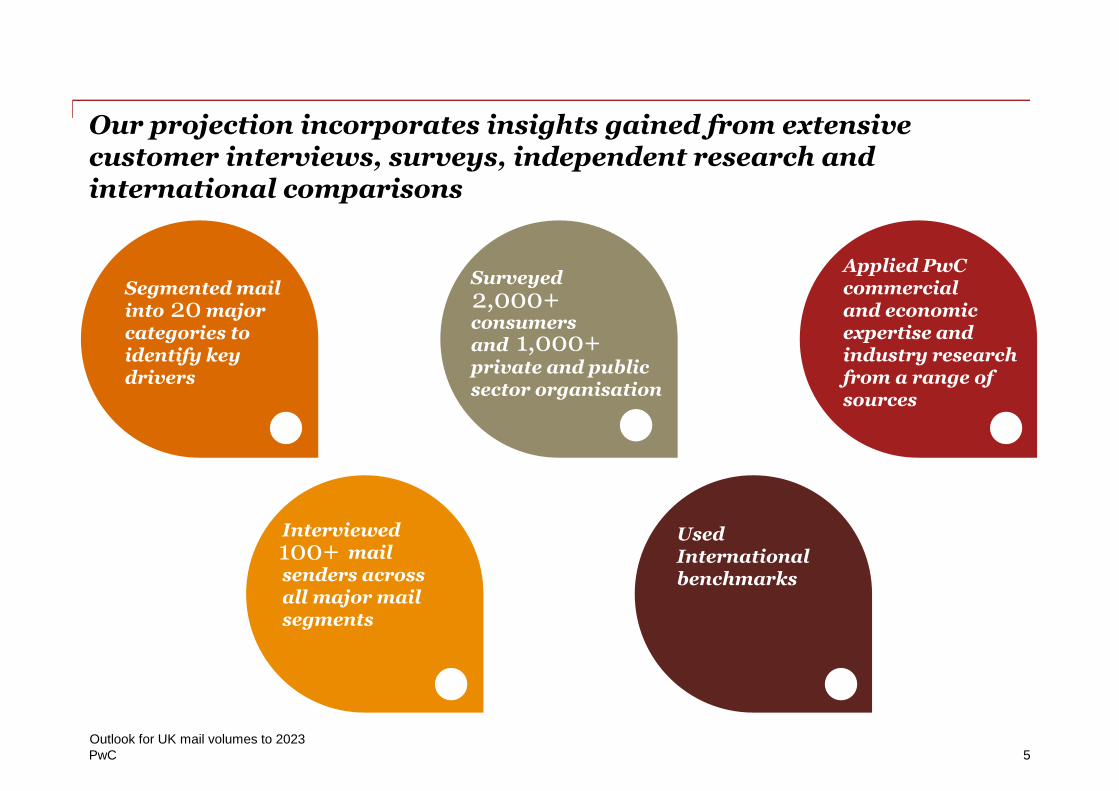
Most e-substitution is being caused by technologies which haveexisted for several years rather than very recent innovations
17
PhoneFaxTV
World wide weblaunched
First graphicalweb browser
1st onlinebank Google
AmazonE-bay Facebook
You Tube 75% of UK hashome internet
access
iPhone
iPad
50% of UKusing the
internet daily
60% of UKhas internet
access
GoogleAdwords
Major banks launch online portals enabling paperlessstatements
Email, PDF and electronic invoicing systems enable B2B electronic invoicing
Rich emails allow newsletter volumes to move online
Pay-Per-Click enables growth in internet advertising
Many of thetechnologiescurrentlydriving themajor mailreductionshave existedfor a numberof years
Recent technological enablers such as Social networks,smartphones and tablets are expected to drive furtherdeclines, e.g. impact on Direct Mail and magazines
The effects of recentinnovation e.g. 3D
printing is not likely tobe felt until towards end
of the plan at theearliest
Source: PwC analysis
HMRC launchesonline Self
Assessment
Outlook for UK mail volumes to 2023
Section 2 – Historical trends and context
1990 2000 2010 2013

PwC
Different segments of the mail bag have declined (or grown) at verydifferent rates
51% 50% 51% 51% 52%51% 50% 50%
30% 30% 30%29%
28%29%
29%29%
6% 7% 7%8%
8%9%
10%11%
8% 8% 7%
6%
6%6%
6%5%
5% 5% 5%
5%
6%
6%6%
5%
2005 2006 2007 2008 2009 2010 2011 2012
Pr
op
or
tio
no
fto
tal
ite
ms
(%)
UK mail volume split by application, 2005-12
Social mail
Publishing
Parcels
Direct mail
Transactional
CAGR 2005-12
(3.9%)
(9.5%)
4.1%
(4.6%)
(4.5%)
Note: International mail volumes not included due to limited data availability for the historical period. Please refer to later section for projections by mail segment; Historical parcel volumes have beenestimated using a combination of parcel volume datasets and parcel specific historical growth driversSource: Royal Mail data, PwC analysis
18
Section 2 – Historical trends and context

PwC
Factors influencing mail volumesSection 3
Outlook for UK mail volumes to 202319

PwC
The e-substitution trend varies considerably between mail types,with each in a different position on the ‘S-curve’
Pre decline Early stagee-substitution
Main phase ofdecline
Approachingbaseline
BaselineMail
volumes
YearsMail remains theprimary form ofcommunication
Remaining mailusers are those who
will not usesubstitute forms of
communication
Rate of declinedecelerates as
remaining mail usershave stronger
preferences forphysical mail
Mail volumesrapidly decline as
other channelsbecome increasingly
popular
Mail begins to besubstituted by other
forms ofcommunication
While the majority ofmail volumes willfollow an ‘s-curve’, thespeed of decline andsize of the baselinewill vary byapplication
Mail e-substitution s-curve
Government
Invoicing
Direct mail
Internationalletters
Financialsector
Payments
Publishing
Social
Outlook for UK mail volumes to 202320
Section 3 – Factors influencing mail volumes
Source: PwC analysis
Illustrative

PwC
The steepness of the s-curve and level of the base is determined by abalance of sender and receiver incentives
Relative receiverdemand forelectronic
substitution
Relative senderincentive to encourage
electronic adoption
Higher
Lower
Lower Higher
B2Cinvoice
B2Cinsurancecertificates
Bankstatements
B2Binvoices
B2Binsurancecertificates
Personaltax returns
Benefits
Incentives in example mail types
B2BMagazines
Sender incentives to e-substitute
To a high value customer
High volume
Requires a response
About a high value transaction
Mail for information only
Want prompt payment
Lower
Higher
Receiver receptiveness to e-substitution
Aimed at older groups
Frequent or large mailing
Mail item required quickly
Aimed at lower income groups
Response likely to be online
Has archive value
Lower
Higher
Slow e-substitution
Rapid e-substitution
Source: PwC analysis
Outlook for UK mail volumes to 202321
Section 3 – Factors influencing mail volumes

PwC
A significant proportion of consumers areincreasingly using online services tocommunicate
These consumers prefer to use onlineservices as they believe that they are moreconvenient. The services can be accessed atanytime from anywhere with an internetenabled device
55% of consumers prefer to use onlineservices to interact remotely withgovernment departments
Consumers can be split into those who embrace online services,those who do not use online services because they do not think theyare suitable, and those who have no internet access
A second group of consumers have theability to use online services but choose notto because:
• They may prefer to keep paper records
• They do not believe that online servicesare suitable for certain applications
A smaller group of consumers have limitedaccess to the internet and therefore areunable to use online services
This proportion of non internet users islikely decline over time
c.80% of consumers are split between those who can and do use online services wherepossible and those who can but prefer not to. However, preferences for online services
vary by mail segment
c. 20% of consumers currently havelimited access to online services
55% of consumers who receive onlinefinancial statements state‘convenience’ as the main reason forstopping paper
34% of consumers who receivefinancial statements by post do so tokeep paper records
42% of consumers who do not useinternet banking state the mainreason is concern over security
79%
4%15%
UK Internet take-up andintentions, 2012
Don't intend to get
Don't know if will get
Likely to get in next 12 months
Internet connection at home
Will continue to useonline services and
gradually reduceremaining mail received
May convert to onlineservices as systems
develop
Largely remain mailusers with some online
service adopters
Source: Ofcom Communication Market Report 2012, PwC surveys
Ma
ilo
utl
oo
k
Outlook for UK mail volumes to 202322
Section 3 – Factors influencing mail volumes

PwC
While cost is the primary driver for most senders engaging in e-substitution, the decision to move away from paper is not alwaysstraightforward
Having the option tochoose channel increases
customers’ satisfaction
High initial IT investment required
Forcing e-substitution oncustomers can annoy them
Physical mail is morelikely to be opened and
readCan improve corporate image
“I prefer not to be inundated with catalogues at all, I just put themin the recycling bin while moaning about how many trees were
wasted” - Consumer
Can generate hidden or unexpected costs
Can provide real timeinformation and live
updates
Not all customers might beready to move online
Improves quantity andquality of data collected
“We thought we could do most of the client’s communicationonline, but systems constraints prevented them from going
through with it - many firms don’t have the resources orappetite to do it” – Consultancy firm
Can offer long term costsavings and cheaper
scalability “Paper bill customers are much less likely to phone in withbilling enquiries than e-bill ones, the true cost of e-bills needs to
reflect the potential cost of phone enquiries”- Telco
Source: PwC interviews, PwC surveys, PwC analysis
Can improve immediacyand ease of communication
Potential benefits of e-substitution
Outlook for UK mail volumes to 202323
Potential costs of e-substitution
Section 3 – Factors influencing mail volumes

PwC
4%
21%
23%
27%
25%
16%
33%
17%
14%
20%
0%
5%
10%
15%
20%
25%
30%
35%
16-24 yrs 25-44 yrs 45-54 yrs 55-64 yrs 65+ yrs
Share of transactional mail vs. share ofpopulation, 2011
% of transactional mail % of population
Demographic changes are likely to contribute to declines in postalcommunication in the long term. However, we believe the impactwill be relatively small over the projection period
The primary driver of maildeclines in the short tomedium term is thechanging behaviour withinand across all age groups
All age groups increasinglyhave access to the internetthrough a range of internetenabled devices
However, as a person ages, thevolume of post they receiveincreases due to the ‘complexity’ oflife
On average, older age groupstypically have greater numbers of,and more complex, transactions(e.g. Life insurance) and assets (e.g.Houses, cars and bank accounts)
In the longer term, demographicchange will have a gradual effect onmail reduction, as older age cohortswith more limited internet accessmake up a smaller proportion ofthe population
84% 86% 87%
69%
51%
23%
90% 90% 88%75%
64%
27%
0%
20%
40%
60%
80%
100%
16-2
4
25
-34
35
-54
55
-64
65
-74
75
+
Home Internet access byage, 2010-2012
2010 2011 2012
46% of over 65’s have home
internet access vs. 80% for the
UK population in 2012
Source: Royal Mail data, Ofcom Communication Market Report 2012, PwC analysis
Demographic and behavioural drivers of mailvolumes
24Outlook for UK mail volumes to 2023
Section 3 – Factors influencing mail volumes
1
1
1
1
11
2
2
3
3

PwC
While e-substitution has largely been negative for letters, parcelvolumes have benefitted from growth in online shopping
Growth of remote retail Rise of online
Parcel deliveries have been growingwith the increasing uptake ofremote shopping
Consumers are increasingly optingfor home shopping as it allows forconvenient price and product rangecomparison
Parcels have traditionally been deliveredto home or work places. More recently,customer collection models such as Click& collect and lockers have been gainingtraction. These enhance flexibility,further increasing demand for remoteshopping
While the increased use ofsmart phones and tablets forleisure encourages impulsebuying, it also fuels digitalsubstitution for somecategories such as Books,Music & DVDs where c.30%and 60% of remote deliveriesrespectively are alreadydigital
86%
12%
TV2%
Online has been takingshare from the moretraditional (offline)remote ordering channelssuch as mail and phoneordering and driving theoverall remote retailcategory
Source: Royal Mail data, Mintel, Verdict, PwC interviews, PwC surveys, PwC analysis
While the growth rate is slowing down, online is outperforming total retailwith last year’s annual online expenditure in the UK increasing by c.12.9%compared to total retail growth of c.0.9% during the same time period
“Some items and sizes are not available in store and it saves time to orderfrom home... Others like the anonymity of the process.”
Clothing & Footwear retailer
Online
Digitisation
25Outlook for UK mail volumes to 2023
Section 3 – Factors influencing mail volumes
Remote retail spendby channel, 2012
Mail order6% 7% 7% 8% 8% 9% 10% 11%
20
05
20
06
20
07
20
08
20
09
20
10
20
11
20
12
%o
fr
eta
ils
ale
s
UK home shopping sales as %of total retail sales
“Click & Collect service isgetting more popular... Itis very convenient for thecustomer as they do notneed to have someone athome to collect the parcel.”
Department store retailer
4 2771
138
261
20
07
20
08
20
09
20
10
20
11
20
12es
t
Sa
les
(£m
)
UK consumere-book market,2007-12est
n/a
CAGR2008-12est
184%

PwC
• International econometric comparisons indicate that a 1.0%increase in real prices leads to a 0.6% decline in mail volumes onaverage
• Although price elasticity is low for total mail, some applications aremore price sensitive than others, such as direct mail
• There are low risks of price rises causing mail volume decline iffuture price increases are in line with inflation. We haveassumed future price increases to be marginally higherthan RPI therefore further downside risks from price increases arelimited
• However, future price increases significantly above RPI couldreduce volumes considerably. In addition, continued priceincreases would be likely to increase the pace of e-substitution as itmakes electronic communication relatively more cost-efficient
• We believe the interaction between e-substitution and priceconstitute an unknown downside risk to mail volumes
Price rises above inflation both reduce mail volumes in the shortterm and can increase the future rate of e-substitution
Outlook for UK mail volumes to 202326
International comparison of the estimated impact of 1% increasein real prices on aggregate mail volumes*
-2
-1.8
-1.6
-1.4
-1.2
-1
-0.8
-0.6
-0.4
-0.2
0
Fin
lan
dB
usi
nes
sto
Co
nsu
mer
ma
il
UK
inla
nd
firs
tcl
ass
no
n-p
re-s
ort
Fin
lan
dB
usi
nes
sto
Bu
sin
ess
ma
il
US
stan
da
rd-m
ail
mar
ket
US
inla
nd
ma
ilm
ark
et
Sw
itze
rla
nd
inla
nd
mai
l
UK
inla
nd
seco
nd
clas
sn
on
-pre
-so
rtm
ark
et
UK
inla
nd
tra
nsa
ctio
na
lm
ail
ma
rket
US
inla
nd
firs
t-cl
ass
mai
l
Co
eff
icie
nt
Note:*Price elasticities based on ‘own-price’ elasticities and hence do not take into account switching between products such as first class volumes moving to second class due to price rises in thefirst class productsSource: Research papers as noted in the Appendix
Section 3 – Factors influencing mail volumes

PwC
Projections by mail segmentSection 4
Outlook for UK mail volumes to 202327

PwC
Our projection looks at the entire UK letter and parcel market,including Royal Mail’s various competitors
Section 4 – Projections by mail segment
Consumers
Businessand public
bodies
Recipient
Overnight express carriers, e.g. Yodel and Hermes
Down stream accesscompanies, e.g. TNT and
UK Mail
CollectionOutward
processingInward
processingDelivery
By-pass, e.g. TNT London trial
Royal Mailoutward
sorting centre Royal Mailinward
sorting centre
Royal Mailcollection
hubs
Deliveryoffices
Wholesale
Presorted
Internationalexport
Internationalimport
Unaddressedadvertising mail
Not covered inour projection:
2 man (items over30kg) deliveries
Irregular mailproducts, e.g.Election mail
Outlook for UK mail volumes to 202328
Food and Grocerydeliveries
Covered in our projection: the UK letter and parcel delivery market

PwC
Ov
er
lay
s
• Develop an econometric model of historical relationships betweenmail volumes and drivers
- Economic and cyclical factors (e.g. GDP, population etc.)
- Time trends to account for e-substitution and e-commercetrends
- Price elasticity, i.e. sensitivity to changes in the price of lettersand parcels
• Apply forecasts of the underlying drivers to produce a projection foreach of the main categories of mail
• 100+ interviews with large senders, 4 online surveys with c.3,000respondents (including consumer, business and public bodies),desktop research and interviews with mail stakeholders
• Analyse each sub-segment of the mail bag to understand keyindustry drivers and trends
• Estimate the likely macro and e-substitution trends for eachsegment
We have projected mail volumes using both bottom-up and top-down approaches
Outlook for UK mail volumes to 202329
Section 4 – Projections by mail segment
Triangulation and harmonizationof results
Integrated view
Sensitivity analysis Short term risks Long term risks
Final projection
The top-down approach allows us to understand the macrodrivers behind changes in mail use
The bottom-up approach allows us to understand the specificdrivers behind changes in each mail segment

PwC
Our top down approach uses econometric models with time trendsto account for technology and e-substitution
Section 4 – Projections by mail segment
E-substitution, linear and non-linear time trend*
Time
Le
tte
rv
olu
me
s
Linear trend(best fit based onhistorical data)
Non-linear trend(best fit based onhistorical data)
E-substitution
Historical data
Note:*Most suitable shape of the time trend varies by applicationSource: PwC analysis
We have considered two ways to include technological factors in oureconometric modelling
2. Estimate the shape and impact oftechnology on mail volumes byincluding time trends in themodel (while remaining agnosticabout what technology is drivingthe trend). Different types of timetrends (linear and non-linear)can be used to estimate the shapeof the historical technologywedge and then applied toestimate future mail volumes
• The limitation of this approach isthat the past may not be a fairrepresentation of the future. Forexample, a trend that has beenincreasing historically may flattenout or even start to decrease
1. Analyse the impact of differenttechnological drivers for e-substitution, e.g. social media usefor social mail or online bankingpenetration for financial mail.There are two limitations to thisapproach:
• Technology is continuouslyevolving and so it is impossible toinclude an exhaustive list of thetechnological factors that mightimpact each mail type in thefuture;
• Forecasting how the selecteddriver will evolve in the future isoften as difficult as forecastinghow mail volumes will evolve
On balance, we believe that time trends provide the best way to create asensible and robust model
Outlook for UK mail volumes to 202330
Illustrative

PwC
Our bottom-up projection breaks down the mail bag into c.20 mainsegments and looks at the drivers and outlook for each
Source: Royal Mail data, PwC analysis
Transactional mail Direct mail Publishing
Socialmail Parcels
0%
10%
20%
30%
40%
50%
60%
70%
80%
90%
100%
0% 20% 40% 60% 80% 100%
Ke
ys
eg
me
nts
Key mail type
UK inland and international mail volume by type, 2012
+
Parcels
Letters
Internationalmail
CentralGovernment
LocalGovernment
Healthcare
Ed
uca
tion
Financial Servicesstatements
Financial Services Legal / Terms and Conditions
Financial ServicesInsurance
Financial ServicesOther
Invoices B2B B2C bills
Other C2X
Other B2B
Other B2C
Payments
Catalogues
Advertising
Ma
ga
zines
New
sletters
B2B
C2X
B2C
Outlook for UK mail volumes to 202331
Section 4 – Projections by mail segment

PwC
These high level categories in turn break down into thousands ofdifferent types of mail from different senders. Each of these types ofmail exhibits different growth dynamics
Total Mail
Transactional Mail
GovernmentMail
Central Government
Source: Royal Mail data, PwC analysis
Not to Scale
32
Section 4 – Projections by mail segment

PwC
Forecast
Total inland letter volumes have been declining historically. Thecontraction is expected to continue albeit at a slower rate year-on-year
Outlook for UK mail volumes to 202333
Section 4 – Projections by mail segment
Note: Above analysis exclusive of parcel, i.e. reflecting letter volumes only. International letter mail volumes not included due to limited data availability for the historical period. Please refer to thelater section for projections by mail segmentSource: Royal Mail data, PwC analysis
0
20
40
60
80
100
120
2005 2006 2007 2008 2009 2010 2011 2012 2013 2014 2015 2016 2017 2018 2019 2020 2021 2022 2023
Ind
ex
ed
ma
ilv
olu
me
s(2
00
5=
100
)
Total inland letters historical and projected volumes, 2005-23
CAGR2005-08
CAGR2008-13
CAGR2013-18
CAGR2018-23
(3.1%) (6.3%) (4.9%) (3.8%)
Position on s-curve

PwC
Forecast
While letter volumes continue to fall, parcels will grow their shareof total inland mail volume
Note: International mail volumes not included due to limited data availability for the historical period. Please refer to the individual section for projectionsSource: Royal Mail data, PwC analysis
50% 49% 48% 47% 46% 45% 44% 43% 42% 41% 40% 39%
29% 28% 28% 28% 28% 29% 29% 29% 30% 30% 30% 30%
11% 12% 13% 14% 15% 16% 17% 18% 19% 19% 20% 21%
5% 5% 5% 5% 5% 5% 5% 5% 5% 5% 5% 5%
5% 5% 5% 5% 5% 5% 5% 5% 5% 5% 5% 5%
0%
10%
20%
30%
40%
50%
60%
70%
80%
90%
100%
2012 2013 2014 2015 2016 2017 2018 2019 2020 2021 2022 2023
Pr
op
or
tio
n(%
)
Total mail volume forecast by type, 2012-23
Social mail
Publishing mail
Parcels
Direct mail
Transactional mail
Outlook for UK mail volumes to 202334
Section 4 – Projections by mail segment

PwC
Forecast
0
10
20
30
40
50
60
70
80
90
100
2005 2006 2007 2008 2009 2010 2011 2012 2013 2014 2015 2016 2017 2018 2019 2020 2021 2022 2023
Ind
ex
ed
ma
ilv
olu
me
s(2
00
5=
100
)
Transactional mail historical and projected volumes, 2005-23
Rapid decline in transactional mail volumes is expected to continuebefore slowing down towards the end of the projection period
Note: Excludes Royal Mail Large Letters (packets) which are included in parcel estimatesSource: Royal Mail data, PwC analysis
Position on s-curve
CAGR2005-08
CAGR2008-13
CAGR2013-18
CAGR2018-23
(2.5%) (6.2%) (5.4%) (4.5%)
Outlook for UK mail volumes to 202335
Transactional Mail – Financial ServicesSection 4 – Projections by mail segment

PwC
Financial institutions have already captured many of the ‘quickwins’ from e-substitution. Consequently substitution of the morefragmented remainder will be slower
We expect growth in the penetration of online banking to slow in thenext five years as the remaining offline consumers become harder toconvert
There will be a continued shift to paperless among online bankingusers. The current 44% of consumers who state they will always wantto receive paper statements is likely to reduce over the projectionperiod
RBS changed from monthly to quarterly statements in Feb 2013 andwe expect other banks may follow suit. This will have a significantimpact on current account volumes, but monthly credit cardstatements are seen as more important as they prompt payment andother statements are already sent less frequently
25% of transactional mail in the
UK is sent by the top 5 banks, withother financial services companies
accounting for another 10%
Statements constitute approximately
half of mail sent by banks, 50%
of which is current accounts
Paperless current accounts are now
c.40% of the total
“The direction banksare going in is aboutcommunicating inthe medium ofchoice. Paper is nowjust one of a numberof media and wehave been verysuccessful atimproving theonline proposition”
Top five UK bank
“As our digitisation increases it isn’tstraightforward that our letter volumesdecrease. There’s baseline growth and asignificant amount of non-statement mail, e.g.credit card renewals. Digitisation cannot offera viable substitute for many of these items”
Top five UK bank
We estimate that of the non-statement mail sent by financial services companies, around 30% isdifficult to substitute due to regulation (e.g. the requirement for a ‘wet’ signature) or is the deliveryof a physical item (e.g. a credit card)
While the substitutable remainder isearly on in its substitution S-curve, itsfragmented nature means the rate ofdecline is likely to be longer and flatterthan that of statements
0%
20%
40%
60%
80%
100%
199
8
20
00
20
02
20
04
20
06
20
08
20
10
Proportion of UK individualsregistered for internetbanking, 1998-2011
Source: British Banking Association Annual Abstract 2012, PwC interviews, PwC surveys, PwC analysis
Outlook for UK mail volumes to 202336
Transactional Mail – Financial ServicesSection 4 – Projections by mail segment

PwC
Sent togeneral
population
Sent tovulnerable
groups
Central government mail sent to thegeneral population vs. vulnerablegroups (Illustrative)
The majority of Government mail is transactional in nature, relatingto services such as benefits and taxation
We believe the Government sector as a whole is towards the beginningof the s-curve with significant scope for further mail reductions
However, there are large variations as some government services haveachieved significant online penetration, while others are not expectedto substitute at all
We expect a continued decline in Government mailvolumes as a result of:
• Increased budgetary pressures. Governmentsurveys estimate the cost of a digital transactioncan be c.30x lower than a postal transaction
• Demand for a better digital service forcustomers
However, in a number of areas, declines will belimited by customer acceptance and technologicalchallenges
• Many online services will need to seamlesslylink to multiple government databases
• Certain customer groups have more limitedonline access, e.g. only 46% of people aged 65and over have home internet access
We expect Government mail volumes to decline faster thanhistorically driven by budgetary pressures and CentralGovernment’s Digital by Default strategy
Outlook for UK mail volumes to 202337
The Government’s Digital Strategy was released in November2012 to drive the development and use of online governmentservices to reduce non-digital transactions (post, phone and faceto face meetings).
“Digital by Default is a major initiative which may accelerate thepost decline”
Central Government Department
“We willcontinue topush formore peopleto usepaperless asit is so muchcheaper”
Local Authority
46% of the
public have useda governmentonlinetransactional
service 83%of Annual SelfAssessment formswere submittedonline to HMRCin 2011/12*
Digital by Default
“We areconstrainedby what ourICT canhandle”
Local Authority
Note: *Of on time Self Assessment submissionsSource: Royal Mail data, Central Government data, Digital Efficiency Report, Government Digital Strategy, Ofcom Communications Report 2012
Transactional Mail – GovernmentSection 4 – Projections by mail segment

PwC
B2C companies are increasingly encouraging consumers to switchto online communications to reduce costs. Rapid declines aretherefore expected to continue
B2C businesses with large customerbases are increasingly seeking toswitch customers from paper todigital interactions to reduce costs
As a result we expect B2C businessesto significantly reduce mail usageover the next ten years
Billing
B2C invoicing continues to move online andwe expect significant mail declines in thenext 3 years as businesses develop theironline billing processes
“We are targeting a significant increase inthe amount of online billing so the vastmajority is online”B2C Company
Examples
Insurance
Recent regulation changes allowedinsurance certificates to be sentelectronically. Companies have plans tomove significant volumes online, but manyare held back by the IT investmentrequired. The largest impact is likely to bein the middle of the projection period
53% of B2C businesses will encourage
their customers to switch to digital with a
further 16% planning to stop paper
transactions at some point in the future
“We will never get everybody online butwe are aiming for as many as possible tocut down our mailing costs”
B2C company
Businesses recognise that aproportion of their customer base willcontinue to prefer paper copies oftransactions, predominantly forrecord keeping. As companies reachthis baseline of paper customers, therate of mail decline will reduce
47% of B2C SMEs will continue to use
mail because their customers will continue torequest paper
Mail costs are an increasing focusof B2C businesses...
Mail costs are an increasing focusof B2C businesses...
...however, customer demand forpaper is likely to act as a
significant inhibitor
...however, customer demand forpaper is likely to act as a
significant inhibitor
“We are dependent on customerpreferences and some will not switch offpaper billing as they like to file the bill”
B2C company
Source: PwC surveys, PwC interviews
38Outlook for UK mail volumes to 2023
Transactional Mail – B2B mailSection 4 – Projections by mail segment

PwC
B2B transactional mail volumes are more fragmented than B2C,but the inhibitors to substitution are lower
The barriers to reducing mail are lower, with less investmentoften required to allow online communication and a smallerbase of businesses resistant to electronic interaction than thebase of consumers
Invoicing
B2B invoicing is likely to follow a similartrend to B2C, with declines in the next fewyears leading to a low baseline of businesseswhich prefer paper by the end of theprojection
“Some businesses like to receive a one pagepaper summary for their accounts”
B2B Invoicer
Mail costs aregenerally less of a
direct focus for B2Bcompanies than
B2C...
Insurance
Rate of decline is lower than for consumerinsurance, with relatively low demand forpaperless insurance in the marketplace.
“There’s some element of demand, but wehaven’t seen a massive appetite”
B2B Insurance advisor
63% of B2B businesses
encourage their customers to switch todigital vs. 53% for B2C
“If we’re insuring something for multimillions, like an ocean liner wesend fancy documents. We send a lot physically as it makes people feellike they have bought something valuable. It’s the bottom-end, massmarkets that will go more online, like car insurance”
Large Insurance Company
...but lower barriersmean the mail
reduction isexpected to
accelerate anddecline to a smaller
base
B2B mail is more fragmented and represents lower volume,higher value transactions than B2C mail. The printing andmailing costs are usually a lower proportion of the overalltransaction or customer value than in B2C, reducing theincentive to reduce mail
Source: PwC surveys, PwC analysis
39Outlook for UK mail volumes to 2023
Transactional Mail – B2B mailSection 4 – Projections by mail segment
Examples

PwC
Forecast
0
20
40
60
80
100
120
2005 2006 2007 2008 2009 2010 2011 2012 2013 2014 2015 2016 2017 2018 2019 2020 2021 2022 2023
Ind
ex
ed
ma
ilv
olu
me
s(2
00
5=
100
)
Direct mail historical and projected volumes, 2005-23
We expect direct mail volumes to stabilise towards the end of theperiod. The weak economy was a major driver of the rapid declinesseen in recent years
Note: Excludes Royal Mail Large Letters (packets) which are included in parcel estimatesSource: Royal Mail data, PwC analysis
Position on s-curve
CAGR2005-08
CAGR2008-13
CAGR2013-18
CAGR2018-23
(2.7%) (6.1%) (2.9%) (1.3%)
Outlook for UK mail volumes to 202340
Direct MailSection 4 – Projections by mail segment

PwC
0%
5%
10%
15%
20%
25%
198
2
198
3
198
4
198
5
198
6
198
7
198
8
198
9
199
0
199
1
199
2
199
3
199
4
199
5
199
6
199
7
199
8
199
9
20
00
20
01
20
02
20
03
20
04
20
05
20
06
20
07
20
08
20
09
20
10
20
11
Direct mail share of total advertising spend, 1982-2011
Historically, direct mail declined as a share of total advertising,but it is likely to reach a new equilibrium level as internetadvertising matures
Source: The Advertising Association/ WARC Expenditure Report, PwC interviews, PwC surveys, PwC analysis
Total advertising expenditure follows GDP and is now recovering fromthe recession. Direct mail declined along with total advertising, but alsolost share of marketing spend to fast growing online marketing. Thedecline rate is slowing as online advertising matures and the economyrecovers
The companies that are most successful at using direct mail integrate itwith other channels to use all the available data to improve thetargeting and relevance of direct mail messages
“Direct mail is a relationship builder and for high-value customers itcan demonstrate the value of the relationship”
Leading advertising agency
Return on investment (ROI) in direct mail is comparable with othermedia and is becoming more measureable due to innovation in directmail response tracking
“Direct mail is a massively important medium and it works”
Marketing consultant
There remains a threat that new technologies such as mobile will upsetthe balance of ROI in the industry again, but declining volumesincrease the attractiveness of direct mail as mailings stand out moreeasily
“When volumes drop below a certain threshold some savvy marketerswill realise the channel is underutilised and ‘rediscover’ it”
Mailing house
1/3 of British consumers
still prefer to receive postedcatalogues rather than usingwebsites
47% of British retailers
use mail as a marketingchannel
Growth due toimprovements in printingquality and costs
Outlook for UK mail volumes to 202341
Direct MailSection 4 – Projections by mail segment

PwC
Forecast
0
10
20
30
40
50
60
70
80
90
100
2005 2006 2007 2008 2009 2010 2011 2012 2013 2014 2015 2016 2017 2018 2019 2020 2021 2022 2023
Ind
ex
ed
ma
ilv
olu
me
s(2
00
5=
100
)
Publishing mail historical and projected volumes, 2005-23
The rapid decline in publishing mail in recent years was largelydriven by the majority of newsletters going online...
Note: Excludes Royal Mail Large Letters (packets) which are included in parcel estimatesSource: Royal Mail data, PwC analysis
Position on s-curve
CAGR2005-08
CAGR2008-13
CAGR2013-18
CAGR2018-23
(9.1%) (9.4%) (5.0%) (3.0%)
Outlook for UK mail volumes to 202342
Publishing MailSection 4 – Projections by mail segment

PwC
NewslettersB2B magazinesB2C magazines
... the publishing segment is now largely comprised of magazines,which have proven more resilient to e-substitution, resulting in aslower decline over the projection period
Source: Enders, Mintel, PwC Entertainment and Media Outlook, PwC interviews, PwC surveys, PwC analysis
His
tor
ica
ltr
en
ds
Consumer print magazine circulationdeclined by c.34% between 2007-2012but subscriptions grew by c.17%
The uptake of digital editions has beenslower then expected and has notreplaced print
Digital brands generated an estimated15% of consumer magazine publisherrevenues in 2012
“We believe digital subscriptions areattracting new customers and notreplacing existing ones”
Leading publisher
Substitution will accelerate slightly butremain relatively slow
Business media customers aregenerally high value, paying muchhigher subscriptions than consumersand are targets for on-sell of data andother services
“The print and distribution costs area small percentage of our revenueper customer”
Large B2B publisher
The incentives for both the senderand receiver to stop the print editionare low so we expect declines tocontinue to be relatively slow
Newsletters moved online veryquickly, only 25% are still offline
“We switched about 2 years agobecause it was not cost-effective “
University
This decline will slow towards theend of the period as a baseline isreached of senders that see a benefitfrom newsletters sent physically,such as charities encouragingdonation
“We send newsletters to previousdonors, to make them aware of theresults of their help. Newsletters arecostly but they will stay offline”
National charity
0
200
400
600
800
2007 2008 2009 2010 2011 2012
Ite
ms
(m)
Estimated newsletter volumes2007-12
0
50
100
150
200
2007 2008 2009 2010 2011 2012
Ite
ms
(m)
B2B Magazine subscriptionvolumes 2007-12
0
50
100
2007 2008 2009 2010 2011 2012
Ite
ms
(m)
B2C Magazine subscriptionvolumes 2007-12
Cu
rr
en
td
ev
elo
pm
en
ts
Outlook for UK mail volumes to 202343
Publishing MailSection 4 – Projections by mail segment

PwC
Forecast
0
10
20
30
40
50
60
70
80
90
100
2005 2006 2007 2008 2009 2010 2011 2012 2013 2014 2015 2016 2017 2018 2019 2020 2021 2022 2023
Ind
ex
ed
ma
ilv
olu
me
s(2
00
5=
100
)
Social mail historical and projected volumes, 2005-23
Social mail volumes are not expected to decline radically in the next10 years. While some contraction is expected, most of the electronicsubstitution has already occurred
Note: Excludes Royal Mail Large Letters (packets) which are included in parcel estimatesSource: Royal Mail data, PwC analysis
Position on s-curve
CAGR2005-08
CAGR2008-13
CAGR2013-18
CAGR2018-23
(1.9%) (5.3%) (3.8%) (3.2%)
Outlook for UK mail volumes to 202344
Social MailSection 4 – Projections by mail segment

PwC
Personal letter use has declined rapidly, but greetings cards aremore resilient and now represent the majority of social mail
18
16
13
2006 2009 2012
Average social mail received perperson, 2006, 2009 & 2012
Split of social mail, 2012
Greetings cards80%
Letters/Postcards
20%
Social letters and postcards have beendeclining rapidly as consumers move tothe wide range of alternatives
Consumers are also sending fewergreetings cards, but the decline is sloweras electronic alternatives have notgained wide acceptance
The overall decline in social mail is likelyto slow as the mix continues to movetowards greetings cards
Innovation
Some decline in Social mail may bemitigated by innovative platforms thatdrive usage of mail:
• Moonpig allows online design andpersonalisation of cards
• The TouchNote app sendssmartphone photos as postcards
Source: Royal Mail data, Ofcom Postal Tracker Q4 2012, PwC analysis
Econometric drivers
Historical relationships suggest socialmail has a number of underlyingeconomic drivers such as number ofhouseholds, price and quality ofservice. Price rises have contributed tomore than half of the decline in socialmail volumes during the last five years
Outlook for UK mail volumes to 202345
Social MailSection 4 – Projections by mail segment
2% 5%
65%
16%8%
Incr
ease
sig
nif
ican
tly
Incr
ease
slig
htl
y
Sta
yth
esa
me
Dec
rea
sesl
igh
tly
Dec
rea
sesi
gn
ific
an
tly
Re
sp
on
se
fre
qu
en
cy
(%)
How will the number of cards you sendthrough the post this Christmas comparewith last year?

PwC
Forecast
Parcel volumes have been growing steadily and this is expected tocontinue during the projection period
Outlook for UK mail volumes to 202346
Note: Includes Royal Mail Large Letters (packets), DSA parcels and couriersSource: Royal Mail data, PwC analysis
ParcelsSection 4 – Projections by mail segment
0
20
40
60
80
100
120
140
160
180
200
2005 2006 2007 2008 2009 2010 2011 2012 2013 2014 2015 2016 2017 2018 2019 2020 2021 2022 2023
Ind
ex
ed
ma
ilv
olu
me
s(2
00
5=
100
)
Parcels historical and projected volumes, 2005-23
Position on s-curve
CAGR2005-08
CAGR2008-13
CAGR2013-18
CAGR2018-23
4.3% 3.7% 3.3% 2.1%

PwC
• The market is less exposed to the risks of digitalsubstitution because it is mainly composed ofphysical items that need to be delivered
Despite strong growth in B2C, overall growth in parcels is reducedby the lower growth rates of B2B and C2X
• Social parcelvolumes willremain stable withonly limitedpopulation growthand behaviouralchange expected
Consumer-to-consumer/ business (C2X)
77% of
consumersthink the
number ofparcels they
send willstay the
same
• Growth will bemainly driven byonline sales (e.g.eBay) • Volumes are expected to
grow at c.2-4% p.a. by 2023,trending with the improvingUK economy
• The growing popularity ofClick & Collect and similardelivery formats will createan additional uplift in themedium term**
61% of
retailers thinkclick & collect
will reachgrowth limitsin 3-5 years
or evenearlier
Business-to-consumer (B2C)
• Increased uptake of online shoppingvia PC, tablet or smart phone is toremain the key growth driver,especially in Clothing, Footwear andHealth & Beauty
• Volumes through traditional remotechannels (mail, phone, store orders)are expected to continue declining andrepresent a gradually smaller portionof overall B2C volumes (now c.15%)
• Fulfilment of Music & DVDs, VideoGames and Books (c.40% of currentparcel deliveries) will remain underpressure until 2023 due to intensifyingdigital substitution
“Online is growing but the growth rateis slowing down” Health &
Beauty retailer
“Online growth is fast for clothingwhere it has been encouraged by freereturns” Department store retailer
Note: *Click and collect parcels transported by retailers’ own fleets; **As the Click & Collect delivery is within the retailer’s network, this drives the B2B market rather than B2CSource: Royal Mail data, PwC interviews, PwC surveys, PwC analysis
Business-to-business (B2B)
Outlook for UK mail volumes to 202347
ParcelsSection 4 – Projections by mail segment
1 2
3
3.7%
2.0%
3.0%
2.3%1.8%
1.0%
3.3%
2.1%
2013-18 2018-23
CA
GR
(%)
Parcel projected volume growth by segment,2013-23
B2C B2B C2X TOTAL

PwC
Underpinning the growth in B2C parcels is greater online orderingof items such as clothing and footwear. However, this will be offsetby ongoing digital substitution of categories such as books and DVDs
Outlook for UK mail volumes to7 202348
Source: PwC analysis
ParcelsSection 4 – Projections by mail segment
CAGR2013-18
(4.2%)
9.3%
4.5%
3.7%Total
41% 37% 34% 31% 29% 27% 25% 24% 22% 21% 19% 18%
36% 39% 42% 44% 47% 49% 50% 52% 53% 54% 55% 56%
23%24%
24%24%
25%25%
25%25%
25%25% 25% 26%
2012 2013 2014 2015 2016 2017 2018 2019 2020 2021 2022 2023
To
tal
ite
ms
UK B2C parcels market volumes, 2012-23
Other
High growth
Substitutable
• Homewares
• DIY and gardening
• Other
• Clothing and footwear
• Health and beauty
• Electricals
• Music and DVDs
• Books
• Video games
CAGR2018-23
(4.7%)
4.5%
2.7%
2.0%

PwC
Forecast
Forecast
Outlook for UK mail volumes to 202349
Despite the historical contraction in letter volumes, internationalmail volumes have benefited from the growth in parcels
Source: Royal Mail data, PwC analysis
Position on s-curve
Position on s-curve
International Mail
0
20
40
60
80
100
120
2012 2013 2014 2015 2016 2017 2018 2019 2020 2021 2022 2023
Ind
ex
ed
ma
ilv
olu
me
s(2
012
=10
0)
International letters historical and projected volumes, 2012-23
0
20
40
60
80
100
120
140
160
180
2012 2013 2014 2015 2016 2017 2018 2019 2020 2021 2022 2023
Ind
ex
ed
ma
ilv
olu
me
s(2
012
=10
0)
International parcels historical and projected volumes, 2012-23
CAGR2005-08
CAGR2008-13
CAGR2013-18
CAGR2018-23
n/a n/a (5.5%) (4.8%)
CAGR2005-08
CAGR2008-13
CAGR2013-18
CAGR2018-23
n/a n/a 4.4% 3.2%
Section 4 – Projections by mail segment
PwC
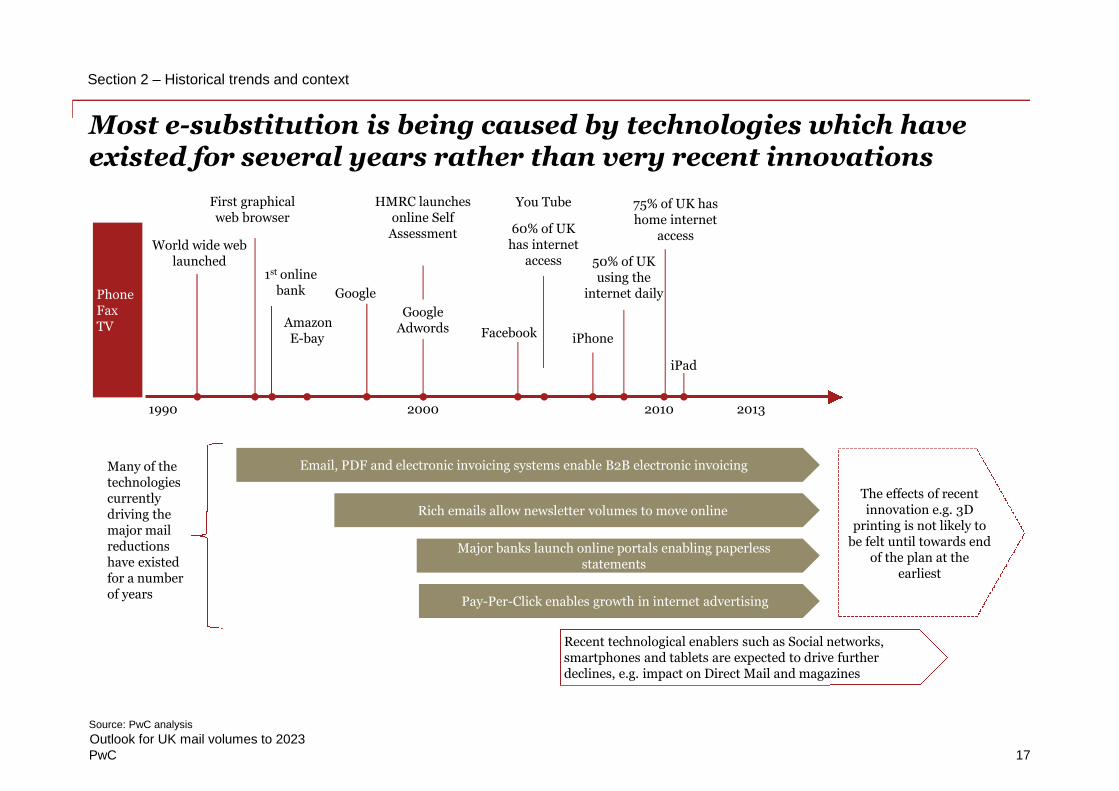
E-substitution continues to erode international letter volumes, butparcel volumes continue to grow, boosted by investment in onlineexports
Source: Royal Mail data, PwC interviews, PwC surveys, PwC analysis
Outlook for UK mail volumes to 2023
International mail by type, 2012
• Export as well as import letter volumes have suffered a declining trend over thepast 10 years (c.6-7% p.a. since 2007) driven by e-substitution
• The latest market data suggests that the decline may have slowed slightly in thelast couple of years even though it is expected to persist until 2023
• In the medium and long term, international GDP growth should create a partialuplift in overall letter volumes in line with increased global trade.
Letters
“International letter volumes have remained relatively flatover the last 3 years although spend has come down”
Central government department
Parcels
• International parcels can be split into B2C, B2B andC2X shipments
• B2C and B2B parcels represent the majority of volumes(c.90%) and are expected to grow, especially on theexport side where UK based businesses are investingfor online growth in Europe and Asia in particular
• Import volumes are expected to remain more stable forsocial and small business parcels, growing at c.1-3%p.a., in line with the domestic demand for onlinetraded products as the economy recovers
“We see international as an areawith a big potential for growth”
Department store retailer 5.9%23.1%
50.6%
0.9% 2.7%16.9%
Str
on
gin
crea
se
Incr
ease
No
cha
ng
e
Dec
rea
se
Str
on
gd
ecre
ase
Do
n't
kn
ow
Re
sp
on
se
fre
qu
en
cy
Response rates across 338 surveyed UK retailers
“Australia is used to buying alot online from the UK and so isthe US”
Department store retailer
50
Expected future change in B2C exportparcels
Section 4 – Projections by mail segment International Mail
Exports45%
Imports55%
Letters74%
Parcles26%

PwC
Main risks to projectionSection 5
Outlook for UK mail volumes to 202351

PwC
There are a number of short term risks which could have one offnegative impacts on the projection which we have not modelled
1. Macroeconomic downturn
• Our projection assumes a return to trend GDP growth in 2015
• A future macroeconomic downturn would have a significant impact onpostal volumes by reducing transaction volumes and direct mail
Source: PwC interviews, PwC analysis
Outlook for UK mail volumes to 2023PwC
3. EU Regulation on Direct Mail
• The EU Commission has recently proposed changes to consumer dataprotection rules
• The proposed changes include the ‘right to be forgotten’ to allow peopleto have their data deleted and limitations on the use of customerprofiling
• The requirement for more explicit consent for personal data to be usedcould significantly impact the ability of companies to engage in DirectMarketing, both by mail and in digital formats
2. Service disruptions
• The disruption of delivery volumes (e.g. from weather or industrialaction) can have a significant impact on mail volumes
• The majority of this impact is temporary. However, service disruptionsmay also encourage greater e-substitution as a result of customerswitching to alternative methods of communication
• The impact of service disruptions on postal volumes can be modelled onthe basis of the historic correlation between previous disruptions andmail volumes.
4. VAT Treatment
• Royal Mail Wholesale (Downstream Access) is currently VAT exempt.However, Royal Mail’s exemption may become subject to a judicialreview
• If all Wholesale services became VAT taxable, organisations that areunable to reclaim VAT, such as charities and financial services firms,would see a significant effective price increase and this could encouragefurther e-substitution of mail
“If Downstream Access becomes taxable, it would lead to a 20%increase in our costs and would have a serious impact on our mail use”
Insurance company
52
Section 5 – Main risks to projection

PwC
Some of the longer term risks applicable to mail volume projectionscannot yet be quantified and so are included in a contingencywithin the projection
Source: PwC analysis
Outlook for UK mail volumes to 202353
Section 5 – Main risks to projection
Potential projection risks
• Identifiable one-offsthat could fall withinthe time frame of theprojection, e.g.:
o Large scale Internetsecurity breach thatencouragesconsumers to revertto mail
o Widespreadadoption of digitalmailboxes
• Rare ‘black swan’event that cannotbe predicted easilybut could have asignificant impacton projected mailvolumes and thestructure of thepostal market
• Shifts could occurthrough anychannel, e.g.technological,political, macroeconomic
• Identifiable trendsthat will materialiseeventually but areunlikely to take placewithin the projectionperiod, e.g.:
o Electronic invoicesmandated for allgovernmentprocurement
o 3D printing ofremotelypurchased goodsthat would reduceparcel deliveries
• Risks arising fromknown trends (e.g.technologydevelopment, ageingpopulation) whichcannot currently bespecifically identified,e.g.:o The development of
new marketingtechnologies thatfurther reducedirect mail’s shareof advertising spend
• Risks arising from anychanges to ourprojection assumptionsrelating to theoperation and structureof the market
Known risks Unknown risks
Unlikely but possiblewithin projection period
Unlikely withinprojection timescale
Identified Unidentified

PwC
Our e-substitution scenario analysis suggests that in a negativecase, the total cumulative decline could be 5ppt below our base-caseby 2015, increasing to c.12ppt by 2023
Outlook for UK mail volumes to 202354
• We have modelled upside and downside e-substitution scenarios to demonstrate thepotential impact on our projection of some of therisks we have identified
• These scenarios are based on changing a numberof assumptions underlying our individual mailsegment projections to create high and low casesfor each mail segment
− These are not ‘worst case’ scenarios, but represent plausible alternative outcomes
− Upside scenarios are based on factors such as a larger baseline of consumers and businessesretaining paper invoicing and slowerGovernment digital uptake while downsidescenarios are based on factors such as fasteradoption of paperless bank statements andslower parcel volume growth
• We have used Monte Carlo analysis to illustratethe range of possible outcomes from combiningthese scenarios (reflecting the fact that it isunlikely that all downsides will occur together)
• The scenarios do not include differing GDPassumptions (illustrated later in the report) andalso exclude large one off events which couldsignificantly affect mail volumes. Examples ofthese events are discussed in the ‘Main risks toprojection’ section of the report
Source: PwC analysis
0
20
40
60
80
100
120
2012 2013 2014 2015 2016 2017 2018 2019 2020 2021 2022 2023
Ind
ex
ed
ma
ilv
olu
me
s(2
012
=10
0)
Total inland mail projected scenarios, 2012-23
The balance is towardsmore downside risk
Section 5 – Main risks to projection

PwC
0
20
40
60
80
100
120
2012 2023
Ind
ex
ed
ma
ilv
olu
me
s(2
012
=10
0)
In addition, the total cumulative decline in mail volumes could bec.6ppt below our base-case by 2023 if GDP growth were to be at thebottom of our projected range
• We have also consideredupside and downside GDPscenarios and their impact onour mail projections
• Our upside GDP caseassumes a stronger thanexpected recovery andmarginally higher trendgrowth over our base-case inthe outer years
• Our downside GDP caseassumes a period ofstagnation and lower trendgrowth than our base-case inthe outer years
• The shaded area shows therange of potential outcomesresulting from the GDPscenarios described above
Outlook for UK mail volumes to 2023
Total inland mail projected GDP scenarios, 2012 & 2023
Our upside GDP scenario assumes a strongerrecovery of the UK economy with c.4% growthin 2014 and a return to trend growth rate of2.5% p.a.
Our downside GDP scenario assumes a periodof stagnation with negative growth in 2013followed by weak growth in 2014 beforerecovering to a trend growth rate of 2% p.a.
Source: PwC analysis
55
Section 5 – Main risks to projection
2013 2014 2015 2016 2017 2018 2019 2020 2021 2022

PwC
The fragmentation of the mail bag means a significant number ofdiscrete downside risks need to materialise to have a significantimpact on the projection
Paper bank statement volumes decline
by 80% after banks start chargingfor paper current account statements
in 2018
Advanced screen technologyand increased e-cardpenetration drives a 60% reduction
in card mail
B2B invoicing mail drops by 80% after
government mandates e-invoicing for its procurement
No growth in B2C parcel volumes after
first five years as 3D printingsubstitutes some online shoppingdelivery
Improvements in tablets reduces
physical magazine subscriptions by50%*
Cheques discontinued as a
payment system
Technology and legislationreduce direct mail’s share of totaladvertising from c.10% to 3%
The Digital by Default strategydrives an 80% reduction in mail sent bycentral government
What would happen if we saw large risks materialise across multiplecategories on top of the currently projected decline?
Note: *From 2012 levelsSource: PwC analysis
The fragmentation means a large proportion ofmail remains unaffected even if all of thesediscrete events were to occur simultaneously
Outlook for UK mail volumes to 2023
Impact of multiple downside scenarios on totalinland addressed mail volumes, 2012-2023
18
16
9
2
0
2
4
6
8
10
12
14
16
18
20
09
20
10
20
11
20
12
20
13
20
14
20
15
20
16
20
17
20
18
20
19
20
20
20
21
20
22
20
23
Ite
ms
(bn
)
IllustrativeDownsidescenario
56% of 2012volumes
72% of 2012volumes
PwCBasecase
56
Section 5 – Main risks to projection

PwC
High profileinternet security
breach
There are also a number of possible upsides which have thepotential to offset some of the volume decline
Imp
ac
t
Likelihood HighLow
Lo
wH
igh
Source: PwC analysis
Outlook for UK mail volumes to 2023
Innovation bymail companies
e.g. Trackeddelivery for all
letters
Stronger thanexpected
economic growth
New onlineprivacy restrictions
affect internetadvertising
Improvementsin targeting and
ROI measurementof direct mail
Reduction in thecost of documentproduction and
processing
Governmentopts to maintain ahigh proportion of
mail to promoteinclusionChanging
consumerattitudes to
environmentalconcerns
New products orcompanies using
57
Section 5 – Main risks to projection

PwC
AppendixSection 6
Outlook for UK mail volumes to 202358

PwC
Research papers consulted
Publication details
Soteri, S., F. Fève, J.P. Florens and F. Rodriguez (2009). “Internet advertising and direct mail: trends and analysis for the UK”, in M.A. Crew andP.R. Kleindorfer (eds), Progress in the Competitive Agenda in the Postal and Delivery Sector, Cheltenham, UK and Northampton, MA,USA: Edward Elgar, pp. 209-22
Veruete-McKay.L, R. Sheldon, P. Burge and A. Lawrence (2013). “Electronic substitution and postal price elasticities: a customer marketapproach”, in M. A. Crew and P. R. Kleindorfer (eds), Reforming the Postal Sector in the Face of Electronic Competition, Edward Elgar,pp.226-40.
Buser, M., C. Jaag and U. Trinkner (2007). “Economics of post office networks: strategic issues and the impact on mail demand”, in M. A. Crew,P. R. Kleindorfer and J. I. Campbell Jnr (eds), Handbook of Worldwide Postal Reform, Cheltenham, UK and Northampton, MA, USA:Edward Elgar
Nikali, H. (2011). “Does the level of price elasticity change with the progression of substitution?”, in M. A. Crew and P. R. Kleindorfer (eds),Reforming the Postal Sector in an Electronic Age, Cheltenham, UK and Northampton, MA, USA: Edward Elgar
“Analysis of Postal Price Elasticities” Office of Inspector General, United States Postal Service (May 2013)
“Implications of Declining Mail Volumes for the Financial Sustainability of the Postal Service” Office of Inspector General, United States PostalService (September 2010)
Outlook for UK mail volumes to 202359
Section 6 – Appendix

PwC
Glossary
Outlook for UK mail volumes to 202360
Term Definition/Meaning
B2B Business to Business
B2C Business to Consumer
Base-case Case in our opinion most likely to materialise
By-pass Mail which is collected and delivered by companies other than Royal Mail
C2X Consumer to Consumer or Consumer to Business
CAGR Compound Annual Growth Rate
Click & Collect A service offered by retailers in which items are purchased online and then delivered to a store chosen by the customer for collection
Direct mail Advertising mail, e.g. Promotional leaflets
Downstream accessMail which is collected and distributed by companies other than Royal Mail but which is then passed on to Royal Mail for finaldelivery
Econometrics Statistical methods used in Economics
E-substitution Substitution of paper communication by electronic methods e.g. email
GDP Gross Domestic Product
HMRC Her Majesty’s Revenue and Customs
Inland Mail Includes all addressed letters and parcels sent within the UK (excludes unaddressed mail and all international letters and parcels)
Monte Carlo analysis A method of repeated random sampling
Pay-Per-Click An internet advertising model in which advertisers pay the publisher each time an advert is ‘clicked’
PDF Portable Document Format
Price elasticity A measure of the impact on mail volumes due to changing price
Publishing mail Includes mail such as Newsletters and Magazines
RPI Retail Price Index
SME Small and Medium sized Enterprises
Social mail Cards, letters and postcards
Transactional mail Typically mail that is sent in relation to a business or Government service, e.g. Invoices, insurance documents
VAT Value Added Tax
Section 6 – Appendix

This document has been prepared only for Royal Mail Group and solely for the purpose and on the terms agreed with Royal Mail Group. PwC accepts no liability (including fornegligence) to anyone else in connection with this document.