Embed Size (px)
Citation preview
1
The Outlook for the Japanese Economy
Economic Research Office
The Bank of Tokyo-Mitsubishi UFJ, Ltd.
~Economic Growth Likely to Slow, but Economy will Continue to Gradually Recover
Lead by Exports~ 1.Current Economic Conditions
Japanese economy is improving thanks to increase in exports primarily toward Asia, and rising sales of eco-cars and electric products boosted by the government’s stimulus measures. The real GDP growth of Oct-Dec 2009 was an annualized rate of 4.6% QoQ, a positive growth for three consecutive quarters, and was higher than expected in the market (Table 1). In addition, capital expenditures turned positive for the first time in seven quarters, which proves that adjustments in the corporate sector have been progressing due to improvement in exports. Supported by the continuing growth of exports reflecting solid overseas economies and consumption stimulus measures, we believe that the risk of a “double dip” is lower than it once had been.
However, individual statistics show domestic demand remains severe, such as the unemployment rate hovering high, and continuing fall of consumer prices. There are signs of a slowdown in economic recovery, as exports and production growth are weaker on monthly basis, and car sales seem to be peaking out.
GDP of Oct-Dec term grew positive for three straight quarters
Signs of slow down in economic recovery can be seen
February 25, 2010 (Original Japanese version released February 22, 2010)
Table 1 : Main Economic Indicators (percent changes from previous quarter or month)
2009/Apr-Jun Jul-Sep Oct-Dec 2009 / Oct Nov Dec Jan
Nominal GDP Growth Rate (annualized; q/q) ▲ 0.5 ▲ 1.8 0.9 - - - -
Real GDP Growth Rate (annualized; q/q) 5.2 0.0 4.6 - - - -
Index of Business Conditions (coincident index) 87.4 91.6 96.0 94.3 96.0 97.6 -
Index of Business Conditions (leading index) 78.6 84.8 91.5 89.5 91.0 94.0 -
Industrial Production 8.3 7.4 4.5 0.5 2.2 1.9 -
Machinery Orders (private, excl. shipping and electric power) ▲ 4.9 ▲ 0.9 0.5 ▲ 4.5 ▲ 11.3 20.1 -
Shipments of Capital Goods (excl. transport equipment) ▲ 17.0 5.3 11.1 ▲ 1.6 6.2 5.0 -
Number of Employees (nonagricultual industries) ▲ 1.6 ▲ 1.4 ▲ 1.6 ▲ 1.6 ▲ 1.7 ▲ 1.4
Nominal Cash Earnings (5 or more workers) ▲ 4.6 ▲ 3.6 ▲ 4.2 ▲ 1.9 ▲ 2.4 ▲ 6.1 -
Unemployment Rate (SA,%) 5.2 5.5 5.1 5.1 5.2 5.1
Aggregated Consumption Index (SA) 1.2 0.5 0.5 0.3 ▲ 0.4 0.5 -
Consumer Confidence (general households, q/q) 6.6 5.1 0.0 0.0 ▲ 1.0 ▲ 1.9 1.4
Exports Volume 10.8 10.5 10.6 9.2 ▲ 0.0 ▲ 1.3
Imports Volume ▲ 1.5 9.8 0.6 ▲ 5.7 8.7 ▲ 10.5Consumer Prices (excl. fresh food) ▲ 1.0 ▲ 2.3 ▲ 1.8 ▲ 2.2 ▲ 1.7 ▲ 1.3Notes: 1. Results for the number of employees, total cash earnings and domestic corporate goods prices are % changes from previous year. 2. Quarterly data for Index of business conditions are results for the end of each quarter. Sources: Compiled by the Research Office, Bank of Tokyo-Mitsubishi UFJ based on Cabinet Office "National Accounts", "Orders Received for Machinery ", "Consumer Confidence Survey ";METI "Industrial Production"; MOF "Trade Statistics"; Ministry of Health, Labour and Welfare "Monthly Labor Statistics", Ministry of Internal Affairs and Comunications "Consumer Price Index", "Labour Force Survey"
2
2.Outlook
<Summary>
Economy should be on a recovery path, but it will be difficult to maintain the rapid growth as we have seen until the Oct-Dec term. The strong growth has partly been a reaction to the drastic fall, so it is expected to slowdown in the future. The governments’ stimulus measure effects which have lead the economic recovery as well as exports will gradually disappear, and will be a factor for economic deceleration. However, the economy will continue to recover moderately, as exports will continue to increase, capital expenditures will stop worsening, and employment and income situation will gradually improve. We expect the real GDP growth for fiscal 2009 to be ▲2.2% YoY, and 1.3% YoY for fiscal 2010 (Figure 1).
Figure1:Real GDP Growth Rate
-16-14-12-10
-8-6-4-202468
10
03 04 05 06 07 08 09 10 11(year)
Private Consumption Housing InvestmentBusiness-fixed Investment Net Exports Inventory Investment Government ExpendituresGDP
Source: Compiled by BTMU Economic Research Office, based on Cabinet Office "National Accounting"
Forecast
(qoq saar,%)
However, there remain downward risks toward the economy. Especially regarding the foreign exchange rates, although we can see a break in the yen appreciation, conditions remain for the yen to progress further, and requires caution. In case the yen surges triggered by the fiscal conditions regarding the South European countries, chances will be higher for the economy to “double dip” due to worsening corporate profits, low stock prices, and fall in sentiment.
Gradual recovery expected to continue
Downward risk is the longing pressure of the strong yen
3
<Details>
(1)Corporate Sector
①Exports
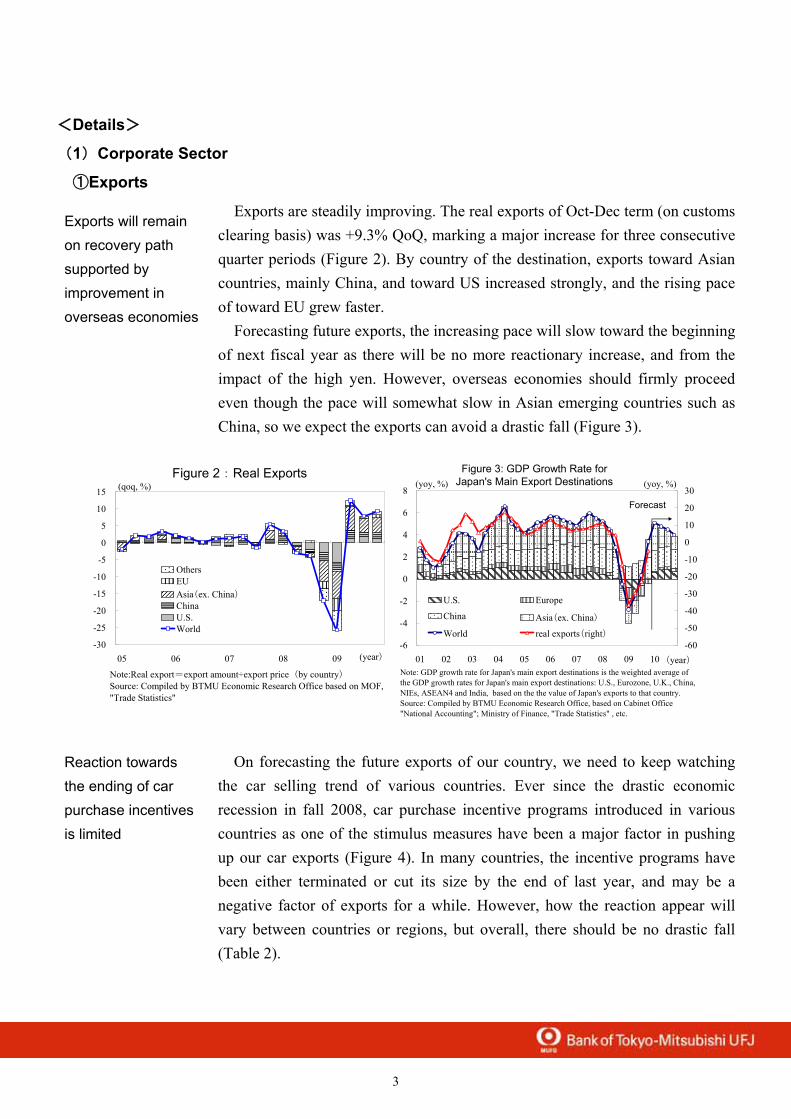
Exports are steadily improving. The real exports of Oct-Dec term (on customs clearing basis) was +9.3% QoQ, marking a major increase for three consecutive quarter periods (Figure 2). By country of the destination, exports toward Asian countries, mainly China, and toward US increased strongly, and the rising pace of toward EU grew faster.
Forecasting future exports, the increasing pace will slow toward the beginning of next fiscal year as there will be no more reactionary increase, and from the impact of the high yen. However, overseas economies should firmly proceed even though the pace will somewhat slow in Asian emerging countries such as China, so we expect the exports can avoid a drastic fall (Figure 3).
Figure 2:Real Exports
-30
-25
-20
-15
-10
-5
0
5
10
15
05 06 07 08 09
OthersEUAsia(ex. China)ChinaU.S.World
(qoq, %)
Note:Real export=export amount÷export price(by country)Source: Compiled by BTMU Economic Research Office based on MOF,"Trade Statistics"
(year)-6
-4
-2
0
2
4
6
8
01 02 03 04 05 06 07 08 09 10(year)-60
-50
-40
-30
-20
-10
0
10
20
30
U.S. Europe
China Asia(ex. China)
World real exports(right)
Figure 3: GDP Growth Rate forJapan's Main Export Destinations(yoy, %) (yoy, %)
Forecast
Note: GDP growth rate for Japan's main export destinations is the weighted average ofthe GDP growth rates for Japan's main export destinations: U.S., Eurozone, U.K., China,NIEs, ASEAN4 and India, based on the the value of Japan's exports to that country.Source: Compiled by BTMU Economic Research Office, based on Cabinet Office"National Accounting"; Ministry of Finance, "Trade Statistics" , etc.
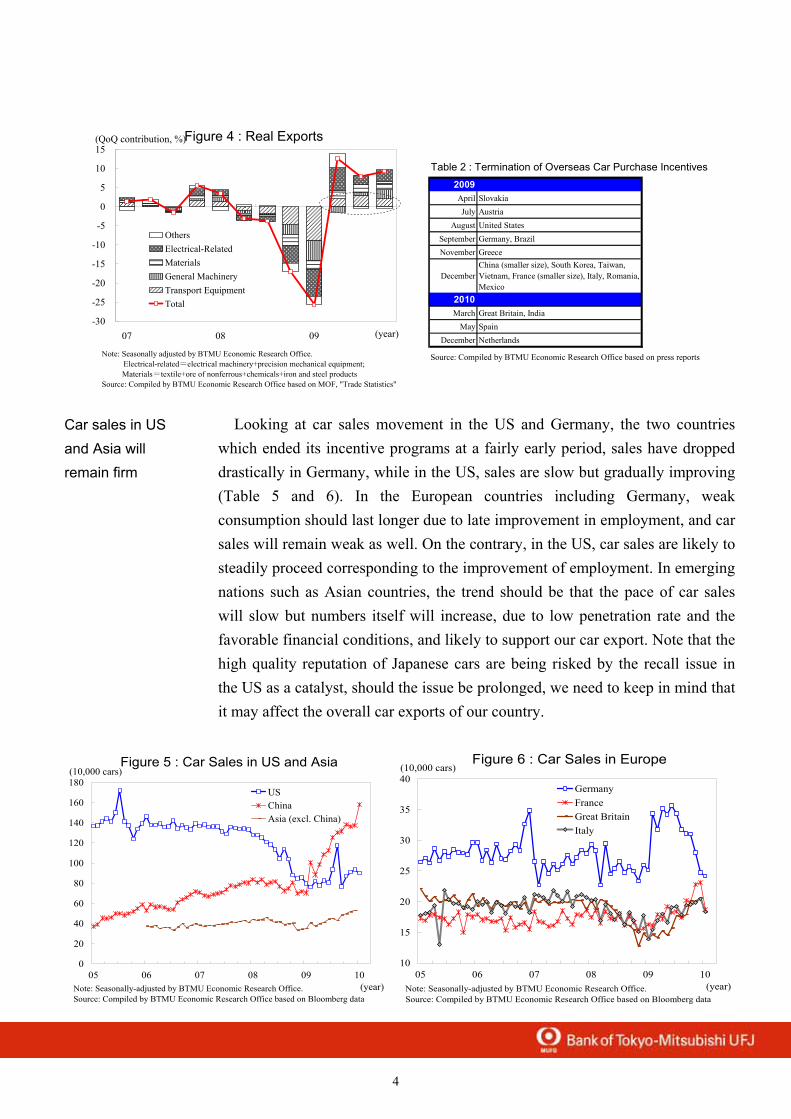
On forecasting the future exports of our country, we need to keep watching the car selling trend of various countries. Ever since the drastic economic recession in fall 2008, car purchase incentive programs introduced in various countries as one of the stimulus measures have been a major factor in pushing up our car exports (Figure 4). In many countries, the incentive programs have been either terminated or cut its size by the end of last year, and may be a negative factor of exports for a while. However, how the reaction appear will vary between countries or regions, but overall, there should be no drastic fall (Table 2).
Exports will remain on recovery path supported by improvement in overseas economies
Reaction towards the ending of car purchase incentives is limited
4
Table 2 : Termination of Overseas Car Purchase Incentives2009April SlovakiaJuly Austria
August United StatesSeptember Germany, BrazilNovember Greece
DecemberChina (smaller size), South Korea, Taiwan,Vietnam, France (smaller size), Italy, Romania,Mexico
2010March Great Britain, India
May SpainDecember Netherlands
Source: Compiled by BTMU Economic Research Office based on press reports
-30
-25
-20
-15
-10
-5
0
5
10
15
07 08 09 (year)
OthersElectrical-RelatedMaterialsGeneral MachineryTransport EquipmentTotal
Note: Seasonally adjusted by BTMU Economic Research Office. Electrical-related=electrical machinery+precision mechanical equipment; Materials=textile+ore of nonferrous+chemicals+iron and steel productsSource: Compiled by BTMU Economic Research Office based on MOF, "Trade Statistics"
Figure 4 : Real Exports(QoQ contribution, %)
Looking at car sales movement in the US and Germany, the two countries which ended its incentive programs at a fairly early period, sales have dropped drastically in Germany, while in the US, sales are slow but gradually improving (Table 5 and 6). In the European countries including Germany, weak consumption should last longer due to late improvement in employment, and car sales will remain weak as well. On the contrary, in the US, car sales are likely to steadily proceed corresponding to the improvement of employment. In emerging nations such as Asian countries, the trend should be that the pace of car sales will slow but numbers itself will increase, due to low penetration rate and the favorable financial conditions, and likely to support our car export. Note that the high quality reputation of Japanese cars are being risked by the recall issue in the US as a catalyst, should the issue be prolonged, we need to keep in mind that it may affect the overall car exports of our country.
Figure 5 : Car Sales in US and Asia
0
20
40
60
80
100
120
140
160
180
05 06 07 08 09 10(year)
USChinaAsia (excl. China)
Note: Seasonally-adjusted by BTMU Economic Research Office.Source: Compiled by BTMU Economic Research Office based on Bloomberg data
(10,000 cars)
Figure 6 : Car Sales in Europe
10
15
20
25
30
35
40
05 06 07 08 09 10(year)
GermanyFranceGreat BritainItaly
Note: Seasonally-adjusted by BTMU Economic Research Office.Source: Compiled by BTMU Economic Research Office based on Bloomberg data
(10,000 cars)
Car sales in US and Asia will remain firm
5
②Production
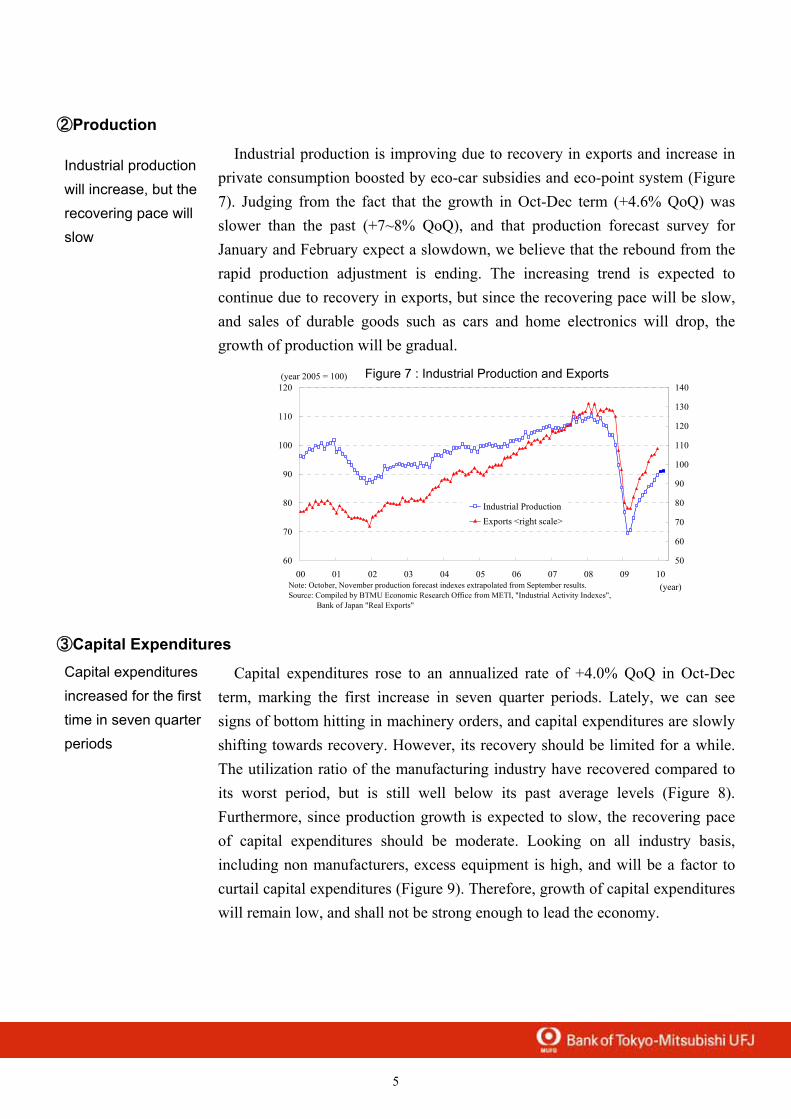
Industrial production is improving due to recovery in exports and increase in private consumption boosted by eco-car subsidies and eco-point system (Figure 7). Judging from the fact that the growth in Oct-Dec term (+4.6% QoQ) was slower than the past (+7~8% QoQ), and that production forecast survey for January and February expect a slowdown, we believe that the rebound from the rapid production adjustment is ending. The increasing trend is expected to continue due to recovery in exports, but since the recovering pace will be slow, and sales of durable goods such as cars and home electronics will drop, the growth of production will be gradual.
Figure 7 : Industrial Production and Exports
60
70
80
90
100
110
120
00 01 02 03 04 05 06 07 08 09 10(year)
50
60
70
80
90
100
110
120
130
140
Industrial ProductionExports <right scale>
(year 2005 = 100)
Note: October, November production forecast indexes extrapolated from September results.Source: Compiled by BTMU Economic Research Office from METI, "Industrial Activity Indexes", Bank of Japan "Real Exports"
③Capital Expenditures
Capital expenditures rose to an annualized rate of +4.0% QoQ in Oct-Dec term, marking the first increase in seven quarter periods. Lately, we can see signs of bottom hitting in machinery orders, and capital expenditures are slowly shifting towards recovery. However, its recovery should be limited for a while. The utilization ratio of the manufacturing industry have recovered compared to its worst period, but is still well below its past average levels (Figure 8). Furthermore, since production growth is expected to slow, the recovering pace of capital expenditures should be moderate. Looking on all industry basis, including non manufacturers, excess equipment is high, and will be a factor to curtail capital expenditures (Figure 9). Therefore, growth of capital expenditures will remain low, and shall not be strong enough to lead the economy.
Industrial production will increase, but the recovering pace will slow
Capital expenditures increased for the first time in seven quarter periods
6
Figure 8 : Capacity Utilization Ratio
45
50
55
60
65
70
75
80
85
90
95 96 97 98 99 00 01 02 03 04 05 06 07 08 09 10(year)Notes : December capacity utilization ratio is the actual data from "Industrial
Production", data for january and february have been estimated by the forecastdata.Based on the assumption that production capacity remains flat.Source: Compiled by BTMU Economic Research Office based on METI, "IndustrialProduction" and the Cabinet Office
(seasonally adjusted, %)
12
13
14
15
16
17
18
19
20
21
22
91 92 93 94 95 96 97 98 99 00 01 02 03 04 05 06 07 08 09 10(year)
(%)-15
-10
-5
0
5
10
15
20
25
30
Nominal Capital Expenditures as % of GDP
Production Capacity DI (all companies, right, inverse axis)
(DI, %, 'Excess' minus 'Insufficient')
Note: March 2010 Production Capacity DI is forecast.Source: Compiled by BTMU Economic Research Office from Cabinet Office ,"National Accountsof Japan", BoJ "Tankan Survey" materials.
Figure 9 : Capital Expenditures and Production Capacity DI
(3)Household Sector ①Private Consumption
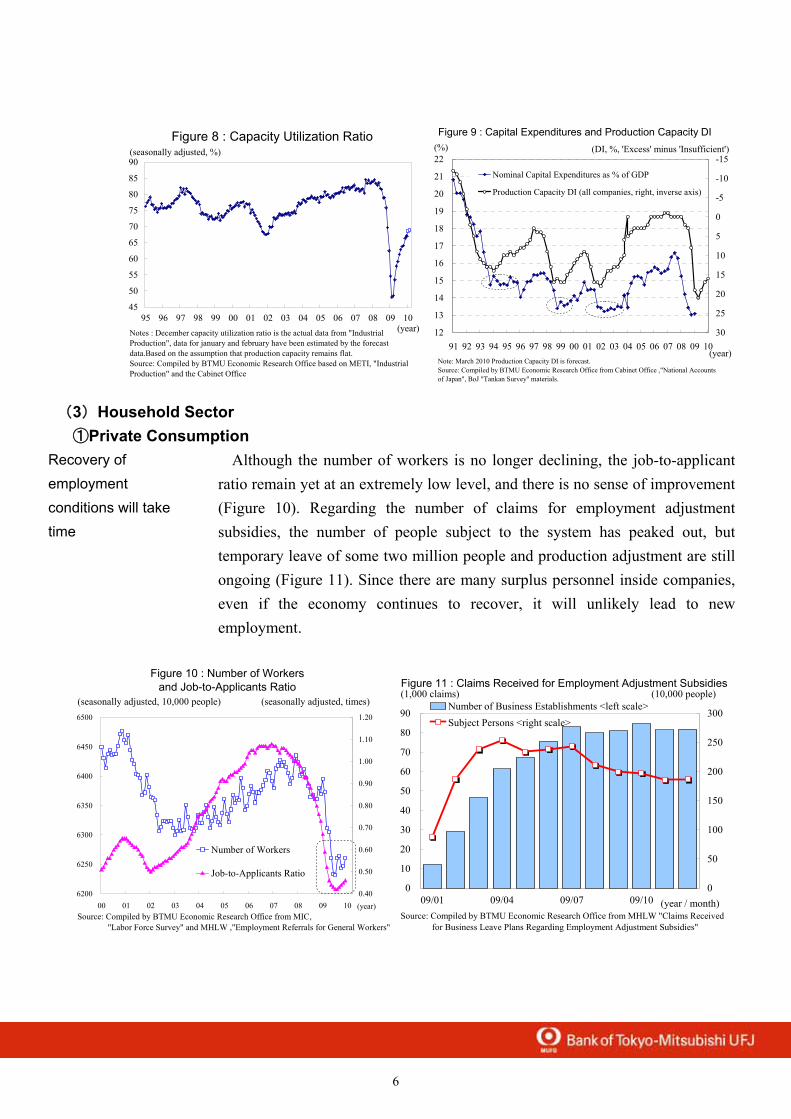
Although the number of workers is no longer declining, the job-to-applicant ratio remain yet at an extremely low level, and there is no sense of improvement (Figure 10). Regarding the number of claims for employment adjustment subsidies, the number of people subject to the system has peaked out, but temporary leave of some two million people and production adjustment are still ongoing (Figure 11). Since there are many surplus personnel inside companies, even if the economy continues to recover, it will unlikely lead to new employment.
Figure 10 : Number of Workersand Job-to-Applicants Ratio
6200
6250
6300
6350
6400
6450
6500
00 01 02 03 04 05 06 07 08 09 10 (year)0.40
0.50
0.60
0.70
0.80
0.90
1.00
1.10
1.20
Number of Workers
Job-to-Applicants Ratio
Source: Compiled by BTMU Economic Research Office from MIC, "Labor Force Survey" and MHLW ,"Employment Referrals for General Workers"
(seasonally adjusted, 10,000 people) (seasonally adjusted, times)
0
10
20
30
40
50
60
70
80
90
09/01 09/04 09/07 09/10 (year / month)0
50
100
150
200
250
300Number of Business Establishments <left scale>Subject Persons <right scale>
Source: Compiled by BTMU Economic Research Office from MHLW "Claims Received for Business Leave Plans Regarding Employment Adjustment Subsidies"
Figure 11 : Claims Received for Employment Adjustment Subsidies(1,000 claims) (10,000 people)
Recovery of employment conditions will take time
7
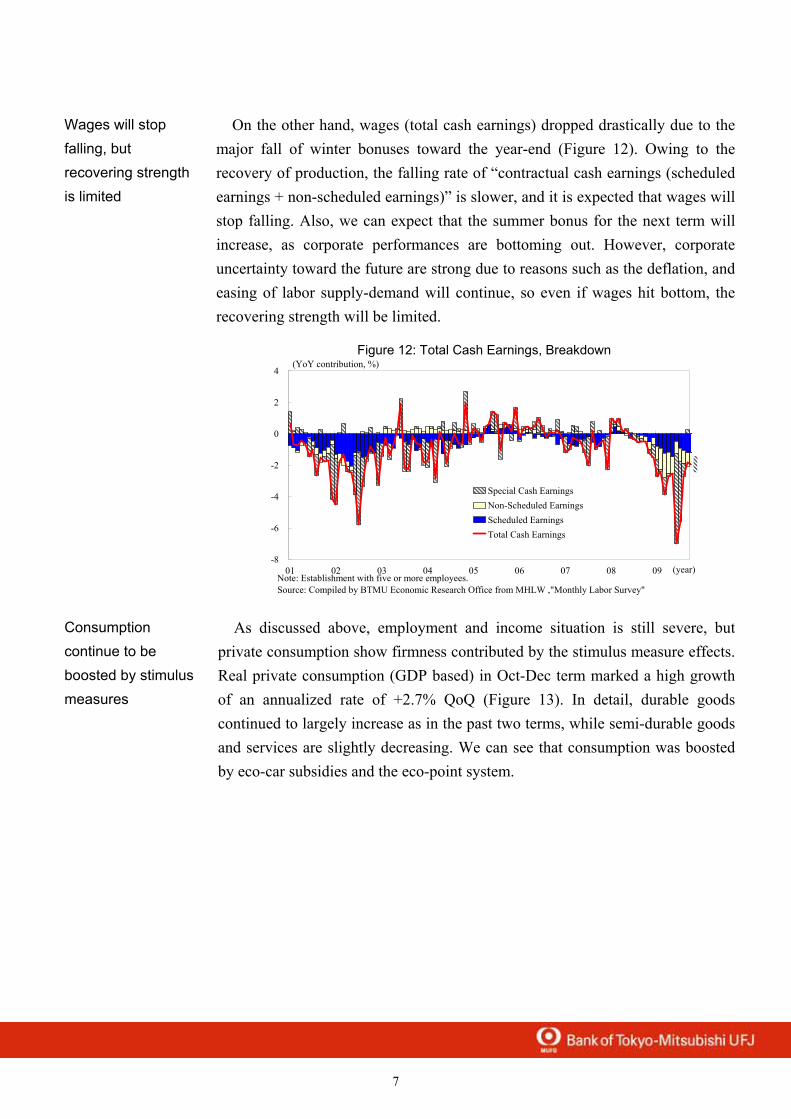
On the other hand, wages (total cash earnings) dropped drastically due to the major fall of winter bonuses toward the year-end (Figure 12). Owing to the recovery of production, the falling rate of “contractual cash earnings (scheduled earnings + non-scheduled earnings)” is slower, and it is expected that wages will stop falling. Also, we can expect that the summer bonus for the next term will increase, as corporate performances are bottoming out. However, corporate uncertainty toward the future are strong due to reasons such as the deflation, and easing of labor supply-demand will continue, so even if wages hit bottom, the recovering strength will be limited.
Figure 12: Total Cash Earnings, Breakdown
-8
-6
-4
-2
0
2
4
01 02 03 04 05 06 07 08 09 (year)
Special Cash EarningsNon-Scheduled EarningsScheduled EarningsTotal Cash Earnings
Note: Establishment with five or more employees.Source: Compiled by BTMU Economic Research Office from MHLW ,"Monthly Labor Survey"
(YoY contribution, %)
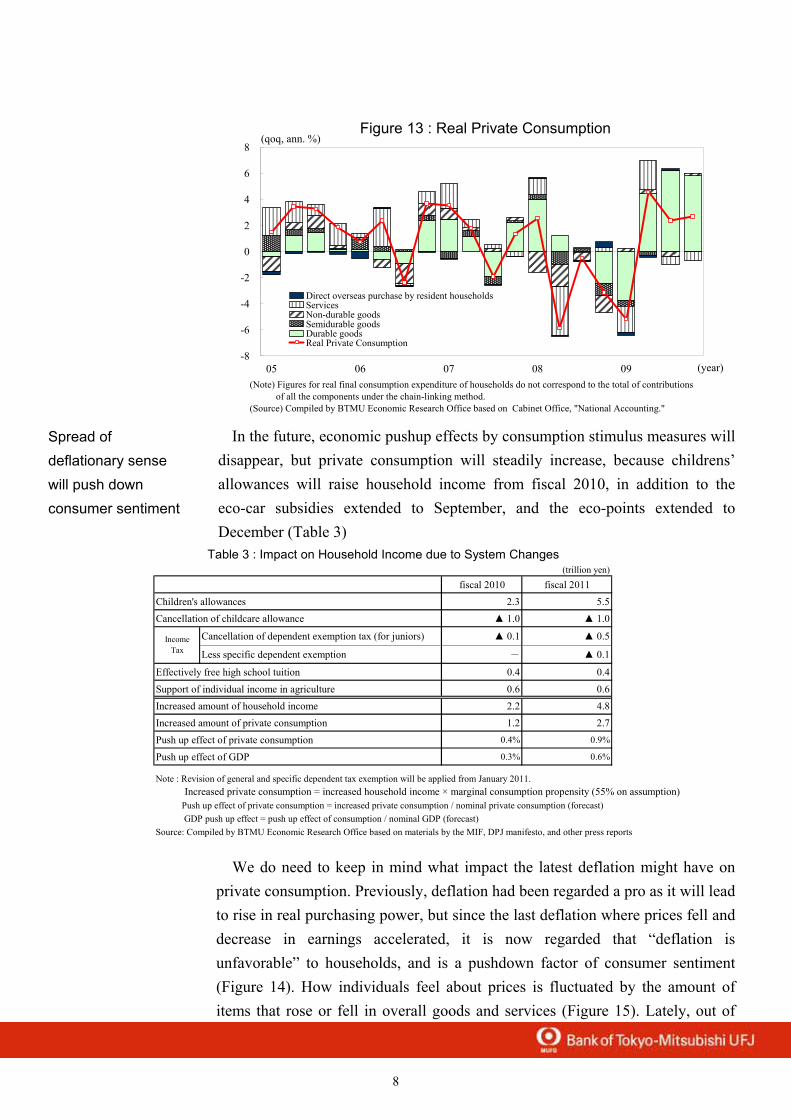
As discussed above, employment and income situation is still severe, but private consumption show firmness contributed by the stimulus measure effects. Real private consumption (GDP based) in Oct-Dec term marked a high growth of an annualized rate of +2.7% QoQ (Figure 13). In detail, durable goods continued to largely increase as in the past two terms, while semi-durable goods and services are slightly decreasing. We can see that consumption was boosted by eco-car subsidies and the eco-point system.
Wages will stop falling, but recovering strength is limited
Consumption continue to be boosted by stimulus measures
8
Figure 13 : Real Private Consumption
-8
-6
-4
-2
0
2
4
6
8
05 06 07 08 09 (year)
Direct overseas purchase by resident householdsServicesNon-durable goodsSemidurable goodsDurable goodsReal Private Consumption
(Note) Figures for real final consumption expenditure of households do not correspond to the total of contributions of all the components under the chain-linking method.(Source) Compiled by BTMU Economic Research Office based on Cabinet Office, "National Accounting."
(qoq, ann. %)
In the future, economic pushup effects by consumption stimulus measures will
disappear, but private consumption will steadily increase, because childrens’ allowances will raise household income from fiscal 2010, in addition to the eco-car subsidies extended to September, and the eco-points extended to December (Table 3)
(trillion yen)
fiscal 2010 fiscal 2011Children's allowances 2.3 5.5Cancellation of childcare allowance ▲ 1.0 ▲ 1.0
Cancellation of dependent exemption tax (for juniors) ▲ 0.1 ▲ 0.5
Less specific dependent exemption - ▲ 0.1
Effectively free high school tuition 0.4 0.4
Support of individual income in agriculture 0.6 0.6Increased amount of household income 2.2 4.8Increased amount of private consumption 1.2 2.7Push up effect of private consumption 0.4% 0.9%
Push up effect of GDP 0.3% 0.6%
Note : Revision of general and specific dependent tax exemption will be applied from January 2011. Increased private consumption = increased household income × marginal consumption propensity (55% on assumption) Push up effect of private consumption = increased private consumption / nominal private consumption (forecast) GDP push up effect = push up effect of consumption / nominal GDP (forecast)Source: Compiled by BTMU Economic Research Office based on materials by the MIF, DPJ manifesto, and other press reports
IncomeTax
Table 3 : Impact on Household Income due to System Changes
We do need to keep in mind what impact the latest deflation might have on
private consumption. Previously, deflation had been regarded a pro as it will lead to rise in real purchasing power, but since the last deflation where prices fell and decrease in earnings accelerated, it is now regarded that “deflation is unfavorable” to households, and is a pushdown factor of consumer sentiment (Figure 14). How individuals feel about prices is fluctuated by the amount of items that rose or fell in overall goods and services (Figure 15). Lately, out of
Spread of deflationary sense will push down consumer sentiment
9
the core-CPI items, there are many which prices fell, but the number is still small compared to around 2002. Considering the fact that there are now further deflationary gap as had in the past deflationary period, it is likely that there will be more items which the prices would fall. When people start thinking that prices would really fall, they will be more frugal than ever, and actual spending will be at the risk of being pushed down.
0
10
20
30
40
5000 01 02 03 04 05 06 07 08 09 10(year)
(%)
-60-50-40-30-20-10010203040
(DI)Perception of Price Levels
Number of Declined Items DI<right scale>
Note : Perception of price levels : the percentage of people who answered present prices "have gone down" compared to one year ago. Number of declined items DI : the percentage of the number of "items which prices have rised" - "items which prices have fallen" out of the core-CPI items.Source : Compiled by BTMU Economic Research Office based on the Bank of Japan "Survey on the General Public's Views and Behavior" and the MIC "Consumer Price Index"
Figure 14 : Perception of Price Levelsand Number of Declined Items DI 0
5
10
15
2000 01 02 03 04 05 06 07 08 09 10
(year)
(DI)
25
30
35
40
45
50(sa, pt)
Perception of price levels
Consumer confidence index<right scale>
Note : Perception of price levels is the weighted average of the percentage of people who answered that the price decline is "rather favorable" = 0, "neither favorable nor unfavorable" = 50, "rather unfavorable" = 100. The higher the DI, the stronger the people feel that the "price decline is rather unfavorable" Survey was taken semi-annually until 2003. Survey was not taken on September 2005, and during September 2006- May 2009.Source : Compiled by BTMU Economic Research Office based on the Bank of Japan "Survey on the General Public's Views and Behavior" and the MIC "Consumer Price Index"
Figure 15 : Perception of Price Levels and Consumer Sentiment
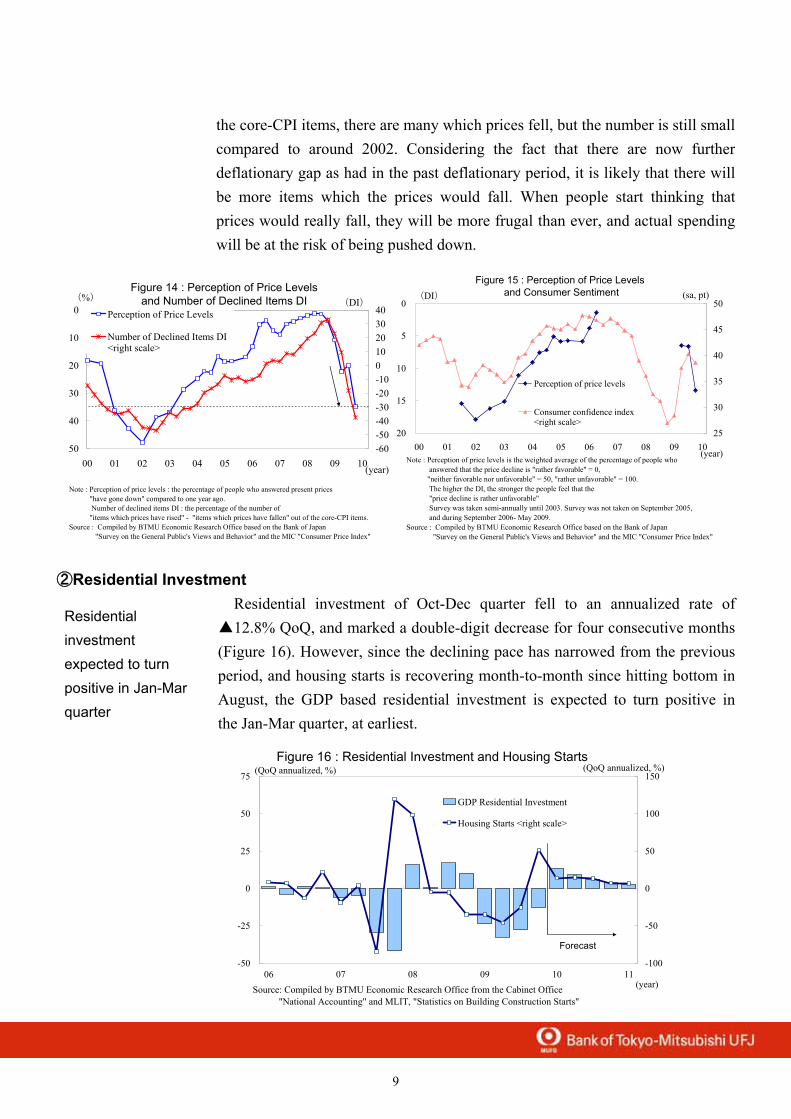
②Residential Investment Residential investment of Oct-Dec quarter fell to an annualized rate of
▲12.8% QoQ, and marked a double-digit decrease for four consecutive months (Figure 16). However, since the declining pace has narrowed from the previous period, and housing starts is recovering month-to-month since hitting bottom in August, the GDP based residential investment is expected to turn positive in the Jan-Mar quarter, at earliest.
-50
-25
0
25
50
75
06 07 08 09 10 11(year)
-100
-50
0
50
100
150
GDP Residential Investment
Housing Starts <right scale>
Source: Compiled by BTMU Economic Research Office from the Cabinet Office "National Accounting" and MLIT, "Statistics on Building Construction Starts"
Forecast
Figure 16 : Residential Investment and Housing Starts(QoQ annualized, %) (QoQ annualized, %)
Residential investment expected to turn positive in Jan-Mar quarter
10
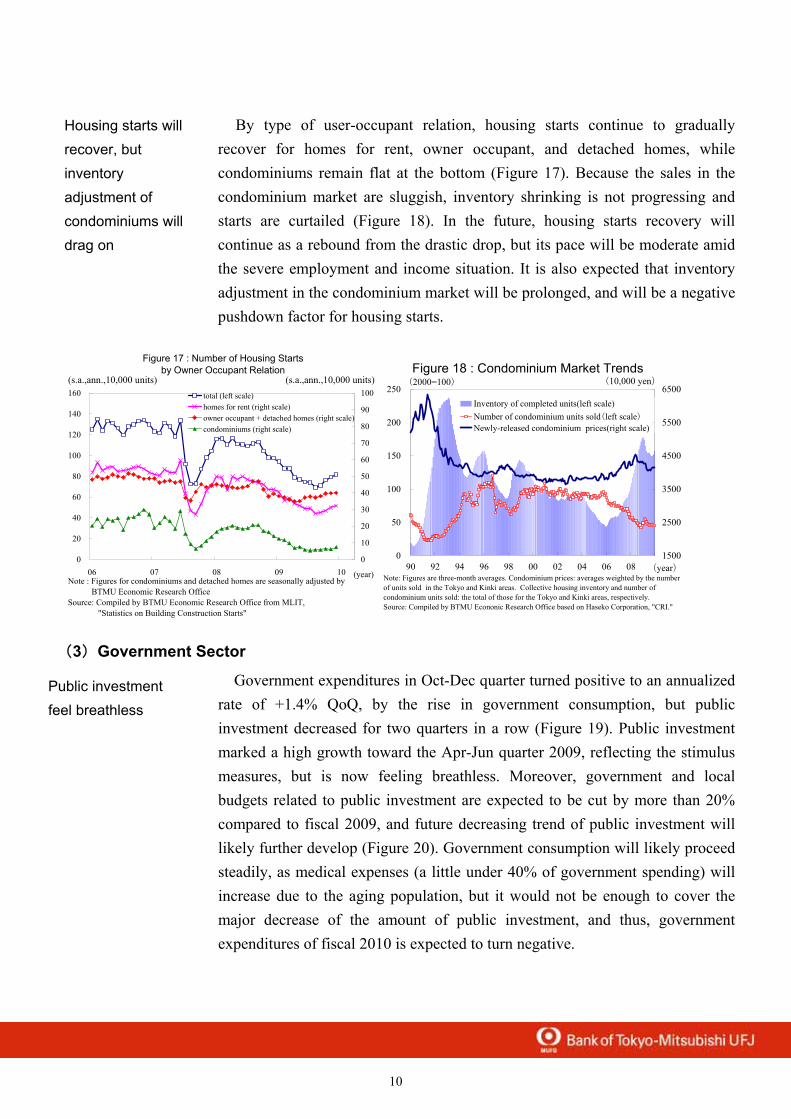
By type of user-occupant relation, housing starts continue to gradually recover for homes for rent, owner occupant, and detached homes, while condominiums remain flat at the bottom (Figure 17). Because the sales in the condominium market are sluggish, inventory shrinking is not progressing and starts are curtailed (Figure 18). In the future, housing starts recovery will continue as a rebound from the drastic drop, but its pace will be moderate amid the severe employment and income situation. It is also expected that inventory adjustment in the condominium market will be prolonged, and will be a negative pushdown factor for housing starts.
0
20
40
60
80
100
120
140
160
06 07 08 09 10 (year)
0
10
20
30
40
50
60
70
80
90
100total (left scale)homes for rent (right scale)owner occupant + detached homes (right scale)condominiums (right scale)
Note : Figures for condominiums and detached homes are seasonally adjusted by BTMU Economic Research OfficeSource: Compiled by BTMU Economic Research Office from MLIT, "Statistics on Building Construction Starts"
(s.a.,ann.,10,000 units)
Figure 17 : Number of Housing Startsby Owner Occupant Relation
(s.a.,ann.,10,000 units)Figure 18 : Condominium Market Trends
0
50
100
150
200
250
90 92 94 96 98 00 02 04 06 08 (year)
(2000=100)
1500
2500
3500
4500
5500
6500(10,000 yen)
Inventory of completed units(left scale)Number of condominium units sold(left scale)Newly-released condominium prices(right scale)
Note: Figures are three-month averages. Condominium prices: averages weighted by the numberof units sold in the Tokyo and Kinki areas. Collective housing inventory and number ofcondominium units sold: the total of those for the Tokyo and Kinki areas, respectively.Source: Compiled by BTMU Econonic Research Office based on Haseko Corporation, "CRI."
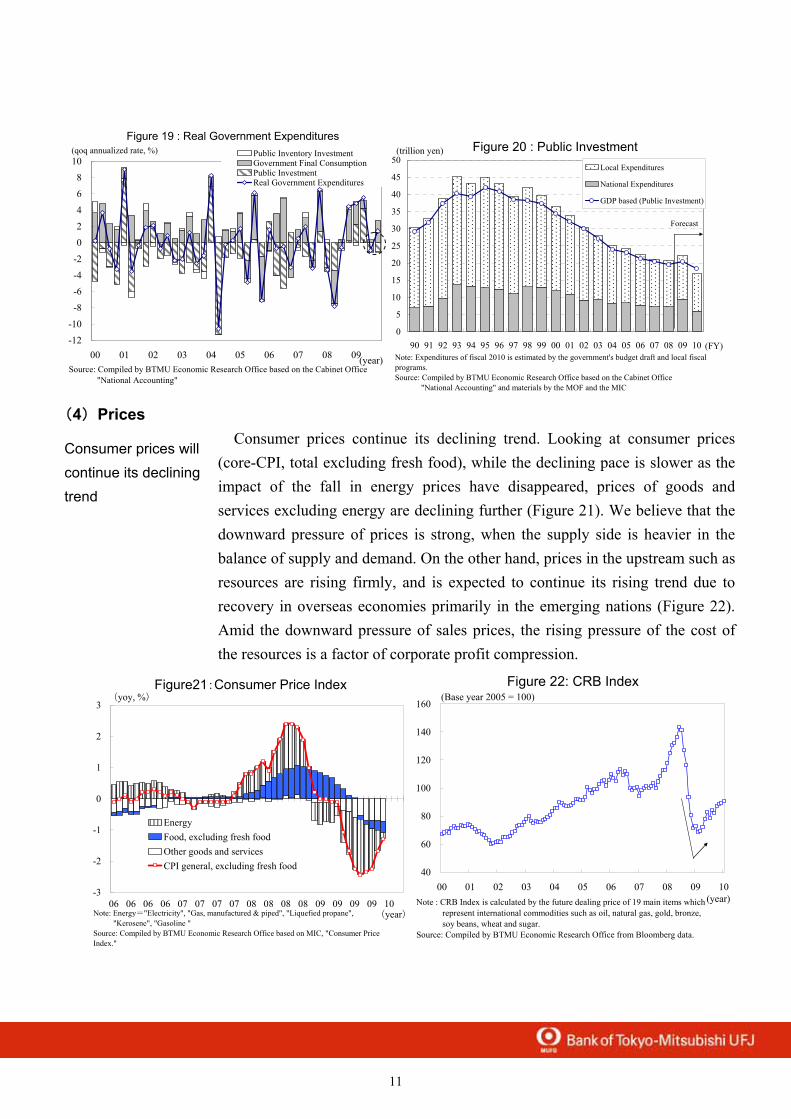
(3)Government Sector
Government expenditures in Oct-Dec quarter turned positive to an annualized rate of +1.4% QoQ, by the rise in government consumption, but public investment decreased for two quarters in a row (Figure 19). Public investment marked a high growth toward the Apr-Jun quarter 2009, reflecting the stimulus measures, but is now feeling breathless. Moreover, government and local budgets related to public investment are expected to be cut by more than 20% compared to fiscal 2009, and future decreasing trend of public investment will likely further develop (Figure 20). Government consumption will likely proceed steadily, as medical expenses (a little under 40% of government spending) will increase due to the aging population, but it would not be enough to cover the major decrease of the amount of public investment, and thus, government expenditures of fiscal 2010 is expected to turn negative.
Public investment feel breathless
Housing starts will recover, but inventory adjustment of condominiums will drag on
11
Figure 19 : Real Government Expenditures
-12-10
-8
-6-4
-2
0
24
6
810
00 01 02 03 04 05 06 07 08 09(year)
Public Inventory InvestmentGovernment Final ConsumptionPublic InvestmentReal Government Expenditures
Source: Compiled by BTMU Economic Research Office based on the Cabinet Office "National Accounting"
(qoq annualized rate, %) Figure 20 : Public Investment
0
5
10
15
20
25
30
35
40
45
50
90 91 92 93 94 95 96 97 98 99 00 01 02 03 04 05 06 07 08 09 10 (FY)
(trillion yen)
Local Expenditures
National Expenditures
GDP based (Public Investment)
Note: Expenditures of fiscal 2010 is estimated by the government's budget draft and local fiscalprograms.Source: Compiled by BTMU Economic Research Office based on the Cabinet Office "National Accounting" and materials by the MOF and the MIC
Forecast
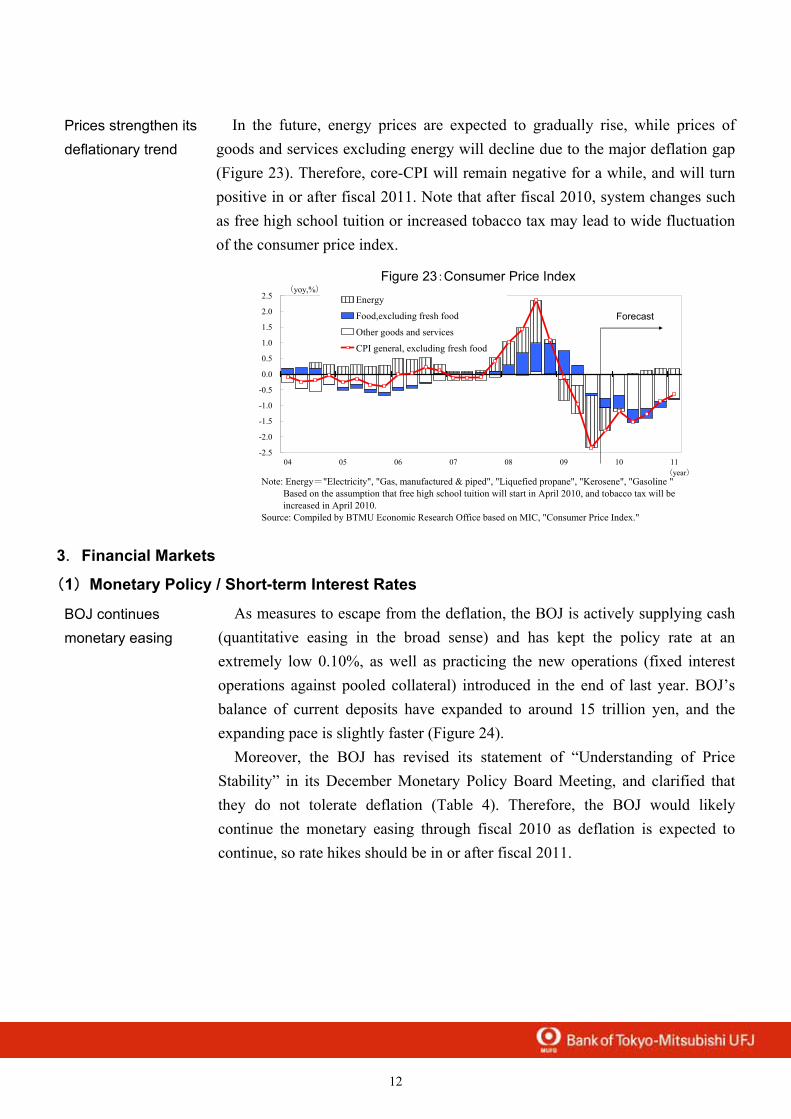
(4)Prices
Consumer prices continue its declining trend. Looking at consumer prices (core-CPI, total excluding fresh food), while the declining pace is slower as the impact of the fall in energy prices have disappeared, prices of goods and services excluding energy are declining further (Figure 21). We believe that the downward pressure of prices is strong, when the supply side is heavier in the balance of supply and demand. On the other hand, prices in the upstream such as resources are rising firmly, and is expected to continue its rising trend due to recovery in overseas economies primarily in the emerging nations (Figure 22). Amid the downward pressure of sales prices, the rising pressure of the cost of the resources is a factor of corporate profit compression.
Figure21:Consumer Price Index
-3
-2
-1
0
1
2
3
06 06 06 06 07 07 07 07 08 08 08 08 09 09 09 09 10(year)
(yoy, %)
EnergyFood, excluding fresh foodOther goods and servicesCPI general, excluding fresh food
Note: Energy="Electricity", "Gas, manufactured & piped", "Liquefied propane", "Kerosene", "Gasoline "Source: Compiled by BTMU Economic Research Office based on MIC, "Consumer PriceIndex."
Figure 22: CRB Index
40
60
80
100
120
140
160
00 01 02 03 04 05 06 07 08 09 10(year)
(Base year 2005 = 100)
Note : CRB Index is calculated by the future dealing price of 19 main items which represent international commodities such as oil, natural gas, gold, bronze, soy beans, wheat and sugar.Source: Compiled by BTMU Economic Research Office from Bloomberg data.
Consumer prices will continue its declining trend
12
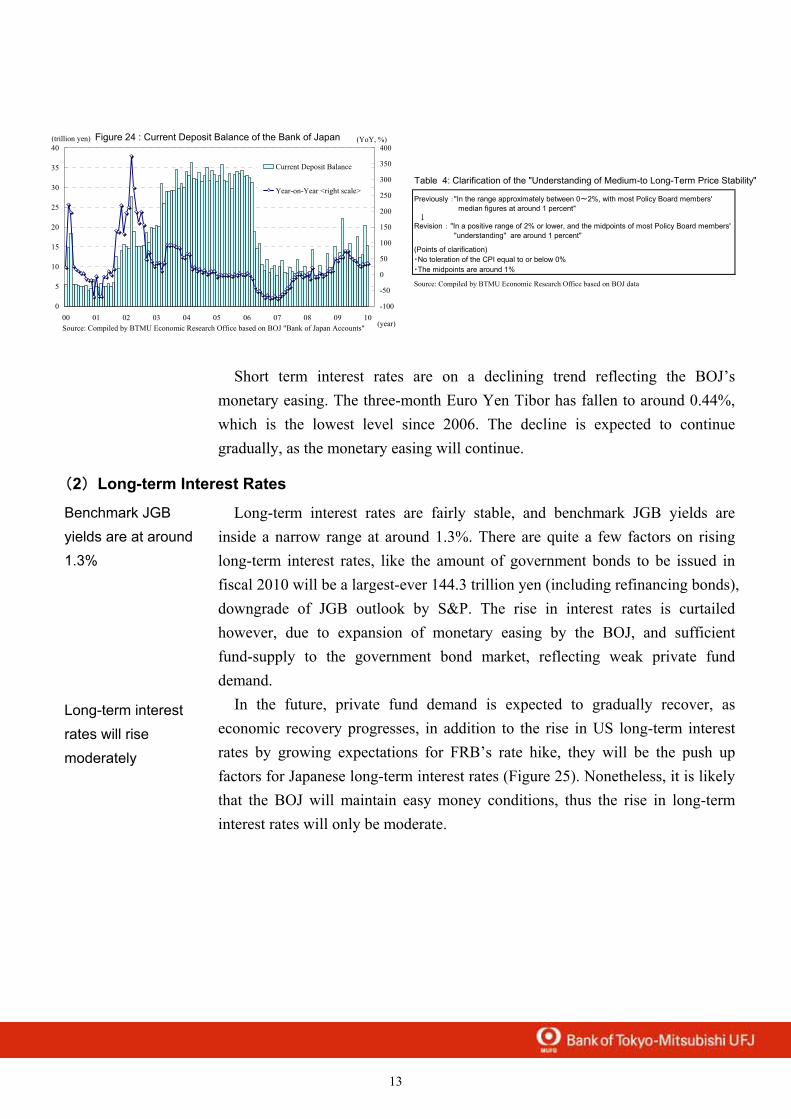
In the future, energy prices are expected to gradually rise, while prices of goods and services excluding energy will decline due to the major deflation gap (Figure 23). Therefore, core-CPI will remain negative for a while, and will turn positive in or after fiscal 2011. Note that after fiscal 2010, system changes such as free high school tuition or increased tobacco tax may lead to wide fluctuation of the consumer price index.
Figure 23:Consumer Price Index
-2.5
-2.0
-1.5
-1.0
-0.5
0.0
0.5
1.0
1.5
2.0
2.5
04 05 06 07 08 09 10 11(year)
(yoy,%)
Energy
Food,excluding fresh food
Other goods and services
CPI general, excluding fresh food
Note: Energy="Electricity", "Gas, manufactured & piped", "Liquefied propane", "Kerosene", "Gasoline " Based on the assumption that free high school tuition will start in April 2010, and tobacco tax will be increased in April 2010.Source: Compiled by BTMU Economic Research Office based on MIC, "Consumer Price Index."
Forecast
3.Financial Markets
(1)Monetary Policy / Short-term Interest Rates
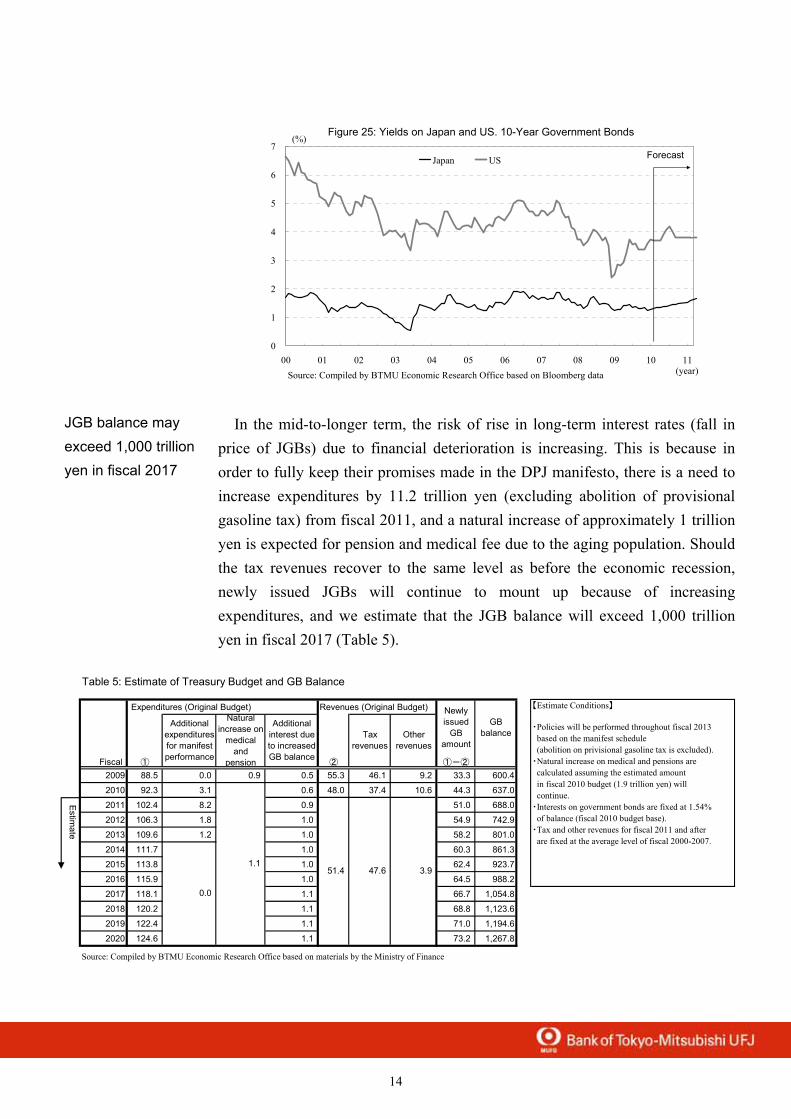
As measures to escape from the deflation, the BOJ is actively supplying cash (quantitative easing in the broad sense) and has kept the policy rate at an extremely low 0.10%, as well as practicing the new operations (fixed interest operations against pooled collateral) introduced in the end of last year. BOJ’s balance of current deposits have expanded to around 15 trillion yen, and the expanding pace is slightly faster (Figure 24).
Moreover, the BOJ has revised its statement of “Understanding of Price Stability” in its December Monetary Policy Board Meeting, and clarified that they do not tolerate deflation (Table 4). Therefore, the BOJ would likely continue the monetary easing through fiscal 2010 as deflation is expected to continue, so rate hikes should be in or after fiscal 2011.
Prices strengthen its deflationary trend
BOJ continues monetary easing
13
Table 4: Clarification of the "Understanding of Medium-to Long-Term Price Stability"
Previously :"In the range approximately between 0~2%, with most Policy Board members' median figures at around 1 percent"↓
Revision : "In a positive range of 2% or lower, and the midpoints of most Policy Board members' "understanding" are around 1 percent"
(Points of clarification)・No toleration of the CPI equal to or below 0%・The midpoints are around 1%
Source: Compiled by BTMU Economic Research Office based on BOJ data
Figure 24 : Current Deposit Balance of the Bank of Japan
0
5
10
15
20
25
30
35
40
00 01 02 03 04 05 06 07 08 09 10(year)
(trillion yen)
-100
-50
0
50
100
150
200
250
300
350
400(YoY, %)
Current Deposit Balance
Year-on-Year <right scale>
Source: Compiled by BTMU Economic Research Office based on BOJ "Bank of Japan Accounts"
Short term interest rates are on a declining trend reflecting the BOJ’s monetary easing. The three-month Euro Yen Tibor has fallen to around 0.44%, which is the lowest level since 2006. The decline is expected to continue gradually, as the monetary easing will continue.
(2)Long-term Interest Rates
Long-term interest rates are fairly stable, and benchmark JGB yields are inside a narrow range at around 1.3%. There are quite a few factors on rising long-term interest rates, like the amount of government bonds to be issued in fiscal 2010 will be a largest-ever 144.3 trillion yen (including refinancing bonds), downgrade of JGB outlook by S&P. The rise in interest rates is curtailed however, due to expansion of monetary easing by the BOJ, and sufficient fund-supply to the government bond market, reflecting weak private fund demand.
In the future, private fund demand is expected to gradually recover, as economic recovery progresses, in addition to the rise in US long-term interest rates by growing expectations for FRB’s rate hike, they will be the push up factors for Japanese long-term interest rates (Figure 25). Nonetheless, it is likely that the BOJ will maintain easy money conditions, thus the rise in long-term interest rates will only be moderate.
Benchmark JGB yields are at around 1.3%
Long-term interest rates will rise moderately
14
Figure 25: Yields on Japan and US. 10-Year Government Bonds
0
1
2
3
4
5
6
7
00 01 02 03 04 05 06 07 08 09 10 11(year)
(%)
Japan US
Source: Compiled by BTMU Economic Research Office based on Bloomberg data
Forecast
In the mid-to-longer term, the risk of rise in long-term interest rates (fall in price of JGBs) due to financial deterioration is increasing. This is because in order to fully keep their promises made in the DPJ manifesto, there is a need to increase expenditures by 11.2 trillion yen (excluding abolition of provisional gasoline tax) from fiscal 2011, and a natural increase of approximately 1 trillion yen is expected for pension and medical fee due to the aging population. Should the tax revenues recover to the same level as before the economic recession, newly issued JGBs will continue to mount up because of increasing expenditures, and we estimate that the JGB balance will exceed 1,000 trillion yen in fiscal 2017 (Table 5).
Table 5: Estimate of Treasury Budget and GB Balance
Expenditures (Original Budget) Revenues (Original Budget)
Fiscal ① ② ①-②
2009 88.5 0.0 0.9 0.5 55.3 46.1 9.2 33.3 600.4
2010 92.3 3.1 0.6 48.0 37.4 10.6 44.3 637.0
2011 102.4 8.2 0.9 51.0 688.0
2012 106.3 1.8 1.0 54.9 742.9
2013 109.6 1.2 1.0 58.2 801.0
2014 111.7 1.0 60.3 861.3
2015 113.8 1.0 62.4 923.7
2016 115.9 1.0 64.5 988.2
2017 118.1 1.1 66.7 1,054.8
2018 120.2 1.1 68.8 1,123.6
2019 122.4 1.1 71.0 1,194.6
2020 124.6 1.1 73.2 1,267.8
Source: Compiled by BTMU Economic Research Office based on materials by the Ministry of Finance
【Estimate Conditions】
・Policies will be performed throughout fiscal 2013 based on the manifest schedule (abolition on privisional gasoline tax is excluded).・Natural increase on medical and pensions are calculated assuming the estimated amount in fiscal 2010 budget (1.9 trillion yen) will continue.・Interests on government bonds are fixed at 1.54% of balance (fiscal 2010 budget base).・Tax and other revenues for fiscal 2011 and after are fixed at the average level of fiscal 2000-2007.
Estim
ate
1.1
0.0
47.6 3.951.4
Otherrevenues
Newlyissued
GBamount
GBbalance
Additionalexpendituresfor manifestperformance
Naturalincrease on
medicaland
pension
Additionalinterest dueto increasedGB balance
Taxrevenues
JGB balance may exceed 1,000 trillion yen in fiscal 2017
15
The government intends to organize by June a “Financial Operation Strategy” that sets a path for fiscal soundness, and a “Mid-term Financial Frame” to set the outlines of expenditures and revenues for the next three years until fiscal 2013, but should there be no practical measures, it will lead to loss of trust for mid-to-long term financial stability. In addition to cutting expenditures by the screening process, they need to strengthen effectiveness of the fiscal soundness measures by considering revision of the tax program including rising consumption tax, or the social security program.
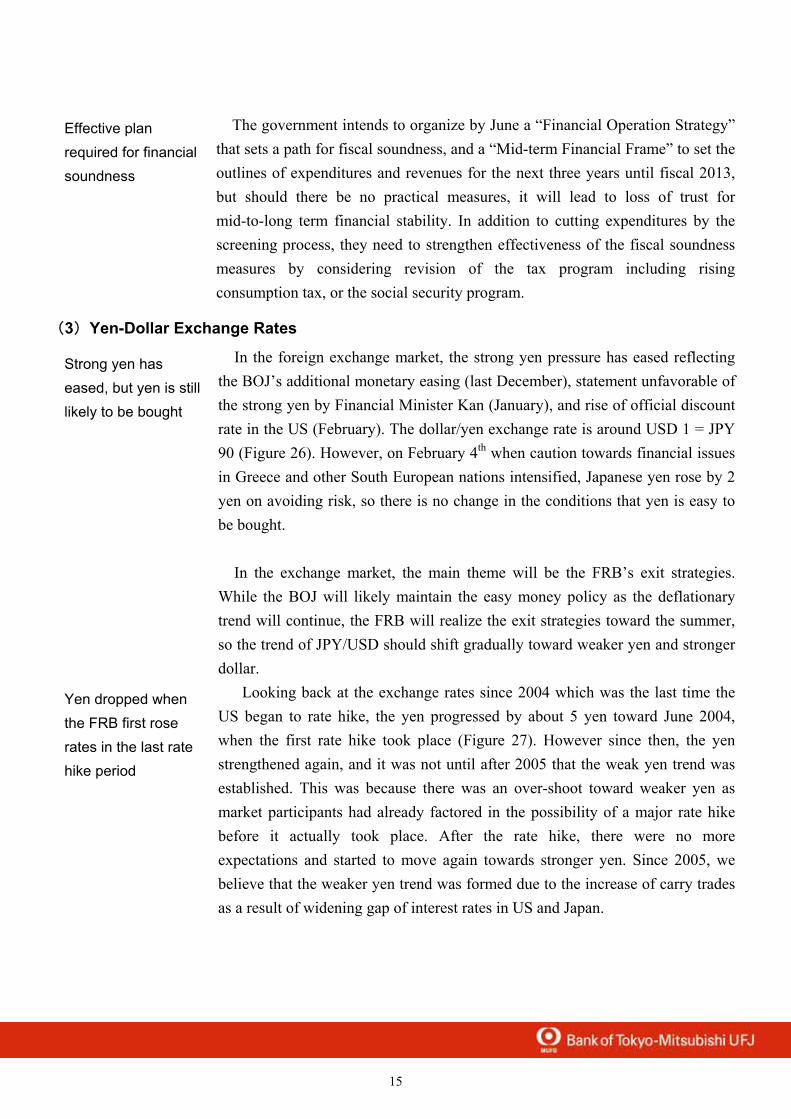
(3)Yen-Dollar Exchange Rates
In the foreign exchange market, the strong yen pressure has eased reflecting the BOJ’s additional monetary easing (last December), statement unfavorable of the strong yen by Financial Minister Kan (January), and rise of official discount rate in the US (February). The dollar/yen exchange rate is around USD 1 = JPY 90 (Figure 26). However, on February 4th when caution towards financial issues in Greece and other South European nations intensified, Japanese yen rose by 2 yen on avoiding risk, so there is no change in the conditions that yen is easy to be bought.
In the exchange market, the main theme will be the FRB’s exit strategies.
While the BOJ will likely maintain the easy money policy as the deflationary trend will continue, the FRB will realize the exit strategies toward the summer, so the trend of JPY/USD should shift gradually toward weaker yen and stronger dollar.
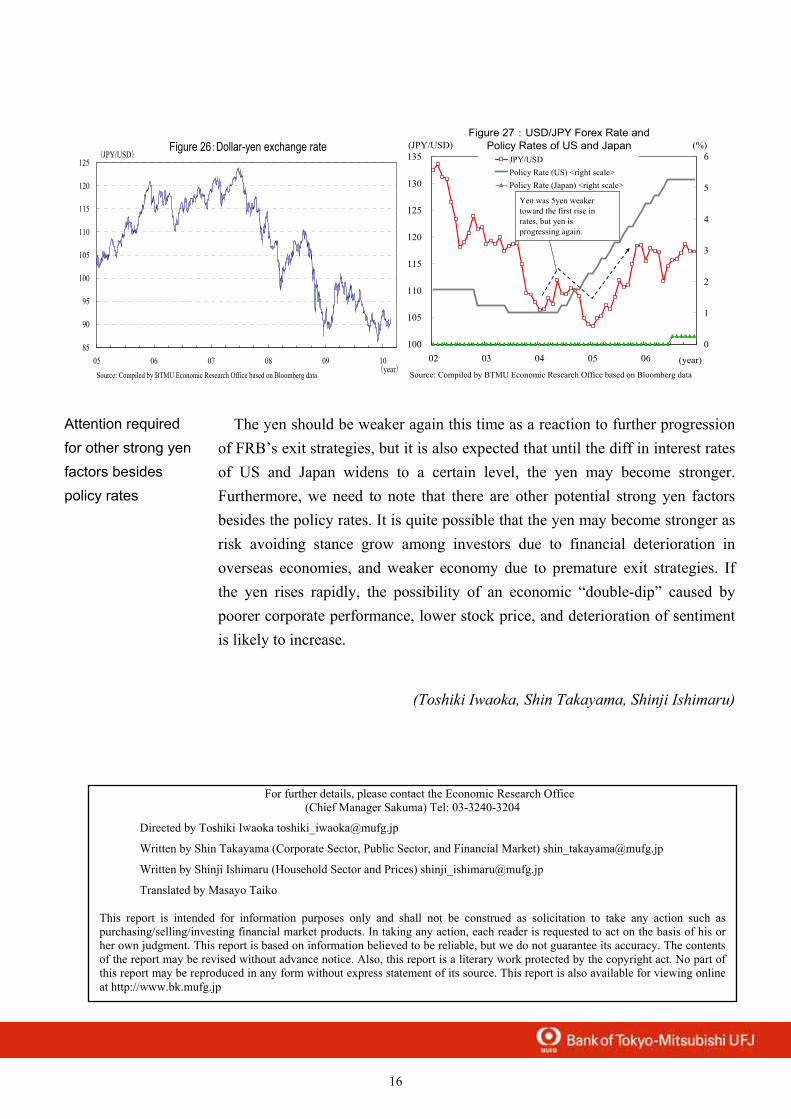
Looking back at the exchange rates since 2004 which was the last time the US began to rate hike, the yen progressed by about 5 yen toward June 2004, when the first rate hike took place (Figure 27). However since then, the yen strengthened again, and it was not until after 2005 that the weak yen trend was established. This was because there was an over-shoot toward weaker yen as market participants had already factored in the possibility of a major rate hike before it actually took place. After the rate hike, there were no more expectations and started to move again towards stronger yen. Since 2005, we believe that the weaker yen trend was formed due to the increase of carry trades as a result of widening gap of interest rates in US and Japan.
Strong yen has eased, but yen is still likely to be bought
Effective plan required for financial soundness
Yen dropped when the FRB first rose rates in the last rate hike period
16
For further details, please contact the Economic Research Office (Chief Manager Sakuma) Tel: 03-3240-3204
Directed by Toshiki Iwaoka [email protected]
Written by Shin Takayama (Corporate Sector, Public Sector, and Financial Market) [email protected]
Written by Shinji Ishimaru (Household Sector and Prices) [email protected]
Translated by Masayo Taiko
This report is intended for information purposes only and shall not be construed as solicitation to take any action such as purchasing/selling/investing financial market products. In taking any action, each reader is requested to act on the basis of his or her own judgment. This report is based on information believed to be reliable, but we do not guarantee its accuracy. The contents of the report may be revised without advance notice. Also, this report is a literary work protected by the copyright act. No part of this report may be reproduced in any form without express statement of its source. This report is also available for viewing online at http://www.bk.mufg.jp
Figure 26:Dollar-yen exchange rate
85
90
95
100
105
110
115
120
125
05 06 07 08 09 10(year)
(JPY/USD)
Source: Compiled by BTMU Economic Research Office based on Bloomberg data
Figure 27:USD/JPY Forex Rate andPolicy Rates of US and Japan
100
105
110
115
120
125
130
135
02 03 04 05 06 (year)
(JPY/USD)
0
1
2
3
4
5
6(%)
JPY/USDPolicy Rate (US) <right scale>Policy Rate (Japan) <right scale>
Source: Compiled by BTMU Economic Research Office based on Bloomberg data
Yen was 5yen weakertoward the first rise inrates, but yen isprogressing again.
The yen should be weaker again this time as a reaction to further progression of FRB’s exit strategies, but it is also expected that until the diff in interest rates of US and Japan widens to a certain level, the yen may become stronger. Furthermore, we need to note that there are other potential strong yen factors besides the policy rates. It is quite possible that the yen may become stronger as risk avoiding stance grow among investors due to financial deterioration in overseas economies, and weaker economy due to premature exit strategies. If the yen rises rapidly, the possibility of an economic “double-dip” caused by poorer corporate performance, lower stock price, and deterioration of sentiment is likely to increase.
(Toshiki Iwaoka, Shin Takayama, Shinji Ishimaru)
Attention required for other strong yen factors besides policy rates
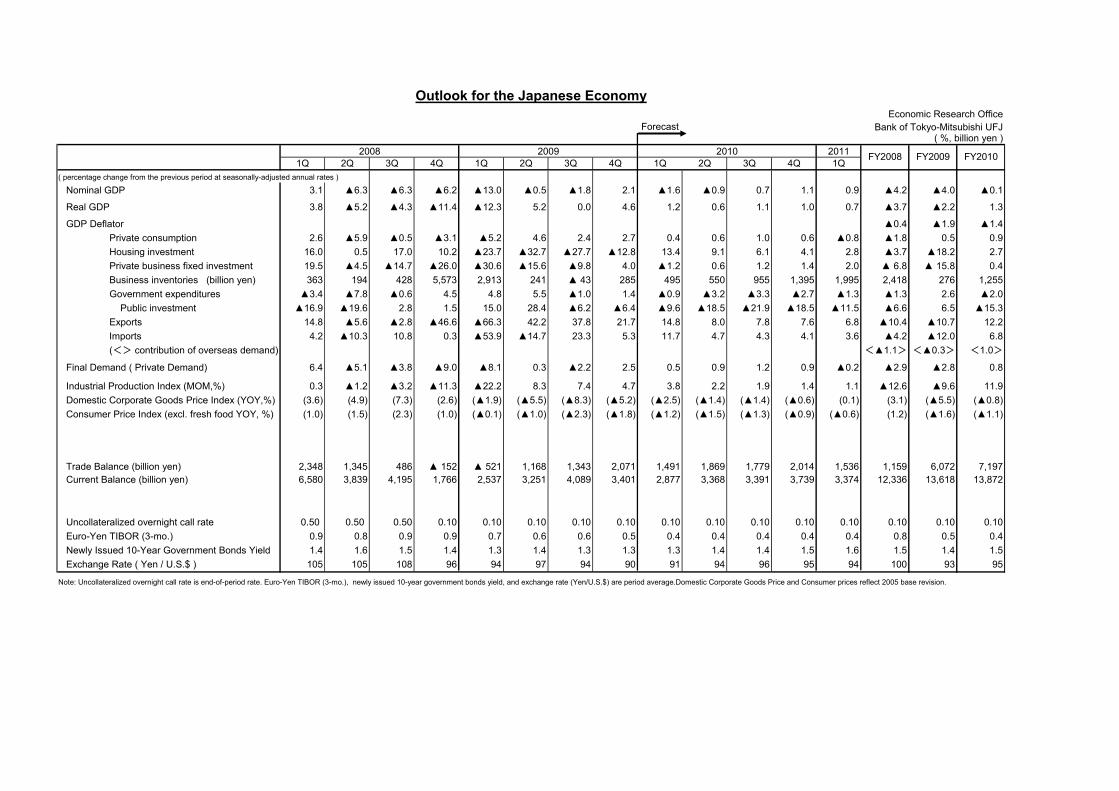
Economic Research OfficeForecast Bank of Tokyo-Mitsubishi UFJ
( %, billion yen )2009 2011
1Q 2Q 3Q 4Q 1Q 2Q 3Q 4Q 1Q 2Q 3Q 4Q 1Q( percentage change from the previous period at seasonally-adjusted annual rates )
Nominal GDP 3.1 ▲6.3 ▲6.3 ▲6.2 ▲13.0 ▲0.5 ▲1.8 2.1 ▲1.6 ▲0.9 0.7 1.1 0.9 ▲4.2 ▲4.0 ▲0.1
Real GDP 3.8 ▲5.2 ▲4.3 ▲11.4 ▲12.3 5.2 0.0 4.6 1.2 0.6 1.1 1.0 0.7 ▲3.7 ▲2.2 1.3
GDP Deflator ▲0.4 ▲1.9 ▲1.4 Private consumption 2.6 ▲5.9 ▲0.5 ▲3.1 ▲5.2 4.6 2.4 2.7 0.4 0.6 1.0 0.6 ▲0.8 ▲1.8 0.5 0.9 Housing investment 16.0 0.5 17.0 10.2 ▲23.7 ▲32.7 ▲27.7 ▲12.8 13.4 9.1 6.1 4.1 2.8 ▲3.7 ▲18.2 2.7 Private business fixed investment 19.5 ▲4.5 ▲14.7 ▲26.0 ▲30.6 ▲15.6 ▲9.8 4.0 ▲1.2 0.6 1.2 1.4 2.0 ▲ 6.8 ▲ 15.8 0.4 Business inventories (billion yen) 363 194 428 5,573 2,913 241 ▲ 43 285 495 550 955 1,395 1,995 2,418 276 1,255 Government expenditures ▲3.4 ▲7.8 ▲0.6 4.5 4.8 5.5 ▲1.0 1.4 ▲0.9 ▲3.2 ▲3.3 ▲2.7 ▲1.3 ▲1.3 2.6 ▲2.0 Public investment ▲16.9 ▲19.6 2.8 1.5 15.0 28.4 ▲6.2 ▲6.4 ▲9.6 ▲18.5 ▲21.9 ▲18.5 ▲11.5 ▲6.6 6.5 ▲15.3 Exports 14.8 ▲5.6 ▲2.8 ▲46.6 ▲66.3 42.2 37.8 21.7 14.8 8.0 7.8 7.6 6.8 ▲10.4 ▲10.7 12.2 Imports 4.2 ▲10.3 10.8 0.3 ▲53.9 ▲14.7 23.3 5.3 11.7 4.7 4.3 4.1 3.6 ▲4.2 ▲12.0 6.8
(<> contribution of overseas demand) <▲1.1> <▲0.3> <1.0>
Final Demand ( Private Demand) 6.4 ▲5.1 ▲3.8 ▲9.0 ▲8.1 0.3 ▲2.2 2.5 0.5 0.9 1.2 0.9 ▲0.2 ▲2.9 ▲2.8 0.8
Industrial Production Index (MOM,%) 0.3 ▲1.2 ▲3.2 ▲11.3 ▲22.2 8.3 7.4 4.7 3.8 2.2 1.9 1.4 1.1 ▲12.6 ▲9.6 11.9Domestic Corporate Goods Price Index (YOY,%) (3.6) (4.9) (7.3) (2.6) (▲1.9) (▲5.5) (▲8.3) (▲5.2) (▲2.5) (▲1.4) (▲1.4) (▲0.6) (0.1) (3.1) (▲5.5) (▲0.8)Consumer Price Index (excl. fresh food YOY, %) (1.0) (1.5) (2.3) (1.0) (▲0.1) (▲1.0) (▲2.3) (▲1.8) (▲1.2) (▲1.5) (▲1.3) (▲0.9) (▲0.6) (1.2) (▲1.6) (▲1.1)
Trade Balance (billion yen) 2,348 1,345 486 ▲ 152 ▲ 521 1,168 1,343 2,071 1,491 1,869 1,779 2,014 1,536 1,159 6,072 7,197Current Balance (billion yen) 6,580 3,839 4,195 1,766 2,537 3,251 4,089 3,401 2,877 3,368 3,391 3,739 3,374 12,336 13,618 13,872
Uncollateralized overnight call rate 0.50 0.50 0.50 0.10 0.10 0.10 0.10 0.10 0.10 0.10 0.10 0.10 0.10 0.10 0.10 0.10Euro-Yen TIBOR (3-mo.) 0.9 0.8 0.9 0.9 0.7 0.6 0.6 0.5 0.4 0.4 0.4 0.4 0.4 0.8 0.5 0.4Newly Issued 10-Year Government Bonds Yield 1.4 1.6 1.5 1.4 1.3 1.4 1.3 1.3 1.3 1.4 1.4 1.5 1.6 1.5 1.4 1.5Exchange Rate ( Yen / U.S.$ ) 105 105 108 96 94 97 94 90 91 94 96 95 94 100 93 95
Note: Uncollateralized overnight call rate is end-of-period rate. Euro-Yen TIBOR (3-mo.), newly issued 10-year government bonds yield, and exchange rate (Yen/U.S.$) are period average.Domestic Corporate Goods Price and Consumer prices reflect 2005 base revision.
2008 FY20082010
Outlook for the Japanese Economy
FY2009 FY2010
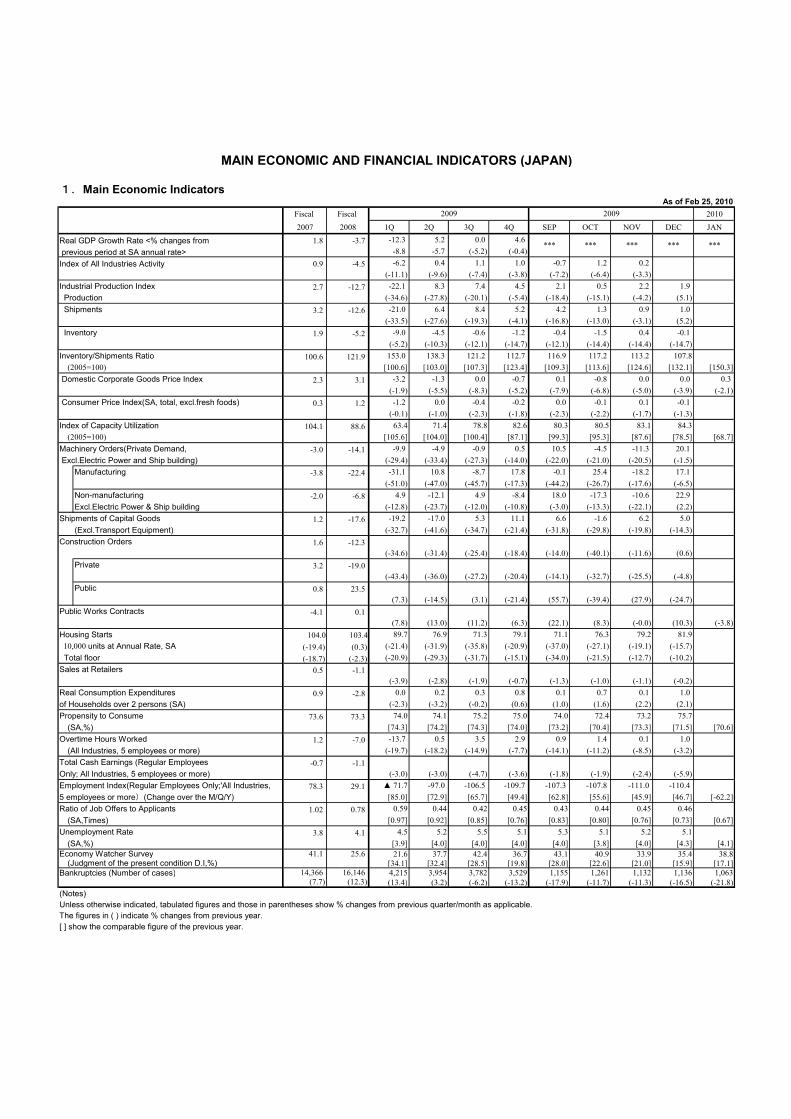
1.Main Economic IndicatorsAs of Feb 25, 2010
Fiscal Fiscal 20102007 2008 1Q 2Q 3Q 4Q SEP OCT NOV DEC JAN
Real GDP Growth Rate <% changes from 1.8 -3.7 -12.3 5.2 0.0 4.6 previous period at SA annual rate> -8.8 -5.7 (-5.2) (-0.4)Index of All Industries Activity 0.9 -4.5 -6.2 0.4 1.1 1.0 -0.7 1.2 0.2 #N/A
(-11.1) (-9.6) (-7.4) (-3.8) (-7.2) (-6.4) (-3.3) #N/AIndustrial Production Index 2.7 -12.7 -22.1 8.3 7.4 4.5 2.1 0.5 2.2 1.9 #N/A Production (-34.6) (-27.8) (-20.1) (-5.4) (-18.4) (-15.1) (-4.2) (5.1) #N/A Shipments 3.2 -12.6 -21.0 6.4 8.4 5.2 4.2 1.3 0.9 1.0 #N/A
(-33.5) (-27.6) (-19.3) (-4.1) (-16.8) (-13.0) (-3.1) (5.2) #N/A Inventory 1.9 -5.2 -9.0 -4.5 -0.6 -1.2 -0.4 -1.5 0.4 -0.1 #N/A
(-5.2) (-10.3) (-12.1) (-14.7) (-12.1) (-14.4) (-14.4) (-14.7) #N/AInventory/Shipments Ratio 100.6 121.9 153.0 138.3 121.2 112.7 116.9 117.2 113.2 107.8 #N/A (2005=100) [100.6] [103.0] [107.3] [123.4] [109.3] [113.6] [124.6] [132.1] [150.3] Domestic Corporate Goods Price Index 2.3 3.1 -3.2 -1.3 0.0 -0.7 0.1 -0.8 0.0 0.0 0.3
(-1.9) (-5.5) (-8.3) (-5.2) (-7.9) (-6.8) (-5.0) (-3.9) (-2.1) Consumer Price Index(SA, total, excl.fresh foods) 0.3 1.2 -1.2 0.0 -0.4 -0.2 0.0 -0.1 0.1 -0.1 #N/A
(-0.1) (-1.0) (-2.3) (-1.8) (-2.3) (-2.2) (-1.7) (-1.3) #N/AIndex of Capacity Utilization 104.1 88.6 63.4 71.4 78.8 82.6 80.3 80.5 83.1 84.3 #N/A (2005=100) [105.6] [104.0] [100.4] [87.1] [99.3] [95.3] [87.6] [78.5] [68.7]Machinery Orders(Private Demand, -3.0 -14.1 -9.9 -4.9 -0.9 0.5 10.5 -4.5 -11.3 20.1 #N/A Excl.Electric Power and Ship building) (-29.4) (-33.4) (-27.3) (-14.0) (-22.0) (-21.0) (-20.5) (-1.5) #N/A Manufacturing -3.8 -22.4 -31.1 10.8 -8.7 17.8 -0.1 25.4 -18.2 17.1 #N/A
(-51.0) (-47.0) (-45.7) (-17.3) (-44.2) (-26.7) (-17.6) (-6.5) #N/A Non-manufacturing -2.0 -6.8 4.9 -12.1 4.9 -8.4 18.0 -17.3 -10.6 22.9 #N/A
Excl.Electric Power & Ship building (-12.8) (-23.7) (-12.0) (-10.8) (-3.0) (-13.3) (-22.1) (2.2) #N/AShipments of Capital Goods 1.2 -17.6 -19.2 -17.0 5.3 11.1 6.6 -1.6 6.2 5.0 #N/A
(Excl.Transport Equipment) (-32.7) (-41.6) (-34.7) (-21.4) (-31.8) (-29.8) (-19.8) (-14.3) #N/AConstruction Orders 1.6 -12.3
(-34.6) (-31.4) (-25.4) (-18.4) (-14.0) (-40.1) (-11.6) (0.6) #N/A Private 3.2 -19.0
(-43.4) (-36.0) (-27.2) (-20.4) (-14.1) (-32.7) (-25.5) (-4.8) #N/A Public 0.8 23.5
(7.3) (-14.5) (3.1) (-21.4) (55.7) (-39.4) (27.9) (-24.7) #N/APublic Works Contracts -4.1 0.1
(7.8) (13.0) (11.2) (6.3) (22.1) (8.3) (-0.0) (10.3) (-3.8)Housing Starts 104.0 103.4 89.7 76.9 71.3 79.1 71.1 76.3 79.2 81.9 #N/A 10,000 units at Annual Rate, SA (-19.4) (0.3) (-21.4) (-31.9) (-35.8) (-20.9) (-37.0) (-27.1) (-19.1) (-15.7) #N/A Total floor (-18.7) (-2.3) (-20.9) (-29.3) (-31.7) (-15.1) (-34.0) (-21.5) (-12.7) (-10.2) #N/ASales at Retailers 0.5 -1.1 (-3.9) (-2.8) (-1.9) (-0.7) (-1.3) (-1.0) (-1.1) (-0.2) #N/AReal Consumption Expenditures 0.9 -2.8 0.0 0.2 0.3 0.8 0.1 0.7 0.1 1.0 #N/Aof Households over 2 persons (SA) (-2.3) (-3.2) (-0.2) (0.6) (1.0) (1.6) (2.2) (2.1) #N/APropensity to Consume 73.6 73.3 74.0 74.1 75.2 75.0 74.0 72.4 73.2 75.7 #N/A (SA,%) [74.3] [74.2] [74.3] [74.0] [73.2] [70.4] [73.3] [71.5] [70.6]Overtime Hours Worked 1.2 -7.0 -13.7 0.5 3.5 2.9 0.9 1.4 0.1 1.0 #N/A (All Industries, 5 employees or more) (-19.7) (-18.2) (-14.9) (-7.7) (-14.1) (-11.2) (-8.5) (-3.2) #N/ATotal Cash Earnings (Regular Employees -0.7 -1.1Only; All Industries, 5 employees or more) (-3.0) (-3.0) (-4.7) (-3.6) (-1.8) (-1.9) (-2.4) (-5.9) #N/AEmployment Index(Regular Employees Only;'All Industries, 78.3 29.1 ▲ 71.7 -97.0 -106.5 -109.7 -107.3 -107.8 -111.0 -110.4 #N/A5 employees or more)(Change over the M/Q/Y) [85.0] [72.9] [65.7] [49.4] [62.8] [55.6] [45.9] [46.7] [-62.2]Ratio of Job Offers to Applicants 1.02 0.78 0.59 0.44 0.42 0.45 0.43 0.44 0.45 0.46 #N/A (SA,Times) [0.97] [0.92] [0.85] [0.76] [0.83] [0.80] [0.76] [0.73] [0.67]Unemployment Rate 3.8 4.1 4.5 5.2 5.5 5.1 5.3 5.1 5.2 5.1 #N/A (SA,%) [3.9] [4.0] [4.0] [4.0] [4.0] [3.8] [4.0] [4.3] [4.1]Economy Watcher Survey 41.1 25.6 21.6 37.7 42.4 36.7 43.1 40.9 33.9 35.4 38.8 (Judgment of the present condition D.I,%) [34.1] [32.4] [28.5] [19.8] [28.0] [22.6] [21.0] [15.9] [17.1]Bankruptcies (Number of cases) 14,366 16,146 4,215 3,954 3,782 3,529 1,155 1,261 1,132 1,136 1,063 (7.7) (12.3) (13.4) (3.2) (-6.2) (-13.2) (-17.9) (-11.7) (-11.3) (-16.5) (-21.8)(Notes)Unless otherwise indicated, tabulated figures and those in parentheses show % changes from previous quarter/month as applicable.The figures in ( ) indicate % changes from previous year.[ ] show the comparable figure of the previous year.
2009 2009
MAIN ECONOMIC AND FINANCIAL INDICATORS (JAPAN)
****** *** ******
As of Feb 25, 2010
Fiscal Fiscal 20102007 2008 1Q 2Q 3Q 4Q SEP OCT NOV DEC JAN
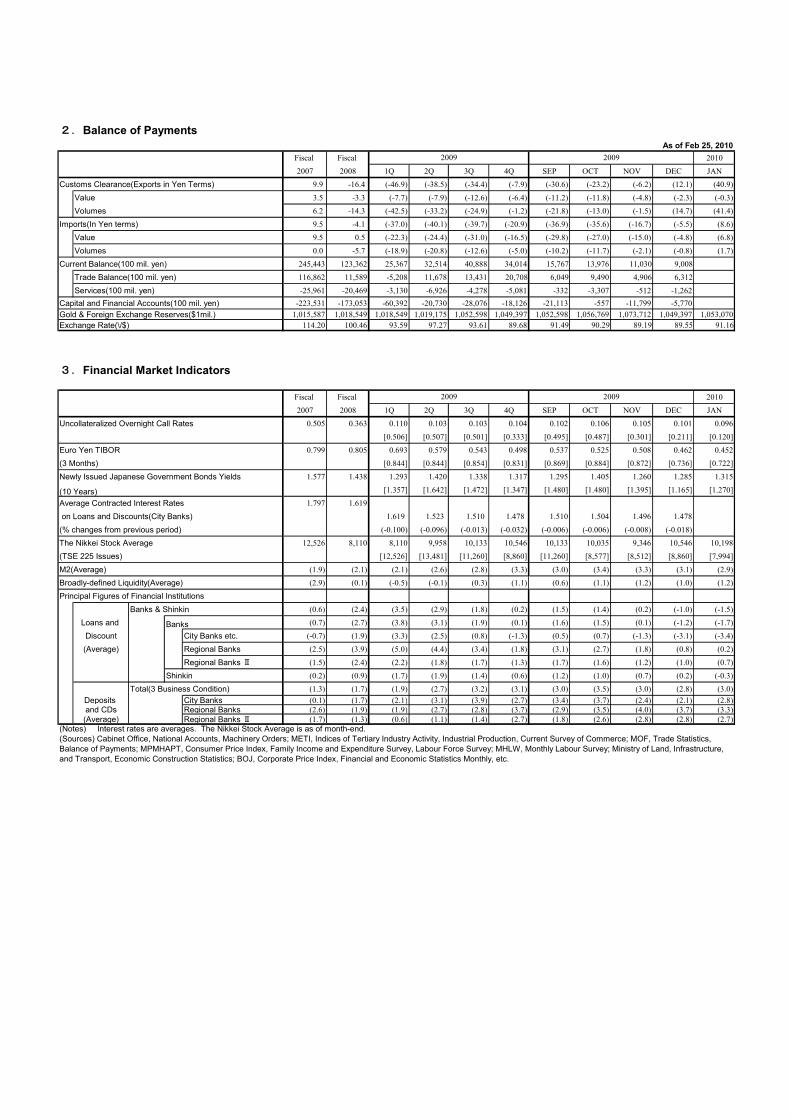
Customs Clearance(Exports in Yen Terms) 9.9 -16.4 (-46.9) (-38.5) (-34.4) (-7.9) (-30.6) (-23.2) (-6.2) (12.1) (40.9)
Value 3.5 -3.3 (-7.7) (-7.9) (-12.6) (-6.4) (-11.2) (-11.8) (-4.8) (-2.3) (-0.3)
Volumes 6.2 -14.3 (-42.5) (-33.2) (-24.9) (-1.2) (-21.8) (-13.0) (-1.5) (14.7) (41.4)
Imports(In Yen terms) 9.5 -4.1 (-37.0) (-40.1) (-39.7) (-20.9) (-36.9) (-35.6) (-16.7) (-5.5) (8.6)
Value 9.5 0.5 (-22.3) (-24.4) (-31.0) (-16.5) (-29.8) (-27.0) (-15.0) (-4.8) (6.8)
Volumes 0.0 -5.7 (-18.9) (-20.8) (-12.6) (-5.0) (-10.2) (-11.7) (-2.1) (-0.8) (1.7)
Current Balance(100 mil. yen) 245,443 123,362 25,367 32,514 40,888 34,014 15,767 13,976 11,030 9,008 #N/A
Trade Balance(100 mil. yen) 116,862 11,589 -5,208 11,678 13,431 20,708 6,049 9,490 4,906 6,312 #N/A
Services(100 mil. yen) -25,961 -20,469 -3,130 -6,926 -4,278 -5,081 -332 -3,307 -512 -1,262 #N/ACapital and Financial Accounts(100 mil. yen) -223,531 -173,053 -60,392 -20,730 -28,076 -18,126 -21,113 -557 -11,799 -5,770 #N/AGold & Foreign Exchange Reserves($1mil.) 1,015,587 1,018,549 1,018,549 1,019,175 1,052,598 1,049,397 1,052,598 1,056,769 1,073,712 1,049,397 1,053,070Exchange Rate(\/$) 114.20 100.46 93.59 97.27 93.61 89.68 91.49 90.29 89.19 89.55 91.16
3.Financial Market Indicators
Fiscal Fiscal 20102007 2008 1Q 2Q 3Q 4Q SEP OCT NOV DEC JAN
Uncollateralized Overnight Call Rates 0.505 0.363 0.110 0.103 0.103 0.104 0.102 0.106 0.105 0.101 0.096
[0.506] [0.507] [0.501] [0.333] [0.495] [0.487] [0.301] [0.211] [0.120]
Euro Yen TIBOR 0.799 0.805 0.693 0.579 0.543 0.498 0.537 0.525 0.508 0.462 0.452
(3 Months) [0.844] [0.844] [0.854] [0.831] [0.869] [0.884] [0.872] [0.736] [0.722]
Newly Issued Japanese Government Bonds Yields 1.577 1.438 1.293 1.420 1.338 1.317 1.295 1.405 1.260 1.285 1.315
(10 Years) [1.357] [1.642] [1.472] [1.347] [1.480] [1.480] [1.395] [1.165] [1.270]
Average Contracted Interest Rates 1.797 1.619
on Loans and Discounts(City Banks) 1.619 1.523 1.510 1.478 1.510 1.504 1.496 1.478 #N/A
(% changes from previous period) (-0.100) (-0.096) (-0.013) (-0.032) (-0.006) (-0.006) (-0.008) (-0.018) #N/A
The Nikkei Stock Average 12,526 8,110 8,110 9,958 10,133 10,546 10,133 10,035 9,346 10,546 10,198
(TSE 225 Issues) [12,526] [13,481] [11,260] [8,860] [11,260] [8,577] [8,512] [8,860] [7,994]
M2(Average) (1.9) (2.1) (2.1) (2.6) (2.8) (3.3) (3.0) (3.4) (3.3) (3.1) (2.9)
Broadly-defined Liquidity(Average) (2.9) (0.1) (-0.5) (-0.1) (0.3) (1.1) (0.6) (1.1) (1.2) (1.0) (1.2)
Principal Figures of Financial InstitutionsBanks & Shinkin (0.6) (2.4) (3.5) (2.9) (1.8) (0.2) (1.5) (1.4) (0.2) (-1.0) (-1.5)
Loans and Banks (0.7) (2.7) (3.8) (3.1) (1.9) (0.1) (1.6) (1.5) (0.1) (-1.2) (-1.7)
Discount City Banks etc. (-0.7) (1.9) (3.3) (2.5) (0.8) (-1.3) (0.5) (0.7) (-1.3) (-3.1) (-3.4)
(Average) Regional Banks (2.5) (3.9) (5.0) (4.4) (3.4) (1.8) (3.1) (2.7) (1.8) (0.8) (0.2)
Regional Banks Ⅱ (1.5) (2.4) (2.2) (1.8) (1.7) (1.3) (1.7) (1.6) (1.2) (1.0) (0.7)
Shinkin (0.2) (0.9) (1.7) (1.9) (1.4) (0.6) (1.2) (1.0) (0.7) (0.2) (-0.3)
Total(3 Business Condition) (1.3) (1.7) (1.9) (2.7) (3.2) (3.1) (3.0) (3.5) (3.0) (2.8) (3.0)Deposits City Banks (0.1) (1.7) (2.1) (3.1) (3.9) (2.7) (3.4) (3.7) (2.4) (2.1) (2.8)and CDs Regional Banks (2.6) (1.9) (1.9) (2.7) (2.8) (3.7) (2.9) (3.5) (4.0) (3.7) (3.3)
(Average) Regional Banks Ⅱ (1.7) (1.3) (0.6) (1.1) (1.4) (2.7) (1.8) (2.6) (2.8) (2.8) (2.7)(Notes) Interest rates are averages. The Nikkei Stock Average is as of month-end.
2009
2009
2009
2009
(Sources) Cabinet Office, National Accounts, Machinery Orders; METI, Indices of Tertiary Industry Activity, Industrial Production, Current Survey of Commerce; MOF, Trade Statistics,Balance of Payments; MPMHAPT, Consumer Price Index, Family Income and Expenditure Survey, Labour Force Survey; MHLW, Monthly Labour Survey; Ministry of Land, Infrastructure,and Transport, Economic Construction Statistics; BOJ, Corporate Price Index, Financial and Economic Statistics Monthly, etc.
2.Balance of Payments