Embed Size (px)
Citation preview
The Outlook and Current Policy Challenges
RMA New England Annual Meeting May 4, 2018
Jeff Fuhrer EVP and Senior Policy Advisor Federal Reserve Bank of Boston
1
2
Disclaimer: The views represented in this presentation are solely those of the author, and do not reflect the views of the Federal Reserve Bank of Boston, the Board of Governors of the Federal Reserve System, or the Federal Open Market Committee
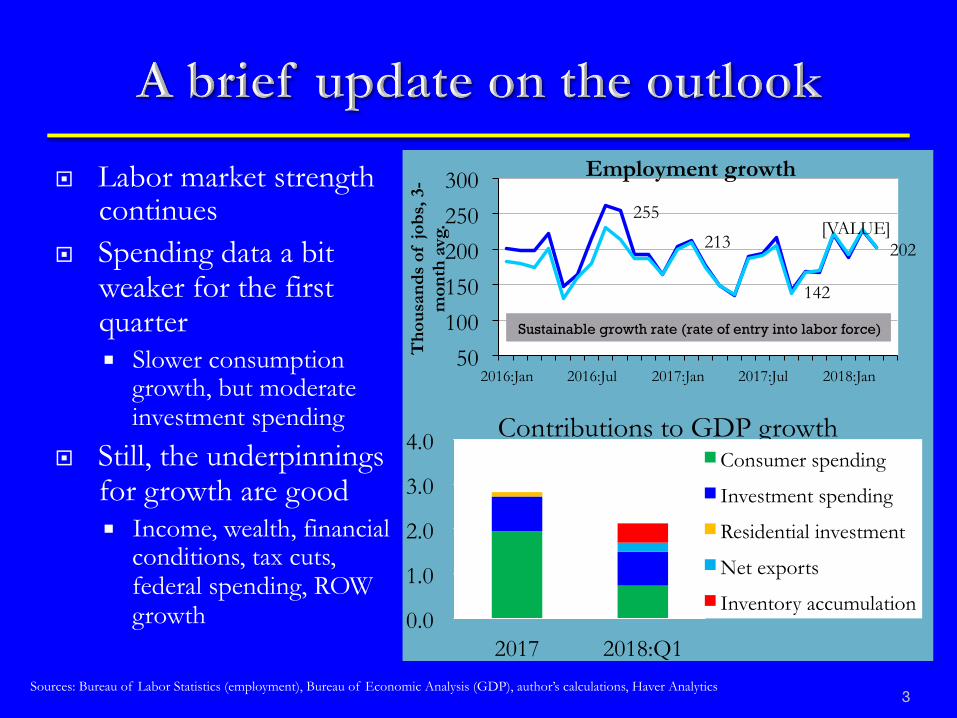
¨ Labor market strength continues
¨ Spending data a bit weaker for the first quarter ¡ Slower consumption
growth, but moderate investment spending
¨ Still, the underpinnings for growth are good ¡ Income, wealth, financial
conditions, tax cuts, federal spending, ROW growth
3
255
213
142
202 [VALUE]
50
100
150
200
250
300
2016:Jan 2016:Jul 2017:Jan 2017:Jul 2018:Jan
Tho
usan
ds o
f jo
bs, 3
-m
onth
avg
.
Employment growth
Sustainable growth rate (rate of entry into labor force)
Sources: Bureau of Labor Statistics (employment), Bureau of Economic Analysis (GDP), author’s calculations, Haver Analytics
0.0
1.0
2.0
3.0
4.0
2017 2018:Q1
Contributions to GDP growth Consumer spending
Investment spending
Residential investment
Net exports
Inventory accumulation
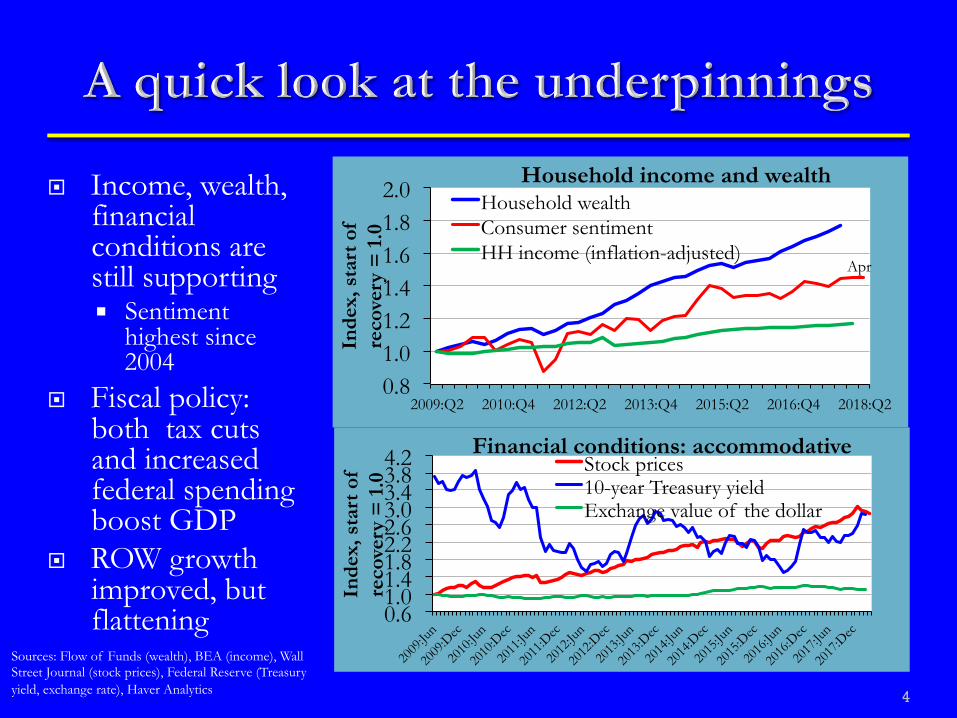
¨ Income, wealth, financial conditions are still supporting ¡ Sentiment
highest since 2004
¨ Fiscal policy: both tax cuts and increased federal spending boost GDP
¨ ROW growth improved, but flattening
4
0.8 1.0 1.2 1.4 1.6 1.8 2.0
2009:Q2 2010:Q4 2012:Q2 2013:Q4 2015:Q2 2016:Q4 2018:Q2
Inde
x, s
tart
of
reco
very
= 1
.0
Household income and wealth Household wealth Consumer sentiment HH income (inflation-adjusted)
Apr
0.6 1.0 1.4 1.8 2.2 2.6 3.0 3.4 3.8 4.2
Inde
x, s
tart
of
reco
very
= 1
.0
Financial conditions: accommodative Stock prices 10-year Treasury yield Exchange value of the dollar
Sources: Flow of Funds (wealth), BEA (income), Wall Street Journal (stock prices), Federal Reserve (Treasury yield, exchange rate), Haver Analytics
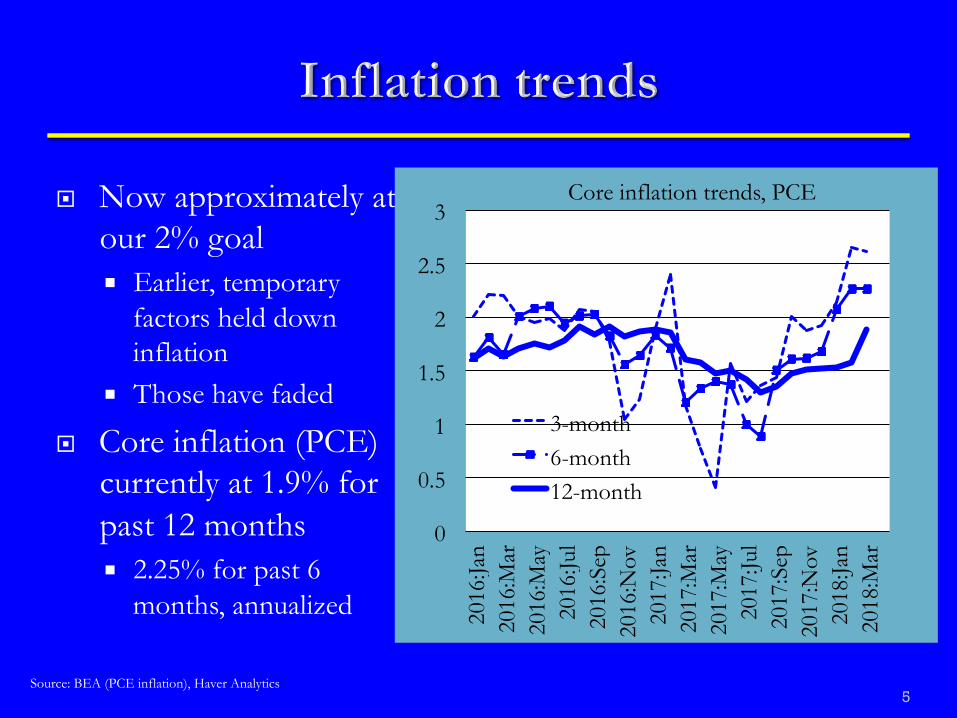
¨ Now approximately at our 2% goal ¡ Earlier, temporary
factors held down inflation
¡ Those have faded
¨ Core inflation (PCE) currently at 1.9% for past 12 months ¡ 2.25% for past 6
months, annualized
5
0
0.5
1
1.5
2
2.5
3
2016
:Jan
2016
:Mar
20
16:M
ay
2016
:Jul
2016
:Sep
20
16:N
ov
2017
:Jan
2017
:Mar
20
17:M
ay
2017
:Jul
2017
:Sep
20
17:N
ov
2018
:Jan
2018
:Mar
Core inflation trends, PCE
3-month 6-month 12-month
Source: BEA (PCE inflation), Haver Analytics
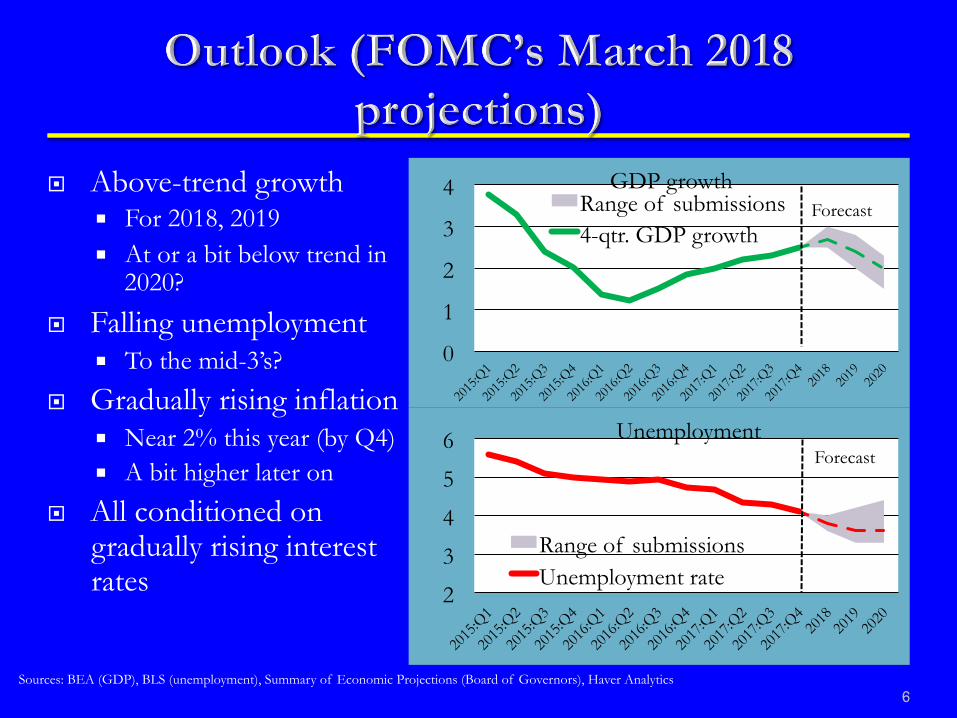
¨ Above-trend growth ¡ For 2018, 2019 ¡ At or a bit below trend in
2020?
¨ Falling unemployment ¡ To the mid-3’s?
¨ Gradually rising inflation ¡ Near 2% this year (by Q4) ¡ A bit higher later on
¨ All conditioned on gradually rising interest rates
6
0
1
2
3
4 GDP growth Range of submissions 4-qtr. GDP growth
2
3
4
5
6 Unemployment
Range of submissions Unemployment rate
Forecast
Sources: BEA (GDP), BLS (unemployment), Summary of Economic Projections (Board of Governors), Haver Analytics
Forecast
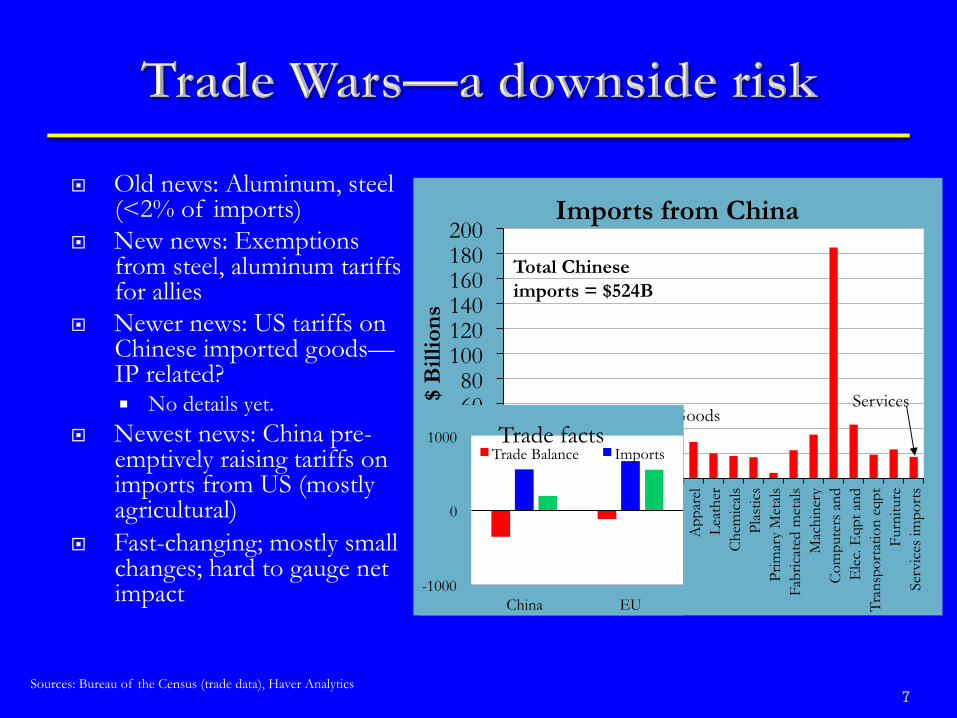
¨ Old news: Aluminum, steel (<2% of imports)
¨ New news: Exemptions from steel, aluminum tariffs for allies
¨ Newer news: US tariffs on Chinese imported goods—IP related? ¡ No details yet.
¨ Newest news: China pre-emptively raising tariffs on imports from US (mostly agricultural)
¨ Fast-changing; mostly small changes; hard to gauge net impact
7 Sources: Bureau of the Census (trade data), Haver Analytics
0 20 40 60 80
100 120 140 160 180 200
Agr
icul
tura
l Li
vest
ock
Fore
stry
Fi
sh
Oil&
Gas
M
iner
als
Food
B
ever
ages
&to
bacc
o Te
xtile
s an
d fa
bric
s A
ppar
el
Leat
her
Che
mic
als
Plas
tics
Prim
ary
Met
als
Fabr
icat
ed m
etal
s M
achi
nery
C
ompu
ters
and
E
lec.
Eqp
t and
Tr
ansp
orta
tion
eqpt
Fu
rnitu
re
Serv
ices
impo
rts
$ B
illio
ns
Imports from China
Total Chinese imports = $524B
Goods Services
-1000
0
1000
China EU
Trade facts Trade Balance Imports
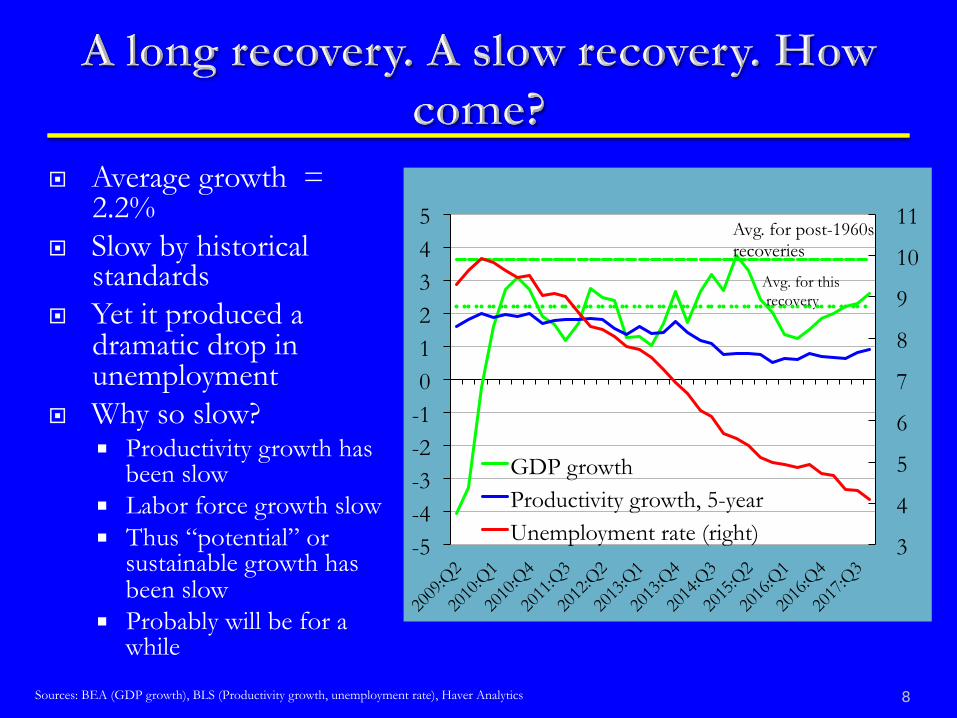
¨ Average growth = 2.2%
¨ Slow by historical standards
¨ Yet it produced a dramatic drop in unemployment
¨ Why so slow? ¡ Productivity growth has
been slow ¡ Labor force growth slow ¡ Thus “potential” or
sustainable growth has been slow
¡ Probably will be for a while
8
3
4
5
6
7
8
9
10
11
-5 -4 -3 -2 -1 0 1 2 3 4 5
GDP growth Productivity growth, 5-year Unemployment rate (right)
Avg. for this recovery
Avg. for post-1960s recoveries
Sources: BEA (GDP growth), BLS (Productivity growth, unemployment rate), Haver Analytics
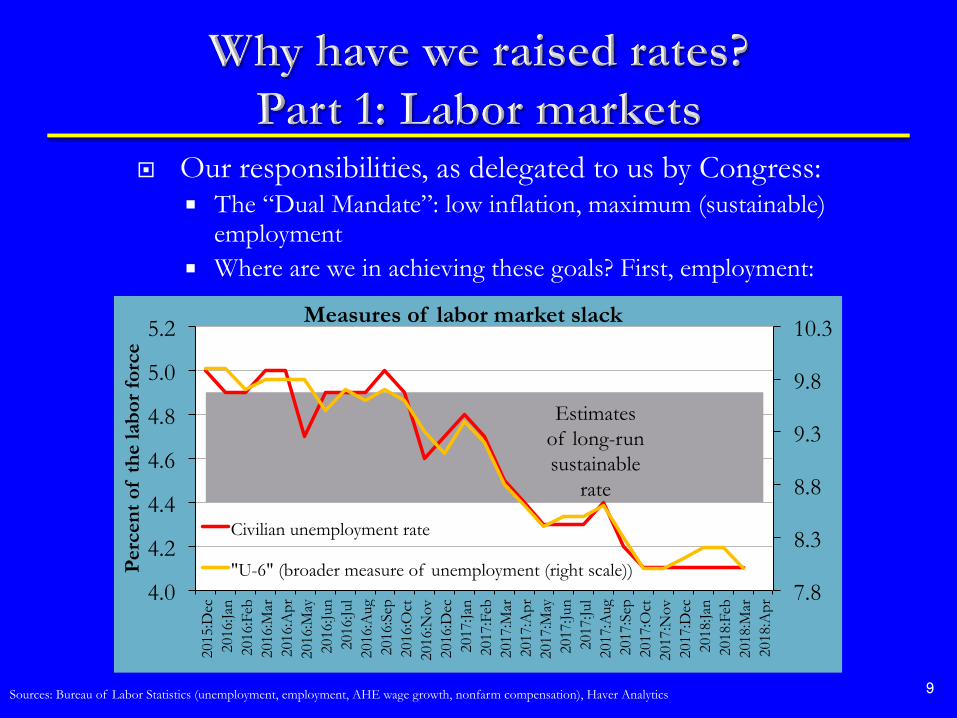
¨ Our responsibilities, as delegated to us by Congress: ¡ The “Dual Mandate”: low inflation, maximum (sustainable)
employment ¡ Where are we in achieving these goals? First, employment:
Sources: Bureau of Labor Statistics (unemployment, employment, AHE wage growth, nonfarm compensation), Haver Analytics 9
7.8
8.3
8.8
9.3
9.8
10.3
4.0
4.2
4.4
4.6
4.8
5.0
5.2
2015
:Dec
20
16:Ja
n 20
16:F
eb
2016
:Mar
20
16:A
pr
2016
:May
20
16:Ju
n 20
16:Ju
l 20
16:A
ug
2016
:Sep
20
16:O
ct
2016
:Nov
20
16:D
ec
2017
:Jan
2017
:Feb
20
17:M
ar
2017
:Apr
20
17:M
ay
2017
:Jun
2017
:Jul
2017
:Aug
20
17:S
ep
2017
:Oct
20
17:N
ov
2017
:Dec
20
18:Ja
n 20
18:F
eb
2018
:Mar
20
18:A
pr
Per
cent
of
the
labo
r fo
rce
Measures of labor market slack
Civilian unemployment rate
"U-6" (broader measure of unemployment (right scale))
Estimates of long-run sustainable
rate
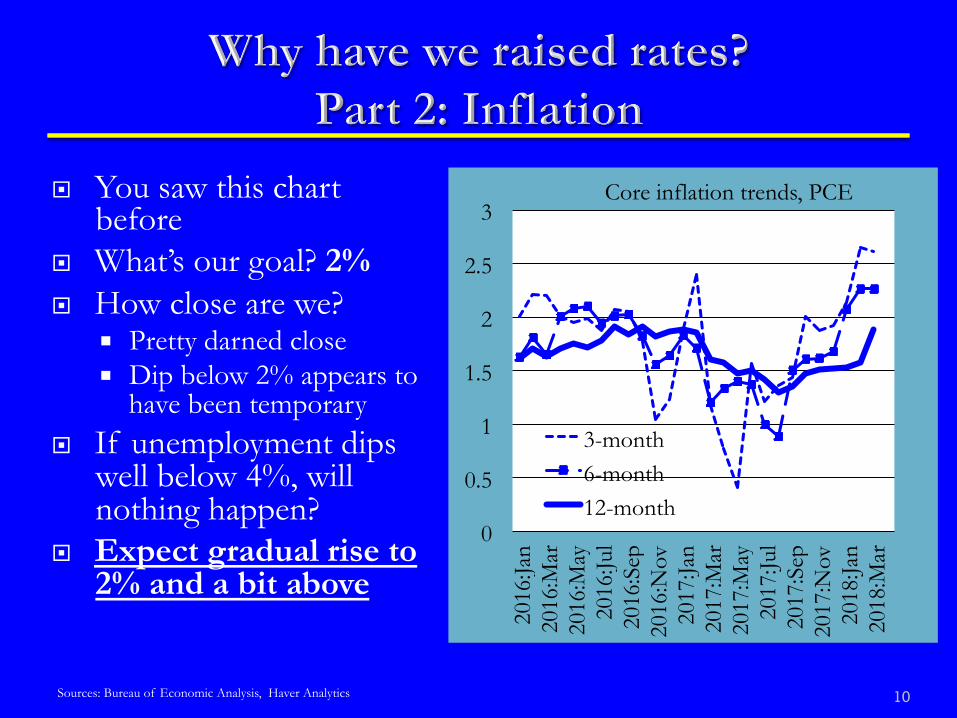
¨ You saw this chart before
¨ What’s our goal? 2% ¨ How close are we?
¡ Pretty darned close ¡ Dip below 2% appears to
have been temporary ¨ If unemployment dips
well below 4%, will nothing happen?
¨ Expect gradual rise to 2% and a bit above
Sources: Bureau of Economic Analysis, Haver Analytics 10
0
0.5
1
1.5
2
2.5
3
2016
:Jan
2016
:Mar
20
16:M
ay
2016
:Jul
2016
:Sep
20
16:N
ov
2017
:Jan
2017
:Mar
20
17:M
ay
2017
:Jul
2017
:Sep
20
17:N
ov
2018
:Jan
2018
:Mar
Core inflation trends, PCE
3-month 6-month 12-month
11 Source: Summary of Economic Projections, 9/20/17, Federal Reserve Board, CME Group FedWatch tool http://www.cmegroup.com/trading/interest-rates/countdown-to-fomc.html/
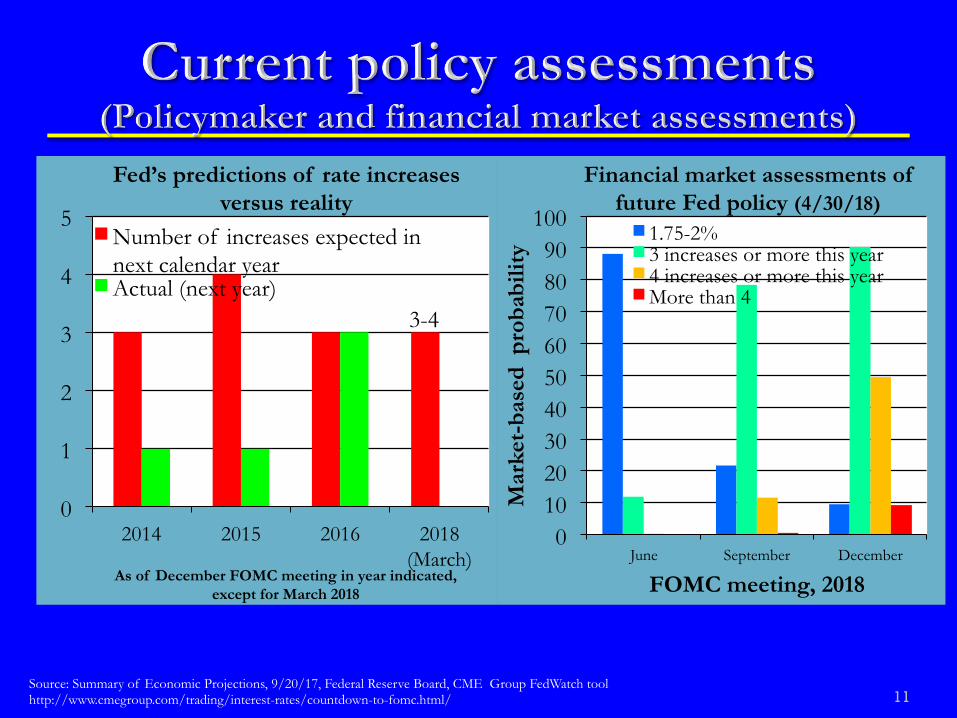
0 10 20 30 40 50 60 70 80 90
100
June September December
Mar
ket-
base
d p
roba
bilit
y
FOMC meeting, 2018
Financial market assessments of future Fed policy (4/30/18)
1.75-2% 3 increases or more this year 4 increases or more this year More than 4
3-4
0
1
2
3
4
5
2014 2015 2016 2018 (March)
As of December FOMC meeting in year indicated, except for March 2018
Fed’s predictions of rate increases versus reality
Number of increases expected in next calendar year Actual (next year)
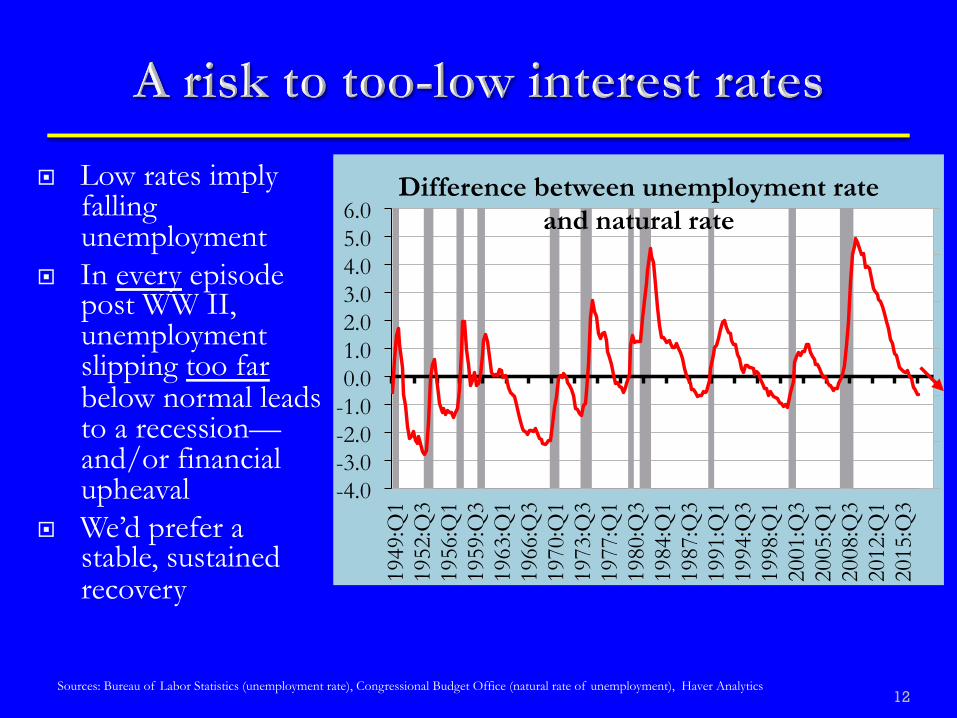
¨ Low rates imply falling unemployment
¨ In every episode post WW II, unemployment slipping too far below normal leads to a recession—and/or financial upheaval
¨ We’d prefer a stable, sustained recovery
-4.0 -3.0 -2.0 -1.0 0.0 1.0 2.0 3.0 4.0 5.0 6.0
1949
:Q1
1952
:Q3
1956
:Q1
1959
:Q3
1963
:Q1
1966
:Q3
1970
:Q1
1973
:Q3
1977
:Q1
1980
:Q3
1984
:Q1
1987
:Q3
1991
:Q1
1994
:Q3
1998
:Q1
2001
:Q3
2005
:Q1
2008
:Q3
2012
:Q1
2015
:Q3
Difference between unemployment rate and natural rate
Sources: Bureau of Labor Statistics (unemployment rate), Congressional Budget Office (natural rate of unemployment), Haver Analytics 12
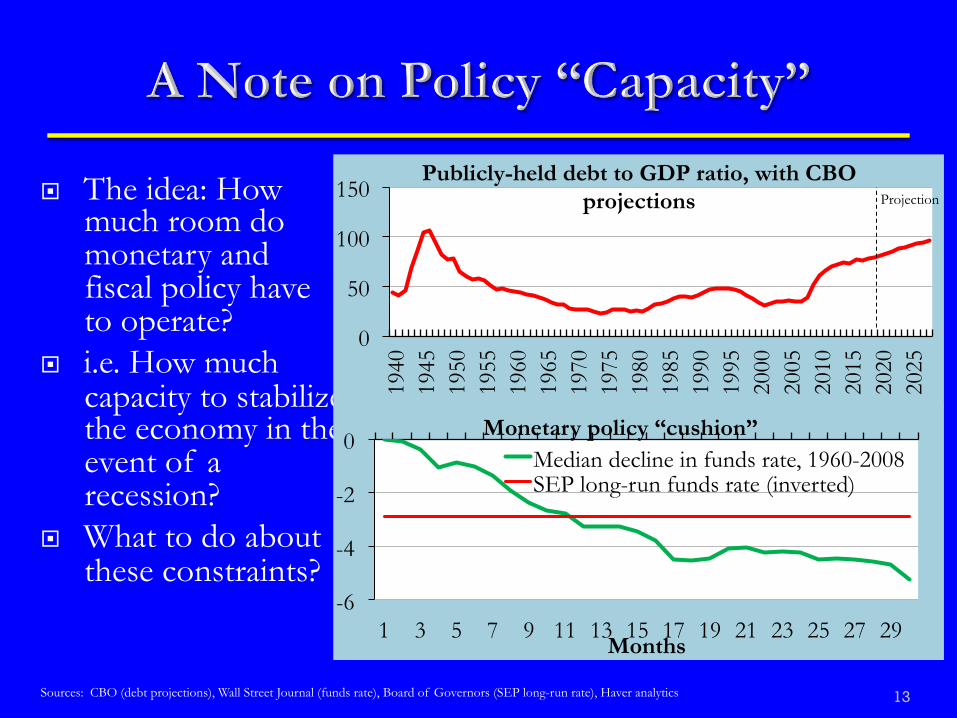
¨ The idea: How much room do monetary and fiscal policy have to operate?
¨ i.e. How much capacity to stabilize the economy in the event of a recession?
¨ What to do about these constraints?
13
0
50
100
150
1940
19
45
1950
19
55
1960
19
65
1970
19
75
1980
19
85
1990
19
95
2000
20
05
2010
20
15
2020
20
25
Publicly-held debt to GDP ratio, with CBO projections Projection
-6
-4
-2
0
1 3 5 7 9 11 13 15 17 19 21 23 25 27 29 Months
Monetary policy “cushion” Median decline in funds rate, 1960-2008 SEP long-run funds rate (inverted)
Sources: CBO (debt projections), Wall Street Journal (funds rate), Board of Governors (SEP long-run rate), Haver analytics
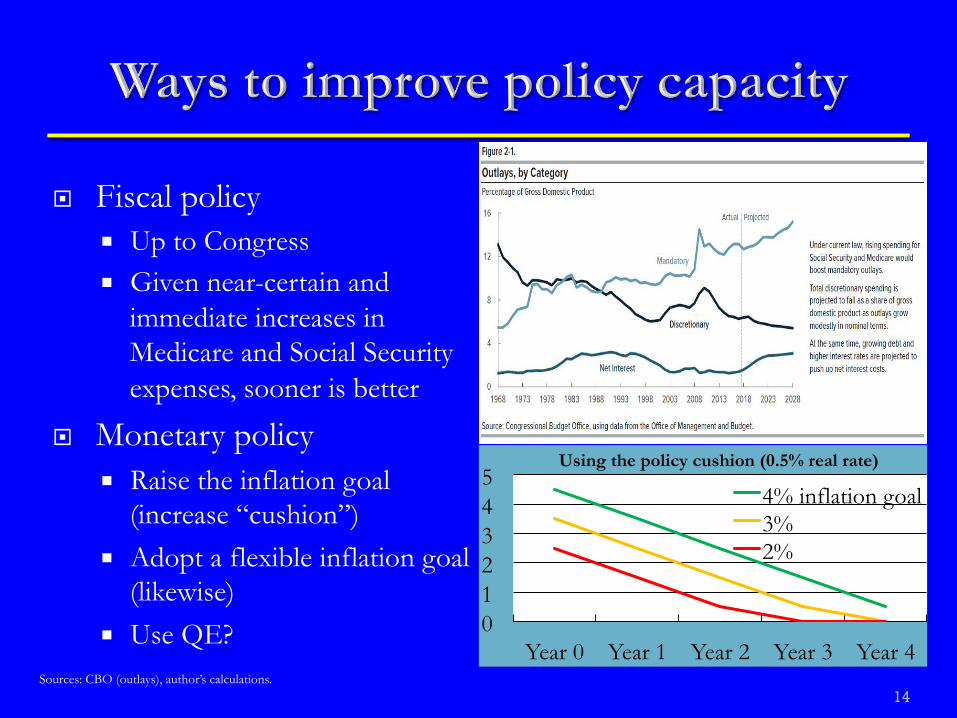
¨ Fiscal policy ¡ Up to Congress ¡ Given near-certain and
immediate increases in Medicare and Social Security expenses, sooner is better
¨ Monetary policy ¡ Raise the inflation goal
(increase “cushion”) ¡ Adopt a flexible inflation goal
(likewise) ¡ Use QE?
14
0 1 2 3 4 5
Year 0 Year 1 Year 2 Year 3 Year 4
Using the policy cushion (0.5% real rate)
4% inflation goal 3% 2%
Sources: CBO (outlays), author’s calculations.
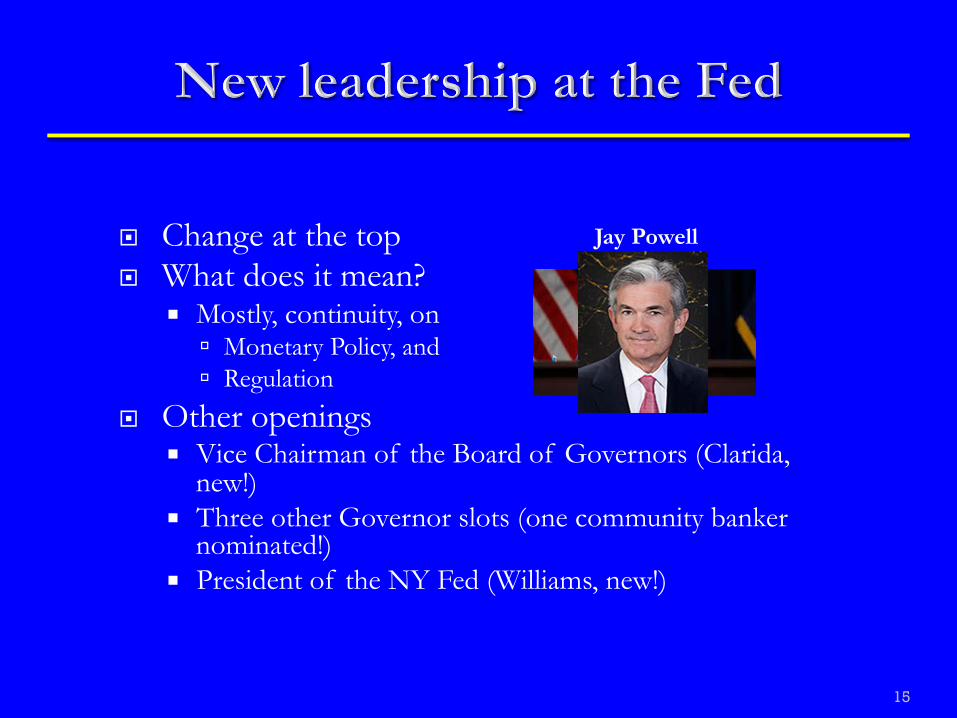
¨ Change at the top ¨ What does it mean?
¡ Mostly, continuity, on ú Monetary Policy, and ú Regulation
¨ Other openings ¡ Vice Chairman of the Board of Governors (Clarida,
new!) ¡ Three other Governor slots (one community banker
nominated!) ¡ President of the NY Fed (Williams, new!)
15
Janet Yellen Jay Powell