Embed Size (px)
Citation preview
@NEWAMERICAED | REPORT | MAY 2015 | #STUDENTARMSRACE | EDCENTR.AL/STUDENTARMSRACE
NEWAMERICA
EDUCATIONPOLICY
STEPHEN BURD
THE OUT-OF-STATE STUDENT ARMS RACEHOW PUBLIC UNIVERSITIES USE MERIT AID TO RECRUIT NONRESIDENT STUDENTS

About New America
New America is dedicated to the renewal of American politics, prosperity, and purpose in the Digital Age. We carry out our mission as a nonprofit civic enterprise: an intellectual venture capital fund, think tank, technology laboratory, public forum, and media platform. Our hallmarks are big ideas, impartial analysis, pragmatic policy solutions, technological innovation, next generation politics, and creative engagement with broad audiences.
Find out more at newamerica.org/our-story.
Acknowledgments
The New America Education Policy Program’s work is made possible through generous grants from the Alliance for Early Success; the Annie E. Casey Foundation; the Bill and Melinda Gates Foundation; the Grable Foundation; the Foundation for Child Development; the Joyce Foundation; the Kresge Foundation; Lumina Foundation; the Pritzker Children’s Initiative; the William and Flora Hewlett Foundation; and the W. Clement and Jessie V. Stone Foundation.
Funding for this report was provided by Lumina Foundation, an independent, private foundation committed to increasing the proportion of Americans with high-quality degrees, certificates and other credentials to 60 percent by 2025. Lumina’s outcomes-based approach focuses on helping to design and build an accessible, responsive and accountable higher education system while fostering a national sense of urgency for action to achieve Goal 2025. For more information on Lumina, visit: www.luminafoundation. org. The views expressed in this report are those of its authors and do not necessarily represent the views of Lumina Foundation, its officers or employees.
About the Author
Stephen Burd is a senior policy analyst at New America. Prior to rejoining New America, Burd was a senior policy analyst for higher education at Education Sector, a non-partisan education think tank in Washington D.C., where he focused on student financial aid and federal higher education tax policy. He also worked for 15 years as a reporter and senior writer at The Chronicle of Higher Education, where he primarily reported on student aid policy and the inner-workings of the U.S. Department of Education.
Introduction
Merit Aid at Public Colleges and Universities
Losing Sight of the “Public Mission”
Conclusion
Contents
2
3
16
17

2EDUCATION POLICY | THE OUT-OF-STATE STUDENT ARMS RACE
INTRODUCTION
The University of Alabama’s dominance on the football field is legendary. The Crimson Tide’s success comes from aggressive recruiting around the country. Last year’s recruiting class included 27 players from 15 states – many of whom were four- and five-star prospects.1
What most people don’t know is that the University of Alabama takes the same intense approach when recruiting top out-of-state students. The school has at least 30 full-time admissions officers spread throughout the country.2 And they come armed with generous merit-based scholarship packages to lure high-achieving students to their school.
It wasn’t always so. In the late 1990s, the University of Alabama’s admissions office had become complacent.3 While the admissions staff did some recruiting, the staff generally expected students to be interested in the school because of its long history and status as a flagship university. Heading into the new century, the university, which marketed itself mainly on its athletic programs and social traditions, was having trouble attracting top students.4
Enter Robert E. Witt, the former business school dean at the University of Texas at Austin and president of the University of Texas at Arlington. Upon taking the presidency of the University of Alabama in 2003, he laid down a challenge to the admissions office: to “recruit top student scholars with the same fervor as top athletic prospects, and look beyond the state’s borders to find them.”5
In the years since, the university has been remarkably successful in attracting nonresident students. Today, in fact, there are more out-of-state students on the campus than in-state ones – a strategy that has helped the school weather large-scale budget cuts from the state.6 Admissions officers at several public universities in different parts of the country said in interviews recently that Alabama has been actively recruiting in their home states. “Alabama has recruiters everywhere,” a top official from a competing public flagship university stated. “It’s really played well for them.”
The University of Alabama is not alone in its aggressive pursuit of out-of-state students. Over the past two decades, there has been a fundamental shift in the
admissions practices of many public four-year colleges and universities. Stung by sharp state budget cuts at the same time they are seeking greater prestige, these universities are increasingly pitted against one another, fiercely competing for students that they most desire: the best and brightest, and those wealthy enough to pay full freight. And they are using a large share of their institutional aid dollars – money that could be going to students who truly need it – to entice these generally privileged students to their schools.
This report examines the use of non-need-based aid at 424 public four-year colleges and universities. The analysis finds that about seven out of 10 of the public institutions examined provide non-need-based aid to at least 5 percent of their freshmen each year. Nearly half provide non-need-based aid to at least 10 percent of their freshmen, and almost one in five provides this assistance to at least 20 percent of their freshmen annually. The study reveals that this practice is not limited to the flagships and major research universities. In recent years, many state regional colleges and universities have found themselves caught up in the competition as well.
Using data that colleges disclose to the magazines that rank them, the report identifies those public colleges that are the biggest players in this merit aid arms race and describes the factors that have led to what has become a widespread and entrenched practice.
In addition, the report finds the following:
• Public colleges that provide substantial amounts of
Public colleges that provide substantial amounts of merit aid to students tend to enroll more out-of-state students than those that provide little of this aid
@NEWAMERICAED
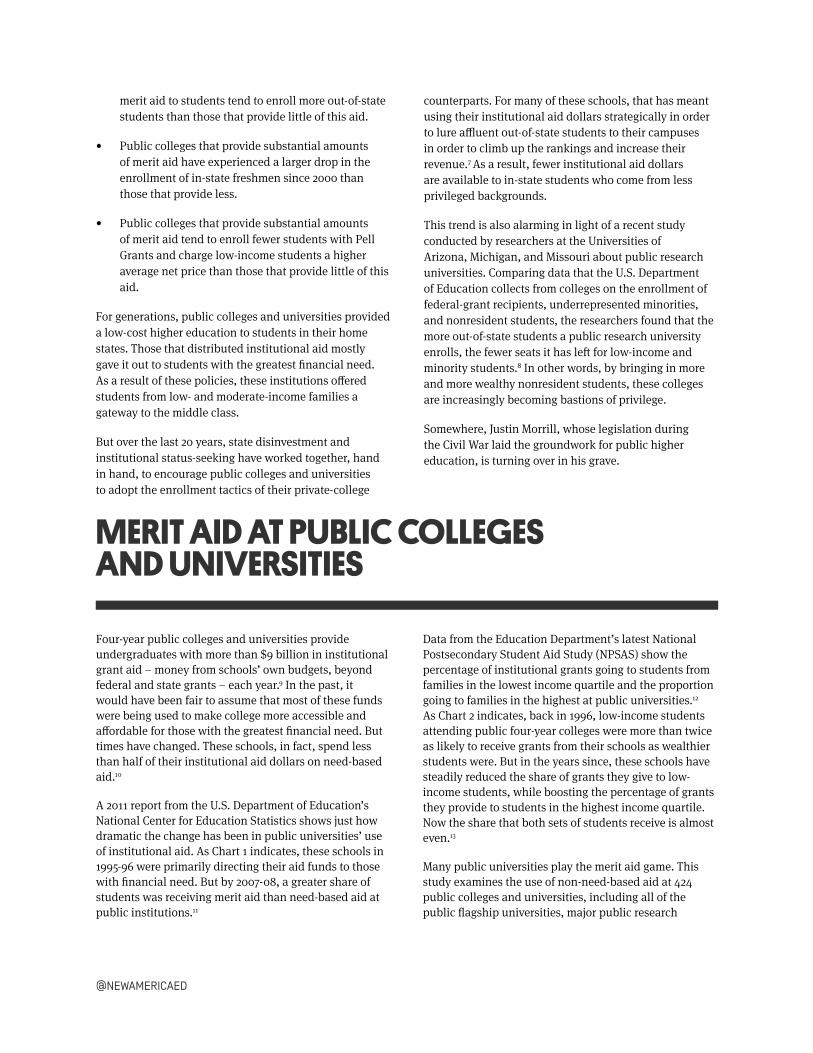
merit aid to students tend to enroll more out-of-state students than those that provide little of this aid.
• Public colleges that provide substantial amounts of merit aid have experienced a larger drop in the enrollment of in-state freshmen since 2000 than those that provide less.
• Public colleges that provide substantial amounts of merit aid tend to enroll fewer students with Pell Grants and charge low-income students a higher average net price than those that provide little of this aid.
For generations, public colleges and universities provided a low-cost higher education to students in their home states. Those that distributed institutional aid mostly gave it out to students with the greatest financial need. As a result of these policies, these institutions offered students from low- and moderate-income families a gateway to the middle class.
But over the last 20 years, state disinvestment and institutional status-seeking have worked together, hand in hand, to encourage public colleges and universities to adopt the enrollment tactics of their private-college
counterparts. For many of these schools, that has meant using their institutional aid dollars strategically in order to lure affluent out-of-state students to their campuses in order to climb up the rankings and increase their revenue.7 As a result, fewer institutional aid dollars are available to in-state students who come from less privileged backgrounds.
This trend is also alarming in light of a recent study conducted by researchers at the Universities of Arizona, Michigan, and Missouri about public research universities. Comparing data that the U.S. Department of Education collects from colleges on the enrollment of federal-grant recipients, underrepresented minorities, and nonresident students, the researchers found that the more out-of-state students a public research university enrolls, the fewer seats it has left for low-income and minority students.8 In other words, by bringing in more and more wealthy nonresident students, these colleges are increasingly becoming bastions of privilege.
Somewhere, Justin Morrill, whose legislation during the Civil War laid the groundwork for public higher education, is turning over in his grave.
3
MERIT AID AT PUBLIC COLLEGES AND UNIVERSITIES
Four-year public colleges and universities provide undergraduates with more than $9 billion in institutional grant aid – money from schools’ own budgets, beyond federal and state grants – each year.9 In the past, it would have been fair to assume that most of these funds were being used to make college more accessible and affordable for those with the greatest financial need. But times have changed. These schools, in fact, spend less than half of their institutional aid dollars on need-based aid.10
A 2011 report from the U.S. Department of Education’s National Center for Education Statistics shows just how dramatic the change has been in public universities’ use of institutional aid. As Chart 1 indicates, these schools in 1995-96 were primarily directing their aid funds to those with financial need. But by 2007-08, a greater share of students was receiving merit aid than need-based aid at public institutions.11
Data from the Education Department’s latest National Postsecondary Student Aid Study (NPSAS) show the percentage of institutional grants going to students from families in the lowest income quartile and the proportion going to families in the highest at public universities.12 As Chart 2 indicates, back in 1996, low-income students attending public four-year colleges were more than twice as likely to receive grants from their schools as wealthier students were. But in the years since, these schools have steadily reduced the share of grants they give to low-income students, while boosting the percentage of grants they provide to students in the highest income quartile. Now the share that both sets of students receive is almost even.13
Many public universities play the merit aid game. This study examines the use of non-need-based aid at 424 public colleges and universities, including all of the public flagship universities, major public research

4EDUCATION POLICY | THE OUT-OF-STATE STUDENT ARMS RACE
160
260
360
320
680
320
600
380
580
380
520
440
500
460
Chart 1. Shift to Merit Aid at 4-Year Public Colleges
Chart 2. Total Institutional Aid by Income Quartile at 4-Year Public Colleges
1995-1996
2007-2008Sc
hool
Yea
rYe
ar
1996
2000
2004
2008
2012
Merit Aid
Parents of Dependent Students in the Lowest Income Quartile
Need-Based Aid
Parents of Dependent Students in the Highest Income Quartile
8%
13%
34%
16%
30%
19%
29%
19%
26%
22%
25%
23%
18%
16%
5@NEWAMERICAED
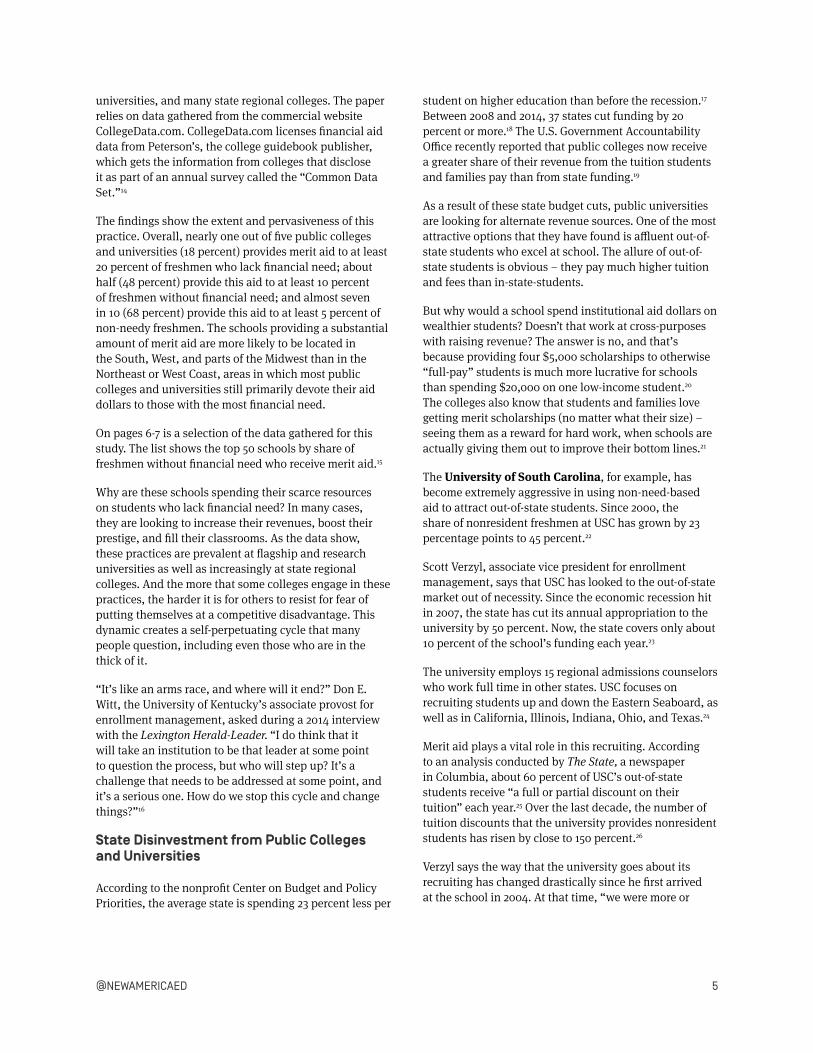
universities, and many state regional colleges. The paper relies on data gathered from the commercial website CollegeData.com. CollegeData.com licenses financial aid data from Peterson’s, the college guidebook publisher, which gets the information from colleges that disclose it as part of an annual survey called the “Common Data Set.”14
The findings show the extent and pervasiveness of this practice. Overall, nearly one out of five public colleges and universities (18 percent) provides merit aid to at least 20 percent of freshmen who lack financial need; about half (48 percent) provide this aid to at least 10 percent of freshmen without financial need; and almost seven in 10 (68 percent) provide this aid to at least 5 percent of non-needy freshmen. The schools providing a substantial amount of merit aid are more likely to be located in the South, West, and parts of the Midwest than in the Northeast or West Coast, areas in which most public colleges and universities still primarily devote their aid dollars to those with the most financial need.
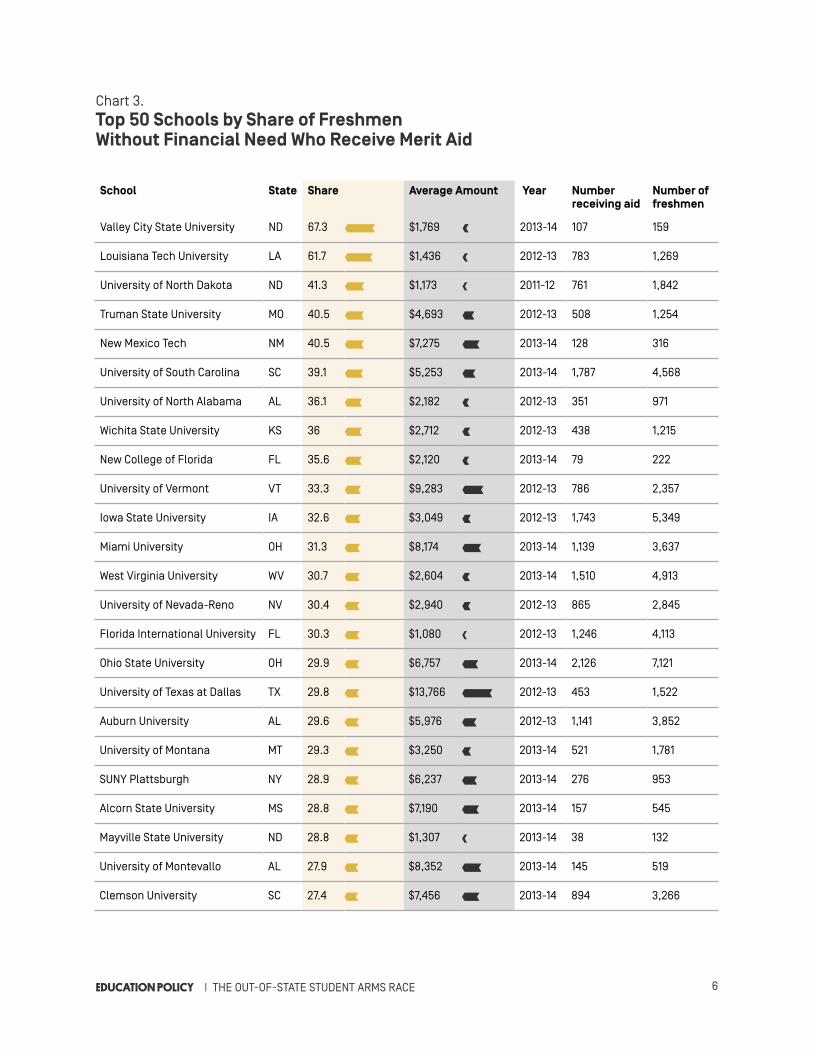
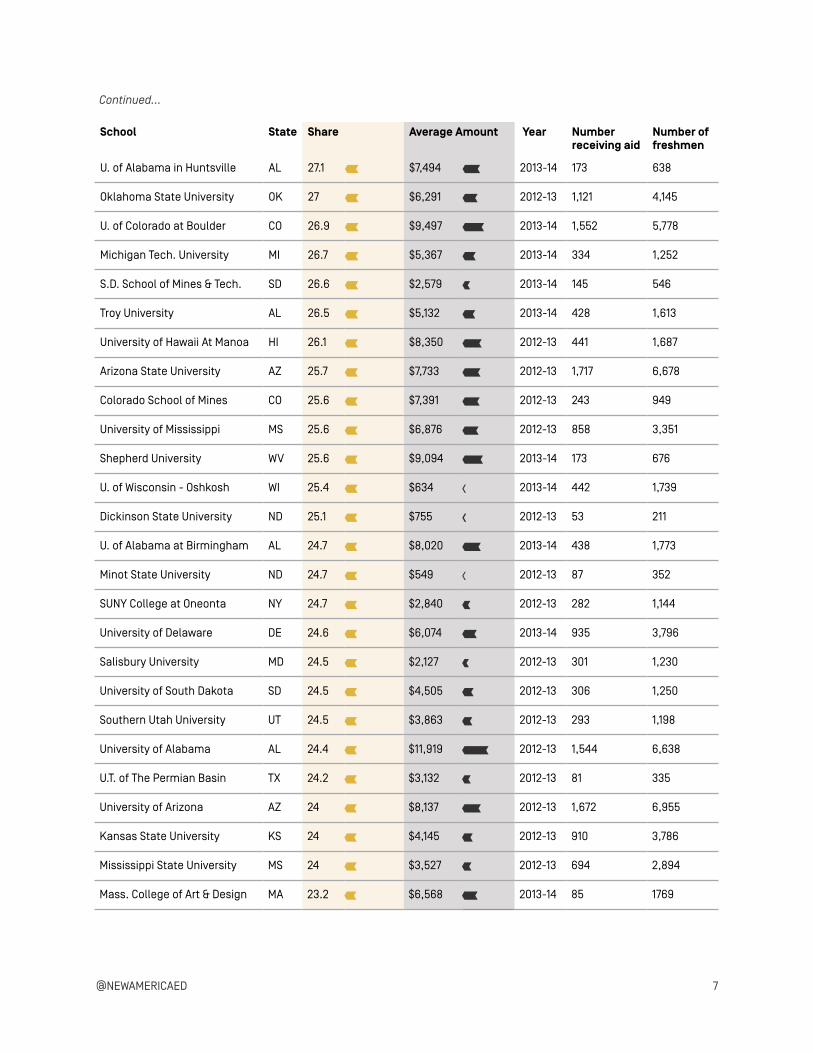
On pages 6-7 is a selection of the data gathered for this study. The list shows the top 50 schools by share of freshmen without financial need who receive merit aid.15
Why are these schools spending their scarce resources on students who lack financial need? In many cases, they are looking to increase their revenues, boost their prestige, and fill their classrooms. As the data show, these practices are prevalent at flagship and research universities as well as increasingly at state regional colleges. And the more that some colleges engage in these practices, the harder it is for others to resist for fear of putting themselves at a competitive disadvantage. This dynamic creates a self-perpetuating cycle that many people question, including even those who are in the thick of it.
“It’s like an arms race, and where will it end?” Don E. Witt, the University of Kentucky’s associate provost for enrollment management, asked during a 2014 interview with the Lexington Herald-Leader. “I do think that it will take an institution to be that leader at some point to question the process, but who will step up? It’s a challenge that needs to be addressed at some point, and it’s a serious one. How do we stop this cycle and change things?”16
State Disinvestment from Public Colleges and Universities
According to the nonprofit Center on Budget and Policy Priorities, the average state is spending 23 percent less per
student on higher education than before the recession.17 Between 2008 and 2014, 37 states cut funding by 20 percent or more.18 The U.S. Government Accountability Office recently reported that public colleges now receive a greater share of their revenue from the tuition students and families pay than from state funding.19
As a result of these state budget cuts, public universities are looking for alternate revenue sources. One of the most attractive options that they have found is affluent out-of-state students who excel at school. The allure of out-of-state students is obvious – they pay much higher tuition and fees than in-state-students.
But why would a school spend institutional aid dollars on wealthier students? Doesn’t that work at cross-purposes with raising revenue? The answer is no, and that’s because providing four $5,000 scholarships to otherwise “full-pay” students is much more lucrative for schools than spending $20,000 on one low-income student.20 The colleges also know that students and families love getting merit scholarships (no matter what their size) – seeing them as a reward for hard work, when schools are actually giving them out to improve their bottom lines.21
The University of South Carolina, for example, has become extremely aggressive in using non-need-based aid to attract out-of-state students. Since 2000, the share of nonresident freshmen at USC has grown by 23 percentage points to 45 percent.22
Scott Verzyl, associate vice president for enrollment management, says that USC has looked to the out-of-state market out of necessity. Since the economic recession hit in 2007, the state has cut its annual appropriation to the university by 50 percent. Now, the state covers only about 10 percent of the school’s funding each year.23
The university employs 15 regional admissions counselors who work full time in other states. USC focuses on recruiting students up and down the Eastern Seaboard, as well as in California, Illinois, Indiana, Ohio, and Texas.24
Merit aid plays a vital role in this recruiting. According to an analysis conducted by The State, a newspaper in Columbia, about 60 percent of USC’s out-of-state students receive “a full or partial discount on their tuition” each year.25 Over the last decade, the number of tuition discounts that the university provides nonresident students has risen by close to 150 percent.26
Verzyl says the way that the university goes about its recruiting has changed drastically since he first arrived at the school in 2004. At that time, “we were more or
6EDUCATION POLICY | THE OUT-OF-STATE STUDENT ARMS RACE
School State Share Average Amount Year Number receiving aid
Number of freshmen
Valley City State University ND 67.3 269 $1,769 35 2013-14 107 159
Louisiana Tech University LA 61.7 247 $1,436 28 2012-13 783 1,269
University of North Dakota ND 41.3 165 $1,173 23 2011-12 761 1,842
Truman State University MO 40.5 162 $4,693 92 2012-13 508 1,254
New Mexico Tech NM 40.5 162 $7,275 143 2013-14 128 316
University of South Carolina SC 39.1 156 $5,253 103 2013-14 1,787 4,568
University of North Alabama AL 36.1 144 $2,182 43 2012-13 351 971
Wichita State University KS 36 144 $2,712 53 2012-13 438 1,215
New College of Florida FL 35.6 142 $2,120 42 2013-14 79 222
University of Vermont VT 33.3 133 $9,283 182 2012-13 786 2,357
Iowa State University IA 32.6 130 $3,049 60 2012-13 1,743 5,349
Miami University OH 31.3 125 $8,174 160 2013-14 1,139 3,637
West Virginia University WV 30.7 123 $2,604 51 2013-14 1,510 4,913
University of Nevada-Reno NV 30.4 122 $2,940 58 2012-13 865 2,845
Florida International University FL 30.3 121 $1,080 21 2012-13 1,246 4,113
Ohio State University OH 29.9 120 $6,757 132 2013-14 2,126 7,121
University of Texas at Dallas TX 29.8 119 $13,766 270 2012-13 453 1,522
Auburn University AL 29.6 118 $5,976 117 2012-13 1,141 3,852
University of Montana MT 29.3 117 $3,250 64 2013-14 521 1,781
SUNY Plattsburgh NY 28.9 116 $6,237 122 2013-14 276 953
Alcorn State University MS 28.8 115 $7,190 141 2013-14 157 545
Mayville State University ND 28.8 115 $1,307 26 2013-14 38 132
University of Montevallo AL 27.9 112 $8,352 164 2013-14 145 519
Clemson University SC 27.4 110 $7,456 146 2013-14 894 3,266
Chart 3. Top 50 Schools by Share of Freshmen Without Financial Need Who Receive Merit Aid
7@NEWAMERICAED
School State Share Average Amount Year Number receiving aid
Number of freshmen
U. of Alabama in Huntsville AL 27.1 108 $7,494 147 2013-14 173 638
Oklahoma State University OK 27 108 $6,291 123 2012-13 1,121 4,145
U. of Colorado at Boulder CO 26.9 108 $9,497 186 2013-14 1,552 5,778
Michigan Tech. University MI 26.7 107 $5,367 105 2013-14 334 1,252
S.D. School of Mines & Tech. SD 26.6 106 $2,579 51 2013-14 145 546
Troy University AL 26.5 106 $5,132 101 2013-14 428 1,613
University of Hawaii At Manoa HI 26.1 104 $8,350 164 2012-13 441 1,687
Arizona State University AZ 25.7 103 $7,733 152 2012-13 1,717 6,678
Colorado School of Mines CO 25.6 102 $7,391 145 2012-13 243 949
University of Mississippi MS 25.6 102 $6,876 135 2012-13 858 3,351
Shepherd University WV 25.6 102 $9,094 178 2013-14 173 676
U. of Wisconsin - Oshkosh WI 25.4 102 $634 12 2013-14 442 1,739
Dickinson State University ND 25.1 100 $755 15 2012-13 53 211
U. of Alabama at Birmingham AL 24.7 99 $8,020 157 2013-14 438 1,773
Minot State University ND 24.7 99 $549 11 2012-13 87 352
SUNY College at Oneonta NY 24.7 99 $2,840 56 2012-13 282 1,144
University of Delaware DE 24.6 98 $6,074 119 2013-14 935 3,796
Salisbury University MD 24.5 98 $2,127 42 2012-13 301 1,230
University of South Dakota SD 24.5 98 $4,505 88 2012-13 306 1,250
Southern Utah University UT 24.5 98 $3,863 76 2012-13 293 1,198
University of Alabama AL 24.4 98 $11,919 234 2012-13 1,544 6,638
U.T. of The Permian Basin TX 24.2 97 $3,132 61 2012-13 81 335
University of Arizona AZ 24 96 $8,137 160 2012-13 1,672 6,955
Kansas State University KS 24 96 $4,145 81 2012-13 910 3,786
Mississippi State University MS 24 96 $3,527 69 2012-13 694 2,894
Mass. College of Art & Design MA 23.2 93 $6,568 129 2013-14 85 1769
Continued...
8EDUCATION POLICY | THE OUT-OF-STATE STUDENT ARMS RACE
less order-takers – people expressed an interest, we provided information and serviced the applicants,” he told The Chronicle of Higher Education in 2011. “Now we’re becoming more like private schools in the way we approach admissions. We’re more in the mode of hustling for business and trying to find new markets.”27
Another public school that has been particularly aggressive in its out-of-state recruiting is Miami University in Ohio. There, Michael Kabbaz, vice president for enrollment management and student success, is on a mission to make the school into a “destination institution” for out-of-state students who are at the top of their class and whose families can afford to pay full freight.28
Given the fiscal realities that Miami University is facing, Kabbaz sees no alternative to the approach he is pursuing. During the recent recession, the state of Ohio slashed spending per student at its public universities by nearly 30 percent. Back in the 1970s, state appropriations covered about three-quarters of Miami University’s annual budget. Today, it accounts for only about 11 percent. The school now relies on tuition revenue to cover 55 percent of its budget.29
“We can’t control what the state has in store for us over the next 10, 15, 20 years,” Kabbaz said. “But we can develop alternative revenue sources so we are able to sustain whatever comes down from the state.”30
Demographic Trends
Out-of-state students are also attractive to public universities in states where the number of students graduating from high school is shrinking. The college-age population is in decline in about 30 states, according to the Western Interstate Commission for Higher Education (WICHE), a regional organization that provides data and policy analysis for governors, legislators, and educators
in 16 Western states and territories.31
Both South Carolina and Ohio are facing steep declines in the college-age population, which has been another impetus for both the University of South Carolina and Miami University to seek out nonresident students.
A more extreme example is North Dakota. This state – already sparsely populated – has seen a steady decline in the number of high school graduates over the last two decades.32 The University of North Dakota is desperate to enroll nonresident students. Its very survival may depend on it. As a result, two-thirds of the freshmen that the university enrolls each year come from out of state.33
And it turns out that it takes a lot of money to persuade nonresident students to go to a college in a state that is known for its remoteness and frigid winters. At UND, more than 40 percent of freshmen with no financial need receive merit aid each year.34 With all of the discounts it provides them, UND charges out-of-state students an amount that is lower than most of them would pay as in-state students at their local public universities.35
Prestige Seeking
By seeking top students around the country, these schools are not only looking to increase their revenues and enrollment but to boost their prestige. Rising up the U.S. News & World Report rankings enhances their reputation and marketability among the students they are trying to attract.
Donald Hossler, a professor at Indiana University, is one of the nation’s foremost experts on enrollment management, a multimillion-dollar industry of private consultants that advise colleges on admissions and financial aid policies. He says that schools that primarily use merit aid to raise their institution’s academic profile tend to give much larger scholarship awards than those that are simply recruiting wealthy students to make up for state budget cuts. “A valedictorian with a high SAT score will be getting offers from all over the country, so it’s quite possible that public flagship universities will offer her a financial package that is larger than the tuition costs of the institution. They may be covering her room and board as well,” Hossler said in an interview.36
For example, at the University of Alabama, out-of state students with 1400 to 1600 SAT scores in critical reading and math who have earned a cumulative grade point average of at least a 3.5 are automatically eligible for a full-tuition scholarship for four years. Those with slightly lower test scores are eligible for scholarships covering
“Now we’re becoming more like private schools in the way we approach admissions. We’re more in the mode of hustling for business and trying to find new markets.” - Scott Verzyl
9@NEWAMERICAED
up to two-thirds of their tuition. Meanwhile, the school goes all out for National Merit Scholars, covering their full tuition for four years as well as providing them with a reduced rate on campus housing, an additional $3,500 scholarship each year for four years, a onetime $2,000 stipend for summer research or international study, and a free iPad.37
The university’s efforts appear to have paid off – as it has seen its U.S. News ranking surge over the last decade. Considered a second-tier institution in the late 1990s, the school now ranks 88th among all national universities and 38th among public universities.38
To be clear, the goals of increasing revenue, raising prestige, and filling classrooms are often not mutually exclusive. Many universities – including Miami University and the University of South Carolina – are trying to achieve these goals simultaneously.
Playing Defense
This is not to say that public colleges and universities aren’t providing merit aid to in-state students. They provide non-need-based aid to top students in their home states as well. In this way, public institutions are using merit aid for both offensive and defensive purposes. They are aggressively seeking affluent and high-achieving students out of state, while trying to stop other institutions from grabbing up their best home-state students, who help them in the rankings.
The University of Missouri at Columbia recently found itself needing to make major changes to its scholarship programs to stem the flow of top students leaving the state.39
Admissions officers from the Universities of Alabama, Arkansas, Kentucky, Minnesota, and Mississippi had all set up shop in Missouri and, in 2013, were offering these students generous merit-based scholarship packages to
attract them to their schools.40
Suffering a significant enrollment decrease among the high-achieving in-state students that it would normally enroll, officials at Mizzou knew they had to respond forcefully. The university created a new program that would provide $6,500-a-year scholarships to Missouri’s best students. At the same time, it beefed up its Mark Twain scholarship for out-of-state students, offering up to $10,000 discounts to nonresident students who scored at least 27 on the ACT exam and were in the top half of their graduating class.41
These changes to the university’s scholarship programs were the first in 20 years, and they appear to have stopped the outflow of students. The school, however, may not have the luxury of waiting so long before it needs to alter them again. “If our competitors continue to increase their merit aid offerings in the next several years, we’ll have to revisit our scholarship programs, especially if our enrollment drops again,” Ann Korschgen, Mizzou’s vice provost for enrollment management, said in an interview.42
The Flagship Universities
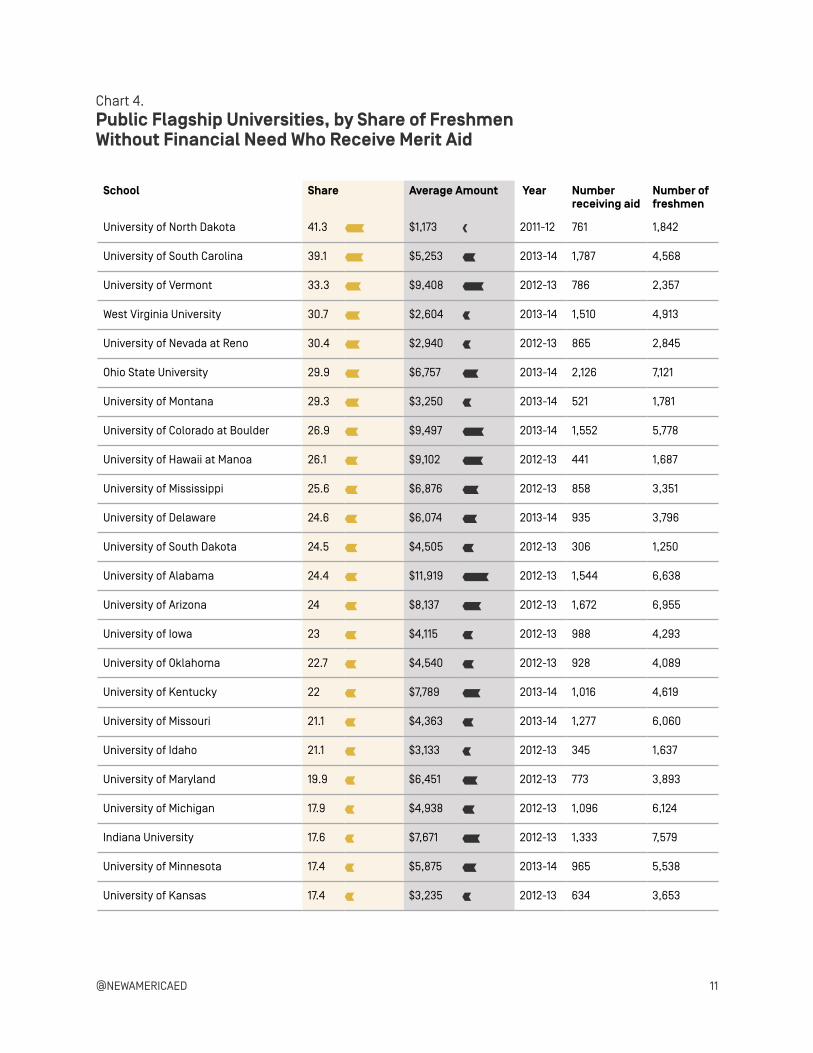
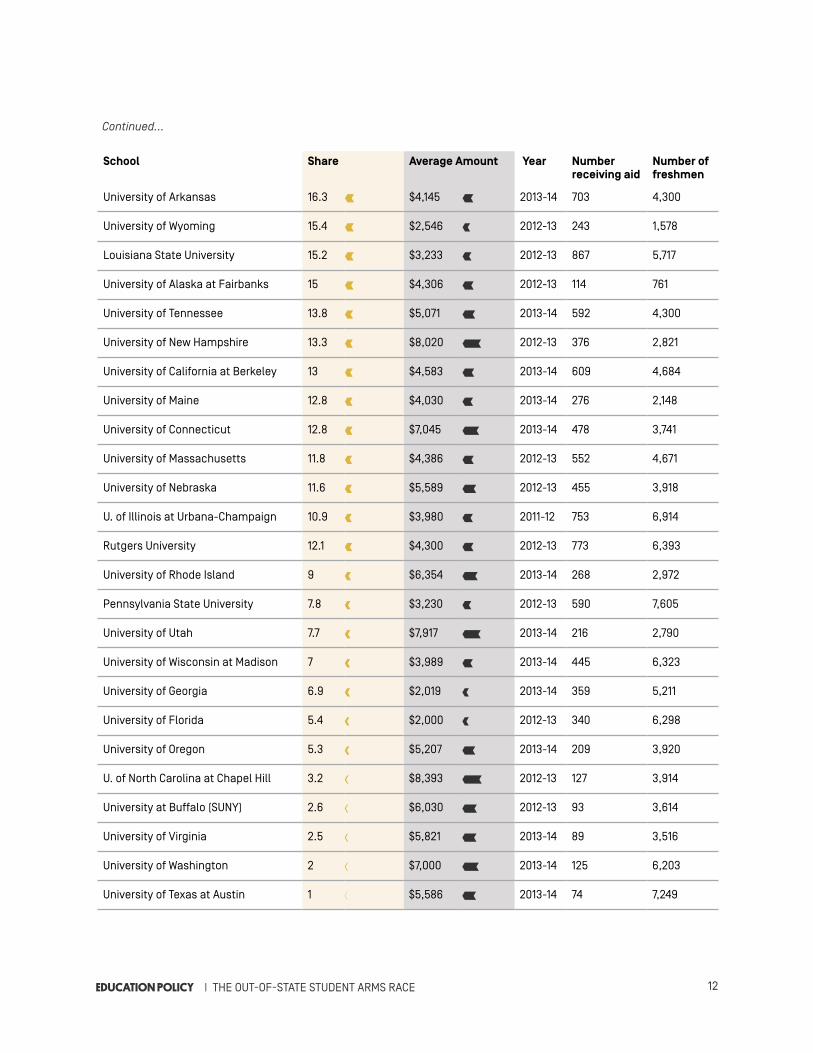
Many flagship institutions are very generous providers of merit aid. But even among these institutions, there are wide disparities in how much this aid is being used. On pages 11-12 is a list of the public flagship universities, showing the share of students on their campuses without financial need who are receiving merit aid.43
At the University of Kentucky (UK), for example, 22 percent of its freshmen with no financial need receive merit aid each year.44 That’s compared to only about 3 percent at the University of North Carolina at Chapel Hill.45
What accounts for the difference? “A lot of these policies are driven by where you sit on the food chain, and where you want to get,” says Shirley Ort, UNC’s associate provost and director of scholarships and student aid.46 Often referred to as a “Public Ivy,” UNC does not need to work nearly as hard as the University of Kentucky to attract top students.
In addition, UNC still reserves the bulk of its seats for students from North Carolina. In fact, public universities in North Carolina have long been prohibited from enrolling more than 18 percent of their students from out of state.47
In contrast, at UK, where no similar cap exists, bringing
“If our competitors continue to increase their merit aid offerings in the next several years, we’ll have to revisit our scholarship programs” - Ann Korschgen
10EDUCATION POLICY | THE OUT-OF-STATE STUDENT ARMS RACE
in high-achieving out-of-state students has been a key part of its strategy to raise its rankings so that it can become a Top 20 public research university.48 To attract these nonresident students as well as to keep the “best and brightest” students from going out of state, the University of Kentucky has almost entirely shifted away from offering pure need-based aid. “Of the nearly $70 million UK gave in institutional aid this past school year, less than 4 percent was earmarked solely for students who need financial help to attend college,” the Lexington Herald-Leader reported last July.49
Largely free from such pressures, the University of North Carolina awards its aid based almost entirely on financial need. Under the Carolina Covenant program, which started a little more than a decade ago, the university solely uses grant aid and work study to cover the full financial need of students with family incomes equivalent to 200 percent of the poverty line or less. As a result, low-income students who qualify for admission can attend the school debt-free.50
“What has always mattered at Carolina and what continues to matter is that we recruit the best and brightest students, regardless of their financial need,” says Ort. “And our admissions decisions are not influenced by whether a student is full pay. We are completely need-blind.”51
Like UNC, the University of California at Berkeley52, the University of Virginia, and the University of Washington at Seattle still spend nearly all of their institutional aid dollars on meeting the full financial need of the low-income students they enroll.53
But even some of these universities have been feeling pressure to join the fray. In recent years, the University of Virginia has seen its “yield rate” – the proportion of students who enroll in college after being admitted – “gradually decline in some demographic groups,” according to Gregory Roberts, UVa’s dean of admission. “Nationally peers are pursuing admission and aid policies that target our best applicants,” Roberts warned in a presentation that he delivered to the university’s board in August 2012, adding, “We will risk losing top scholars unless we begin to rethink the relationship between admission and financial aid at UVa.”54
Few flagship universities have felt the heat of competition more acutely than the University of Illinois at Urbana-Champaign. For nearly a decade, the school has seen its “yield” numbers decline each year, as public universities from other states have swooped in and recruited top Illinois students to their campuses.55
Indiana University and the Universities of Iowa and Missouri have been especially aggressive in going after these students.56 In recent years, about 20 percent of freshmen at Missouri’s flagship campus have come from Illinois.57
“We have to offer admission to more students to fill our class because the competition for top-notch students just keeps getting more intense each year,” Daniel Mann, the director of student financial aid at the University of Illinois, said. “And many times, it is scholarships and financial aid that are being used to compete for those students.”58
The university has struggled in part because it was late to embrace merit aid. For most of its history, the school awarded its aid predominantly based on financial need.59 It wasn’t until the 2011-12 academic year that the university began offering $5,000 and $10,000 merit-based scholarships for incoming students with high test scores.60
But even these efforts have not stopped top students from leaving the state. Explaining why the yield rates continued to decline, Phyllis Wise, the university’s chancellor, told the university’s Board of Trustees in 2013, “The No. 1 reason students don’t come is because of money.”61
But given dramatic state budget cuts, the university is unlikely to further sweeten the pot anytime soon. “Our big concern in the immediate future is maintaining this level of merit aid in the face of tough economic times in the state,” Charles Tucker, the university’s vice provost for undergraduate education and innovation, said during an interview.62
Public Regional Colleges and Universities
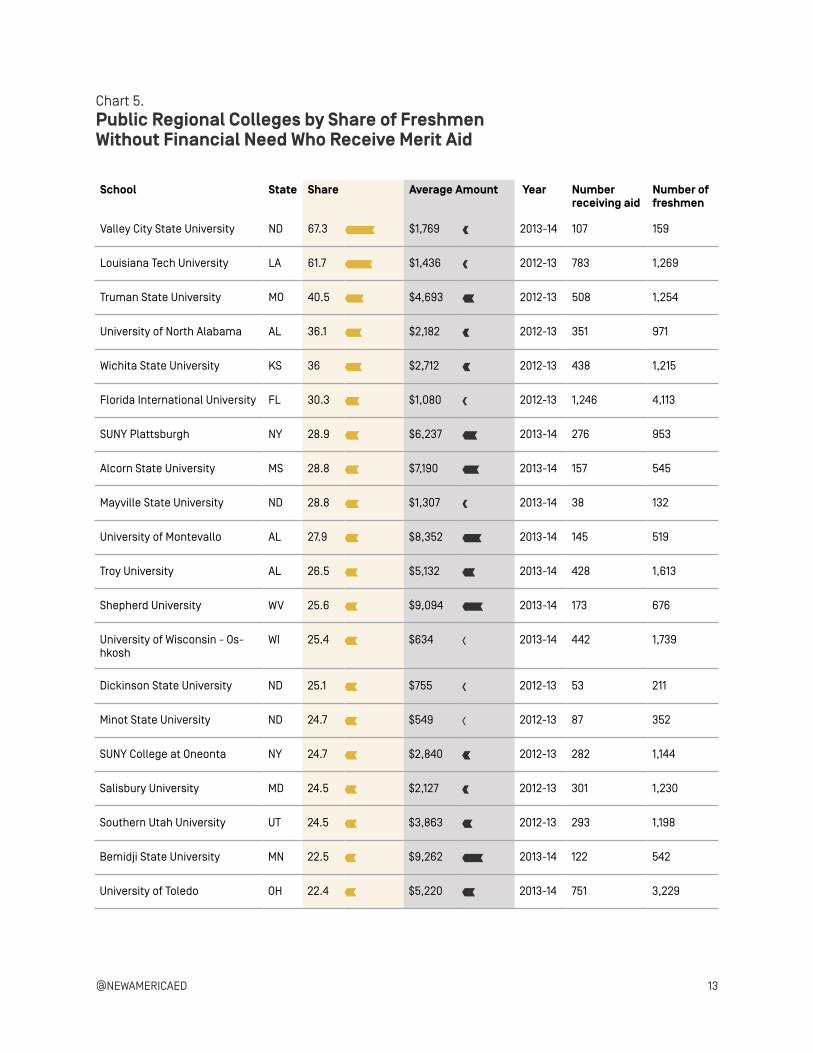
Public flagships and research universities are not the only institutions making significant investments in non-need-based aid. Many state regional colleges are increasingly offering merit aid as well. In fact, 40 percent of the 277 regional colleges examined in this paper provided merit aid to at least 10 percent of freshmen who lacked financial need; 23 percent provided it to at least 15 percent; and 14 percent provided it to 20 percent or more.63
On page 13 is a list of the public regional colleges that are providing merit aid to the largest share of freshmen without financial need on their campuses.
It is probably not too surprising that four of the universities on the list hail from North Dakota –Valley
11@NEWAMERICAED
School Share Average Amount Year Number receiving aid
Number of freshmen
University of North Dakota 41.3 165 $1,173 23 2011-12 761 1,842
University of South Carolina 39.1 156 $5,253 103 2013-14 1,787 4,568
University of Vermont 33.3 133 $9,408 184 2012-13 786 2,357
West Virginia University 30.7 123 $2,604 51 2013-14 1,510 4,913
University of Nevada at Reno 30.4 122 $2,940 58 2012-13 865 2,845
Ohio State University 29.9 120 $6,757 132 2013-14 2,126 7,121
University of Montana 29.3 117 $3,250 64 2013-14 521 1,781
University of Colorado at Boulder 26.9 108 $9,497 186 2013-14 1,552 5,778
University of Hawaii at Manoa 26.1 104 $9,102 178 2012-13 441 1,687
University of Mississippi 25.6 102 $6,876 135 2012-13 858 3,351
University of Delaware 24.6 98 $6,074 119 2013-14 935 3,796
University of South Dakota 24.5 98 $4,505 88 2012-13 306 1,250
University of Alabama 24.4 98 $11,919 234 2012-13 1,544 6,638
University of Arizona 24 96 $8,137 160 2012-13 1,672 6,955
University of Iowa 23 92 $4,115 81 2012-13 988 4,293
University of Oklahoma 22.7 91 $4,540 89 2012-13 928 4,089
University of Kentucky 22 88 $7,789 153 2013-14 1,016 4,619
University of Missouri 21.1 84 $4,363 86 2013-14 1,277 6,060
University of Idaho 21.1 84 $3,133 61 2012-13 345 1,637
University of Maryland 19.9 80 $6,451 126 2012-13 773 3,893
University of Michigan 17.9 72 $4,938 97 2012-13 1,096 6,124
Indiana University 17.6 70 $7,671 150 2012-13 1,333 7,579
University of Minnesota 17.4 70 $5,875 115 2013-14 965 5,538
University of Kansas 17.4 70 $3,235 63 2012-13 634 3,653
Chart 4. Public Flagship Universities, by Share of Freshmen Without Financial Need Who Receive Merit Aid
12EDUCATION POLICY | THE OUT-OF-STATE STUDENT ARMS RACE
School Share Average Amount Year Number receiving aid
Number of freshmen
University of Arkansas 16.3 65 $4,145 81 2013-14 703 4,300
University of Wyoming 15.4 62 $2,546 50 2012-13 243 1,578
Louisiana State University 15.2 61 $3,233 63 2012-13 867 5,717
University of Alaska at Fairbanks 15 60 $4,306 84 2012-13 114 761
University of Tennessee 13.8 55 $5,071 99 2013-14 592 4,300
University of New Hampshire 13.3 53 $8,020 157 2012-13 376 2,821
University of California at Berkeley 13 52 $4,583 90 2013-14 609 4,684
University of Maine 12.8 51 $4,030 79 2013-14 276 2,148
University of Connecticut 12.8 51 $7,045 138 2013-14 478 3,741
University of Massachusetts 11.8 47 $4,386 86 2012-13 552 4,671
University of Nebraska 11.6 46 $5,589 110 2012-13 455 3,918
U. of Illinois at Urbana-Champaign 10.9 44 $3,980 78 2011-12 753 6,914
Rutgers University 12.1 48 $4,300 84 2012-13 773 6,393
University of Rhode Island 9 36 $6,354 125 2013-14 268 2,972
Pennsylvania State University 7.8 31 $3,230 63 2012-13 590 7,605
University of Utah 7.7 31 $7,917 155 2013-14 216 2,790
University of Wisconsin at Madison 7 28 $3,989 78 2013-14 445 6,323
University of Georgia 6.9 28 $2,019 40 2013-14 359 5,211
University of Florida 5.4 22 $2,000 39 2012-13 340 6,298
University of Oregon 5.3 21 $5,207 102 2013-14 209 3,920
U. of North Carolina at Chapel Hill 3.2 13 $8,393 165 2012-13 127 3,914
University at Buffalo (SUNY) 2.6 10 $6,030 118 2012-13 93 3,614
University of Virginia 2.5 10 $5,821 114 2013-14 89 3,516
University of Washington 2 8 $7,000 137 2013-14 125 6,203
University of Texas at Austin 1 4 $5,586 110 2013-14 74 7,249
Continued...
13@NEWAMERICAED
School State Share Average Amount Year Number receiving aid
Number of freshmen
Valley City State University ND 67.3 269 $1,769 35 2013-14 107 159
Louisiana Tech University LA 61.7 247 $1,436 28 2012-13 783 1,269
Truman State University MO 40.5 162 $4,693 92 2012-13 508 1,254
University of North Alabama AL 36.1 144 $2,182 43 2012-13 351 971
Wichita State University KS 36 144 $2,712 53 2012-13 438 1,215
Florida International University FL 30.3 121 $1,080 21 2012-13 1,246 4,113
SUNY Plattsburgh NY 28.9 116 $6,237 122 2013-14 276 953
Alcorn State University MS 28.8 115 $7,190 141 2013-14 157 545
Mayville State University ND 28.8 115 $1,307 26 2013-14 38 132
University of Montevallo AL 27.9 112 $8,352 164 2013-14 145 519
Troy University AL 26.5 106 $5,132 101 2013-14 428 1,613
Shepherd University WV 25.6 102 $9,094 178 2013-14 173 676
University of Wisconsin - Os-hkosh
WI 25.4 102 $634 12 2013-14 442 1,739
Dickinson State University ND 25.1 100 $755 15 2012-13 53 211
Minot State University ND 24.7 99 $549 11 2012-13 87 352
SUNY College at Oneonta NY 24.7 99 $2,840 56 2012-13 282 1,144
Salisbury University MD 24.5 98 $2,127 42 2012-13 301 1,230
Southern Utah University UT 24.5 98 $3,863 76 2012-13 293 1,198
Bemidji State University MN 22.5 90 $9,262 182 2013-14 122 542
University of Toledo OH 22.4 90 $5,220 102 2013-14 751 3,229
Chart 5. Public Regional Colleges by Share of Freshmen Without Financial Need Who Receive Merit Aid
14EDUCATION POLICY | THE OUT-OF-STATE STUDENT ARMS RACE
City State University, Mayville State University, Dickinson State University, and Minot State University. Like the University of North Dakota, these colleges feel they have little choice but to seek out nonresident students, given the steadily shrinking number of North Dakotan high school graduates.64 For example, nearly 40 percent of freshmen at Valley City come from other states.65
These four universities have one major competitive advantage over most other public regional schools: North Dakota is the only state that substantially boosted spending on its public universities during the recession.66 Due to an oil boom in western North Dakota, the state was able to increase appropriations to the schools by about 40 percent per student from 2008 to 2014.67 With more resources in hand, these schools have been able to make themselves very attractive to nonresident students who are hunting for bargains.68
Also prominent on the list is the University of North Alabama (UNA). For much of its history, UNA has predominantly enrolled students from just five Alabama counties. But the school has seen its enrollment decline in each of the past five years, as other public universities have begun to recruit heavily in the counties that it primarily serves.69
The competition “does indeed make the job more difficult for us,” Thomas J. Calhoun Jr., vice president for enrollment management at UNA, recently told the TimesDaily. “It has created the need for us to redefine what our region is.”70
“Everyone’s territory appears to be becoming everyone else’s territory, to the point that we don’t have a territory, really,” he said. “Everyone is competing everywhere.”71
Now, the university is not just using merit aid to stem the flow of northern Alabama students to other schools, but it is starting to expand its recruiting presence out-of-
state as well. Beginning this August, UNA will be able to charge nonresident students who receive a scholarship of at least $1,000 its in-state tuition rate. The school’s goal, according to the TimesDaily, is “to grab a larger percentage of students in Tennessee while working to create a market in other Southeastern states.”72
Another school that gives out a lot of merit aid is Wichita State University in Kansas, a state that has cut spending on higher education by about 23 percent since 2008.73 To make up for lost revenue, the university is seeking to grow by enrolling an additional 7,000 students.74 This effort will require Wichita State to engage in “much more aggressive recruiting of freshmen both in-state and out-of-state,” according to John Bardo, the school’s president.75
As a first step, the university spent $700,000 in 2013 to hire the enrollment management firm Royall & Company to help expand its reach outside Kansas. With the help of the company, the university is purchasing lists of names of hundreds of thousands of high school sophomores, juniors, and seniors that it can recruit nationwide. “The plan is to spend hundreds of thousands,” Bardo said. “The payoff will be millions.”76
The school has also restructured its scholarship program to make it more appealing to “academically talented students.”77 For the first time, students are automatically considered for merit scholarships upon admission to the university (instead of having to apply for them separately). And the scholarships are available for up to four years of school. Previously, students had to reapply for them each year.78
“Our interest is in making sure we keep the best and brightest people in Wichita so that they become part of our long-term workforce,” Bardo stated. “The new plan also allows us to recruit bright new people from out of state who we can help become part of our community.”79
Wichita State is certainly generous with merit aid. In 2012-13, 36 percent of freshmen with no financial need received merit aid, averaging $2,712 per year.80
A Self-Perpetuating System
Northern Illinois University (NIU) may never have wanted to join the merit aid arms race. But the school realized several years ago that it didn’t have any other choice.
Enrollment was dropping, in part because the supply of high school graduates in Illinois was in decline. But there was also another major factor: Public universities from other states were increasingly coming in and recruiting
Forty percent of the 277 regional colleges examined in this paper provided merit aid to at least 10 percent of freshmen who lacked financial need

15@NEWAMERICAED
students in the 11 northern Illinois counties that the school has traditionally served.81
“Northern Illinois has become a robust recruitment territory for many out-of-state colleges and universities, some of which have Chicago-based recruitment offices,” university officials wrote in the school’s 2012-16 enrollment management strategic plan.82
“Our competition is aggressive,” the enrollment management plan stated, “and we need more dollars to compete and let high-achieving students, especially those in the top 10 percent of their graduating class, know how much they are valued.”83
As a result, NIU set aside $10 million in 2011 to create two new scholarship programs. The first was aimed at keeping top Illinois students in the state. The second was to help the university begin to recruit out-of-state students. Under the program, top students from Indiana, Iowa, and Wisconsin were eligible to have their out-of-state tuition discounted by 50 percent.84
In 2012-13, about 13 percent of the university’s freshmen with no financial need received merit aid, averaging $4,635.85 While the proportion of students receiving merit aid is small compared with other institutions discussed in this paper, it is likely to grow as NIU is still experiencing enrollment declines.
In response, the university has been working with outside consultants to improve its merit aid offerings. And the administration has floated plans to significantly reduce the out-of-state tuition for all students from the Midwest “to create a greater incentive for these students to enroll at NIU.”86
The increased competition for students has left some NIU officials nostalgic for the past. “It used to be you could just sit back and wait for the students to come to you,” Paul Palian, the university’s director of media and public relations, recently told The Associated Press.87
Schools like NIU are becoming involved in the merit aid arms race in order to keep up with the competition, fill their classrooms, and strengthen their bottom line. It appears to be a good strategy and the only way to stay afloat. However, the end results are not actually so clear. If everyone is playing the same game, the stakes only get higher and it becomes impossible to break the cycle.
And indeed, some experts warn that this path may be harmful to the colleges following it. “Institutions seeking to offset enrollment and/or revenue declines with out-of-state students are going to find it a tough road,” Hossler of Indiana University told The Chronicle of Higher Education. “And to the extent that they are successful, they are likely to increasingly find that they have to get into a cycle of ever increasing the dollar value of their financial aid awards to achieve their goals.”88
But the chance that the institutions themselves will end the cycle seems low. Indeed, public university presidents appear to be even more resistant to the idea of giving up non-need-based aid than their private-college peers. According to a 2013 Inside Higher Ed survey, 71 percent of public four-year college presidents said they wouldn’t eliminate merit aid even if their competitors did so. In comparison, only 48 percent of private-college leaders disagreed or strongly disagreed with the idea.89
“Our competition is aggressive and we need more dollars to compete and let high-achieving students, especially those in the top 10 percent of their graduating class, know how much they are valued. - Northern Illinois University
Enrollment Management Plan
Seventy-one percent of public four-year college presidents said they wouldn’t eliminate merit aid even if their competitors did so. In comparison, only 48 percent of private-college leaders disagreed or strongly disagreed with the idea

16EDUCATION POLICY | THE OUT-OF-STATE STUDENT ARMS RACE
For generations, public colleges and universities provided a low-cost higher education in their home states, allowing students from low- and moderate-income families a gateway to the middle class.
But as more and more public colleges get caught up in the merit aid arms race, the nature of public higher education appears to be changing. Public colleges and universities are increasingly adapting the enrollment management tactics of their private-college counterparts to get the students they most desire: those that will help them raise their revenue and boost their prestige.
These trends are raising alarms among higher education experts. In 2013, the Western Interstate Commission for Higher Education (WICHE) issued a policy brief warning that “dwindling state appropriations” were skewing public colleges’ priorities – by encouraging them to recruit and aid affluent out-of-state students at the expense of “a large contingent of students closer by who might be served.”90
“The chase for net tuition revenue is putting enormous and rising pressure on institutions, and especially their admissions and enrollment management operations, in ways that may work at cross purposes to the states’ public interest in achieving higher levels of educational attainment,” the policy brief states.91
New America’s study provides more detail about the role merit aid plays in these larger trends that subvert the mission of public higher education.
The extent to which universities are fulfilling their public
mission can be measured by the percentage of resident students, the proportion of Pell Grant recipients, and the average net price – the average amount of money that students and their families have to pay after all grant and scholarship aid is deducted from the listed price.
While it is difficult to employ the data gathered in this study to prove a causal relationship between the shift to merit aid and these other variables, there are a number of correlations that bring the picture into focus.
The Drive for Out-of-State Students
Data in this paper show that public colleges and universities that provide merit aid to a large share of their freshmen tend to enroll more out-of-state students and fewer in-state students than those that provide little or none of this aid to their freshmen.
At high merit aid schools (those that provide merit aid to 25 percent or more of their freshmen), the freshman class is made up, on average, of 69 percent in-state students and 28 percent out-of-state students. In comparison, at low merit aid schools (those that provide merit aid to 5 percent or less of their freshmen), the freshman class consists of, on average, 87 percent in-state students and only 10 percent out-of-state students.92
The report also examined changes in enrollment patterns since 2000 at the 424 public colleges and universities. The data show that the enrollment of in-state first-time students has fallen both at high merit-aid and low merit-aid schools, substantiating the general trend toward higher-tuition students. However, the reduction has been steeper at high merit-aid schools – 5 percentage points fewer in-state students over a little more than a decade, compared with only 1 percentage point fewer at low merit-aid schools. This difference strongly suggests the role merit aid has played in recruiting nonresident students.93
These findings are distressing in light of the recent study that found that the more a public research university enrolls out-of-state students, the fewer seats it has left for low-income and minority students.94
“The shift towards nonresident students suggests that public research universities have increased the value they place on students that pay high tuition and have high test
LOSING SIGHT OF THE “PUBLIC MISSION”
As more and more public colleges get caught up in the merit aid arms race, the nature of public higher education appears to be changing
17@NEWAMERICAED
scores,” the researchers wrote. “This shift is indicative of a deeper change in organizational values, away from the public good emphasis on access towards the self-interested emphases of academic profile and revenue generation. As scholars, campus leaders, or policymakers, we must ask ourselves, are these the values we want our flagship public institutions to promote?”95
Our study looks at a wider range of schools, including public flagships, research universities, and state regional colleges, to show that these trends aren’t evident only in the more prestigious schools. Public regional schools, which tend to enroll larger shares of low-income and working-class students than their more prominent peers, have recently entered the merit aid race, and the data we collected indicate that the threats to access are even broader than the earlier study suggests.
The merit aid data show that public universities and colleges that award large amounts of non-need-based aid serve fewer Pell Grant recipients and charge them more than schools that provide less of it.
At high merit-aid schools, Pell Grant recipients, on average, made up 32 percent of the student body. In contrast, at low merit-aid schools, Pell Grant recipients, on average, made up 42 percent of the student body.96
Additionally, there is a correlation between merit aid and net price. At high merit-aid schools, the lowest-income freshmen pay an average net price of $10,630 – almost $1,000 more than they pay ($9,794) at low merit-aid schools.97
While these numbers are not extreme, they show a downward trend in access and affordability over an increasingly broad range of public institutions.
If the public regional colleges continue on this course, they will likely become more exclusive and less responsive to the needs of the students that they have historically served. And that will make our higher education system, which is already extremely stratified, even more so.
In 1862 Congress approved the Morrill Land-Grant Act, which provided federal land to states to create land-grant universities that would “promote the liberal and practical education of the industrial classes.”
These days, most land-grant colleges and other public colleges and universities are more focused on seeking upper- and upper-middle-class students who will help them increase their prestige and raise their revenue. And they are using financial aid – money that could be going to students who couldn’t afford to attend college without it – to pursue these students.
While the colleges began competing for affluent out-of-state students to make up for state budget cuts and to climb up the rankings, the competition itself is making it difficult for schools to avoid doing it. Public regional schools that have for decades served five or 10 counties are now increasingly being swept up in it.
“The level of competition is creating a prisoner’s dilemma,” Hossler, the enrollment management expert,
said in an interview. “Some schools are doing this not because they want to but because their peers are. They feel they can’t afford not to do it.”98
These practices may end up harming the schools involved, as they will have to keep ratcheting up the amount of merit aid they award to keep up with their competitors. There’s only so far they can go before the costs of these policies start to outweigh the benefits.99
Low-income and working-class students appear to be paying the highest price for these policies. As public colleges and universities bring in more and more affluent out-of-state students, fewer institutional aid dollars and fewer seats are available for in-state students who come from less-privileged backgrounds.
It would be a national tragedy if public colleges and universities, which have long provided students with a portal to the middle class, allow those with the most financial need to fall by the wayside.
CONCLUSION
18EDUCATION POLICY | THE OUT-OF-STATE STUDENT ARMS RACE
NOTES
1 “Crimson Tide Finish with No. 1 Recruiting Class in 2014,” the University of Alabama, February 5, 2014: http://www.rolltide.com/sports/m-footbl/spec-rel/020514aab.html.
2 Erica E. Phillips and Douglas Belkin, “Colleges’ Wider Search for Applicants Crowds Out Local Students,” The Wall Street Journal, October 8, 2014: http://www.wsj.com/articles/colleges-wider-search-for-applicants-crowds-out-local-students-1412790096.
3 Chris D. Hutt, Nathaniel J. Bray, Jennifer LI. Jones, Kelly Leach, and Jerome Ward, “Enrolling the Tide: A Case Study of Purposeful Campus Enrollment Increases,” College and University, Vol. 85, No. 4 (Spring 2010), American Association of Collegiate Registrars and Admissions Officers: https://aacrao-web.s3.amazonaws.com/files/mjL2tlReRYqLI2tD6sIy_CUJ8504.pdf.
4 Ibid.
5 Ibid.
6 Melissa Brown, “Out-of-State Students Outnumber Alabama Residents at the University of Alabama,” The Huntsville Times, September 17, 2014: http://www.al.com/news/birmingham/index.ssf/2014/09/fewer_alabama_residents_attend.html.
7 Kati Haycock, Mary Lynch, and Jennifer Engle, “Opportunity Adrift: Our Flagship Public Universities Are Straying from Their Public Mission,” The Education Trust, January 2010: http://edtrust.org/press_release/americas-most-prestigious-public-universities-are-decreasing-representation-of-low-income-students-and-spending-more-institutional-aid-on-students-from-wealther-families-2/.
8 Bradley R. Curs, Ozan Jaquette, and Julie R. Posselt, “Tuition Rich, Mission Poor: Nonresident Enrollment and the Changing Proportions of Low-Income and Underrepresented Minority Students at Public Research Universities,” the Universities of Arizona, Michigan, and Missouri, October 24, 2014: http://web.missouri.edu/~cursb/research/tuition-rich-mission-poor-jaquette-curs-posselt-10-24-2014.pdf.
9 Estimate comes from Sandy Baum, a Senior Fellow at the Urban Institute and a Senior Fellow at the George Washington University Graduate School of Education and Human Development.
10 The College Board, “Trends in Student Aid 2014,” p. 39: http://trends.collegeboard.org/sites/default/files/2014-trends-student-aid-final-web.pdf.
11 Jennifer H. Woo and Susan P. Choy, “Merit Aid for
Undergraduates: Trends from 1995-96 to 2007-08,” U.S. Department of Education National Center for Education Statistics, October 2011: http://nces.ed.gov/pubs2012/2012160.pdf.
12 U.S. Department of Education’s 2011-12 National Postsecondary Student Aid Study (NPSAS:12): http://nces.ed.gov/surveys/npsas/.
13 Marian Wang, “Public Universities Ramp Up Aid for the Wealthy, Leaving the Poor Behind,” ProPublica, September 11, 2013: http://www.propublica.org/article/how-state-schools-ramp-up-aid-for-the-wealthy-leaving-the-poor-behind.
14 “The Common Data Set (CDS) initiative is a collaborative effort among data providers in the higher education community and publishers as represented by the College Board, Peterson’s, and U.S. News & World Report. The combined goal of this collaboration is to improve the quality and accuracy of information provided to all involved in a student’s transition into higher education, as well as to reduce the reporting burden on data providers”: http://www.commondataset.org/.
15 In the financial aid section of the Common Data Set surveys that colleges filled out, schools were given the choice of either reporting final figures for the 2012-13 academic year or estimated numbers for the 2013-14 school year. In the case of the University of North Dakota, the latest numbers available are from the 2011-12 academic year.
16 Linda B. Blackford, “As University of Kentucky Competes for Top Students, More Lower-Income Kids Left Behind,” Lexington Herald-Leader, July 19, 2014: http://www.kentucky.com/2014/07/19/3343795/as-university-of-kentucky-competes.html.
17 Michael Mitchell, Vincent Palacios, and Michael Leachman, “States Are Still Funding Higher Education Below Pre-Recession Levels,” Center on Budget and Policy Priorities, May 1, 2014: http://www.cbpp.org/cms/?fa=view&id=4135.
18 Ibid.
19 The U.S. Government Accountability Office, “Higher Education: State Funding Trends and Policies on Affordability,” (GAO-15-151), December 2014: http://www.gao.gov/assets/670/667557.pdf.
20 Matthew Quirk, “The Best Class Money Can Buy,” The Atlantic Monthly, November 2005: http://www.theatlantic.com/magazine/archive/2005/11/the-best-class-money-can-buy/304307/.
19@NEWAMERICAED
21 John Roush, “Control the Aid Arms Race,” Inside Higher Ed, January 5, 2010: https://www.insidehighered.com/views/2010/01/05/roush.
22 Out-of-state data come from the U.S. Department of Education’s Integrated Postsecondary Education Data System (IPEDS).
23 Eric Hoover and Josh Keller, “More Students Migrate Away from Home,” The Chronicle of Higher Education, October 30, 2011: http://chronicle.com/article/The-Cross-Country-Recruitment/129577/.
24 Author’s interview with Scott Verzyl, the University of South Carolina’s associate vice president for enrollment management, December 2014.
25 Andrew Shain, “More Out-of-State Students Get Tuition Discounts at S.C. Colleges,” The State, September 7, 2013: http://chronicle.augusta.com/news/2013-09-08/more-out-state-students-get-tuition-discounts-south-carolina.
26 Ibid.
27 Eric Hoover and Josh Keller, “More Students Migrate Away from Home.”
28 Stephen Burd, “Merit Aid Madness,” [Washington Monthly, September/October 2013: http://www.washingtonmonthly.com/magazine/september_october_2013/features/merit_aid_madness046453.php?page=all.
29 Burd, “Merit Aid Madness.”
30 Author’s interview with Michael Kabbaz, the Miami University’s vice president for enrollment management and student success, May 2013.
31 Brian T. Prescott and Peace Bransberger, “Knocking at the College Door: Projections of High School Graduates(eighth edition), Western Interstate Commission for Higher Education, 2012: http://www.wiche.edu/info/publications/knocking-8th/knocking-8th.pdf.
32 Kevin Helliker, “Frigid North Dakota Is a Hot Draw for Out-of-State College Students,” The Wall Street Journal, July 16, 2011: http://www.wsj.com/articles/SB10001424052702304231204576406042109860376.
33 Out-of-state data come from the U.S. Department of Education’s Integrated Postsecondary Education Data System (IPEDS), as reported on the National Center for Education Statistics’ College Navigator: http://nces.ed.gov/collegenavigator/?q=university+ of+north+dakota&s=all&id=200280#enrolmt.
34 Information about non-need-based aid comes from the University of North Dakota’s Common Data Set as reproduced on collegedata.com: http://www.collegedata.com/cs/data/college/college_pg03_tmpl.jhtml?schoolId=735.
35 Helliker, “Frigid North Dakota is a Hot Draw for Out-of-State College Students.”
36 Author’s interview with Donald Hossler, a professor of educational leadership and policy studies at Indiana University, December 2014.
37 Information about the University of Alabama’s merit scholarship programs can be found here: http://scholarships.ua.edu/.
38 The University of Alabama’s U.S. News ranking among national universities can be found here: http://colleges.usnews.rankingsandreviews.com/best-colleges/university-of-alabama-1051. The university’s ranking among public universities can be found here: http://colleges.usnews.rankingsandreviews.com/best-colleges/rankings/national-universities/top-public/page+2.
39 Tim Barker, “Missouri Colleges Battle to Keep Students from Leaving State,” St. Louis Post-Dispatch, October 6, 2013: http://www.stltoday.com/news/local/education/missouri-colleges-battle-to-keep-students-from-leaving-state/article_ffa75815-c7cb-5bb9-8532-109aa2cbdd7c.html.
40 Ibid.
41 Ibid.
42 Author’s interview with Ann Korschgen, the University of Missouri’s vice provost for enrollment management, December 2014.
43 The University of New Mexico is not on this list because it has not in recent years filled out the financial aid section of its Common Data Set form.
44 Information about non-need-based aid comes from the University of Kentucky’s Common Data Set as reproduced on collegedata.com: http://www.collegedata.com/cs/data/college/college_pg03_tmpl.jhtml?schoolId=1532.
45 Information about non-need-based aid comes from the University of North Carolina’s Common Data Set as reproduced on collegedata.com: http://www.collegedata.com/cs/data/college/college_pg03_tmpl.jhtml?schoolId=1600.
46 Author’s interview with Shirley Ort, the University of North Carolina’s associate provost and director of scholarships and student aid, November 2014.
47 From the University of North Carolina’s policy manual, chapter 700: http://www.northcarolina.edu/apps/policy/index.php?pg=vs&id=450.
48 Blackford, “As University of Kentucky Competes for Top Students, More Lower-Income Kids Left Behind.”
49 Ibid.
20EDUCATION POLICY | THE OUT-OF-STATE STUDENT ARMS RACE
50 Kelly Hinchcliffe, “For Talented, Low-Income Students, UNC Promises Chance to Graduate Debt-Free,” WRAL.com, September 20, 2014: http://www.wral.com/for-talented-low-income-students-unc-promises-chance-to-graduate-debt-free/14013339/.
51 Author’s interview with Shirley Ort, November 2014.
52 The merit aid data used in this report make it look like Berkeley gives out a considerable amount of merit aid. That’s because the school has recently started the “Middle Class Access Plan,” which limits the financial contribution that parents earning between $80,000 and $150,000 have to make to 15 percent of their income. There is no merit component to the program.
53 See, for instance, the “Husky Promise” on the University of Washington’s website: http://www.washington.edu/huskypromise/.
54 Gregory Roberts, Memo to the Board of Visitors, University of Virginia, August 15, 2012: http://www.documentcloud.org/documents/902476-public-retreatpackage-need-to-rethink-need.html#document/p14/a141607.
55 Lauren Rohr, “Applications Hit Record High, but Fewer Admits Enroll at UI,” The Daily Illini, July 17, 2013: http://www.dailyillini.com/news/campus/administration/article_43e41898-3ea0-11e2-b396-0019bb30f31a.html?mode=jqm.
56 Ibid.
57 Jodi S. Cohen, “U. of I. Revamping Admissions Date After Record Deferrals,” Chicago Tribune, October 14, 2014: http://www.chicagotribune.com/news/ct-u-of-i-admissions-changes-met-20141014-story.html#page=1.
58 Rohr, “Applications Hit Record High, but Fewer Admits Enroll at UI.”
59 “Report of the External Review Team on Enrollment Management & Services at the University of Illinois,” August 2011: http://www.senate.illinois.edu/sc_external_emreport.pdf. According to the study, the University of Illinois at Urbana-Champaign uses the federal methodology “to determine financial aid disbursements.” The federal methodology is the formula the government uses to determine how much students and their families can afford to contribute to their education.
60 According to a PowerPoint presentation that Stacy Kostell, assistant provost for enrollment management, delivered at an October 8, 2012, meeting of the University of Illinois Urbana-Champaign Academic Senate: http://www.senate.illinois.edu/121008_admissions.pdf.
61 Jodi S. Cohen and Alex Richards, “Illinois’ Share of Students at U. of I. Continues to Decline,” Chicago Tribune, September 13, 2013: http://articles.chicagotribune.com/2013-09-13/news/chi-u-of-i-enrollment-20130912_1_international-students-few-illinois-residents-stacey-
kostell.
62 Author’s interview with Charles Tucker, the University of Illinois at Urbana-Champaign’s vice provost for undergraduate education and innovation, January 2015.
63 Institutions were identified to be regional state colleges if they belong to the American Association of State Colleges and Universities (AASCU): http://www.aascu.org/aascumemberlist/.
64 Helliker, “Frigid North Dakota is a Hot Draw for Out-of-State College Students.”
65 Out-of-state data come from the U.S. Department of Education’s Integrated Postsecondary Education Data System (IPEDS), as reported on the National Center for Education Statistics’ College Navigator: http://nces.ed.gov/collegenavigator/?q=Valley+City+ State&s=all&id=200572#enrolmt.
66 According to the Center on Budget and Policy Priorities, Alaska also increased spending per student at its public colleges during the recession but only by 3.5 percent: http://www.cbpp.org/cms/?fa=view&id=4135.
67 Helliker, “Frigid North Dakota is a Hot Draw for Out-of-State College Students.”
68 Ibid.
69 Jennifer Edwards, “Fewer Alabama Students at Public, Community Colleges,” TimesDaily, October 4, 2014: http://www.al.com/news/index.ssf/2014/10/fewer_alabama_students_at_publ.html.
70 Ibid.
71 Ibid.
72 Ibid.
73 Andy Marso, “Report: Kansas Higher Education Cuts Among Longest Lasting,” The Topeka Capital-Journal, May 1, 2014: http://cjonline.com/news/2014-05-01/report-kansas-higher-education-cuts-among-longest-lasting.
74 Roy Wenzl, “Wichita State Hires Recruiting Firm to Boost Enrollment,” The Wichita Eagle, September 17, 2013: http://www.kansas.com/news/article1123568.html.
75 John Bardo, “Overview and Next Steps in Strategic Planning,” Wichita State University, September 2013: http://webs.wichita.edu/depttools/depttoolsmemberfiles/wsustrategy/Stage2_docs/Strategic_Planning_Retreat_powerpoint_9.17.13.pdf.
76 Roy Wenzl, “Wichita State Hires Recruiting Firm to Boost Enrollment.”
77 John Bardo, “Overview and Next Steps in Strategic Planning.”
21@NEWAMERICAED
78 Roy Wenzl, “New Wichita State Scholarship Program Aims to Boost Enrollment,” The Wichita Eagle, October 14, 2013: http://www.kansas.com/news/article1125336.html.
79 Ibid.
80 Information about non-need-based aid comes from Wichita State’s Common Data Set as reproduced on collegedata.com: http://www.collegedata.com/cs/data/college/college_pg03_tmpl.jhtml?schoolId=1152.
81 Discussion of these difficulties can be found in Northern Illinois University’s “2012-16 Enrollment Management Strategic Plan,” Northern Illinois University, 2011: http://niu.edu/stuaff/planningassessment/Strategic_Planning/EM_Strategic_Plan/EM_Strategic_Plan_Files/2012_2016_StrategicPlan.pdf.
82 Ibid.
83 Ibid.
84 The history of Northern Illinois University’s scholarship strategy can be found on page 102 of the minutes of the meeting of the Board of Trustees, December 4, 2014: https://webcourses.niu.edu/bbcswebdav/institution/Board/12-4-14/12-04-14-Board.pdf.
85 Information about non-need-based aid comes from Northern Illinois University’s Common Data Set as reproduced on collegedata.com: http://www.collegedata.com/cs/data/college/college_pg03_tmpl.jhtml?schoolId=820.
86 The university’s proposal to lower the out-of-state tuition and fees for Midwestern students can be found on page 26 of the minutes of the meeting of the Board of Trustees, December 4, 2014.
87 “Illinois Universities Competing for Students,” The Associated Press, October 1, 2014: http://www.sj-r.com/article/20141001/News/141009956.
88 Hoover and Keller, “More Students Migrate Away from Home.”
89 Scott Jaschik and Doug Lederman, “The 2013 Inside Higher Ed Survey of College & University Presidents,” Inside Higher Ed, March 2013: https://www.insidehighered.com/news/survey/affirmative-action-innovation-and-financial-future-survey-presidents.
90 Brian T. Prescott, “Demography as Destiny: Policy Considerations in Enrollment Management,” Western Interstate Commission for Higher Education, April 2013: http://www.wiche.edu/info/publications/PI-knocking2013.pdf.
91 Ibid.
92 Individual schools’ out-of-state data come from the U.S. Department of Education’s Integrated Postsecondary Education Data System (IPEDS), as reported on the
National Center for Education Statistics’ College Navigator.
93 In-state enrollment data come from the U.S. Department of Education’s Integrated Postsecondary Education Data System (IPEDS).
94 Bradley R. Curs, Ozan Jaquette, and Julie R. Posselt, “Tuition Rich, Mission Poor: Nonresident Enrollment and the Changing Proportions of Low-Income and Underrepresented Minority Students at Public Research Universities.”
95 Ibid.
96 Pell Grant figures are from the 2012-13 school year and represent all undergraduates on a campus who have received the awards. The data come from the U.S. Department of Education’s Integrated Postsecondary Education Data System (IPEDS), as reported on the National Center for Education Statistics’ College Navigator.
97 Average net price data are from the 2012-13 school year. The data come from the U.S. Department of Education’s Integrated Postsecondary Education Data System (IPEDS), as reported on the National Center for Education Statistics’ College Navigator.
98 Author’s interview with Donald Hossler, December 2014.
99 Nicholas W. Hillman, “Tuition Discounting for Revenue Management,” Research in Higher Education, Volume 53, Issue 3, May 2012: http://link.springer.com/article/10.1007%2Fs11162-011-9233-4.
This report carries a Creative Commons license, which permits non-commercial re-use of New America content when proper attribution is provided. This means you are free to copy, display and distribute New America’s work, or include our content in derivative works, under the following conditions:
• Attribution. You must clearly attribute the work to New America and provide a link back to www.newamerica.org.
• Noncommercial. You may not use this work for commercial purposes without explicit prior permission from New America.
• Share Alike. If you alter, transform, or build upon this work, you may distribute the resulting work only under a license identical to this one.
For the full legal code of this Creative Commons license, please visit creativecommons.org. If you have any questions about citing or reusing New America content, please contact us.
Photos in this report are supplied by, and licensed to, shutterstock.com.
© 2015 New America
@NEWAMERICAED | NEWAMERICA.ORG | 1899 L STREET, NW, SUITE 400, WASHINGTON DC 20036


24EDUCATION POLICY | THE OUT-OF-STATE STUDENT ARMS RACE