Embed Size (px)
Citation preview
The ‘Out-of-Africa’ hypothesis
Peter McCullagh
Department of StatisticsUniversity of Chicago
South Africa, November 2013
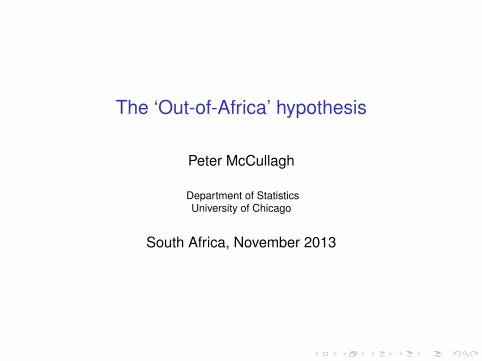
Outline
Atkinson paperPhonemic inventories and linguistic diffusion hypothesisWALS dataFitting Atkinson’s cline model
Spatial and variance-component models
Controversies: Feb/Mar 2012
Socotra
Providence Is.
Agalega Is.Farquhar Is.
Mayotte Is.(under French
admin.)
Aldabra Is.
Amirante Is.Zanzibar
Pemba
Carajos
Réunion
TromelinSt. Helena
Ascension
Madeira Is.
Canary Is.
Principe
Cargados
Annobón
São Tomé
Asmara
LibrevilleKampala
Nairobi
Moroni
Brazzaville
Kinshasa
Yaoundé
Khartoum
Addis Ababa
N'Djamena
Bangui
Kigali
Bujumbura
Lilongwe
Djibouti
Banjul
Conakry
Yamoussoukro Accra
Freetown
Monrovia
Abidjan
Abuja
Nouakchott
Dakar
Bissau
Bamako
Ouagadougou
Malabo
Niamey
Luanda
PortoNovo
Tripoli
TunisAlgiers
Rabat
Laayoune
Cairo
Lusaka
Harare
Pretoria
MaseruBloemfontein
MbabaneMaputo
Cape Town
Windhoek Gaborone
Antananarivo
Dodoma Victoria
Mogadishu
Praia
Lom
e
Port Louis
SãoTomé
Juba
A T L A N T I C
O C E A N
LakeTurkanaLake
Albert
LakeTanganyika
LakeNyasa
LakeKariba
LakeChad
LakeVictoria I N D I A N O C E A N
M e d i t e r r a n e a n S e a
Re d S e a
Gulf of Aden
SUDAN
SOUTHSUDAN
NIGERIA
NAMIBIA
LIBYA
CHAD
SOUTHAFRICA
UNITED REPUBLIC OFTANZANIA
MOROCCO
SAO TOME AND PRINCIPE
ZAMBIA
CENTRALAFRICAN REPUBLIC
TUNISIA
UGANDA
CÔTE- D'IVOIRE
LIBERIA
SIERRALEONE
BURKINA FASOGAMBIA
CAMEROON
EQUATORIAL GUINEA
WesternSahara
MAURITIUS
CAPE VERDE
ERITREA
C
ONGO
NIGER
DEMOCRATIC REPUBLIC
OF THECONGO
GABON
MALI
Cabinda(ANGOLA)
MAURITANIA
BOTSWANA
SWAZILAND
LESOTHO
MALAWI
BURUNDI
RWANDA
ZIMBABWE
DJIBOUTI
KENYA
COMOROS
SEYCHELLES
MO
ZA
M
BIQ U E
MA
DA
GA
SCAR
ANGOLA
ALGERIA
SENEGAL
GUINEA-BISSAU GUINEA
EGYPT
ETHIOPIA
(EQUATORIAL GUINEA)
(PORTUGAL)
(SPAIN)
(UK)
(UK)
(YEMEN)
(MAURITIUS)
(FRANCE)
(FRANCE)
GHANA
BE
NIN
T
OG
O
SOMA
LIA
Map No. 4045 Rev. 7 UNITED NATIONSNovember 2011
Department of Field SupportCartographic Section
0
0
500 1000 km
500 mi
AFRICA
The boundaries and names shown and the designations used on this map do not imply official endorsement or acceptance by the United Nations.
Final boundary between the Republic of the Sudan and the Republic of South Sudan has not yet been determined.
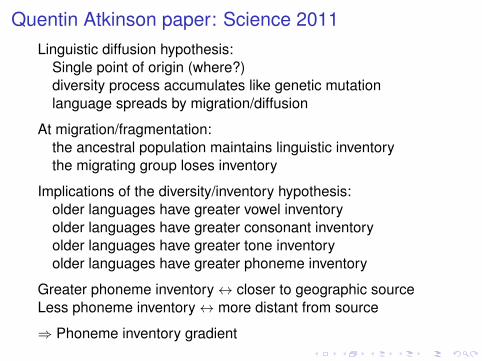
Quentin Atkinson paper: Science 2011Linguistic diffusion hypothesis:
Single point of origin (where?)diversity process accumulates like genetic mutationlanguage spreads by migration/diffusion
At migration/fragmentation:the ancestral population maintains linguistic inventorythe migrating group loses inventory
Implications of the diversity/inventory hypothesis:older languages have greater vowel inventoryolder languages have greater consonant inventoryolder languages have greater tone inventoryolder languages have greater phoneme inventory
Greater phoneme inventory↔ closer to geographic sourceLess phoneme inventory↔ more distant from source
⇒ Phoneme inventory gradient
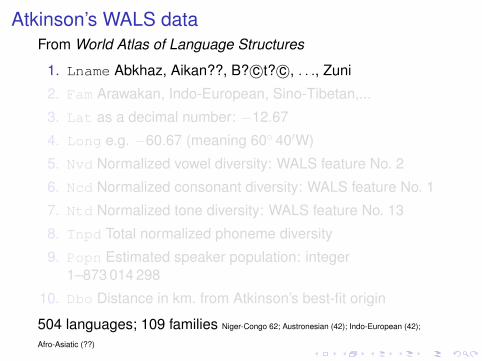
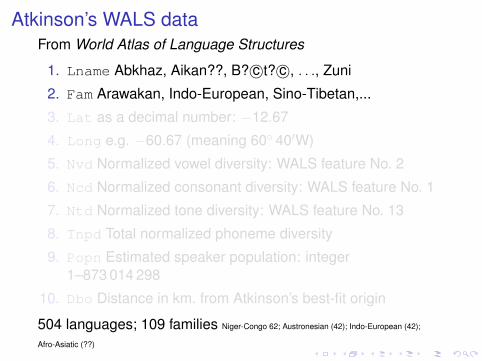
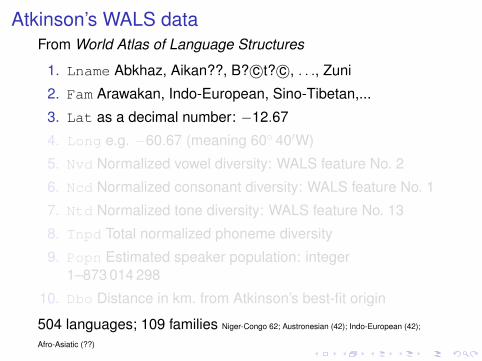
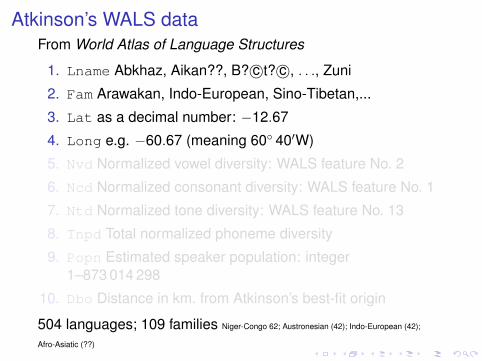
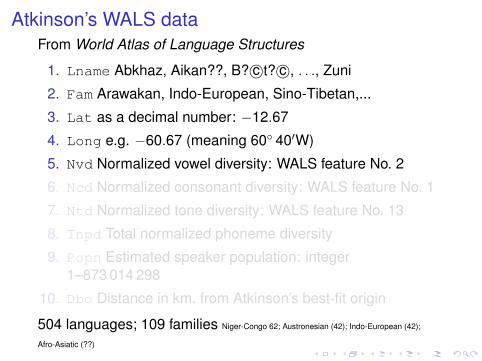
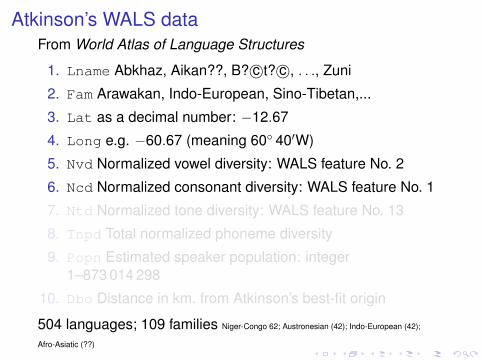
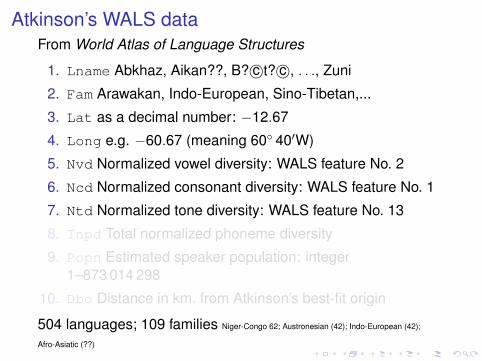
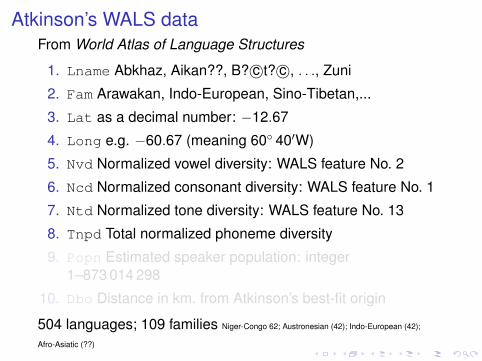
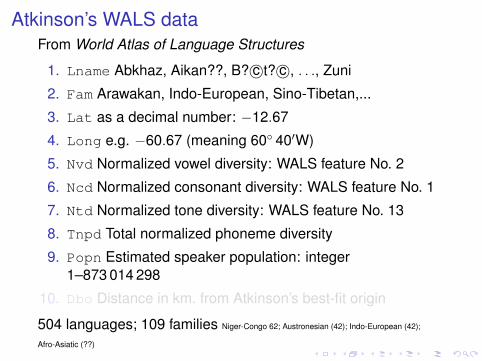
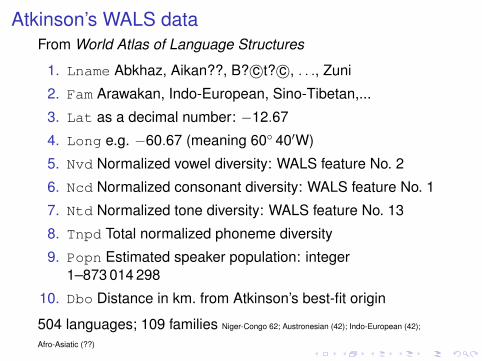
Atkinson’s WALS dataFrom World Atlas of Language Structures
1. Lname Abkhaz, Aikan??, B? c©t? c©, . . ., Zuni
2. Fam Arawakan, Indo-European, Sino-Tibetan,...
3. Lat as a decimal number: −12.67
4. Long e.g. −60.67 (meaning 60◦ 40′W)
5. Nvd Normalized vowel diversity: WALS feature No. 2
6. Ncd Normalized consonant diversity: WALS feature No. 1
7. Ntd Normalized tone diversity: WALS feature No. 13
8. Tnpd Total normalized phoneme diversity
9. Popn Estimated speaker population: integer1–873 014 298
10. Dbo Distance in km. from Atkinson’s best-fit origin
504 languages; 109 families Niger-Congo 62; Austronesian (42); Indo-European (42);
Afro-Asiatic (??)
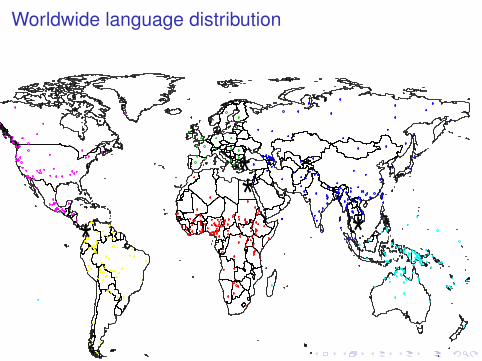
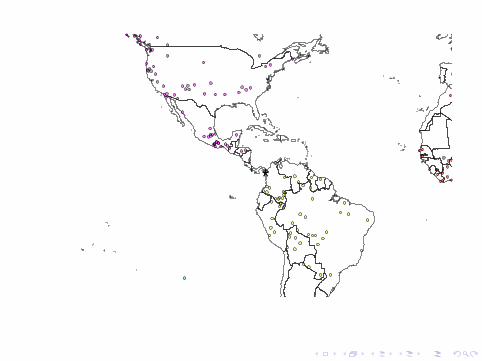
Worldwide language distribution
**
*
*
*
*
*
*
*
*
*
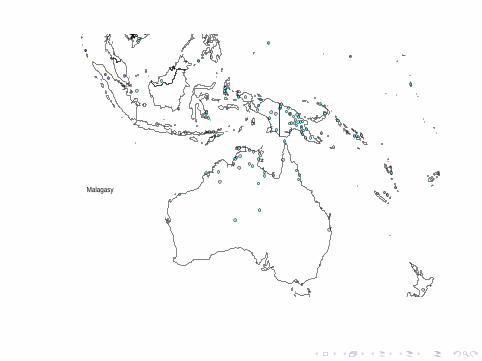
Malagasy
*
*
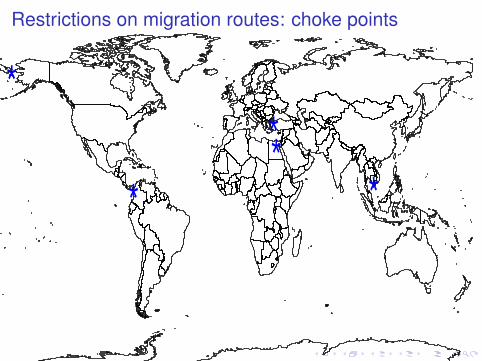
Restrictions on migration routes: choke points
**
*
*
*
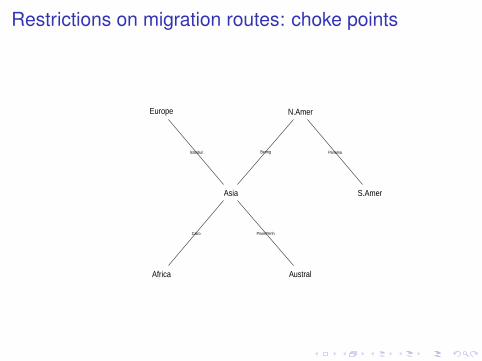
Restrictions on migration routes: choke points
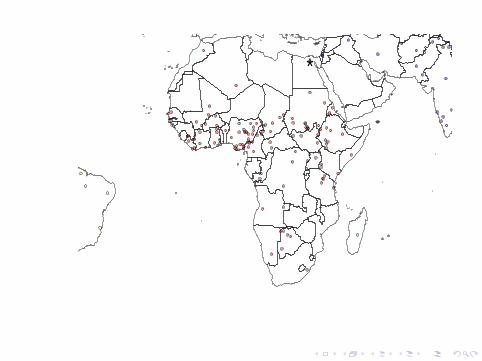
Africa
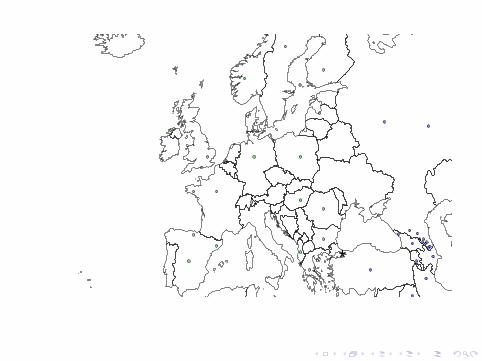
Europe
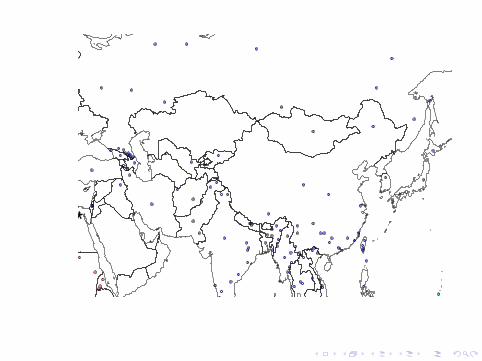
Asia
Austral
N.Amer
S.Amer
Cairo
Istanbul Bering
PnomPenh
Panama
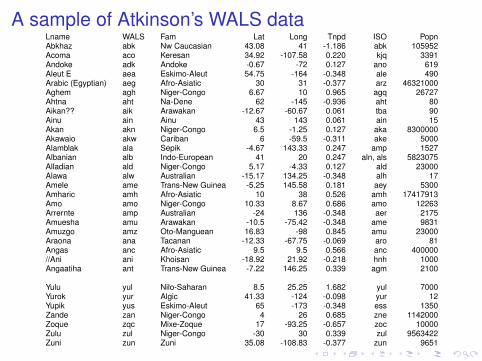
A sample of Atkinson’s WALS dataLname WALS Fam Lat Long Tnpd ISO PopnAbkhaz abk Nw Caucasian 43.08 41 -1.186 abk 105952Acoma aco Keresan 34.92 -107.58 0.220 kjq 3391Andoke adk Andoke -0.67 -72 0.127 ano 619Aleut E aea Eskimo-Aleut 54.75 -164 -0.348 ale 490Arabic (Egyptian) aeg Afro-Asiatic 30 31 -0.377 arz 46321000Aghem agh Niger-Congo 6.67 10 0.965 agq 26727Ahtna aht Na-Dene 62 -145 -0.936 aht 80Aikan?? aik Arawakan -12.67 -60.67 0.061 tba 90Ainu ain Ainu 43 143 0.061 ain 15Akan akn Niger-Congo 6.5 -1.25 0.127 aka 8300000Akawaio akw Cariban 6 -59.5 -0.311 ake 5000Alamblak ala Sepik -4.67 143.33 0.247 amp 1527Albanian alb Indo-European 41 20 0.247 aln, als 5823075Alladian ald Niger-Congo 5.17 -4.33 0.127 ald 23000Alawa alw Australian -15.17 134.25 -0.348 alh 17Amele ame Trans-New Guinea -5.25 145.58 0.181 aey 5300Amharic amh Afro-Asiatic 10 38 0.526 amh 17417913Amo amo Niger-Congo 10.33 8.67 0.686 amo 12263Arrernte amp Australian -24 136 -0.348 aer 2175Amuesha amu Arawakan -10.5 -75.42 -0.348 ame 9831Amuzgo amz Oto-Manguean 16.83 -98 0.845 amu 23000Araona ana Tacanan -12.33 -67.75 -0.069 aro 81Angas anc Afro-Asiatic 9.5 9.5 0.566 anc 400000//Ani ani Khoisan -18.92 21.92 -0.218 hnh 1000Angaatiha ant Trans-New Guinea -7.22 146.25 0.339 agm 2100
Yulu yul Nilo-Saharan 8.5 25.25 1.682 yul 7000Yurok yur Algic 41.33 -124 -0.098 yur 12Yupik yus Eskimo-Aleut 65 -173 -0.348 ess 1350Zande zan Niger-Congo 4 26 0.685 zne 1142000Zoque zqc Mixe-Zoque 17 -93.25 -0.657 zoc 10000Zulu zul Niger-Congo -30 30 0.339 zul 9563422Zuni zun Zuni 35.08 -108.83 -0.377 zun 9651
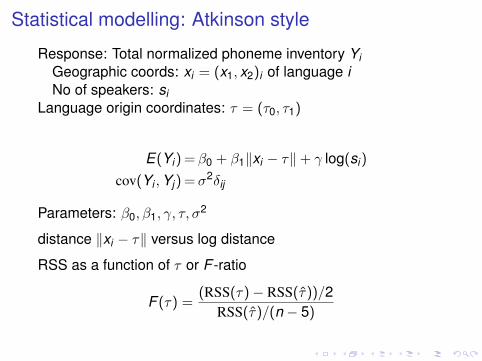
Statistical modelling: Atkinson style
Response: Total normalized phoneme inventory YiGeographic coords: xi = (x1, x2)i of language iNo of speakers: si
Language origin coordinates: τ = (τ0, τ1)
E(Yi) = β0 + β1‖xi − τ‖+ γ log(si)
cov(Yi ,Yj) = σ2δij
Parameters: β0, β1, γ, τ, σ2
distance ‖xi − τ‖ versus log distance
RSS as a function of τ or F -ratio
F (τ) =(RSS(τ)− RSS(τ̂))/2
RSS(τ̂)/(n − 5)
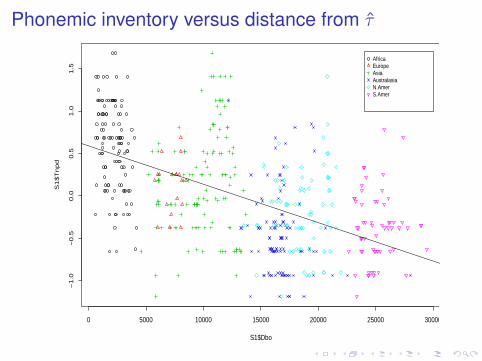
Phonemic inventory versus distance from τ̂
0 5000 10000 15000 20000 25000 30000
−1
.0−
0.5
0.0
0.5
1.0
1.5
S1$Dbo
S1
$T
np
dAfricaEuropeAsiaAustralasiaN.AmerS.Amer
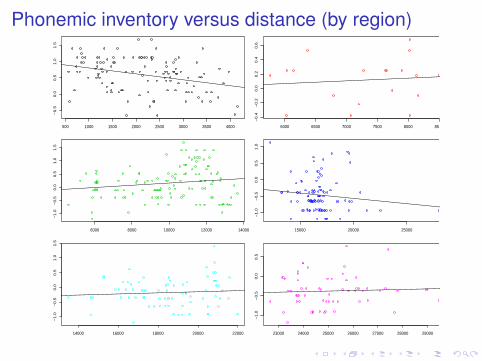
Phonemic inventory versus distance (by region)
500 1000 1500 2000 2500 3000 3500 4000
−0
.50
.00
.51
.01
.5
6000 6500 7000 7500 8000 8500
−0
.4−
0.2
0.0
0.2
0.4
0.6
6000 8000 10000 12000 14000
−1
.0−
0.5
0.0
0.5
1.0
1.5
15000 20000 25000
−1
.0−
0.5
0.0
0.5
1.0
14000 16000 18000 20000 22000
−1
.0−
0.5
0.0
0.5
1.0
1.5
23000 24000 25000 26000 27000 28000 29000
−1
.0−
0.5
0.0
0.5
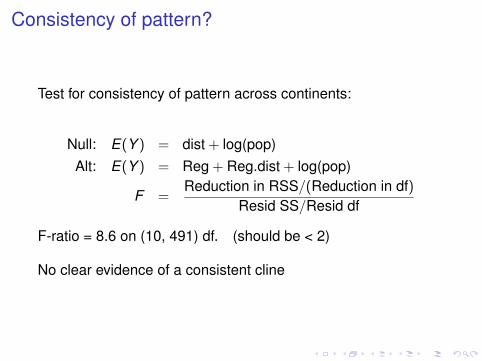
Consistency of pattern?
Test for consistency of pattern across continents:
Null: E(Y ) = dist + log(pop)Alt: E(Y ) = Reg + Reg.dist + log(pop)
F =Reduction in RSS/(Reduction in df)
Resid SS/Resid df
F-ratio = 8.6 on (10, 491) df. (should be < 2)
No clear evidence of a consistent cline
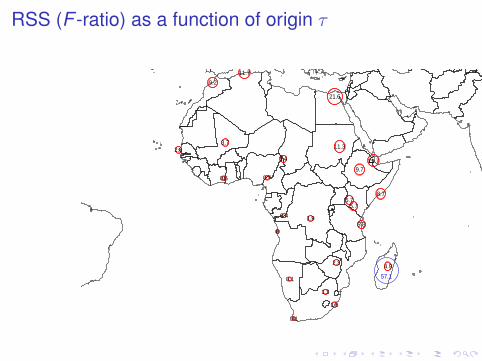
RSS (F -ratio) as a function of origin τ
1.6
0.1
1.3
0.1
0
1.9
2.3
0.6
5.7
0.4
0.7
2.83.7
9.2
11.7
21.6
11.3
3.4
9.711.7
8.7
5.7
5.3
4.9
57.1
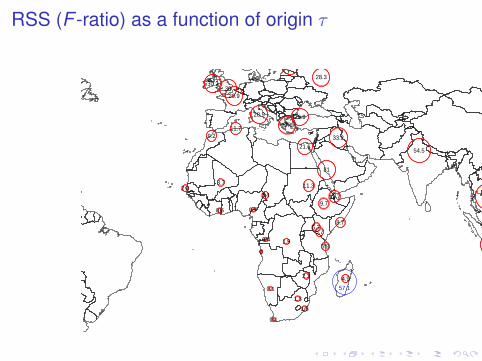
RSS (F -ratio) as a function of origin τ
1.6
0.1
1.3
0.1
0
1.9
2.3
0.6
5.7
0.4
0.7
2.83.7
9.211.7
21.6
11.3
3.49.7
11.7
8.7
5.7
5.3
4.9
27.6
30.2
29.930
28.9
28.3
26.9
33.2
31
54.5
58.7
56.7
57.1
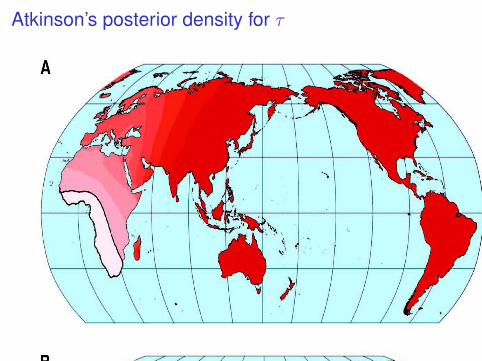
Atkinson’s posterior density for τ
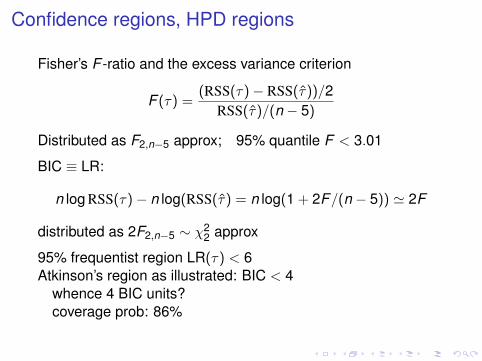
Confidence regions, HPD regions
Fisher’s F -ratio and the excess variance criterion
F (τ) =(RSS(τ)− RSS(τ̂))/2
RSS(τ̂)/(n − 5)
Distributed as F2,n−5 approx; 95% quantile F < 3.01
BIC ≡ LR:
n log RSS(τ)− n log(RSS(τ̂) = n log(1 + 2F/(n − 5)) ' 2F
distributed as 2F2,n−5 ∼ χ22 approx
95% frequentist region LR(τ) < 6Atkinson’s region as illustrated: BIC < 4
whence 4 BIC units?coverage prob: 86%
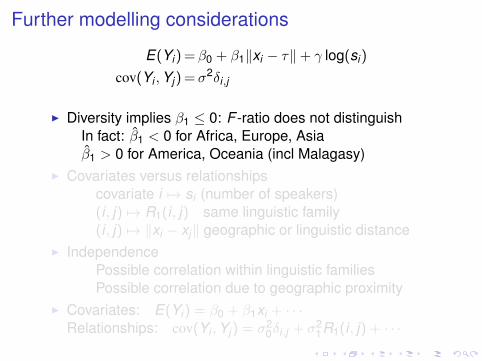
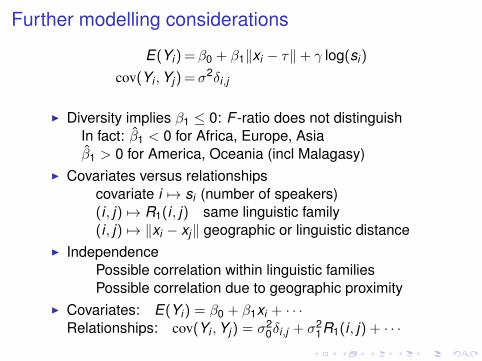
Further modelling considerations
E(Yi) = β0 + β1‖xi − τ‖+ γ log(si)
cov(Yi ,Yj) = σ2δi,j
I Diversity implies β1 ≤ 0: F -ratio does not distinguishIn fact: β̂1 < 0 for Africa, Europe, Asiaβ̂1 > 0 for America, Oceania (incl Malagasy)
I Covariates versus relationshipscovariate i 7→ si (number of speakers)(i , j) 7→ R1(i , j) same linguistic family(i , j) 7→ ‖xi − xj‖ geographic or linguistic distance
I IndependencePossible correlation within linguistic familiesPossible correlation due to geographic proximity
I Covariates: E(Yi) = β0 + β1xi + · · ·Relationships: cov(Yi ,Yj) = σ2
0δi,j + σ21R1(i , j) + · · ·
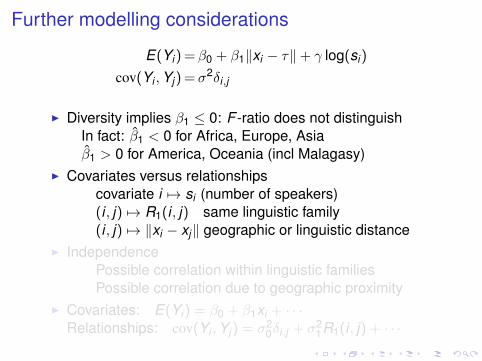
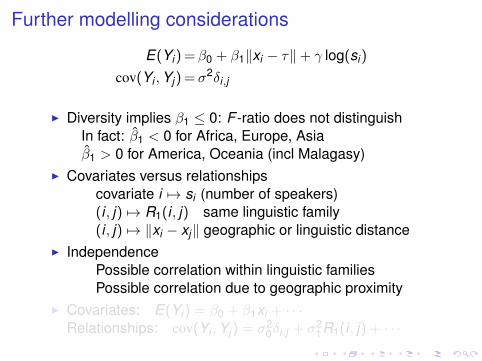
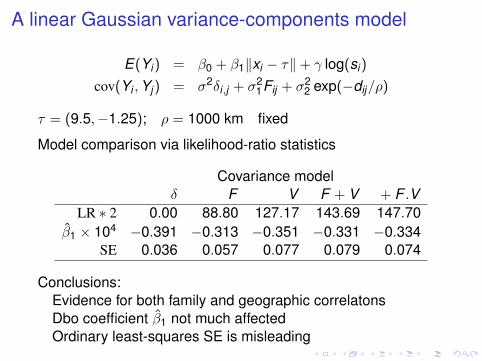
A linear Gaussian variance-components model
E(Yi) = β0 + β1‖xi − τ‖+ γ log(si)
cov(Yi ,Yj) = σ2δi,j + σ21Fij + σ2
2 exp(−dij/ρ)
τ = (9.5,−1.25); ρ = 1000 km fixed
Model comparison via likelihood-ratio statistics
Covariance modelδ F V F + V + F .V
LR ∗ 2 0.00 88.80 127.17 143.69 147.70β̂1 × 10⁴ −0.391 −0.313 −0.351 −0.331 −0.334
SE 0.036 0.057 0.077 0.079 0.074
Conclusions:Evidence for both family and geographic correlatonsDbo coefficient β̂1 not much affectedOrdinary least-squares SE is misleading
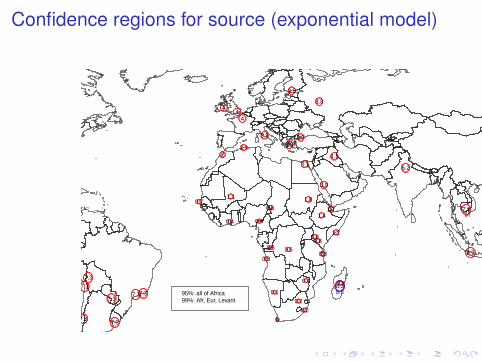
Confidence regions for source (exponential model)
0.2
0
0.2
0.1
0.3
0.5
0.4
0.4
0.8
0.3
0.4
0.71.1
22.3
3.1
1.80.8
1.41.7
1.20.8
0.8
0.7
3.8
4
44
3.9
3.9
3.8
3.7
4.1
3.9
6.2
7.5
7.8
8.2
8.4
8.37.3
7.3
7.3
7.3
7.3
7.3
7.38.395%: all of Africa
99%: Afr, Eur, Levant
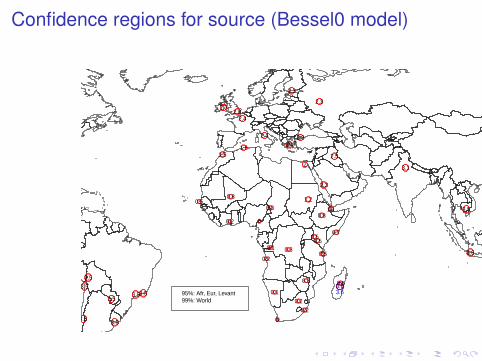
Confidence regions for source (Bessel0 model)
0.2
0
0.2
0.1
0.2
0.3
0.3
0.2
0.5
0.1
0
0.50.8
1.51.6
2
1.20.3
0.81.1
0.70.5
0.5
0.5
2.4
2.3
2.42.3
2.4
2.3
2.3
2.3
2.5
2.3
3.1
3.3
3.5
3.6
3.6
3.63.5
3.5
3.5
3.5
3.5
3.5
3.53.695%: Afr, Eur, Levant
99%: World
Summary
I Distinction between covariates and relationshipsI Rel1: family as a block factor Fij
I Rel2: geographic separation Dij
I Spatial covariance models: Matérn’s Bessel familyI Effect of correlation on OLS coefficientsI Effect of correlation on SE of OLS coefficientsI Selection of languages for inclusion in analysisI Choice of total phoneme inventory as responseI Alternative forms of data using specific phonenes
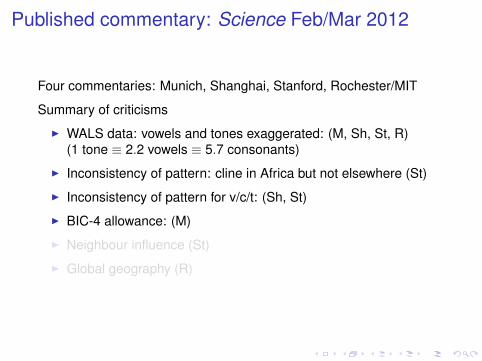
Published commentary: Science Feb/Mar 2012
Four commentaries: Munich, Shanghai, Stanford, Rochester/MIT
Summary of criticisms
I WALS data: vowels and tones exaggerated: (M, Sh, St, R)(1 tone ≡ 2.2 vowels ≡ 5.7 consonants)
I Inconsistency of pattern: cline in Africa but not elsewhere (St)
I Inconsistency of pattern for v/c/t: (Sh, St)
I BIC-4 allowance: (M)
I Neighbour influence (St)
I Global geography (R)
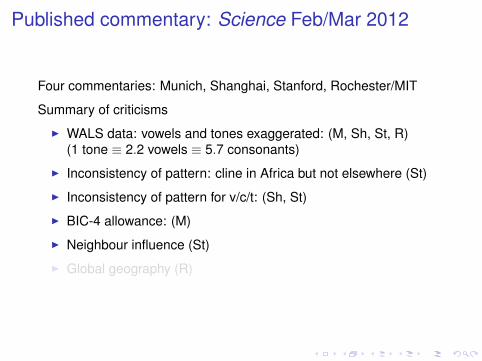
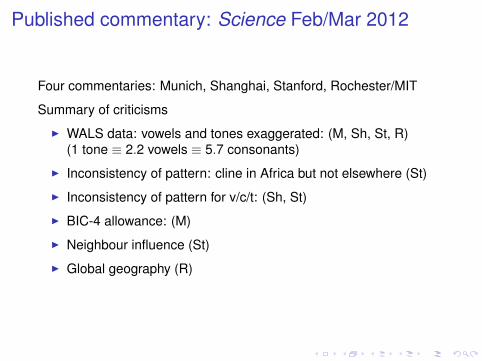
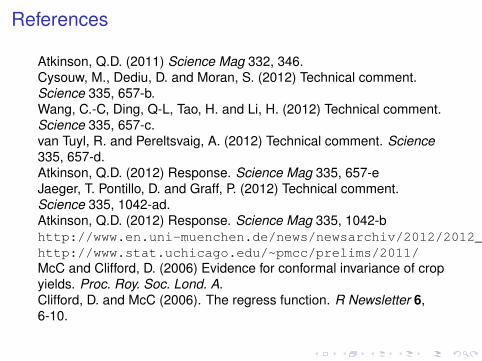
References
Atkinson, Q.D. (2011) Science Mag 332, 346.Cysouw, M., Dediu, D. and Moran, S. (2012) Technical comment.Science 335, 657-b.Wang, C.-C, Ding, Q-L, Tao, H. and Li, H. (2012) Technical comment.Science 335, 657-c.van Tuyl, R. and Pereltsvaig, A. (2012) Technical comment. Science335, 657-d.Atkinson, Q.D. (2012) Response. Science Mag 335, 657-eJaeger, T. Pontillo, D. and Graff, P. (2012) Technical comment.Science 335, 1042-ad.Atkinson, Q.D. (2012) Response. Science Mag 335, 1042-bhttp://www.en.uni-muenchen.de/news/newsarchiv/2012/2012_cysow.htmlhttp://www.stat.uchicago.edu/~pmcc/prelims/2011/McC and Clifford, D. (2006) Evidence for conformal invariance of cropyields. Proc. Roy. Soc. Lond. A.Clifford, D. and McC (2006). The regress function. R Newsletter 6,6-10.