Embed Size (px)
Citation preview
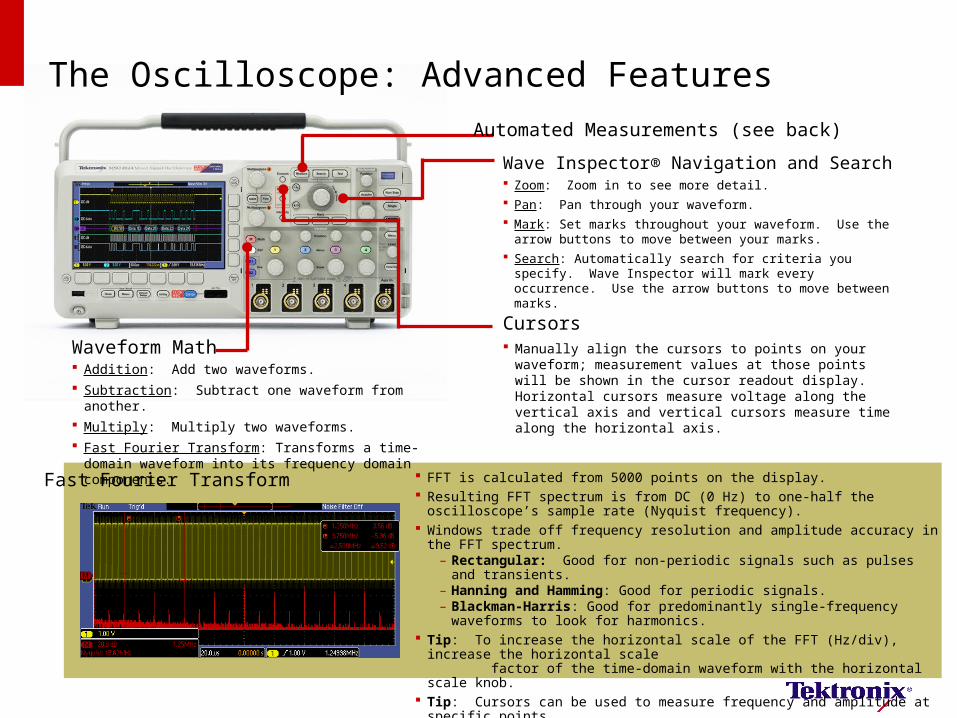
The Oscilloscope: Advanced Features
Wave Inspector® Navigation and Search Zoom: Zoom in to see more detail.
Pan: Pan through your waveform.
Mark: Set marks throughout your waveform. Use the arrow buttons to move between your marks.
Search: Automatically search for criteria you specify. Wave Inspector will mark every occurrence. Use the arrow buttons to move between marks.
Waveform Math Addition: Add two waveforms.
Subtraction: Subtract one waveform from another.
Multiply: Multiply two waveforms.
Fast Fourier Transform: Transforms a time-domain waveform into its frequency domain components.
FFT is calculated from 5000 points on the display. Resulting FFT spectrum is from DC (0 Hz) to one-half the oscilloscope’s sample rate
(Nyquist frequency). Windows trade off frequency resolution and amplitude accuracy in the FFT spectrum.
– Rectangular: Good for non-periodic signals such as pulses and transients.– Hanning and Hamming: Good for periodic signals.– Blackman-Harris: Good for predominantly single-frequency waveforms to look for
harmonics. Tip: To increase the horizontal scale of the FFT (Hz/div), increase the horizontal scale
factor of the time-domain waveform with the horizontal scale knob. Tip: Cursors can be used to measure frequency and amplitude at specific points
on the FFT spectrum.
Fast Fourier Transform
Cursors Manually align the cursors to points on your waveform;
measurement values at those points will be shown in the cursor readout display. Horizontal cursors measure voltage along the vertical axis and vertical cursors measure time along the horizontal axis.
Automated Measurements (see back)

The Oscilloscope: Advanced Features
Copyright © 2009, Tektronix. All rights reserved. Tektronix products are covered by U.S. and foreign patents, issued and pending. Information in this publication supersedes that in all previously published material. Specification and price change privileges reserved. TEKTRONIX and TEK are registered trademarks of Tektronix, Inc. All other trade names 6/09 GB/WWW 3GW-24333-0_ppt
www.tektronix.com/oscilloscopes
Automated Measurements
Period (sec): Time (t) required to complete one cycle of the signal.
Frequency (Hertz): Reciprocal of period. (Frequency = 1/t).
Rise Time (sec): Time (t) required for rising edge to rise from the Low Reference level to the High Reference level.
Fall Time (sec): Time (t) required for falling edge to fall from the High Reference level to the Low Reference level.
Pulse Width (sec): Time (t) between Mid-Reference crossings of a pulse, either a positive pulse or negative pulse.
Duty Cycle (%): Ratio of the pulse width to the period. (Duty Cycle = (t1/t2)*100%)
Max (Volts): Maximum value of the signal.
Min (Volts): Minimum value of the signal.
Peak-to-peak (Volts): Difference (a) between the maximum value and the minimum value.
High (Volts): Highest density of points above the midpoint of the signal.
Low (Volts): Lowest density of points below the midpoint of the signal.
Amplitude (Volts): Difference (a) between the high value and the low value.
Positive Overshoot (%): Difference between the maximum value and high value of the signal, divided by the signal amplitude. (Positive Overshoot = (a1/a2)*100%)
Negative Overshoot (%): Difference between the minimum value and low value of the signal, divided by the signal amplitude. (Negative Overshoot = (a1/a2)*100%)
Mean (Volts): Arithmetic mean value.(Mean = (So + S1 + … + Sn) / n)
RMS (Volts): True Root Mean Square Value.
(RMS = √(So2 + S1
2 + … + Sn2) / n )
Measurement Gating
Gating can be used to define where on the waveform measurementsare performed.

The Oscilloscope: Basic Features & Functions
Use level 1 text for main slide text in paragraph format. Level 1 text is Arial 20pt, black, flush left, with bullets.
– Use level 2 text for main bullet points – Level 2 text is Arial 18pt with dashes for bullets– Avoid multiple-line and paragraph-formatted bullets
– Level 3 text is Arial 16pt– Level 4 text is Arial 14pt
– Level 5 text is Arial 14pt
Use the “Increase Indent” and “Decrease Indent” buttons to change text levels.
Tektronix colors
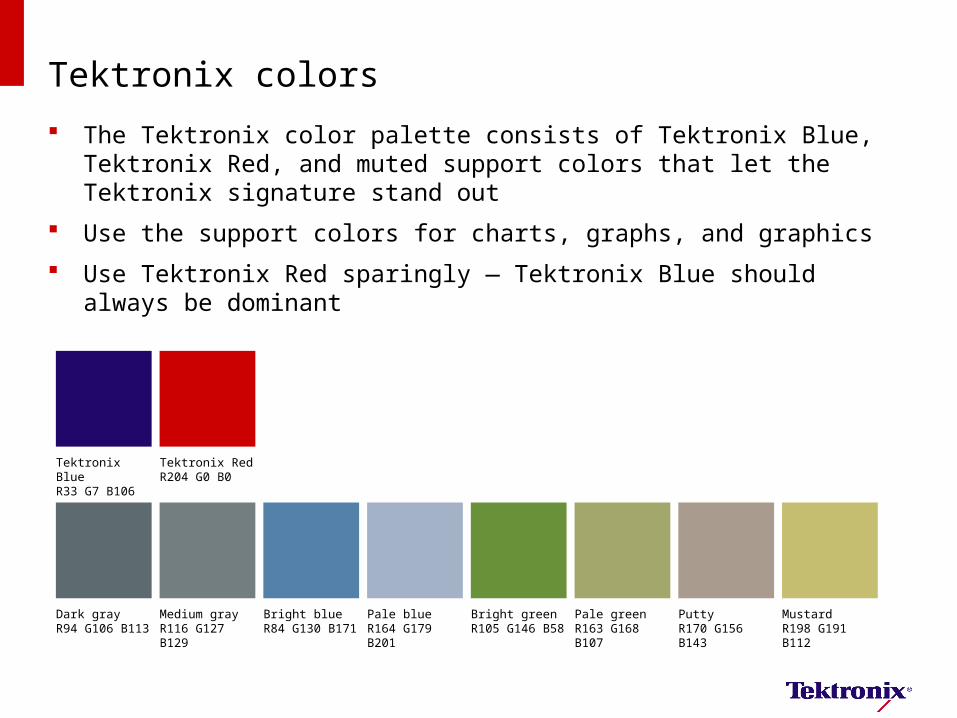
The Tektronix color palette consists of Tektronix Blue, Tektronix Red, and muted support colors that let the Tektronix signature stand out
Use the support colors for charts, graphs, and graphics
Use Tektronix Red sparingly — Tektronix Blue should always be dominant
Bright blueR84 G130 B171
Dark grayR94 G106 B113
Medium grayR116 G127 B129
Bright greenR105 G146 B58
PuttyR170 G156 B143
Pale blueR164 G179 B201
Pale greenR163 G168 B107
MustardR198 G191 B112
Tektronix BlueR33 G7 B106
Tektronix RedR204 G0 B0