Embed Size (px)
Citation preview

The Options Penny Pilot
NYSE Arca Inc.
2
NYSE Arca Inc. (“NYSE Arca” or “Exchange”) is pleased to present this report covering the
Fourth and Sixth Penny Pilot reporting periods (February 1, 2008 – July 31, 2008 and February
1, 2009 – April 30, 2009). Data covering the Fifth Reporting Period (August 1, 2008 – January
31, 2009) will be submitted in a separate report.
Summary
Data from the two periods continues to demonstrate the overall success of the Pilot Program.
Customers continue to benefit form greatly reduced spreads, liquidity continues to be sufficient,
and trading systems and exchanges have coninued to function without incident.
Prior to the launch of the Penny Pilot, there were concerns that liquidity at the disseminated
market would become so fragmented that orders would not be filled in their entirety at the
disseminated price. Top of Book liquidity was reviewed for the two periods and found that it
had maintained the ability to fill all most all Customer orders and Firm orders in their entirety at
the NYSE Arca disseminated market. In Period Four, 97% of Customer orders were filled at the
Top of Book, while in Period Six, 94% of Customer orders were handled by the NYSE Arca Top
of Book. Similarly, for Firm Orders, 99% in Period Four, and 97% in Period Six were satisfied
at the NYSE Arca Top of Book.
The narrowest possible spread between the bid and ask provides a substantial benefit to
customers. During the Fourth Period, the national volume-weighted average spread for penny
series declined % from the pre-pilot period. Nickel series declined 16% for the same period.
During the Sixth Period, the national volume-weighted average spread for penny series declined
% from the pre-pilot period. Nickel series declined 16% for the same period.
NYSE Arca’s quote mitigation policy is highly effective and quantifiable. On average, over 26.5
million quotes per day were mitigated during the Post 3 period, representing approximately 9%
of the Exchange’s total. Over 40,750 series were mitigated, representing 21% of the total series
traded on the Exchange.
Over the past several months, OPRA has met the demands of the Penny Pilot by greatly
increasing capacity. While new peaks have occurred in January 2008, there have not been any
significant operational or system-related problems. This is particularly noteworthy when one
considers the market conditions under which the Penny Pilot has been conducted. The equity
and options markets have experienced unprecedented volume and volatility, providing the
ultimate test for system performance.
Order Size and Top of Book Liquidity
For purposes of this report, “Top of Book” liquidity is defined as the volume of contracts
available at the NYSE Arca Best Bid or Offer. This is an important aspect of quote quality and
3
determines whether or not incoming orders can be filled in their entirety at the Exchange’s
disseminated quote.
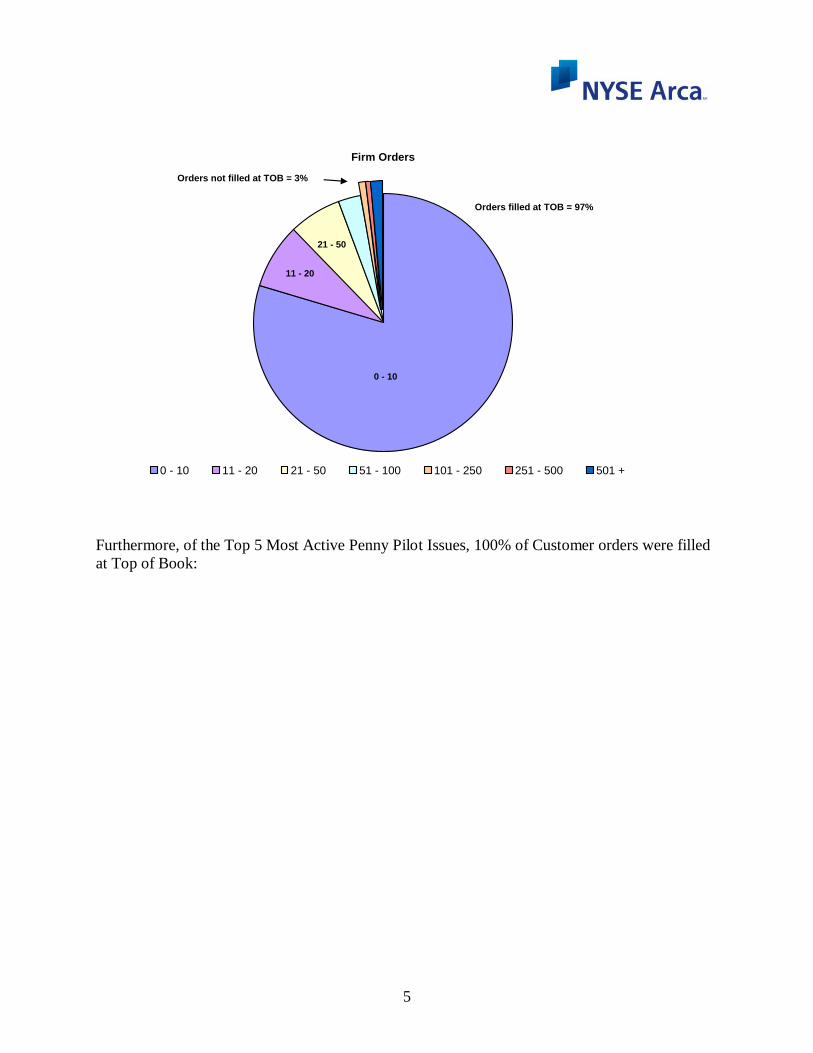
NYSE Arca examined the order size of Customer and Firm orders during the Fourth and Sixth
period. Order sizes were broken down into the following categories: 0 - 10 contracts, 11 - 20
contracts, 21 - 50 contracts, 51 - 100 contracts, 101 - 250 contracts, 251 - 500 contracts and
greater than 500 contracts.
In Period Four, 97% of Customer orders were filled at the Top of Book, while in Period Six,
94% of Customer orders were handled by the NYSE Arca Top of Book. Similarly, for Firm
Orders, 99% in Period Four, and 97% in Period Six were satisfied at the NYSE Arca Top of
Book.
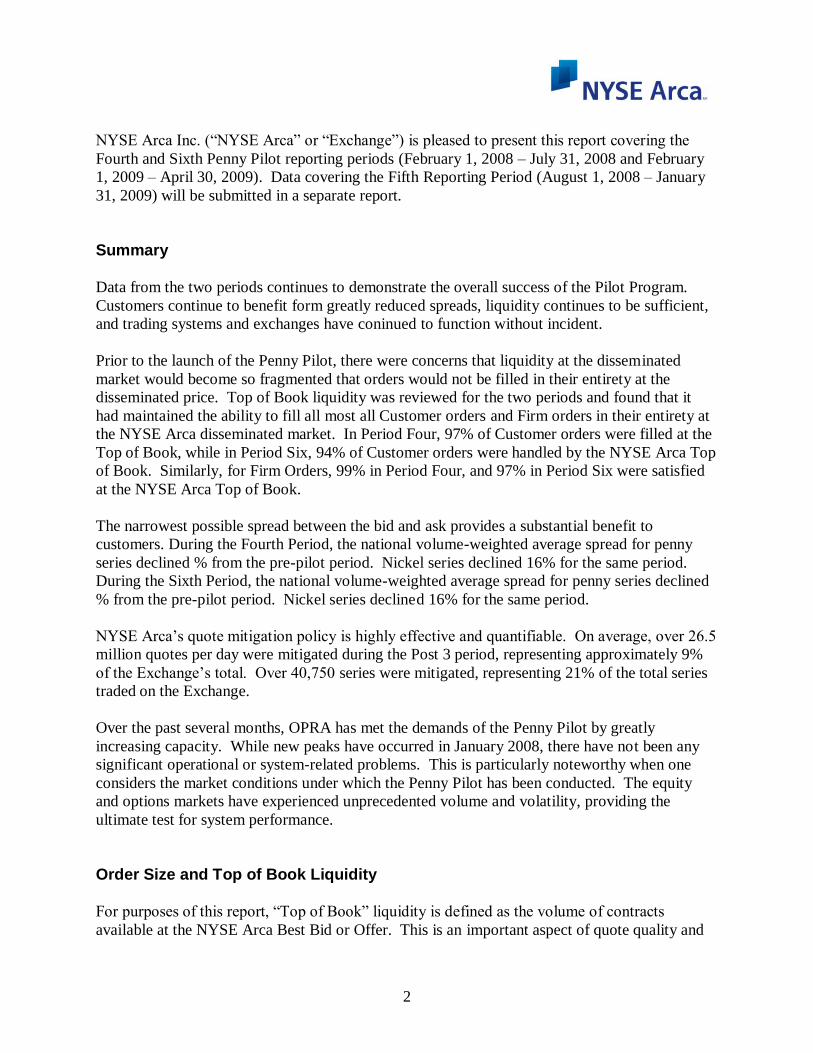
The following charts illustrate order size and the percentage of customer and firm orders that
could be filled at the Top of the Book.
Period 4
Customer Orders
0 - 10 11 - 20 21 - 50 51 - 100 101 - 250 251 - 500 501 +
Orders not filled at TOB = 3%
Orders Filled at TOB = 97%
4
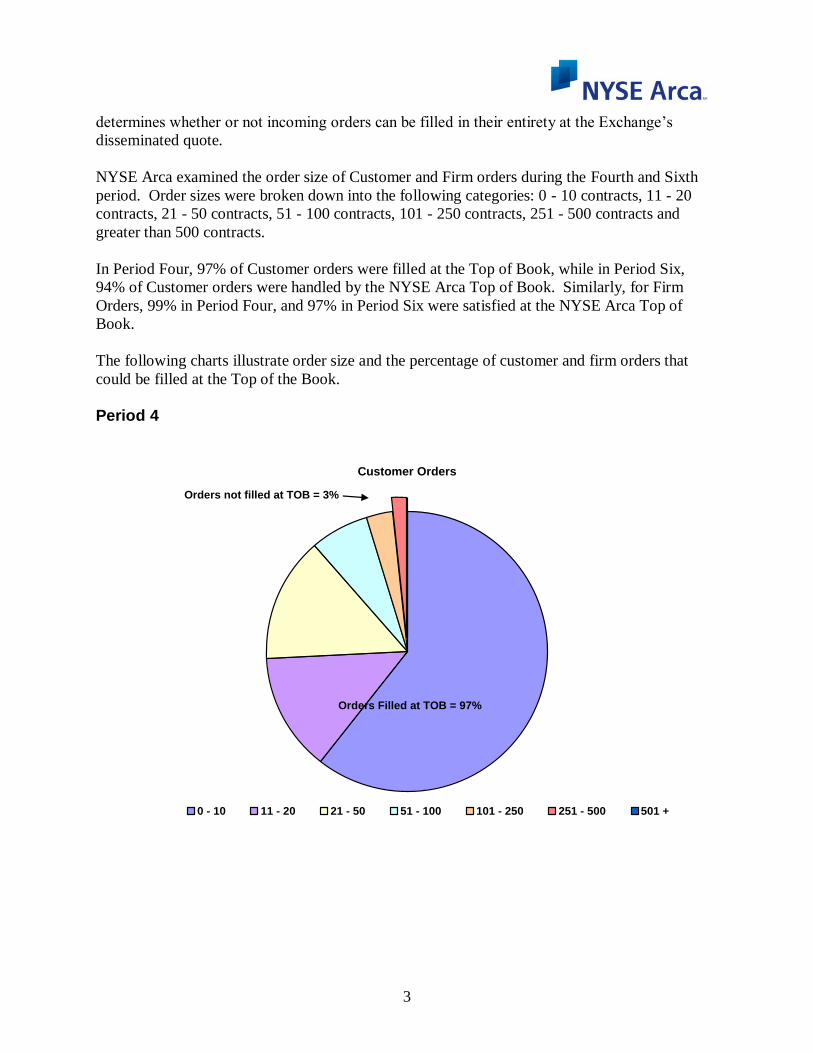
Firm Orders
0 - 10 11 - 20 21 - 50 51 - 100 101 - 250 250 - 500 501 +
Orders filled at TOB = 99%
Orders not filled at TOB = 1%
Period 6
Aggregate Customer Orders
0 - 10 11 - 20 21 - 50 51 - 100 101 - 250 251 - 500 501 +
Orders not filled at TOB = 6%
Orders filled at TOB = 94%
0 - 10
11 - 20
21 - 50
51 - 100
5
Firm Orders
0 - 10 11 - 20 21 - 50 51 - 100 101 - 250 251 - 500 501 +
Orders not filled at TOB = 3%
Orders filled at TOB = 97%
0 - 10
11 - 20
21 - 50
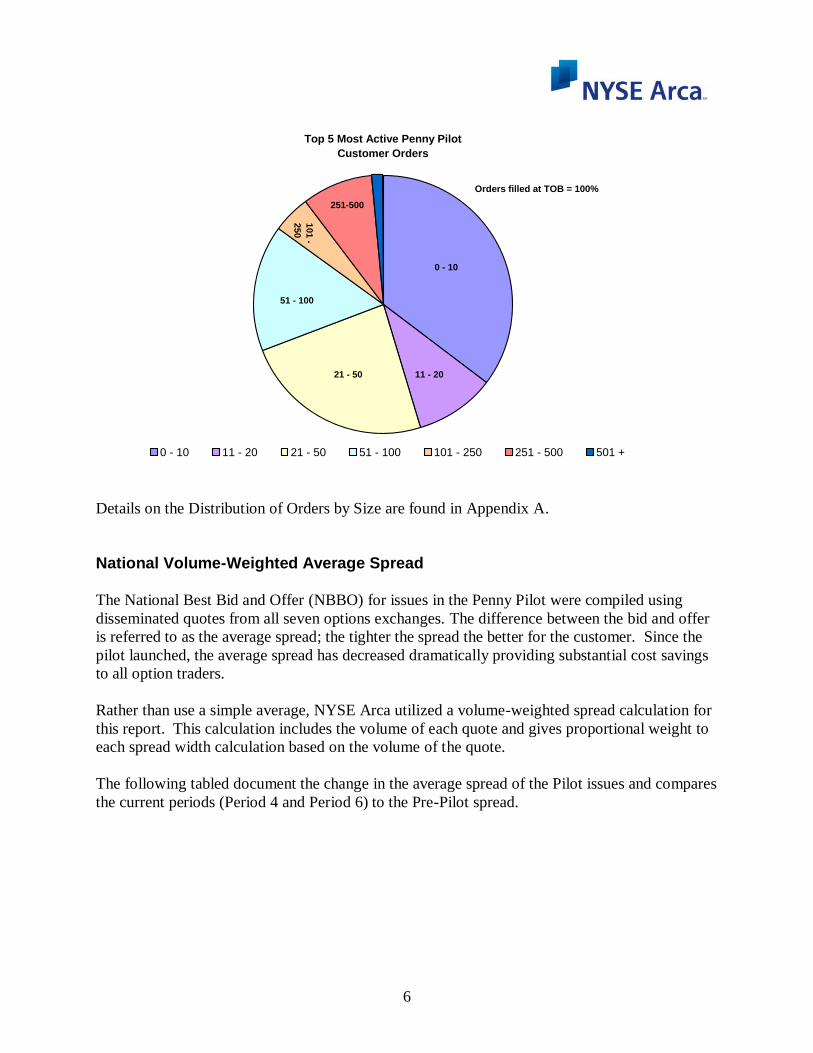
Furthermore, of the Top 5 Most Active Penny Pilot Issues, 100% of Customer orders were filled
at Top of Book:
6
Top 5 Most Active Penny Pilot
Customer Orders
0 - 10 11 - 20 21 - 50 51 - 100 101 - 250 251 - 500 501 +
Orders filled at TOB = 100%
0 - 10
11 - 2021 - 50
51 - 100
101 -
250
251-500
Details on the Distribution of Orders by Size are found in Appendix A.
National Volume-Weighted Average Spread The National Best Bid and Offer (NBBO) for issues in the Penny Pilot were compiled using
disseminated quotes from all seven options exchanges. The difference between the bid and offer
is referred to as the average spread; the tighter the spread the better for the customer. Since the
pilot launched, the average spread has decreased dramatically providing substantial cost savings
to all option traders.
Rather than use a simple average, NYSE Arca utilized a volume-weighted spread calculation for
this report. This calculation includes the volume of each quote and gives proportional weight to
each spread width calculation based on the volume of the quote.
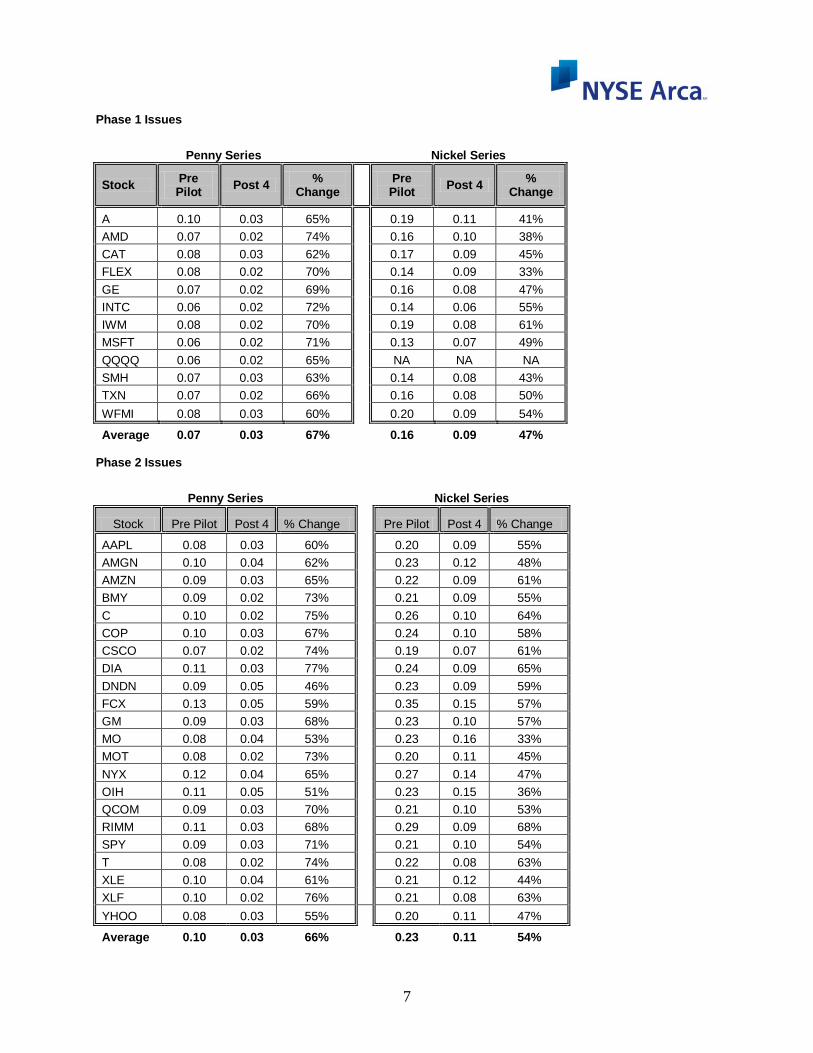
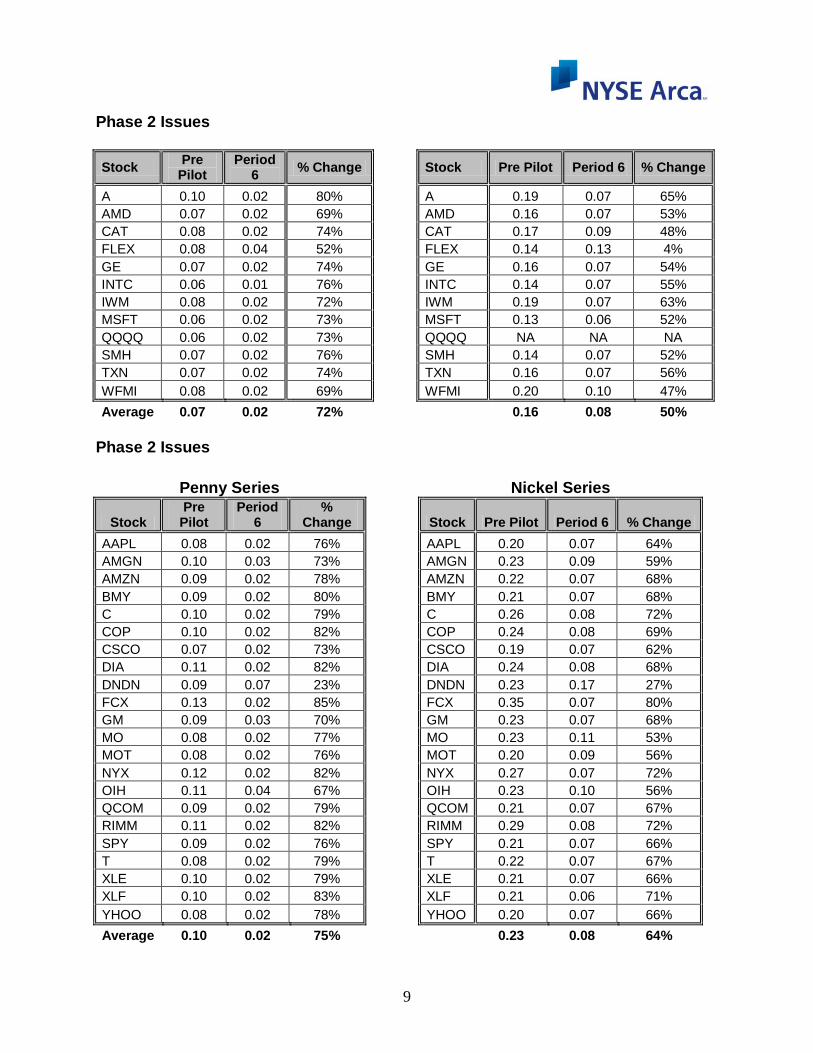
The following tabled document the change in the average spread of the Pilot issues and compares
the current periods (Period 4 and Period 6) to the Pre-Pilot spread.
7
Phase 1 Issues
Penny Series Nickel Series
Stock Pre Pilot
Post 4 %
Change
Pre Pilot
Post 4 %
Change
A 0.10 0.03 65% 0.19 0.11 41%
AMD 0.07 0.02 74% 0.16 0.10 38%
CAT 0.08 0.03 62% 0.17 0.09 45%
FLEX 0.08 0.02 70% 0.14 0.09 33%
GE 0.07 0.02 69% 0.16 0.08 47%
INTC 0.06 0.02 72% 0.14 0.06 55%
IWM 0.08 0.02 70% 0.19 0.08 61%
MSFT 0.06 0.02 71% 0.13 0.07 49%
QQQQ 0.06 0.02 65% NA NA NA
SMH 0.07 0.03 63% 0.14 0.08 43%
TXN 0.07 0.02 66% 0.16 0.08 50%
WFMI 0.08 0.03 60% 0.20 0.09 54%
Average 0.07 0.03 67% 0.16 0.09 47% Phase 2 Issues
Penny Series Nickel Series
Stock Pre Pilot Post 4 % Change Pre Pilot Post 4 % Change
AAPL 0.08 0.03 60% 0.20 0.09 55%
AMGN 0.10 0.04 62% 0.23 0.12 48%
AMZN 0.09 0.03 65% 0.22 0.09 61%
BMY 0.09 0.02 73% 0.21 0.09 55%
C 0.10 0.02 75% 0.26 0.10 64%
COP 0.10 0.03 67% 0.24 0.10 58%
CSCO 0.07 0.02 74% 0.19 0.07 61%
DIA 0.11 0.03 77% 0.24 0.09 65%
DNDN 0.09 0.05 46% 0.23 0.09 59%
FCX 0.13 0.05 59% 0.35 0.15 57%
GM 0.09 0.03 68% 0.23 0.10 57%
MO 0.08 0.04 53% 0.23 0.16 33%
MOT 0.08 0.02 73% 0.20 0.11 45%
NYX 0.12 0.04 65% 0.27 0.14 47%
OIH 0.11 0.05 51% 0.23 0.15 36%
QCOM 0.09 0.03 70% 0.21 0.10 53%
RIMM 0.11 0.03 68% 0.29 0.09 68%
SPY 0.09 0.03 71% 0.21 0.10 54%
T 0.08 0.02 74% 0.22 0.08 63%
XLE 0.10 0.04 61% 0.21 0.12 44%
XLF 0.10 0.02 76% 0.21 0.08 63%
YHOO 0.08 0.03 55% 0.20 0.11 47%
Average 0.10 0.03 66% 0.23 0.11 54%
8
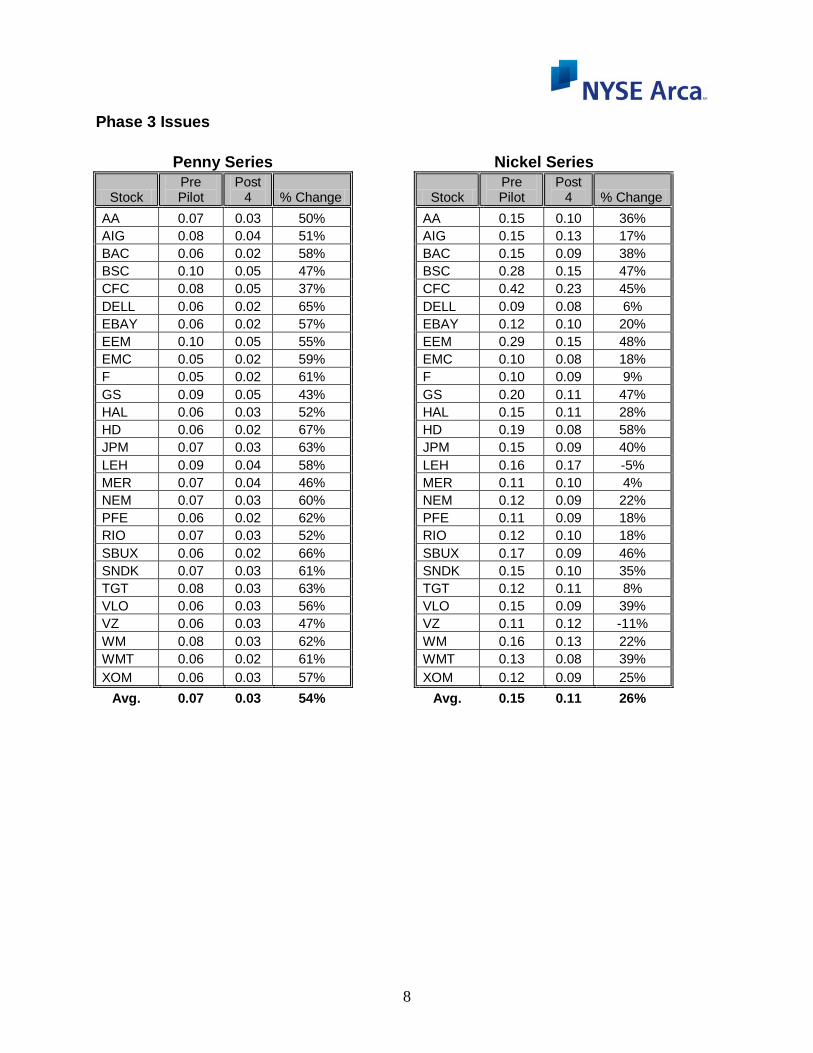
Phase 3 Issues
Penny Series Nickel Series
Stock Pre Pilot
Post 4 % Change Stock
Pre Pilot
Post 4 % Change
AA 0.07 0.03 50% AA 0.15 0.10 36%
AIG 0.08 0.04 51% AIG 0.15 0.13 17%
BAC 0.06 0.02 58% BAC 0.15 0.09 38%
BSC 0.10 0.05 47% BSC 0.28 0.15 47%
CFC 0.08 0.05 37% CFC 0.42 0.23 45%
DELL 0.06 0.02 65% DELL 0.09 0.08 6%
EBAY 0.06 0.02 57% EBAY 0.12 0.10 20%
EEM 0.10 0.05 55% EEM 0.29 0.15 48%
EMC 0.05 0.02 59% EMC 0.10 0.08 18%
F 0.05 0.02 61% F 0.10 0.09 9%
GS 0.09 0.05 43% GS 0.20 0.11 47%
HAL 0.06 0.03 52% HAL 0.15 0.11 28%
HD 0.06 0.02 67% HD 0.19 0.08 58%
JPM 0.07 0.03 63% JPM 0.15 0.09 40%
LEH 0.09 0.04 58% LEH 0.16 0.17 -5%
MER 0.07 0.04 46% MER 0.11 0.10 4%
NEM 0.07 0.03 60% NEM 0.12 0.09 22%
PFE 0.06 0.02 62% PFE 0.11 0.09 18%
RIO 0.07 0.03 52% RIO 0.12 0.10 18%
SBUX 0.06 0.02 66% SBUX 0.17 0.09 46%
SNDK 0.07 0.03 61% SNDK 0.15 0.10 35%
TGT 0.08 0.03 63% TGT 0.12 0.11 8%
VLO 0.06 0.03 56% VLO 0.15 0.09 39%
VZ 0.06 0.03 47% VZ 0.11 0.12 -11%
WM 0.08 0.03 62% WM 0.16 0.13 22%
WMT 0.06 0.02 61% WMT 0.13 0.08 39%
XOM 0.06 0.03 57% XOM 0.12 0.09 25%
Avg. 0.07 0.03 54% Avg. 0.15 0.11 26%
9
Phase 2 Issues
Stock Pre
Pilot Period
6 % Change Stock Pre Pilot Period 6 % Change
A 0.10 0.02 80% A 0.19 0.07 65%
AMD 0.07 0.02 69% AMD 0.16 0.07 53%
CAT 0.08 0.02 74% CAT 0.17 0.09 48%
FLEX 0.08 0.04 52% FLEX 0.14 0.13 4%
GE 0.07 0.02 74% GE 0.16 0.07 54%
INTC 0.06 0.01 76% INTC 0.14 0.07 55%
IWM 0.08 0.02 72% IWM 0.19 0.07 63%
MSFT 0.06 0.02 73% MSFT 0.13 0.06 52%
QQQQ 0.06 0.02 73% QQQQ NA NA NA
SMH 0.07 0.02 76% SMH 0.14 0.07 52%
TXN 0.07 0.02 74% TXN 0.16 0.07 56%
WFMI 0.08 0.02 69% WFMI 0.20 0.10 47%
Average 0.07 0.02 72% 0.16 0.08 50%
Phase 2 Issues
Penny Series Nickel Series
Stock Pre
Pilot Period
6 %
Change Stock Pre Pilot Period 6 % Change
AAPL 0.08 0.02 76% AAPL 0.20 0.07 64%
AMGN 0.10 0.03 73% AMGN 0.23 0.09 59%
AMZN 0.09 0.02 78% AMZN 0.22 0.07 68%
BMY 0.09 0.02 80% BMY 0.21 0.07 68%
C 0.10 0.02 79% C 0.26 0.08 72%
COP 0.10 0.02 82% COP 0.24 0.08 69%
CSCO 0.07 0.02 73% CSCO 0.19 0.07 62%
DIA 0.11 0.02 82% DIA 0.24 0.08 68%
DNDN 0.09 0.07 23% DNDN 0.23 0.17 27%
FCX 0.13 0.02 85% FCX 0.35 0.07 80%
GM 0.09 0.03 70% GM 0.23 0.07 68%
MO 0.08 0.02 77% MO 0.23 0.11 53%
MOT 0.08 0.02 76% MOT 0.20 0.09 56%
NYX 0.12 0.02 82% NYX 0.27 0.07 72%
OIH 0.11 0.04 67% OIH 0.23 0.10 56%
QCOM 0.09 0.02 79% QCOM 0.21 0.07 67%
RIMM 0.11 0.02 82% RIMM 0.29 0.08 72%
SPY 0.09 0.02 76% SPY 0.21 0.07 66%
T 0.08 0.02 79% T 0.22 0.07 67%
XLE 0.10 0.02 79% XLE 0.21 0.07 66%
XLF 0.10 0.02 83% XLF 0.21 0.06 71%
YHOO 0.08 0.02 78% YHOO 0.20 0.07 66%
Average 0.10 0.02 75% 0.23 0.08 64%
10
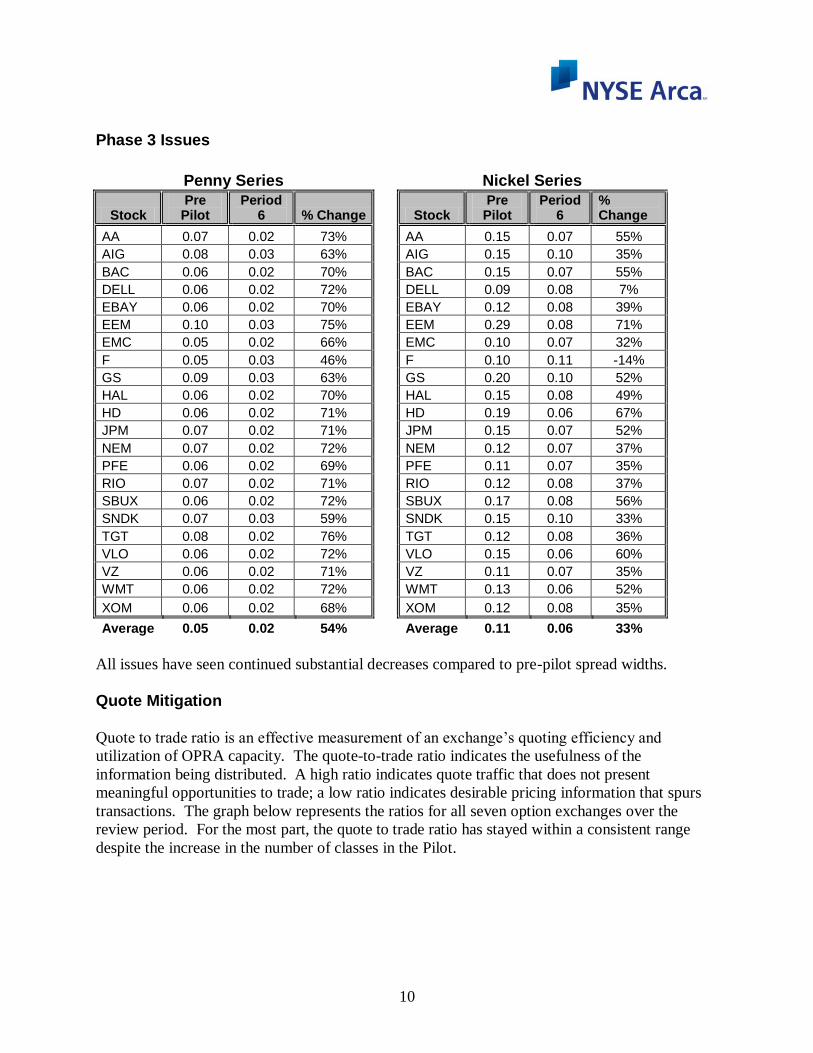
Phase 3 Issues
Penny Series Nickel Series
Stock Pre
Pilot Period
6 % Change Stock Pre
Pilot Period
6 % Change
AA 0.07 0.02 73% AA 0.15 0.07 55%
AIG 0.08 0.03 63% AIG 0.15 0.10 35%
BAC 0.06 0.02 70% BAC 0.15 0.07 55%
DELL 0.06 0.02 72% DELL 0.09 0.08 7%
EBAY 0.06 0.02 70% EBAY 0.12 0.08 39%
EEM 0.10 0.03 75% EEM 0.29 0.08 71%
EMC 0.05 0.02 66% EMC 0.10 0.07 32%
F 0.05 0.03 46% F 0.10 0.11 -14%
GS 0.09 0.03 63% GS 0.20 0.10 52%
HAL 0.06 0.02 70% HAL 0.15 0.08 49%
HD 0.06 0.02 71% HD 0.19 0.06 67%
JPM 0.07 0.02 71% JPM 0.15 0.07 52%
NEM 0.07 0.02 72% NEM 0.12 0.07 37%
PFE 0.06 0.02 69% PFE 0.11 0.07 35%
RIO 0.07 0.02 71% RIO 0.12 0.08 37%
SBUX 0.06 0.02 72% SBUX 0.17 0.08 56%
SNDK 0.07 0.03 59% SNDK 0.15 0.10 33%
TGT 0.08 0.02 76% TGT 0.12 0.08 36%
VLO 0.06 0.02 72% VLO 0.15 0.06 60%
VZ 0.06 0.02 71% VZ 0.11 0.07 35%
WMT 0.06 0.02 72% WMT 0.13 0.06 52%
XOM 0.06 0.02 68% XOM 0.12 0.08 35%
Average 0.05 0.02 54% Average 0.11 0.06 33%
All issues have seen continued substantial decreases compared to pre-pilot spread widths.
Quote Mitigation
Quote to trade ratio is an effective measurement of an exchange’s quoting efficiency and
utilization of OPRA capacity. The quote-to-trade ratio indicates the usefulness of the
information being distributed. A high ratio indicates quote traffic that does not present
meaningful opportunities to trade; a low ratio indicates desirable pricing information that spurs
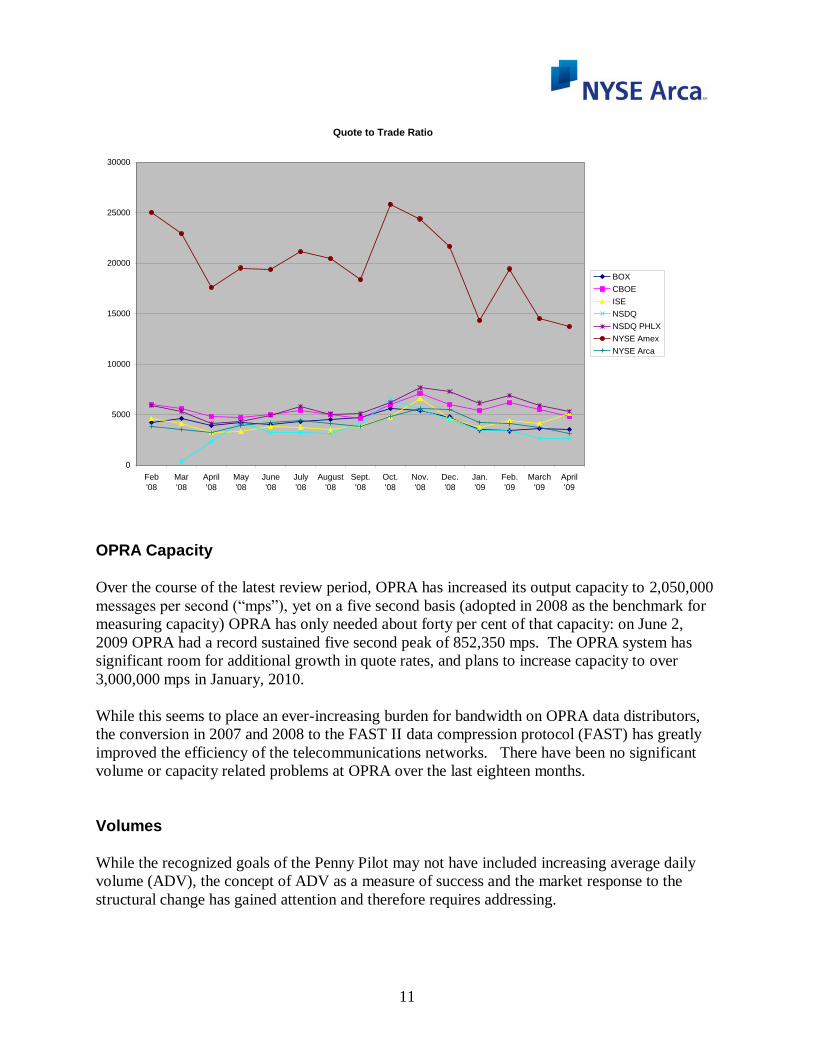
transactions. The graph below represents the ratios for all seven option exchanges over the
review period. For the most part, the quote to trade ratio has stayed within a consistent range
despite the increase in the number of classes in the Pilot.
11
Quote to Trade Ratio
0
5000
10000
15000
20000
25000
30000
Feb
'08
Mar
'08
April
'08
May
'08
June
'08
July
'08
August
'08
Sept.
'08
Oct.
'08
Nov.
'08
Dec.
'08
Jan.
'09
Feb.
'09
March
'09
April
'09
BOX
CBOE
ISE
NSDQ
NSDQ PHLX
NYSE Amex
NYSE Arca
OPRA Capacity
Over the course of the latest review period, OPRA has increased its output capacity to 2,050,000
messages per second (“mps”), yet on a five second basis (adopted in 2008 as the benchmark for
measuring capacity) OPRA has only needed about forty per cent of that capacity: on June 2,
2009 OPRA had a record sustained five second peak of 852,350 mps. The OPRA system has
significant room for additional growth in quote rates, and plans to increase capacity to over
3,000,000 mps in January, 2010.
While this seems to place an ever-increasing burden for bandwidth on OPRA data distributors,
the conversion in 2007 and 2008 to the FAST II data compression protocol (FAST) has greatly
improved the efficiency of the telecommunications networks. There have been no significant
volume or capacity related problems at OPRA over the last eighteen months.
Volumes
While the recognized goals of the Penny Pilot may not have included increasing average daily
volume (ADV), the concept of ADV as a measure of success and the market response to the
structural change has gained attention and therefore requires addressing.
12
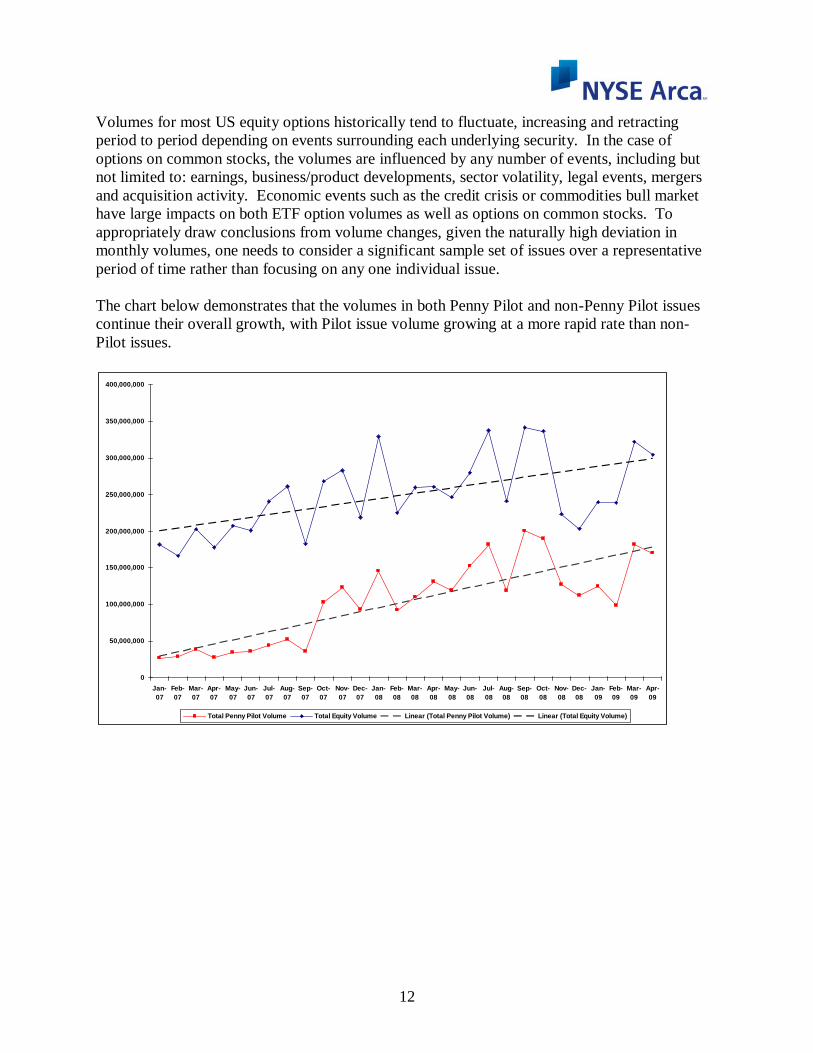
Volumes for most US equity options historically tend to fluctuate, increasing and retracting
period to period depending on events surrounding each underlying security. In the case of
options on common stocks, the volumes are influenced by any number of events, including but
not limited to: earnings, business/product developments, sector volatility, legal events, mergers
and acquisition activity. Economic events such as the credit crisis or commodities bull market
have large impacts on both ETF option volumes as well as options on common stocks. To
appropriately draw conclusions from volume changes, given the naturally high deviation in
monthly volumes, one needs to consider a significant sample set of issues over a representative
period of time rather than focusing on any one individual issue.
The chart below demonstrates that the volumes in both Penny Pilot and non-Penny Pilot issues
continue their overall growth, with Pilot issue volume growing at a more rapid rate than non-
Pilot issues.
0
50,000,000
100,000,000
150,000,000
200,000,000
250,000,000
300,000,000
350,000,000
400,000,000
Jan-
07
Feb-
07
Mar-
07
Apr-
07
May-
07
Jun-
07
Jul-
07
Aug-
07
Sep-
07
Oct-
07
Nov-
07
Dec-
07
Jan-
08
Feb-
08
Mar-
08
Apr-
08
May-
08
Jun-
08
Jul-
08
Aug-
08
Sep-
08
Oct-
08
Nov-
08
Dec-
08
Jan-
09
Feb-
09
Mar-
09
Apr-
09
Total Penny Pilot Volume Total Equity Volume Linear (Total Penny Pilot Volume) Linear (Total Equity Volume)
13
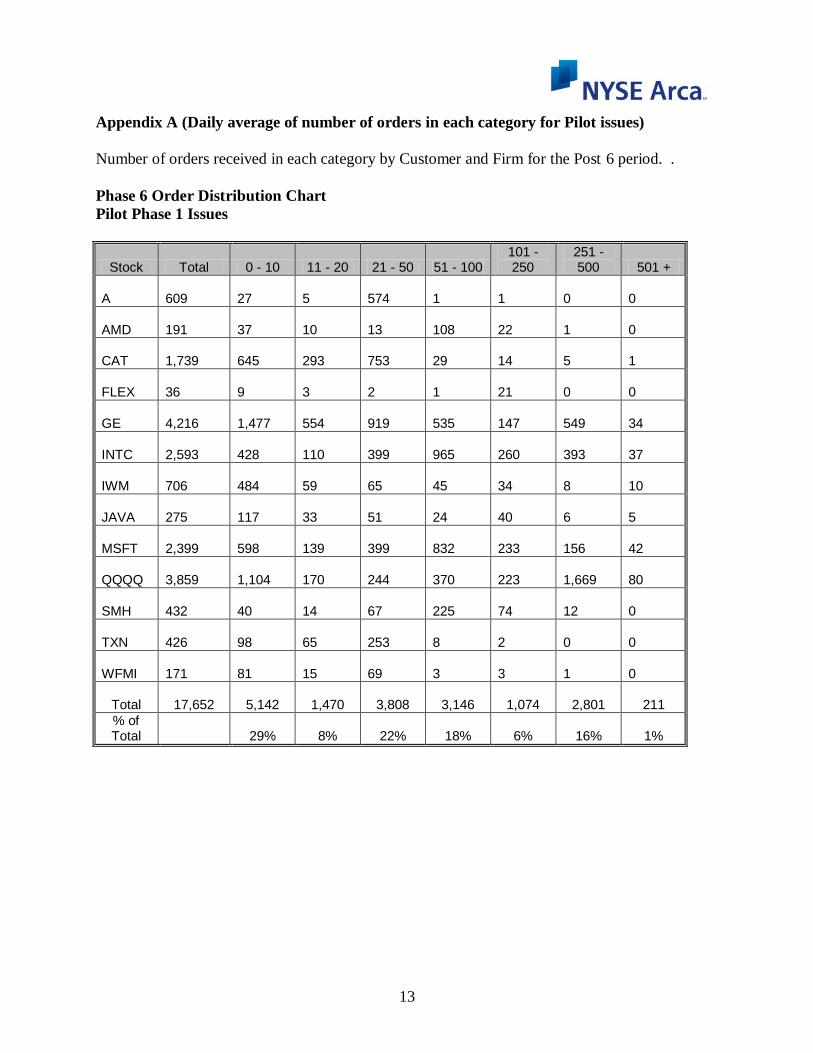
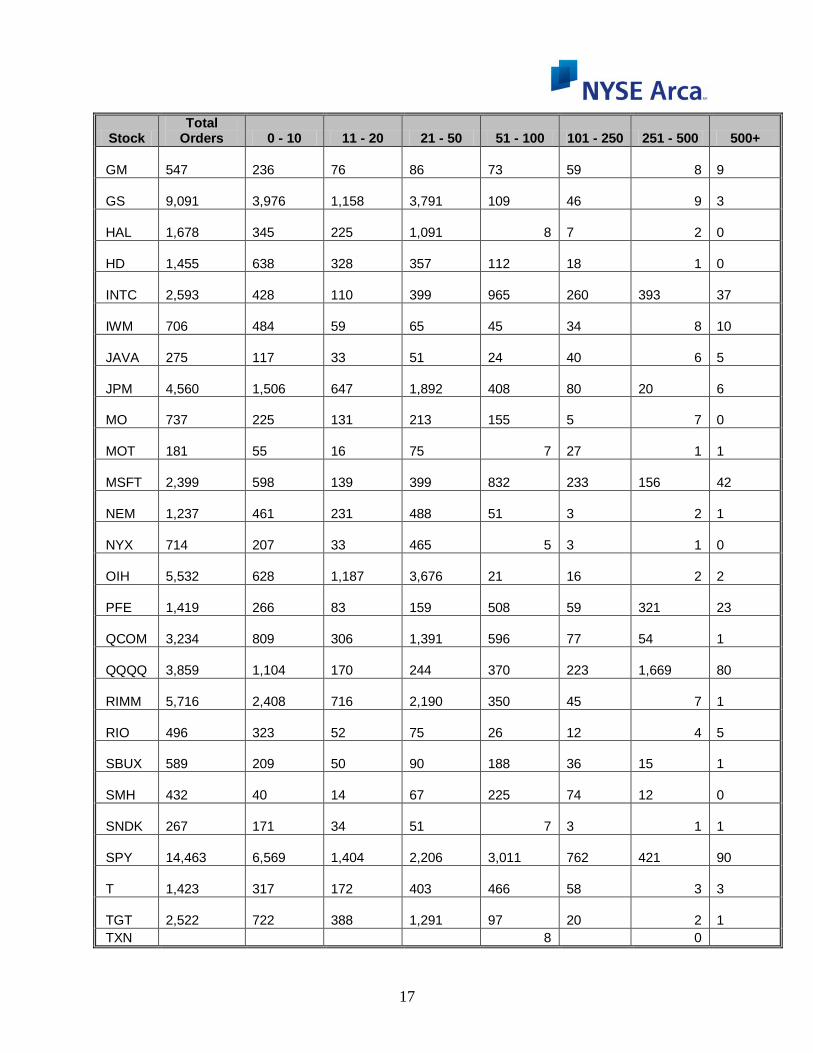
Appendix A (Daily average of number of orders in each category for Pilot issues)
Number of orders received in each category by Customer and Firm for the Post 6 period. .
Phase 6 Order Distribution Chart
Pilot Phase 1 Issues
Stock Total 0 - 10 11 - 20 21 - 50 51 - 100 101 - 250
251 - 500 501 +
A 609
27
5
574
1
1
0
0
AMD 191
37
10
13
108
22
1
0
CAT 1,739
645
293
753
29
14
5
1
FLEX 36
9
3
2
1
21
0
0
GE 4,216
1,477
554
919
535
147
549
34
INTC 2,593
428
110
399
965
260
393
37
IWM 706
484
59
65
45
34
8
10
JAVA 275
117
33
51
24
40
6
5
MSFT 2,399
598
139
399
832
233
156
42
QQQQ 3,859
1,104
170
244
370
223
1,669
80
SMH 432
40
14
67
225
74
12
0
TXN 426
98
65
253
8
2
0
0
WFMI 171
81
15
69
3
3
1
0
Total
17,652
5,142
1,470
3,808
3,146
1,074
2,801
211
% of Total 29% 8% 22% 18% 6% 16% 1%
14
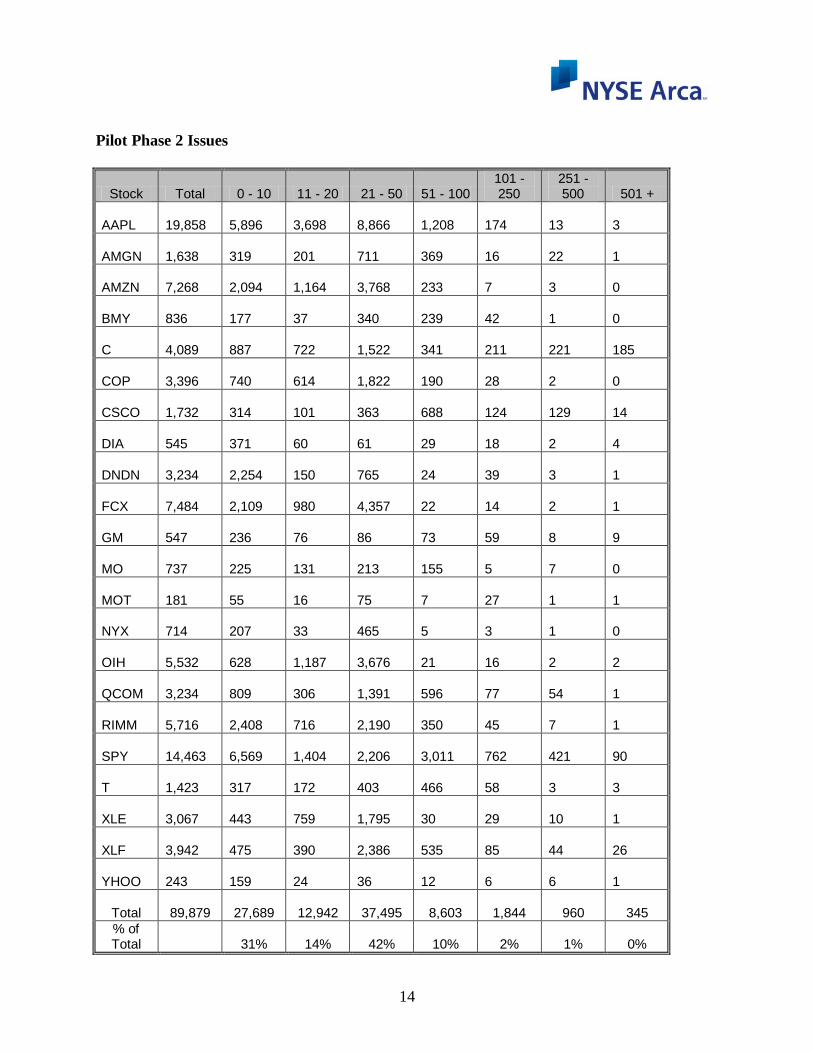
Pilot Phase 2 Issues
Stock Total 0 - 10 11 - 20 21 - 50 51 - 100 101 - 250
251 - 500 501 +
AAPL 19,858
5,896
3,698
8,866
1,208
174
13
3
AMGN 1,638
319
201
711
369
16
22
1
AMZN 7,268
2,094
1,164
3,768
233
7
3
0
BMY 836
177
37
340
239
42
1
0
C 4,089
887
722
1,522
341
211
221
185
COP 3,396
740
614
1,822
190
28
2
0
CSCO 1,732
314
101
363
688
124
129
14
DIA 545
371
60
61
29
18
2
4
DNDN 3,234
2,254
150
765
24
39
3
1
FCX 7,484
2,109
980
4,357
22
14
2
1
GM 547
236
76
86
73
59
8
9
MO 737
225
131
213
155
5
7
0
MOT 181
55
16
75
7
27
1
1
NYX 714
207
33
465
5
3
1
0
OIH 5,532
628
1,187
3,676
21
16
2
2
QCOM 3,234
809
306
1,391
596
77
54
1
RIMM 5,716
2,408
716
2,190
350
45
7
1
SPY 14,463
6,569
1,404
2,206
3,011
762
421
90
T 1,423
317
172
403
466
58
3
3
XLE 3,067
443
759
1,795
30
29
10
1
XLF 3,942
475
390
2,386
535
85
44
26
YHOO 243
159
24
36
12
6
6
1
Total
89,879
27,689
12,942
37,495
8,603
1,844
960
345
% of Total 31% 14% 42% 10% 2% 1% 0%
15
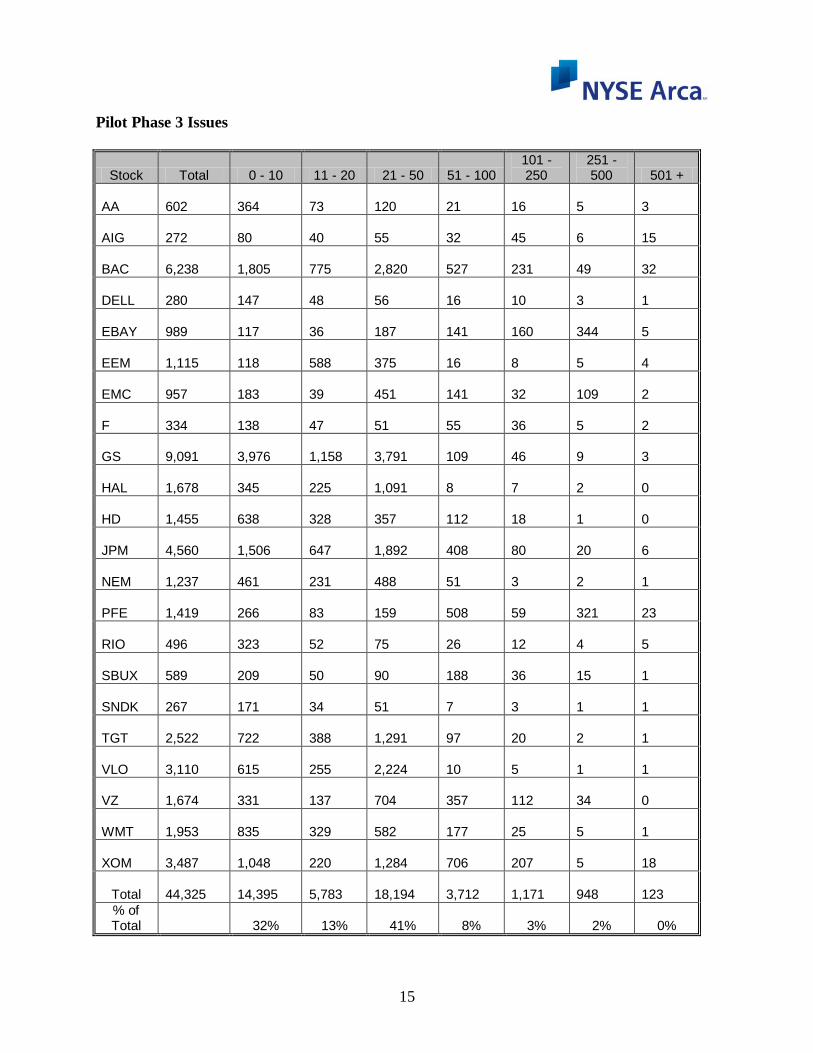
Pilot Phase 3 Issues
Stock Total 0 - 10 11 - 20 21 - 50 51 - 100 101 - 250
251 - 500 501 +
AA 602
364
73
120
21
16
5
3
AIG 272
80
40
55
32
45
6
15
BAC 6,238
1,805
775
2,820
527
231
49
32
DELL 280
147
48
56
16
10
3
1
EBAY 989
117
36
187
141
160
344
5
EEM 1,115
118
588
375
16
8
5
4
EMC 957
183
39
451
141
32
109
2
F 334
138
47
51
55
36
5
2
GS 9,091
3,976
1,158
3,791
109
46
9
3
HAL 1,678
345
225
1,091
8
7
2
0
HD 1,455
638
328
357
112
18
1
0
JPM 4,560
1,506
647
1,892
408
80
20
6
NEM 1,237
461
231
488
51
3
2
1
PFE 1,419
266
83
159
508
59
321
23
RIO 496
323
52
75
26
12
4
5
SBUX 589
209
50
90
188
36
15
1
SNDK 267
171
34
51
7
3
1
1
TGT 2,522
722
388
1,291
97
20
2
1
VLO 3,110
615
255
2,224
10
5
1
1
VZ 1,674
331
137
704
357
112
34
0
WMT 1,953
835
329
582
177
25
5
1
XOM 3,487
1,048
220
1,284
706
207
5
18
Total 44,325
14,395
5,783
18,194
3,712
1,171
948
123
% of Total 32% 13% 41% 8% 3% 2% 0%
16
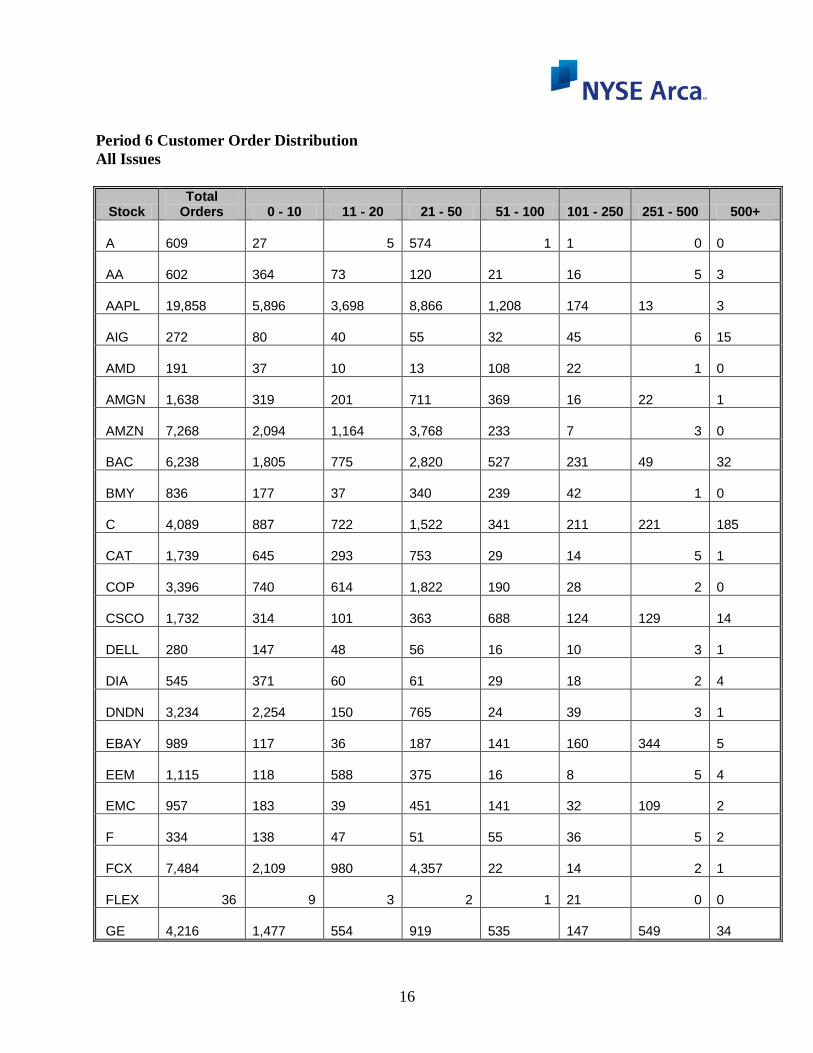
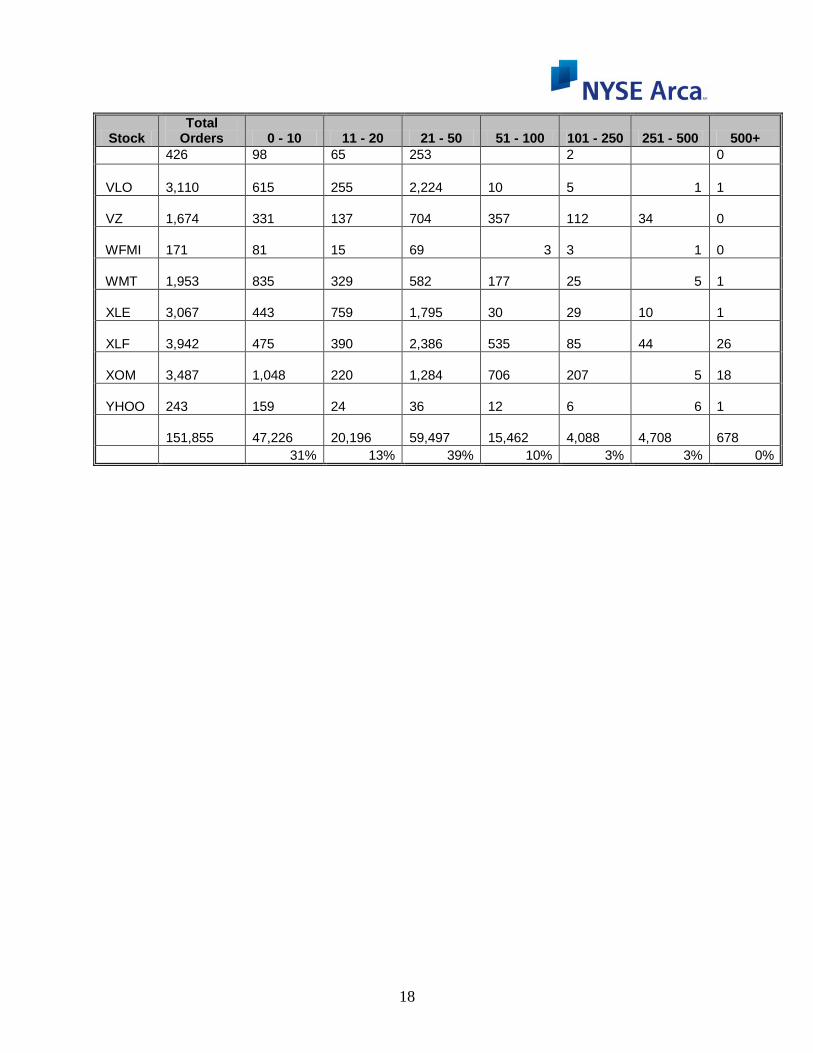
Period 6 Customer Order Distribution
All Issues
Stock Total
Orders 0 - 10 11 - 20 21 - 50 51 - 100 101 - 250 251 - 500 500+
A 609
27 5
574 1
1 0
0
AA 602
364
73
120
21
16 5
3
AAPL 19,858
5,896
3,698
8,866
1,208
174
13
3
AIG 272
80
40
55
32
45 6
15
AMD 191
37
10
13
108
22 1
0
AMGN 1,638
319
201
711
369
16
22
1
AMZN 7,268
2,094
1,164
3,768
233
7 3
0
BAC 6,238
1,805
775
2,820
527
231
49
32
BMY 836
177
37
340
239
42 1
0
C 4,089
887
722
1,522
341
211
221
185
CAT 1,739
645
293
753
29
14 5
1
COP 3,396
740
614
1,822
190
28 2
0
CSCO 1,732
314
101
363
688
124
129
14
DELL 280
147
48
56
16
10 3
1
DIA 545
371
60
61
29
18 2
4
DNDN 3,234
2,254
150
765
24
39 3
1
EBAY 989
117
36
187
141
160
344
5
EEM 1,115
118
588
375
16
8 5
4
EMC 957
183
39
451
141
32
109
2
F 334
138
47
51
55
36 5
2
FCX 7,484
2,109
980
4,357
22
14 2
1
FLEX 36 9 3 2 1 21 0
0
GE 4,216
1,477
554
919
535
147
549
34
17
Stock Total
Orders 0 - 10 11 - 20 21 - 50 51 - 100 101 - 250 251 - 500 500+
GM 547
236
76
86
73
59 8
9
GS 9,091
3,976
1,158
3,791
109
46 9
3
HAL 1,678
345
225
1,091 8
7 2
0
HD 1,455
638
328
357
112
18 1
0
INTC 2,593
428
110
399
965
260
393
37
IWM 706
484
59
65
45
34 8
10
JAVA 275
117
33
51
24
40 6
5
JPM 4,560
1,506
647
1,892
408
80
20
6
MO 737
225
131
213
155
5 7
0
MOT 181
55
16
75 7
27 1
1
MSFT 2,399
598
139
399
832
233
156
42
NEM 1,237
461
231
488
51
3 2
1
NYX 714
207
33
465 5
3 1
0
OIH 5,532
628
1,187
3,676
21
16 2
2
PFE 1,419
266
83
159
508
59
321
23
QCOM 3,234
809
306
1,391
596
77
54
1
QQQQ 3,859
1,104
170
244
370
223
1,669
80
RIMM 5,716
2,408
716
2,190
350
45 7
1
RIO 496
323
52
75
26
12 4
5
SBUX 589
209
50
90
188
36
15
1
SMH 432
40
14
67
225
74
12
0
SNDK 267
171
34
51 7
3 1
1
SPY 14,463
6,569
1,404
2,206
3,011
762
421
90
T 1,423
317
172
403
466
58 3
3
TGT 2,522
722
388
1,291
97
20 2
1
TXN 8 0
18
Stock Total
Orders 0 - 10 11 - 20 21 - 50 51 - 100 101 - 250 251 - 500 500+
426 98 65 253 2 0
VLO 3,110
615
255
2,224
10
5 1
1
VZ 1,674
331
137
704
357
112
34
0
WFMI 171
81
15
69 3
3 1
0
WMT 1,953
835
329
582
177
25 5
1
XLE 3,067
443
759
1,795
30
29
10
1
XLF 3,942
475
390
2,386
535
85
44
26
XOM 3,487
1,048
220
1,284
706
207 5
18
YHOO 243
159
24
36
12
6 6
1
151,855
47,226
20,196
59,497
15,462
4,088
4,708
678
31% 13% 39% 10% 3% 3% 0%
19
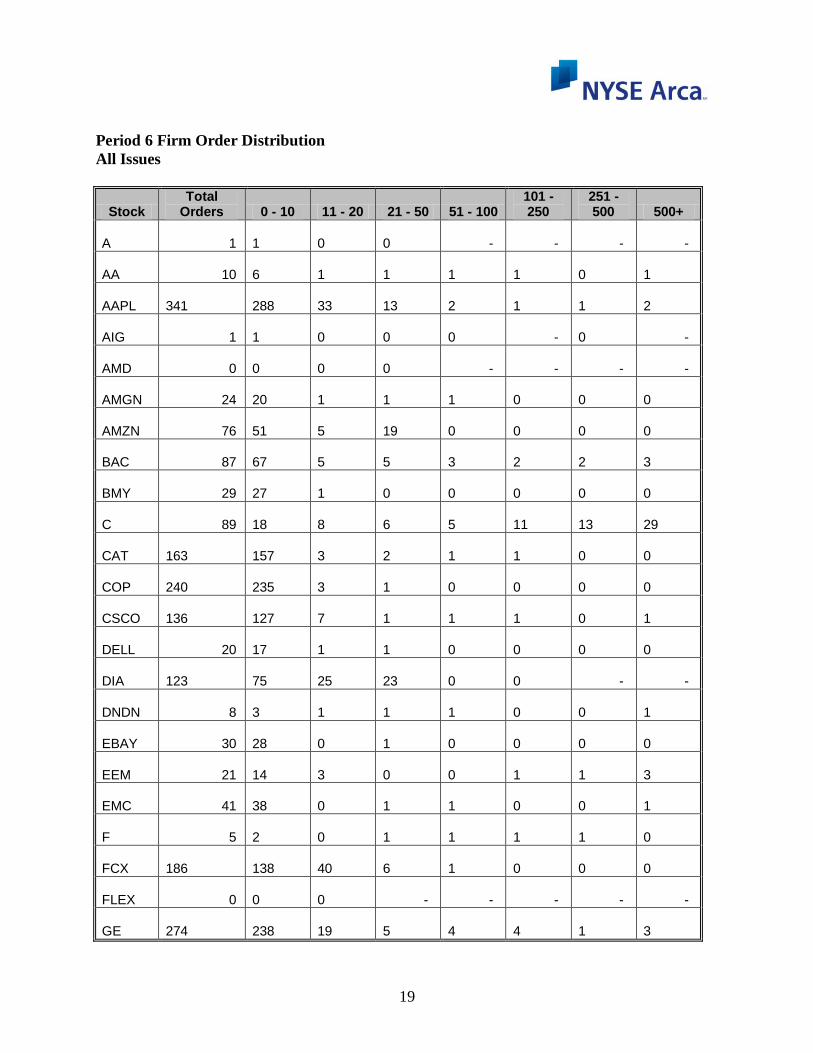
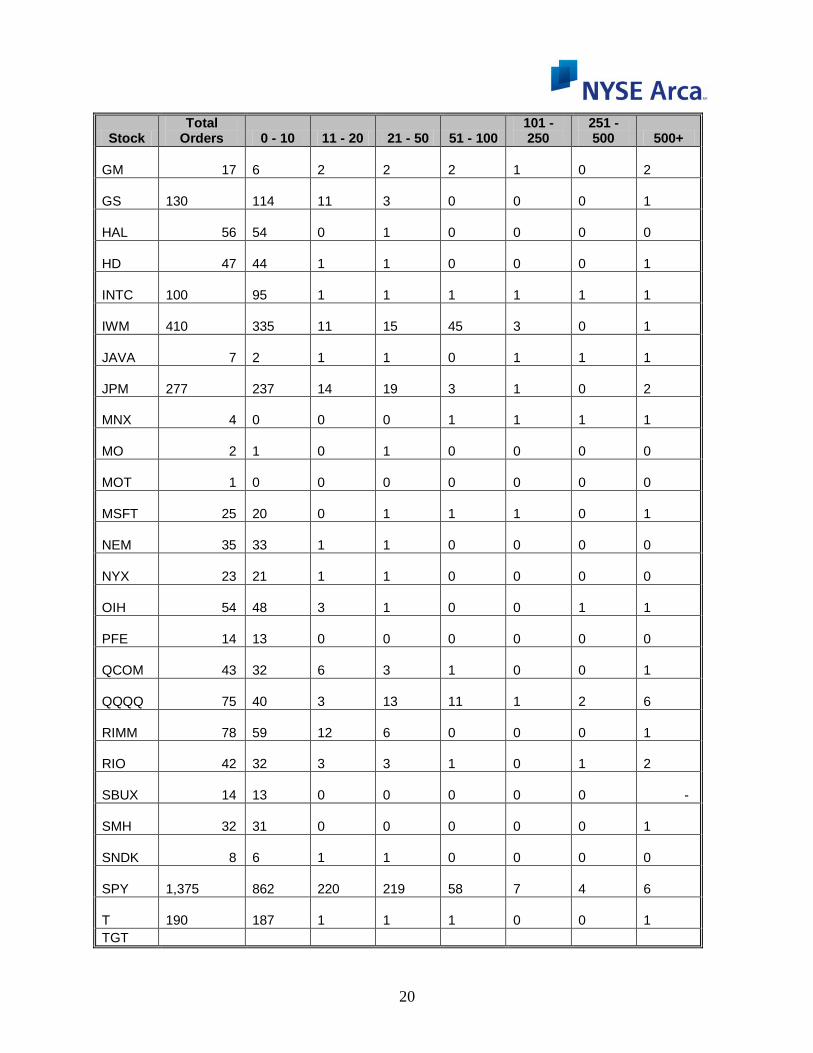
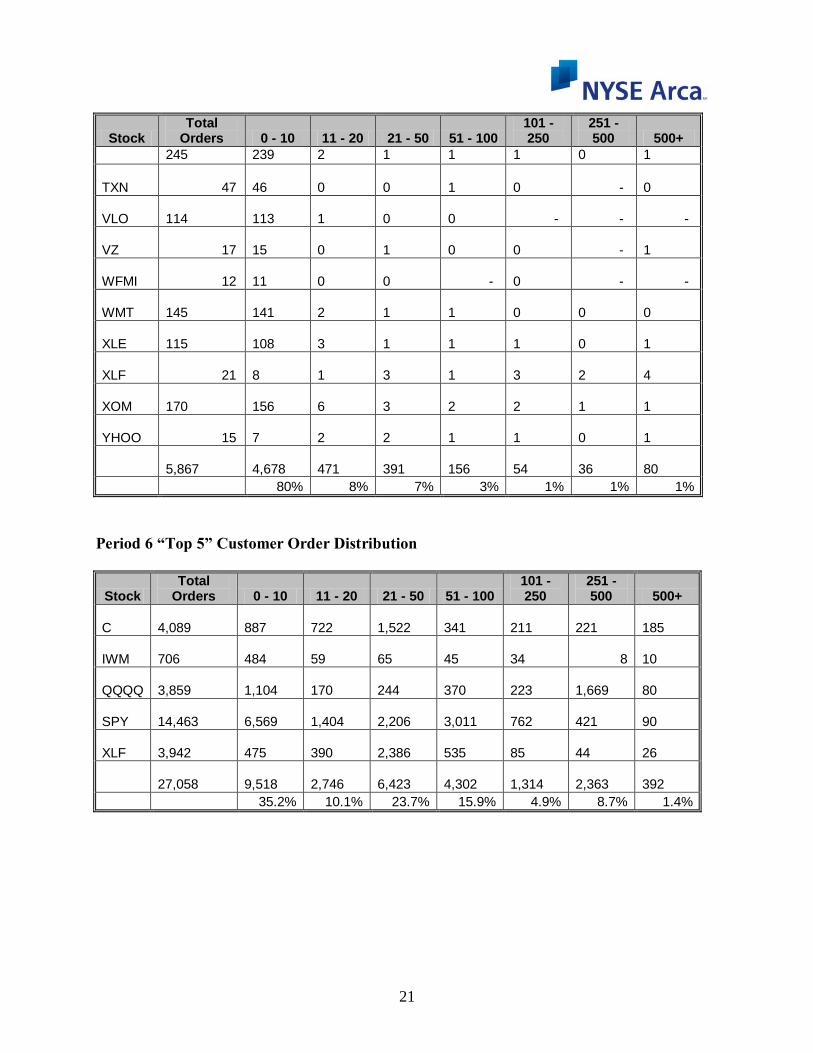
Period 6 Firm Order Distribution
All Issues
Stock Total
Orders 0 - 10 11 - 20 21 - 50 51 - 100 101 - 250
251 - 500 500+
A 1 1
0
0 - - - -
AA 10 6
1
1
1
1
0
1
AAPL 341
288
33
13
2
1
1
2
AIG 1 1
0
0
0 -
0 -
AMD 0 0
0
0 - - - -
AMGN 24 20
1
1
1
0
0
0
AMZN 76 51
5
19
0
0
0
0
BAC 87 67
5
5
3
2
2
3
BMY 29 27
1
0
0
0
0
0
C 89 18
8
6
5
11
13
29
CAT 163
157
3
2
1
1
0
0
COP 240
235
3
1
0
0
0
0
CSCO 136
127
7
1
1
1
0
1
DELL 20 17
1
1
0
0
0
0
DIA 123
75
25
23
0
0 - -
DNDN 8 3
1
1
1
0
0
1
EBAY 30 28
0
1
0
0
0
0
EEM 21 14
3
0
0
1
1
3
EMC 41 38
0
1
1
0
0
1
F 5 2
0
1
1
1
1
0
FCX 186
138
40
6
1
0
0
0
FLEX 0 0
0 - - - - -
GE 274
238
19
5
4
4
1
3
20
Stock Total
Orders 0 - 10 11 - 20 21 - 50 51 - 100 101 - 250
251 - 500 500+
GM 17 6
2
2
2
1
0
2
GS 130
114
11
3
0
0
0
1
HAL 56 54
0
1
0
0
0
0
HD 47 44
1
1
0
0
0
1
INTC 100
95
1
1
1
1
1
1
IWM 410
335
11
15
45
3
0
1
JAVA 7 2
1
1
0
1
1
1
JPM 277
237
14
19
3
1
0
2
MNX 4 0
0
0
1
1
1
1
MO 2 1
0
1
0
0
0
0
MOT 1 0
0
0
0
0
0
0
MSFT 25 20
0
1
1
1
0
1
NEM 35 33
1
1
0
0
0
0
NYX 23 21
1
1
0
0
0
0
OIH 54 48
3
1
0
0
1
1
PFE 14 13
0
0
0
0
0
0
QCOM 43 32
6
3
1
0
0
1
QQQQ 75 40
3
13
11
1
2
6
RIMM 78 59
12
6
0
0
0
1
RIO 42 32
3
3
1
0
1
2
SBUX 14 13
0
0
0
0
0 -
SMH 32 31
0
0
0
0
0
1
SNDK 8 6
1
1
0
0
0
0
SPY 1,375
862
220
219
58
7
4
6
T 190
187
1
1
1
0
0
1
TGT
21
Stock Total
Orders 0 - 10 11 - 20 21 - 50 51 - 100 101 - 250
251 - 500 500+
245 239 2 1 1 1 0 1
TXN 47 46
0
0
1
0 -
0
VLO 114
113
1
0
0 - - -
VZ 17 15
0
1
0
0 -
1
WFMI 12 11
0
0 -
0 - -
WMT 145
141
2
1
1
0
0
0
XLE 115
108
3
1
1
1
0
1
XLF 21 8
1
3
1
3
2
4
XOM 170
156
6
3
2
2
1
1
YHOO 15 7
2
2
1
1
0
1
5,867
4,678
471
391
156
54
36
80
80% 8% 7% 3% 1% 1% 1%
Period 6 “Top 5” Customer Order Distribution
Stock Total
Orders 0 - 10 11 - 20 21 - 50 51 - 100 101 - 250
251 - 500 500+
C 4,089
887
722
1,522
341
211
221
185
IWM 706
484
59
65
45
34 8
10
QQQQ 3,859
1,104
170
244
370
223
1,669
80
SPY 14,463
6,569
1,404
2,206
3,011
762
421
90
XLF 3,942
475
390
2,386
535
85
44
26
27,058
9,518
2,746
6,423
4,302
1,314
2,363
392
35.2% 10.1% 23.7% 15.9% 4.9% 8.7% 1.4%


![A Guide to the NYSE Marketplace - Take Charge Today1].pdf · NYSE Arca, following rules set by the Securities and Exchange Commission (SEC), a U.S. federal government agency, and](https://img.pdfslide.us/doc/110x75/5e138bd0dd84da753002dfc2/a-guide-to-the-nyse-marketplace-take-charge-today-1pdf-nyse-arca-following.jpg)