Embed Size (px)
Citation preview
The Options Miracle System:
How to Generate 30% Annualized Returns in a
Stagnant Market With Limited Risk
The Wealth Summit May 2014
Jim Fink

Jim FinkChief Investment Strategist, Jim Fink’s Options for Income

Stocks are Significantly Overvalued• Yale economics professor James Tobin• Q ratio: market price of stock divided by asset
replacement cost– Similar to book value, but better because market values, not
accounting values
• Andrew Smithers (U.K.) maintains Q ratio: www.smithers.co.uk
• Stock market is overvalued whenever Q ratio is above its long-term average.
• Right now, stock market is 75% overvalued, right near the overvaluation peak prior to previous bear markets.
• Robert Shiller’s cyclically-adjusted 10-year P/E ratio is currently 28.4 vs. 15.7 long-term average: 81% overvalued.

Market Cap of Stock Market > GDP
• Warren Buffett: – The percentage of total market cap relative to the US
GDP is “probably the best single measure of where valuations stand at any given moment.”
• US GDP is $16.8 trillion and total market cap of U.S. stocks is $19.8 trillion
• Since 1970, only three times that market cap has equaled GDP:– 1999-2000 (148%) – Nasdaq lost 78%– 2007 (111%) – S&P 500 lost 56%– 2014 (118%) -- ????
• Economics Ph.D. John Hussman: “ since the 1940’s, the ratio of equity market value to GDP has demonstrated a 90% correlation with subsequent 10-year total returns on the S&P 500. Present level is associated with projected annual total returns on the S&P 500 of just over 1.8% annually.”

Other Warning Signs
• High-flying momentum stocks in the Internet (e.g., GOOG, FB, PCLN, NFLX) and biotechnology (e.g., ALXN, REGN, CELG, GILD) sectors have already begun to crack with steep corrections.
• Nasdaq/NSYE relative strength dropped decisively below its 10-week moving average for the first time since late September 2012.
• University of Michigan finance professor Nejat Seyhun: insider selling is “as pessimistic as I’ve ever seen over the last 25 years.” More pessimistic than in 2007 (before 37% bear market in 2008) and more pessimistic than in 2011 (before 20% market correction).
• The Investor Intelligence bull/bear ratio has been above 3 for most of the past five months, which is longer than any time since the 1980s.
• But the S&P 500 remains comfortably above its uptrending 10-month moving average, so the Ivy Portfolio market-timing system continues to flash a “fully invested” signal.

Loss/Gain Asymmetry
Loss (%)Gain (%)
Needed to Break Even
10% 11%
15% 18%
20% 25%
25% 33%
30% 43%
40% 67%
50% 100%
60% 150%
70% 233%
80% 400%
90% 900%
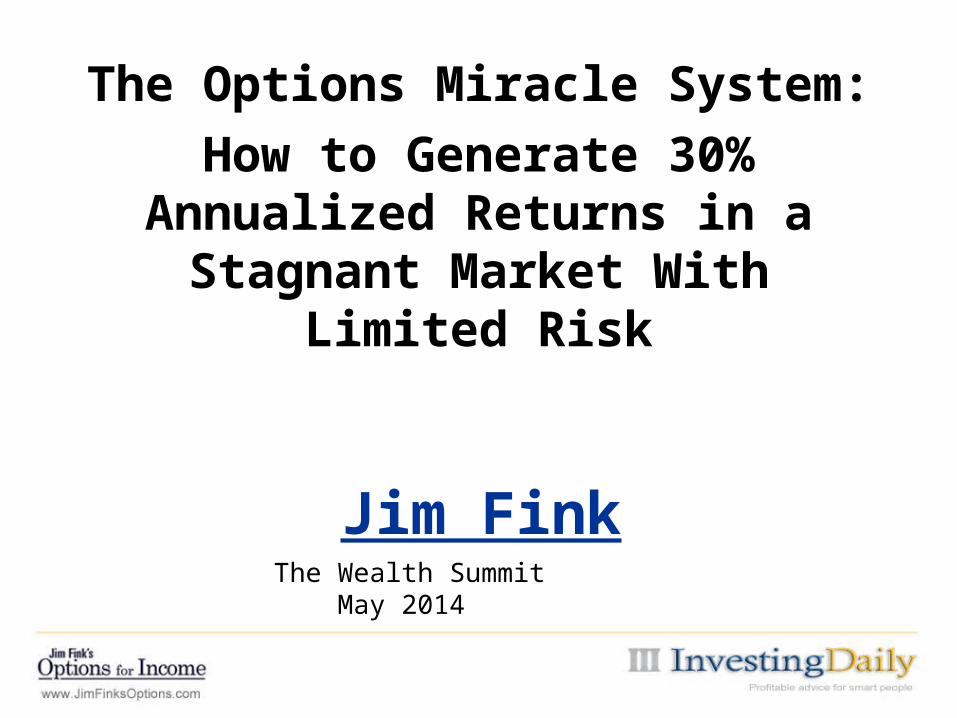
OptionsGeneral Strategy
1. Sell Low-Probability Fear
– Out-of-the-money put options
2. Buy High-Probability Growth
– In-the-money call options
3. Sell Low Probability Greed
– Out-of-the-money call options

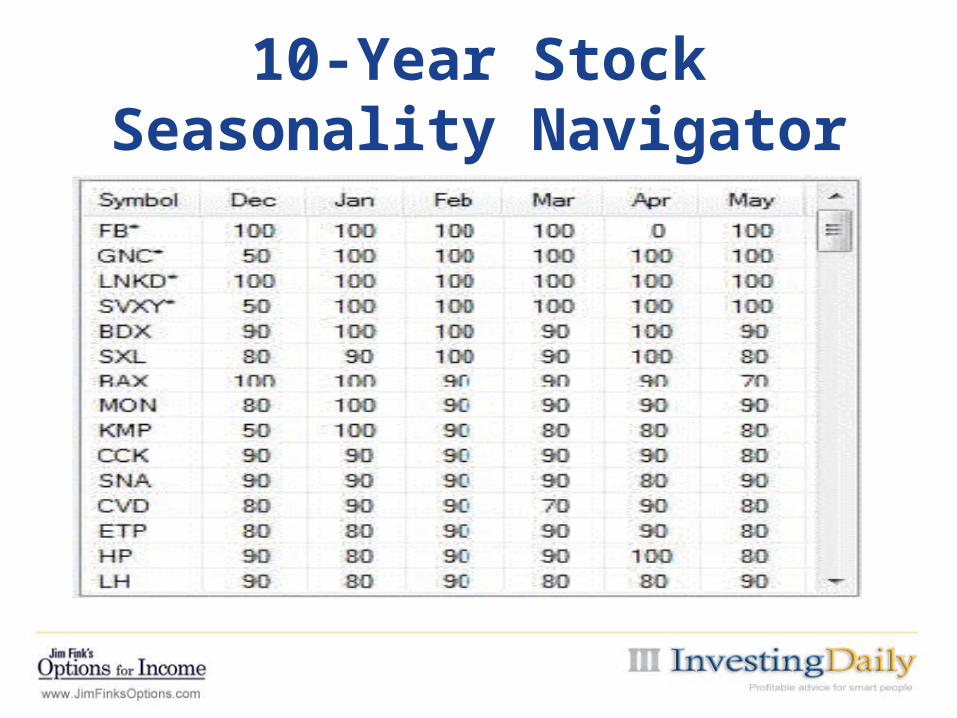
OFI’s 10-Year Stock Seasonality Navigator
• “Seasonality” refers to particular time frames during the calendar year when a company’s stock price is influenced by recurring forces that produce a consistent price direction – either bullish or bearish. Some stocks tend to go up consistently at certain times in the year.
• For example, consumer-related stocks (e.g., food, drugs, beer, leisure, utilities, media, and retail) outperform the overall market between May 1st and October 31st and manufacturing and production stocks (e.g., consumer durables, chemicals, construction, mining, steel) outperform between November 1st and April 30th.
• Seasonal tendencies can be based on weather events (temperature, precipitation, planting cycle), spending surges (holiday and back-to-school shopping, end of government fiscal years, tax refunds), new-product announcements at industry conferences, or financial events (quarterly earnings reports, dividend hikes, and regulatory approvals.).

10-Year Stock Seasonality Navigator
Frequency Strength
10-Year Stock Seasonality Navigator

Easy Strategy:
Buy Long-Term Calls (LEAPS)
Stock Replacement

OptionsLEAP Call Strategy
1. Sell Low-Probability Fear
– Out-of-the-money put options
2. Buy High-Probability Growth
– In-the-money call options
3. Sell Low Probability Greed
– Out-of-the-money call options

Long-Term Calls (LEAPS)Specific Trade Example (April 29th)
Stock: Occidental Petroleum (NYSE: OXY) at $97.45
Call Option: January 2016 $90 Call at $12.90 (expires in 625 days).
Upside Breakeven: $90.00 + $12.90 = $102.90, which is a 5.6% premium ($5.45 more) to current stock price of $97.45.
Cost Advantage: $1,290 vs. $9,745, or 87% less! If stock drops 30% to $68.22, max. option loss is only $1,290 (13.2%). Stock loss is $2,923 (9,745-6,822), or 127% (more than double)!
Delta: 70%, so call option increases $0.70 per $1.00 move in stock. Delta increases towards 100% by expiration.
Profit if Stock Rises to $110 at Expiration: $20/$12.90 - 1 = 55.0%, which is 42.1 percentage points higher than stock return (12.9%)!

Long-Term Calls (LEAPS)Portfolio Construction
• $200,000 Equity Portfolio. Reasonable diversification requires 20 holdings of $10,000 each
• 102 shares of OXY costs $9,940 ($102 * $97.45)
• One OXY $90 LEAP call for $1,290 gives virtually same profit potential of 102 shares for 87% less cost than $9,940.
• If all 20 stock holdings of 100-share positions could mimicked by $1,290 cost, then total equity option investment would be only $25,800, leaving $174,200 in cash.
• Maximum dollar loss of LEAP call positions is $25,800 or 13% of portfolio. Same stock upside with built-in 13% stop loss. Much less than 100% potential loss with all-stock portfolio. Stocks must rise to make money in both call option and stock scenarios.

Medium Strategy:
Put Credit Spreads
Selling Irrational Fear

OptionsPut Credit Spread Strategy
1. Sell Low-Probability Fear
– Out-of-the-money put options
2. Buy High-Probability Growth
– In-the-money call options
3. Sell Low Probability Greed
– Out-of-the-money call options

Put Credit SpreadsGenerates Income With Less Risk than
Owning Stock
Put Sellers: Obligation to buy stock at a strike price
Selling Options• Receive fixed amount of instant cash• Risk limited to width of put strikes.
Stock Price Does not Need to Rise• Maximum profit occurs if the stock does not rise or even falls a little
bit.

Put Write ETF (HVPW) vs. Buy/Write ETF (PBP)
12-20-07 to 3-9-09 (Bear Market)• SPY: -52.3%• PBP: -39.3%• ^PUT: -35.9%
4-28-13 to 4-28-14 (Bull Market)• SPY: 19.7%• PBP: 9.2%• ^PUT: 10.1%• Put-Write ETF (HVPW): 0.8%
(started trading 2-28-13)

Put Credit SpreadsSpecific Trade Example (May 2nd)
Stock: Reynolds American (NYSE: RAI) at $56.50 (Apr. 29th)
• Second-largest U.S. cigarette manufacturer (Camel, Pall Mall, Kool)• 10-Year Positive seasonality into August expiration of 90%, with single loss in 2011 of
only -2.7%.
Put Spread:
• Sell August $55 Put at $2.35 (expires in 105 days)• Buy August $50 Put at $1.00 (expires in 105 days)• Net Credit = $1.35• Potential Rate of Return = $1.35/$3.65 = 37.0 Percent• Breakeven = $53.65 ($55-$1.35)• Breakeven Discount to Current Stock Price = 8.3 Percent

Put Credit SpreadsShort Put Options Can Be Exercised Early
• Although early exercise is rare, it does happen
• Usually able to buy back put and sell longer-dated put if not ready to buy the stock (i.e., Vertical Roll)
• Buying stock at a discount from the current market price is a good thing! Can easily sell assigned stock and re-initiate new put spread.
• No margin call for involuntary early assignment because brokers know that your risk is limited to width of put spread. “Same-day substitution” rule.
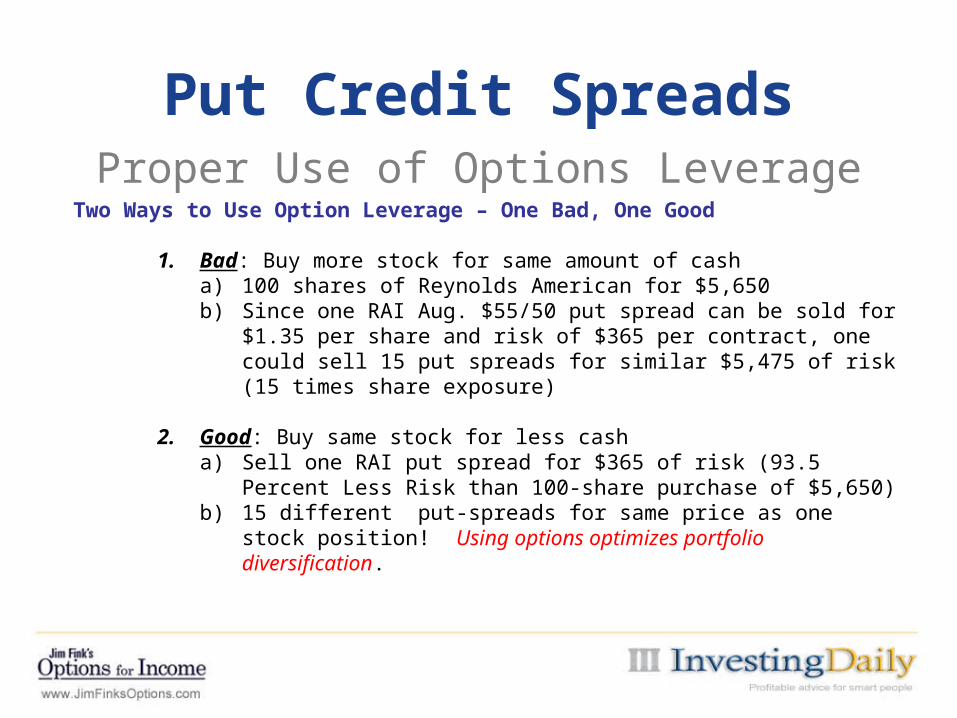
Put Credit SpreadsProper Use of Options Leverage
Two Ways to Use Option Leverage – One Bad, One Good
1. Bad: Buy more stock for same amount of casha) 100 shares of Reynolds American for $5,650b) Since one RAI Aug. $55/50 put spread can be sold for $1.35
per share and risk of $365 per contract, one could sell 15 put spreads for similar $5,475 of risk (15 times share exposure)
2. Good: Buy same stock for less casha) Sell one RAI put spread for $365 of risk (93.5 Percent Less
Risk than 100-share purchase of $5,650)b) 15 different put-spreads for same price as one stock
position! Using options optimizes portfolio diversification.

Put Credit SpreadsPortfolio Construction
• $135,000 Equity Portfolio. Reasonable diversification requires 20 holdings of $6,750 each. Expected portfolio return = 10%, or $13,500.
• 50 separate positions of two-contract put credit spreads at per-contract income of $135 and per-contract cost of $365 would yield same $13,500 income, but the total investment risk would be only $36,500 (50*2*$365), leaving $98,500 in cash.
• Maximum dollar loss of put-spread positions is $36,500 or 27.0% of portfolio. Much better than 100% potential loss on stocks. But chance of suffering maximum loss on all 50 put-spread positions is infinitesimal, whereas chance of losing 27% on stock portfolio is definitely possible.
• Probability of making $13,500 income with put spreads is much higher than buy-and-hold stocks because put spreads do not require stocks to rise.

Advanced Strategy:
Iron Condors
Selling Irrational Fear and Irrational Greed
OptionsIron Condor Strategy
1. Sell Low-Probability Fear
– Out-of-the-money put options
3. Sell Low Probability Greed
– Out-of-the-money call options

Autozone (NYSE: AZO)May 2nd–to-June Seasonality
Year Stock Return %
2013 1.1
2012 -2.8
2011 3.7
2010 5.6
2009 -4.0
2008 -7.2
2007 3.5
2006 0.5
2005 12.1
2004 1.4

Autozone (NYSE: AZO)May 2nd–to-June Seasonality
• Frequency of up or down is not important for neutral iron-condor trades.
• Magnitude of yearly moves is what counts.• Only one year out of 10 had a price move in
double-digits (12.1% in 2005). • All the nine other years saw price moves of 7.2%
or less in magnitude.• Conclusion: Choose short strikes 8% out-of-the-
money both up and down from current stock price.
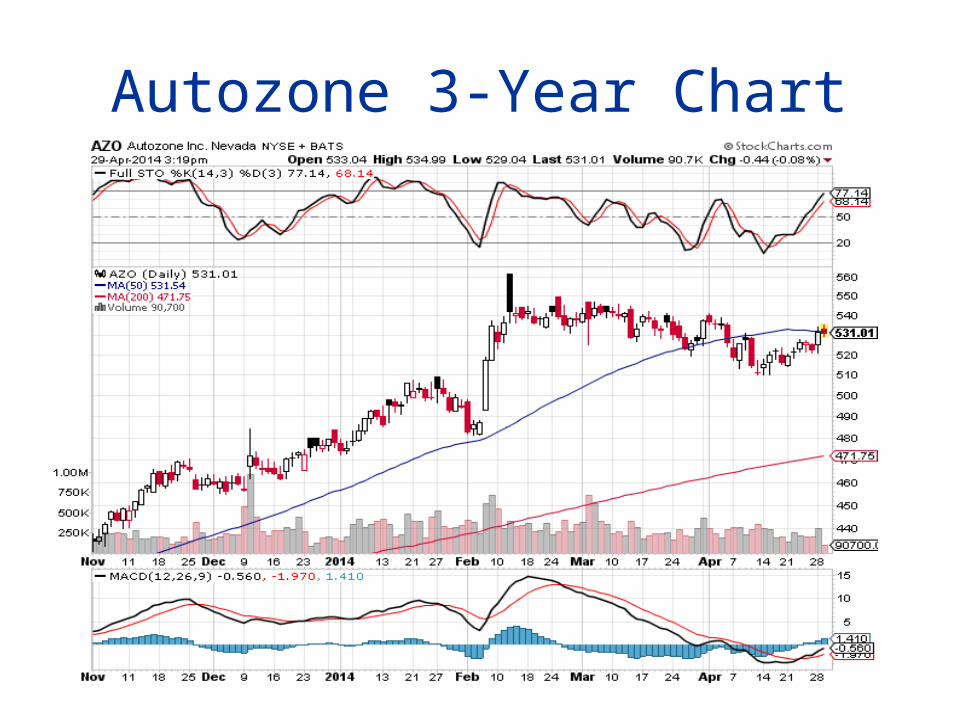
Autozone 3-Year Chart

Iron CondorSpecific Trade Example (April 28th)
Stock: Autozone (NYSE: AZO) at $531.00
Iron Condor:
• Sell June $480 Put at $3.00 (expires in 50 days)• Buy June $470 Put at $2.20 (expires in 50 days)• Sell June $570 Call at $3.00 (expires in 50 days)• Buy June $580 Call at $2.00 (expires in 50 days)• Net Credit = $1.80• Potential Rate of Return = $1.80/$8.20 = 22.0 Percent• Breakeven = $478.20 downside (9.9%), $571.80 upside (7.7%)• Maximum Profit Range = $90 wide ($480 to $570)
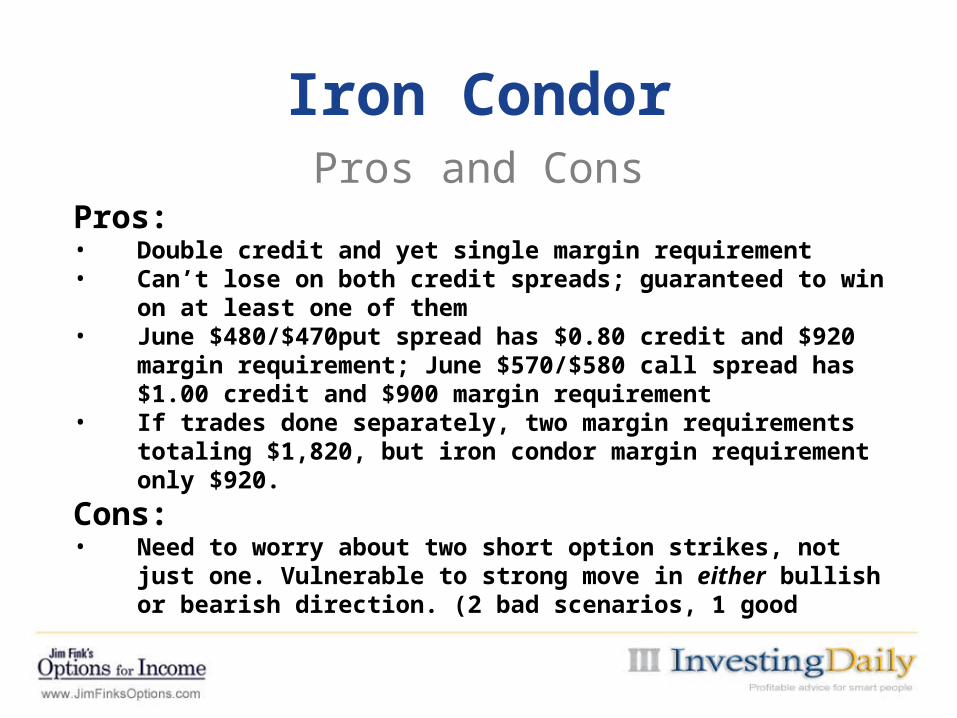
Iron CondorPros and Cons
Pros:• Double credit and yet single margin requirement• Can’t lose on both credit spreads; guaranteed to win on at least
one of them• June $480/$470put spread has $0.80 credit and $920 margin
requirement; June $570/$580 call spread has $1.00 credit and $900 margin requirement
• If trades done separately, two margin requirements totaling $1,820, but iron condor margin requirement only $920.
Cons:• Need to worry about two short option strikes, not just one.
Vulnerable to strong move in either bullish or bearish direction. (2 bad scenarios, 1 good scenario).
• Four option legs, so commission cost is heavy both initial and if roll.

Trade SummaryEasy, Medium, Advanced
Trade Examples
Long-Term Call: Buy Occidental Petroluem (NYSE: OXY) January 2016 $90 call for a debit of $12.90 or less.
Short Put Spread: Sell Reynolds American (NYSE: RAI) August $55/August $50 put spread for a net credit of $1.35 or higher.
Short Iron Condor: Sell Autozone (NYSE: AZO) June $480/$470 put spread and sell June $570/$580 call spread for a net credit of $1.80 or more.
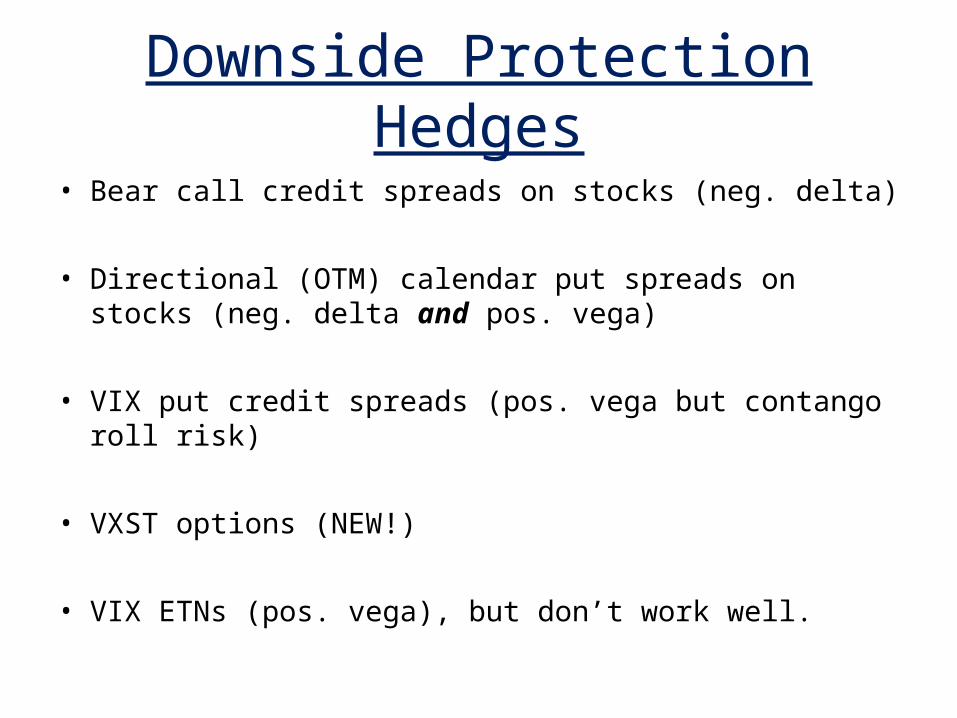
Downside Protection Hedges
• Bear call credit spreads on stocks (neg. delta)
• Directional (OTM) calendar put spreads on stocks (neg. delta and pos. vega)
• VIX put credit spreads (pos. vega but contango roll risk)
• VXST options (NEW!)
• VIX ETNs (pos. vega), but don’t work well.

How To Calculate Number of SPY Puts for Portfolio Hedge
• Divide Dollar Value of Portfolio By Index Value * 100 Multiplier
• Portfolio worth $100,000
• SPY = $188
• $100,000/($188*100) = 5.3 SPY puts

Adjust SPY Hedge By Portfolio Beta
• Beta = Correlation and magnitude of portfolio movement with S&P 500. – Perfect correlation = 1.0
• Portfolio Beta = – (Stock A % amount * stock A beta) + (Stock B %
amount * stock B beta)
• If portfolio Beta = 0.8, adjust SPY puts from 5 down to 4 (0.8*5)
• If portfolio beta = 1.8, adjust SPY puts from 5 up to 9 (1.8*5)
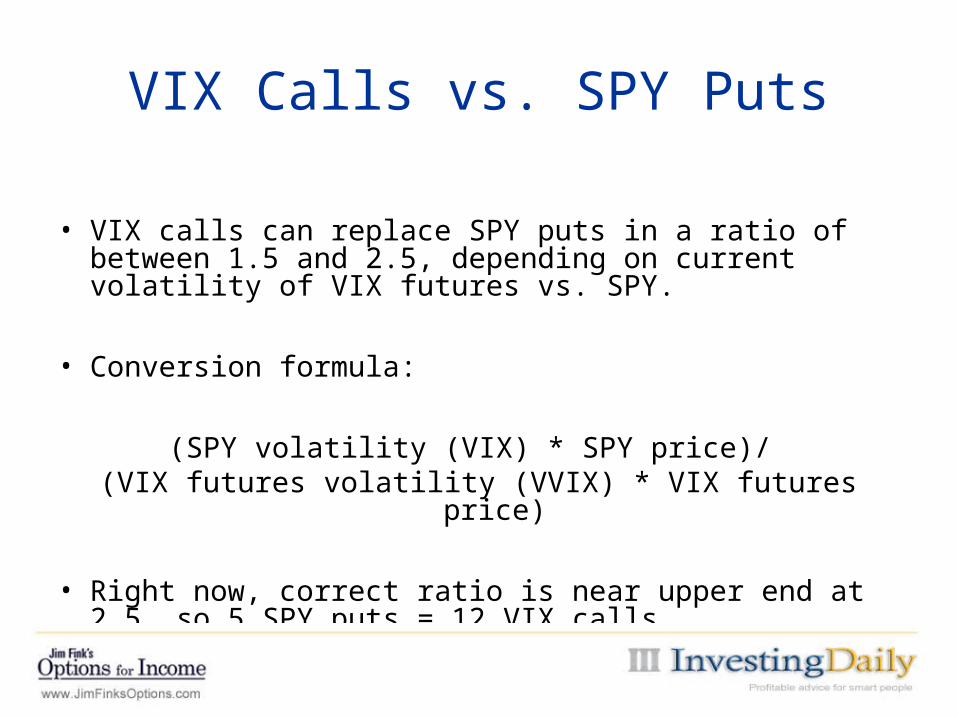
VIX Calls vs. SPY Puts
• VIX calls can replace SPY puts in a ratio of between 1.5 and 2.5, depending on current volatility of VIX futures vs. SPY.
• Conversion formula:
(SPY volatility (VIX) * SPY price)/ (VIX futures volatility (VVIX) * VIX futures price)
• Right now, correct ratio is near upper end at 2.5, so 5 SPY puts = 12 VIX calls

CBOE Short-Term Volatility Index (VXST)
• Uses weekly SPX options to calculate 9-day expected volatility – compared to the VIX’s 30-day expected volatility.
• VXST futures started trading on Feb. 13, 2014.
• VXST options started trading on Apr. 10, 2014.
• Less contango means better performance

VXST vs. VIX vs. VXX (April 2011 to April 2014)

Second-Generation Volatility ETFs
• XVIX – UBS Daily Long-Short VIX ETN – Benefits from contango– 100% long VIX mid-term futures index (VXV)– 50% short VIX short-term futures index
• XVZ – Barclays iPath Dynamic VIX ETN – Also long/short VIX futures, but changes percentages based on current
term structure– Ranges from -30% short short-term VIX/70% long mid-term VIX if steep
contango to 50% long short-term VIX/50% long mid-term VIX if inverted (backwardation)
• VIXH – First Trust VIX Tail Hedge ETF– Long S&P 500 index and buys one-month 30-delta (i.e., OTM) VIX call
options– 1% allocation to VIX calls if VIX is between 15% and 30%– ½% if VIX between 30% and 50%– 0% if VIX under 15% or over 50%

Second-Generation Volatility ETFs (Page 2)
• VQT – Barclays S&P 500 Dynamic VEQTOR ETN (SPX + VIX Futures)

Performance Comparison of VIX ETNsYear SPY XVIX XVZ VIXH VQT Outperform
SPY?
2008 -36.8% 16.4% 132.3% -19.3% 21.3% All 4 VIX ETNs
2009 26.4% 24.2% 0.7% 16.0% 24.5% None, but all positive
2010 15.1% 55.4% 20.7% 21.1% 1.7% 3 of 4 VIX ETNs
2011 1.9% -13.6% 8.8% 5.9% 16.2% 3 of 4 VIX ETNs
2012 16.0% -11.1% -18.6% 3.6% 2.6% None, but 2 of 4 positive
2013 32.3% -9.4% -26.7% 19.0% 13.0% None, but 2 of 4 positive
2014 (thru Apr. 28)
1.6% -6.2% -9.3% -0.5% -1.5% None