Embed Size (px)
Citation preview
THE OPTIMAL DISTRIBUTION OF INCOME REVISITED
By
Ray C. Fair
March 2016
COWLES FOUNDATION DISCUSSION PAPER NO. 2031
COWLES FOUNDATION FOR RESEARCH IN ECONOMICS YALE UNIVERSITY
Box 208281 New Haven, Connecticut 06520-8281
http://cowles.yale.edu/
The Optimal Distribution of IncomeRevisitedRay C. Fair∗
March 2016
Abstract
This paper revisits the optimal distribution of income model in Fair (1971).This model is the same as in Mirrlees (1971) except that education is also adecision variable and tax rates are restricted to lie on a tax function. In thecurrent paper the tax-rate restriction is relaxed. As in Fair (1971), a numericalmethod is used. The current method uses the DFP algorithm with numericderivatives. Because no analytic derivatives have to be taken, it is easy tochange assumptions and functional forms and run alternative experiments.Gini coefficients are computed, which provides a metric for comparing theredistributive effects under different assumptions. Ten optimal marginal taxrates are computed per experiment corresponding to ten tax brackets.
The sensitivity of the results to the four main assumptions of the modelare examined: 1) the form of the social welfare function that the governmentmaximizes, 2) the form of the utility function that each individual maximizes,3) the distribution of ability across individuals, and 4) the rate of return toeducation.
The changes in the Gini coefficient from before-tax income to after-taxincome for the experiments are compared to actual changes from variouscountries. Experiments using a lognormal distribution of ability match the
∗Cowles Foundation, Department of Economics, Yale University, New Haven, CT 06520-8281.e-mail: [email protected]; website: fairmodel.econ.yale.edu. Without implicating anyone, I amindebted to the following people for helpful answers to questions: Joe Altonji, Momi Dahan, PeterDiamond, Fatih Guvenen, Etienne Lehmann, Sharon Oster, Emmanuel Saez, and Danny Yagan. AFORTRAN computer program is available from the author that does all the calculations describedin this paper. This program can be used to run alternative experiments from those discussed in thispaper.
data better than those using a lognormal distribution with a Pareto tail—thereis less actual redistribution than a Pareto tail implies.
The numerical approach in this paper has advantages over the use of ana-lytic expressions. When functional forms are changed, it may be easier to runa new numerical experiment then use an analytic expression, which can becomplicated. Also, although not done in this paper, individual heterogeneityis straightforward to handle. The coding can have a different utility functionfor each individual. And different assumptions about education can be easilyincorporated. The approach also shows the problematic nature of assuminga quasi-linear utility function—a utility function with no income effects.
1 Introduction
Mirrlees’ (1971) classic paper analyzes optimal marginal tax rates and lump sum
redistribution in a setting in which the government maximizes a social welfare
function in the face of individual optimization behavior. An individual chooses his
or her labor supply to maximize utility, taking as given his or her wage rate, the
tax rates, and the lump sum transfer payment. Assumptions need to be made about
the distribution of wage rates, the form of the utility functions, and the form of the
social welfare function. The key question for Mirrlees and the large literature that
followed is how the optimal rates vary with income. In the original simulations,
Mirrlees came to two somewhat surprising conclusions: optimal tax rates may
decline at high income levels, and a constant tax rate for all incomes may be close
to optimal. But as Mirrlees himself concluded, these conclusions are sensitive to
the underlying assumptions.
In the literature since Mirrlees there is still no agreement on his first proposition.
Diamond (1998) found optimal marginal tax rates were U-shaped, but Dahan and
Strawczynski (2000) showed that this result is sensitive to replacing linear by
logarithmic utility of consumption. Mankiw, Weinzierl, and Yagan (2009) argue
that optimal marginal tax rates are likely to decline with income, whereas Diamond
and Saez (2011) argue the opposite.
2
The basic setup in Fair (1971) is the same as in Mirrlees (1971) except that edu-
cation is a decision variable and a single parameter of a tax-rate function with rising
marginal tax rates is computed (plus the lump sum transfer) rather than many un-
restricted tax rates. In Mirrlees (1971) the distribution of wage rates is exogenous,
whereas in Fair (1971) the distribution of ability is exogenous and an individual’s
wage rate depends on his or her ability and hours of education. A central focus
in Fair (1971) was on how the optimal government tax policy changes the income
distribution—Gini coefficients. The literature following Mirrlees was mostly con-
cerned with optimal tax rates, but it is straightforward after the optimization to
compute Gini coefficients or other income-distribution parameters.
In the current paper I return to this basic setup with education as a decision
variable, but relax the assumption of a tax-rate function, allowing flexibility in the
number of marginal tax rates chosen. I also use a flexible solution method—the
DFP algorithm with numeric derivatives. This requires that no analytic derivatives
be taken—unlike many papers in this literature, this paper is not filled with first-
order conditions and Lagrangians! This allows one to consider alternative cases
with only a few coding changes. One can easily examine the sensitivity of the
optimal marginal tax rates to alternative assumptions about the the social welfare
function, the individual utility functions, the ability distribution, and the returns to
education.
Regarding education, I know of no paper following Mirrlees (1971) that takes
education hours as a decision variable on a par with hours worked. The closest
to this is Chapter 7 in Tuomala (1990), but in the models in that chapter there are
no foregone earnings from education. The only cost to education is that it enters
negatively in the utility function. In Bovenberg and Jacobs (2008) education is an
investment cost but does not subtract from hours worked. Also, the government
observes education in their model. Best and Kleven (2013) examine career effects
in a two-period model in which future wages depend on current hours worked.
There is no formal education. In Fair (1971) and in the analysis below educa-
3

tion hours are not observed by the government and they subtract from total hours
available for work.
The main conclusions are as follows. Lognormal distributions of ability lead
to declining marginal tax rates at the top. Adding a Pareto tail leads to a higher
tax rate in the top bracket relative to the other brackets. As the social welfare
function weights low income individuals more, tax rates increase. There is huge
redistribution if the social welfare function is Rawlsian. Eliminating education
as a decision variable leads to higher tax rates since there are then no negative
tax-rate effects on education. As the risk aversion parameter increases in the
utility functions, which means faster declining marginal utility with income, the
tax rates increase and there is more redistribution. OECD results match best for
a risk aversion parameter between 0.75 and 1.00. Quasi-linear utility functions,
as in Diamond (1998), are too extreme to analyze unless one assumes that utility
functions of low ability individuals have a lower weight on leisure than utility
functions of high ability individuals.
2 The Model
Overview
The model is timeless. I prefer to set it up as a lifetime model rather than a model
for one year, but this is simply a matter of interpretation. There is no wealth and
no saving. An individual’s utility function is a function of after-tax income and
leisure, where leisure is total hours minus hours worked minus education hours.
Individuals choose hours of work and education hours to maximize lifetime utility,
given ability, the tax system, and the rate of return to education. The wage rate
depends on ability and education.
The government has a social welfare function (SWF) in the individual utilities
and chooses the tax system to maximize this SWF. The tax system consists of tax
4
rates by income categories. The budget constraint implies that all taxes are returned
to the individuals as lump sum transfers—each individual gets 1/n of total taxes,
where n is the number of individuals. For the numerical results below n is taken
to be 999. The tax system is used only for redistribution, although one could add
government expenditure to be financed by taxes.
General Equations
The lifetime utility function for each individual is
ui = fi(yi, T − hi − ei), i = 1, . . . , n (1)
where ui is utility, yi is after-tax income, hi is the number of hours worked, eiis the number of hours spent in education, and T is the total number of hours in
an individual’s working or education life. The wage rate for each individual is
determined by the earnings function:
wi = g(ai, ei), i = 1, . . . , n (2)
where wi is the wage rate and ai is ability. Before-tax income, y∗i , is
y∗i = wihi, i = 1, . . . , n (3)
After-tax income is
yi = y∗i − t(y∗i ) + k, i = 1, . . . , n (4)
where t(y∗i ) is the tax schedule—the amount of tax collected from an individual
with before-tax income y∗i —and k is the lump sum amount transferred to each
individual by the government. The tax schedule consists of marginal tax rates by
income category.
The social welfare function of the government is
SWF = z(u1, u2, . . . , un) (5)
5
The budget constraint of the government is
n · k =n∑i=1
t(y∗i ) (6)
The decision of the government is to choose the tax schedule to maximize SWF
subject to the budget constraint and to the fact that individuals maximize utility.
Individuals take the tax schedule and k as given and choose hi and ei to maximize
utility subject to equations (2), (3), and (4).
Solution Method
It is possible to use an algorithm like Davidon-Fletcher-Powell (DFP)—Davidon
(1959) and Fletcher and Powell (1963)—and numeric derivatives to solve many
nonlinear optimization problems. I have used it in Fair (1974) to solve large
optimal control problems, of up to 239 control variables. This procedure—DFP
with numeric derivatives—is used in this paper. The advantage of using numeric
derivatives is that no analytic derivatives have to be taken, which makes it trivial
to change functional forms and reoptimize. Given the sensitivity of results to
functional forms, this feature of the method is very useful.
The overall solution is as follows. There are two decision variables per
individual—hi and ei—and n optimization problems in total, one per individ-
ual. This is n uses of the DFP algorithm. Call this the “level 1” solution. The
decision variables of the government are the marginal tax rates in the tax schedule,
say 10 of them. The DFP algorithm is also used to find the optimal marginal tax
rates, subject to the budget constraint (6). Call this the “level 2” solution.
The use of the DFP algorithm with numeric derivatives simply requires that a
program (subroutine) be written that computes the value of the objective function
for given set of values of the decision variables. For the level 1 solution for a given
individual i, the subroutine computes ui for given values of hi and ei, conditional
on the tax schedule and k. This is all the DFP algorithm needs to find the optimal
6
values of hi and ei, given ai and the utility functions. Function evaluations are
used in computing the numeric derivatives and in the search process.
The function evaluation for the level 2 solution is a little more involved. It
computes SWF for a given tax schedule. Embedded in this evaluation is the
level 1 solution, which requires n uses of the DFP algorithm. The complication
for the level 2 solution is that for a given tax schedule, the lump sum transfer k
requires the n values of hi and ei, but the optimal values of the hi’s and ei’s depend
on k. An iterative technique was used to solve this problem. Initial values of hi and
ei were used to compute k (given a tax schedule); the n uses of the DFP algorithm
were used to compute the level 1 solution; k was recomputed using the computed
values of hi and ei; the level 1 solution was computed again; etc. The process
was stopped when the difference between successive values of k was within a
prescribed tolerance level. At the stopping point optimal values of hi and ei have
been computed for the given tax schedule (within the tolerance level of the budget
constraint), from which the values of ui can be computed and thus SWF . This
is one function evaluation for the level 2 solution, which is all the DFP algorithm
needs. The level 2 solution yields optimal values of the marginal tax rates (and k).
Specific Equations for the Base Case
Given the above setup, it should be clear that it is easy to use alternative functional
forms. Each change just requires a different line of code. The following is the
base-line specification.
Working or education years are assumed to between the ages of 18 and 70 (53
years). Sleep requirements are assumed to be 8 hours per day, so the total number
of non-sleep hours (T ) is 53× 365.25× 16 = 309, 732., which is rounded to 300
thousand hours. A year of education is assumed to take 8 hours per day times 20
days per month times 12 months = 1,920 hours, which is rounded to 2 thousand
hours.
In the base case, ability ai is assumed to be log normally distributed with mean
7
log(25) and standard deviation 0.5. The wage function is
logwi = log ai + ρ log(ei2+ 1) (7)
If ei = 0, then the wage rate is just equal to the ability value. The wage rate is in
units of dollars per hour. The rate of return to education, ρ, is taken to be 0.12. A
year of education (2 thousand hours) increases wi by 12 percent.
If an individual works 8 hours a day, 20 days a month, 12 months a year for
53 years, this is 101.760 thousand hours, which is rounded to 100 thousand hours.
At a wage rate of $25 per hour, this is lifetime before-tax income of $2.5 million
dollars, or an average of about $47 thousand per year. The parameter β in the
utility function presented next was chosen to have the optimal values of hi be in
the ball park of 100 thousand hours.
The base-case utility function is taken to be logarithmic in after-tax income
and leisure:
ui = log yi + β log(T − hi − ei) (8)
whereβ is taken to be 2.0. This is a constant relative risk aversion (CRRA) function,
with risk aversion parameter of 1.0. It will be denoted CRRA (1.00).
The social welfare function is postulated to be:
SWF =n∑i=1
log ui (9)
If the government could chose utility for each individual with no constraints, the
optimum would be complete equality of utility.
If taxes were proportional, the tax function would be:
t(y∗i ) = t1y∗i , i = 1, . . . , n (10)
where t1 is the proportional tax rate. If instead, say, 10 tax rates were chosen, there
would be 10 brackets: b1 − 0, b2 − b1, . . ., b10 − b9, where b10 is larger than the
income of any individual. The choice of brackets is discussed below.
8
Robustness Options
As noted above, it is easy to change assumptions and reoptimize. Some of the
options are as follows.
• Different utility functions can be used, including having the parameters of the
function differ by individual. Four other CRRA functions are considered be-
low, with risk aversion parameters of 0.50, 0.75, 1.25,and 1.50 respectively.
These are CRRA (0.50), CRRA (0.75), CRRA (1.25), and CRRA (1.50)
respectively.
• Different distributions of ai can be used. Two other distributions are con-
sidered below: a lognormal distribution with a standard deviation of 0.6
rather than 0.5, and a Pareto tail with parameter 1.5 spliced to the lognormal
distribution with standard deviation 0.5 at the 95th percentile.
• For education, different values of ρ can be used. Also, a different wage
function can be used, and education can be dropped from the model. The
case of no education is considered below.
• Different tax brackets can be used, including more or fewer than 10. For each
set of the other assumptions, two cases are considered below: 1) one pro-
portional tax and 2) 10 tax brackets. The choice of the brackets is explained
below.
• A different SWF can be used, for example the sum of utilities instead of
the sum of the log of utilities and a Rawlsian utility function. Both of these
functions are considered below. Also considered is a SWF that excludes the
top 10 percent of income earners.
9
Gini Coefficients
Although the literature following Mirrlees (1971) has not focused on the opti-
mal income distribution, it is straightforward to compute Gini coefficients once a
solution has been obtained. The two Gini coefficients of interest are the one corre-
sponding to before-tax income, y∗i , and the one corresponding to after-tax income,
yi. These will be denoted g∗ and g respectively. It is of interest to see how much
the Gini coefficient is lowered by the government’s tax policy. Note that the Gini
coefficients as is usual are in income, not utility. As a result, g is not a decision
variable of the government but a result of its policy.
Returns to Education
As noted above, the return to a year of education has been taken to be 12 percent.
This number can, of course, be changed for the calculations. From Table 5 in
Card’s (1999) survey article, a return of 10 percent seems roughly consistent with
the literature. Since the present analysis pertains to lifetime variables, I have chosen
to use a slightly higher return of 12 percent.
In Fair (1971) nine earnings functions were postulated, given data at the time,
where an individual’s productivity depended on his or her ability and education.
These functions were then approximated by a polynomial function to get an earn-
ings function. In this work the effect of education on an individual’s productivity
depended positively on his or her ability. In the present paper the earnings function
is simpler, and the return to education in percent terms does not vary with ability.
Note that no cost to education has been built into the model except foregone
earnings. Such costs could be added, but it is unlikely that this would make much
difference to the analysis.
10
The Utility Functions
The log function in (8) has the feature that if income is all wage income, an
uncompensated change in the wage rate has no effect on hours worked. If, however,
part of income is nonwage income, the number of hours worked does depend on
the wage rate. Consider (8) where there is no ei and yi = (1 − t1)wihi + k,
where t1 is the proportional tax rate and k is a lump sum transfer (exogenous to
the individual). Then taking the derivative of ui with respect to hi and setting it
equal to zero yields optimal hours, h∗i :
h∗i =T
1 + β− k
(1 + β)(1− t1)wi(11)
The derivative of h∗i with respect to t1 is − k(1+β)(1−t1)2wi
, which is negative. So an
increase in the tax rate lowers hours worked. The derivative of h∗i with respect to k
is − 1(1+β)(1−t1)wi
, which is also negative. So an increase in the lump sum transfer
also lowers hours worked.
The other two utility functions have the form:
ui =y1−θi
1− θ+ β
(T − hi − ei)1−γ
1− γ(12)
where θ and γ are coefficients of relative risk aversion. This equation reduces to
(8) when θ and γ are one. For CRRA (0.50), θ and γ are 0.50; for CRRA (0.75),
they are 0.75; for CRRA (1.25), they are 1.25; and for CRRA (1.50), they are 1.50.
The larger is θ, the faster does marginal utility decrease with income. The values of
β chosen for these four functions are 7.071, 3.76, 1.0636, and 0.566, respectively.
These values were chosen to have the optimal values of hi for the median ability
individual (i = 500) be in the ball park of 100.
When there are no taxes (and no lump sum) and the utility function is CRRA
(1.00), everyone works the same amount and has the same amount of education.
As θ and γ deviate from 1.00 in either direction, the range of hours worked and
education across ability gets wider. When they are less than one, higher ability
11
individuals work more and get more education, and vice versa when they are
greater than one. A wide range of hours worked and education is problematic for
the numerical procedure used in this paper, and 0.50 and 1.50 are about the limits
of what can be computed. For example, for CRRA (0.50), lognormal (0.5), SWF
the sum of the log of utilities, education in, and no taxes, the bottom ability person
works 31 hours and the top ability person works 198 hours. The education hours
are 1.7 versus 27.2. The ratio of income for the top to the bottom is 182. This
compares to 21.98 for CRRA (1.00). Smaller differences in behavior could be
achieved by having the utility functions differ by ability, although it is somewhat
arbitrary as to how this is specified. For purposes of this paper, the same utility
function has been used for all, with risk aversion parameters outside the range of
0.50 and 1.50 not used. Comments about quasi-linear utility functions are made
at the end of Section 3.
The Social Welfare Functions
Maximizing the SWF in (9) is equivalent to maximizing the product of utilities.
Another option is simply to maximize the sum:
SWF =n∑i=1
ui (13)
Another option is the Rawls case, where the utility of the lowest ability individual
is maximized:
SWF = u1 (14)
A fourth SWF was also used, which is (9) except that the top 10 percent of the
individuals are not counted. The summation is from 1 to .9n.
The Tax Brackets
The tax brackets were chosen to correspond to roughly 10 percent of the population
in each bracket. For each set of assumptions (each table below), the optimal
12
proportional tax rate was first computed (t1), i.e., just one tax rate. For this run
the 999 individuals were ranked by before-tax income, and the 10 brackets were
chosen by picking the income of individual 100 to end the first bracket, the income
of individual 200 to end the second, up to the income of individual 900 to end the
ninth. The top income for the tenth bracket was taken to be in effect infinite. The
marginal tax rates are thus roughly for the first decile, the second decile, and so
on.
A Note on the DFP Algorithms
The fact that the overall DFP algorithm requires the use of another DFP algorithm
to compute the objective function leads to some accuracy issues when numeric
derivatives are used. In some cases, especially when 10 tax rates are computed,
the objective function is fairly flat, and some of the results were sensitive to starting
points. The general pattern of the optimal marginal tax rates by income was not
sensitive, but the accuracy to three, and sometimes two, decimal points was. For
each run I tried a number of starting points and chose the one that led to the
largest value of the objective function. I don’t think any of the main points below
are affected by these accuracy issues. Remember, however, that the numerical
procedure is limited to considering values of the risk aversion parameter between
about 0.50 and 1.50.
Top and Bottom Tax Rates
The question of whether the optimal marginal tax rate is zero for the lowest and
highest income individuals is not an issue in this paper because of the use of
brackets. There is no one tax rate for the highest income individual, nor for the
lowest income individual. Also, for some of the experiments the lowest income
individual does not work.
13
3 The Results
There are a large number of options that can be run. With say 3 utility functions, 3
distributions of ai, education or no education, 2 tax schedules, and 4 social welfare
functions, there are 72 runs. There is also considerable output per run. For each run
there are 999 values for each variable pertaining to an individual plus the tax-rate
values and the Gini coefficients.
Before considering the results in detail, it will be useful to present a summary
of the sensitivity of the optimal marginal tax rates to the various assumptions. This
is done in Table 1. t1 is the tax rate when there is only one tax parameter, and t10/t5is the ratio of the 90th percentile marginal tax rate to the 50th percent marginal
tax rate when 10 tax rates are computed. Part I of the table shows that as the risk
aversion parameter increases, the overall tax rate increases, as does the ratio of
the top rate to the 50th percentile rate. As the risk aversion parameter increases,
marginal utility decreases faster with income, which encourages redistribution.
Part II of Table 1 shows that as the ability distribution becomes more skewed
to the right, the higher is the overall tax rate and the ratio of the top rate to the 50th
percentile rate. For the lognormal distributions the ratio is less than one, but for
the Pareto tail the ratio is considerably above one. This result is consistent with
the results in Mankiw, Weinzierl, and Yagan (2009). For all the runs in this study,
the top rate was lower than the other rates when a lognormal distribution was used
and higher when the Pareto tail was used.
Part III of Table 1 shows that as the SWF weights low income individuals more,
the overall tax rate rises, as does the ratio. As expected, when the top 10 percent
are excluded from the SWF, they are taxed more. The Rawls case leads to a very
high tax rate. Although not shown in the table, for the Rawls case 130 individuals
do not work, and 223 individuals do not take any education.
14
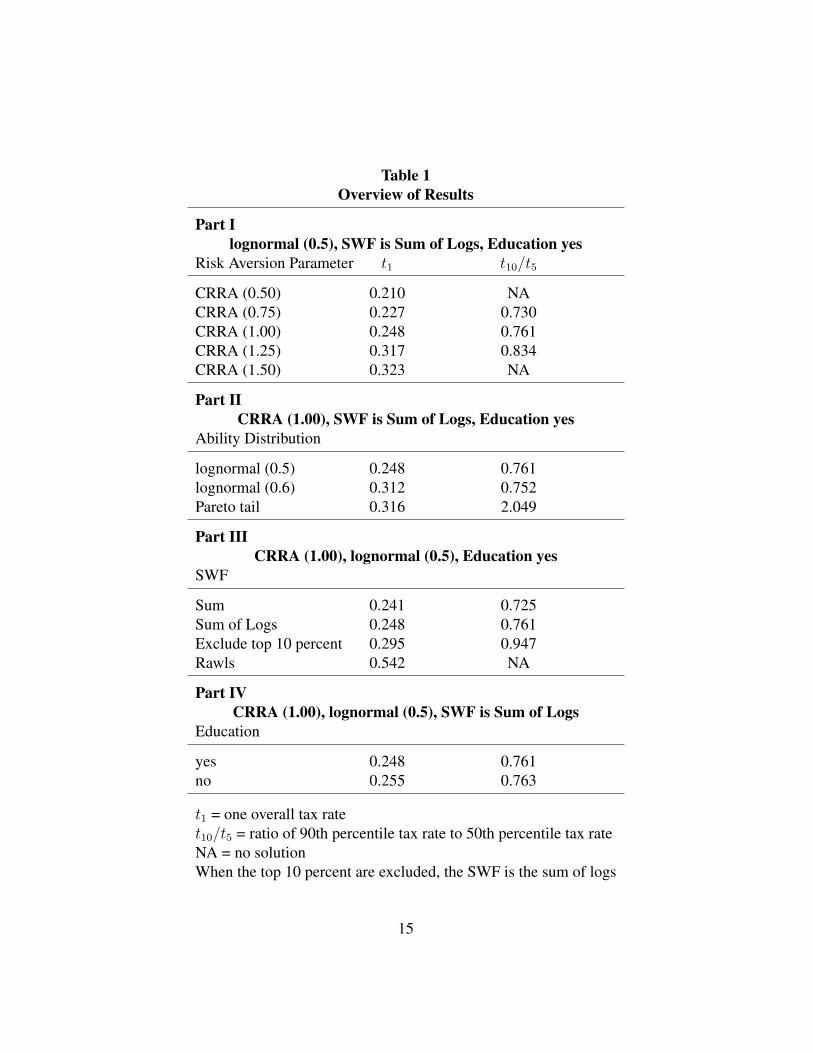
Table 1Overview of Results
Part Ilognormal (0.5), SWF is Sum of Logs, Education yes
Risk Aversion Parameter t1 t10/t5
CRRA (0.50) 0.210 NACRRA (0.75) 0.227 0.730CRRA (1.00) 0.248 0.761CRRA (1.25) 0.317 0.834CRRA (1.50) 0.323 NA
Part IICRRA (1.00), SWF is Sum of Logs, Education yes
Ability Distribution
lognormal (0.5) 0.248 0.761lognormal (0.6) 0.312 0.752Pareto tail 0.316 2.049
Part IIICRRA (1.00), lognormal (0.5), Education yes
SWF
Sum 0.241 0.725Sum of Logs 0.248 0.761Exclude top 10 percent 0.295 0.947Rawls 0.542 NA
Part IVCRRA (1.00), lognormal (0.5), SWF is Sum of Logs
Education
yes 0.248 0.761no 0.255 0.763
t1 = one overall tax ratet10/t5 = ratio of 90th percentile tax rate to 50th percentile tax rateNA = no solutionWhen the top 10 percent are excluded, the SWF is the sum of logs
15
Finally, Part IV of Table 1 shows the effects of education. When education
is not a decision variable, the overall tax rate is higher, as is the ratio. This is as
expected, since with no education possibilities there is one less way for individuals
to respond to tax changes—one less disincentive.
I now turn to a more detailed examination of the results. Twelve runs are
discussed, the first six using tables. The results reported in the tables for each
run are the two Gini coefficients, g and g∗; the 10 marginal tax values, t1, . . . , t10;
the ratio of the lump sum transfer to median before-tax income, k/y∗500; the first
individual for whom h is not zero, #h; h for individuals 25, 500, and 975, h25,
h500, and h975; the same four variables for e, #e, e25, e500, and e975; the ratio of the
ability of the top individual to that of the bottom individual, a999/a1; and the same
for after-tax income and utility, y999/y1 and u999/u1.
For ease of discussion, individuals in the bottom 10 percent of the ability
distribution well be called “poor,” and those in the top 10 percent will be called
“rich”.
Lognormal (0.5), CRRA (1.00)
Table 2 contains the results for the base case: lognormal distribution with standard
deviation of 0.5, CRRA (1.00), and SWF as the sum of the log of the utilities.
Column (1) is the run with no taxes and transfers; column (2) is the column for
one tax rate; and column (3) is for 10 marginal tax rates.
In column (1), with no taxes, everyone works the same number of hours and
has the same number of hours of education—h = 96.8 and e = 9.6. The ratio of
the ability of the top individual to the bottom is 21.98. In column (2), with one tax
rate, the rate is 0.248 and the ratio of the lump sum transfer to median before-tax
income is 0.289. Hours worked increases with ability, as does education. The
bottom 2 individuals do not work, and the bottom 6 do not choose any education.
16
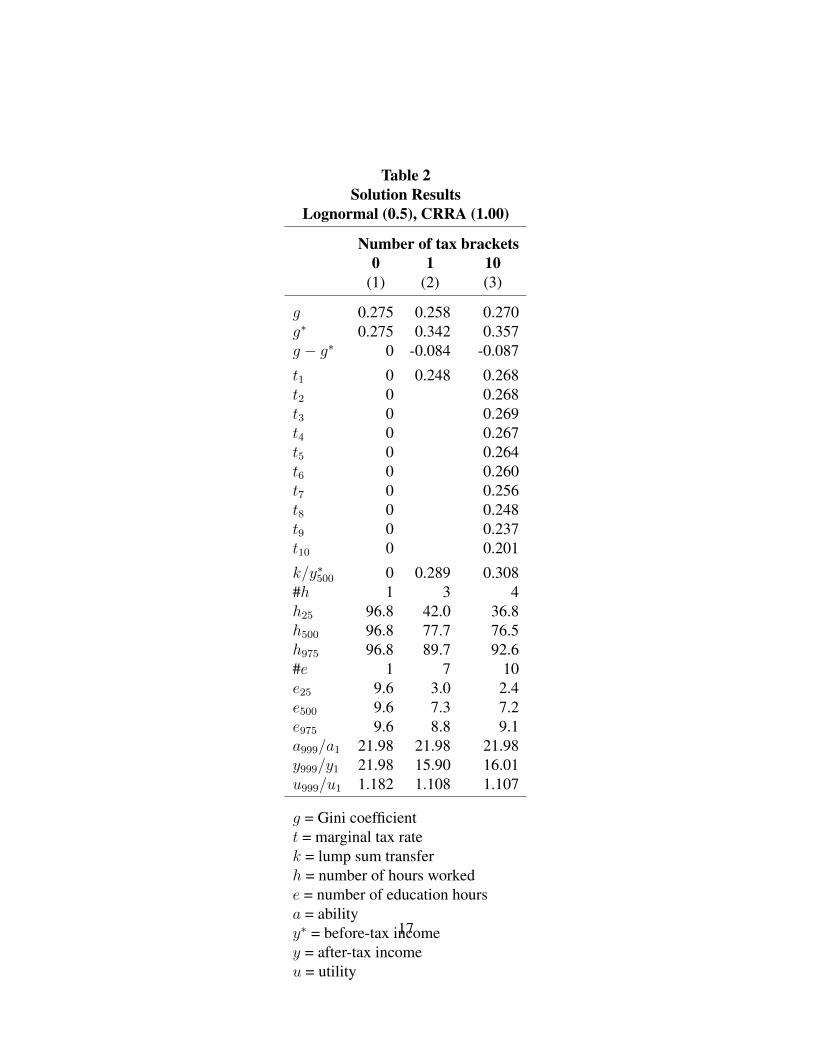
Table 2Solution Results
Lognormal (0.5), CRRA (1.00)
Number of tax brackets0 1 10
(1) (2) (3)
g 0.275 0.258 0.270g∗ 0.275 0.342 0.357g − g∗ 0 -0.084 -0.087
t1 0 0.248 0.268t2 0 0.268t3 0 0.269t4 0 0.267t5 0 0.264t6 0 0.260t7 0 0.256t8 0 0.248t9 0 0.237t10 0 0.201
k/y∗500 0 0.289 0.308#h 1 3 4h25 96.8 42.0 36.8h500 96.8 77.7 76.5h975 96.8 89.7 92.6#e 1 7 10e25 9.6 3.0 2.4e500 9.6 7.3 7.2e975 9.6 8.8 9.1a999/a1 21.98 21.98 21.98y999/y1 21.98 15.90 16.01u999/u1 1.182 1.108 1.107
g = Gini coefficientt = marginal tax ratek = lump sum transferh = number of hours workede = number of education hoursa = abilityy∗ = before-tax incomey = after-tax incomeu = utility
17
In column (3), with 10 tax rates, the tax rates are higher than 0.248 for the
bottom 70 percent and lower for the top 20 percent. The lump sum transfer is
slightly higher than in column (2). Compared to column (2), the poor work less
because of the higher tax rates and higher transfer, and the rich work more because
of the lower tax rate. The poor educate themselves less, and the rich educate
themselves more. In column (3) the Gini coefficient falls by 0.087, from 0.357 for
before-tax income to 0.270 for after-tax income.
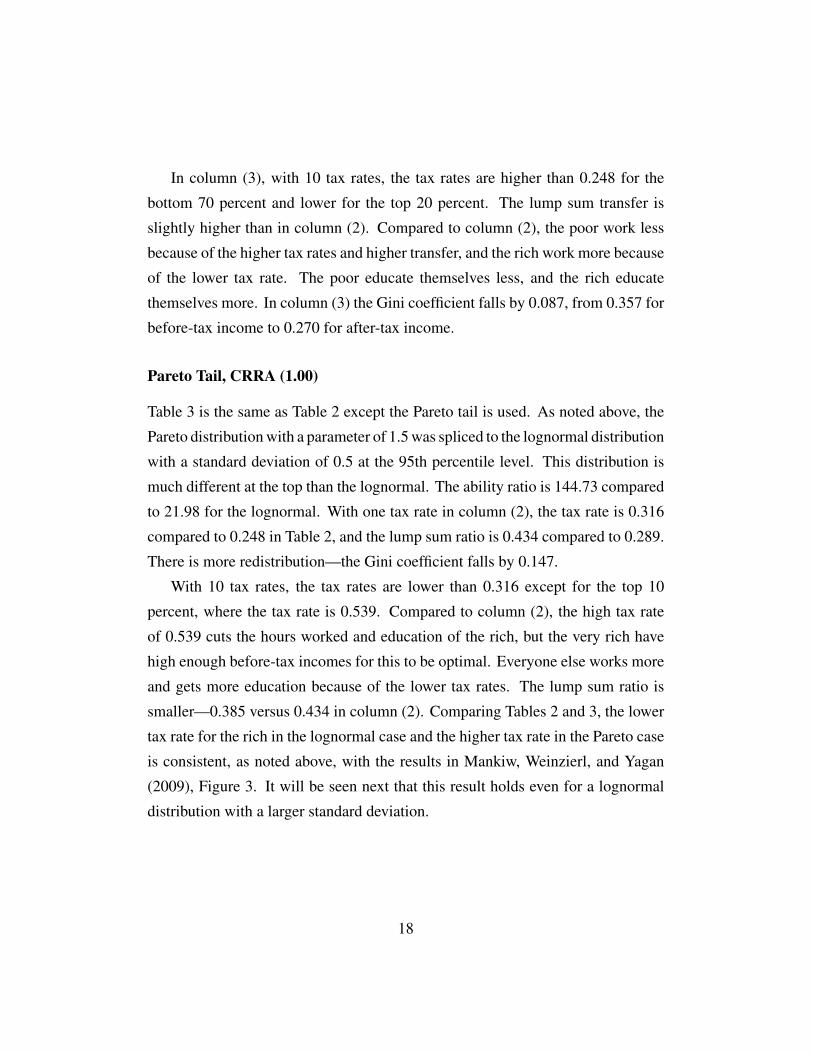
Pareto Tail, CRRA (1.00)
Table 3 is the same as Table 2 except the Pareto tail is used. As noted above, the
Pareto distribution with a parameter of 1.5 was spliced to the lognormal distribution
with a standard deviation of 0.5 at the 95th percentile level. This distribution is
much different at the top than the lognormal. The ability ratio is 144.73 compared
to 21.98 for the lognormal. With one tax rate in column (2), the tax rate is 0.316
compared to 0.248 in Table 2, and the lump sum ratio is 0.434 compared to 0.289.
There is more redistribution—the Gini coefficient falls by 0.147.
With 10 tax rates, the tax rates are lower than 0.316 except for the top 10
percent, where the tax rate is 0.539. Compared to column (2), the high tax rate
of 0.539 cuts the hours worked and education of the rich, but the very rich have
high enough before-tax incomes for this to be optimal. Everyone else works more
and gets more education because of the lower tax rates. The lump sum ratio is
smaller—0.385 versus 0.434 in column (2). Comparing Tables 2 and 3, the lower
tax rate for the rich in the lognormal case and the higher tax rate in the Pareto case
is consistent, as noted above, with the results in Mankiw, Weinzierl, and Yagan
(2009), Figure 3. It will be seen next that this result holds even for a lognormal
distribution with a larger standard deviation.
18
Table 3Solution Results
Pareto Tail, CRRA (1.00)
Number of tax brackets0 1 10
(1) (2) (3)
g 0.346 0.320 0.273g∗ 0.346 0.467 0.421g − g∗ 0 -0.147 -0.148
t1 0 0.316 0.257t2 0 0.265t3 0 0.266t4 0 0.266t5 0 0.263t6 0 0.261t7 0 0.257t8 0 0.251t9 0 0.242t10 0 0.539
k/y∗500 0 0.434 0.385#h 1 17 9h25 96.8 8.2 23.1h500 96.8 68.8 72.7h975 96.8 89.3 68.5#e 1 40 21e25 9.6 0.0 0.8e500 9.6 6.3 6.7e975 9.6 8.7 6.2a999/a1 144.73 144.73 144.73y999/y1 144.73 71.59 51.74u999/u1 1.293 1.187 1.171
See notes to Table 2
19
Lognormal (0.6), CRRA (1.00)
Table 4 is the same as Table 2 except the standard deviation of the lognormal
distribution is 0.6 rather than 0.5. The ability ratio is 40.78 versus 21.98 for 0.5.
This is still, however, much lower than the ratio of 144.73 for the Pareto case.
The tax rates are higher in Table 4 versus Table 2, as are the lump sum transfers.
However, it is still the case that the tax rates fall for the upper part of the distribution.
The general story is the same in Table 4 as in Table 2, but with more redistribution.
Lognormal (0.5), CRRA (0.75)
Table 5 is the same as Table 2 except that the utility function is CRRA (0.75). For
this utility function compared to CRRA (1.00), marginal utility decreases less with
income. With no taxes and transfers in column (1), hours worked and education
increase with ability. Higher ability individuals work more than they do in Table
2 because their marginal utility does not decrease as much as they earn more
income. Because of this, in column (1) the ratio of the top and bottom income is
45.90 compared to 21.98 in Table 2 where everyone works and educates themselves
the same. As in Table 2, the tax rates are lower in column (3) at the higher incomes
relative to the lower incomes. Overall, the tax rates are lower in Table 5 than in
Table 2. Because marginal utility declines less with income than in Table 2, the
optimum is for there to be less redistribution from the top incomes to the bottom.
Lognormal (0.5), CRRA (1.25)
Table 6 is the same as Table 2 except that the utility function is CRRA (1.25). In
this case marginal utility decreases more with income. With no taxes and transfers
in column (1) hours worked and education decrease with ability. The ratio of
the top and bottom income is 14.12 compared to 21.98 in Table 2. The tax rates
are higher in Table 6 versus Table 2. The optimum is now for there to be more
redistribution from the top incomes to the bottom. However, the tax rate at the
20
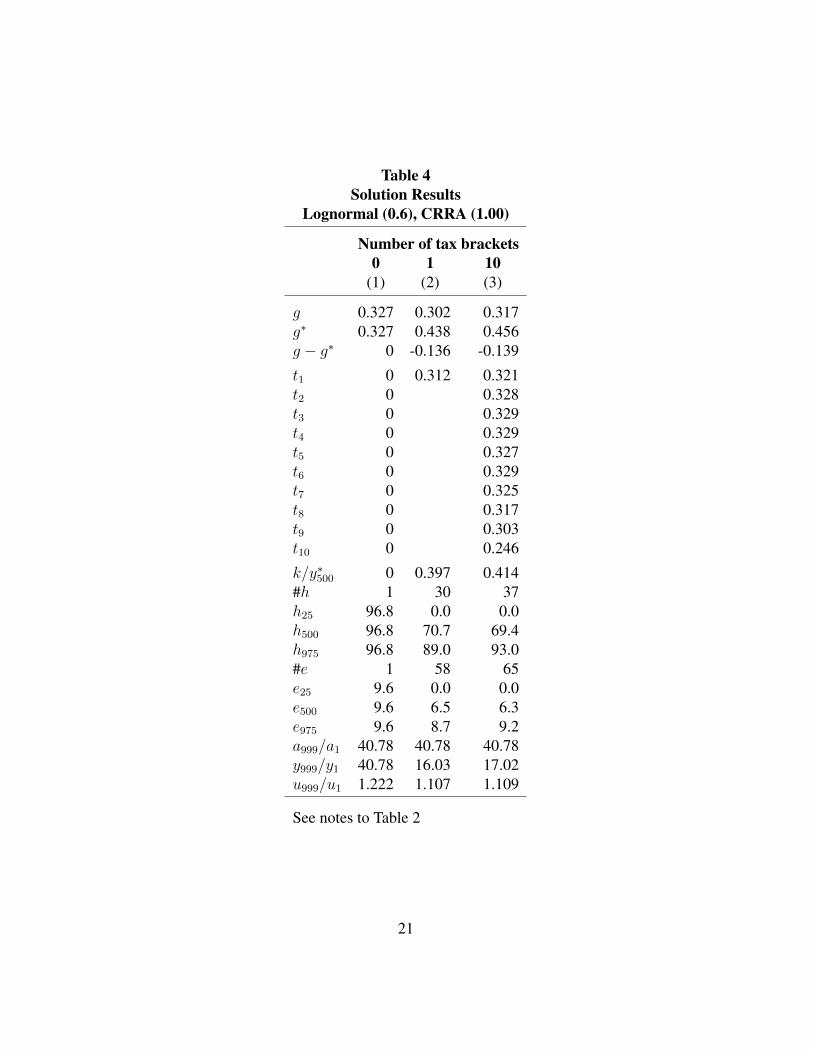
Table 4Solution Results
Lognormal (0.6), CRRA (1.00)
Number of tax brackets0 1 10
(1) (2) (3)
g 0.327 0.302 0.317g∗ 0.327 0.438 0.456g − g∗ 0 -0.136 -0.139
t1 0 0.312 0.321t2 0 0.328t3 0 0.329t4 0 0.329t5 0 0.327t6 0 0.329t7 0 0.325t8 0 0.317t9 0 0.303t10 0 0.246
k/y∗500 0 0.397 0.414#h 1 30 37h25 96.8 0.0 0.0h500 96.8 70.7 69.4h975 96.8 89.0 93.0#e 1 58 65e25 9.6 0.0 0.0e500 9.6 6.5 6.3e975 9.6 8.7 9.2a999/a1 40.78 40.78 40.78y999/y1 40.78 16.03 17.02u999/u1 1.222 1.107 1.109
See notes to Table 2
21
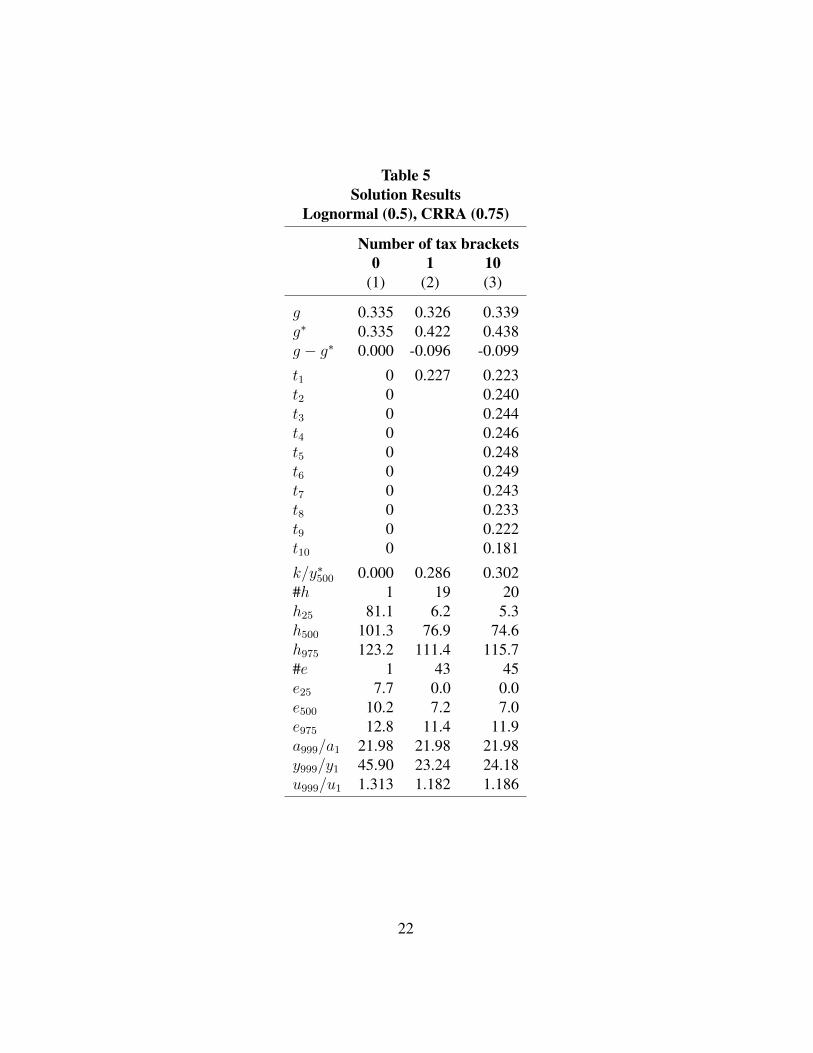
Table 5Solution Results
Lognormal (0.5), CRRA (0.75)
Number of tax brackets0 1 10
(1) (2) (3)
g 0.335 0.326 0.339g∗ 0.335 0.422 0.438g − g∗ 0.000 -0.096 -0.099
t1 0 0.227 0.223t2 0 0.240t3 0 0.244t4 0 0.246t5 0 0.248t6 0 0.249t7 0 0.243t8 0 0.233t9 0 0.222t10 0 0.181
k/y∗500 0.000 0.286 0.302#h 1 19 20h25 81.1 6.2 5.3h500 101.3 76.9 74.6h975 123.2 111.4 115.7#e 1 43 45e25 7.7 0.0 0.0e500 10.2 7.2 7.0e975 12.8 11.4 11.9a999/a1 21.98 21.98 21.98y999/y1 45.90 23.24 24.18u999/u1 1.313 1.182 1.186
22
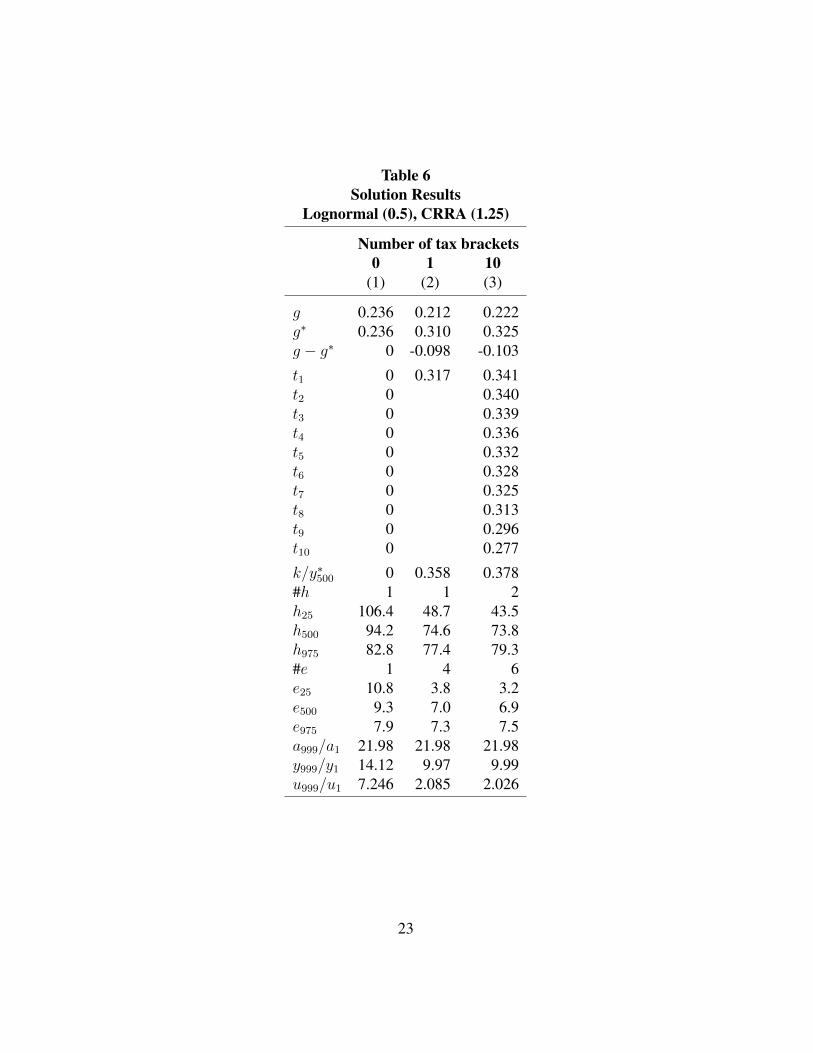
Table 6Solution Results
Lognormal (0.5), CRRA (1.25)
Number of tax brackets0 1 10
(1) (2) (3)
g 0.236 0.212 0.222g∗ 0.236 0.310 0.325g − g∗ 0 -0.098 -0.103
t1 0 0.317 0.341t2 0 0.340t3 0 0.339t4 0 0.336t5 0 0.332t6 0 0.328t7 0 0.325t8 0 0.313t9 0 0.296t10 0 0.277
k/y∗500 0 0.358 0.378#h 1 1 2h25 106.4 48.7 43.5h500 94.2 74.6 73.8h975 82.8 77.4 79.3#e 1 4 6e25 10.8 3.8 3.2e500 9.3 7.0 6.9e975 7.9 7.3 7.5a999/a1 21.98 21.98 21.98y999/y1 14.12 9.97 9.99u999/u1 7.246 2.085 2.026
23
top income bracket in column (3) is still lower compared to the other tax rates in
column (3).
So, as expected, the results in Table 2 are in between those in Table 5 and 6.
Lognormal (0.5), CRRA (1.00), No Education
Table 7 is the same as Table 2 except there is no education. Except for t1 in column
(3), the tax rates are higher in Table 7 than in Table 2, and the lump sum transfers
are slightly higher. There is a little more redistribution. This is as expected, since,
as noted above, with no education possibilities there is one less way for individuals
to respond to tax changes.
Some other runs that were computed are as follows. Tables are not presented
to save space.
Pareto Tail, CRRA (0.75)
Comparing this run with Table 3 is similar to comparing Table 5 with Table 2. The
tax rates are generally lower and there is more redistribution. The change in the
Ginis is -0.196 versus -0.148 in Table 3. The tax rate for the top 10 percent is
higher than all the other tax rates, as in Table 3—0.542 versus a range of 0.203 to
0.271 for the others.1 As in Table 3, the rich work more than the poor, and when
there are no taxes and transfers the ratio of the top income to the bottom is 393.72!
The bottom 76 (out of 999) do not work, and the bottom 135 do not choose any
education.1For this case only 9 tax rates were computed, with the first bracket beginning with the income of
the 20th percentile individual. There are too few working in the bottom 10 percent to get meaningfulresults.
24
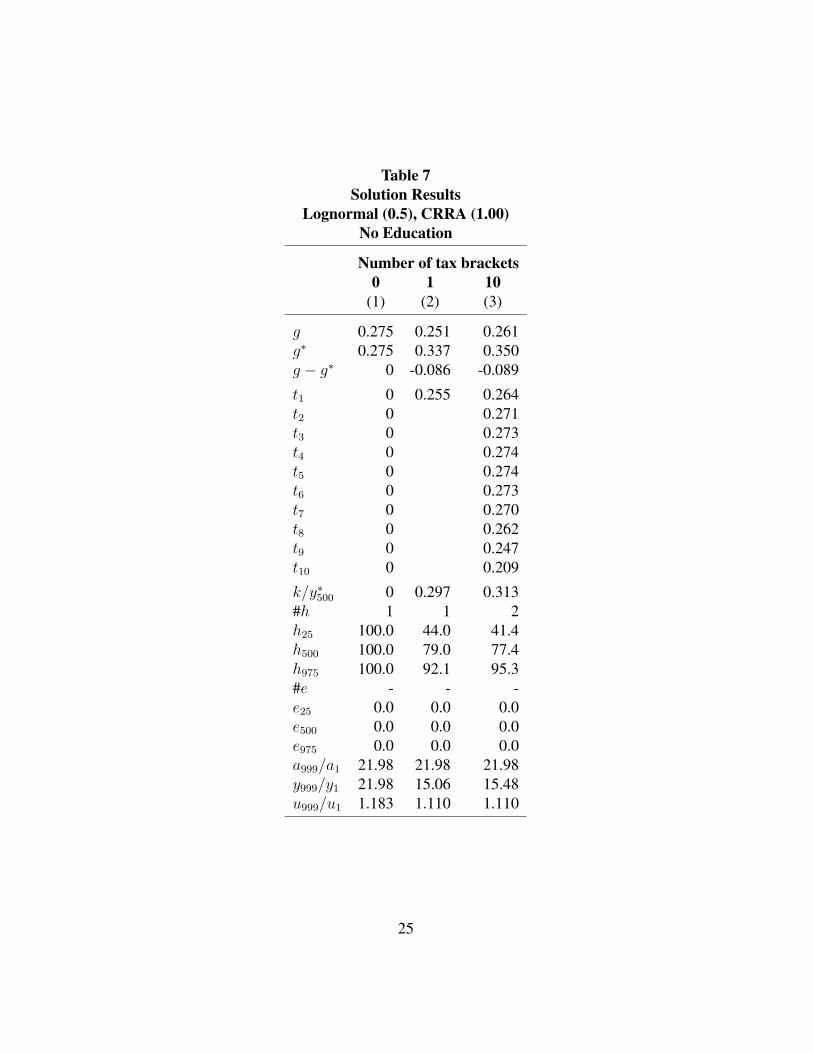
Table 7Solution Results
Lognormal (0.5), CRRA (1.00)No Education
Number of tax brackets0 1 10
(1) (2) (3)
g 0.275 0.251 0.261g∗ 0.275 0.337 0.350g − g∗ 0 -0.086 -0.089
t1 0 0.255 0.264t2 0 0.271t3 0 0.273t4 0 0.274t5 0 0.274t6 0 0.273t7 0 0.270t8 0 0.262t9 0 0.247t10 0 0.209
k/y∗500 0 0.297 0.313#h 1 1 2h25 100.0 44.0 41.4h500 100.0 79.0 77.4h975 100.0 92.1 95.3#e - - -e25 0.0 0.0 0.0e500 0.0 0.0 0.0e975 0.0 0.0 0.0a999/a1 21.98 21.98 21.98y999/y1 21.98 15.06 15.48u999/u1 1.183 1.110 1.110
25
Pareto Tail, CRRA (1.25)
Comparing this run with Table 3 is similar to comparing Table 6 with Table 2. The
tax rates are generally higher and there is less redistribution. The change in the
Ginis is -0.126. The tax rate for the top 10 percent is higher than all the other tax
rates, as in Table 3. In this case the rich work less than the poor, and with no taxes
and transfers the ratio of the top income to the bottom is 68.07.
So again as expected, the results in Table 3 are in between those in these latter
two runs. And for all the Pareto cases the tax rate for the top 10 percent is always
higher than the others.
Lognormal (0.5), CRRA (1.00), SWF is the Sum of Utilities
This case is the same as Table 2 except SWF is the sum of utilities instead of the
sum of the log of utilities. This change makes only a small difference. For 10 tax
rates g is slightly larger—0.272 versus 0.270 in Table 2, and u999/u1 is slightly
larger—1.108 versus 1.107. There is slightly more redistribution.
Lognormal (0.5), CRRA (1.00), SWF is (9) Excluding the Top 10 percent
This case is the same as Table 2 except that in the SWF the government does not
care about the top 10 percent. In this case, as expected, the tax rates are higher than
those in Table 2 and there is more redistribution. With 10 tax rates, g is 0.256 versus
0.270 in Table 2. The ratio of after-tax income of the top individual to the bottom
is 13.03 versus 16.01 in Table 2. It is still the case, however, that the tax rate for
the top 10 percent is lower than the tax rate for the rest of the distribution—0.287
versus about 0.310 for the rest. Even though the government does not care about
the rich, it is still optimal to tax them less when the distribution is lognormal.
26
Lognormal (0.5), CRRA (1.00), SWF is Rawls
This case is the same as Table 2 except that the SWF is just u1. This change does
make a large difference. With only one tax rate, the tax rate is 0.542 versus 0.248
in Table 2 and the lump sum ratio is 0.705 versus 0.289 in Table 2. The bottom
129 individuals do not work, and the bottom 223 do not choose any education.
The Gini coefficient falls from 0.511 for before-tax income to 0.234 for after-tax
income. y999/y1 is 6.85 and u999/u1 is 1.063. Plato in The Laws thought that the
former should be no larger than 4, so we are getting close. Trying to solve this
case for several tax rates gave erratic results, but the main point using just one tax
rate is clear.
Lognormal (0.5), CRRA (0.50)
This case is the same as Table 2 and Table 5 except that the utility function is
CRRA (0.50). The one tax rate is 0.210, lower than in Tables 2 and 5. The results
are more extreme than in Table 5. 116 individuals do not work, compared to 19
in column (2) in Table 5, and 191 do not take any education, compared to 43 in
Table 5. h975 is 159.7 versus 111.4 in Table 5. The rich work more since their
marginal utility decreases more slowly with income, and the optimum is for them
to be taxed less (than in Table 5, where the utility function is CRRA (0.75)).
It was not possible in this case to compute 10 tax rates using the numerical
procedure.
Lognormal (0.5), CRRA (1.50)
This case is the same as Table 2 and Table 6 except that the utility function is
CRRA (1.50). In this case marginal utility decreases faster with income. The one
tax rate is 0.323, higher than in Tables 2 and 6. In this case h975 is 71.1 versus
77.4 in Table 6. The rich work less since thier marginal utility of incme decreases
faster with income, and the optimum is for them to be taxed more.
27
It was also not possible in this case to compute 10 tax rates.
Quasi-Linear Utility Functions
Diamond (1998) and a number of papers that followed have examined the case of
a quasi-linear utility function. Assuming no education, in the present notation this
function is
ui = yi + ν(T − hi) (15)
where ν is strictly concave. Assume, for example, that the function is
ui = yi + β log(T − hi) (16)
As discussed in Section 2, in dealing with utility functions in the numerical work,
β was chosen so that the optimal values of hi for the median ability individual
(i = 500) were in the ball park of 100. All individuals were assumed to have the
same β. This is not possible for the function in (16).
Consider the case of no taxes, where yi = wihi. Taking the derivative of uiwith respect to hi and setting it equal to zero yields optimal hours, h∗i :
h∗i = T − β
wi(17)
In the numerical work T = 300 and w500 = 25. (With no education wi = ai.) For
h∗500 = 100, this is a value of β of 2500. This value of β, however, is not sensible
for low and high ability individuals. For the lognormal (0.5) distribution, w999
is 117.2, which implies h∗999 = 279, and w1 is 5.33, which implies h∗1 = −169.
If β = 1066, then h∗1 = 100, but h∗999 = 291. The only way for a function like
(16) to be used in the numerical work is for β to vary inversely with ability. One
needs low ability individuals to have a low weight on leisure relative to high ability
individuals. There seems no particular reason that this is true, which casts doubt
on the usefulness of the quasi-linear utility function.
28
4 The Gini Coefficients
The OECD has computed for a number of countries Gini coefficients for market
income and disposable income, roughly in this paper before-tax income and after-
tax income. Table 8 shows results for 23 countries plus the OECD average of
29 countries. The market income Gini ranges from 0.323 for Korea to 0.523 for
Chile. The disposable Gini ranges from 0.243 for Denmark to 0.496 for Chile.
The changes in the two Ginis range from -0.023 for Korea to -0.152 for Belgium.
The OECD averages for 29 countries are 0.304 and 0.407, for a change of -0.103.
The average change is similar to the changes in Tables 2, 5, and 6, which pertain to
the lognormal (0.5) distribution and the three CRRA utility functions. For column
(3) in the three tables the changes are -0.087, -0.099, and -0.109, respectively.
Regarding the level of g, the values in the three tables are 0.270, 0.339, and 0.216.
The OECD value f 0.304 is thus in between the values in Tables 2 and 5. Note that
the Pareto results in Table 3 [and the Pareto results discussed above for CRRA (0.75)
and CRRA (1.25)] have noticeably more redistribution than the OECD average.
5 Conclusion
The main conclusions from the results are the following.
• When the lognormal distribution of ability is used, the optimal marginal tax
rates are always lower for the top income categories. When the Pareto tail
is used, the optimal marginal tax rate for the top income bracket (top 10
percent) is always higher. There is considerably more redistribution for the
Pareto than the lognormal.
• Regarding the SWF, it makes only a small difference whether the sum is
over utilities or the log of utilities. If the top 10 percent are excluded, there
is more redistribution, but the marginal tax rate for the top income bracket
29
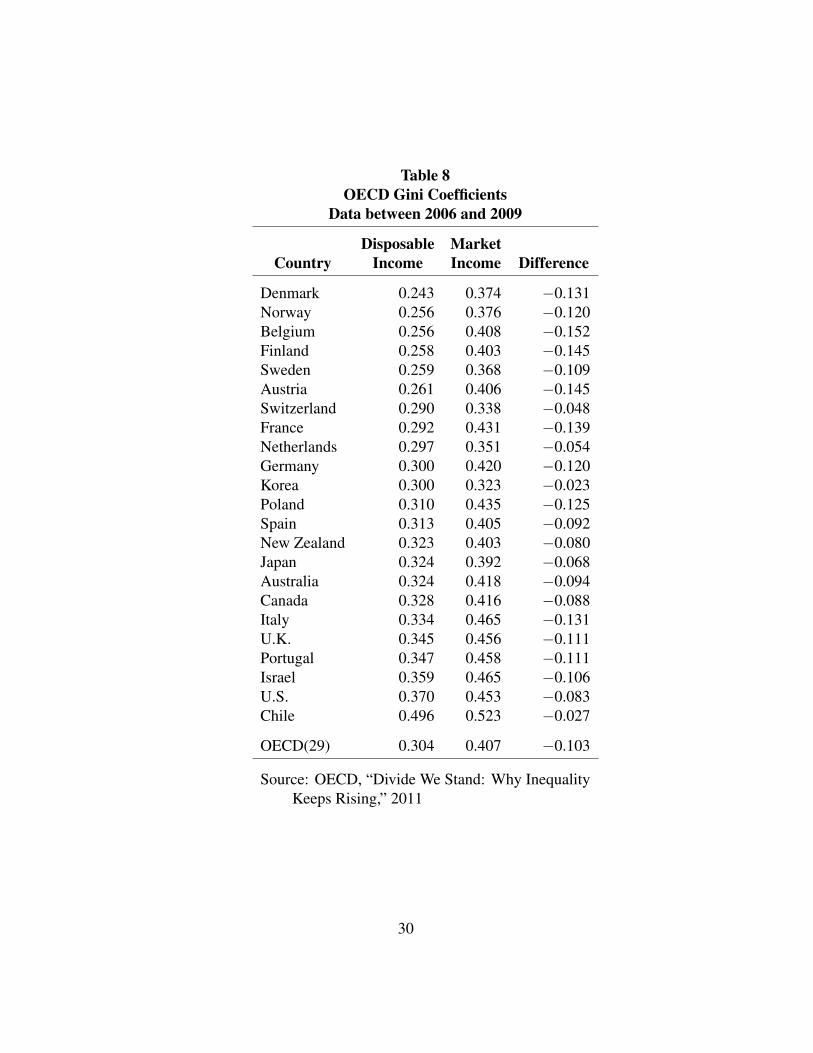
Table 8OECD Gini Coefficients
Data between 2006 and 2009
Disposable MarketCountry Income Income Difference
Denmark 0.243 0.374 −0.131Norway 0.256 0.376 −0.120Belgium 0.256 0.408 −0.152Finland 0.258 0.403 −0.145Sweden 0.259 0.368 −0.109Austria 0.261 0.406 −0.145Switzerland 0.290 0.338 −0.048France 0.292 0.431 −0.139Netherlands 0.297 0.351 −0.054Germany 0.300 0.420 −0.120Korea 0.300 0.323 −0.023Poland 0.310 0.435 −0.125Spain 0.313 0.405 −0.092New Zealand 0.323 0.403 −0.080Japan 0.324 0.392 −0.068Australia 0.324 0.418 −0.094Canada 0.328 0.416 −0.088Italy 0.334 0.465 −0.131U.K. 0.345 0.456 −0.111Portugal 0.347 0.458 −0.111Israel 0.359 0.465 −0.106U.S. 0.370 0.453 −0.083Chile 0.496 0.523 −0.027
OECD(29) 0.304 0.407 −0.103
Source: OECD, “Divide We Stand: Why InequalityKeeps Rising,” 2011
30
is still lower (for the lognormal distribution). There is huge redistribution
when the SWF is Rawlsian, and the ratio of the top after-tax income to the
bottom is only 6.85, close to Plato’s 4.0.
• The results are as expected for education. The tax rates are higher and there
is more redistribution when there is no education since there are then no
negative tax-rate effects on education.
• The results are also as expected for the utility functions. The more does
marginal utility decline with income, the higher are the tax rates and the
more is there redistribution. The OECD results match best for the lognormal
(0.5) distribution and a risk aversion parameter between 0.75 and 1.0.
• The quasi-linear utility function is not sensible in the present context unless
it is assumed that low ability individuals weight leisure less than do high
ability individuals.
Does this analysis have any guidance for public policy? There are, of course,
many restrictive assumptions, especially the timeless nature of the analysis. There
is no tagging power of the government, as in Akerlof (1978). There are no other
taxes and just one government entity. Nevertheless, the results are firm in showing
that for a lognormal distribution of ability it is optimal to tax the rich less. This
is true across fairly different utility functions. It is also true even when the top 10
percent are excluded from the SWF. For a Pareto tail, the top tax rate is always
greater than the others. So an important empirical question is which distribution of
ability best approximates reality. The OECD results in Table 8 suggests that if the
countries are optimizing, they are not using a Pareto distribution. The redistribution
is not as large as a Pareto distribution would imply. Finally, the results suggest
that if one could pin down the actual distribution of ability, the optimal marginal
tax rates are not likely to be constant across income categories. If the distribution
31

is close to lognormal, they are likely to decline at the top income brackets, and if
the distribution has a Pareto tail, the tax rate at the top is likely to be higher.
32
References[1] Akerlof, George, 1978, “The Economics of ’Tagging’ as Applied to the Op-
timal Income Tax, Welfare Programs, and Manpower Planning,” AmericanEconomic Review, 68, 8-19.
[2] Best, Michael Carlos, and Henrik Jacobsen Kleven, 2013, “Optimal IncomeTaxation with Career Effects of Work Effort,” LSE Working Paper, February.
[3] Bovenbert, A. Lans, and Bas Jacobs, 2008, “Optimal Taxation of HumanCapital and the Earnings Function,” CESIFO Working Paper No. 2250,March.
[4] Card, David, 1999, “The Causal Effect of Education on Earnings,” in Hand-book of Labor Economics, Volume 3, edited by O. Ashenfelter and D. Card,Elseview Science B.V., 1801–1863.
[5] Dahan, Momi, and Michel Strawczynski, 2000, “Optimal Income Taxa-tion: An Example with a U-Shaped Pattern of Optimal Marginal Tax Rates:Comment,” American Economic Review, 90, 681–686.
[6] Davidon, W.C., 1959, “Variable Metric Method for Minimization,” A.E.C.Research and Development Report ANL-5990 (Revised).
[7] Diamond, Peter, 1998, “Optimal Income Taxation: An Example with aU-Shaped Pattern of Optimal Marginal Tax Rates,” American EconomicReview, 88, 83-95.
[8] Diamond, Peter, and Emmanuel Saez, 2011, “The Case for a ProgressiveTax: From Basic Research to Policy Recommendations,” Journal of Eco-nomic Perspectives, 25, 165–190, Fall.
[9] Fair, Ray C., 1971, “The Optimal Distribution of Income,” The QuarterlyJournal of Economics, 85, 551–579, November.
[10] Fair, Ray C., 1974, “On the Solution of Optimal Control Problems as Maxi-mization Problems,” Annals of Economic and Social Measurement, 3, 135–154.
[11] Fletcher, R. and M.J.D. Powell, 1963, “A Rapidly Convergent DescentMethod for Minimization,” Computer Journal, 6, 163–168.
33
[12] Mankiw, N. Gregory, Matthew Weinzierl, and Danny Yagan, 2009, “OptimalTaxation in Theory and Practice,” Journal of Economic Perspectives, 23,147–174, Fall.
[13] Mirrlees, James A., 1971, “An Exploration in the Theory of Optimal IncomeTaxation,” Review of Economic Studies, 38, 175–208.
[14] Plato, The Laws, trans. A.E. Taylor (New York: E.P. Dutton and Co., 1960),p. 127.
[15] Tuomala, Matti, 1990, Optimal Income Tax and Redistribution, Oxford Uni-versity Press.
34


![OPTIMAL ESTIMATION VIA NONANTICIPATIVE …sloyka/papers/2018/SIAM.Stavrou.18.pdfIn [14], Charalambous, Stavrou, and Ahmed revisited the relation between infor-mation theory and ltering](https://img.pdfslide.us/doc/110x75/5e872967809bc72e6c381068/optimal-estimation-via-nonanticipative-sloykapapers2018siamstavrou18pdf-in.jpg)