Embed Size (px)
Citation preview
1989ApJ...338..862G
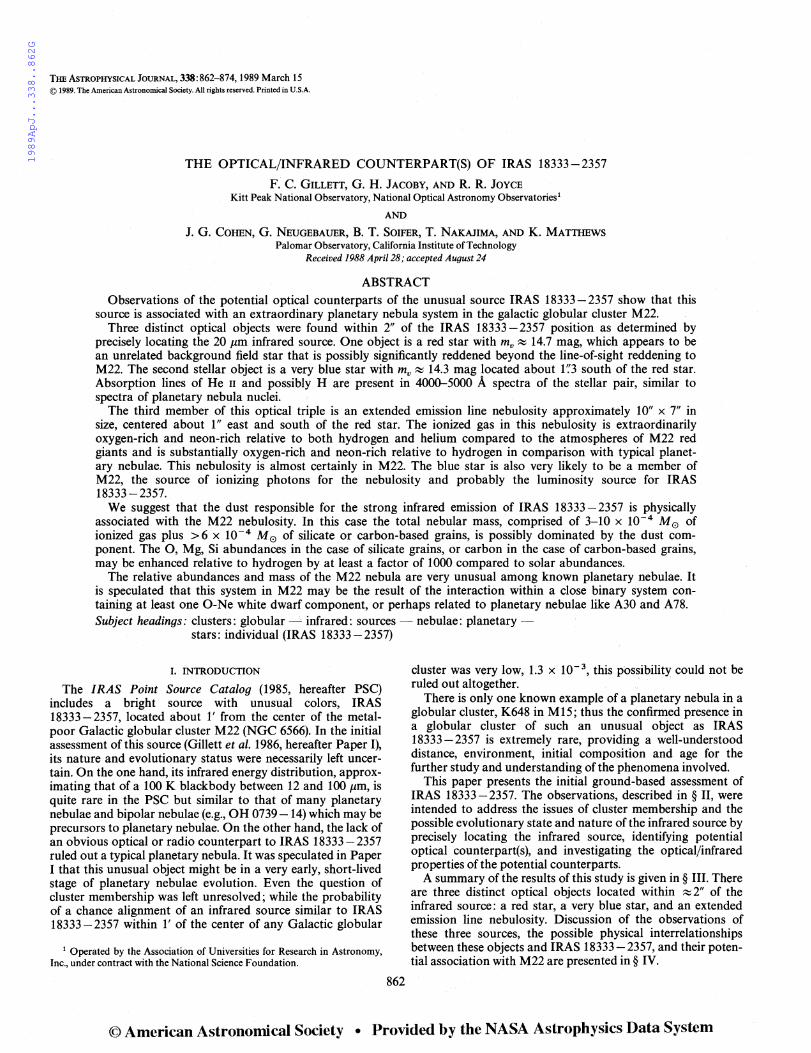
THE AsTROPHYSICAL JOURNAL, 338: 862-874, 1989 March 15 © 1989. The American Astronomical Society. All rights reserved. Printed in U.S.A.
THE OPTICAL/INFRARED COUNTERPART(S) OF IRAS 18333-2357
F. c. GILLETI, G. H. JACOBY, AND R. R. JOYCE Kitt Peak National Observatory, National Optical Astronomy Observatories'
AND
J. G. COHEN, G. NEUGEBAUER, B. T. SOIFER, T. NAKAJIMA, AND K. MATTHEWS Palomar Observatory, California Institute of Technology
Received 1988 April 28; accepted August 24
ABSTRACT Observations of the potential optical counterparts of the unusual source IRAS 18333-2357 show that this
source is associated with an extraordinary planetary nebula system in the galactic globular cluster M22. Three distinct optical objects were found within 2" of the IRAS 18333-2357 position as determined by
precisely locating the 20 µm infrared source. One object is a red star with mv ~ 14.7 mag, which appears to be an unrelated background field star that is possibly significantly reddened beyond the line-of-sight reddening to M22. The second stellar object is a very blue star with mv ~ 14.3 mag located about 1~3 south of the red star. Absorption lines of He 11 and possibly H are present in 4000--5000 A spectra of the stellar pair, similar to spectra of planetary nebula nuclei.
The third member of this optical triple is an extended emission line nebulosity approximately 10" x 7" in size, centered about 1" east and south of the red star. The ionized gas in this nebulosity is extraordinarily oxygen-rich and neon-rich relative to both hydrogen and helium compared to the atmospheres of M22 red giants and is substantially oxygen-rich and neon-rich relative to hydrogen in comparison with typical planetary nebulae. This nebulosity is almost certainly in M22. The blue star is also very likely to be a member of M22, the source of ionizing photons for the nebulosity and probably the luminosity source for IRAS 18333-2357.
We suggest that the dust responsible for the strong infrared emission of IRAS 18333-2357 is physically associated with the M22 nebulosity. In this case the total nebular mass, comprised of 3-10 x 10-4 M 0 of ionized gas plus > 6 x 10⁻⁴ M 0 of silicate or carbon-based grains, is possibly dominated by the dust component. The 0, Mg, Si abundances in the case of silicate grains, or carbon in the case of carbon-based grains, may be enhanced relative to hydrogen by at least a factor of 1000 compared to solar abundances.
The relative abundances and mass of the M22 nebula are very unusual among known planetary nebulae. It is speculated that this system in M22 may be the result of the interaction within a close binary system containing at least one 0-Ne white dwarf component, or perhaps related to planetary nebulae like A30 and A78. Subject headings: clusters: globular ~ infrared: sources - nebulae: planetary -
stars: individual (IRAS 18333 - 2357)
I. INTRODUCTION
The IRAS Point Source Catalog (1985, hereafter PSC) includes a bright source with unusual colors, IRAS 18333-2357, located about 1' from the center of the metalpoor Galactic globular cluster M22 (NGC 6566). In the initial assessment ofthis source (Gillett et al. 1986, hereafter Paper I), its nature and evolutionary status were necessarily left uncertain. On the one hand, its infrared energy distribution, approximating that of a 100 K blackbody between 12 and 100 µm, is quite rare in the PSC but similar to that of many planetary nebulae and bipolar nebulae (e.g., OH 0739-14) which may be precursors to planetary nebulae. On the other hand, the lack of an obvious optical or radio counterpart to IRAS 18333-2357 ruled out a typical planetary nebula. It was speculated in Paper I that this unusual object might be in a very early, short-lived stage of planetary nebulae evolution. Even the question of cluster membership was left unresolved; while the probability of a chance alignment of an infrared source similar to IRAS 18333-2357 within 1' of the center of any Galactic globular
1 Operated by the Association of Universities for Research in Astronomy, Inc., under contract with the National Science Foundation.
862
cluster was very low, 1.3 x 10- 3 , this possibility could not be ruled out altogether. · ·
There is only one known example of a planetary nebula in a globular cluster, K648 in M15; thus the confirmed presence in a globular cluster of such an unusual object as IRAS 18333-2357 is extremely rare, providing a well-understood distance, environment, initial composition and age for the further study and understanding of the phenomena involved.
This paper presents the initial ground-based assessment of IRAS 18333- 2357. The observations, described in § II, were intended to address the issues of cluster membership and the possible evolutionary state and nature of the infrared source by precisely locating the infrared source, identifying potential optical counterpart(s), and investigating the optical/infrared properties of the potential counterparts.
A summary of the results of this study is given in § III. There are three distinct optical objects located within ~ 2" of the infrared source: a red star, a very blue star, and an extended emission line nebulosity. Discussion of the observations of these three sources, the possible physical interrelationships between these objects and IRAS 18333- 2357, and their potential association with M22 are presented in§ IV.
© American Astronomical Society • Provided by the NASA Astrophysics Data System
1989ApJ...338..862G
OPTICAL/IR COUNTERPART(S) OF IRAS 18333-2357 863
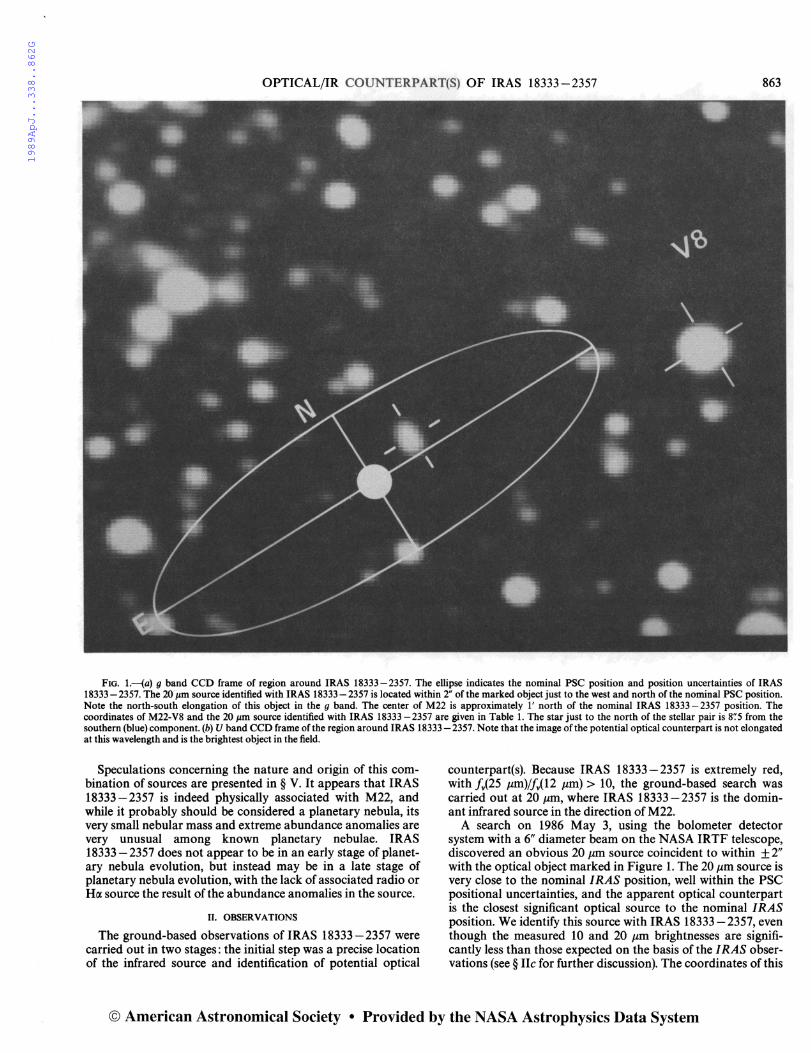
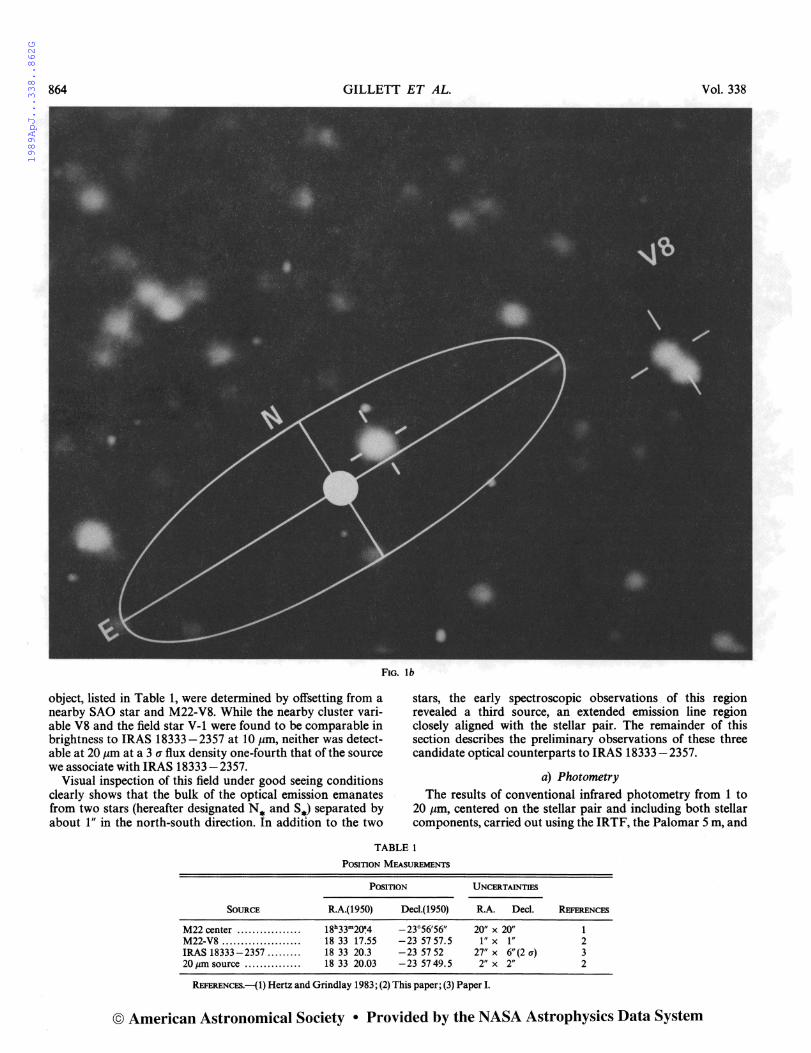
FIG. 1.-{a) g band CCD frame of region around IRAS 18333-2357. The ellipse indicates the nominal PSC position and position uncertainties of IRAS 18333-2357. The 20 µm source identified with IRAS 18333-2357 is located within 2" of the marked object just to the west and north of the nominal PSC position. Note the north-south elongation of this object in the g band. The center of M22 is approximately l' north of the nominal IRAS 18333-2357 position. The coordinates of M22-V8 and the 20 µm source identified with IRAS 18333-2357 are given in Table 1. The star just to the north of the stellar pair is 8''.5 from the southern (blue) component. (b) U band CCD frame of the region around IRAS 18333 - 2357. Note that the image of the potential optical counterpart is not elongated at this wavelength and is the brightest object in the field.
Speculations concerning the nature and origin of this combination of sources are presented in § V. It appears that IRAS 18333 - 2357 is indeed physically associated with M22, and while it probably should be considered a planetary nebula, its very small nebular mass and extreme abundance anomalies are very unusual among known planetary nebulae. IRAS 18333 - 2357 does not appear to be in an early stage of planetary nebula evolution, but instead may be in a late stage of planetary nebula evolution, with the lack of associated radio or H(X source the result of the abundance anomalies in the source.
II. OBSERVATIONS
The ground-based observations ofIRAS 18333-2357 were carried out in two stages: the initial step was a precise location of the infrared source and identification of potential optical
counterpart(s). Because IRAS 18333-2357 is extremely red, with f,(25 µm)/f,(12 µm) > 10, the ground-based search was carried out at 20 µm, where IRAS 18333-2357 is the dominant infrared source in the direction of M22.
A search on 1986 May 3, using the bolometer detector system with a 6" diameter beam on the NASA IRTF telescope, discovered an obvious 20 µm source coincident to within ± 2" with the optical object marked in Figure 1. The 20 µm source is very close to the nominal I RAS position, well within the PSC positional uncertainties, and the apparent optical counterpart is the closest significant optical source to the nominal I RAS position. We identify this source with IRAS 18333 - 2357, even though the measured 10 and 20 µm brightnesses are significantly less than those expected on the basis of the I RAS observations (see§ Ile for further discussion). The coordinates of this
© American Astronomical Society • Provided by the NASA Astrophysics Data System
1989ApJ...338..862G
864 GILLETT ET AL. Vol. 338
Fm. lb
object, listed in Table 1, were determined by offsetting from a nearby SAO star and M22-V8. While the nearby cluster variable VS and the field star V-1 were found to be comparable in brightness to IRAS 18333-2357 at 10 µm, neither was detectable at 20 µm at a 3 u flux density one-fourth that of the source we associate with IRAS 18333-2357.
Visual inspection of this field under good seeing conditions clearly shows that the bulk of the optical emission emanates from two stars (hereafter designated N • and s.) separated by about l" in the north-south direction. In addition to the two
stars, the early spectroscopic observations of this region revealed a third source, an extended emission line region closely aligned with the stellar pair. The remainder of this section describes the preliminary observations of these three candidate optical counterparts to IRAS 18333- 2357.
a) Photometry
The results of conventional infrared photometry from 1 to 20 µm, centered on the stellar pair and including both stellar components, carried out using the IRTF, the Palomar 5 m, and
TABLE 1
POSITION MEASUREMENTS
SoURCE
M22center ... .... .... .. .. .. M22-V8 ... .... .... .... .... .. IRAS 18333-2357 .. ..... .. 20 µm source .......... .. .. .
POSITION
R.A.(1950)
l8h33m2~4
18 33 17.55 18 33 20.3 18 33 20.03
Decl.(1950)
-23°56'56" -23 57 57.5 -23 57 52 -23 5749.5
UNCERTAINTIES
R.A. Deel.
20" x 20" 1" x 1"
27"x 6"(2a) 2" x 2"
REFERENCES.--(1) Hertz and Grindlay 1983; (2) This paper; (3) Paper I.
REFERENCES
1 2 3 2
© American Astronomical Society • Provided by the NASA Astrophysics Data System
1989ApJ...338..862G
No. 2, 1989 OPTICAL/IR COUNTERPART(S) OF IRAS 18333-2357 865
TABLE 2
PHOTOMETRY SUMMARY
INTEGRATED PHOTOMETRY (N* + S*) (mag) FLUX RATIO
(N*/S*) Pl.5, CCDd PARAMETER M3.0, Bolo• P5.0, InSb• Kl.3, InSb• Pl.5, CCDd NOTES
Filter: u ........................ . B ........................ . g ........................ . i ......................... . J ........................ . H ........................ . K ........................ .
H 20 index ................ . CO index .................. .
L ........................ . [10.2] ...................... . [12.5] ...................... . [20] ....................... .
9.15 ±0.08
9.5 ± 0.1 6.3 ± 0.1 4.9 ± 0.12 1.90
10.99 10.12 9.82 0.09 0.18 9.5 ± 0.3
10.88 9.96 9.72
9.3 ± 0.14
13.5 ± 0.2 14.6 ± 0.1 14.0 ± 0.05 13.8 ± 0.1
0.09 ± 0.02 0.43 ± 0.09 7.8 ± 0.5
1, 2 1 1, 3 1, 4
• IRTF 3.0 m on Mauna Kea with bolometer photometer; 6':0 beam diameter. • Palomar 5.0 m with lnSb photometer; 5':0 beam diameter. • Kitt Peale 1.3 m with InSb photometer; 11" beam diameter. d Pl.5, CCD: Palomar 1.5 m with RCA CCD; 8':5 beam diameter. NoTES.-(1) Relative to M22 stars IV-5, 6, 16, 18, 19 using B, V magnitudes of Arp and Melbourne 1959 as quoted in
Alcaino Atlas 1973. (2) B- V, U - B relationship for M22 stars deduced from photometry by Eggen 1977. (3) Photometric system defined by Thuan and Gunn 1976. (4) Photometric system defined by Wade et al.1919. With B- V, V-1 relationship for M22 stars deduced from photometry by Eggen 1977.
the KPNO 1.3 m telescopes, are summarized in Table 2. Also included in Table 2 are the results of preliminary optical photometry of the pair in the U, B, g, and i bands obtained from RCA CCD frames (0':47 per pixel) taken with the Palomar 1.5 m telescope. Reproductions of the central portion of the g and U band CCD frames are shown in Figures la and lb. Seeing at the time of observation was about 1':5, and therefore the stellar pair appears as an elongated north-south object in the g frame. In order to estimate the relative contribution of the two components, the CCD images of this pair have been deconvolved by fitting point source profiles at the positions of the two stellar objects to the observed north-south profile. The derived flux ratios are also included in Table 2.
The optical photometry is significantly uncertain for two reasons: (1) uncertainty in the relative contributions ofN* and S* and (2) the photometry is calibrated relative to M22 cluster stars with Band B- V photometry (Arp and Melbourne 1959) as quoted by Alcaino (1973). Extrapolation of this B, V calibration to the U, g, and i bands was accomplished using UBVRI color relations for M22 stars (Eggen 1977) and the g, i band definitions from Thuan and Gunn (1976) and Wade et al. (1979). The quoted uncertainties reflect the star-to-star spread in the conversion factors.
The region around IRAS 18333-2357 was also imaged at the KPNO 4 m prime focus using the RCA3 CCD on 1987 March 31. One 900 s exposure (Fig. 2a) was obtained through an interference filter centered at 5006 A with a bandpass of 31 A. A second exposure of 240 s was taken through a line-free filter centered at 5279 A with a 273 A bandpass. While the nebulosity can be identified in the 5006 A frame, it can be seen much more easily when the line-free image is subtracted from the on-line image (Fig. 2b). Residual flux from some of the very red, very blue, and saturated stars is evident in the difference frame.
b) Spectroscopy
Spectroscopic observations in the vicinity of the stellar pair were obtained with the double spectrograph (Oke and Gunn 1982) attached to the Palomar 5 m telescope on 1986 May 28, 29, and 31 and 1987 May 6. The 1986 May spectra of this region were obtained using both l" and 2" slit widths with corresponding spectral resolutions of 4 A and 8 A in the 3775-5485 A range and 12 A and 24 A in the 5500-10060 A range. Exposure times ranged from 100 to 1800 s. The higher resolution 1987 May spectrum was centered on the stellar pair and covered 3858 A to 4306 A with 1.4 A resolution, and 6331 A to 6978 A with 2 A resolution.
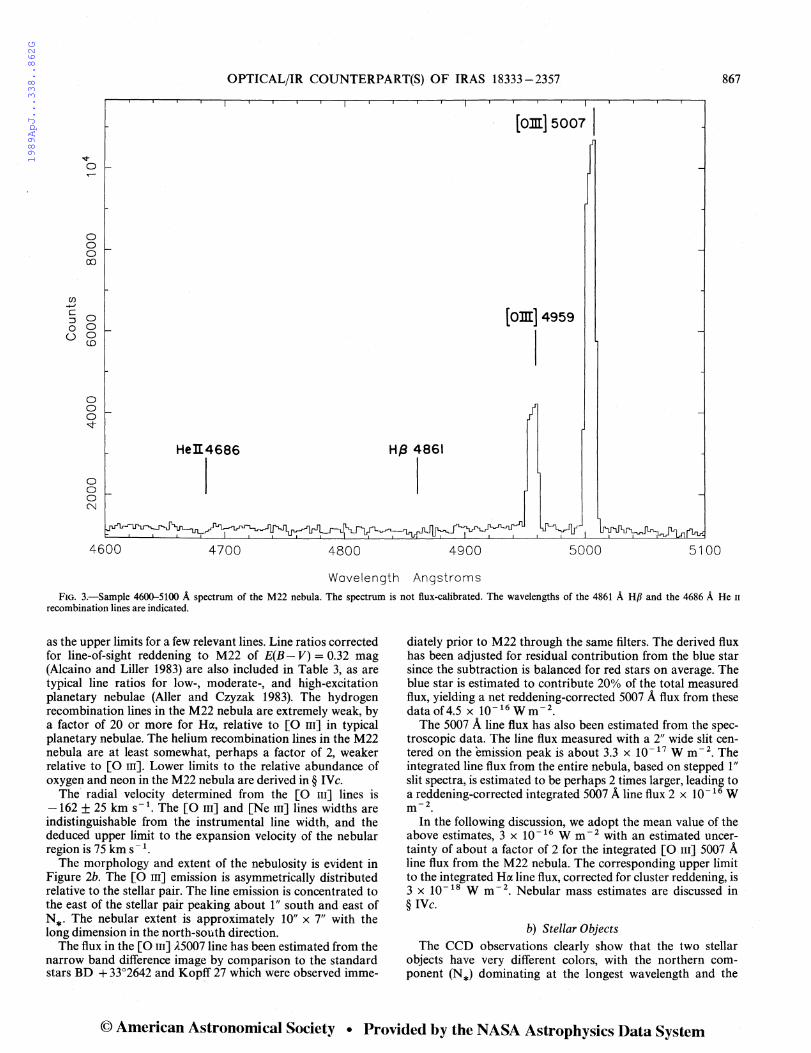
Figure 3 is a section of a blue spectrum showing the 4600-5100 A region with the slit aligned north-south and located so as to minimize the stellar contribution to the nebular spectrum. Figure 4a shows a 4000-5000 A spectrum of the stellar pair, while Figure 4b shows the 3860-4300 A spectrum obtained in 1987 May.
III. RESULTS
a) Nebulosity
Figure 3 illustrates the fundamental property of the nebulosity discovered during these observations. The spectrum is dominated by the 5007 A and 4959 A lines of [O III]. Conspicuous by their absence are the 4861 A HP hydrogen recombination line and the 4686 A recombination line of ionized helium. Indeed, the only other nebular emission line apparent in the 3800-9000 A wavelength range is the 3869, 3967 A doublet of [Ne m] (Fig. 4b). A weak emission feature near the expected position of the 4363 A [O m] line is indistinguishable in these spectra from the mercury night sky line at 4361 A. We do not believe that this feature is the nebular line. Table 3 lists the intensity of [Ne III] 3869 A relative to [Orn] 5007 A as well
© American Astronomical Society • Provided by the NASA Astrophysics Data System

1989ApJ...338..862G
A B FIG. 2.- 5006 A CCD frame of the region around IRAS 18333-2357. North is up, and east is to the left. The stellar pair (N* ands.) appear as the elongated
image near the center of the field. (b) Difference image. The same field as in (a) with the 5279 A image subtracted from the 5006 A image. The difference has been balanced for redder stars in the field.
TABLE 3
NEBULAR SPECTROSCOPY SUMMARY
RELATIVE LINE INTENSITY(/ soo7 = 100)
Planetary Nebulae M22 Nebula
Excitation Temperature• Corrected for
LINE Measured Extinction• High Medium Low K648•
[Ne m], 3869 A .... ... ...... 28 ± 14 37 ± 18 48 12 6 3.8 [O m], 4363 A . ..... . . .... .. <3.0 <3.5 1.2 1.0 0.5 1.3 He 11, 4686A . ............... < 1.6 <1.75 5.5 0.5 <1 HP,4861 A ··· ····· ····· ···· <1.3 <1.3 9 8 14 48 [Om], 4959 A .. .. ... . . .. .. . 31 31 32 33 [O m], 5007 A ...... .. .. .... 100 100 100 100 100 100 He1, 5876A ...... .... .... .. <0.8 <0.65 0.5 1.1 2.0 6.2 Ha, 6563A .................. < 1.4 <1.0 26 23.2 42 143
• AssumingE(B-V) = 0.32mag. • Average line ratios for classes as defined by Aller and Czyzak 1983. • Adams et al. 1984.
866
© American Astronomical Society • Provided by the NASA Astrophysics Data System
1989ApJ...338..862G
OPTICAL/IR COUNTERPART(S) OF IRAS 18333-2357 867
en +-' c :::i 0 u
0 0 0 co
0 0 0 CD
0 0 0 '<t-
0 0 0 N
4600
HeII4686
I
4700
[om] 5001 I
[om] 4959
I
H,8 4861
I
4800 4900 5000 5100
Wavelength Angstroms
FIG. 3.-Sample 4600--5100 A spectrum of the M22 nebula. The spectrum is not flux-calibrated. The wavelengths of the 4861 A HP and the 4686 A Hen recombination lines are indicated.
as the upper limits for a few relevant lines. Line ratios corrected for line-of-sight reddening to M22 of E(B- V) = 0.32 mag (Alcaino and Liller 1983) are also included in Table 3, as are typical line ratios for low-, moderate-, and high-excitation planetary nebulae (Aller and Czyzak 1983). The hydrogen recombination lines in the M22 nebula are extremely weak, by a factor of 20 or more for Ha, relative to [O III] in typical planetary nebulae. The helium recombination lines in the M22 nebula are at least somewhat, perhaps a factor of 2, weaker relative to [O m]. Lower limits to the relative abundance of oxygen and neon in the M22 nebula are derived in § IV c.
The radial velocity determined from the [O m] lines is -162 ± 25 km s- 1. The [Om] and [Ne m] lines widths are indistinguishable from the instrumental line width, and the deduced upper limit to the expansion velocity of the nebular region is 7 5 km s - 1 .
The morphology and extent of the nebulosity is evident in Figure 2b. The [O m] emission is asymmetrically distributed relative to the stellar pair. The line emission is concentrated to the east of the stellar pair peaking about 111 south and east of N*. The nebular extent is approximately 10" x 7" with the long dimension in the north-south direction.
The flux in the [Om] A.5007 line has been estimated from the narrow band difference image by comparison to the standard stars BD + 33°2642 and Kopff 27 which were observed imme-
diately prior to M22 through the same filters. The derived flux has been adjusted for residual contribution from the blue star since the subtraction is balanced for red stars on average. The blue star is estimated to contribute 20% of the total measured flux, yielding a net reddening-corrected 5007 A flux from these dataof4.5 x 10- 16 wm- 2.
The 5007 A line flux has also been estimated from the spectroscopic data. The line flux measured with a 2" wide slit centered on the emission peak is about 3.3 x 10- 17 Wm - 2. The integrated line flux from the entire nebula, based on stepped 111
slit spectra, is estimated to be perhaps 2 times larger, leading to a reddening-corrected integrated 5007 A line flux 2 x 10- 16 W
-2 m . In the following discussion, we adopt the mean value of the
above estimates, 3 x 10- 16 W m- 2 with an estimated uncertainty of about a factor of 2 for the integrated [O m] 5007 A line flux from the M22 nebula. The corresponding upper limit to the integrated Ha line flux, corrected for cluster reddening, is 3 x 10- 18 W m- 2. Nebular mass estimates are discussed in § IVc.
b) Stellar Objects
The CCD observations clearly show that the two stellar objects have very different colors, with the northern component (N*) dominating at the longest wavelength and the
© American Astronomical Society • Provided by the NASA Astrophysics Data System

1989ApJ...338..862G
868 GILLETT ET AL. Vol. 338
(/] -+--' c ::J 0 u
0 0 0 co
0 0 0 (()
0 0 0 >I-
0 0 0 N
4000
(\J
0 v 00 J:
0 0 (\J v l=I cu J:
4200 4400
,.._ v v H cu J:
(\J v I()
v l=I cu J:
4600 4800 5000 Wavelength Angstroms
FIG. 4a
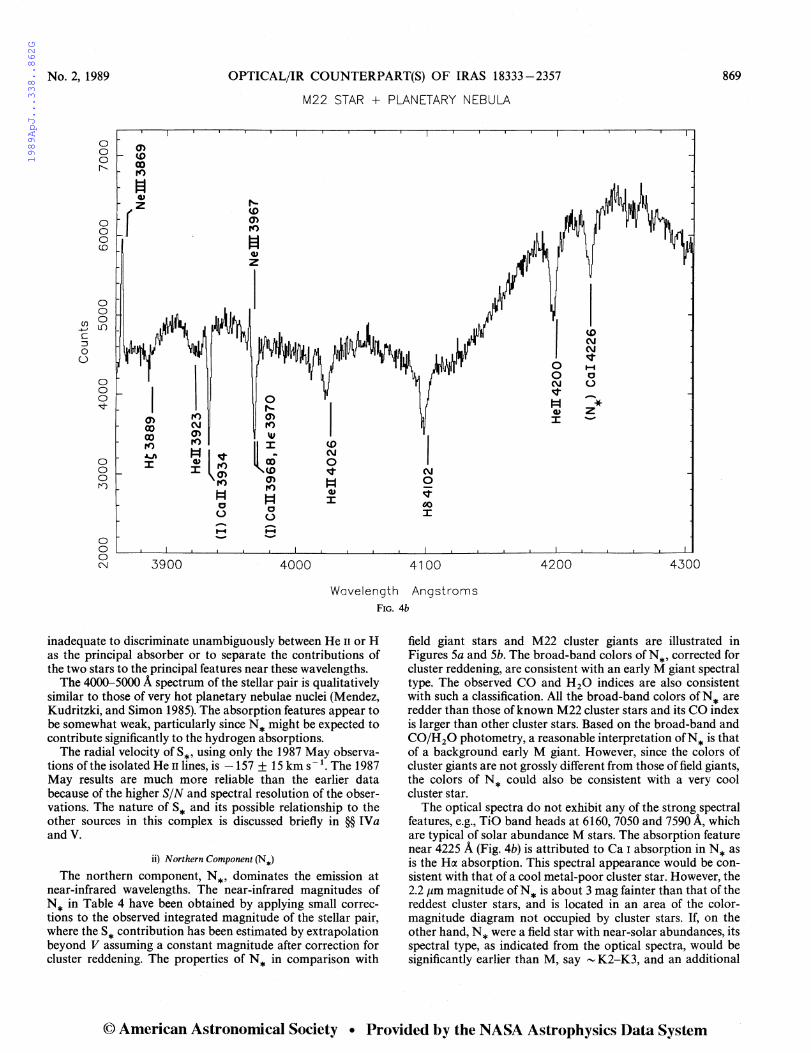
FIG. 4.-{a) Sample 4000--5000 A spectrum of the stellar objects N* and S* from 1986 May observations. The spectrum is not flux-calibrated. The wavelengths of several hydrogen and helium lines are indicated. (b) 3860-4300A spectra of stellar pair from 1987 May.
southern component (S*) increasingly dominant towards the blue until N* is not detectable in the U band frame. The separation between the two components, as measured by the positional difference between the i and U observations, is 1':3, essentially in the north-south direction. All of the photometry includes both components, as do the stellar spectra.
The adopted magnitudes for the two stellar components are
TABLE 4
ADOPTED CoMPONENT MAGNITUDES
FILTER
u ················· B ·················· (V)b .............. . J ................. . H ................ . K ................ .
OBSERVED
16.0 (0.1) 14.7 (0.2) 11.04 10.09 9.81
13.5 (0.2) 14.8 (0.1) 14.3 (0.2)
• A;}E(B- V) from Rieke and Lebofsky 1985.
CORRECTED FOR E(B- V) = 0.32•
15.3 (0.2) 13.7 (0.2) 10.76 9.92 9.70
12.0 (0.2) 13.5 (0.2) 13.3 (0.2)
b Inferred using g, V, B- V relation from Thuan and Gunn 1976.
shown in Table 4, including component magnitudes corrected for the line-of-sight reddening to M22.
i) Southern Component (S*)
The stellar pair is relatively faint compared to nearby cluster stars at the longer wavelengths, but s* is the brightest object in the 2' field of the U band frame. S* has nearly the same B magnitude and B - g, and thus presumably B- V, color as the nearby blue horizontal-branch cluster stars IV-16 and IV-18 (Arp and Melbourne 1959); however, it is about 1.5 mag bluer in U - B than these stars.
Presumably this extremely blue star has escaped previous notice for two reasons. First, it is located within l' of the center of M22, well within the core radius of the cluster, while most searches for unusually blue or UV bright stars have been carried out in the less crowded outer regions of the cluster (e.g., Zinn, Newell, and Gibson 1972). Second, the proximity of the red star, N*, tends to mask the extreme nature of S*.
The 4000-5000 A spectrum of the stellar pair, Figures 4a and 4b, also indicates that S* is an extremely hot star. Clearly present are absorption lines of He n at 4686, 4541, 4200, 4026 and 3923 A, while the 4471 A line of He I is not visible. Additional He n lines of similar strength to the above isolated He II absorption lines would be expected about 2 A to the blue of the hydrogen Balmer lines. The observations presented here are
©American Astronomical Society • Provided by the NASA Astrophysics Data System
1989ApJ...338..862G
No. 2, 1989 OPTICAL/IR COUNTERPART(S) OF IRAS 18333-2357
M22 STAR + PLANETARY NEBULA
869
0 0 0 r--
0 0 0 co
0 0
en 0 ....., l[) i:::: :::i 0
(.)
0 0 0
"""
0 0 0 f")
0 0 0 N
en ex> ex> rt) ...,. :::c
3900
0
""" rt) en C\I rt) en Ill rt)
~~ l=I l v ~ rt) :::c en
rt) en l=I
rt)
c l=I (.) c
(.) ....... ....... ..... t:! ......
tD C\I C\I v
0 1-t 0 c C\I (.)
v ....... * l=I ~ z
:::c
tD C\I 0 v C\I l=I 0 ~ v :::c «>
:::c
4000 4100 4200 4300
Wavelength Angstroms FIG. 4b
inadequate to discriminate unambiguously between He II or H as the principal absorber or to separate the contributions of the two stars to the principal features near these wavelengths.
The 4000--5000 A spectrum of the stellar pair is qualitatively similar to those of very hot planetary nebulae nuclei (Mendez, Kudritzki, and Simon 1985). The absorption features appear to be somewhat weak, particularly since N* might be expected to contribute significantly to the hydrogen absorptions.
The radial velocity of s., using only the 1987 May observations of the isolated He II lines, is -157 ± 15 km s- 1. The 1987 May results are much more reliable than the earlier data because of the higher S/N and spectral resolution of the observations. The nature of s. and its possible relationship to the other sources in this complex is discussed briefly in §§ IV a andV.
ii) Northern Component (N .l The northern component, N., dominates the emission at
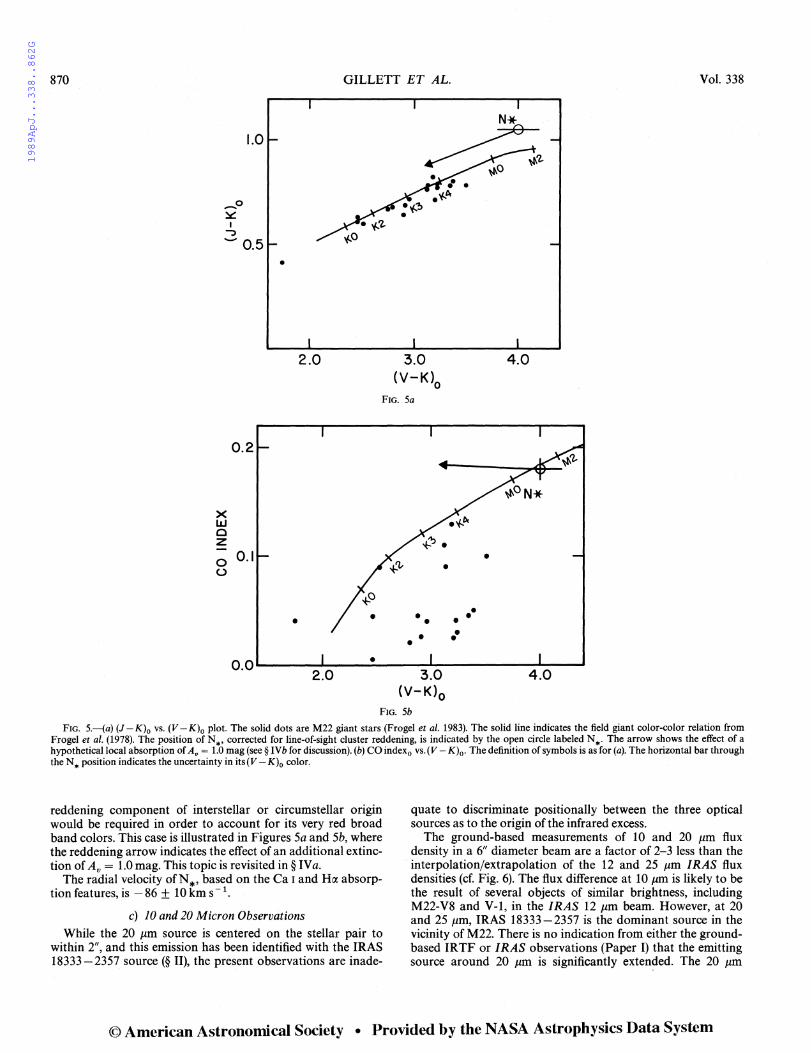
near-infrared wavelengths. The near-infrared magnitudes of N* in Table 4 have been obtained by applying small corrections to the observed integrated magnitude of the stellar pair, where the s. contribution has been estimated by extrapolation beyond V assuming a constant magnitude after correction for cluster reddening. The properties of N* in comparison with
field giant stars and M22 cluster giants are illustrated in Figures 5a and 5b. The broad-band colors ofN., corrected for cluster reddening, are consistent with an early M giant spectral type. The observed CO and H20 indices are also consistent with such a classification. All the broad-band colors ofN* are redder than those of known M22 cluster stars and its CO index is larger than other cluster stars. Based on the broad-band and CO/H20 photometry, a reasonable interpretation ofN* is that of a background early M giant. However, since the colors of cluster giants are not grossly different from those of field giants, the colors of N* could also be consistent with a very cool cluster star.
The optical spectra do not exhibit any of the strong spectral features, e.g., TiO band heads at 6160, 7050 and 7590 A, which are typical of solar abundance M stars. The absorption feature near 4225 A (Fig. 4b) is attributed to Ca 1 absorption in N* as is the Hoc absorption. This spectral appearance would be consistent with that of a cool metal-poor cluster star. However, the 2.2 µm magnitude ofN* is about 3 mag fainter than that of the reddest cluster stars, and is located in an area of the colormagnitude diagram not occupied by cluster stars. If, on the other hand, N* were a field star with near-solar abundances, its spectral type, as indicated from the optical spectra, would be significantly earlier than M, say "'K2-K3, and an additional
© American Astronomical Society • Provided by the NASA Astrophysics Data System
1989ApJ...338..862G
870 GILLETT ET AL. Vol. 338
_o ~ I
J
1.0
-o.5 •
2.0
~ ~o
• • •• • ~°'
3.0 (V-K)0
4.0
FIG. 5a
x UJ c z
0.2
0 0.1 u
• • •
o.o .... ~~~ ...... ~~~-·~~~__..__~~~~~~--~~ ..... 2.0 3.0 4.0
(V-K)0
FIG. 5b
Fm. 5.---{a) (J -K)0 vs. (V -K)0 plot. The solid dots are M22 giant stars (Frogel et al. 1983). The solid line indicates the field giant color-color relation from Frogel et al. (1978). The position of N*, corrected for line-of-sight cluster reddening, is indicated by the open circle labeled N •. The arrow shows the effect of a hypothetical local absorption of A 0 = 1.0 mag (see§ IVb for discussion). (b) CO index0 vs.(V - K)0 • The definition of symbols is as for (a). The horizontal bar through the N * position indicates the uncertainty in its (V - K)0 color,
reddening component of interstellar or circumstellar ongm would be required in order to account for its very red broad band colors. This case is illustrated in Figures 5a and 5b, where the reddening arrow indicates the effect of an additional extinction of A. = 1.0 mag. This topic is revisited in § IV a.
The radial velocity ofN*, based on the Ca 1 and Hix absorption features, is - 86 ± 10 km s - 1.
c) 10 and 20 Micron Observations
While the 20 µm source is centered on the stellar pair to within 2", and this emission has been identified with the IRAS 18333-2357 source(§ II), the present observations are inade-
quate to discriminate positionally between the three optical sources as to the origin of the infrared excess.
The ground-based measurements of 10 and 20 µm flux density in a 6" diameter beam are a factor of 2-3 less than the interpolation/extrapolation of the 12 and 25 µm IRAS flux densities (cf. Fig. 6). The flux difference at 10 µmis likely to be the result of several objects of similar brightness, including M22-V8 and V-1, in the IRAS 12 µm beam. However, at 20 and 25 µm, IRAS 18333-2357 is the dominant source in the vicinity of M22. There is no indication from either the groundbased IR TF or I RAS observations (Paper I) that the emitting source around 20 µm is significantly exten~ed. The 20 µm
© American Astronomical Society • Provided by the NASA Astrophysics Data System
1989ApJ...338..862G
No. 2, 1989 OPTICAL/IR COUNTERPART(S) OF IRAS 18333-2357 871
-C\J
E ' 3:
-~ ~
-11 10
-12 10
-13 10
0.01 0.1 1.0
WAVELENGTH (µ.m)
10 100
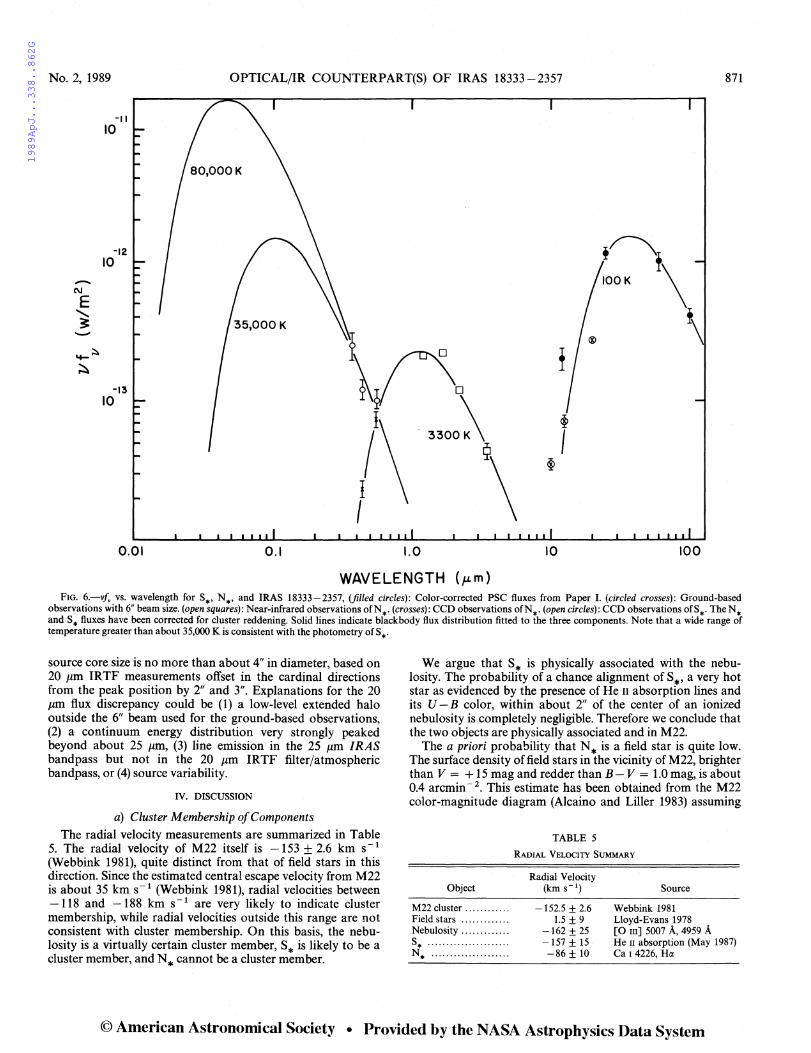
Fm. 6.-vfv vs. wavelength for S*, N., and IRAS 18333-2357, (filled circles): Color-corrected PSC fluxes from Paper I. (circled crosses): Ground-based observations with 6" beam size. (open squares): Near-infrared observations ofN •. (crosses): CCD observations ofN •. (open circles): CCD observations ofS*. The N* and s. fluxes have been corrected for cluster reddening. Solid lines indicate blackbody flux distribution fitted to the three components. Note that a wide range of temperature greater than about 35,000 K is consistent with the photometry of s •.
source core size is no more than about 4" in diameter, based on 20 µm IRTF measurements offset in the cardinal directions from the peak position by 2" and 3". Explanations for the 20 µm flux discrepancy could be (1) a low-level extended halo outside the 6" beam used for the ground-based observations, (2) a continuum energy distribution very strongly peaked beyond about 25 µm, (3) line emission in the 25 µm I RAS bandpass but not in the 20 µm IRTF filter/atmospheric bandpass, or (4) source variability.
IV. DISCUSSION
a) Cluster Membership of Components
The radial velocity measurements are summarized in Table 5. The radial velocity of M22 itself is -153 ± 2.6 km s- 1
(Webbink 1981), quite distinct from that of field stars in this direction. Since the estimated central escape velocity from M22 is about 35 km s - 1 (Webbink 1981 ), radial velocities between -118 and - 188 km s - 1 are very likely to indicate cluster membership, while radial velocities outside this range are not consistent with cluster membership. On this basis, the nebulosity is a virtually certain cluster member, s* is likely to be a cluster member, and N* cannot be a cluster member.
We argue that S* is physically associated with the nebulosity. The probability of a chance alignment of S*, a very hot star as evidenced by the presence of He n absorption lines and its U - B color, within about 2" of the center of an ionized nebulosity is completely negligible. Therefore we conclude that the two objects are physically associated and in M22.
The a priori probability that N* is a field star is quite low. The surface density offield stars in the vicinity of M22, brighter than V = + 15 mag and redder than B - V = 1.0 mag, is about 0.4 arcmin - 2 • This estimate has been obtained from the M22 color-magnitude diagram (Alcaino and Liller 1983) assuming
Object
M22 cluster ........... . Field stars ............ . Nebulosity ............ .
s* ······················ N* .................... .
TABLE 5
RADIAL VEWCITY SUMMARY
Radial Velocity (km s- 1)
-152.5 ± 2.6 1.5 ± 9
-162 ± 25 -157 ± 15 -86 ± 10
Source
Webbink 1981 Lloyd-Evans 1978 [O III] 5007 A, 4959 A He n absorption (May 1987) Ca 1 4226, Hrx
© American Astronomical Society • Provided by the NASA Astrophysics Data System
1989ApJ...338..862G
872 GILLETT ET AL. Vol. 338
that stars not closely associated with the M22 giant branch are field stars. Thus one would expect only about one such field star within 1' of the center of M22 and the probability of a chance alignment of a field star within 2" of the M22 nebula-S* system is only about 10- 3. In spite of this, the radial velocity of N* would appear to rule out cluster membership. If N* is a field star, then its broad-band colors are substantially redder, by ,..., 1-1.5 mag in V -K, than expected for field stars with strong Ca I 4226 and no TiO features. This additional reddening could be due to interstellar extinction in or beyond M22 or to possible circumstellar extinction local to N * itself. However, the measured CO index (Fig. 5b) is not consistent with an early spectral type for N*. Thus this star appears to be quite peculiar in its properties, and no consistent picture of this object has emerged.
b) Relationship to IRAS 18333-2357
In Paper I it was suggested, among other possibilities, that IRAS 18333-2357 may be related to planetary nebula-like objects because of its unusual infrared energy distribution. Its continuum energy distribution is quite similar to that of many planetary nebulae in the PSC and unlike that of most circumstellar dust shells around cool stars. This argument also strongly suggests a physical association of IRAS 18333- 2357 and the M22 nebulosity-S* pair.
A luminosity comparison also supports this point of view. Figure 6 shows the observed energy distributions for IRAS 18333-2357, N*, and S*. The optical and near-infrared observations have been corrected for a line-of-sight reddening of E(B - V) = 0.32. In this plot, blackbodies with the same peak vfv have the same integrated flux, and therefore the same luminosity, if at the same distance. The integrated flux ofN* is only about 0.15 that of IRAS 18333-2357; thus it appears that this star cannot be the luminosity source for IRAS 18333- 2357 unless it is very heavily attenuated by local absorbing dust. The integrated flux of N*, even with the assumption of an additional Av = 1 mag, as indicated in Figures 5a and 5b, is still a factor of 3 less than that of IRAS 18333-2357.
On the other hand, there is some evidence that the integrated flux of S*' while very uncertain, may be substantially larger than that ofIRAS 18333-2357. Blackbody energy distributions for temperatures of 35,000 and 80,000 K, adjusted to agree with the flux density of S* at B, are shown in Figure 6, illustrating the cases of equal and 10 x the integrated flux density ofIRAS 18333-2357. Either temperature is consistent with the broad-band photometry of S*, while the spectrum of S* is roughly similar to those of planetary nebula nuclei with effective temperatures in the range 60,000--100,000 K (Mendez, Kudritzki, and Simon 1985). The luminosity of S* is approximately given by 700[T(S*)/35,000]3 L 0 ; thus it would be the most luminous star in M22 if its effective temperature exceeds about 55,000 K.
An additional argument supporting the association of IRAS 18333-2357 and the S*-M22 nebula may be derived from estimating the grain equilibrium temperature in a dust cloud coincident with the [O III] 5007 A nebula heated by S*. Assuming 0.1 11m amorphous carbon grains with Q,..., A. - 1 for A.> 0.1 µm, a dust cloud radius of 4", and the L, T relation given above, one derives equilibrium dust temperatures of 63 K, 77 K, and 103 K for values of T (S*) = 35,000 K, 50,000 K, and 80,000 K, respectively. This picture is self-consistent in terms of the expected temperature range for s* and the ,..., 100
K far-infrared energy distribution of IRAS 18333-2357 (Paper I).
We conclude that the most likely luminosity source for IRAS 18333-2357 is S*. This conclusion is consistent with association of IRAS 18333-2357 with the S*-M22 nebula system.
c) Nebular Properties i) Abundances
Lower limits to the relative abundance of oxygen and neon can be obtained from the observed line ratio limits, given assumptions about the electron density and temperature. An upper limit of 20,000 K for the electron temperature can be determined from the lower limit to the [O III] (5007 +4959)/ [O III] 4363 line ratio. In the following discussion, we assume that the electron temperature is 10,000 K, a value typical of planetary nebulae.
With the relations from Aller (1985) and the upper limits to the Hix, He n 4686 and He I 5876 lines, then N(O+ +)/ N(H+) > 8 x 10- 3, N(o++)/N(He++) > 2 x 10- 2, and N(O+ +)/N(He+) > 5.5 x 10- 3• If all the oxygen is in the form of 0 III, then its relative abundance compared to solar (Aller and Czyzak 1983) is [O/H] > +l.O and [O/He] > -0.1; where [X/H] =log (X/H) - log (X/H) Sun. Similarly, the relative intensity of [Ne III] 3869 A corresponds to [Ne/ HJ> + 1.9 and [Ne/He]> +0.8.
The above abundance limits for the M22 nebula are grossly unlike the envelope composition of M22 stars. M22 is a very metal-poor globular cluster, with [Fe/HJ = -1.8 to -1.9 (Cohen 1981; Alcaino and Liller 1983 and references therein). Stars in metal-poor clusters tend to be somewhat overabundant in oxygen relative to Fe (see, e.g., Pilachowski, Sneden, and Wallerstein 1983); thus [O/H] for M22 stars may be about -1.5. Therefore, the oxygen abundance (and that of Ne) in the M22 nebula appears to be enhanced by at least a factor of 500 with respect to hydrogen and 30 with respect to helium when compared to typical cluster stars.
H n regions with an overabundance of heavy elements are generally characterized by electron temperatures that are lower than 10,000 K since the heavy ions, particularly those of oxygen, are the dominant cooling mechanism (e.g., Price 1981). Assuming a lower electron temperature for the M22 nebula would lead to even larger overabundances of oxygen and neon relative to helium and hydrogen. In fact, nebulae such as A30, having a large overabundance of heavy ions, should have very low electron temperatures if the only heating mechanism is photoionization. If this were true, the [O III] A.5007 line would be very weak, which it is not. Harrington and Feibelman (1984) find a similar situation for A30 and attribute the necessary heating to the interaction between the nebula and a strong stellar wind from the central star.
ii) Nebular Mass
In this discussion, the M22 nebula is treated as a simple, uniform density sphere of radius 3", an electron temperature of 10,000 K, and an integrated [O m] 5007 A line flux of 3 x 10- 16 W m- 2 . With these simplifying assumptions, the mass of 0 III and the total ionized gas mass are still substantially uncertain because of (1) unknown ionization equilibrium and (2) uncertain electron density in the nebula as a result of nondetection of hydrogen and helium recombination lines.
In order to illustrate the range of potential nebular mass, two examples are evaluated: (1) H and He abundances corre-
©American Astronomical Society • Provided by the NASA Astrophysics Data System
1989ApJ...338..862G
No. 2, 1989 OPTICAL/IR COUNTERPART(S) OF IRAS 18333-2357 873
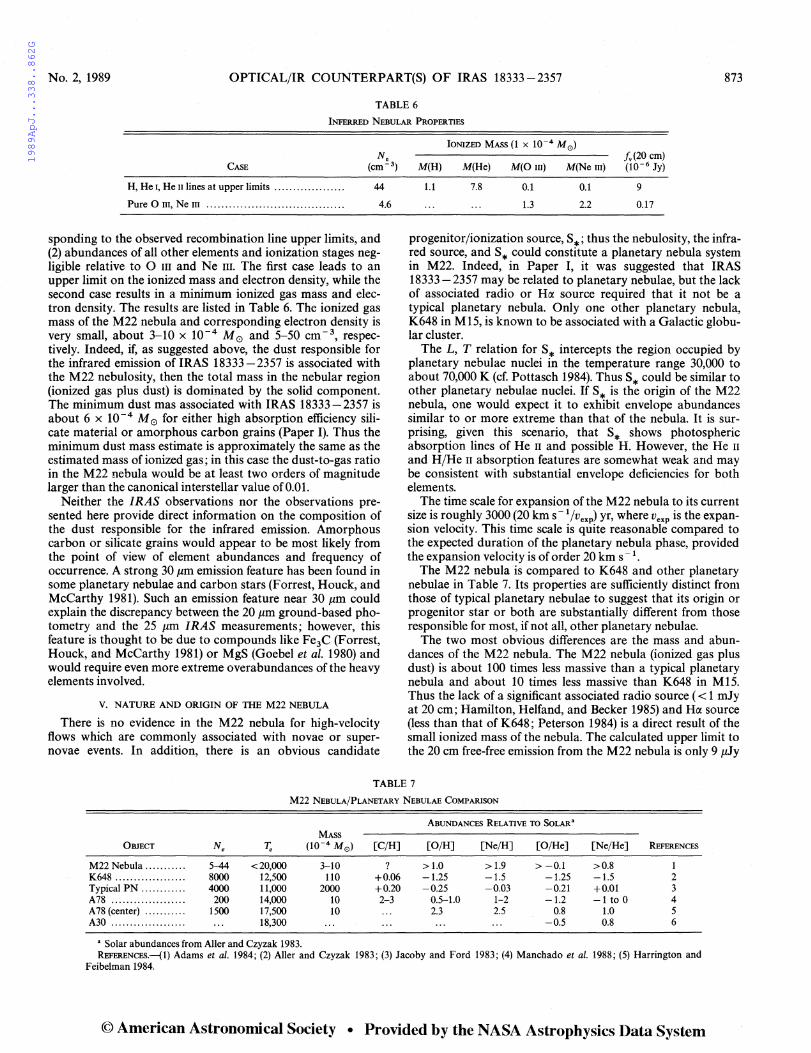
TABLE 6
INFERRED NEBULAR PROPERTIES
N. CASE (cm-')
H, He 1, He n lines at upper limits ................... 44
Pure 0 III, Ne 111 ····································· 4.6
sponding to the observed recombination line upper limits, and (2) abundances of all other elements and ionization stages negligible relative to 0 m and Ne m. The first case leads to an upper limit on the ionized mass and electron density, while the second case results in a minimum ionized gas mass and electron density. The results are listed in Table 6. The ionized gas mass of the M22 nebula and corresponding electron density is very small, about 3-10 x 10- 4 M 0 and 5-50 cm - 3, respectively. Indeed, if, as suggested above, the dust responsible for the infrared emission ofIRAS 18333-2357 is associated with the M22 nebulosity, then the total mass in the nebular region (ionized gas plus dust) is dominated by the solid component. The minimum dust mas associated with IRAS 18333-2357 is about 6 x 10⁻⁴ M 0 for either high absorption efficiency silicate material or amorphous carbon grains (Paper I). Thus the minimum dust mass estimate is approximately the same as the estimated mass of ionized gas; in this case the dust-to-gas ratio in the M22 nebula would be at least two orders of magnitude larger than the canonical interstellar value of0.01.
Neither the IRAS observations nor the observations presented here provide direct information on the composition of the dust responsible for the infrared emission. Amorphous carbon or silicate grains would appear to be most likely from the point of view of element abundances and frequency of occurrence. A strong 30 µm emission feature has been found in some planetary nebulae and carbon stars (Forrest, Houck, and McCarthy 1981). Such an emission feature near 30 µm could explain the discrepancy between the 20 µm ground-based photometry and the 25 µm IRAS measurements; however, this feature is thought to be due to compounds like Fe3C (Forrest, Houck, and McCarthy 1981) or MgS (Goebel et al. 1980) and would require even more extreme overabundances of the heavy elements involved.
V. NATURE AND ORIGIN OF TIIE M22 NEBULA
There is no evidence in the M22 nebula for high-velocity flows which are commonly associated with novae or supernovae events. In addition, there is an obvious candidate
f.(20cm) M(H) M(He) M(Om) M(Nem) (10-6 Jy)
1.1 7.8 0.1 0.1 9
1.3 2.2 0.17
progenitor/ionization source, S*; thus the nebulosity, the infrared source, and S* could constitute a planetary nebula system in M22. Indeed, in Paper I, it was suggested that IRAS 18333- 2357 may be related to planetary nebulae, but the lack of associated radio or Hix source required that it not be a typical planetary nebula. Only one other planetary nebula, K648 in Ml5, is known to be associated with a Galactic globular cluster.
The L, T relation for S* intercepts the region occupied by planetary nebulae nuclei in the temperature range 30,000 to about 70,000 K (cf. Pottasch 1984). Thus S* could be similar to other planetary nebulae nuclei. If S* is the origin of the M22 nebula, one would expect it to exhibit envelope abundances similar to or more extreme than that of the nebula. It is surprising, given this scenario, that S* shows photospheric absorption lines of He 11 and possible H. However, the He II
and H/He II absorption features are somewhat weak and may be consistent with substantial envelope deficiencies for both elements.
The time scale for expansion of the M22 nebula to its current size is roughly 3000 (20 km s- 1 /vexp) yr, where Vexp is the expansion velocity. This time scale is quite reasonable compared to the expected duration of the planetary nebula phase, provided the expansion velocity is of order 20 km s - 1 •
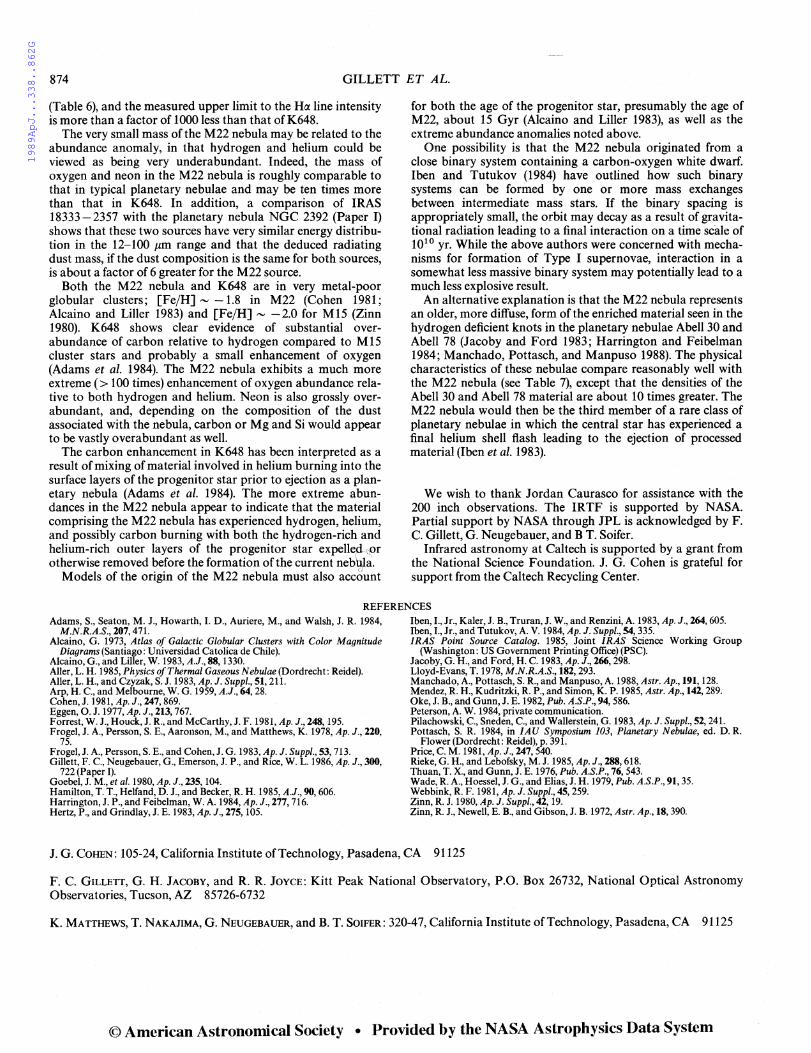
The M22 nebula is compared to K648 and other planetary nebulae in Table 7. Its properties are sufficiently distinct from those of typical planetary nebulae to suggest that its origin or progenitor star or both are substantially different from those responsible for most, if not all, other planetary nebulae.
The two most obvious differences are the mass and abundances of the M22 nebula. The M22 nebula (ionized gas plus dust) is about 100 times less massive than a typical planetary nebula and about 10 times less massive than K648 in M15. Thus the lack of a significant associated radio source ( < 1 mJy at 20 cm; Hamilton, Helfand, and Becker 1985) and Hix source (less than that of K648; Peterson 1984) is a direct result of the small ionized mass of the nebula. The calculated upper limit to the 20 cm free-free emission from the M22 nebula is only 9 µJy
TABLE 7
M22 NEBULA/PLANETARY NEBULAE CoMPARISON
ABUNDANCES RELATIVE TO SoLAR4
MASS OBJECT N, r. (10-4 M0) [C/H] [O/H] [Ne/H] [O/He] [Ne/He] REFERENCES
M22Nebula .......... . 5-44 <20,000 3-10 ? >1.0 > 1.9 >-0.1 >0.8 1 K648 .................. . 8000 12,500 110 +0.06 -1.25 -1.5 -1.25 -1.5 2 Typical PN ........... . 4000 11,000 2000 +0.20 -0.25 -0.03 -0.21 +0.01 3 A78 ................... . 200 14,000 10 2-3 05-1.0 1-2 -1.2 -1 to 0 4 A78 (center) .......... . 1500 17,500 10 2.3 2.5 0.8 1.0 5 A30 ................... . 18,300 -0.5 0.8 6
• Solar abundances from Aller and Czyzak 1983. REFERENCES.-{1) Adams et al. 1984; (2) Aller and Czyzak 1983; (3) Jacoby and Ford 1983; (4) Manchado et al. 1988; (5) Harrington and
Feibelman 1984.
© American Astronomical Society • Provided by the NASA Astrophysics Data System
1989ApJ...338..862G
874 GILLETT ET AL.
(Table 6), and the measured upper limit to the Hoc line intensity is more than a factor of 1000 less than that ofK648.
The very small mass of the M22 nebula may be related to the abundance anomaly, in that hydrogen and helium could be viewed as being very underabundant. Indeed, the mass of oxygen and neon in the M22 nebula is roughly comparable to that in typical planetary nebulae and may be ten times more than that in K648. In addition, a comparison of IRAS 18333 - 2357 with the planetary nebula NGC 2392 (Paper I) shows that these two sources have very similar energy distribution in the 12-100 µm range and that the deduced radiating dust mass, if the dust composition is the same for both sources, is about a factor of 6 greater for the M22 source.
Both the M22 nebula and K648 are in very metal-poor globular clusters; [Fe/HJ ,.,,, -1.8 in M22 (Cohen 1981; Alcaino and Liller 1983) and [Fe/HJ,.,,, -2.0 for M15 (Zinn 1980). K648 shows clear evidence of substantial overabundance of carbon relative to hydrogen compared to M15 cluster stars and probably a small enhancement of oxygen (Adams et al. 1984). The M22 nebula exhibits a much more extreme ( > 100 times) enhancement of oxygen abundance relative to both hydrogen and helium. Neon is also grossly overabundant, and, depending on the composition of the dust associated with the nebula, carbon or Mg and Si would appear to be vastly overabundant as well.
The carbon enhancement in K648 has been interpreted as a result of mixing of material involved in helium burning into the surface layers of the progenitor star prior to ejection as a planetary nebula (Adams et al. 1984). The more extreme abundances in the M22 nebula appear to indicate that the material comprising the M22 nebula has experienced hydrogen, helium, and possibly carbon burning with both the hydrogen-rich and helium-rich outer layers of the progenitor star expellefi:~or otherwise removed before the formation of the current nebtya.
Models of the origin of the M22 nebula must also account
for both the age of the progenitor star, presumably the age of M22, about 15 Gyr (Alcaino and Liller 1983), as well as the extreme abundance anomalies noted above.
One possibility is that the M22 nebula originated from a close binary system containing a carbon-oxygen white dwarf. Iben and Tutukov (1984) have outlined how such binary systems can be formed by one or more mass exchanges between intermediate mass stars. If the binary spacing is appropriately small, the orbit may decay as a result of gravitational radiation leading to a final interaction on a time scale of 1010 yr. While the above authors were concerned with mechanisms for formation of Type I supernovae, interaction in a somewhat less massive binary system may potentially lead to a much less explosive result.
An alternative explanation is that the M22 nebula represents an older, more diffuse, form of the enriched material seen in the hydrogen deficient knots in the planetary nebulae Abell 30 and Abell 78 (Jacoby and Ford 1983; Harrington and Feibelman 1984; Manchado, Pottasch, and Manpuso 1988). The physical characteristics of these nebulae compare reasonably well with the M22 nebula (see Table 7), except that the densities of the Abell 30 and Abell 78 material are about 10 times greater. The M22 nebula would then be the third member of a rare class of planetary nebulae in which the central star has experienced a final helium shell flash leading to the ejection of processed material (Iben et al. 1983).
We wish to thank Jordan Caurasco for assistance with the 200 inch observations. The IRTF is supported by NASA. Partial support by NASA through JPL is acknowledged by F. C. Gillett, G. Neugebauer, and BT. Soifer.
Infrared astronomy at Caltech is supported by a grant from the National Science Foundation. J. G. Cohen is grateful for support from the Caltech Recycling Center.
REFERENCES
Adams, S., Seaton, M. J., Howarth, I. D., Auriere, M., and Walsh, J. R. 1984, M.N.R.A.S., 207, 471.
Alcaino, G. 1973, Atlas of Galactic Globular Clusters with Color Magnitude Diagrams (Santiago: Universidad Catolica de Chile).
Alcaino, G., and Liller, W. 1983, A.J., 88, 1330. Aller, L. H. 1985, Physics of Thermal Gaseous Nebulae (Dordrecht: Reidel). Aller, L. H., and Czyzak, S. J. 1983, Ap. J. Suppl., 51, 211. Arp, H. C., and Melbourne, W. G. 1959, A.J., 64, 28. Cohen, J. 1981, Ap. J., 247, 869. Eggen, 0. J. 1977, Ap. J., 213, 767. Forrest, W. J., Houck, J. R., and McCarthy, J. F. 1981, Ap. J., 248, 195. Frogel, J. A., Persson, S. E., Aaronson, M., and Matthews, K. 1978, Ap. J., 220,
15. Frogel, J. A., Persson, S. E., and Cohen,J. G. 1983, Ap. J. Suppl., 53, 713. Gillett, F. C., Neugebauer, G., Emerson, J.P., and Rice, W. L. 1986, Ap. J., 300,
722 (Paper I). Goebel, J.M., et al. 1980, Ap. J., 235, 104. Hamilton, T. T., Helfand, D. J., and Becker, R.H. 1985, A.J., 90, 606. Harrington, J.P., and Feibelman, W. A. 1984, Ap. J., 277, 716. Hertz, P., and Grindlay, J.E. 1983, Ap. J., 275, 105.
Iben, I., Jr., Kaler, J. B., Truran, J. W., and Renzini, A. 1983, Ap. J., 264, 605. Iben, I., Jr., and Tutukov, A. V. 1984, Ap. J. Suppl., 54, 335. IRAS Point Source Catalog. 1985, Joint IRAS Science Working Group
(Washington: US Government Printing Office) (PSC). Jacoby, G. H., and Ford, H. C. 1983, Ap. J., 266, 298. Lloyd-Evans, T. 1978, M.N.R.A.S., 182, 293. Manchado, A., Pottasch, S. R., and Manpuso, A. 1988, Astr. Ap., 191, 128. Mendez, R.H., Kudritzki, R. P., and Simon, K. P. 1985, Astr. Ap., 142, 289. Oke, J. B., and Gunn, J. E. 1982, Pub. A.S.P., 94, 586. Peterson, A. W. 1984, private communication. Pilachowski, C., Sneden, C., and Wallerstein, G. 1983, Ap. J. Suppl., 52, 241. Pottasch, S. R. 1984, in IAU Symposium I03, Planetary Nebulae, ed. D.R.
Flower (Dordrecht: Reidel), p. 391. Price, C. M. 1981, Ap. J., 247, 540. Rieke, G. H., and Lebofsky, M. J. 1985, Ap. J., 288, 618. Thuan, T. X., and Gunn, J.E. 1976, Pub. A.S.P., 76, 543. Wade, R. A., Hoessel, J. G., and Elias, J. H. 1979, Pub. A.S.P., 91, 35. Webbink, R. F. 1981, Ap. J. Suppl., 45, 259. Zinn, R. J. 1980, Ap. J. Suppl., 42, 19. Zinn, R. J., Newell, E. B., and Gibson, J. B. 1972, Astr. Ap., 18, 390.
J. G. COHEN: 105-24, California Institute of Technology, Pasadena, CA 91125
F. C. GILLETT, G. H. JACOBY, and R.R. JOYCE: Kitt Peak National Observatory, P.O. Box 26732, National Optical Astronomy Observatories, Tucson, AZ 85726-6732
K. MATTHEWS, T. NAKAJIMA, G. NEUGEBAUER, and B. T. SOIFER: 320-47, California Institute of Technology, Pasadena, CA 91125
© American Astronomical Society • Provided by the NASA Astrophysics Data System