Embed Size (px)
Citation preview

The Opposing Forces that Shape Developmental Education: Assessment, Placement, and Progression
at CUNY Community Colleges
Shanna Smith Jaggars and Michelle Hodara
November 2011
CCRC Working Paper No. 36
Address correspondence to: Shanna Smith Jaggars Senior Research Associate, Community College Research Center Teachers College, Columbia University 525 West 120th Street, Box 174 New York, NY 10027 212-678-3091 Email: [email protected] This research was funded by the Bill & Melinda Gates Foundation. The authors gratefully acknowledge the helpful comments provided by Thomas Bailey, Nikki Edgecombe, Katherine Hughes, Judith Scott-Clayton, Dolores Perin, Olga Rodriguez, Susan Bickerstaff, and David Crook.
Abstract
The developmental education process, as it is typically implemented in colleges across the country, seems straightforward: underprepared students are assessed and placed into an appropriate developmental course sequence designed to prepare them for college-level work; once finished with the sequence, these students presumably then move on to success in college. Analyses of student progression through developmental education reveal, however, that this seemingly straightforward process is rife with complexity and confusion, and results in poor outcomes for the majority of developmental students.
Various explanations have been advanced to explain developmental students’ lack of progression, including inadequate test preparation, insufficiently predictive exams, poorly aligned curricula, uninspiring skill-and-drill instruction, and the sheer length of time and financial resources required to finish a long sequence of courses (Edgecombe, 2011a; Grubb, 2010; Hughes & Scott-Clayton, 2011). Each explanation implies that the developmental system is broken and that one or more specific fixes will mend it. Yet underlying these issues is a deeper and more vexing question: Why is the system broken?
Based on a case study of the City University of New York’s six community colleges, this report proposes a new opposing forces framework for understanding the dysfunction of the developmental system. We identify three sets of opposing forces that shape developmental policy and practice: system-wide consistency versus institutional autonomy, efficient versus effective assessment, and promotion of student progression versus enforcement of academic standards. Within each set, both goals are important and worthy, both are championed by key stakeholders in the system, and both have direct impacts on developmental policy. However, while the two goals may not be absolutely irreconcilable, they tend to work in opposition to one another and may create frustration on the part of administrators and faculty, confusion on the part of students, and poor outcomes overall.
We begin the report by outlining the opposing forces framework and by discussing how the tensions inherent in the framework are apparent at the national level. We then use CUNY as a case study to describe in detail how each of the three tensions shape developmental policies, practices, and student progression patterns. Finally, we provide suggestions on how colleges nationwide can bring apparently opposing forces into alignment and thus create a system that works to meet all its stakeholders’ goals.
Table of Contents
1. Introduction................................................................................................................... 1
2. Three Sets of Opposing Forces .................................................................................... 4 2.1 System-Wide Consistency Versus Institutional Autonomy..................................... 4 2.2 Efficient Versus Effective Assessment .................................................................... 6 2.3 Supporting Student Progression and Enforcing Academic Standards ..................... 7
3. The CUNY Case Study ................................................................................................. 9 3.1 Qualitative Data Collection...................................................................................... 9 3.2 Quantitative Analysis ............................................................................................. 10 3.3 System Policy During the Quantitative Study Period (2004–2009) ...................... 10
4. System-Wide Consistency and Institutional Autonomy at CUNY......................... 11 4.1 Placement Testing .................................................................................................. 12 4.2 Developmental Education Programming ............................................................... 15 4.3 Subject-Area Department Autonomy..................................................................... 19 4.4 Summary of the Tension Between Consistency and Autonomy at CUNY ........... 21
5. Sufficient Versus Effective Assessment at CUNY.................................................... 22 5.1 Math Exams ........................................................................................................... 22 5.2 Writing Exams ....................................................................................................... 28 5.3 Summary of Efficiency Versus Effectiveness at CUNY ....................................... 32
6. Supporting Student Progression Versus Enforcing Academic Standards at CUNY.......................................................................................................................................... 34
6.1 Student Progression................................................................................................ 34 6.2 Enforcing Academic Standards.............................................................................. 46 6.3 Summary of Progression Versus Standards at CUNY........................................... 49
7. Discussion: Reconciling Opposing Forces ................................................................ 50 7.1 Consistency that Allows for Flexibility ................................................................. 50 7.2 Efficient Assessment that Aligns with Treatment.................................................. 53 7.3 Supporting Progression While Maintaining Academic Standards......................... 56 7.4 Final Thoughts ....................................................................................................... 58
References........................................................................................................................ 60 Appendix A: Technical Definitions ............................................................................... 64 Appendix B: Qualitative Methodology ......................................................................... 66 Appendix C: Report Data .............................................................................................. 68 Appendix D: Developmental Course-Taking Requirements ...................................... 71 Appendix E: Persistence and Attrition ......................................................................... 73 Appendix F: Progression Through Developmental Education................................... 75 Appendix G: Additional Analysis—Persistence by Progression Category ............... 79 Appendix H: The Role of Sequence Length ................................................................. 84

1
1. Introduction
The majority of students who enter community college are deemed academically
underprepared for college-level work (Attewell, Lavin, Domina, & Levey, 2006; Bailey,
Jeong, & Cho, 2010). As a result, most community colleges devote substantial
instructional and institutional resources to developmental education—courses in basic
reading, writing, and mathematics skills.
The developmental education process, as it is typically implemented in colleges
across the country, seems straightforward. Incoming students take short, standardized
placement exams designed to measure skill levels in reading, writing, and mathematics
(Hughes & Scott-Clayton, 2011). Taking math as an example, students who score above a
college-determined cutoff are viewed as ready to take college-level math courses.
Students who score below the cutoff are referred to developmental math. Many colleges
also use secondary cutoffs to sort developmental students into different course levels; for
example, while a student scoring barely below the math cutoff may need to take only a
developmental algebra course, a student scoring far below the cutoff may need to take a
sequence of three courses (e.g., arithmetic, pre-algebra, and algebra). After completing
the recommended developmental math sequence, the student proceeds to college-level
math and presumably to success in other math-related courses in his or her program of
study.
Analyses of student progression through developmental education reveal,
however, that the system is more complex than the above description implies. One aspect
of this complexity is that many students are unaware of the purpose and high-stakes
consequences of the placement exams and thus often perform more poorly than their self-
perceived ability, breeding confusion and frustration at the outset of the process (Venezia,
Bracco, & Nodine, 2010). In addition, after receiving their recommended placement,
many developmental students never enroll in the first course in the sequence. Some avoid
developmental education by taking unrelated college-level coursework, others find ways
to circumvent developmental courses and “skip ahead” into college-level math or English,
and others disappear from the college entirely (Bailey, Jaggars, & Cho, 2010; Jenkins,
Jaggars, Roksa, Zeidenberg, & Cho, 2009). Finally, the majority of students who do
enroll in developmental education stall halfway through and never reach the end of the
2
sequence, much less move on to college-level courses and eventual completion of
degrees (Bailey, Jeong, et al., 2010; Jenkins et al., 2009). For example, among recent
high school graduates who took at least one developmental course in community college,
only about a quarter earned a degree within eight years (Attewell et al., 2006).
Various explanations have been advanced to explain developmental students’ lack
of progression, including inadequate test preparation, insufficiently predictive exams,
poorly aligned curricula, uninspiring skill-and-drill instruction, and the sheer length of
time and financial resources required to finish a long sequence of courses (Edgecombe,
2011a; Grubb, 2010; Hughes & Scott-Clayton, 2011). Each explanation implies that the
developmental system is broken and that one or more specific fixes will mend it. Yet
underlying these seemingly straightforward issues is a deeper and more vexing question:
Why is the system broken?
These complexities and unanswered questions provided the impetus for
examining developmental assessment, placement, and progression in more detail. The
City University of New York (CUNY), a higher education system comprised of 23
institutions scattered across the five boroughs of New York City, provides an excellent
setting for an in-depth case study of these issues.
Developmental education has long been a critical issue for CUNY (e.g., Schmidt
et al., 1999). In 1999, the system shifted the bulk of its remedial function to its six
community colleges;1 underprepared students aiming for a four-year college program
were now required to successfully complete remediation prior to enrollment in that
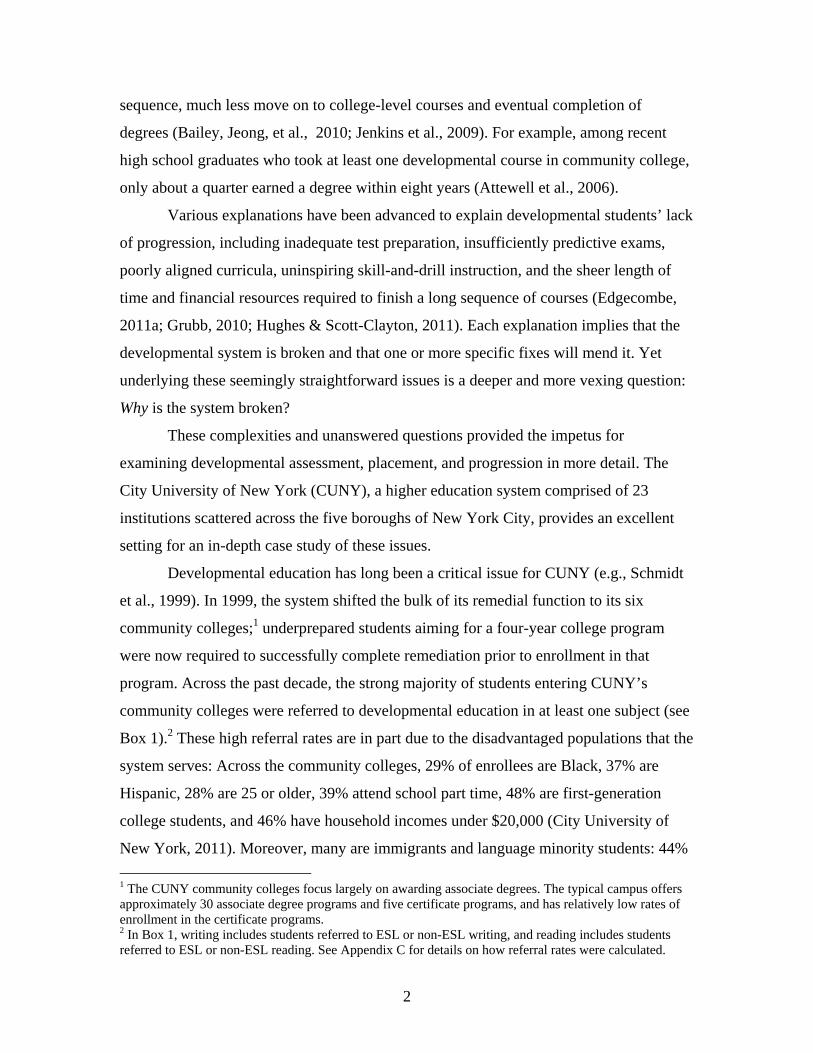
program. Across the past decade, the strong majority of students entering CUNY’s
community colleges were referred to developmental education in at least one subject (see
Box 1).2 These high referral rates are in part due to the disadvantaged populations that the
system serves: Across the community colleges, 29% of enrollees are Black, 37% are
Hispanic, 28% are 25 or older, 39% attend school part time, 48% are first-generation
college students, and 46% have household incomes under $20,000 (City University of
New York, 2011). Moreover, many are immigrants and language minority students: 44% 1 The CUNY community colleges focus largely on awarding associate degrees. The typical campus offers approximately 30 associate degree programs and five certificate programs, and has relatively low rates of enrollment in the certificate programs. 2 In Box 1, writing includes students referred to ESL or non-ESL writing, and reading includes students referred to ESL or non-ESL reading. See Appendix C for details on how referral rates were calculated.
3
of CUNY’s community college students were born outside the U.S. mainland, and an
estimated 46% speak a native language other than English (City University of New York,
2011).
Box 1 CUNY CC Developmental Referral Rates, 2004–2008 Cohorts3
Any developmental 82%
Mathematics 64%
Writing 56%
Reading 24%
CUNY has been contemplating developmental reform for several years, and
interest in reform quickened as the system began planning a seventh community college,
which administrators are explicitly designing around principles and practices thought to
support student success. To help understand whether the system’s current policies and
practices were bringing about their intended outcomes, we collected and analyzed both
qualitative and quantitative data to answer two broad research questions:
1. What are the developmental education assessment and placement policies and practices at the community colleges of the City University of New York?
2. What are the impacts of these policies and practices on student progression and educational outcomes?
As we investigated these questions, we began to see that developmental assessment
and placement policy are shaped by a variety of goals, each of which may work toward
opposite ends. Based on this observation, the current report sets forth a new framework,
the opposing forces framework, for analyzing developmental education policy and
practice based on three sets of opposing forces: system-wide consistency versus
institutional autonomy, efficient versus effective assessment, and promotion of student
progression versus enforcement of academic standards. While the opposing forces
framework was derived from our work with CUNY, the tensions described by the
framework are immediately helpful in clarifying why the developmental education
system is broken on a national level.
3 For a definition of cohort and other technical terms that appear throughout the report, see Appendix A.
4
We begin the report by outlining the opposing forces framework and by
discussing how the tensions inherent in the framework are apparent at the national level.
We then use CUNY as a case study to describe in detail how each of the three tensions
shape developmental policies, practices, and student progression patterns. Finally, we
provide suggestions on how colleges nationwide can bring apparently opposing forces
into alignment and thus create a system that works to meet all its stakeholders’ goals.
2. Three Sets of Opposing Forces
In order for any system to work smoothly, its component pieces must be aligned.
Consider the design of a mechanical system, such as a wind-up watch, a watermill, or a
steam-powered engine. If two interlocking gears are poorly designed, struggling against
one another in opposite directions, the machine will seize up and may break under the
strain. Simply mending the broken gears and reintroducing them into the same positions
will not fix the system. Instead, the gears—and their relations to one another—must be
rethought and redesigned. In this section, we apply this notion to the developmental
education system and describe three sets of potentially opposing goals. Within each set,
both goals are important and worthy, both are championed by key stakeholders in the
system, and both have a direct impact on developmental policy. However, while the two
goals may not be absolutely irreconcilable, they tend to work in opposition to one another
and thus may create frustration on the part of administrators and faculty, confusion on the
part of students, and poor outcomes overall.
2.1 System-Wide Consistency Versus Institutional Autonomy
In decentralized community college systems, individual institutions typically
retain the autonomy to choose their own placement tests and cutoff scores, to determine
whether developmental education is required or merely recommended, and to design their
own developmental education course sequences. Such flexibility may allow institutions
to tailor a developmental system that works as effectively as possible for its particular
mix of students. For example, vendors of the most commonly used placement tests
recommend that institutions reexamine cut scores every few years with an eye to the
5
school’s changing student characteristics and course requirements (Morgan &
Michaelides, 2005).
Yet decentralized systems are frequently criticized for creating confusion or even
inequity through inconsistent standards. In Ohio, for example, Bettinger and Long (2003)
found that a given student’s probability of enrolling in developmental education varied
quite widely across potential community colleges. As an illustration, “while an individual
might have a 20 percent chance of remediation at one community college, they may have
a 90 percent chance at another” (Bettinger & Long, 2003, p. 18). While a 70-point range
in probability may initially seem an exaggeration for effect, their research found that the
average student’s range in probability was even wider (at 74.5 points). Such
inconsistencies across colleges would likely confuse and frustrate students, if they were
aware of them; however, most students choose a community college on the basis of
proximity (Bettinger & Long, 2003) and seem generally unaware of the issue of
remediation standards until after they apply (Venezia et al., 2010). Perhaps more
consequentially, differing standards across colleges send mixed messages to high schools
in terms of how to prepare students to be “college ready.” Moreover, proponents of
consistency note that common requirements make it more feasible for systems to track
student performance across colleges and to smooth the process of student transfer
between colleges (Prince, 2005). Due in part to these arguments, many states have
recently moved toward common placement tests and cut scores across colleges in each
system (Hughes & Scott-Clayton, 2011).
One example of the struggle between autonomy and consistency has played out in
Texas, where at the turn of the 21st century, entering college students were assessed
according to central standards on a statewide exam, and students could not exit
developmental education until they met those standards (Texas Higher Education
Coordinating Board [THECB], 2005). However, colleges argued that this “one-size-fits-
all approach”4 did not make sense for all students, resulting in new legislation in 2003
that allowed colleges more flexibility in determining and ensuring the college readiness
of their students, including the freedom to choose their own assessment exams from a set
4 From THECB Agenda Item IX-D, October 2003, Consideration of adopting the repeal of section and adopting new sections of Board rules concerning the Success Initiative (S.B. 286 of the 78th Texas Legislature) (Second Consideration).
6
of state-approved instruments. Subsequently, evidence of confusion among incoming
college students, inconsistencies across the state regarding how students were placed into
and exited from developmental education, and a lack of predictive validity among the
assessments chosen by the colleges prompted the state to begin designing legislation that
would return to more standardized policies (THECB, 2009).
The case of Texas illustrates that higher education systems tend toward adoption
of centralized policies that they believe will lead to the best possible outcomes for
students. However, there is typically no evidence-based certainty regarding the
effectiveness of any given policy; this situation, twinned with the fact that individual
colleges each believe that they have the clearest understanding of their own students’
needs, tends to push colleges to resist system-wide consistency in favor of the pursuit of
their own strategies. Moreover, as we will see in our examination of CUNY community
colleges, even under a system that has traditionally been strongly centralized, individual
institutions and departments may continue to push back against central policy in a variety
of overt and covert ways.
2.2 Efficient Versus Effective Assessment
Almost all community colleges use standardized tests to assess college readiness
(Parsad, Lewis, & Greene, 2003; Primary Research Group, 2008). These exams are
popular because they provide the efficiency necessary to process thousands of students in
time for the first day of class: They can be administered quickly, scored by computer, and
applied almost instantaneously to determine the appropriate placement for each student.
The sorting process is also relatively straightforward. Typically, there is one sequence
through math developmental education, one sequence through writing developmental
education, and so on. Depending on test scores, students may start earlier or later in the
sequence, but each step in the sequence is tied to a specific course. This standardized
system of assessment and placement allows all the college’s administrative systems—the
student information system, registration, financial aid, classroom allocation, and teacher
appointment—to work smoothly and efficiently together (ACT, Inc., 2006; College
Board, 2003).
7
Yet this administrative efficiency goes hand-in-hand with high rates of student
failure and attrition, such that the system itself is not at all efficient in producing college-
ready students. Recent research suggests that standardized placement tests are part of the
problem; they are only weakly predictive of student success and do not provide a
diagnosis of each student’s particular strengths and weaknesses (Hughes & Scott-
Clayton, 2011). A more effective assessment system might incorporate diagnostic testing
to determine students’ individual academic needs, affective measures to identify non-
cognitive factors related to academic performance, and/or multiple measures to provide a
more holistic assessment of college readiness; yet such assessments and processes require
substantial time and resources to administer and respond to with appropriate interventions
(Hughes & Scott-Clayton, 2011). For many resource-constrained institutions, this is
simply not feasible.
Colleges, then, are faced with a tradeoff. At one extreme of the efficiency-
effectiveness continuum, institutions could achieve maximum efficiency if they
abandoned testing altogether and allowed students to proceed directly to college-level
courses, a tactic that would result in misplacement for some proportion of students (see
Scott-Clayton, 2011). At the other extreme, institutions could maximize effectiveness by
meeting with each student individually, placing them into courses based on a
comprehensive set of information. Due to resource constraints, most colleges have
chosen a middle way—standardized testing and placement—that lies closer to the
efficiency end of the continuum. But as our case study of CUNY will illustrate, a highly
efficient test often has the drawback of being only mildly effective in terms of placing
students in the most appropriate treatment.
2.3 Supporting Student Progression and Enforcing Academic Standards
The ongoing push to improve college completion rates, a goal espoused by the
federal government as well as by several major education foundations, is a worthy
initiative. Yet some administrators and faculty worry that this push may have
counterproductive consequences. In order to meet institutional and departmental
completion goals, faculty could be subjected to subtle pressures to inflate grading and
8
“pass through” more students, which would eventually undermine academic quality and
the value of a college degree.
Elite institutions have traditionally resolved the tension between strong academic
quality and high student completion by selecting only the best-prepared and most-
motivated students, who are likely to successfully progress through college regardless of
the institution they attend. Community colleges, distinguished by their open-access
mission, cannot screen out students who are likely to do poorly. Yet for decades,
developmental education has served a similar function for these institutions’ college-level
courses and their instructors. High placement cutoff scores, coupled with a
developmental system through which only the most highly motivated students persist,
create college-level classrooms filled with relatively well-prepared students who are
likely to succeed in the course.
The strategy of funneling underprepared students into developmental education
mirrors the system of tracking prevalent in secondary schools. The traditional tracking of
middle and high school students into honors, general, and remedial courses has now been
typically replaced with less blatant forms of tracking, such as allowing students to choose
courses based on their academic level and interests; despite this change, secondary
schools are still highly stratified, with lower income and lower ability students
concentrated in remedial courses characterized by the “endless practice of the most basic
skills, slowing down the pacing of the curriculum, and reducing its depth and breadth”
(Levin, 2007, p. 1411). This approach to educating disadvantaged students has
contributed to a widening achievement gap between low-income students and their more
affluent peers; in contrast, accelerated strategies, such as implementing a challenging
curriculum and placing struggling students into advanced courses while concurrently
providing them with additional academic support, can improve the educational outcomes
of the lowest performing students (Levin, 2007).
Accelerated strategies for underprepared postsecondary students are also
becoming a popular alternative to traditional developmental course sequences
(Edgecombe, 2011b). Recent research has revealed that many students deemed
underprepared for college-level work can indeed succeed in college-level math and
English if they are allowed the opportunity to immediately enroll in such courses (Jenkins

9
et al., 2009; Jenkins, Speroni, Belfield, Jaggars, & Edgecombe, 2010); however, many
others will not succeed. As Scott-Clayton (2011) points out, while colleges could
improve underprepared students’ overall success rates by allowing more of them into
college-level courses, instructors of those courses may view such a development with
alarm. Given the strong variation in student skill levels, pass rates in the college-level
course would inevitably decline, and in the context of an institutional push for higher
completion rates, faculty may strongly feel the pressure to relax academic standards or to
“teach to the bottom of the class.” As our case study of CUNY will illustrate, while
faculty and administrators may earnestly support the goal of helping students move as
quickly as possible through the developmental sequence, their equally strong desire to
ensure a high-quality academic experience in college-level courses tends to create
barriers to speedy developmental completion.
3. The CUNY Case Study
3.1 Qualitative Data Collection
Across the fall of 2009 and the spring of 2010, CCRC staff visited each of the six
community colleges, interviewing a total of 67 faculty and administrators. In our
interviews, we focused particularly on math and English (i.e., writing) developmental
education. At each school, we interviewed developmental and college-level math,
English, and ESL faculty; administrators involved with developmental assessment,
policy, or programming; and senior administrators. Interviews, conducted on an
individual basis, were typically an hour long. Questions focused on developmental
education programming and supports at each school, as well as on the perceived
effectiveness of current policies and programs. Additional information on specific
policies and programming were collected by analyzing documents provided by the
university or by individual schools, including course catalogs and official web pages. See
Appendix B for more detailed information regarding our qualitative methodology.
10
3.2 Quantitative Analysis
CUNY’s Office of Institutional Research and Assessment provided CCRC with
anonymized transcript information on nearly 75,000 students who first enrolled in one of
CUNY’s six community colleges between the fall of 2004 (when the system moved to a
new math exam) and the spring of 2008; each student was tracked through the fall of
2009, or at least two academic years. Our examination of student progression required a
complex array of descriptive analyses on multiple subsets of students. A more detailed
description of the data utilized for this report is available in Appendix C, and details
regarding each analysis conducted for this report are located in subsequent Appendices D
through H.
3.3 System Policy During the Quantitative Study Period (2004–2009)
According to the typical criteria used for evaluating the centralization of
developmental education policy (Collins, 2008; Ewell, Boeke, & Zis, 2008; Perin, 2006),
CUNY is a strongly centralized system. Box 2 summarizes the most popular criteria of
centralization, and the extent to which CUNY met each one during the study period from
2004 to 2009.
Overall, the system required specific placement tests and cutoffs into college-
level work. In terms of math, students took both the COMPASS pre-algebra exam
(covering topics such as integers, fractions, decimals, absolute values, percentages, and
exponents) and the COMPASS algebra exam (covering topics such as equations,
polynomials, formula manipulations, and algebraic expressions). In terms of writing,
exams were qualitatively evaluated by two separate readers; the sum of the two readers’
scores (each awarding a score from 1 to 6) was used to determine the student’s score.
Readers also used their qualitative judgment to determine whether non-passing students
should be referred to an ESL sequence or to a traditional writing developmental sequence.

11
Box 2 Centralization of CUNY Developmental Policy
System specifies exemptions? Yes; based on specific SAT, ACT, or New York State Regents exam cutoffs.
System requires nonexempt students to take placement test?
Yes; students must take the exam in the specific areas from which they are not exempt.
System specifies common test to be used across schools?
Yes; COMPASS pre‐algebra test (ranges from 17–99); COMPASS algebra test (15–99); COMPASS reading exam (19–99); and the ACT/CUNY writing exam (2–12).
System specifies cutoff score into college‐level work?
Yes;
Pre‐algebra >= 30, Algebra >= 30 Reading >= 70 Writing >=7
System requires developmental education for students who fail the exam?
Yes; and students cannot retake exam until completion of developmental coursework or other appropriate intervention.
System requires students to enroll in or complete developmental education within a certain timeframe?
No; however, successful developmental completion is enforced as a prerequisite for corresponding college‐level courses.
Finally, the system used the COMPASS and ACT/CUNY exams not only as
placement instruments but also as requirements to successfully exit developmental
education.5 For example, students taking a top-level developmental course not only had
to pass the course, but also had to retake and pass the exam that had initially placed them
in the course.
In the next three major sections of the paper, we revisit each of the three sets of
opposing forces and analyze how they helped shape CUNY’s developmental policies
described above, as well as how they impact student progression and success at CUNY.
4. System-Wide Consistency and Institutional Autonomy at CUNY
Box 2 suggests that CUNY’s developmental education system is quite centralized,
with the central policy comprehensively covering the key aspects of developmental
placement and programming. Yet upon closer examination, the policy focuses most
5 The use of placement exams as a developmental exit requirement is quite uncommon. The CUNY administration implemented this exit exam policy in fall 1999 in concert with a phase-out of remedial course instruction in bachelor’s degree programs, in order to ensure that all students in associate degree programs met the same level of academic readiness in math, writing, and reading. Using the same exam as both a placement instrument and developmental exit requirement also allowed the system to assess the usefulness of developmental coursework in terms of improving test scores.
12
closely on defining the border between developmental and college ready, saying little
about the governance of programming and coursework below the developmental cutoff.
As a result, although each college adhered fairly closely to CUNY’s stated policies, each
also had the autonomy to define its own approach to developmental education, resulting
in a degree of variation in developmental programming similar to that seen in less
centralized systems (e.g., Edgecombe, 2011b). In addition, colleges also exercised
autonomy in their (sometimes creative) interpretations of particular elements of the
central policy. Below we discuss variation across colleges in terms of: (1) their
implementation of placement testing, including test exemptions, college-level test cutoffs,
and test cutoffs into different levels of developmental education; and (2) their
developmental education programming, including the number of courses in each
sequence, alternatives to developmental coursework, and the extent to which
developmental requirements were enforced.
4.1 Placement Testing
Exemptions from testing. CUNY’s admission requirements for four-year
colleges include scoring at a minimum level of proficiency on the SAT, ACT, or Regents
English and math subject tests. Community college students who meet at least one of
these standards in math are exempt from placement testing in math; likewise, those who
meet at least one of these standards in English are exempt from placement testing in
reading and writing.6 However, colleges have the latitude to require math-exempt
students (particularly those interested in STEM majors—science, technology,
engineering, or mathematics) to take the COMPASS math exam for the purpose of
placement in the most appropriate college-level math course. Two of the community
colleges utilized this policy to require students in STEM fields to take more advanced
math exams (i.e., the COMPASS college algebra or trigonometry exams) in order to
place into STEM-specific mathematics courses; the remaining four colleges used only the
pre-algebra and algebra exam. Some colleges tested very few math-exempt students,
while others tested the majority; the percentage of math-exempt students tested ranged
from 18% to 86% across the six community colleges. Among math-exempt students who 6 See Appendix A for the exact criteria that must be met to be determined English-exempt and math-exempt.
13
took the math placement test, some proportion failed it (for more information, see Section
5). Central policy indicated that these students’ exemptions should be honored, thus
allowing them to enroll in college-level courses. Some schools, however, required these
students to enroll in developmental education. Accordingly, the proportion of math-
exempt students who enrolled in math developmental education varied widely across
schools, from 2% to 50%.
In contrast to math, colleges typically did not require English-exempt students to
take the reading or writing placement exam. The percentage of English-exempt students
tested across the community colleges ranged from 8% to 28%, and of these tested
students, only between 1% to 8% of students (proportions that represent between 26 to 54
students) enrolled in developmental writing, ESL, and/or reading.
College-level placement cutoffs. During the 2009–2010 school year, most
schools adhered to the system’s cutoffs for reading and writing as set forth in Box 2 (p.
11)7 However, most schools were concerned that the central math placement cutoff into
college-level math was too low, so four schools simply set higher cutoffs on the algebra
exam and one of these schools also set higher cutoffs on the pre-algebra exam.8 Faculty
and administrators at these four schools typically offered one of two explanations for the
college’s policy: (1) the CUNY-wide cutoffs indicate the minimum requirements for
college readiness, which a college could raise if needed; or (2) colleges can control the
prerequisites, in terms of both cutoff scores and coursework, required to enroll in specific
college-level course. Colleges tended to employ the latter strategy to control entry into
STEM-related college math courses; for example, developmental trigonometry might be
a prerequisite for college-level calculus. At some schools, STEM-bound students were
required to take the developmental prerequisite regardless of their test scores, while at
other schools, students could avoid the prerequisite if they exhibited mastery via a
college-specified standard (e.g., a high COMPASS algebra, college algebra, or
trigonometry score). Among the four schools that employed higher math entry cutoffs,
7 The system’s cutoff of 7 is typically achieved by one rater awarding a 3 and the other awarding a 4. Two schools allowed students with a cutoff of 6 (typically achieved by both raters awarding a 3) who also passed the reading exam to advance to a special section of college-level English. 8 Due in part to colleges’ dissatisfaction with the math exam cutoffs, CUNY raised the community college math cutoffs from 30/30 to 35/40 for fall 2011 entrants.
14
the inconsistencies between system cutoffs and college- and course-specific cutoffs
created two unusual and potentially confusing patterns.
First, as noted above, some schools subjected high proportions of math-exempt
students to math testing. According to CUNY’s central cutoffs, about 17% of math-
exempt students subjected to the pre-algebra portion failed it, while 37% failed the
algebra portion. According to individual schools’ cutoffs (which tended to increase the
algebra standard), about the same 17% failed the pre-algebra portion but an astounding
63% failed the algebra portion. These high failure rates may have reinforced the opinion,
pronounced by several faculty, that the system’s exemption standards were insufficiently
strict. Second, schools with high algebra cutoffs faced an uncomfortable dilemma with
regard to students who passed by central standards but failed by school-specific
standards. As one math faculty member put it:
We have one score to place into the course and then once you’re in the course you have a lower standard in order to successfully place out. So, there is this window between 30 and 38. Say you score a 35, you’re placed into the [developmental] algebra course. But when you take the final exam all you need is a 30, so you’re good to go. The 30 is the CUNY minimum standard. ... Not many students catch on to how crazy it is, but it really is crazy.
Placement cutoffs into different developmental levels. As discussed in more
detail below, each school had very different math and English developmental sequences.
For example, some schools had two levels of developmental math while others had three.
Accordingly, cutoffs into different developmental courses also varied across schools.
Even among schools with a similar number and type of courses in a given sequence,
placement criteria for each level in the sequence were not necessarily consistent. For
example, one school might determine placement into a particular level of developmental
writing based on the writing exam only while another school might take into account
reading exam scores; similarly, one school might determine math placement based
primarily on the algebra exam score while another might rely on both the pre-algebra and
algebra scores. Finally, even in the rare circumstance that schools used the same
combination of exams to place students into a fairly similar sequence (e.g., at four
schools the reading exam alone was used to place students in a two-course reading
15
sequence), the schools typically differed in terms of the exact cutoffs between courses
(e.g., those four schools had four different cutoffs between the top-level and second-level
courses). Thus, cutoffs across the community colleges might seem fairly consistent (with
the exception of higher math cutoffs at some schools) to the small proportion of students
who enter CUNY college-ready. For the vast majority of students who enter college
underprepared, however, standards would not seem at all consistent across the six
community colleges.
4.2 Developmental Education Programming
Variation across colleges in terms of placement testing was mirrored in colleges’
developmental education programming. Each college required different numbers of
developmental courses, offered different alternatives to developmental coursework,
enforced different developmental requirements for various college-level courses, and had
different proportions of students who adhered to developmental course requirements.
Number of courses. Each school created a very different set of developmental
sequences to meet the needs of its students. Some schools had only one level of
developmental education for a specific subject while others had two, three, or even more;
some schools combined reading and writing developmental education into one sequence
and others maintained separate sequences; some schools had an additional developmental
math course for STEM9 students while others routed all developmental math students
through the same sequence; some schools offered accelerated paths through the
developmental sequence for students with certain exam cutoffs while others did not. As a
result, for a student with a fairly low set of exam scores, the number of credit-hours
required to complete developmental education varied widely across schools. For
example, for non-STEM students who barely failed the pre-algebra exam, the number of
developmental credit-hours required in math varied across schools from seven to 11.
Alternatives to developmental coursework. In line with recommendations from
ACT regarding the appropriate circumstances for retesting (ACT, Inc., 2006), CUNY
policy allows students to retest in a given subject area only if they complete an
instructional intervention at least 20 hours in length. This policy allows incoming
9 See Appendix A for a definition.
16
students to improve their developmental skills over the summer through CUNY’s
extracurricular immersion programs, the CUNY Language Immersion Program (CLIP) or
the University Summer Immersion Program (USIP).10 Such students can retest prior to
fall entry, which may allow some to place directly into college-level courses.
Departments in some colleges also took advantage of the retest policy to develop other
interventions for developmental test preparation. For example, at some schools, students
could undergo documented self-paced tutoring at the computer lab; at other schools,
students could take an intensive winter-break test preparation workshop. However, in
general, colleges placed strong restrictions on student participation in these interventions
(for example, the intervention might be only for incoming students who barely missed the
college-level cutoff, or only for students who successfully completed the appropriate
course but failed the developmental exit exam). Perhaps in consequence, very few
students seemed to utilize such interventions, at least during the course of the first
semester.11
Developmental course-taking requirement. Across CUNY, developmental
recommendations were strongly and consistently enforced as prerequisites to college-
level math and English. In addition, at all six schools, most degree programs required key
courses in the social sciences, humanities, or sciences that in turn required prior
completion of developmental English; at three colleges, some of these subject-area
courses also required completion of college-level English as a prerequisite. Thus while
students might delay taking a math course until later in their program, students needed to
move ahead with reading, writing, and English courses as quickly as possible.
Accordingly, although students were not required to enroll in developmental education in
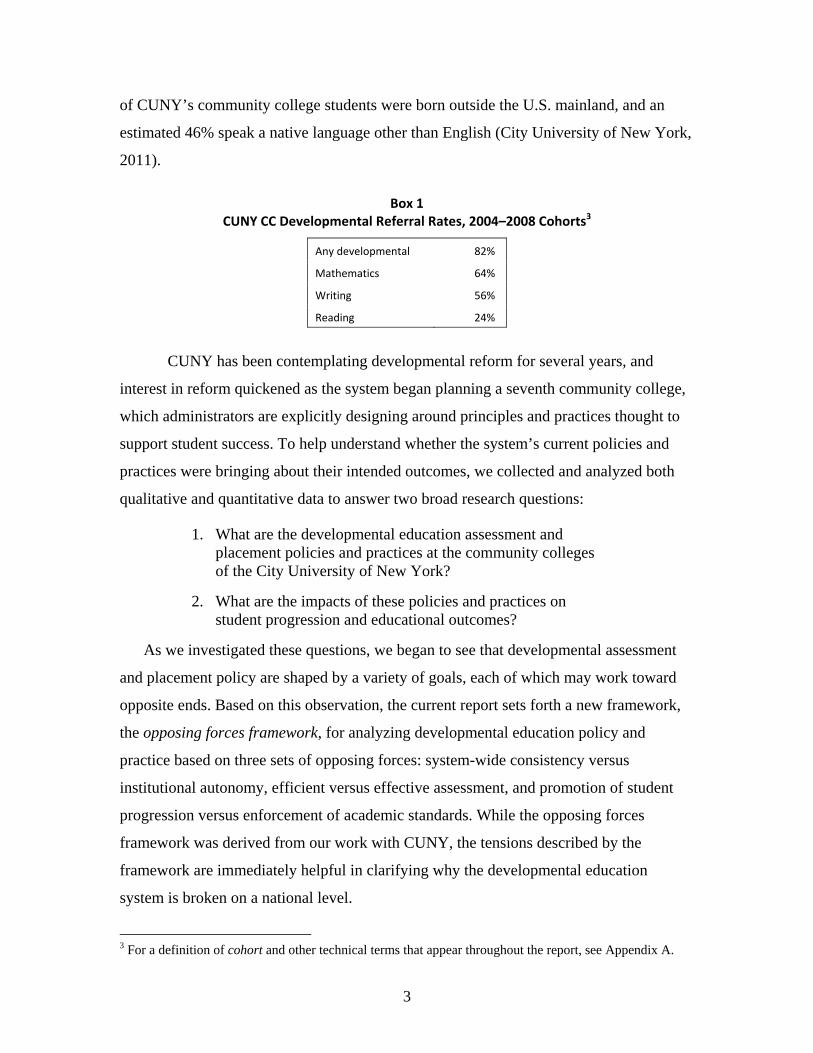
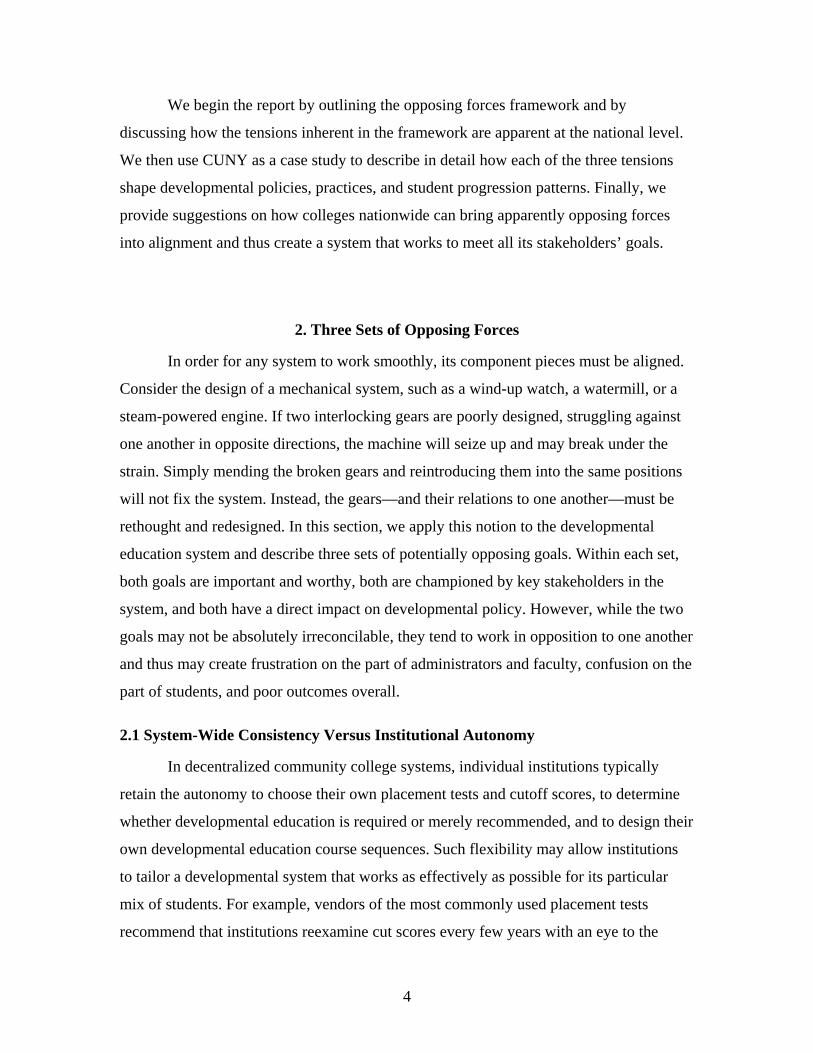
their first semester, most students did so. Figures 1 and 2, which display the course-
10 In this study, we do not have data on CLIP or USIP participation. Students who complete CLIP or USIP typically retake the placement exam after the program but prior to actual college enrollment. Accordingly, throughout this report we define readiness according to the last placement exam prior to enrollment. (We are currently collecting CLIP participation data, and a subsequent report is expected to focus on that program.) 11 While such interventions are not recorded in the data, they can be inferred if a student with a pretest took a posttest in that subject prior to the second semester without taking an associated developmental course. Only about 5% of the students who took a math or writing posttest prior to their second semester had a pretest in the same subject but no associated developmental course.
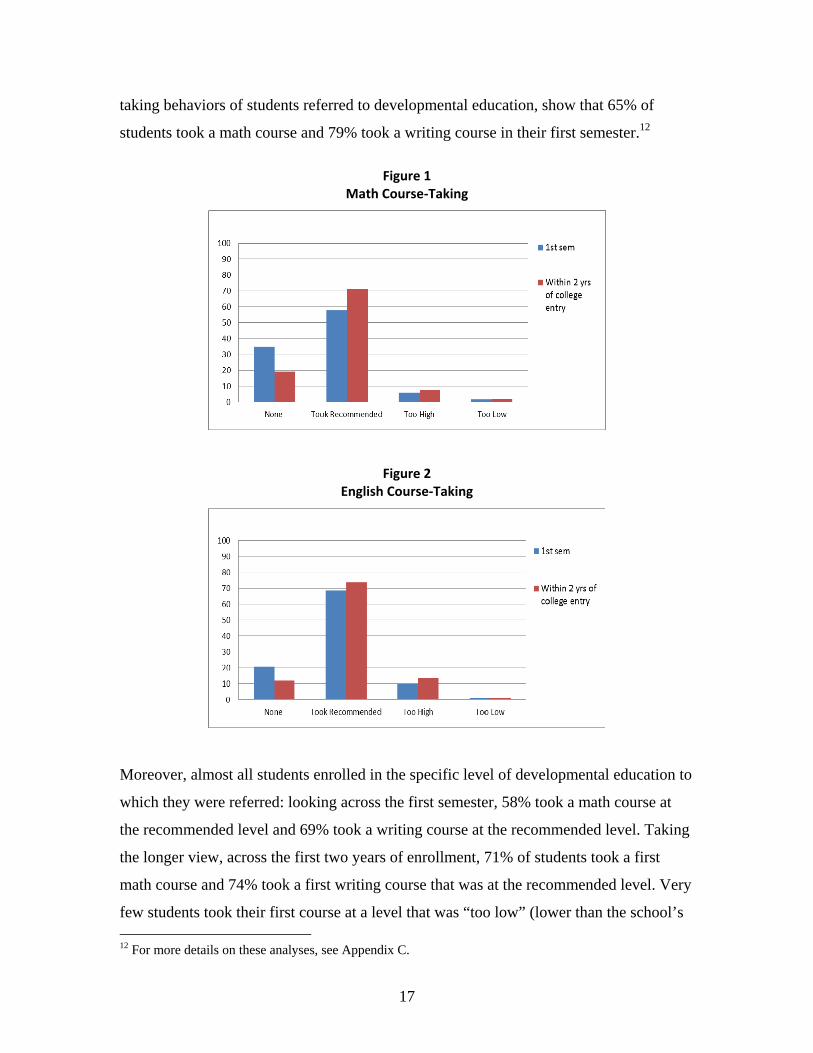
17
taking behaviors of students referred to developmental education, show that 65% of
students took a math course and 79% took a writing course in their first semester.12
Figure 1 Math Course‐Taking
Figure 2
English Course‐Taking
Moreover, almost all students enrolled in the specific level of developmental education to
which they were referred: looking across the first semester, 58% took a math course at
the recommended level and 69% took a writing course at the recommended level. Taking
the longer view, across the first two years of enrollment, 71% of students took a first
math course and 74% took a first writing course that was at the recommended level. Very
few students took their first course at a level that was “too low” (lower than the school’s 12 For more details on these analyses, see Appendix C.
18
placement recommendation) or “too high” (higher than the school’s placement
recommendation). There are two potential reasons why students may have enrolled in
courses that were too high or too low.
First, some students may have been moved up or down in the developmental
sequence based on diagnostics administered on the first day of class (see Section 5);
however, only a very small proportion of students seemed to be affected by this practice.
Second, some faculty claimed that advisors would occasionally register students for a
higher level course, either because they did not understand the policies or because they
didn’t think the student really needed the lower level course. These two practices may
have been more common for English than for math: at every college, students were
slightly more likely to enroll in an English course that was too high than they were to
enroll in a math course that was too high.13
Despite some course enrollments that were too high or too low, student adherence
to recommended placement was extraordinarily high,14 both overall and across individual
colleges. However, colleges did vary in terms of the proportion of students who delayed
or avoided their developmental requirements. For example, developmental education
avoidance was rare at one college: of students referred to developmental math, only 17%
in their first semester and 7% over the two-year period did not enroll in math, and of
students referred to developmental writing, only 4% in their first semester and 2% over
the two-year period did not enroll in writing. One possible explanation for this college’s
low developmental avoidance rate could be its intake process, which faculty and staff
described as extremely effective in terms of providing students with personalized
advisement during the admissions and registration period.
At the other end of the spectrum, one college had unusually high rates of
developmental avoidance in math and another had high rates in English. In the high-
13 Most commonly, students who barely failed the writing placement exam (i.e., scored a 6) enrolled in gatekeeper English. 14 As a basis for comparison, among students who entered Virginia’s community colleges in fall 2004 and were referred to math remediation, 41% did not enroll in developmental math within four years. Moreover, among those who were recommended to remedial math but did not take it, nearly half skipped ahead to enroll in college-level math (Jenkins et al., 2009). Among students who entered Achieving the Dream community colleges, typically 20%–30% of developmental students enrolled in a course that was higher or lower than the one to which they were referred (Bailey, Jaggars, et al., 2010).
19
math-avoidance college, 58% of students avoided math their first semester and 37%
avoided it for the entire two-year period. Students at this college may have been able to
avoid math due to flexible requirements for non-STEM students, who could often fulfill
their program’s math requirement by taking certain science courses. While most of these
science courses had math prerequisites, some popular courses did not. In the high-
English-avoidance college, 42% of students avoided developmental writing in their first
semester and 29% avoided it for at least two years. Two factors seemed to contribute to
this pattern: In contrast to other colleges, many popular business courses at this college
did not have English prerequisites, and this college also had an unusually high proportion
of students who, rather than taking a semester-long developmental writing course, took a
20-hour, non-course-based developmental intervention (see discussion of the 20-hour
interventions in Section 4.4).
4.3 Subject-Area Department Autonomy
Our discussion in this section has focused on the tension between system-wide
consistency and individual college autonomy. Yet within a college, there can also be a
tension between institutional control and departmental autonomy. For example, some
researchers advocate locating developmental courses within a dedicated basic skills
department rather than within math and English departments (e.g., Boylan & Bliss,
1997). Such centralization of developmental education departments could have two
benefits: Instructors may be more likely to have specific training and interest in
developmental pedagogy, and such departments may be more responsive to the needs of
other subject-area departments rather than be focused exclusively on the needs of the
math or English department. However, there is no clear evidence regarding the impact of
centralized versus localized developmental education departments. At CUNY, colleges
typically chose to retain developmental programming within subject-area departments. At
all six CUNY community colleges, developmental math courses were located in the math
department. At five colleges, developmental writing courses were in the English
department and three of those colleges also housed their reading and/or ESL courses in
the English department. Only two colleges had developmental education departments:
20
one that housed developmental writing, reading, and ESL courses and one that housed
developmental reading and ESL courses.
Thus, in general across the CUNY community colleges, the math department
controlled math developmental programming and the English department controlled
writing developmental programming. Colleges typically did not have an overall
coordinator of developmental education to ensure that the system was aligned with the
needs of other degree-granting departments, and faculty in math and English tended to
have little connection to other academic departments. Perhaps as a consequence,
developmental coursework tended to focus solely on preparing students for introductory
composition or college-level algebra, with little reference to each student’s larger
program of study.15 Overall, math and English faculty tended to feel that all
developmental students should be held to the same literacy and math standards,
regardless of the individual student’s academic or career goals. These expectations may
be derived in part from the fact that the PhD-level faculty who design departmental
programming are dedicated to their own fields and feel that mastery of that field is
critical to long-term success in any area. However, some respondents felt that it may be
counterproductive to hold all students to the same standards, particularly in math. For
example, one college administrator said, “Students have to take real hardcore math to
graduate from this college, even if they are going to be a graphic designer or
filmmaker. ...That presents a real barrier to graduation.”
Some colleges recognized that students in different programs may need to meet
different standards in math. During the time period under study, three of the six colleges
had different developmental paths for students in science, technology, engineering, or
math (STEM) academic programs. For the most part, the STEM sequence was similar to
the regular developmental path, with one additional course designed to prepare students
for calculus. At no college were developmental math requirements amended for students
in explicitly non-mathematical programs of study (such as fine arts). As we did not
interview faculty from disciplines outside of math and English, it is unclear whether these
faculty felt that the current developmental math requirements were appropriate for their
15 With some exceptions. During the time period under study, three colleges had developmental courses that were paired with disciplinary college-level courses and/or contextualized to the student’s course of study. However, these were restricted to a small proportion of faculty and developmental course sections.
21
students. Even had other departments wished to amend the requirements for their own
students, however, the system-wide requirement that all students must pass the pre-
algebra and algebra exams would render such adjustments impossible.
4.4 Summary of the Tension Between Consistency and Autonomy at CUNY
The CUNY system appears on the surface to have a strongly centralized and
consistent developmental education policy, yet in our study, individual colleges
exhibited a strong degree of variation in developmental policy and programming. In
particular: the system specified exemption criteria, but colleges could work around those
exemptions through course prerequisites; the system specified college-level placement
cutoffs, but colleges could raise them; the system required at least a 20-hour intervention
for failing students, but the nature of that intervention, including the number of courses
and credits that students must take, was very different across colleges and subjects; and
while the system did not require students to complete developmental coursework within a
given timeframe, individual colleges’ intake systems, course prerequisites, and program
requirements seemed to strongly shape the behavior of students in terms of when they
took their developmental courses.
Taking the larger view, these observations suggest that even in highly centralized
systems, colleges will pursue all opportunities to exert autonomy over their own
developmental policy and programming. If a given centralized system’s policy were
objectively “correct,” then such college autonomy would be counterproductive. However,
as will be discussed in more detail throughout the remainder of this report, there is no
objectively optimal way to calibrate policy—at least not on the basis of current evidence.
Thus, unless and until an optimal strategy is established and proven, consistency across a
system may guarantee only that all colleges must pursue what they perceive to be
“incorrect” policy. From the perspective of a college, then, resisting consistency and
designing their own policies and programming to be as optimal as possible for their own
student population seems to be the only rational strategy.
22
5. Efficient Versus Effective Assessment at CUNY
The CUNY system adopted the COMPASS math test in part due to its efficiency.
Students can complete the exam in less than an hour, and computer-graded results are
available almost immediately. The writing exam is slightly less efficient; to quickly turn
around grading, a large number of English faculty from across the university are trained
to use a specific essay-grading rubric. Two readers independently grade each exam at
central locations; if the two scores are similar, they are summed to create a total score.16
Although multiple readers grade each exam, the process is handled quickly: according to
administrators, an experienced reader can grade an exam in two minutes, and students
typically receive their score 48 to 72 hours after taking the test. Overall, CUNY’s
placement testing system is able to efficiently process very large numbers of students;
over the course of the years we included in this study, 68,221 students, or 91% of all
incoming community college students, were tested in at least one subject prior to
enrolling. While the efficiency of the exam processes is admirable, the majority of faculty
expressed dissatisfaction with the test’s effectiveness in terms of its lack of diagnostic
information, as well as in terms of its lack of alignment with the larger curriculum. In the
following subsections, we discuss these themes in more detail, focusing first on the math
exam and then on the writing exam.
5.1 Math Exams
The COMPASS math exam (like its sibling, the College Board’s
ACCUPLACER) is a computerized adaptive test and thus can be administered very
quickly. The exam begins with questions in the middle range of difficulty, randomly
drawn from a large set of problems and topic areas. Students who perform well on early
items proceed quickly to more difficult topics; students who perform poorly on early
items are routed to an easier set of questions and move on to more difficult questions only
if they answer the easier items correctly. Given that early performance determines the test
content, students may not see the same set of exam items or topics.
16 If the two readers’ scores are different (particularly if one is 3, indicating a need for remediation, and the other is 4, indicating college readiness), then the essay is referred to additional readers. If all additional readers give the essay a score of 3, the student is referred to remediation.
23
Systems that adopt the COMPASS test have some discretion over the length of
the exam, and most colleges would prefer the test to be as short as possible in order to
process students efficiently. As the test’s developer ACT explains, however, there is an
inherent tradeoff between efficiency and diagnostic precision:
Institutions offering a wide array of entry-level courses in a given curriculum may need a fairly long and accurate test to ensure proper placement. Institutions that wish not only to place students but also to assess individual strengths and weaknesses across a broad range of skills will require even more testing time. At the other end of the spectrum, for institutions with only a small number of entry-level courses, highly precise measurement may not be a critical concern. These institutions can place students with only a minimum of testing time. (ACT, Inc., 2006, p. 70)
At CUNY, given that each student must take tests in multiple subject areas, the
university felt that lengthy testing would not be feasible for most students and opted for a
short version of the math exam. This exam summarizes each student’s math skillset into
two simple scores: the pre-algebra score and the algebra score. In the subsections below,
we discuss CUNY faculty and administrator reactions to the COMPASS exam.
Consistent with ACT’s perspective, respondents pointed out that the exam’s very
efficiency hinders its effectiveness in terms of adequately diagnosing students’ strengths
and weaknesses. Faculty also complained that the exam was poorly aligned with course
content. When both factors are combined, it is clear to see that the exam is not currently
an effective tool in terms of aligning developmental treatment with individual students’
needs and goals.
Poor diagnostic ability. A highly efficient adaptive exam does not cover the
same topic for every student, and for an individual student, it does not cover every
relevant topic within a given skill level. Many faculty expressed frustration with these
qualities of the exam. Some felt the lack of consistency across students was unfair; others
felt the topic coverage was too random, resulting in skewed results for some students; and
others complained about the lack of individualized diagnostic reports, which are
impossible to generate from an exam that does not cover a fairly comprehensive set of
topics. Box 3 includes some of the comments from math faculty on their perceptions
regarding the consequences of the adaptive nature of the exam.

24
Box 3 Faculty Describe the Adaptive Math Exam
“The COMPASS is unpredictable. It is random. On average the COMPASS does a good job with placement, but it does a bad job for a lot of students.”
“The problem with the COMPASS is that it’s a mystery. It’s not entirely clear what a number means.”
“Two students take an exam, they both get 45. They both proceed further up. One person does a lot better than the other in the next course. Well, you might say, why is that? They took the same exam, they’ve got the same grade. Why is one doing better than the other? Well, the full statement there is, they didn’t take the same exam.”
“The way they do it, they’ll go in, they’ll take the COMPASS … and somebody will walk out (‘cause I stayed there usually and waited for them to come out), and somebody will come out having completed eight questions, and the person behind him or her will have completed 14 questions, and the person beyond them 18 questions. … I’m sure COMPASS would say it’s all exactly the same, but I don’t think it is.”
The unifying theme across all the comments is that the adaptive exam does not
necessarily generate the correct placement for every student because it is neither
comprehensive nor sufficiently diagnostic.
Additional diagnostic modules are available from the test maker, and some faculty
expressed a desire to “get our hands on” these modules. However, using the additional
diagnostics is not particularly feasible for individual faculty. The diagnostic tests contain
“live” test items and thus CUNY must administer them under secure conditions in the
testing lab; faculty cannot simply administer the diagnostics in their own classrooms. As
an alternative, some math instructors administered departmental diagnostic exams on the
first day of each developmental course. For these instructors, the primary purpose of this
“first-day diagnostic” was to identify misplaced students and to allow such students to
move up or down in the developmental sequence as appropriate. Yet in practice, very few
students were re-placed on the basis of these exams. Indeed, in one college, the
proportion of students passing the first-day test and thus moving up to the next course in
the sequence was said to be “practically zero,” and the college eventually discontinued
the practice.
Thus, while faculty were frustrated with the lack of diagnostic information
provided by the COMPASS, additional diagnostic information did not seem to be helpful
in terms of altering placement. This seeming paradox may be grounded in the fact that a
traditional developmental sequence is not designed to be responsive to diagnostic input.
Consider, for example, a student referred to a two-course math sequence. She takes a
25
first-day diagnostic and does very well in terms of multiplication and division, fractions,
decimals, and signed numbers, but she does poorly with basic algebraic concepts,
resulting in a score of 65 on the exam. Despite having mastered over half the content of
the current course, she cannot move up to the next course in the sequence. And given that
her instructor is overwhelmed with students who are even farther behind, chances are
slim that this student will receive additional supports or instruction tailored to her specific
diagnosed needs. For CUNY and many other colleges, then, it does not make sense to
sacrifice efficiency for improved diagnostic power, because the system has no effective
way to leverage the additional information.
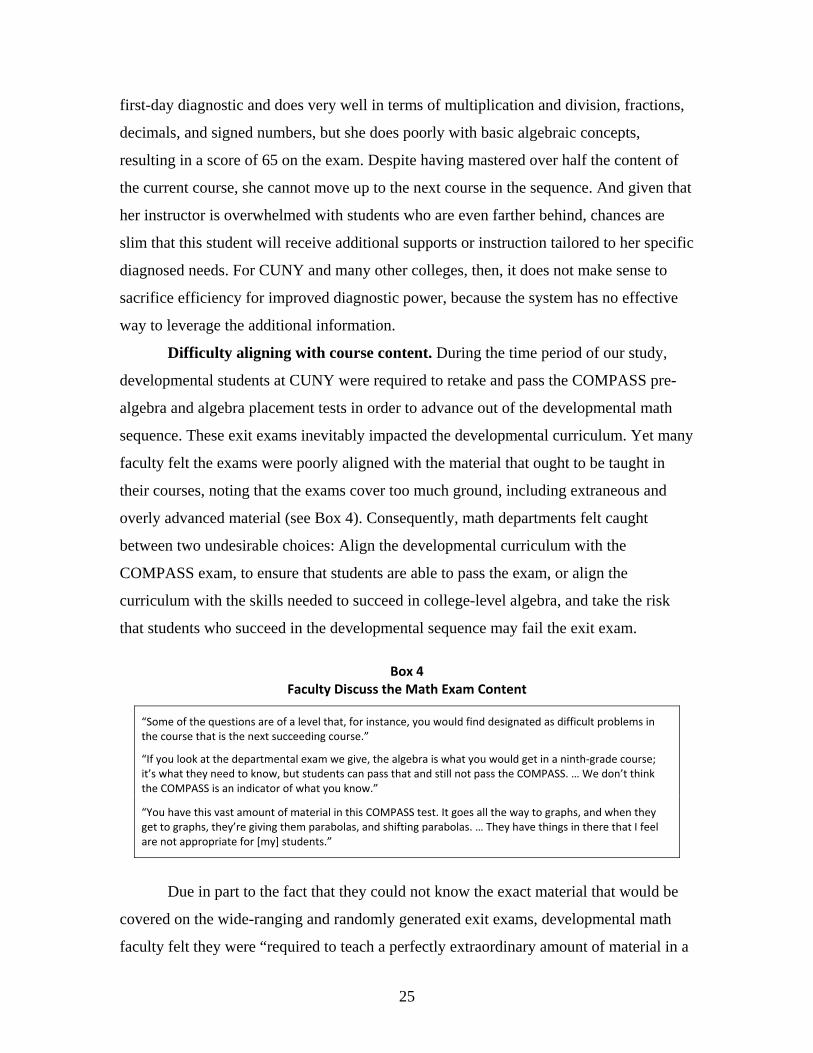
Difficulty aligning with course content. During the time period of our study,
developmental students at CUNY were required to retake and pass the COMPASS pre-
algebra and algebra placement tests in order to advance out of the developmental math
sequence. These exit exams inevitably impacted the developmental curriculum. Yet many
faculty felt the exams were poorly aligned with the material that ought to be taught in
their courses, noting that the exams cover too much ground, including extraneous and
overly advanced material (see Box 4). Consequently, math departments felt caught
between two undesirable choices: Align the developmental curriculum with the
COMPASS exam, to ensure that students are able to pass the exam, or align the
curriculum with the skills needed to succeed in college-level algebra, and take the risk
that students who succeed in the developmental sequence may fail the exit exam.
Box 4 Faculty Discuss the Math Exam Content
“Some of the questions are of a level that, for instance, you would find designated as difficult problems in the course that is the next succeeding course.”
“If you look at the departmental exam we give, the algebra is what you would get in a ninth‐grade course; it’s what they need to know, but students can pass that and still not pass the COMPASS. … We don’t think the COMPASS is an indicator of what you know.”
“You have this vast amount of material in this COMPASS test. It goes all the way to graphs, and when they get to graphs, they’re giving them parabolas, and shifting parabolas. … They have things in there that I feel are not appropriate for [my] students.”
Due in part to the fact that they could not know the exact material that would be
covered on the wide-ranging and randomly generated exit exams, developmental math
faculty felt they were “required to teach a perfectly extraordinary amount of material in a
26
very short period of time,” skimming quickly over each topic and sacrificing the ability to
delve more deeply and conceptually into key content areas. One instructor complained
that the college placed too much importance on grades and the exam, which robs the
enjoyment from teaching and learning and results in “boring, meaningless, formula
memorizing.” Similarly, another faculty member discussed her involvement in a program
that encourages pedagogical innovation, with an emphasis on instructional techniques
that encourage conceptual understanding. She felt handcuffed in her ability to integrate
the desired project- and activity-based instructional approach in her developmental class,
because the exit exam heavily emphasizes procedural skills rather than conceptual
understanding. Moreover, some faculty felt that certain aspects of the material covered in
their courses was unnecessary; for example, one noted that it would be appropriate to
remove factorials from the developmental curriculum and instead cover them in the
introductory portion of a college-level statistics course. However, given that these
materials were covered in the exit exam, faculty felt they had no choice but to cover them
in class.
In general, math faculty felt strongly that the COMPASS exam was not an
appropriate arbiter of college-level math readiness.17 In order to ensure that their
developmental students indeed learned the skills necessary to succeed in college-level
algebra, most math departments designed an additional exit exam, which was typically
used as the final for the highest level developmental math course. While practices varied,
most schools barred developmental students from taking the exit COMPASS exam until
they had demonstrated proficiency according to the college’s own math standards, such
as passing the departmentally-designed exam or otherwise performing well in the highest
level course. These additional testing and filtering practices constituted some sacrifice of
efficiency and further decreased consistency and standardization across the six colleges.
At this point in the process, however, faculty and administrators were less concerned
about efficiency than about ensuring that each exiting developmental student was
properly prepared for college-level work.
17 Due to these concerns, effective May 2011, community colleges had the option of using departmental exit exams instead of COMPASS exams, and effective January 2012, CUNY will eliminate the COMPASS exit requirement for math developmental education completely, to be replaced with faculty-designed uniform exit exams (A. Logue, memo, February 25, 2011).
27
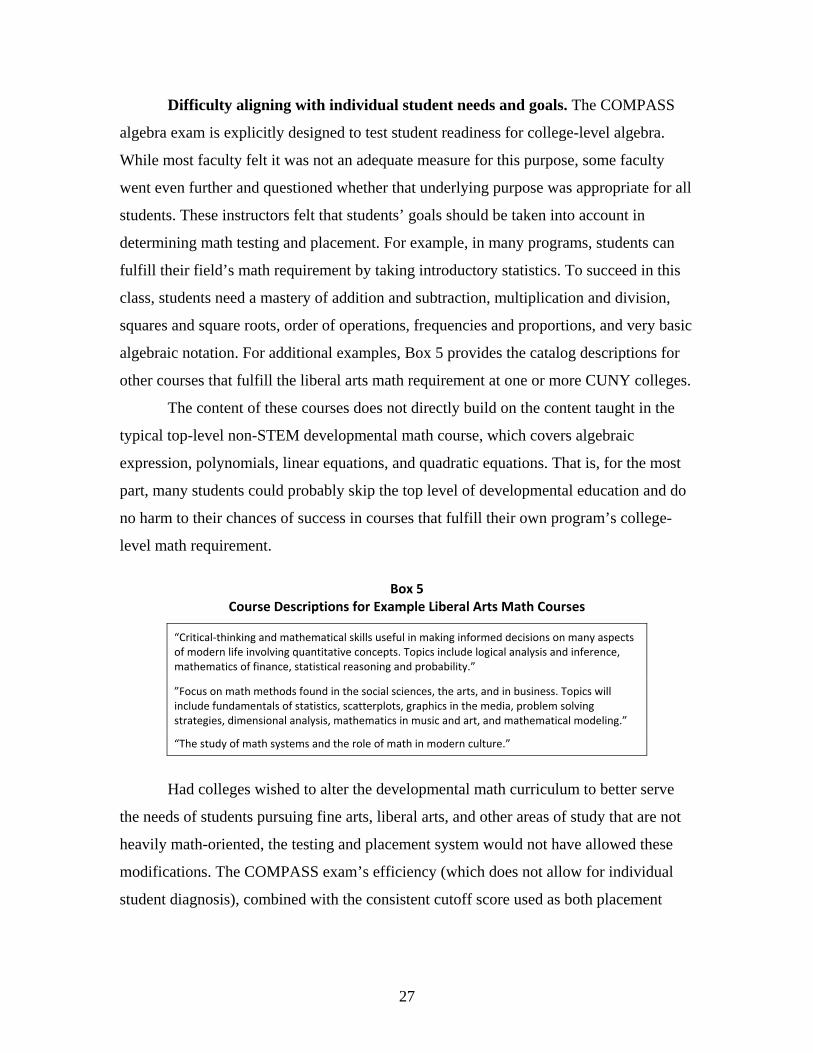
Difficulty aligning with individual student needs and goals. The COMPASS
algebra exam is explicitly designed to test student readiness for college-level algebra.
While most faculty felt it was not an adequate measure for this purpose, some faculty
went even further and questioned whether that underlying purpose was appropriate for all
students. These instructors felt that students’ goals should be taken into account in
determining math testing and placement. For example, in many programs, students can
fulfill their field’s math requirement by taking introductory statistics. To succeed in this
class, students need a mastery of addition and subtraction, multiplication and division,
squares and square roots, order of operations, frequencies and proportions, and very basic
algebraic notation. For additional examples, Box 5 provides the catalog descriptions for
other courses that fulfill the liberal arts math requirement at one or more CUNY colleges.
The content of these courses does not directly build on the content taught in the
typical top-level non-STEM developmental math course, which covers algebraic
expression, polynomials, linear equations, and quadratic equations. That is, for the most
part, many students could probably skip the top level of developmental education and do
no harm to their chances of success in courses that fulfill their own program’s college-
level math requirement.
Box 5 Course Descriptions for Example Liberal Arts Math Courses
“Critical‐thinking and mathematical skills useful in making informed decisions on many aspects of modern life involving quantitative concepts. Topics include logical analysis and inference, mathematics of finance, statistical reasoning and probability.”
”Focus on math methods found in the social sciences, the arts, and in business. Topics will include fundamentals of statistics, scatterplots, graphics in the media, problem solving strategies, dimensional analysis, mathematics in music and art, and mathematical modeling.”
“The study of math systems and the role of math in modern culture.”
Had colleges wished to alter the developmental math curriculum to better serve
the needs of students pursuing fine arts, liberal arts, and other areas of study that are not
heavily math-oriented, the testing and placement system would not have allowed these
modifications. The COMPASS exam’s efficiency (which does not allow for individual
student diagnosis), combined with the consistent cutoff score used as both placement
28
instrument and as exit standard (which does not allow for different standards for different
student goals), would have made it impossible.
5.2 Writing Exams
During the time period under study, the CUNY writing exam required students to
write a persuasive letter. The typical prompt presented students with two potential policy
options and asked the student to write a letter to a policymaker endorsing one option and
explaining why. Similar to math instructors’ reactions to the COMPASS exam, English
faculty unanimously felt that the writing exam was insufficiently diagnostic and
misaligned with the skills needed to succeed in college-level English.
Poor diagnostic ability. In order to efficiently process the exams, centrally-
trained readers assigned a single holistic score to each exam. Readers also flagged essays
that appeared to have “ESL-type errors” with an “E”; these exams were typically then
reread by ESL faculty at the given school to determine the appropriate level of ESL
placement. Although the central readers were trained in a standardized rubric to evaluate
writing quality, they did not receive formal training in detecting ESL errors. As a
consequence, ESL faculty felt that the E flag was unreliable; as one noted,
The problem is we only get the ones that get marked E. The first couple years we were doing it the ACT scorers were not marking E very much and later on they started marking everything E. And sometimes we end up with native speakers in ESL classes and there are a lot of students where it is not clear where they ought to be.
Several instructors noted that the readers’ difficulties may be due in part to the high
number of generation 1.5 students, a term used to indicate those who immigrated to the
United States at a young age. One ESL instructor explained that the E flag:
…mixes the generation 1.5 with ESL. So when we reread the papers we look for idiomaticity—the kinds of features students who have lived here all their lives have that ESL students don’t have—and try to separate them out. Figuring that they identify more with English, we send them to English.
ESL faculty at all schools attempted to address these problems by rereading exams
marked E to ensure the student was properly placed in ESL, and at one school, the ESL
29
faculty reread every non-passing writing exam, whether it was flagged with an E or not.
At this school, faculty felt that the cost in terms of decreased efficiency was worth the
improvement in terms of placement accuracy.
Outside of potential ESL misdiagnoses, faculty expressed two other concerns
regarding the usefulness of the exam in placing students. First, several faculty felt that
students received insufficient information prior to the exam in terms of its importance as
well as expectations of performance. As one respondent explained:
The real tragedy is that when they are taking the test, they don’t have a sense of the implications. They don’t have a sense that this is a real high-stakes test. That if they fail, it is going to cost them time and money. … At the end, when they take the writing test, they are exhausted by that time. And then on top of that it says write a letter. For any student who is not savvy, you tell them to write a letter, they are going to write something short and sweet because it’s a letter. … Not realizing that a short letter like that, half a page, three quarters of a page, will send them right into [the lowest level developmental writing course].
Second, faculty described the policy-oriented writing prompts on the exam as “terrible,”
“awful,” “sterile,” and “boring,” which they felt affected the quality of students’
responses. As one instructor said:
Often times it’s not a very interesting subject. Students are asked if they want to refurbish elevators or put in new escalators at their school, or whatever. And they find that, what do I care about that? When have I ever thought about that? How do I develop a paper like that?
Another instructor explained:
The topics are emptied of any kind of meaning for the students, for things that students can really engage in. … I feel that if the topics were more meaningful, we’d get more meaningful writing, we’d get writing that would be more engaged, where students have something to say, because these students do have a lot to say. But that’s not what they’re given on these tests.
To help address the perceived problems with initial writing placement, some
schools encouraged faculty to administer first-day diagnostics; as with mathematics,
30
however, these first-day writing tests resulted in very little re-placement. While faculty
who administered the diagnostics said that the information regarding student weakness
was useful, they also noted that it did not substantively change the way they taught the
class. Thus, some felt that the diagnostics were not worth the time. However, one
respondent argued that the attempt makes a real difference to students: “You ask that one
student who was given a second chance and moved on to [college-level English], and that
should be enough for you.” Within the traditional course-based developmental sequence,
then, the most important function of the first-day diagnostic may be its symbolic value: it
gives students the sense of having a second chance and communicates the faculty’s
willingness to help move students out of remediation as quickly as possible.
Difficulty aligning with course content. English faculty were unanimous in their
dislike of the writing exam. But their antipathy was not necessarily due to its potential for
initial misplacement; despite its flaws, most faculty felt the exam did a reasonable job in
terms of placement (or as one faculty member put it, “I don’t think we’re at a point where
we feel students are being egregiously misplaced”). Rather, faculty directed their
strongest criticism at the test in its capacity as an exit exam, due to misalignment between
the exam and the skills that students needed to succeed in college-level English (see Box
6). The exam asked students to write a letter, an assignment that requires very different
structures and rhetorical devices than those that students would use to compose papers for
college-level courses. Many faculty felt they had to teach the course as test-prep in order
to ensure that students were able to pass the exit exam and move on to college-level
courses in their program area. And teaching the course as test-prep could result in boring,
uninteresting, “formulaic” assignments. As one instructor explained, when speaking of
the stigma that many students feel upon being assigned to developmental education:
They think it reflects on them, that they are dumb, they’re stupid, and especially if the class is taught as if they are stupid, and you don’t challenge them and give them challenging work and literature to read and short stories and things like that. … It reinforces that sense they have that they’re dumb.
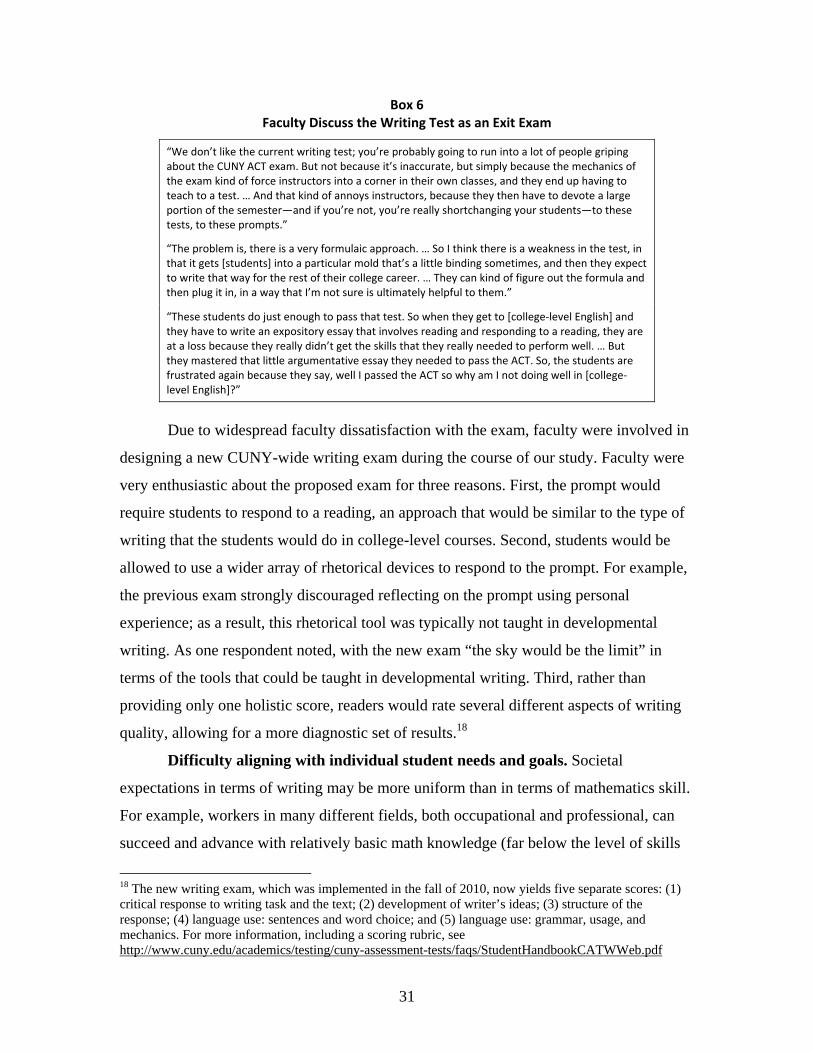
31
Box 6 Faculty Discuss the Writing Test as an Exit Exam
“We don’t like the current writing test; you’re probably going to run into a lot of people griping about the CUNY ACT exam. But not because it’s inaccurate, but simply because the mechanics of the exam kind of force instructors into a corner in their own classes, and they end up having to teach to a test. … And that kind of annoys instructors, because they then have to devote a large portion of the semester—and if you’re not, you’re really shortchanging your students—to these tests, to these prompts.”
“The problem is, there is a very formulaic approach. … So I think there is a weakness in the test, in that it gets [students] into a particular mold that’s a little binding sometimes, and then they expect to write that way for the rest of their college career. … They can kind of figure out the formula and then plug it in, in a way that I’m not sure is ultimately helpful to them.”
“These students do just enough to pass that test. So when they get to [college‐level English] and they have to write an expository essay that involves reading and responding to a reading, they are at a loss because they really didn’t get the skills that they really needed to perform well. … But they mastered that little argumentative essay they needed to pass the ACT. So, the students are frustrated again because they say, well I passed the ACT so why am I not doing well in [college‐level English]?”
Due to widespread faculty dissatisfaction with the exam, faculty were involved in
designing a new CUNY-wide writing exam during the course of our study. Faculty were
very enthusiastic about the proposed exam for three reasons. First, the prompt would
require students to respond to a reading, an approach that would be similar to the type of
writing that the students would do in college-level courses. Second, students would be
allowed to use a wider array of rhetorical devices to respond to the prompt. For example,
the previous exam strongly discouraged reflecting on the prompt using personal
experience; as a result, this rhetorical tool was typically not taught in developmental
writing. As one respondent noted, with the new exam “the sky would be the limit” in
terms of the tools that could be taught in developmental writing. Third, rather than
providing only one holistic score, readers would rate several different aspects of writing
quality, allowing for a more diagnostic set of results.18
Difficulty aligning with individual student needs and goals. Societal
expectations in terms of writing may be more uniform than in terms of mathematics skill.
For example, workers in many different fields, both occupational and professional, can
succeed and advance with relatively basic math knowledge (far below the level of skills
18 The new writing exam, which was implemented in the fall of 2010, now yields five separate scores: (1) critical response to writing task and the text; (2) development of writer’s ideas; (3) structure of the response; (4) language use: sentences and word choice; and (5) language use: grammar, usage, and mechanics. For more information, including a scoring rubric, see http://www.cuny.edu/academics/testing/cuny-assessment-tests/faqs/StudentHandbookCATWWeb.pdf
32
taught in college-level algebra). In contrast, workers with an associate or bachelor’s
degree in any field are expected to produce college-level writing: clear, well-organized,
and grammatically correct prose that appropriately responds to the task at hand.
Accordingly, there may be few opportunities to modify the required English curriculum
for students with different academic and professional goals. While minimal requirements
for writing skills may need to remain fairly constant across schools and program areas,
that observation does not necessarily imply that treatment—the method of delivering
curriculum—should remain constant across different types of writing problems and
weaknesses. Yet with only one holistic score with which to place students, departments
had little choice but to place students who may have similar overall scores but very
different writing needs together in the same course; for example, each developmental
writing class may mix students who are proficient with the mechanics of grammar but
who have difficulty formulating high-quality ideas together with students who have good
ideas but poor grammar.
5.3 Summary of Efficiency Versus Effectiveness at CUNY
Administrators’ and faculty’s discussions of placement policy were grounded in
the general precept that standardized tests were a necessary part of the process, due to
their efficiency. For example, when asked to describe a more effective method of
placement, one faculty member said, “You would have to meet individually with them,
and that is absolutely impossible. We have more than 1,000 students. A test is what we
have to do.” Thus when we asked faculty how placement assessment could be made more
effective, they tended to suggest better aligned, more comprehensive, and more
diagnostic tests.
Increased alignment of the exam with college-level course material would not
necessarily infringe on efficiency. However, comprehensiveness and diagnostic accuracy
are directly in conflict with efficiency. Such exams would require more student time, as
well as more computer lab time, challenging both the college’s lab resources and
students’ patience. The latter issue is not a negligible one: CUNY, like most public
institutions, is partially dependent on funding derived from student enrollment numbers.
Requiring potential students to wait in long lines to take lengthy tests could result in
33
enrollment drops, causing real financial damage. Moreover, it is not immediately clear
how the system would effectively leverage diagnostic testing if it were available.
Many of the faculty complaints regarding exam effectiveness were focused on the
exam as an exit instrument. Yet the same faculty also tended to feel the same exams
worked reasonably well for the purposes of initial placement. The juxtaposition of these
two opinions is puzzling; after all, if it is reasonable to place a student on the basis of a
particular exam in August, why is it unreasonable to place the student on the basis of the
same exam in December? Our speculation is that the exit exam is much more relevant to
the experience of developmental faculty than is the placement exam. The exit exam
directly impacts their curriculum and pedagogy. Moreover, by the end of each semester,
the instructor knows his or her students well and certifies to take the COMPASS exam
only those students who have done fairly well in the course. If one of these students then
fails the exam, the mismatch between the student’s skills and the exam’s ruling then
seems obvious. In contrast, the instructor cannot directly observe such mismatches in the
exam when it is initially used as a placement instrument.
Stepping back from the specific context of CUNY, the results of this section raise
two main points. First, all stakeholders desire more effective assessment, but for the most
part, they assume that the time and costs inherent in a better aligned, more
comprehensive, and more diagnostic system are prohibitive. Second, most community
colleges across the country do not use exit exams, and so CUNY’s experience in this
regard is instructive. The exit exam throws into relief the problems with the assessment
exam, in particular its poor alignment, in a way that is salient to faculty. The same
problems may not be as clear at other colleges where the exam is used solely for initial
placement—but that does not mean the same problems are not present.
34
6. Supporting Student Progression Versus
Enforcing Academic Standards at CUNY
We begin this section with a general overview of CUNY community college
student success in terms of persisting in school, as well as progressing through
developmental education and into college-level courses. We then discuss the potential
tension between student progression and the maintenance of academic standards.
6.1 Student Progression
To paint a picture of developmental student success at CUNY, we first examine
student persistence in school. Next, we discuss students’ overall progression through the
sequence, including the number of months required for successful students to complete
the sequence, as well as the role of sequence length in student progression and eventual
success in college-level math and English.
Persistence and attrition. Many community college students do not persist past
their first semester of school for a variety of reasons related to poor academic skills,
financial difficulties, or family or employment responsibilities. Recent research has
suggested that beyond these factors, referral to developmental education may have a
discouraging effect on persistence. Students are often surprised, confused, or angry when
they discover that, despite graduating from high school or earning their GED, they are
considered unprepared for college-level work (Strong American Schools, 2008; Venezia
et al., 2010). These students may feel disappointed and discouraged by the unexpectedly
long road ahead of them, which could dampen rates of initial enrollment or short-term
persistence.
The CUNY institutional dataset available at the time of our analysis did not
contain information on students who sat for the placement exam but never enrolled;
accordingly, we could not assess whether referral tended to dampen initial enrollment
rates.19 Among students who enrolled, however, we compared short-term persistence
between students within a similar range of ability who were referred to developmental
versus college-level courses (Figure 3). Overall, approximately 16% of students attend
19 However, the system is working to create these data, and in a subsequent report, we hope to include analyses addressing the impact of placement tests scores on initial enrollment.

35
for only one semester, leaving the CUNY system after their first term and not returning
within four years.20 Among students who were near the borderline in terms of needing
developmental education, those referred to developmental math had similar attrition rates
compared with those who were referred to college-level math; however, those referred to
developmental English had significantly higher attrition rates than those referred to
college-level English.
Figure 3 Dropout Rates After 1st Semester for Students Above and Below College Cutoffs
Note. For math, barely passed indicates scoring at the college‐specific cutoff or no more than 3 points above; barely failed indicates no more than 4 points below cutoff. For writing, barely passed is a score of 7 or 8; barely failed is a score of 6. For more detailed information, see Appendix E.
Among developmental students, those who failed or withdrew from a remedial
course in their first semester were least likely to return to CUNY again (Figures 4 and 5).
Students who failed a developmental writing course in their first semester had a 26%
chance of dropping out before the next semester, and those who failed a developmental
math course had a 23% chance. Students who chose to delay their developmental
coursework had only slightly better outcomes.21 In contrast, those who passed a
20 The attrition results illustrated in Figures 3, 4, and 5 were conducted only for cohorts who entered in the 2004 or 2005 academic years because we can follow these students for at least four years, providing sufficient time to track long-term absence from the CUNY system, as well as long-term persistence and graduation. See Appendix E for more details about the sample used in the attrition analyses, and see Appendix G for a more detailed analysis of persistence by progression category. 21 Some students may delay math in order to avoid the developmental course, but others delay for more constructive reasons. Some colleges actively counsel students who are placed into both developmental English and math to begin their reading and/or writing first. In addition, some colleges have developmental
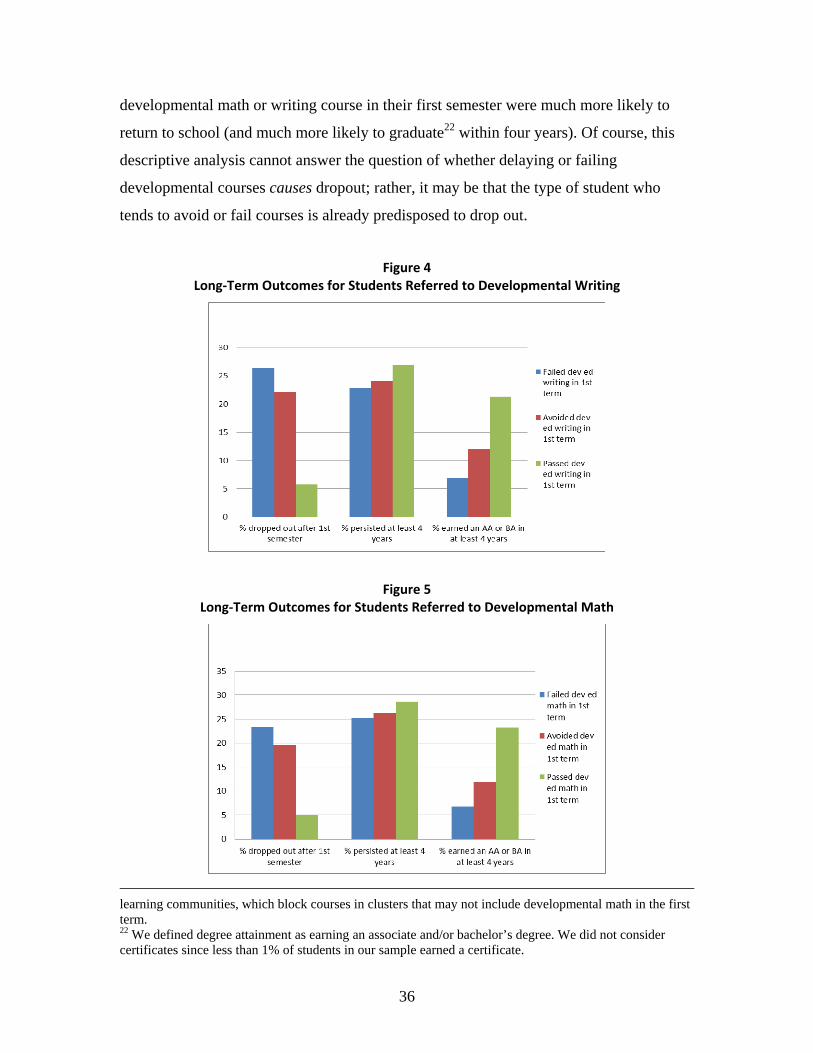
36
developmental math or writing course in their first semester were much more likely to
return to school (and much more likely to graduate22 within four years). Of course, this
descriptive analysis cannot answer the question of whether delaying or failing
developmental courses causes dropout; rather, it may be that the type of student who
tends to avoid or fail courses is already predisposed to drop out.
Figure 4 Long‐Term Outcomes for Students Referred to Developmental Writing
Figure 5 Long‐Term Outcomes for Students Referred to Developmental Math
learning communities, which block courses in clusters that may not include developmental math in the first term. 22 We defined degree attainment as earning an associate and/or bachelor’s degree. We did not consider certificates since less than 1% of students in our sample earned a certificate.
37
Progression through developmental education. Previous research drawing on
data from several states (Bailey, Jeong, et al., 2010; Jenkins et al., 2009) has indicated
that few developmental students complete their recommended sequence and move on to
complete the introductory college-level math or English courses required for their
program of study (here termed gatekeeper23 courses). For example, in an early Achieving
the Dream sample including seven states and 57 community colleges, only 20% of
students referred to developmental math eventually enrolled in and completed college-
level math within three years (Bailey, Jeong, et al., 2010). The likelihood of eventually
completing a gatekeeper course is even lower for very poorly scoring students, who must
proceed through a lengthy sequence of developmental courses.
Students drop out of the developmental-gatekeeper pipeline at multiple points.
Some students never take a developmental course at all, some fail a course in the
developmental sequence and never manage to complete it or move on, and some pass
their first developmental courses but never enroll in the next developmental course in the
sequence. Among those who complete the developmental sequence, some never enroll in
a gatekeeper course and some enroll in gatekeeper but fail or withdraw from the course.
We examined CUNY students’ progression through the pipeline for math and writing,
considering only those who actually enrolled in the developmental sequence, and tracked
students for two years after their initial enrollment.24
Figure 6 describes the progression of developmental math students through the
non-STEM sequence.25 These students were most likely to be referred to the first or
second level of math developmental education (47% each); far fewer were referred to the
third level (6%), in part because only one school offered a third level for non-STEM
students during the timeframe under study. Across all levels, only 18% passed gatekeeper
math within two years. In the top two levels, the most commonly-encountered barrier was
failing a developmental course. Among students referred to the lowest level of
developmental education, while course failure was still common, a substantial proportion 23 See Appendix A for a definition of gatekeeper. 24 Please note these figures are not directly comparable to those presented in similar studies of progression in other states (Bailey, Jeong, et al., 2010; Jenkins et al., 2009), as we use a different timeframe and baseline sample. Our figures include only developmental enrollees (ignoring referrals who never enrolled) and track students for only two years. 25 For a definition of non-STEM sequence, see Appendix A, and for detail on the analyses presented in Figures 6 and 7, see Appendix F.
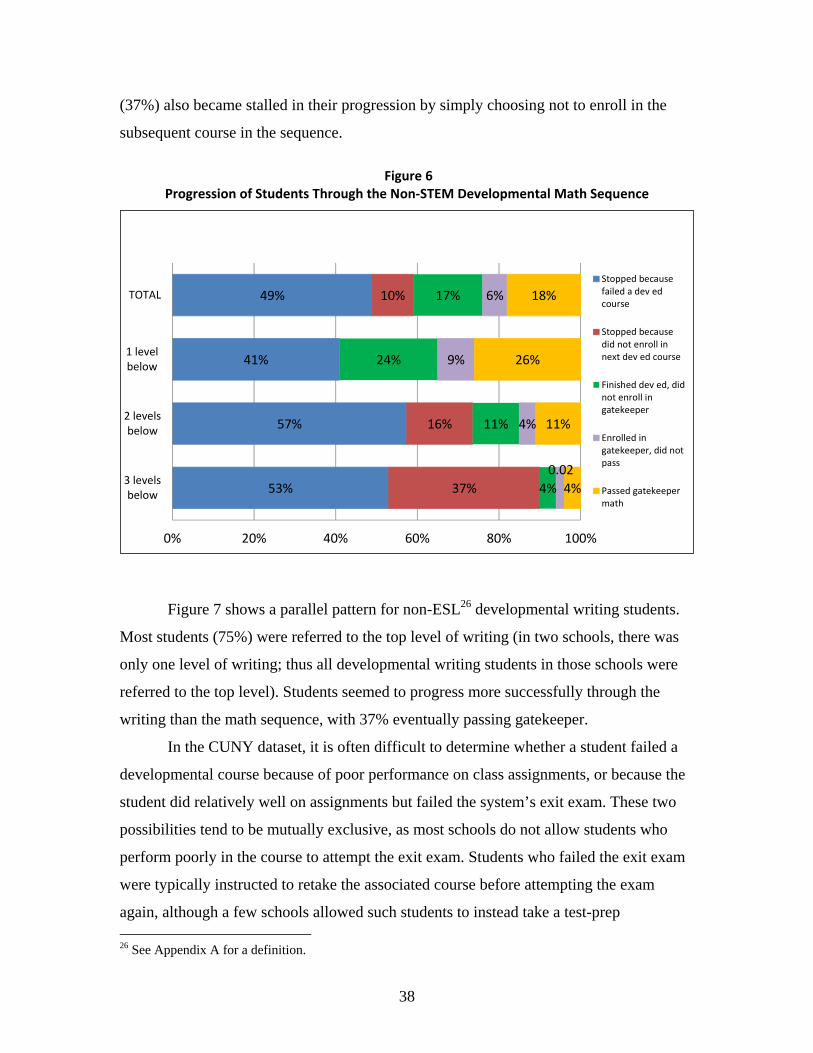
38
(37%) also became stalled in their progression by simply choosing not to enroll in the
subsequent course in the sequence.
Figure 6 Progression of Students Through the Non‐STEM Developmental Math Sequence
53%
57%
41%
49%
37%
16%
10%
4%
11%
24%
17%
0.02
4%
9%
6%
4%
11%
26%
18%
0% 20% 40% 60% 80% 100%
3 levelsbelow
2 levelsbelow
1 levelbelow
TOTALStopped becausefailed a dev edcourse
Stopped becausedid not enroll innext dev ed course
Finished dev ed, didnot enroll ingatekeeper
Enrolled ingatekeeper, did notpass
Passed gatekeepermath
Figure 7 shows a parallel pattern for non-ESL26 developmental writing students.
Most students (75%) were referred to the top level of writing (in two schools, there was
only one level of writing; thus all developmental writing students in those schools were
referred to the top level). Students seemed to progress more successfully through the
writing than the math sequence, with 37% eventually passing gatekeeper.
In the CUNY dataset, it is often difficult to determine whether a student failed a
developmental course because of poor performance on class assignments, or because the
student did relatively well on assignments but failed the system’s exit exam. These two
possibilities tend to be mutually exclusive, as most schools do not allow students who
perform poorly in the course to attempt the exit exam. Students who failed the exit exam
were typically instructed to retake the associated course before attempting the exam
again, although a few schools allowed such students to instead take a test-prep 26 See Appendix A for a definition.
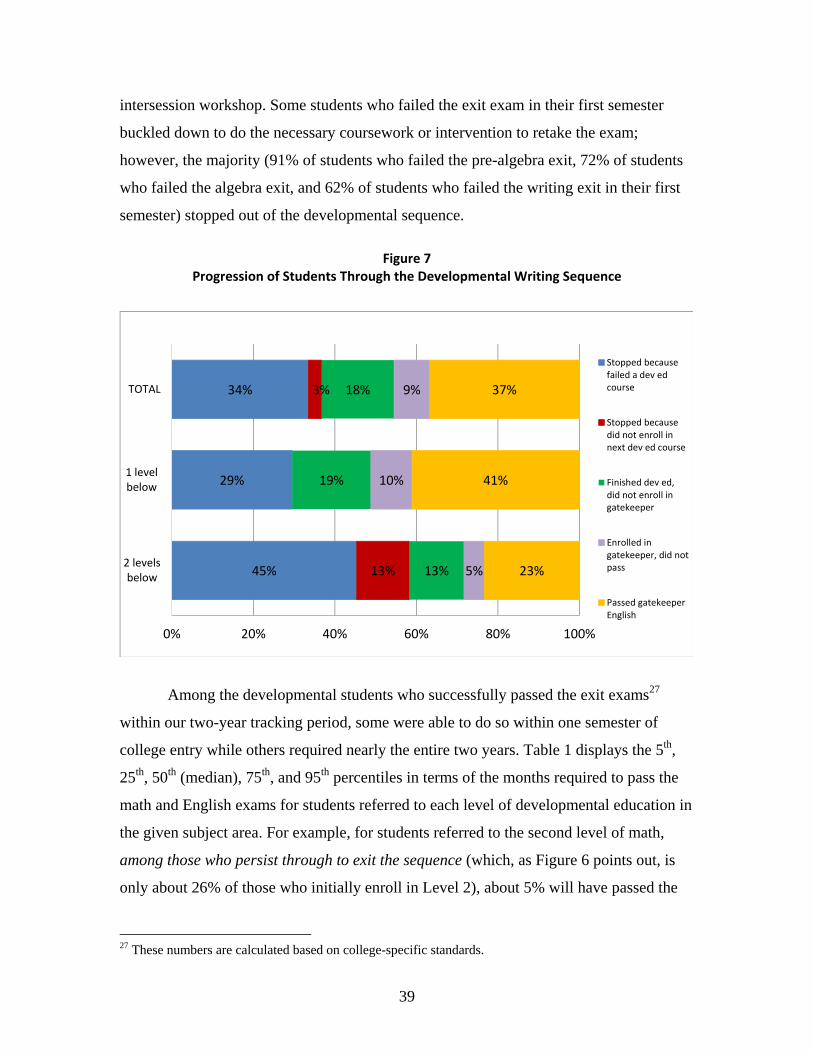
39
intersession workshop. Some students who failed the exit exam in their first semester
buckled down to do the necessary coursework or intervention to retake the exam;
however, the majority (91% of students who failed the pre-algebra exit, 72% of students
who failed the algebra exit, and 62% of students who failed the writing exit in their first
semester) stopped out of the developmental sequence.
Figure 7 Progression of Students Through the Developmental Writing Sequence
45%
29%
34%
13%
3%
13%
19%
18%
5%
10%
9%
23%
41%
37%
0% 20% 40% 60% 80% 100%
2 levelsbelow
1 levelbelow
TOTAL
Stopped becausefailed a dev edcourse
Stopped becausedid not enroll innext dev ed course
Finished dev ed,did not enroll ingatekeeper
Enrolled ingatekeeper, did notpass
Passed gatekeeperEnglish
Among the developmental students who successfully passed the exit exams27
within our two-year tracking period, some were able to do so within one semester of
college entry while others required nearly the entire two years. Table 1 displays the 5th,
25th, 50th (median), 75th, and 95th percentiles in terms of the months required to pass the
math and English exams for students referred to each level of developmental education in
the given subject area. For example, for students referred to the second level of math,
among those who persist through to exit the sequence (which, as Figure 6 points out, is
only about 26% of those who initially enroll in Level 2), about 5% will have passed the
27 These numbers are calculated based on college-specific standards.
40
exam in three months.28 Twenty-five percent will have passed the exam within five
months, about 50% within 10 months, 75% within 15 months and 95% within 22 months.
Those requiring 22 months typically failed the algebra exit exam on the first try but
passed on the second try.
Our two-year tracking period somewhat curtails the amount of time in which
students may successfully pass the exam. If we examine earlier cohorts, which we can
track for at least four years, then results among students referred to the top level of
developmental education are similar to that seen in Table 1. For example, a top-level
math developmental student who passes the algebra exam within the four-year tracking
period will typically do so just four months after enrollment. However, among students
referred to the second or third levels, the extended four-year tracking period reveals that
the typical student may take even longer to pass the exam than is indicated above: the
median is 15 months for those referred to the second level of math and 12 months for
those referred to the third level of math, with the 75th and 95th percentiles lagging even
further behind (see Appendix F, Table F1).
28 Curiously, students referred to three levels below in math were able to complete their developmental requirements and pass the math retest more quickly than students referred to two levels below. To understand this pattern, we examined the records of this very small sample (N = 38) more closely. Their average algebra pretest score (21) was certainly not promising. Although half of the students followed the recommendation to enroll in a third-level course, all but one of those skipped at least one level in the sequence. The other half initially enrolled in a second or first-level math course (perhaps due to being moved up through first-day diagnostic testing). At the conclusion of their first course, all of these developmental “skippers” retested and successfully passed the algebra exam with substantially higher scores (more than doubling their initial scores, with a posttest average of 55). As a result, most were able to advance past more than one course in their first semester. Of this select group of 38 students who were referred three levels below and passed the algebra exam, 15 moved on to enroll in math gatekeeper within the two-year follow-up period, and 13 successfully passed it. This pattern of results suggests that, among students referred to three levels below in math, only those who were unusually motivated managed to exit developmental education within two years.
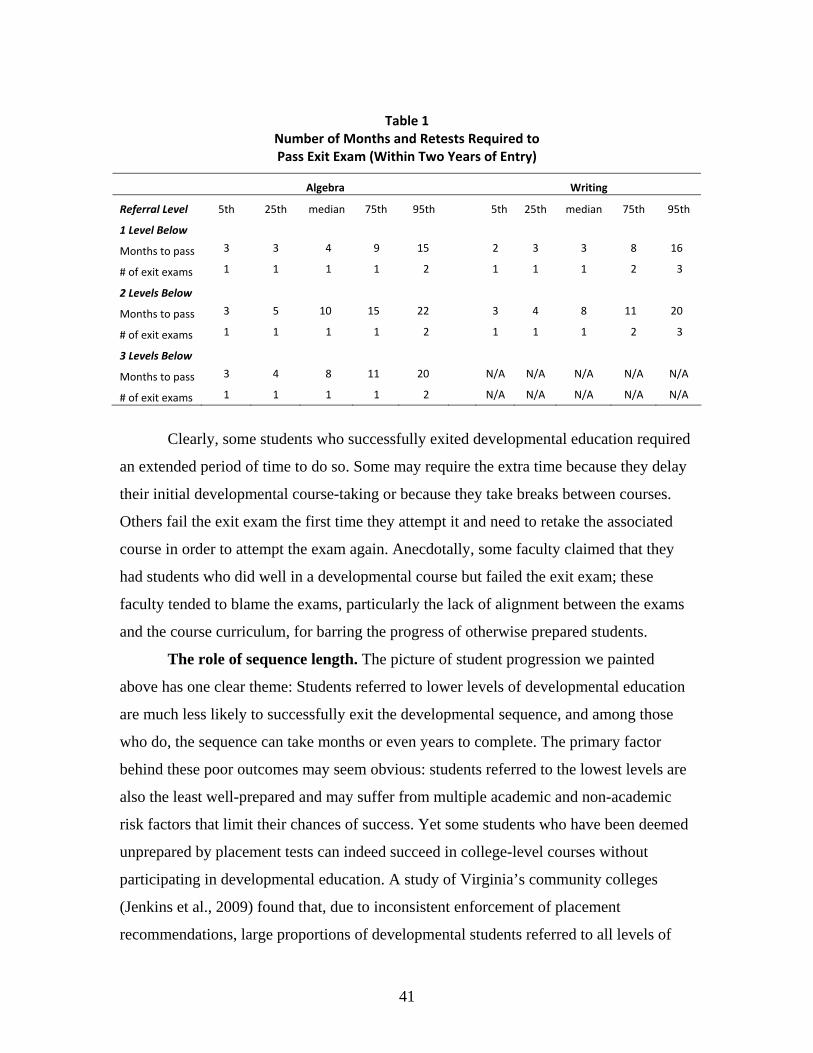
41
Table 1 Number of Months and Retests Required to Pass Exit Exam (Within Two Years of Entry)
Algebra Writing
Referral Level 5th 25th median 75th 95th 5th 25th median 75th 95th
1 Level Below
Months to pass 3 3 4 9 15 2 3 3 8 16
# of exit exams 1 1 1 1 2 1 1 1 2 3
2 Levels Below
Months to pass 3 5 10 15 22 3 4 8 11 20
# of exit exams 1 1 1 1 2 1 1 1 2 3
3 Levels Below
Months to pass 3 4 8 11 20 N/A N/A N/A N/A N/A
# of exit exams 1 1 1 1 2 N/A N/A N/A N/A N/A
Clearly, some students who successfully exited developmental education required
an extended period of time to do so. Some may require the extra time because they delay
their initial developmental course-taking or because they take breaks between courses.
Others fail the exit exam the first time they attempt it and need to retake the associated
course in order to attempt the exam again. Anecdotally, some faculty claimed that they
had students who did well in a developmental course but failed the exit exam; these
faculty tended to blame the exams, particularly the lack of alignment between the exams
and the course curriculum, for barring the progress of otherwise prepared students.
The role of sequence length. The picture of student progression we painted
above has one clear theme: Students referred to lower levels of developmental education
are much less likely to successfully exit the developmental sequence, and among those
who do, the sequence can take months or even years to complete. The primary factor
behind these poor outcomes may seem obvious: students referred to the lowest levels are
also the least well-prepared and may suffer from multiple academic and non-academic
risk factors that limit their chances of success. Yet some students who have been deemed
unprepared by placement tests can indeed succeed in college-level courses without
participating in developmental education. A study of Virginia’s community colleges
(Jenkins et al., 2009) found that, due to inconsistent enforcement of placement
recommendations, large proportions of developmental students referred to all levels of

42
developmental education were able to enroll directly in college-level math and English.
Those developmental education “skippers” were just as likely to succeed in college-level
math and English compared with students who complied with developmental
recommendations; moreover, in the long term, developmental skippers were just as likely
to successfully earn a credential or transfer to a four-year school as were developmental
compliers. Those results, however, do not shed light on why some skippers were able to
succeed. Was this self-selected group particularly motivated to succeed or particularly
savvy about navigating college? Did they select college-level courses and programs that
were relatively easy? Or, all else being equal, does shortening or eliminating the
developmental requirement reduce the likelihood that students will “stop out” of the
developmental sequence, thus increasing their chances of long-term academic success?
At one school at least, faculty’s observations seemed to support the latter
proposition. At this school, math faculty noticed that students were having difficulty
completing the two-course non-STEM developmental algebra sequence. As one faculty
member explained:
Many of them would take the first [developmental algebra] course, and then for whatever reason, even if they passed it, they would wait several semesters before taking the second [developmental algebra] course, at which point they had forgotten everything from the first course. Or, if they just squeaked through the first course with a D and then waited another semester, it was almost hopeless in the second course. We looked at the pass rate of the sequence over a two-year period, and it was very, very bad, just for that reason of students not following through and taking that second course immediately after the first course. So, instead of making liberal arts students take those two courses, we gave them one six-hour course. … Even if the pass rates are not spectacular in [the new course], at least if you pass it, as a liberal arts student, you’re done with remediation and you don’t have to come back for another semester.
At the time of our study, the school had approved but not yet implemented the
new six-hour single developmental algebra course for students in non-STEM degree
programs. However, faculty were hopeful that the new course would have better overall
outcomes than the previous two-course algebra sequence.
43
The variation in programming across the six CUNY schools provides an
opportunity to more directly test the hypothesis that equally prepared students who are
referred to shorter sequences will be more successful than those referred to longer
sequences. We conducted several analyses to explore this question in more detail. In each
analysis, we identified students who were similar in terms of their test scores, but (due to
a difference in policy based on cohort of entry or school of enrollment) were referred to
longer versus shorter developmental sequences.29 The outcome for each analysis was
whether the student was successful in passing a college-level course in the given subject
within the two-year follow-up period.
For example, depending on their college of enrollment, non-STEM students who
failed the pre-algebra exam (N = 15,700) were sometimes referred to three levels below
gatekeeper math (14%) but much more often referred to two levels below gatekeeper
math (86%). Figure 8a shows that those enrolled three levels below had lower rates of
eventual gatekeeper completion (4%) compared with those who were enrolled two levels
below (10%). If we further limit the same sample to students who failed the pre-algebra
test with a very low score (21 or below, N = 7,153), the difference remains similar: 3% of
those who enrolled three levels below eventually passed gatekeeper, while 9% of those
who enrolled two levels below eventually passed gatekeeper (Figure 8b). Figures 8c
through 8e show similar patterns. Figure 8c shows results for students scoring in the 27–
29 range on the pre-algebra exam who were referred to the top versus the second level of
math developmental education, Figure 8d shows results for students scoring in the 2–4
range on the writing exam who were referred to the top versus the second level of a
writing sequence, and Figures 8e and 8f show the results for the small groups of students
who took a 20-hour test preparation workshop rather than a semester-long top-level
developmental course.
While these descriptive analyses are only suggestive, they each converge on the
same conclusion: Students in the same range of ability who were referred to a shorter
developmental sequence had an equal (or in some cases, substantially better) chance of
29 See Appendix H for more detailed information.
44
eventually enrolling in and completing the related gatekeeper course in comparison with
those who were referred to a longer sequence.30
While some students will not be able to handle the increased difficulty of material in the
shorter sequence, when we balance that against the fact that many students depart
between courses in a sequence, it may be that overall, students are equally or more
successful in terms of reaching and passing college-level math and English if they are
referred to a shorter developmental sequence. Moreover, research on accelerated
curricula in secondary education suggests that many underperforming students will rise to
the challenge of high expectations, and given the proper supports, can indeed perform at a
level that was previously thought to be beyond their skills (Burris, Heubert, & Levin,
2006).
30 A smaller number of courses in a sequence does not necessarily indicate that the number of credit-hours in the sequence is fewer; for example, a school can choose to bundle two three-hour courses together into one intensive six-hour course. On average, however, the shorter sequences under examination also involved fewer credit-hours. For more information, see Appendix H, Table H1.

45
Figure 8 Gatekeeper Pass Rates for Students with
Similar Test Scores but Different Sequence Lengths
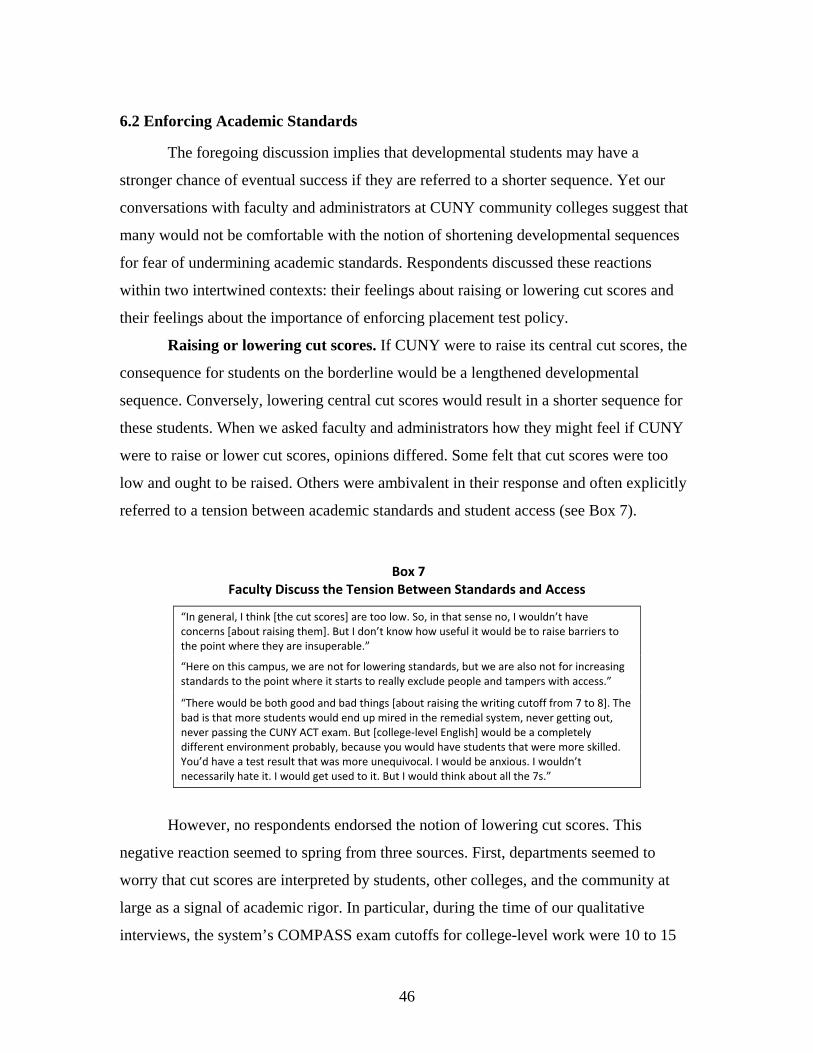
46
6.2 Enforcing Academic Standards
The foregoing discussion implies that developmental students may have a
stronger chance of eventual success if they are referred to a shorter sequence. Yet our
conversations with faculty and administrators at CUNY community colleges suggest that
many would not be comfortable with the notion of shortening developmental sequences
for fear of undermining academic standards. Respondents discussed these reactions
within two intertwined contexts: their feelings about raising or lowering cut scores and
their feelings about the importance of enforcing placement test policy.
Raising or lowering cut scores. If CUNY were to raise its central cut scores, the
consequence for students on the borderline would be a lengthened developmental
sequence. Conversely, lowering central cut scores would result in a shorter sequence for
these students. When we asked faculty and administrators how they might feel if CUNY
were to raise or lower cut scores, opinions differed. Some felt that cut scores were too
low and ought to be raised. Others were ambivalent in their response and often explicitly
referred to a tension between academic standards and student access (see Box 7).
Box 7
Faculty Discuss the Tension Between Standards and Access
“In general, I think [the cut scores] are too low. So, in that sense no, I wouldn’t have concerns [about raising them]. But I don’t know how useful it would be to raise barriers to the point where they are insuperable.”
“Here on this campus, we are not for lowering standards, but we are also not for increasing standards to the point where it starts to really exclude people and tampers with access.”
“There would be both good and bad things [about raising the writing cutoff from 7 to 8]. The bad is that more students would end up mired in the remedial system, never getting out, never passing the CUNY ACT exam. But [college‐level English] would be a completely different environment probably, because you would have students that were more skilled. You’d have a test result that was more unequivocal. I would be anxious. I wouldn’t necessarily hate it. I would get used to it. But I would think about all the 7s.”
However, no respondents endorsed the notion of lowering cut scores. This
negative reaction seemed to spring from three sources. First, departments seemed to
worry that cut scores are interpreted by students, other colleges, and the community at
large as a signal of academic rigor. In particular, during the time of our qualitative
interviews, the system’s COMPASS exam cutoffs for college-level work were 10 to 15
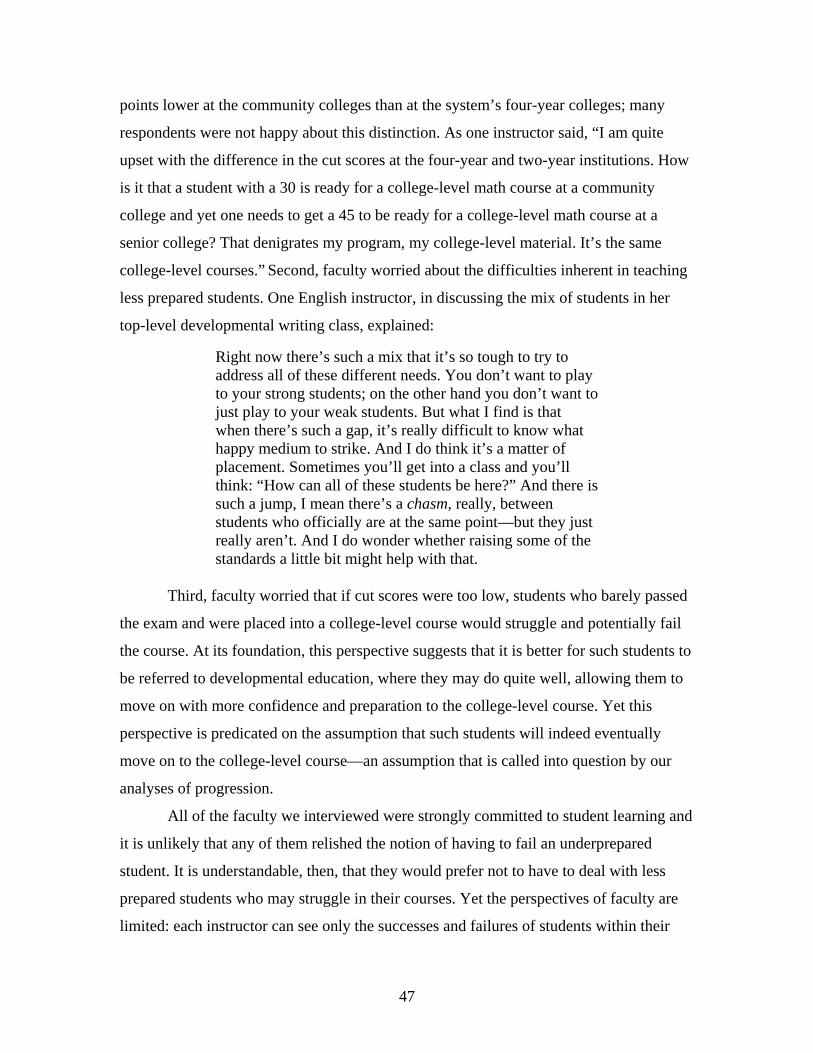
47
points lower at the community colleges than at the system’s four-year colleges; many
respondents were not happy about this distinction. As one instructor said, “I am quite
upset with the difference in the cut scores at the four-year and two-year institutions. How
is it that a student with a 30 is ready for a college-level math course at a community
college and yet one needs to get a 45 to be ready for a college-level math course at a
senior college? That denigrates my program, my college-level material. It’s the same
college-level courses.” Second, faculty worried about the difficulties inherent in teaching
less prepared students. One English instructor, in discussing the mix of students in her
top-level developmental writing class, explained:
Right now there’s such a mix that it’s so tough to try to address all of these different needs. You don’t want to play to your strong students; on the other hand you don’t want to just play to your weak students. But what I find is that when there’s such a gap, it’s really difficult to know what happy medium to strike. And I do think it’s a matter of placement. Sometimes you’ll get into a class and you’ll think: “How can all of these students be here?” And there is such a jump, I mean there’s a chasm, really, between students who officially are at the same point—but they just really aren’t. And I do wonder whether raising some of the standards a little bit might help with that.
Third, faculty worried that if cut scores were too low, students who barely passed
the exam and were placed into a college-level course would struggle and potentially fail
the course. At its foundation, this perspective suggests that it is better for such students to
be referred to developmental education, where they may do quite well, allowing them to
move on with more confidence and preparation to the college-level course. Yet this
perspective is predicated on the assumption that such students will indeed eventually
move on to the college-level course—an assumption that is called into question by our
analyses of progression.
All of the faculty we interviewed were strongly committed to student learning and
it is unlikely that any of them relished the notion of having to fail an underprepared
student. It is understandable, then, that they would prefer not to have to deal with less
prepared students who may struggle in their courses. Yet the perspectives of faculty are
limited: each instructor can see only the successes and failures of students within their
48
own course. They do not see the attrition that occurs between courses; those losses and
failures are invisible and are emotionally salient to nobody except the student involved.
Enforcing placement policy. Each of the six colleges were quite strict in
enforcing their testing and placement policy, and both administrators and faculty were in
agreement regarding the importance of this enforcement. According to respondents,
loopholes or alternate strategies for placement into a college-level course were few, and
their experiences and perceptions are supported by quantitative analysis (see Figures 1
and 2). Most schools did not allow appeals from students who wished to contest their
placement into developmental education.31 As one faculty member said,
I just spend a lot of time hearing the same story over and over again. “It was a bad day. I’m better than a 6 writer. Can I take the test again?” And no. What good is a test if you can keep taking it again until you get the result you want? That’s not what they want to hear.
While some schools offered 20-hour interventions to help students prepare for
retest, the bulk of these interventions were offered to students who had completed the
recommended developmental course but failed the retest. Several faculty and
administrators felt that it was inappropriate to allow an entering student who barely failed
the exam to take a 20-hour intervention rather than a full developmental course. One
instructor explained that her school allowed the practice, “But we don’t like it. …We feel
that a semester in which they are reviewing the material prepares them better to succeed
in the other courses. We are afraid that just passing the COMPASS because of the
workshop doesn’t really prepare the student.”
As noted in an earlier section, most colleges restricted access to the COMPASS
algebra exit exam (for example, to students who had completed the developmental math
sequence, or to students who passed the department’s top-level departmental math exam
with a grade of C or better). While faculty regarded these practices as necessary to ensure
academic quality, administrators had another reason to restrict access to the COMPASS
exit exam: institutional performance metrics. The CUNY system benchmarks each
community college against the others in terms of a variety of student success measures, 31 While some schools allowed first-class-day retesting as a form of appeal, these tests were used to move students within the developmental sequence and could not be used to move students from a developmental course to a college-level one.
49
including pass rates on the developmental writing exit exam and the COMPASS math
exit exam. According to administrators, the CUNY system typically allows each college
to chart its own course as long as the institution’s metrics remain satisfactory. College
administrators, then, have a powerful incentive to ensure that only students who have a
strong likelihood of passing the developmental exit exam are allowed to sit for the exam.
Overall, our discussions with faculty and administrators revealed a strong
ambivalence about the role of placement exams in the enforcement of academic quality.
Faculty and administrators do not necessarily believe that passing the placement exam
signals readiness for a college-level course—and indeed, research on assessment exams
shows that placement scores typically predict little of the variance in student success in
college-level math and English (Hughes & Scott-Clayton, 2011). Yet institutional distrust
of the exams is coupled with a strict adherence to testing and cut-score policies, with little
opportunity for appeal—practices that clearly and publicly convey the implication that
the exams are infallible.
6.3 Summary of Progression Versus Standards at CUNY
Similar to most community colleges across the country, students’ progression
through developmental education at CUNY is slow and uncertain. For example, among
students referred to the second level below college in mathematics, only 26% exit the
developmental sequence within two years, and the time required for each student to do so
is typically at least 10 to 15 months. Students can progress through the sequence more
quickly if they are offered shorter sequences, including 20-hour interventions that allow
them to reattempt the exam without developmental coursework. Yet faculty worry that
such shortcuts result in more underprepared students enrolling in college-level courses,
which may in turn cause a slow erosion of academic standards.
When we consider efficiency versus effectiveness, the source of the conflict is
clear: time and cost are the villains, forcing colleges to maintain efficiency at the expense
of their desired goal of effectiveness. In contrast, when we consider the tension between
progression and standards, there is no clear villain. Faculty and administrators, in general,
want to support student progression. And faculty and administrators, in general, want to
maintain the quality of the education they provide. Yet the two goals can tend to work
50
against one another. As a result, institutions and individual faculty members can hold
positions that are internally inconsistent, such as recognizing that placement exams are
unreliable yet strictly adhering to their results, or expressing anger and frustration about
the flaws of an exit exam yet feeling that same exam is a perfectly reasonable instrument
for initial placement.
In the concluding section, we discuss each of the three tensions that we identified
at CUNY in terms of their larger context and implications and suggest some initial
recommendations in terms of how systems and individual colleges can reconcile the
tensions to create policy that optimizes consistency, autonomy, efficiency, effectiveness,
student progression, and academic standards.
7. Discussion: Reconciling Opposing Forces
Nationwide, the goals that help shape developmental education policy and
practice often seem locked in mutual struggle, resulting in a dysfunctional system that
achieves none of its goals. By examining how the opposing forces that shape
developmental education play out within one community college system, we hope to
identify strategies occurring in the CUNY system and across the country that may resolve
those tensions, allowing the goals of the developmental system to work together rather
than in opposition.
7.1 Consistency that Allows for Flexibility
CUNY’s common placement exams present a broadly consistent message to New
York City’s high schools and their students. This consistency laid the groundwork for
CUNY’s recently launched collaboration with the Mayor’s Office and the city’s
Department of Education to align academic standards between high school and college.32
While plans are still under development, it is clear that CUNY’s placement exams will be
critical to the alignment process. Recognizing the importance of the exams, CUNY
32 Alignment between high school and college comprises two of the seven goals of the Graduate NYC! project, funded by the Bill & Melinda Gates Foundation. See http://www.cuny.edu/about/administration/offices/ue/CUNYDOECollegeReadiness.html for more information.
51
recently undertook a serious effort to improve the tests and ameliorate or eliminate their
flaws. As discussed in an earlier section, during the 2009–2010 academic year CUNY
convened a committee of English faculty from across the system who worked together to
create a new common writing placement/exit exam. The new exam, which faculty
generally believed to be more strongly aligned with the skills students need to succeed in
college-level English, was launched in the fall of 2010. Similarly, the university is now
convening panels of mathematics faculty to design common standards in arithmetic and
elementary algebra that will be the basis for departmental exams, and which will be more
closely aligned with the college-level curriculum.
Cross-college working groups, such as those convened by CUNY, are valuable
not only to promote consistency in the placement exam, but also to help community
college and four-year college faculty communicate expectations and share curricular
goals. Ideally, system-wide working groups would include not only math or English
faculty, but also instructors in other high-enrollment departments—such as business,
liberal arts, and the health professions—who would communicate their expectations
regarding the reading, writing, and mathematics competencies necessary for entering
students to succeed in their program. In reading and writing, this information could be
used to design a developmental curriculum and corresponding exam that are more
contextualized, integrating the types of reading and writing assignments that students will
be expected to perform in social science, natural science, business, and other college-
level courses (see Perin, 2011). In mathematics, an understanding of the expectations of
content-area faculty would allow the system to design an exam that measures the minimal
skills necessary for all students, with additional exam components required only for
students entering math-heavy courses or programs of study. For example, students who
are undecided or are on a liberal arts track might be required to demonstrate proficiency
in the skills necessary to succeed in a basic statistics or quantitative literacy course—the
type of course they are likely to take in order to fulfill the liberal arts math requirement. If
a student then decides to switch to an engineering major, he or she would be required to
demonstrate proficiency in an additional set of math skills prior to enrolling in math-
heavy courses in the major.
52
The notion that institutions should create distinct math pathways for students in
different programs of study has been embraced by the Carnegie Foundation for the
Advancement of Teaching,33 which points out that the calculus-oriented curriculum of
most mathematics developmental education programs is a poor fit for the skills required
in most of today’s occupations and professions. Working with 30 community colleges
and universities, as well as key national organizations such as the American
Mathematical Association of Two-Year Colleges, the Foundation has designed statistics-
oriented and quantitative literacy-oriented pathways for developmental students entering
non-STEM academic programs. In discussing the notion of such differentiated pathways
with mathematics faculty from community colleges across the country, some have
expressed concern about this notion, arguing that intermediate and advanced algebra
skills (such as factoring quadratic equations) are important for all students to master,
regardless of whether those particular skills are applicable to the student’s chosen
program of study. And indeed, perhaps most academics would agree that every college-
educated person ought to possess the critical-thinking skills and logical step-by-step
processes required to solve intermediate and advanced algebra problems. Yet a barely
passing score on a standardized math exam does not guarantee that a student possesses
these particular skills. Moreover, given that most entering students are unlikely to already
possess these skills at the desired level, it is important to recognize that algebra
instruction is not the only method of teaching and building critical and logical thought
processes. These skills and strategies can be taught in statistics courses, quantitative
literacy courses, social and natural science courses, philosophy courses, and potentially in
any academic college-level course. This line of thinking suggests that colleges and larger
institutional systems should not depend on developmental math placements and
coursework to guarantee these skills, but rather employ curriculum-based strategies to
inculcate these skills among all entering students, within both developmental and college-
level courses.
Overall, to reduce confusion and maximize alignment, large systems may find it
helpful to encourage faculty to work together—across both colleges and different
academic departments—to define learning outcomes in key developmental and college-
33 For more information, see http://www.carnegiefoundation.org/developmental-math
53
level courses. These learning outcomes can provide the basis for common placement
exams that tap the minimal math, reading, and writing skills necessary to succeed in
English and in other key introductory courses, while allowing content-area departments
the flexibility to require additional levels of proficiency as needed. By creating
consistency through cross-college discussion and collaboration rather than through
externally-imposed fiat, a system can continue to honor its individual institutions’ goals
and values, rising above the struggle between consistency and autonomy. And by
integrating the concerns and issues of each college, the system’s policy is more likely to
be effective for all colleges, reducing the degree to which colleges will push back against
full implementation of the policy at their own institution. Moreover, common system-
wide placement or exit exams do not necessarily imply that all colleges must have exactly
the same developmental sequences. Although evidence from this report and others (e.g.,
Edgecombe, 2011a; Jenkins et al., 2010) suggests that shortened developmental
sequences may result in equal or greater student success, as yet there is no clear
prescription regarding the “best” design for developmental programming. Accordingly, it
makes sense for systems to allow individual colleges the flexibility to experiment with
developmental courses and sequences—and to support colleges’ attempts to shorten
sequences through accelerated programming, tutoring, test preparation workshops, or
other means, as discussed in more detail below.
7.2 Efficient Assessment that Aligns with Treatment
CUNY’s fall 2010 deployment of the new writing exam, which provides scores in
five different skill domains, demonstrates that an exam can remain efficient while
incorporating more diagnostic value. However, in order for these diagnostic exams to be
worth the small tradeoff in efficiency, the additional information they provide must be
leveraged to provide more effective treatment. Across the country, many institutions are
interested in the notion of linking diagnostic testing to specific instructional modules, so
that a student needs to take only the modules in which they scored poorly, rather than
taking an entire three- or four-credit course. It is important to note, however, that this
modularized approach has not yet been rigorously tested, and thus it is not clear whether
it would accelerate student success. Indeed, if taken to its furthest extent, modularized
54
instruction could result in drilling students on subskills that are isolated from their
conceptual and applied context; and according to pedagogical theories on situated
cognition and contextualization (Brown, Collins, & Duguid, 1989; Johnson, 2002), such
approaches do not allow for the transfer of skills to other courses and real-world tasks.
Thus it may be important to find a balance between tailoring content to an individual’s
needs and integrating that content together with broader concepts and related skills.
Below, we outline some possible ways to strike a balance that could be both
institutionally efficient and instructionally effective.
In terms of writing, a diagnostic exam can provide colleges with a clearer
understanding of developmental students’ skill profiles. To effectively leverage this
information, the testing and placement system could not only identify each student’s
writing weaknesses but also restructure the delivery of the writing curriculum to
explicitly address specific weaknesses. For example, schools could require a lab
component for each developmental writing course, with lab hours fulfilled by attending
the academic learning center to receive additional support and practice in targeted areas
of weakness. This strategy would require faculty to work together with the learning
center to develop appropriate support for key areas of weakness. Students would be
placed in the level of developmental writing indicated by the placement exam, but after
students enroll in the appropriate class, instructors could take advantage of first-day
testing to administer additional surveys or more-targeted diagnostics, then use that
information in coordination with the learning center to assign students to specific lab
sections, tutors, workshops, or tutoring-based assignments. As many underprepared
students have problems not only with specific skills but also with time management,
metacognitive reflection, and other general academic strategies (see Karp, 2011),
developmental course curricula could also include strategy development and
metacognitive skill building for all students.
In terms of mathematics, the Virginia community college system’s developmental
math redesign, currently underway, provides an illustration of how a system could
potentially leverage diagnostic testing (Virginia’s Community Colleges, 2010). A
redesign team including mathematics and content-area faculty from across the Virginia
system defined nine “pre-college” mathematics units, ranging from operations with
55
positive fractions to quadratic equations, parabolas, and systems of linear equations and
inequalities. Consistent with our recommendations in the section above, the redesign
team recommended that career and technical education programs would have the
discretion to determine the units required in their own area, while liberal arts programs
would require units 1–5 and STEM and business areas would require units 1–9. The
Virginia system is designing an exam that will diagnose student performance in each of
the nine units, and each unit will correspond with one developmental course credit.
Theoretically, by allowing students to take only the modules they need, students will be
able to complete developmental education more quickly. Given that many students take
the opportunity to drop out between courses, however, there may be some psychological
benefit to bundling several needed competencies together into one course. Moreover,
scheduling and financial aid requirements may discourage offering nine different one-
credit courses. In Virginia, then, colleges will maintain the flexibility to mix and match
units in ways that meet the college’s administrative efficiency needs as well as the needs
of their own student population. Some colleges may choose to implement hybrid or lab-
based styles with the aim of allowing students to proceed through units at a quicker or
slower pace, while others may choose a more traditional structure in which the whole
class covers the same material at the same pace.
Overall, systems may be able to strike an ideal balance between efficient and
effective assessment by testing students on a manageable number of key competency
areas, such as the five writing competencies identified by CUNY, or the nine math units
identified by Virginia’s community colleges. Colleges can then adapt their developmental
course structures and supports to provide specific treatments to address weaknesses in
each competency. At the same time, colleges must ensure that such modular approaches
do not degenerate into drilling students on isolated subskills. Accordingly, colleges may
wish to explicitly incorporate a variety of applied contexts and connections into each
module, contextualize modules within the student’s specific program area, or integrate
developmental modules as additional required components within higher-level
developmental or introductory-level college courses. In developmental math,
modularized approaches may also incorporate structured student collaboration and the
solving of problems using multiple representations and solution strategies—two
56
pedagogical approaches that are tied to higher student outcomes in mathematics (Hodara,
2011). For systems concerned with the quality of modularized or otherwise accelerated
approaches, well-designed exit exams can help ensure that new, innovative, or non-
course-based treatments remain as effective as the traditional block of sequenced courses.
7.3 Supporting Progression While Maintaining Academic Standards
Our analysis of developmental sequence length across the six CUNY community
colleges suggests that shorter sequences do no harm to students (and in some cases, may
help students) in terms of the likelihood of eventually enrolling in and passing college-
level math and English. This descriptive evidence accords with a growing body of data
on accelerated developmental courses (e.g., Edgecombe 2011a; Jenkins et al., 2010). In
her review of accelerated strategies, Edgecombe explains that colleges typically take one
of two approaches to spur student progression through the developmental sequence: (1)
“rationalizing” the developmental curriculum, by eliminating redundant content across
courses and modifying the remaining content to be more closely aligned to the college
curriculum; and (2) “mainstreaming” developmental students into college-level math or
English courses while providing additional supports, such as a companion
developmental-credit support section.
Faculty may worry that accelerated strategies allow less prepared students to enter
college-level courses. In turn, when faced with less prepared students, a college-level
instructor may feel pressured to “water down” the course by adjusting the rigor of
assignments, creating looser grading rubrics, and generally allowing more exceptions in
terms of deadlines and other expectations. As noted in the previous section, however, a
developmental exit exam that is solidly aligned with college-level material would ensure
that accelerated approaches produce students with the same level of skill as do traditional
developmental sequences. Thus, in order to support student progression while
maintaining high academic standards, the most obvious solution may be to encourage
colleges to experiment with shortened sequences, including the use of non-course-based
strategies such as test-preparation workshops, while also requiring students to pass a
high-quality well-aligned exam prior to enrollment in key introductory courses. A major
drawback to this strategy, however, is that the exit exam requirement may thwart
57
experimentation with mainstreaming programs, some of which seem quite effective (e.g.,
Jenkins et al., 2010). For example, given the exit requirement at CUNY, only two schools
offered a mainstreaming option and only under very specific circumstances.34
A more difficult but also more effective and consequential strategy to ensure high
academic standards in college-level courses might be to institute rigorous requirements
into the curriculum that cannot be circumvented by an individual instructor who is feeling
pressure from his or her students to water down the course. These requirements can be
implemented at both the institutional level and the departmental level. First, at the
institutional level, many colleges require that their students take a certain number of
“writing-intensive” courses in order to graduate. Similar requirements could be instituted
in terms of “reading-intensive” courses. Recent research indicates that most students take
very few writing- and reading-intensive courses during their college career, but the fact
that participation in such courses is correlated with the development of critical thinking
and complex reasoning skills over time (Arum & Roksa, 2011) implies that colleges
should be more proactive in setting requirements to take such courses, as well as
requirements for faculty to participate in teaching such courses. Second, at the
departmental level, faculty can work together to establish common learning outcomes
across course sections that tap not only content knowledge but also higher-order critical-
thinking and analytic reasoning skills. The process of defining learning outcomes is a key
step forward in terms of helping faculty from different disciplines communicate and align
expectations across courses in terms of key reading, writing, and math skills (see Perin,
2011). Moreover, measuring these learning outcomes on a consistent basis can help
faculty within each department identify gaps between their own academic standards and
their students’ performance using a metric that is much more clear, consistent, and
informative than end-of-semester letter grades (see Jenkins, 2011). Such clear and
actionable information would allow faculty to design an agenda for learning outcome
improvements that may include curricular redesign, a more strategic use of campus
learning resources, or a more focused and targeted use of faculty professional
development.
34 I.e., two schools allowed entering students with a writing score of 6 who also passed the reading exam to advance to a special section of college-level English.
58
7.4 Final Thoughts
Across the country, institutions struggle with how to improve the effectiveness of
developmental education. Attempts at reform can come to an impasse when
stakeholders—including the system, individual colleges within the system, and faculty
and students within each college—champion seemingly irreconcilable points of view. In
this report, we identify three common sources of tension that arise: system-wide
consistency versus institutional and departmental autonomy, efficient versus effective
assessment, and the support of student progression versus the enforcement of academic
standards. We use the example of one large community college system to bring those
tensions into relief and discuss how they might be resolved. Overall, in order to reconcile
competing points of view and create a developmental system that can be consistent yet
flexible, both efficient and effective, and support progression while maintaining academic
standards, we recommend that systems consider four approaches.
First, faculty across disciplines within a system should work together to create
well-defined learning outcomes for key introductory courses. Second, these learning
outcomes should then serve as a basis to design common placement exams for the general
education curriculum. Exams should include a manageable number of diagnostic
components, and system policy should allow for the addition or subtraction of test
components based on a student’s program of study. Third, with these high-quality, well-
aligned exams in hand, colleges can then experiment with shortened and accelerated
developmental sequences, learning support modules, contextualized developmental
courses, and other innovations. And fourth, colleges should rely not only on placement
exams to ensure academic rigor but should also encourage faculty within each department
to work together to design common learning outcomes that can serve as a foundation for
continuous improvements in the quality of teaching and learning. As Jenkins (2011)
points out in his review of institutional improvement, colleges can create time and space
for this critical faculty-driven work by redefining professional development and
departmental service, focusing these activities more sharply on defining, aligning, and
improving departmental learning outcomes.
More broadly, our three-tensions framework can help systems and individual
colleges identify some of the sources of conflict and dysfunction in their developmental
59
approach. Leaders can then convene college stakeholders to discuss these tensions in the
open, in a supportive and non-threatening environment. By acknowledging that both
sides of each tension represent valid goals and by discussing how those tensions might be
reconciled to maximize both goals, colleges may be able to move forward dramatically in
their conceptualization of an optimal developmental education system, setting the
groundwork for real improvements in policy, programming, and eventual student success.
60
References
ACT, Inc. (2006). COMPASS/ESL reference manual. Iowa City, IA: Author. Attewell, P., Lavin, D. E., Domina, T., & Levey, T. (2006). New evidence on college
remediation. Journal of Higher Education, 77(5), 886–924. Arum, R., & Roksa, J. (2011). Academically adrift: Limited learning on college
campuses. Chicago, IL: University of Chicago Press. Bailey, T., Jeong, D. W., & Cho, S.-W. (2010). Referral, enrollment, and completion in
developmental education sequences in community colleges. Economics of Education Review, 29(2), 255–270.
Bailey, T., Jaggars, S. S., & Cho, S.-W. (2010). Exploring the gap between
developmental education referral and enrollment. Presented at the Achieving the Dream Strategy Institute 2010, Charlotte, NC.
Bailey, T., & Morest, V. S. (Eds.) (2006). Defending the community college equity
agenda. Baltimore, MD: John Hopkins University Press. Bettinger, E., & Long, B. (2003). The effect of remediation on student outcomes: The
plight of underprepared students in higher education (Working Paper, cited with authors’ permission). Cleveland, OH: Case Western University.
Boylan, H., & Bliss, L. (1997). Program components and their relationship to student
performance. Journal of Developmental Education, 20(3), 2–7. Brown, J. S., Collins, A., & Duguid, P. (1989). Situated cognition and the culture of
learning. Educational Researcher, 18(1), 32–42.
Burris, C. C., Heubert, J. P., & Levin, H. M. (2006). Accelerating mathematics achievement using heterogeneous grouping. American Educational Research Journal, 43(1), 105–136.
City University of New York. (2011). A profile of undergraduates at CUNY senior and community colleges: Fall 2010. New York, NY: CUNY Office of Institutional Research and Assessment. Retrieved from http://owl.cuny.edu:7778/portal/page/portal/oira/OIRA_HOME/ug_student_profile_f10.pdf
College Board. (2003). ACCUPLACER OnLine: Technical manual. New York, NY:
College Board.
61
Collins, M. L. (2008). It’s not about the cut score: Redesigning placement assessment policy to improve student success (Achieving the Dream Policy Brief). Boston, MA: Jobs for the Future.
Edgecombe, N. (2011a). Accelerating the academic achievement of students referred to
developmental education (CCRC Working Paper No. 30, Assessment of Evidence Series). New York, NY: Columbia University, Teachers College, Community College Research Center.
Edgecombe, N. (2011b). Developmental policy and practice in Virginia’s community colleges [draft title]. Manuscript in preparation.
Ewell, P., Boeke, M., & Zis, S. (2008). State policies on student transitions: Results of a
fifty-state inventory. Boulder, CO: National Center for Higher Education Management Systems.
Grubb, W. N. (2010). The quandaries of basic skills in community colleges: Views from
the classroom (NCPR Working Paper). New York, NY: Columbia University, Teachers College, National Center for Postsecondary Research.
Hagedorn, L. S. (2005). How to define retention: A new look at an old problem. In A.
Seidman (Ed.), College student retention: Formula for student success (pp. 89–107). Westport, CT: Praeger.
Hodara, M. (2011). Reforming mathematics classroom pedagogy: Evidence-based
findings and recommendations for the developmental math classroom (CCRC Working Paper No. 27, Assessment of Evidence Series). New York, NY: Columbia University, Teachers College, Community College Research Center.
Hughes, K. L., & Scott-Clayton, J. (2011). Assessing developmental education
assessment in community colleges (CCRC Working Paper No. 19, Assessment of Evidence Series). New York, NY: Columbia University, Teachers College, Community College Research Center.
Jenkins, D., Jaggars, S. S., Roksa, J., Zeidenberg, M., & Cho, S.-W. (2009). Strategies for promoting gatekeeper course success among students needing remediation: Research report for the Virginia Community College System. New York, NY: Columbia University, Teachers College, Community College Research Center.
Jenkins, D., Speroni, C., Belfield, C., Jaggars, S. S., & Edgecombe, N. (2010). A model for accelerating academic success of community college remedial English students: Is the Accelerated Learning Program (ALP) effective and affordable? (CCRC Working Paper No. 21). New York, NY: Columbia University, Teachers College, Community College Research Center.
62
Jenkins, D. (2011). Redesigning community colleges for completion: Lessons from research on high-performance organizations (CCRC Working Paper No. 24, Assessment of Evidence Series). New York, NY: Columbia University, Teachers College, Community College Research Center.
Johnson, E. B. (2002). Contextual teaching and learning: What it is and why it’s here to stay. Thousand Oaks, CA: Corwin Press.
Karp, M. M. (2011). Toward a new understanding of academic support: Four
mechanisms encouraging positive student outcomes in the community college (CCRC Working Paper No. 28, Assessment of Evidence Series). New York, NY: Columbia University, Teachers College, Community College Research Center.
Levin, H. (2007). On the relationship between poverty and curriculum. North Carolina
Law Review, 85(5), 1381–1418.
Morgan, D. L., & Michaelides, M. P. (2005). Setting cut scores for college placement
(Research Report No. 2005-9). New York, NY: College Board. Parsad, B., Lewis, L., & Greene, B. (2003). Remedial education at degree-granting
postsecondary institutions in fall 2000: Statistical analysis report (NCES 2004-010). Washington, DC: U.S. Department of Education, National Center for Education Statistics.
Perin, D. (2006). Can community colleges protect both access and standards? The
problem of remediation. Teachers College Record, 108(3), 339–373. Primary Research Group, Inc. (2008). Survey of assessment practices in higher
education. New York, NY: Author. Prince, H. (2005). Standardization vs. flexibility: State policy options on placement
testing for developmental education in community colleges (Achieving the Dream Policy Brief). Boston, MA: Jobs for the Future.
Schmidt, B. C., Badillo, H., Brady, J. V., Mac Donald, H., Ohrenstein, M., Roberts, R. T.,
& Schwartz, R. (1999). The City University of New York: An institution adrift (Report of the Mayor’s Advisory Task Force on The City University of New York). New York, NY: New York City Mayoral Office.
Scott-Clayton, J. (2011). Do high-stakes placement exams predict college success?
Manuscript in preparation.
Strong American Schools. (2008). Diploma to nowhere. Washington, DC: Author. Retrieved from: http://www.deltacostproject.org/analyses/outside_reports.asp
63
Texas Higher Education Coordinating Board [THECB]. (2005). Developmental education in Texas higher education: A comparison of policies and practices, fall 2000 and fall 2004. Retrieved from http://www.thecb.state.tx.us/reports/pdf/0832.pdf
Texas Higher Education Coordinating Board [THECB]. (2009). Statewide developmental
education plan, 2010-2011 biennium. Retrieved from http://www.thecb.state.tx.us/files/dmfile/DevelopmentalEducationPlan.pdf
Venezia, A., Bracco, K. R., & Nodine, T. (2010). One shot deal? Students’ perceptions of
assessment and course placement in California’s community colleges. San Francisco, CA: WestEd.
Virginia’s Community Colleges. (2010). The critical point: Redesiging developmental
mathematics education in Virginia’s Community Colleges (Report of the Developmental Mathematics Redesign Team). Richmond, VA: Author.
64
Appendix A: Technical Definitions
Several technical terms appear throughout the report; we define these below.
Cohort: A cohort is a group of students who enter college in a given semester. A
fall cohort is defined as all first-time certificate- or degree-seeking students who initially
enrolled in the summer or fall of a given academic year. A spring cohort is defined as all
first-time certificate- or degree-seeking students who initially enrolled in the spring of a
given academic year. In this report, we examine the following cohorts: fall 2004, spring
2005, fall 2005, spring 2006, fall 2006, spring 2007, fall 2007, and spring 2008. We
tracked each cohort’s course enrollments and outcomes across their first several years of
enrollment at CUNY.
Gatekeeper: A gatekeeper course is a college-level, introductory math or English
course that students must take to fulfill their math and English program requirements.
These courses also serve as prerequisites to more advanced math and English courses.
Each college had only one or two English gatekeeper courses but had a much wider array
of math gatekeeper courses, ranging from four to 11 courses per school. Some math
gatekeeper courses were prerequisites for higher-level math courses required of students
in science, technology, engineering, or mathematics (STEM) fields, while others served
as terminal math elective courses that liberal arts majors could take to fulfill their
program’s math requirement. The term gatekeeper is similar to the term gateway, which
is used by CUNY to refer to specific introductory courses. In English, the terms
gatekeeper and gateway are synonymous. In math, the term gatekeeper refers to a wider
variety of math courses, while CUNY’s label, gateway, refers only to introductory
college-level math courses that serve as prerequisites to more advanced math courses
within majors that require more advanced math.
English-exempt: According to CUNY central policy, entering community college
students who earned a 480 on the SAT critical reading, a 20 on the ACT English, or a 75
on the New York State English Regents exam were considered college-ready in English
and, therefore, exempt from taking the COMPASS reading and writing placement exams.
We call these students English-exempt.
65
Math-exempt: According to CUNY central policy, entering community college
students who earned a 480 on the SAT math, a 20 on the ACT math, or a 75 on the New
York State Math A, Math B, Sequential II, or Sequential III Regents exam were
considered college-ready in math and, therefore, exempt from taking the COMPASS pre-
algebra and algebra placement exams. We call these students math-exempt.
ESL/Non-ESL: All colleges had separate writing sequences for students who
speak English as a second language. Courses in these sequences are termed ESL courses.
This report does not include any analyses on students in ESL courses; a subsequent report
will discuss these students and their progression in more detail. In this report, we focus
on students in developmental writing sequences. We term these courses non-ESL writing
courses to distinguish them from ESL writing courses.
Non-STEM/STEM students: The CUNY dataset includes information on the
academic program and degree that each student selected when they entered a CUNY
community college. In math, four colleges had a different developmental sequence for
students intending to enter math-heavy programs of study. These programs, which
require math gatekeeper courses with more rigorous prerequisites (i.e., higher placement
scores, scoring above the cutoff on an additional placement exam, and/or an additional
developmental education course) are termed STEM programs or majors (even though not
all of these programs were in science, technology, engineering, or mathematics fields).
Students at these four colleges who chose a STEM program are termed STEM students.
We term all other students as non-STEM students, including all students at the two
colleges that have the single developmental math sequence regardless of program choice.
Non-STEM developmental math sequence: As discussed in the definition of non-
STEM/STEM students (above), four schools had distinct STEM35 and non-STEM
developmental math sequences. At the remaining two schools, which made no distinction
among developmental students in terms of their intended program of study, the math
developmental sequence was classified as non-STEM.
35 We present the progression analysis of students through the STEM developmental math sequence in Appendix F, Figure F1.
66
Appendix B: Qualitative Methodology
A team of CCRC researchers, including the authors of this report, collected the
qualitative data, first receiving approval for the study from the Teachers College
Institutional Review Board and the City University of New York Institutional Review
Board. We also received letters of support from each of the six CUNY community
colleges and the CUNY Office of Institutional Research and Assessment, the office that
provided us with the administrative data for the quantitative analyses.
We followed a process for gathering general and program-specific information on
institutional priorities, policies, and practices that was developed through CCRC’s
National Field Study (Bailey & Morest, 2006). According to this protocol, researchers
first define the pool of appropriate respondents and conduct semi-structured interviews
and, second, examine relevant documentary evidence such as policy handbooks, program
pamphlets or websites, and other published communications.
For this study, we defined the pool of appropriate respondents as assessment
coordinators, developmental education coordinators, higher level administrators, and
English and math developmental education and gatekeeper faculty. Our lead contacts at
each of the CUNY community colleges helped us identify these individuals at their
college. We contacted potential respondents, making it clear that their participation in this
study was voluntary and that if they agreed to participate, we would work to ensure their
confidentiality by using general job functions as pseudonyms and by masking identifying
information wherever possible. We interviewed about 11 respondents per institution for a
total of 67 interviews. The majority of respondents at each college were faculty. Most
interviews took place face-to-face at the respondent’s college, although some were
conducted by telephone and generally lasted for about one hour. Prior to each interview,
we described the purpose of the study and interview, and participants read and signed an
informed consent. CCRC researchers took notes during the interviews, and if participants
consented, we recorded their interviews as well.
The interview covered the following topics: official assessment and placement
policies, policies in practice, perception of student responses to assessment, the role and
effectiveness of assessment, and the organization and delivery of developmental
67
education at the college. Each respondent was asked at least 20 questions, and the
interview questions varied based on the respondent’s position. Examples of questions
asked of faculty respondents include:
1. What are the college’s policies regarding how students advance out of developmental coursework?
2. Would you have concerns if the assessment cutoffs were raised or exemption policies made more stringent? If yes, please describe your concerns. What about if they were lowered or made less stringent?
3. Do you think there is a better way to assess students? If yes, what is it? Why doesn’t your college do assessment that way?
4. Do you feel students who enter your college-level course are ready for that level of academic work, or not? If they have taken basic skills courses, do you feel that these courses have prepared them for the work in your class, or not?
The second source of data was documentary evidence. We reviewed each
college’s website and college catalog for information relevant to the study, such as
placement policies and developmental course offerings. We also collected and reviewed
memos and official documents that outlined system-level and institutional-level
assessment and placement policies. After gathering these data, the authors of this report
analyzed the interview notes, recordings, and documentary evidence to answer our broad
research questions; identify common themes, reactions, and perceptions; and understand
and document system-level and institutional-level policies and practices. We describe the
findings that emerged from analysis of the qualitative and quantitative data in this report.
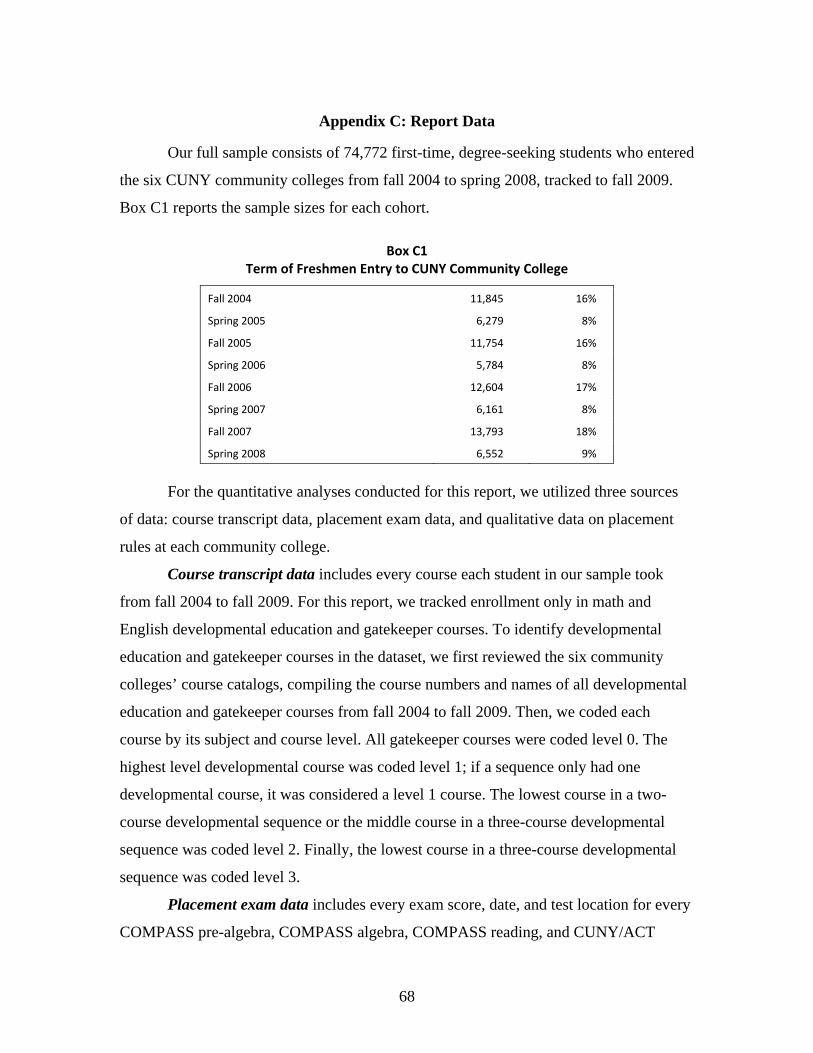
68
Appendix C: Report Data
Our full sample consists of 74,772 first-time, degree-seeking students who entered
the six CUNY community colleges from fall 2004 to spring 2008, tracked to fall 2009.
Box C1 reports the sample sizes for each cohort.
Box C1 Term of Freshmen Entry to CUNY Community College
Fall 2004 11,845 16%
Spring 2005 6,279 8%
Fall 2005 11,754 16%
Spring 2006 5,784 8%
Fall 2006 12,604 17%
Spring 2007 6,161 8%
Fall 2007 13,793 18%
Spring 2008 6,552 9%
For the quantitative analyses conducted for this report, we utilized three sources
of data: course transcript data, placement exam data, and qualitative data on placement
rules at each community college.
Course transcript data includes every course each student in our sample took
from fall 2004 to fall 2009. For this report, we tracked enrollment only in math and
English developmental education and gatekeeper courses. To identify developmental
education and gatekeeper courses in the dataset, we first reviewed the six community
colleges’ course catalogs, compiling the course numbers and names of all developmental
education and gatekeeper courses from fall 2004 to fall 2009. Then, we coded each
course by its subject and course level. All gatekeeper courses were coded level 0. The
highest level developmental course was coded level 1; if a sequence only had one
developmental course, it was considered a level 1 course. The lowest course in a two-
course developmental sequence or the middle course in a three-course developmental
sequence was coded level 2. Finally, the lowest course in a three-course developmental
sequence was coded level 3.
Placement exam data includes every exam score, date, and test location for every
COMPASS pre-algebra, COMPASS algebra, COMPASS reading, and CUNY/ACT
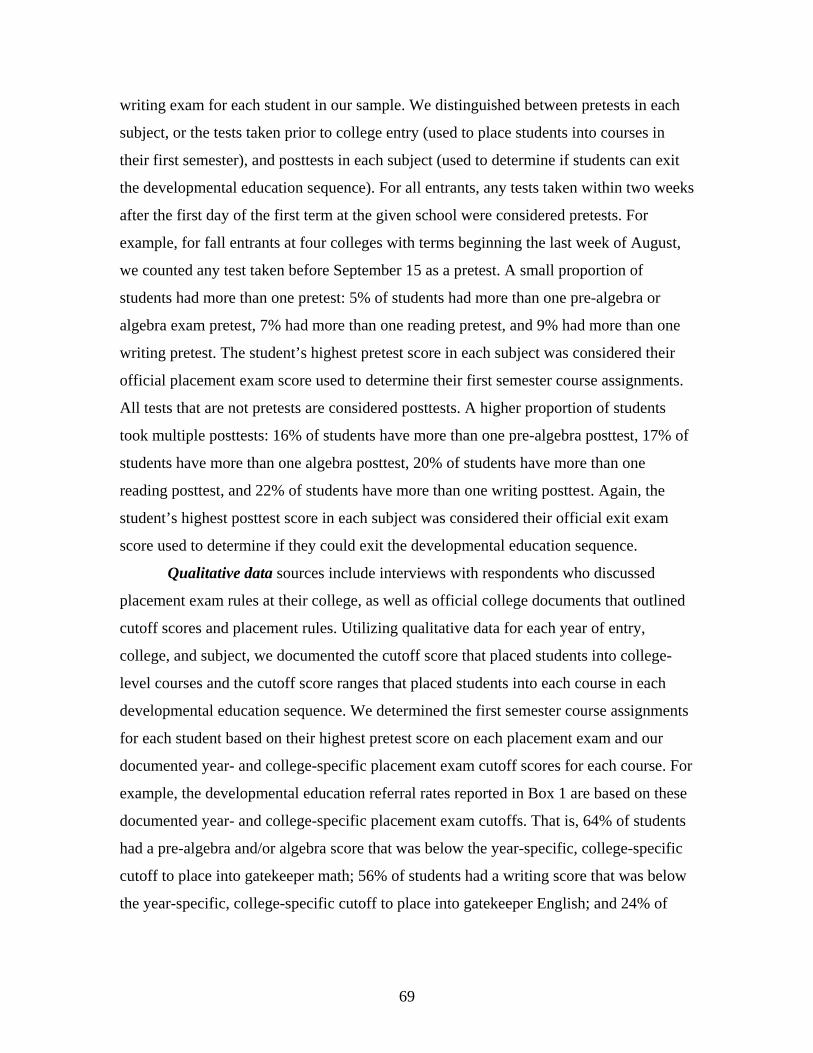
69
writing exam for each student in our sample. We distinguished between pretests in each
subject, or the tests taken prior to college entry (used to place students into courses in
their first semester), and posttests in each subject (used to determine if students can exit
the developmental education sequence). For all entrants, any tests taken within two weeks
after the first day of the first term at the given school were considered pretests. For
example, for fall entrants at four colleges with terms beginning the last week of August,
we counted any test taken before September 15 as a pretest. A small proportion of
students had more than one pretest: 5% of students had more than one pre-algebra or
algebra exam pretest, 7% had more than one reading pretest, and 9% had more than one
writing pretest. The student’s highest pretest score in each subject was considered their
official placement exam score used to determine their first semester course assignments.
All tests that are not pretests are considered posttests. A higher proportion of students
took multiple posttests: 16% of students have more than one pre-algebra posttest, 17% of
students have more than one algebra posttest, 20% of students have more than one
reading posttest, and 22% of students have more than one writing posttest. Again, the
student’s highest posttest score in each subject was considered their official exit exam
score used to determine if they could exit the developmental education sequence.
Qualitative data sources include interviews with respondents who discussed
placement exam rules at their college, as well as official college documents that outlined
cutoff scores and placement rules. Utilizing qualitative data for each year of entry,
college, and subject, we documented the cutoff score that placed students into college-
level courses and the cutoff score ranges that placed students into each course in each
developmental education sequence. We determined the first semester course assignments
for each student based on their highest pretest score on each placement exam and our
documented year- and college-specific placement exam cutoff scores for each course. For
example, the developmental education referral rates reported in Box 1 are based on these
documented year- and college-specific placement exam cutoffs. That is, 64% of students
had a pre-algebra and/or algebra score that was below the year-specific, college-specific
cutoff to place into gatekeeper math; 56% of students had a writing score that was below
the year-specific, college-specific cutoff to place into gatekeeper English; and 24% of
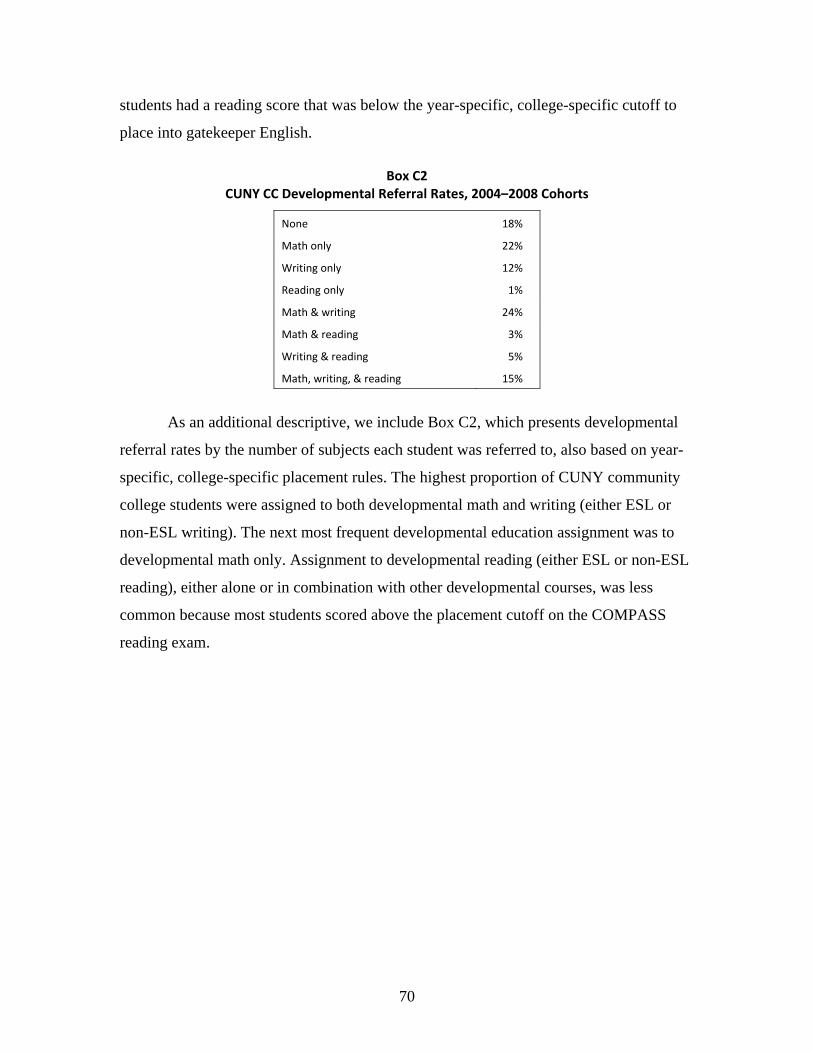
70
students had a reading score that was below the year-specific, college-specific cutoff to
place into gatekeeper English.
Box C2 CUNY CC Developmental Referral Rates, 2004–2008 Cohorts
None 18%
Math only 22%
Writing only 12%
Reading only 1%
Math & writing 24%
Math & reading 3%
Writing & reading 5%
Math, writing, & reading 15%
As an additional descriptive, we include Box C2, which presents developmental
referral rates by the number of subjects each student was referred to, also based on year-
specific, college-specific placement rules. The highest proportion of CUNY community
college students were assigned to both developmental math and writing (either ESL or
non-ESL writing). The next most frequent developmental education assignment was to
developmental math only. Assignment to developmental reading (either ESL or non-ESL
reading), either alone or in combination with other developmental courses, was less
common because most students scored above the placement cutoff on the COMPASS
reading exam.
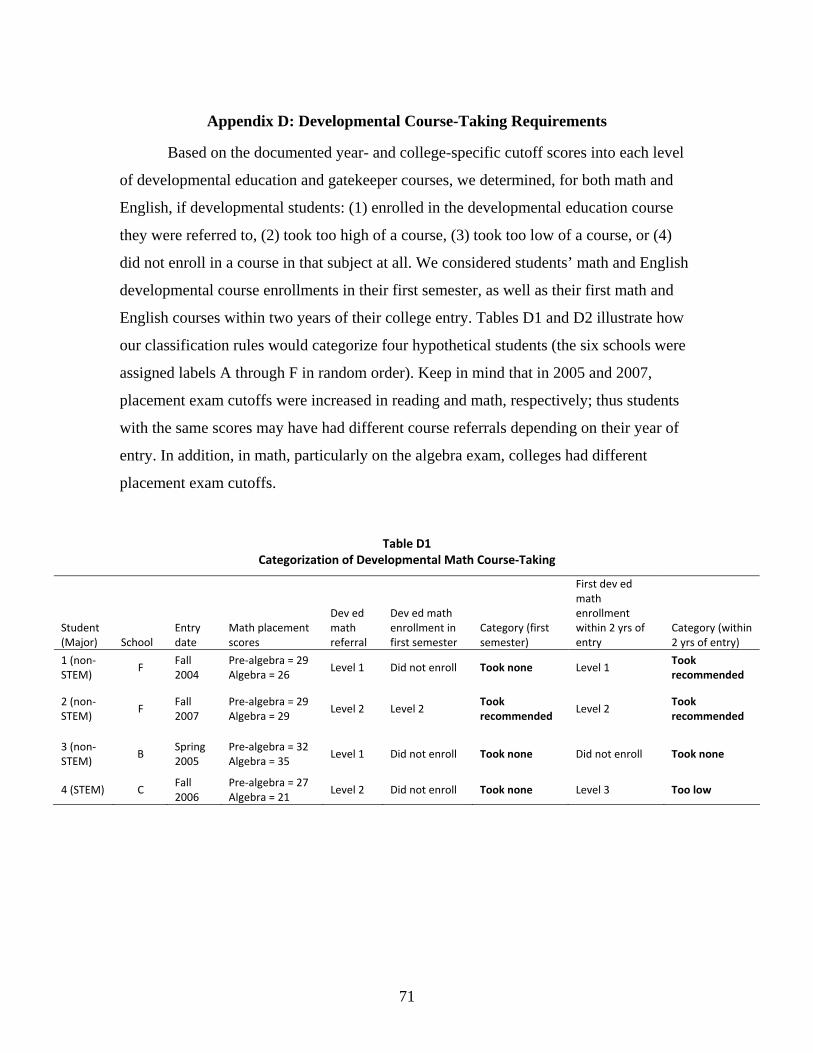
71
Appendix D: Developmental Course-Taking Requirements
Based on the documented year- and college-specific cutoff scores into each level
of developmental education and gatekeeper courses, we determined, for both math and
English, if developmental students: (1) enrolled in the developmental education course
they were referred to, (2) took too high of a course, (3) took too low of a course, or (4)
did not enroll in a course in that subject at all. We considered students’ math and English
developmental course enrollments in their first semester, as well as their first math and
English courses within two years of their college entry. Tables D1 and D2 illustrate how
our classification rules would categorize four hypothetical students (the six schools were
assigned labels A through F in random order). Keep in mind that in 2005 and 2007,
placement exam cutoffs were increased in reading and math, respectively; thus students
with the same scores may have had different course referrals depending on their year of
entry. In addition, in math, particularly on the algebra exam, colleges had different
placement exam cutoffs.
Table D1 Categorization of Developmental Math Course‐Taking
Student (Major) School
Entry date
Math placement scores
Dev ed math referral
Dev ed math enrollment in first semester
Category (first semester)
First dev ed math enrollment within 2 yrs of entry
Category (within 2 yrs of entry)
1 (non‐STEM)
F Fall 2004
Pre‐algebra = 29 Algebra = 26
Level 1 Did not enroll Took none Level 1 Took recommended
2 (non‐STEM)
F Fall 2007
Pre‐algebra = 29 Algebra = 29
Level 2 Level 2 Took recommended
Level 2 Took recommended
3 (non‐STEM)
B Spring 2005
Pre‐algebra = 32 Algebra = 35
Level 1 Did not enroll Took none Did not enroll Took none
4 (STEM) C Fall 2006
Pre‐algebra = 27 Algebra = 21
Level 2 Did not enroll Took none Level 3 Too low
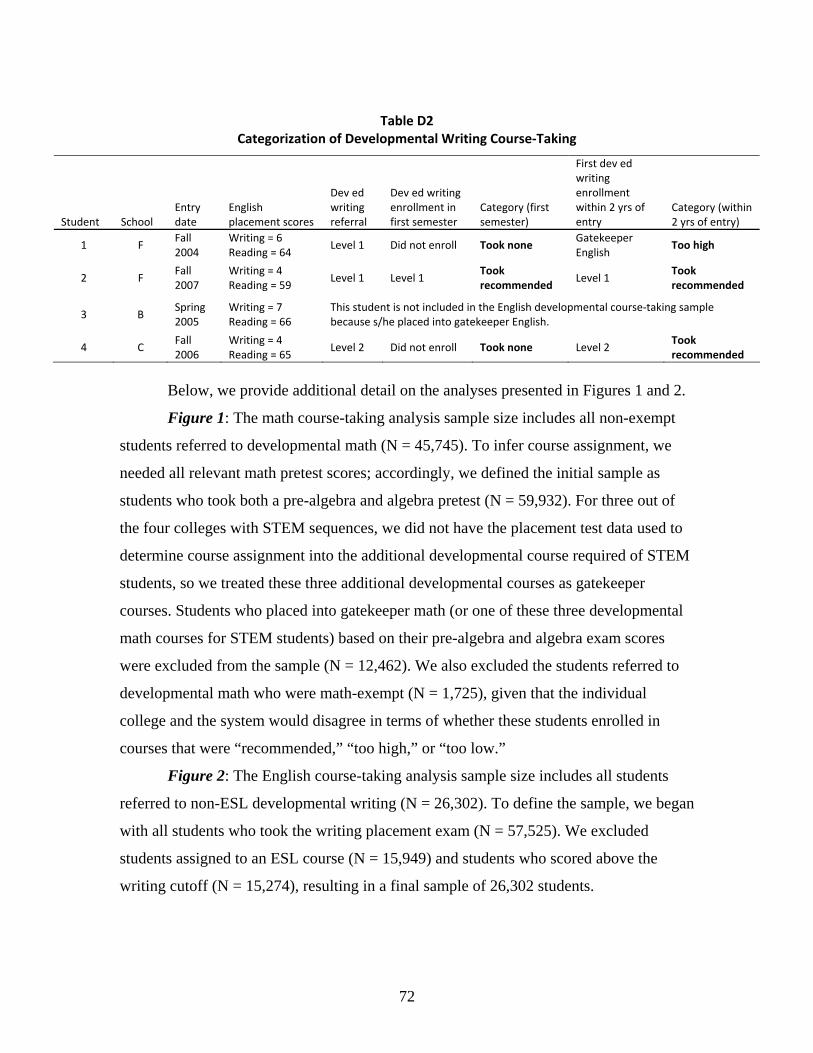
72
Table D2 Categorization of Developmental Writing Course‐Taking
Student School
Entry date
English placement scores
Dev ed writing referral
Dev ed writing enrollment in first semester
Category (first semester)
First dev ed writing enrollment within 2 yrs of entry
Category (within 2 yrs of entry)
1 F Fall 2004
Writing = 6 Reading = 64
Level 1 Did not enroll Took none Gatekeeper English
Too high
2 F Fall 2007
Writing = 4 Reading = 59
Level 1 Level 1 Took recommended
Level 1 Took recommended
3 B Spring 2005
Writing = 7 Reading = 66
This student is not included in the English developmental course‐taking sample because s/he placed into gatekeeper English.
4 C Fall 2006
Writing = 4 Reading = 65
Level 2 Did not enroll Took none Level 2 Took recommended
Below, we provide additional detail on the analyses presented in Figures 1 and 2.
Figure 1: The math course-taking analysis sample size includes all non-exempt
students referred to developmental math (N = 45,745). To infer course assignment, we
needed all relevant math pretest scores; accordingly, we defined the initial sample as
students who took both a pre-algebra and algebra pretest (N = 59,932). For three out of
the four colleges with STEM sequences, we did not have the placement test data used to
determine course assignment into the additional developmental course required of STEM
students, so we treated these three additional developmental courses as gatekeeper
courses. Students who placed into gatekeeper math (or one of these three developmental
math courses for STEM students) based on their pre-algebra and algebra exam scores
were excluded from the sample (N = 12,462). We also excluded the students referred to
developmental math who were math-exempt (N = 1,725), given that the individual
college and the system would disagree in terms of whether these students enrolled in
courses that were “recommended,” “too high,” or “too low.”
Figure 2: The English course-taking analysis sample size includes all students
referred to non-ESL developmental writing (N = 26,302). To define the sample, we began
with all students who took the writing placement exam (N = 57,525). We excluded
students assigned to an ESL course (N = 15,949) and students who scored above the
writing cutoff (N = 15,274), resulting in a final sample of 26,302 students.
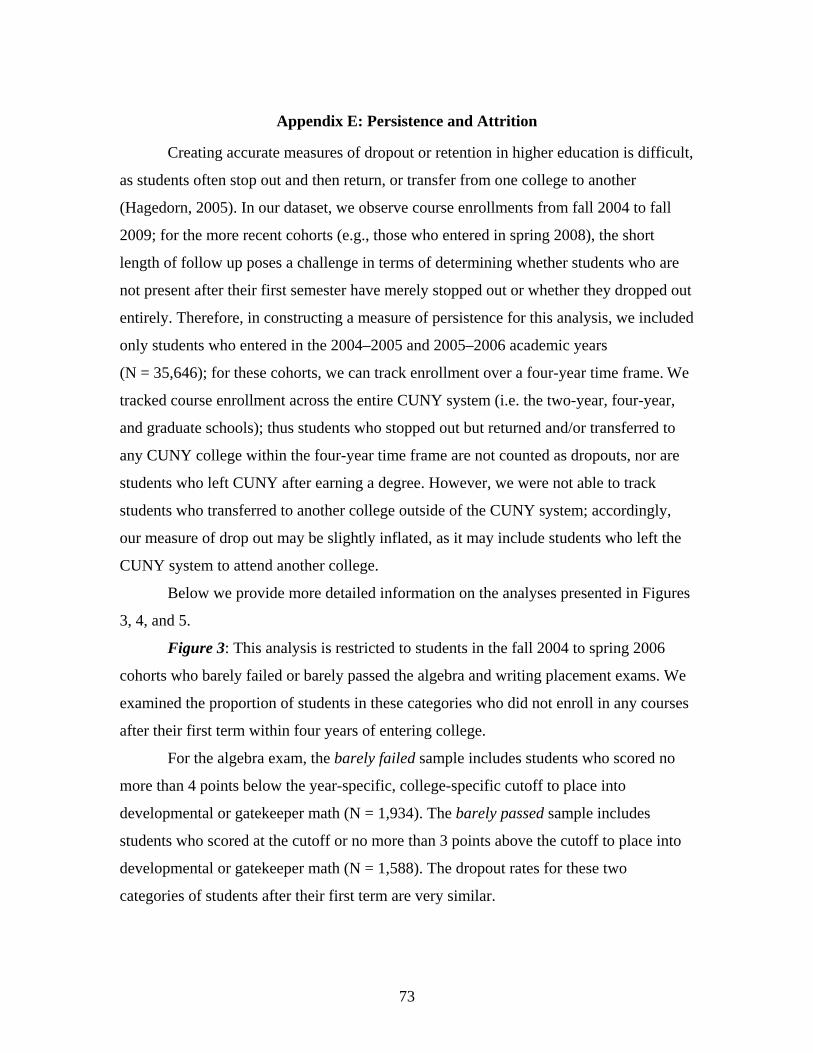
73
Appendix E: Persistence and Attrition
Creating accurate measures of dropout or retention in higher education is difficult,
as students often stop out and then return, or transfer from one college to another
(Hagedorn, 2005). In our dataset, we observe course enrollments from fall 2004 to fall
2009; for the more recent cohorts (e.g., those who entered in spring 2008), the short
length of follow up poses a challenge in terms of determining whether students who are
not present after their first semester have merely stopped out or whether they dropped out
entirely. Therefore, in constructing a measure of persistence for this analysis, we included
only students who entered in the 2004–2005 and 2005–2006 academic years
(N = 35,646); for these cohorts, we can track enrollment over a four-year time frame. We
tracked course enrollment across the entire CUNY system (i.e. the two-year, four-year,
and graduate schools); thus students who stopped out but returned and/or transferred to
any CUNY college within the four-year time frame are not counted as dropouts, nor are
students who left CUNY after earning a degree. However, we were not able to track
students who transferred to another college outside of the CUNY system; accordingly,
our measure of drop out may be slightly inflated, as it may include students who left the
CUNY system to attend another college.
Below we provide more detailed information on the analyses presented in Figures
3, 4, and 5.
Figure 3: This analysis is restricted to students in the fall 2004 to spring 2006
cohorts who barely failed or barely passed the algebra and writing placement exams. We
examined the proportion of students in these categories who did not enroll in any courses
after their first term within four years of entering college.
For the algebra exam, the barely failed sample includes students who scored no
more than 4 points below the year-specific, college-specific cutoff to place into
developmental or gatekeeper math (N = 1,934). The barely passed sample includes
students who scored at the cutoff or no more than 3 points above the cutoff to place into
developmental or gatekeeper math (N = 1,588). The dropout rates for these two
categories of students after their first term are very similar.
74
For the writing exam, the barely failed sample includes students who scored a 6
on the writing placement exam (N = 11,476). The barely passed sample includes students
who scored a 7 or 8 (N = 5,907). (We included students who scored an 8 because the
sample size of students who scored a 7 is quite small: only N = 2,309.) The dropout rate
for students who barely failed the writing exam is significantly higher (p < .001) than for
those who barely passed.
Figure 4: This analysis examines outcomes within four years of entry for students
in the fall 2004 through spring 2006 cohorts who were referred to developmental writing.
While this sample includes 12,886 students, the figure portrays only students who
dropped out after their first term (N = 2,523), persisted at least four years (N = 3,136), or
earned an associate or bachelor’s degree within four years (N = 1,582). The remaining
students (N = 5,645) persisted between two and six terms, but then left the CUNY system
and did not return within the four-year time frame.
Figure 5: This analysis examines outcomes within four years of entry for students
in the fall 2004 through spring 2006 cohorts who were referred to developmental math.
While this sample includes 22,319 students, the figure portrays only students who
dropped out after their first term (N = 4,044), persisted for at least four years (N = 5,868),
or earned an associate or bachelor’s degree within four years (N = 2,695). The remaining
students (N = 9,712) persisted between two and six terms, but then left the CUNY system
and did not return within the four-year time frame.
75
Appendix F: Progression Through Developmental Education
The progression analysis tracks student enrollment through the developmental
education sequence and into gatekeeper courses within a two-year time frame. For the
developmental math sequence, we follow the progression of students who enrolled three
levels, two levels, and one level below gatekeeper math. For the non-ESL developmental
writing sequence, we follow the progression of students who enrolled two levels and one
level below gatekeeper English. We report five outcomes for each of these starting
points: the proportion of students who (1) left the sequence of courses within the two-
year time frame because they failed a developmental course in the sequence, (2) left the
sequence of courses within the two-year time frame because they did not enroll in the
next developmental course in the sequence, (3) finished the sequence, but did not enroll
in the gatekeeper course within the two-year time frame, (4) enrolled in the gatekeeper
course, but did not pass, and (5) enrolled in and passed the gatekeeper course.
Below, we provide additional details on the analyses presented in Figures 6 and 7,
as well as in Table 1. Supplementary analyses (Figure E1 and Table E1) provide
additional context for the analyses presented in the main report.
Figure 6: The total Figure 6 sample size (N = 37,713) includes the following
students: students who enrolled in a developmental math course at the two colleges that
had a single math sequence regardless of program choice (N = 14,128) and, at the four
colleges that have separate sequences for STEM and non-STEM majors, the non-STEM
majors who enrolled in a developmental math course in the non-STEM sequence (N =
23,685). Therefore, students who chose STEM programs at the four colleges with STEM-
specific math sequences are excluded from analysis (N = 5,038). The course progression
of the STEM students is presented in Figure F1 below.
Among the students included in this analysis, only 6% (N = 2,380) started in a
developmental math course that was three levels below gatekeeper, because only one
school had a three-level developmental math sequence during our time frame. The same
proportion (47%) started two levels below (N = 17,725) as one level below (N = 17,708).
Figure 7: This sample includes all students who enrolled in a non-ESL
developmental writing course at their college (N = 30,555). Only 25% (N = 7,726) started
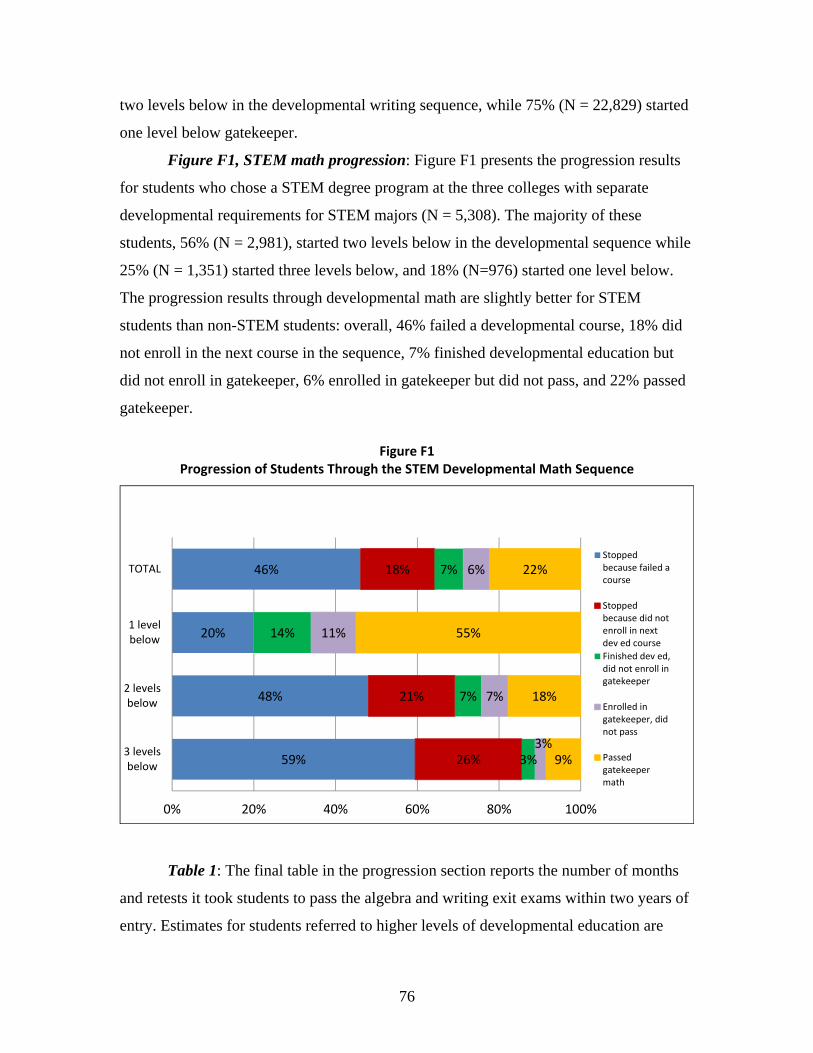
76
two levels below in the developmental writing sequence, while 75% (N = 22,829) started
one level below gatekeeper.
Figure F1, STEM math progression: Figure F1 presents the progression results
for students who chose a STEM degree program at the three colleges with separate
developmental requirements for STEM majors (N = 5,308). The majority of these
students, 56% (N = 2,981), started two levels below in the developmental sequence while
25% (N = 1,351) started three levels below, and 18% (N=976) started one level below.
The progression results through developmental math are slightly better for STEM
students than non-STEM students: overall, 46% failed a developmental course, 18% did
not enroll in the next course in the sequence, 7% finished developmental education but
did not enroll in gatekeeper, 6% enrolled in gatekeeper but did not pass, and 22% passed
gatekeeper.
Figure F1 Progression of Students Through the STEM Developmental Math Sequence
59%
48%
20%
46%
26%
21%
18%
3%
7%
14%
7%
3%
7%
11%
6%
9%
18%
55%
22%
0% 20% 40% 60% 80% 100%
3 levelsbelow
2 levelsbelow
1 levelbelow
TOTALStoppedbecause failed acourse
Stoppedbecause did notenroll in nextdev ed courseFinished dev ed,did not enroll ingatekeeper
Enrolled ingatekeeper, didnot pass
Passedgatekeepermath
Table 1: The final table in the progression section reports the number of months
and retests it took students to pass the algebra and writing exit exams within two years of
entry. Estimates for students referred to higher levels of developmental education are
77
more reliable, as they are based on much larger numbers of students (given that few
students referred to lower levels of developmental education eventually take and pass the
exit exam). The Algebra columns include: students who were referred one level below
gatekeeper math and passed the algebra exam within two years of entry according to
year- and college-specific cutoffs (N = 6,626), students who were referred two levels
below and passed the algebra exam (N = 2,595), and students who were referred three
levels below and passed the algebra exam (N = 38). The Writing columns include:
students who were referred one level below gatekeeper English and passed the writing
exam within two years of entry according to year- and college-specific cutoffs (N =
11,843) and students who were referred two levels below and passed the writing exam (N
= 2,140).
Table F1, Passing the exam within four years of entry: We also examined the
number of months and retests required to pass the algebra and writing exit exams within
four years of entry. This analysis includes only the earlier cohorts (fall 2004 to spring
2006), which can be tracked for at least four years. The Algebra columns include:
students who were referred one level below gatekeeper math and passed the algebra exam
within four years of entry according to year- and college-specific cutoffs (N = 3,834),
students who were referred two levels below and passed the algebra exam (N = 1,597),
and students who were referred three levels below and passed the algebra exam (N = 19).
The Writing columns include: students who were referred one level below gatekeeper
English and passed the writing exam within two years of entry according to year- and
college-specific cutoffs (N = 6,121) and students who were referred two levels below and
passed the writing exam (N = 1,322). Comparing the results presented below to the
results in Table 1 in the body of the report demonstrates that in math, students referred to
the second or third level take considerably more time to exit remediation when we extend
the tracking period to four years, and across all levels and subjects, students in the 75th
and 95th percentile retook the exam more often and took many more months to pass the
exit exam when tracked over a four-year time frame versus a two-year time frame.
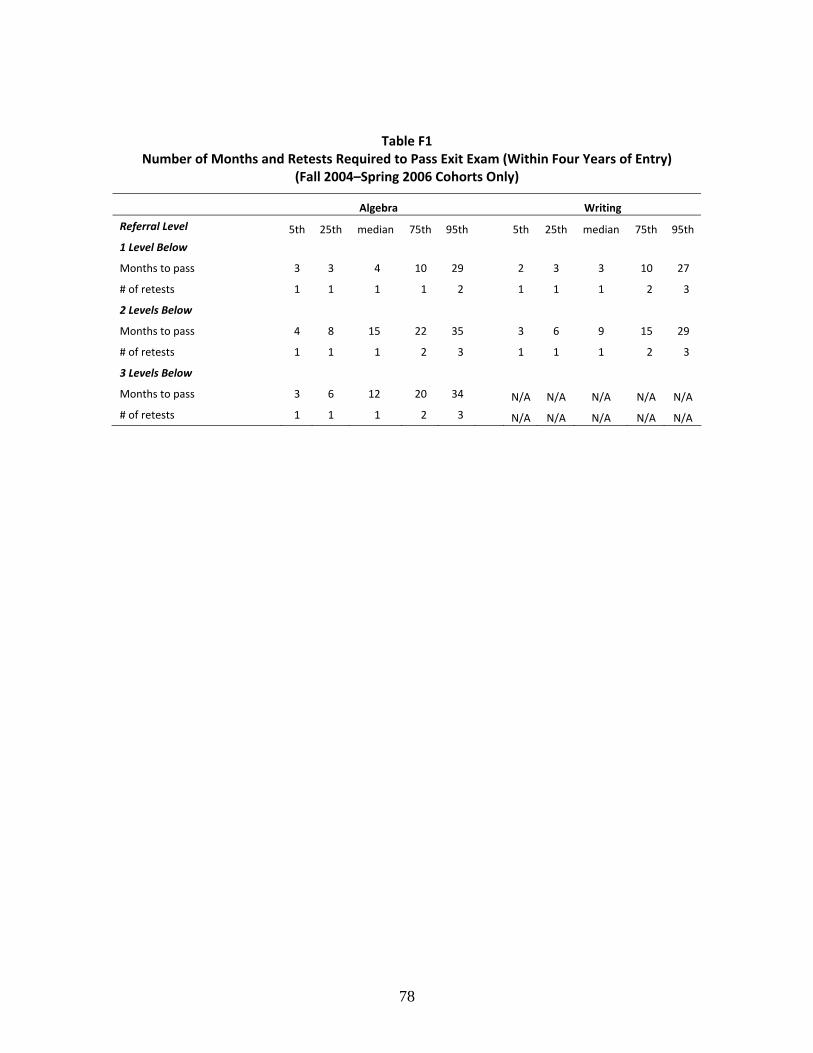
78
Table F1 Number of Months and Retests Required to Pass Exit Exam (Within Four Years of Entry)
(Fall 2004–Spring 2006 Cohorts Only)
Algebra Writing
Referral Level 5th 25th median 75th 95th 5th 25th median 75th 95th
1 Level Below
Months to pass 3 3 4 10 29 2 3 3 10 27
# of retests 1 1 1 1 2 1 1 1 2 3
2 Levels Below
Months to pass 4 8 15 22 35 3 6 9 15 29
# of retests 1 1 1 2 3 1 1 1 2 3
3 Levels Below
Months to pass 3 6 12 20 34 N/A N/A N/A N/A N/A
# of retests 1 1 1 2 3 N/A N/A N/A N/A N/A
79
Appendix G: Additional Analysis—Persistence by Progression Category
The progression analysis raises a number of questions regarding how each of the
five progression outcomes is related to persistence over the long term. First, among
students who chose not to enroll in the next course in the developmental sequence, what
proportion actually dropped out, versus those who persisted in school while avoiding
their developmental requirements? How does their long-term persistence compare to
students who failed a course, students who finished the sequence but did not enroll in
gatekeeper, and students who did not pass gatekeeper? Second, several of the analyses in
our report suggest that developmental students may benefit from shorter sequences that
accelerate student progression through developmental education. One theory behind the
potential effectiveness of accelerated sequences is that they afford lesser opportunity for
life events and other outside commitments to pull students away from school prior to
completing the sequence (Edgecombe, 2011a). However, while an extended amount of
time in developmental education may pose additional burdens to students compared with
an extended amount of time in college-level coursework, outside circumstances can pull
students away from community college at any point in their career. Thus accelerating
student progression through all types of community college coursework—both
developmental and college-level courses—could be important to student retention and
completion. To explore this notion using CUNY data, we examine whether
developmental students who successfully progressed into credit-bearing coursework early
in their college career demonstrate lower attrition over the long term than their
counterparts who did not and whether long-term attrition is fairly constant over time for
students who began community college in developmental education.
To address these questions, we include an additional analysis illustrating the
persistence over a four-year time frame of students from earlier cohorts (fall 2004 to
spring 2006) who enrolled in the non-STEM developmental math and developmental
writing sequences.
Explanation of figures: Figures G1 and G2 indicate the proportion of students in
the fall 2004 to spring 2006 cohorts who were still enrolled in the CUNY system in each
term, beginning with their term of entry, followed for four years. We defined student
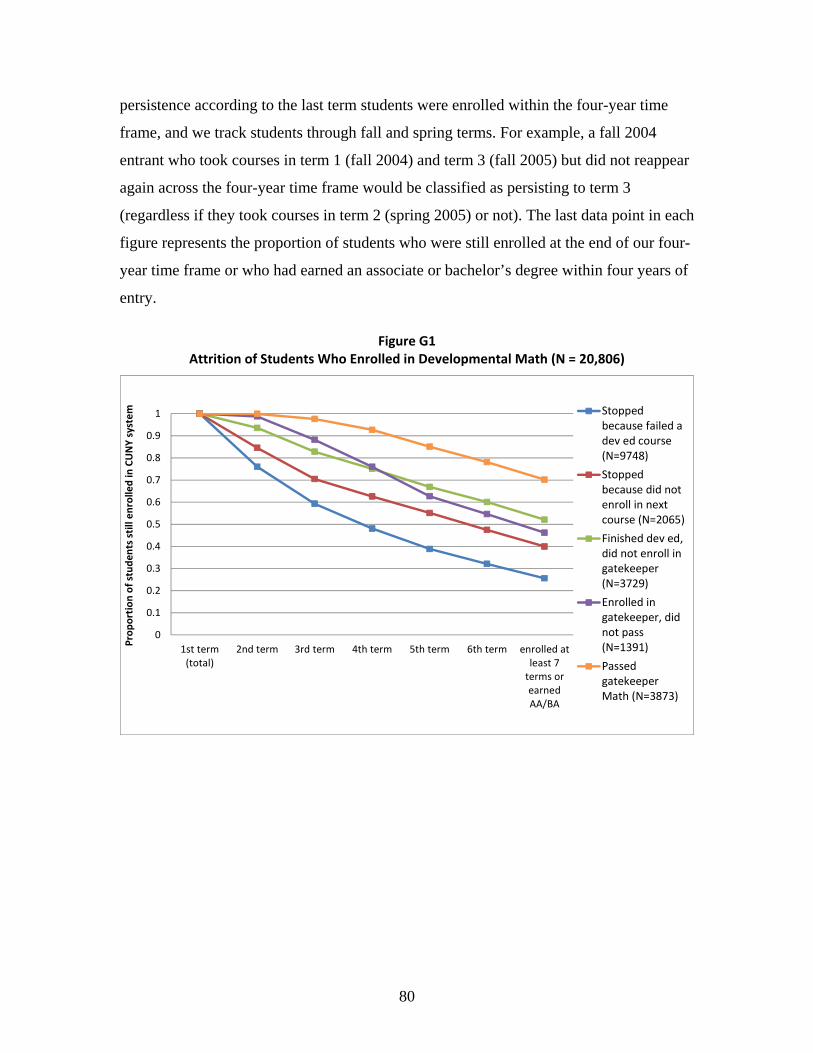
80
persistence according to the last term students were enrolled within the four-year time
frame, and we track students through fall and spring terms. For example, a fall 2004
entrant who took courses in term 1 (fall 2004) and term 3 (fall 2005) but did not reappear
again across the four-year time frame would be classified as persisting to term 3
(regardless if they took courses in term 2 (spring 2005) or not). The last data point in each
figure represents the proportion of students who were still enrolled at the end of our four-
year time frame or who had earned an associate or bachelor’s degree within four years of
entry.
Figure G1 Attrition of Students Who Enrolled in Developmental Math (N = 20,806)
0
0.1
0.2
0.3
0.4
0.5
0.6
0.7
0.8
0.9
1
1st term(total)
2nd term 3rd term 4th term 5th term 6th term enrolled atleast 7terms orearnedAA/BA
Prop
ortion
of stude
nts still enrolled in CUNY system Stopped
because failed adev ed course(N=9748)
Stoppedbecause did notenroll in nextcourse (N=2065)
Finished dev ed,did not enroll ingatekeeper(N=3729)
Enrolled ingatekeeper, didnot pass(N=1391)
PassedgatekeeperMath (N=3873)
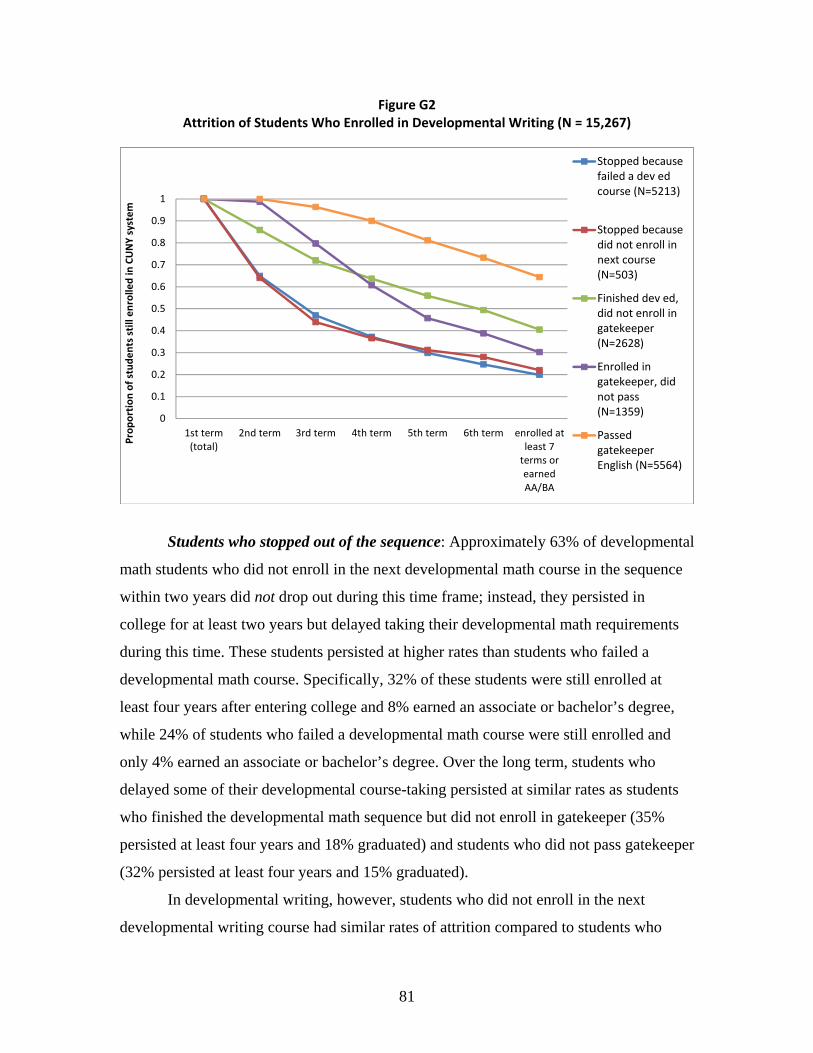
81
Figure G2 Attrition of Students Who Enrolled in Developmental Writing (N = 15,267)
0
0.1
0.2
0.3
0.4
0.5
0.6
0.7
0.8
0.9
1
1st term(total)
2nd term 3rd term 4th term 5th term 6th term enrolled atleast 7terms orearnedAA/BA
Prop
ortion
of stude
nts still enrolled in CUNY system
Stopped becausefailed a dev edcourse (N=5213)
Stopped becausedid not enroll innext course(N=503)
Finished dev ed,did not enroll ingatekeeper(N=2628)
Enrolled ingatekeeper, didnot pass(N=1359)
PassedgatekeeperEnglish (N=5564)
Students who stopped out of the sequence: Approximately 63% of developmental
math students who did not enroll in the next developmental math course in the sequence
within two years did not drop out during this time frame; instead, they persisted in
college for at least two years but delayed taking their developmental math requirements
during this time. These students persisted at higher rates than students who failed a
developmental math course. Specifically, 32% of these students were still enrolled at
least four years after entering college and 8% earned an associate or bachelor’s degree,
while 24% of students who failed a developmental math course were still enrolled and
only 4% earned an associate or bachelor’s degree. Over the long term, students who
delayed some of their developmental course-taking persisted at similar rates as students
who finished the developmental math sequence but did not enroll in gatekeeper (35%
persisted at least four years and 18% graduated) and students who did not pass gatekeeper
(32% persisted at least four years and 15% graduated).
In developmental writing, however, students who did not enroll in the next
developmental writing course had similar rates of attrition compared to students who
82
failed a developmental writing course. Only a small number (N = 503) of developmental
writing students did not progress to the next developmental writing course in the
sequence within two years from entry,36 but among these students, 63% left college
within two years from entry, leaving only 37% who remained in college while avoiding
their developmental writing requirements. Over the long term, 20% of these “writing
delayers” persisted at least four years and only 2% earned an associate or bachelor’s
degree; similarly, 18% of students who failed a developmental writing course persisted at
least four years and 2% graduated. Compared to writing delayers, students who
completed the writing sequence but failed gatekeeper English had only slightly better
outcomes: 26% remained in college for at least four years and 5% graduated. Students
who completed their developmental writing requirements but did not enroll in gatekeeper
English within two years fared much better than developmental writing delayers: 31%
persisted at least four years and 9% graduated.
Overall, delayed enrollment is connected to attrition much more strongly when
the subject is writing rather than math. One possible explanation for this finding is that
delayed enrollment in the next math course is not a clear signal of a student’s propensity
to leave college, given that students can enroll in some degree program requirements that
do not require developmental and/or college-level math prerequisites. However, since
developmental writing courses serve as prerequisites to many more college courses, not
enrolling in the next writing course in the sequence has more serious consequences and
may signal other characteristics and behaviors related to dropping out of college.
Rate of attrition across time: Overall, students who passed gatekeeper courses
within two years of entry were most likely to persist or graduate across the four-year
period. However, it is important to note that, although persistence is substantially higher
for these students, over time their term-to-term attrition rates (i.e., the slope of their lines
in Figures G1 and G2) begin to equalize with developmental students who failed or
delayed their courses. For example, over the first three terms, only 2% of students who
passed gatekeeper math left college compared with 12% of students who did not pass
gatekeeper, 17% of students who did not enroll in gatekeeper, 30% of students who did
36 Four colleges had a two-course developmental writing sequence. This outcome therefore applies only to students at these four colleges who enrolled in and passed the lowest level writing course but did not enroll in the highest level writing course within two years from entry.
83
not enroll in the next developmental math course, and 41% of students who failed a
developmental math course. However, later term-to-term attrition rates are more similar:
8% of developmental math students who passed gatekeeper dropped out after their fourth
term, compared with 12% of students who failed gatekeeper, 8% of students who finished
the sequence but did not enroll in gatekeeper, 8% of students who did not enroll in the
next developmental math course, and 9% of students who failed a developmental math
course.
Summary: Among students referred to math developmental education, delay in
math course-taking was not necessarily a strong signal of the student’s propensity to drop
out early; however, among those referred to English developmental education, delay in
English course-taking seemed a much stronger signal of early dropout. Overall, students
in different progression categories were widely divergent in their propensity to drop out
over the first two semesters. After that point, however, the pull of attrition seemed to be
fairly constant for most groups of students across all the remaining time points of the
study, typically pulling away an additional 8%–10% of students each semester. This
observation supports the notion that accelerating student progression through all types of
community college coursework—both developmental and college-level courses—could
be important to eventual student completion and success.
84
Appendix H: The Role of Sequence Length
Below we provide additional information on the Figure 8 analyses. All analyses
compare the gatekeeper pass rates within two years of entry for students who scored in
the same placement exam range but received different developmental education
treatments. We also include a supplementary analysis (Table H1) that compares the
average number of equated credit hours37 for the set of sequences discussed below.
Figure 8a: Across all six colleges, students who failed the pre-algebra placement
exam were referred to the lowest level developmental math course. At one college with a
three-course non-STEM developmental math sequence, the lowest level was three levels
below gatekeeper, while at four colleges that had a two-course non-STEM developmental
math sequence, the lowest level was two levels below gatekeeper. To utilize this variation
in development math programming, we restricted the sample to students who failed the
pre-algebra placement exam and enrolled in the lowest level developmental math course
in the non-STEM sequence at their college within two years of college entry (N =
15,700), comparing the gatekeeper pass rate of students who failed the pre-algebra
placement exam and started three levels below (N = 2,243) with the gatekeeper pass rate
of students who failed the pre-algebra placement exam and started two levels below (N =
13,457).
Figure 8b: This analysis further restricts the above sample to students who scored
a 21 or below on the pre-algebra placement exam and enrolled in the lowest level
developmental math course in the non-STEM sequence at their college within two years
of college entry (N = 7,153). The figure compares the gatekeeper pass rate of these
students who enrolled three levels below (N = 1,135) with the gatekeeper pass rate of
these students who enrolled two levels below (N = 6,018).
Figure 8c: In fall 2007, CUNY central raised the cutoff score to pass the pre-
algebra exam from 27 to 30. As a result, prior to fall 2007, students who scored a 27, 28,
or 29 on the pre-algebra exam passed; and at five colleges, if they failed the algebra
exam, they were referred to the highest developmental math course in the non-STEM
sequence. In 2007–2008, students who scored a 27, 28, or 29 failed the pre-algebra exam, 37 Since developmental courses do not bear credit, CUNY refers to the number of classroom hours for developmental courses as “equated credit hours.”
85
and at these same five colleges, the students were then referred to the second level
developmental math course in the non-STEM sequence. Therefore, we restricted the
sample to students who scored in the 27–29 range at the five colleges and enrolled in a
developmental math course in the non-STEM sequence within two years of college entry
(N = 1,836), comparing the gatekeeper pass rate of students who started one level below
prior to 2007 (N = 1,655) to the gatekeeper pass rate of students who started two levels
below in 2007–2008 (N = 181).
It is important to note that in the 2007–2008 school year, the majority of students
in those five schools who scored in the 27–29 range started one level below gatekeeper
anyway (N = 580), primarily due to grandfathering of students who took the exam prior
to August 2007. Of these students, 18% (N = 96) passed gatekeeper math.
Figure 8d: Students who scored a 2, 3, or 4 on the writing placement exam (and
were not referred to ESL) were referred to the lowest (or second) level of developmental
writing at four colleges; the remaining two colleges only had one level of developmental
writing, thus students at these colleges who scored a 2, 3, or 4 (and were not referred to
ESL) were referred to take one level of developmental writing. To utilize this variation in
non-ESL developmental writing programming, we restricted the sample to students who
scored in the 2–4 range on the writing placement exam and enrolled in a developmental
writing course within two years of college entry (N = 6,938), comparing the gatekeeper
pass rate of students who scored in the 2–4 range and started two levels below (N =
4,420) to the gatekeeper pass rate of students who scored in the 2–4 range and started one
level below (N = 2,518).
Figures 8e and 8f: This analysis compares students in a similar score range who
took a level 1 developmental education course in their first semester to students who took
a 20-hour intervention in their first semester. Our dataset did not have variables to
identify 20-hour interventions; instead, we identified students who potentially took a 20-
hour intervention by the following criteria: (1) they took a placement exam prior to entry,
(2) they took an exit exam before their second semester, and (3) they took no course in
that exam subject in their first semester. We assume that these students took a 20-hour
intervention before their second semester rather than a developmental course.
86
Figure 8e: For math, we restricted the score range to students who passed the pre-
algebra placement exam but failed the algebra placement exam by year-specific, college-
specific standards. Therefore, the 20-hour algebra intervention sample includes students
who passed pre-algebra, failed algebra, took no developmental or gatekeeper math
courses in their first semester, and then retested on the algebra placement exam prior to
their second semester (N = 334). Out of these students, 40% (N = 132) enrolled in
gatekeeper and 34% (N = 113) passed. The comparison sample consists of students who
passed pre-algebra, failed algebra, and enrolled in a level 1 developmental math course in
their first semester (N =13,232). Out of these students, 37% (N = 4,859) enrolled in
gatekeeper and 27% (N = 3,617) passed.
Figure 8f: For writing, we restricted the score range to students who scored a 6 on
the writing placement exam. Therefore, the 20-hour writing intervention sample includes
students who scored a 6 on the writing placement exam; took no developmental writing,
ESL, or gatekeeper English courses in their first semester; and retested on the writing
placement exam prior to their second semester (N = 758). Out of these students, 70% (N
= 533) enrolled in gatekeeper and 64% (N = 487) passed. The comparison sample
consists of students who scored a 6 on the writing placement exam and enrolled in a level
1 developmental writing course in their first semester (N =13,297). Out of these students,
53% (N = 7,057) enrolled in gatekeeper and 43% (N = 5,778) passed.
Table H1, Average number of equated credit hours: Figure 8 shows that students
who enrolled in shorter sequences had higher gatekeeper pass rates than students who
scored in the same range on the placement exam and enrolled in longer sequences. For
the most part, the shorter sequences were also fewer equated credit hours, but one school
had a shorter sequence that was more equated credit hours than the longer sequence. So,
overall, do the shorter sequences in Figure 8 really translate to fewer in-class hours? To
explore this question, we calculated the average number of equated credit hours required
to complete each of the sequences referred to in Figure 8. The table below illustrates that,
on average, students who enrolled in shorter sequences had to take fewer hours of
developmental coursework than did students scoring in the same range who enrolled in
longer sequences. The difference in the average number of equated credit hours is
smallest for students failing the pre-algebra placement exam and scoring 21 or below, and
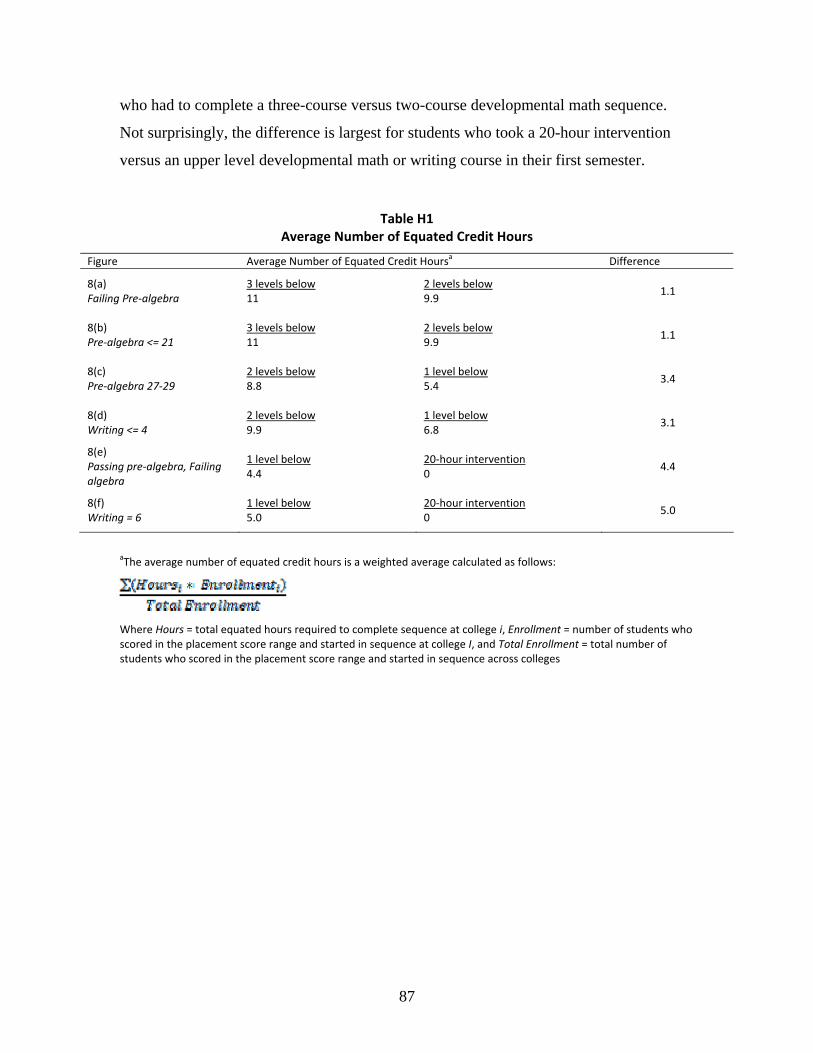
87
who had to complete a three-course versus two-course developmental math sequence.
Not surprisingly, the difference is largest for students who took a 20-hour intervention
versus an upper level developmental math or writing course in their first semester.
Table H1 Average Number of Equated Credit Hours
Figure Average Number of Equated Credit Hoursa Difference
8(a) Failing Pre‐algebra
3 levels below 11
2 levels below 9.9
1.1
8(b) Pre‐algebra <= 21
3 levels below 11
2 levels below 9.9
1.1
8(c) Pre‐algebra 27‐29
2 levels below 8.8
1 level below 5.4
3.4
8(d) Writing <= 4
2 levels below 9.9
1 level below 6.8
3.1
8(e) Passing pre‐algebra, Failing algebra
1 level below 4.4
20‐hour intervention 0
4.4
8(f) Writing = 6
1 level below 5.0
20‐hour intervention 0
5.0
aThe average number of equated credit hours is a weighted average calculated as follows:
Where Hours = total equated hours required to complete sequence at college i, Enrollment = number of students who scored in the placement score range and started in sequence at college I, and Total Enrollment = total number of students who scored in the placement score range and started in sequence across colleges