Embed Size (px)
Citation preview

1
The Opioid Overdose Epidemic Epidemiology and Trends Christopher M. Jones, PharmD, MPH
CDR, US Public Health Service Centers for Disease Control and Prevention
National Center for Injury Prevention and Control Division of Unintentional Injury Prevention

2
Patients with mental health or substance use disorders are at increased risk for nonmedical use and overdose from prescription opioids…appropriate screening, identification, and clinical management by health care providers are essential parts of both behavioral health and chronic pain management and overdose prevention.
Thomas R. Frieden, MD, MPH Director, Centers for Disease Control and Prevention
February 20, 2013

3
Trends and Epidemiology
Nonmedical use Relationship between opioids and heroin Emergency department visits Dependence and abuse Overdose deaths Economic costs and additional public health
consequences

4
TRENDS IN USE

5
Past year nonmedical use of opioid analgesics and heroin have increased in the US
SAMHSA NSDUH 2012
404 669
10,992
12,489
0
2,000
4,000
6,000
8,000
10,000
12,000
14,000
2002 2012
Num
ber o
f use
rs a
mon
g pe
rson
s ≥ 1
2 ye
ars o
ld
(num
bers
in th
ousa
nds)
Year
Heroin
Opioid analgesics

6
Chronic nonmedical use of opioid analgesics has increased more than less frequent use
Jones CM. Frequency of prescription pain releiver nonmedical use, 2002-2003 and 2009-2010. Arch Intern Med. 2012 Sep 10;172(16):1265-7;
0
5
10
15
20
25
30
35
1-29 Days Past YearNonmedical Use
30-99 Days Past YearNonmedical Use
100-199 Days Past YearNonmedical Use
200-365 Days Past YearNonmedical Use
Rate
per
1,0
00 p
opul
atio
n ≥
12 y
ears
old
Frequency of Past Year Nonmedical Use
2002-2003
2009-201075%
Increase

7
Increase in heroin use has occurred among people who were past year nonmedical users
of opioid analgesics
Jones, C.M., Heroin use and heroin use risk behaviors among nonmedical users of prescription opioid pain relievers – United States, 2002–2004 and 2008–2010. Drug Alcohol Depend. (2013), http://dx.doi.org/10.1016/j.drugalcdep.2013.01.007
379
176
58 46
99
588
171
115 100
202
0
100
200
300
400
500
600
700
Overall Past YearHeroin Use
No Past Year NMUOpioids
1-29 Days PastYear NMU Opioids
30-99 Days PastYear NMU Opioids
100-365 Days PastYear NMU Opioids
Num
ber o
f pas
t yea
r use
rs a
mon
g pe
rson
s ≥1
2 ye
ars o
ld (n
umbe
rs in
thou
sand
s)
2002-2004
2008-2010

8
Frequent nonmedical users of opioids more likely to engage in risky use behaviors, US, 2008-2010.
Characteristic
1-29 Days of PYNMU of Opioid Pain Relievers
30-99 Days of PYNMU of Opioid Pain Relievers
100-365 Days of PYNMU of Opioid Pain Relievers
aOR (95% CI) aOR (95% CI) aOR (95% CI)
Past Year Heroin Use referent 2.8 (1.7-4.5) 6.4 (3.7-11.1)
Ever Inject Heroin referent 1.6 (0.9-2.9) 4.3 (2.5-7.3)
Ever Inject Opioid Pain Relievers
referent 3.8 (1.9-7.8) 13.3 (7.7-23.0)
Past Year Heroin Abuse or Dependence
referent 3.2 (1.7-6.1) 7.8 (4.7-12.8)
Past Year Opioid Pain Reliever Abuse or Dependence
referent 2.9 (2.3-3.8) 8.9 (7.1-11.3)
Heroin Fairly or Very Easy to Obtain
referent 1.4 (1.1-1.7) 2.1 (1.8-2.6)
Abbreviations: PYNMU, past year nonmedical use; aOR, adjusted Odds Ratio; 95% CI, 95% Confidence Interval
1Odds ratio adjusted for sex, age, race/ethnicity, total family income, and county type
Jones, C.M., Heroin use and heroin use risk behaviors among nonmedical users of prescription opioid pain relievers – United States, 2002–2004 and 2008–2010. Drug Alcohol Depend. (2013), http://dx.doi.org/10.1016/j.drugalcdep.2013.01.007

9
18-25 year olds have highest rates of chronic nonmedical use of opioid analgesics and
heroin use
Jones CM. Frequency of prescription pain releiver nonmedical use, 2002-2003 and 2009-2010. Arch Intern Med. 2012 Sep 10;172(16):1265-7; SAMHSA NSDUH Public Use File 2011
0
1
2
3
4
5
6
7
8
12-17 18-25 26-34 35-49 50+
Rate
per
1,0
00 p
opul
atio
n
Age Group
Past year chronic nonmedical use Past year heroin use

10
EMERGENCY DEPARTMENT VISITS
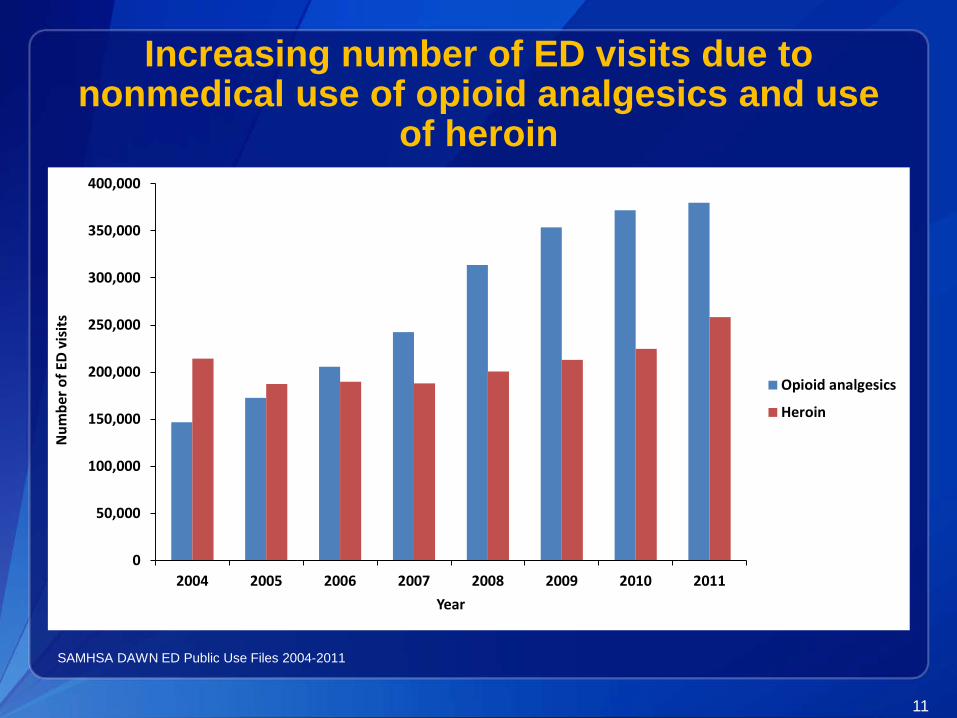
11
Increasing number of ED visits due to nonmedical use of opioid analgesics and use
of heroin
SAMHSA DAWN ED Public Use Files 2004-2011
0
50,000
100,000
150,000
200,000
250,000
300,000
350,000
400,000
2004 2005 2006 2007 2008 2009 2010 2011
Num
ber o
f ED
visi
ts
Year
Opioid analgesics
Heroin

12
18-34 year olds have highest rates of ED visits due to nonmedical use of opioid analgesics
and heroin use
SAMHSA DAWN ED Public Use Files 2011
0
50
100
150
200
250
12-17 18-24 25-34 35-44 45-54 55-64 65+
Rate
per
100
,000
pop
ulat
ion
Age Group
Opioid analgesics Heroin

13
DEPENDENCE AND ABUSE
14
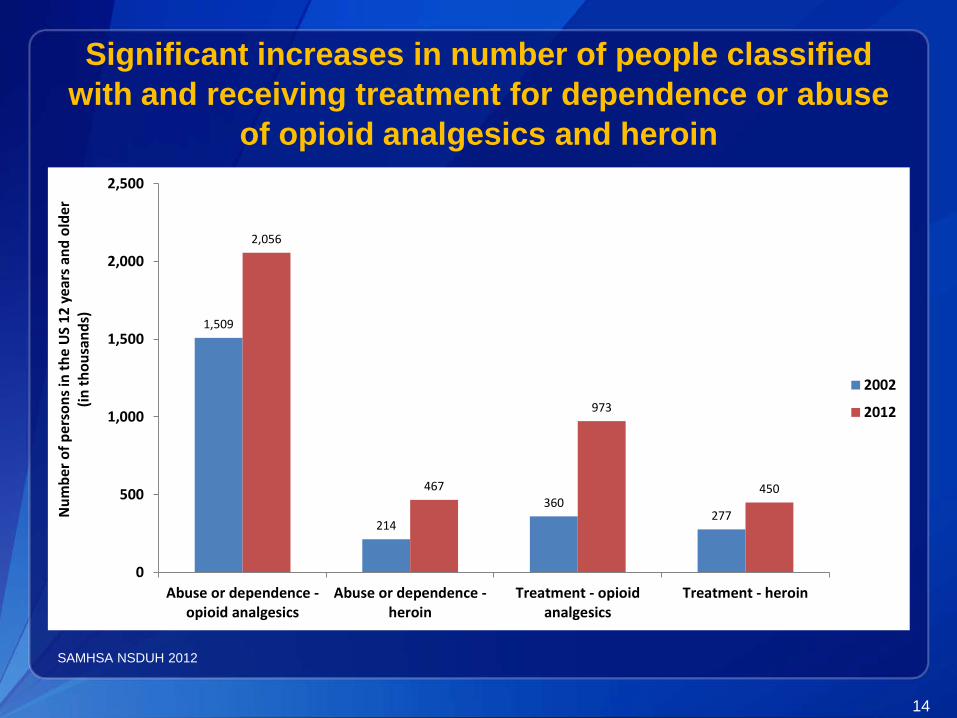
Significant increases in number of people classified with and receiving treatment for dependence or abuse
of opioid analgesics and heroin
SAMHSA NSDUH 2012
1,509
214
360 277
2,056
467
973
450
0
500
1,000
1,500
2,000
2,500
Abuse or dependence -opioid analgesics
Abuse or dependence -heroin
Treatment - opioidanalgesics
Treatment - heroin
Num
ber o
f per
sons
in th
e U
S 12
yea
rs a
nd o
lder
(in
thou
sand
s)
2002
2012

15
18-25 year olds have highest rate of dependence or abuse of opioid analgesics and
heroin
SAMHSA NSDUH Public Use Files 2008-2011
0
2
4
6
8
10
12
14
16
18
20
12-17 18-25 26-34 35-49 50-64 65+
Rate
per
1,0
00 p
opul
atio
n
Age Group
Opioid Analgesic Heroin
16
OVERDOSE DEATHS

17
Drug overdose death rates continue to increase; unprecedented death rate
NCHS Data Brief, December, 2011, Updated with 2009 and 2010 mortality data
0
5
10
15
20
25
1980 1982 1984 1986 1988 1990 1992 1994 1996 1998 2000 2002 2004 2006 2008 2010
Dea
ths
per 1
00,0
00 p
opul
atio
n
Year
Motor Vehicle Traffic Drug Poisoning (Overdose)

18
11 years of increases in opioid analgesic overdose deaths; heroin deaths increasing in
recent years
CDC NCHS/NVSS Mutliple Cause of Death File 1999-2010
0
2,000
4,000
6,000
8,000
10,000
12,000
14,000
16,000
18,000
1999 2000 2001 2002 2003 2004 2005 2006 2007 2008 2009 2010
Num
ber o
f dea
ths
Year
Opioid analgesics
Heroin

19
Opioid analgesics #1 drug involved in overdose deaths; heroin #5
Jones CM et al Pharmaceutical overdose deaths, United States, 2010. JAMA 2013 and CDC/NCHS NVSS MCOD 2010
0
2,000
4,000
6,000
8,000
10,000
12,000
14,000
16,000
18,000
Ddea
ths
Drug Class

20
Opioid analgesic death rates highest in 45-54; heroin highest in 25-34
CDC NCHS/NVSS Mutliple Cause of Death File 2010
0
2
4
6
8
10
12
12-17 18-24 25-34 35-44 45-54 55-64 65+
Deat
hs p
er 1
00,0
00 p
opul
atio
n
Age Group
Opioid analgesics Heroin

Additional risk factors
Demographics Men Whites American Indians/Alaska Natives
Socioeconomics and Geography Medicaid Rural vs urban

ECONOMIC COSTS AND ADDITIONAL PUBLIC HEALTH
CONSEQUENCES
23
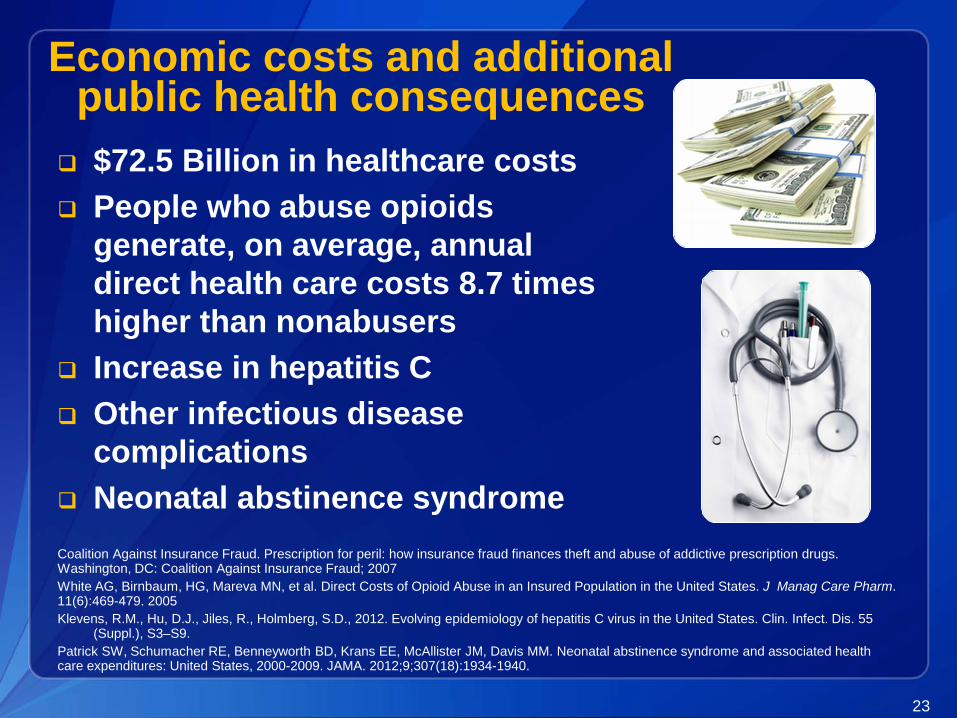
Economic costs and additional public health consequences $72.5 Billion in healthcare costs
People who abuse opioids generate, on average, annual direct health care costs 8.7 times higher than nonabusers
Increase in hepatitis C Other infectious disease
complications Neonatal abstinence syndrome
Coalition Against Insurance Fraud. Prescription for peril: how insurance fraud finances theft and abuse of addictive prescription drugs. Washington, DC: Coalition Against Insurance Fraud; 2007 White AG, Birnbaum, HG, Mareva MN, et al. Direct Costs of Opioid Abuse in an Insured Population in the United States. J Manag Care Pharm. 11(6):469-479. 2005 Klevens, R.M., Hu, D.J., Jiles, R., Holmberg, S.D., 2012. Evolving epidemiology of hepatitis C virus in the United States. Clin. Infect. Dis. 55
(Suppl.), S3–S9. Patrick SW, Schumacher RE, Benneyworth BD, Krans EE, McAllister JM, Davis MM. Neonatal abstinence syndrome and associated health care expenditures: United States, 2000-2009. JAMA. 2012;9;307(18):1934-1940.

24
Of 75 patients who underwent AAROD at a NYC clinic during January–September 2012, 2 died and 5 others experienced serious adverse events requiring hospitalization.
To reduce morbidity and mortality associated with opioid dependence, evidence-based approaches (e.g., medication-assisted treatment) should be used for its management.
http://www.cdc.gov/mmwr/preview/mmwrhtml/mm6238a1.htm?s_cid=mm6238a1_e

Conclusions
Abuse of opioids has increased over the last decade Overdose deaths from these drugs exact significant
health, economic, and social consequences People with substance use disorders are at high risk
for overdose death This is a complex problem with multiple drivers
which requires a multi-pronged response strategy Expanding access to medication assisted treatment
is an essential component of this strategy
26
Thank You
Christopher M. Jones - - [email protected]
The findings and conclusions in this report are those of the author and do not necessarily represent the views of the Centers for Disease Control and Prevention.