Embed Size (px)
Citation preview
Send Orders of Reprints at [email protected]
The Open Construction and Building Technology Journal, 2012, 6, (Suppl 1-M14) 213-235 213
1874-8368/12 2012 Bentham Open
Open Access Realistic FE Models to Enable Push-Over Non Linear Analysis of Masonry Infilled Frames
Frederick Ellul* and Dina D’Ayala
Holford Mews, Cruikshank Street, London WC1X 9HW, UK
Abstract: The assessment of low engineered masonry infilled reinforced concrete frame (LE-MIRCF) buildings is ex-plored using a finite element based modelling technique that enables the representation of the masonry infills in a non-linear finite element analytical environment. A mezo-modelling approach has been developed and implemented for the masonry infills, while fibre elements are used to represent the reinforced concrete members and a spring element for the interface between these and the masonry. The methodology developed also specifically enables for the identification of the onset of shear failure in the columns.
To date the approach has been used to explore the effects of having different patterns of masonry infill distributions and openings, throughout internal frames of a five storey LE-MIRCF structure. The resulting structures were analysed in the inelastic range, and their performance assessed. The results show that the provision of masonry infills is not always dam-aging but nor is always advantageous. Rather it very much depends on the particular infill configuration.
Scope: The development and implementation of a simple yet sufficiently accurate modelling technique that enables the representation of the masonry infills, in an analytical environment suitable for use in the assessment of structures under seismic excitation.
Keywords: Assessment, analytical modeling, low engineered structures, push over analysis, masonry infill.
1. INTRODUCTION
A review of the techniques found in the literature, for the analysis of masonry infilled frames [1], has revealed that to date, proposed strategies are not entirely suitable for the seismic assessment of Low Engineered Masonry Infilled Reinforced Concrete Frame (LE-MIRCF) constructions. This principally stems from the fact, that the earthquake engineer-ing community, has so far relied heavily upon the inclined strut approach and its variants, to represent masonry infills in numerical models. However, the inability of the latter tech-nique to predict suitable estimates of the actual action effects within the reinforced concrete members must be considered as a serious drawback for its use in assessing the perform-ance of LE-MIRCF structures subjected to significant ground motions. Especially so, as post earthquake observa-tions, showed that significant damage in these buildings in-variably took the form of local failure in the reinforced con-crete columns, induced by the interaction effects with the masonry infills [2]. Therefore, the present research is de-voted to presenting the development and implementation, of a specific element suitable for modelling masonry infills in the seismic assessment of LE-MIRCF buildings. Its inclusion in a widely used analytical platform in the field of earth-quake engineering being considered an essential prerequisite of its appeal. Furthermore, a methodology has also been out-lined to describe its use in a performance based assessment framework of LE-MICRF buildings.
* Address correspondence to this author at the Holford Mews, Cruikshank Street, London WC1X 9HW, UK; Tel; 4407952 001464; E-mail: [email protected]
2. NUMERICAL ENVIRONMENT
The main goal of the solution procedure is to allow for a better representation of the action effects within the frame elements, originating from the interaction with the masonry infills. It was therefore decided to employ a distributed plas-ticity type fibre element, in modelling the cross sections, as it accounts rationally for the interaction between axial force and biaxial bending. In this way the location of non-linearity within the elements is automatically taken into account and not assumed at the start of the analysis, as with a lumped plasticity approach. Moreover, the modelling of the spatial distribution of the masonry infills is also considered to be of significant importance in the seismic assessment of LE-MIRCF constructions, and therefore a numerical environ-ment was sought which would allow solutions to be attained in three dimensions. Therefore, the widely used application DRAIN-3DX [3] was selected, also due in part to its open source code.
3. MODELLING THE REINFORCED CONCRETE ELEMENTS
The fibre element used in the present study to model the reinforced concrete members, was element 15 of DRAIN-3DX [4]. The element is essentially of the distributed plastic-ity type, accounting for the spread of inelastic behaviour over the cross sections and along the member length. This is in contrast to a lumped plasticity model where the inelastic behaviour is concentrated in zero length plastic hinges. In constructing the model of any member, the deformable part of the element is divided into a number of segment lengths, and behaviour is monitored at the centre cross section of

214 The Open Construction and Building Technology Journal, 2012, Volume 6 Ellul and D’Ayala
each segment. The cross section properties are assumed con-stant within each segment, but can vary from segment to segment.
The cross section is then either defined as being com-pletely elastic or it is divided into a number of fibres that have nonlinear stress-strain relationships of concrete or steel applied. The material models account for yielding of steel, including strain hardening, for cracking and crushing of con-crete, including post-crushing strength loss, and for tension stiffening of concrete. The accuracy of the model increases with the number of segments along the element length, the number of fibres in each cross section, and the number of points on each material stress-strain curve. However, natu-rally the trade-off in computational cost increases substan-tially. Moreover, P-Delta effects can also be included in the element results.
Though, the element also has the ability to include con-nection hinges at the element ends, simulating the deforma-tions that occur at member intersections, the data required to implement this approach is very hard to come by. Hence, this option was not considered as being viable and was not used throughout the study, as it was felt that insufficient data was given in the literature to use this feature effectively. Neglect-ing the reinforcement slip in the member ends may prove un-conservative however. This is partly counteracted by model-ling the elements at the centre-lines of the members, which results in a larger member length and hence larger overall deformations.
The stress versus strain curve for each material is repre-sented in a piecewise manner. Strengths of concrete fibres can be specified to decrease after a maximum strength is reached. The element is however unable to capture a number of potentially important aspects of beam-column behaviour. These include the fact that the element assumes that plane sections remain plane and uses this as a kinematic constraint to express the degrees of freedom of the various points of a cross-section in terms of the three deformations of the sec-tion, meaning that within the body of the element, bond-slip is assumed to be zero and thus full composite action is as-sumed. Furthermore, though shear deformations can be in-cluded, the shear behaviour is assumed to be elastic as is that in torsion.
4. MODELLING OF THE MASONRY INFILL PANEL
Though the infills heavily influence the structural behav-iour of LE-MIRCF constructions, it is not their own detailed response which is of concern. Rather, it is their effect on the surrounding framing members that ultimately causes failure and is of immediate interest in this case. Thus, since the overall solution was geared towards enabling the geometric representation of an entire structure, a mezo-modelling ap-proach was adopted for the masonry infills
The properties of masonry are significantly influenced by a large number of factors, including material and dimen-sional properties of the units and mortar, arrangement of bed and head joints and quality of workmanship amongst others, Hendry [5]. Hence, the use of sophisticated numerical mod-els as opposed to more practical means of analysis is argu-able in the context of a complete and actual construction. Especially so, as obtaining reliable and useful experimental
data for numerical models from the literature, or from actual site measurements, is no easy task. Consequently, in propos-ing a suitable model for the masonry infill, allowance was made to the fact that the required approach be based on the minimum number of parameters which can be evaluated with the desired degree of accuracy and reliability, within the framework of a professional assessment of an average LE-MIRCF structure.
Masonry can be regarded as a homogenous material, as long as the size of the element considered is substantially larger than the size of its constituent materials. In the model-ling approach adopted, each finite element therefore repre-sents several bricks and mortar joints, as shown in Fig. (1).
Global axes z
x
(-1,-1)
y
Integration pointsNodes
(1,-1)
-1/e 3
(-1,1)-1/e 3 +1/e 3
+1/e 3
(1,1)
Fig. (1). The representation of the masonry infill panel is achieved by considering a single finite element to represent several bricks and mortar joints. The typical 4-node membrane element is also shown with the locations of the nodes and integration points, corre-sponding to a 2 x 2 rule (all coordinates are shown normalised).
The element model was numerically implemented by us-ing a four noded three dimensional isoparametric membrane element. This element was used in preference to using the three dimensional shell element as it is continuously ob-served in post event field reports that damage in the infill panels occurs primarily in the plane of the infills, which eventually leads to their failure, as opposed to out-of-plane failure, which is a much rarer occurrence for infills held en-tirely in the plane of a column line.
The isoparametric membrane element as coded in FEAP [6] was then implemented into DRAIN-3DX [3]. A 2 x 2 Gaussian integration rule was considered as providing the optimum solution between computational efficiency and accuracy of the results, as suggested in Kotsovos and Pav-lovic [7]. Geometric nonlinearities were not included, limit-ing the analysis to small deformation situations with infini-tesimal strains, as it was considered that masonry is not able to sustain large deformations without severe damage.
4.1. Modelling of the Compressive Behaviour of Masonry
A review of masonry characteristics in compression [5, 8], evidences the sheer variability, for even the simplest of quantities under the most basic of loading conditions. This stems directly from the numerous parameters which play a part in determining the overall characteristics of the masonry matrix. Matters are only compounded further, due to the fact
Realistic FE Models to Enable Push-Over Non Linear Analysis The Open Construction and Building Technology Journal, 2012, Volume 6 215
that masonry exhibits distinct directional properties, due to the different geometrical arrangement of units and mortar in either orthogonal direction, the latter acting as planes of weakness, thus resulting in an anisotropic constitutive behav-iour [9].
A further significant fact which the analyst has to con-tend with in analysing masonry structures is the endless range of unit and mortar combinations encountered. Clearly this has severe implications when trying to model the mate-rial, as effectively each situation is really representing a dif-ferent material matrix with different properties. When added to the aforementioned factors that affect the masonry proper-ties in-situ, the task of providing a tool which is suitable for general use is truly daunting. Yet, the main problem with masonry modelling remains the lack of reliable test data un-der realistic conditions.
Although a generally accepted constitutive model for ma-sonry analysis is not found in the literature, several ap-proaches are encountered, each having merits and limita-tions. Invariably however, the different assumptions made in establishing the various criteria, yield to widely varying re-sults, and calibration often becomes impossible. It is there-fore unlikely that a model applicable to all problems under all states of stress exists. Clearly then, depending on the pur-pose of the analysis, it is up to the analyst to choose an ap-propriate modelling technique.
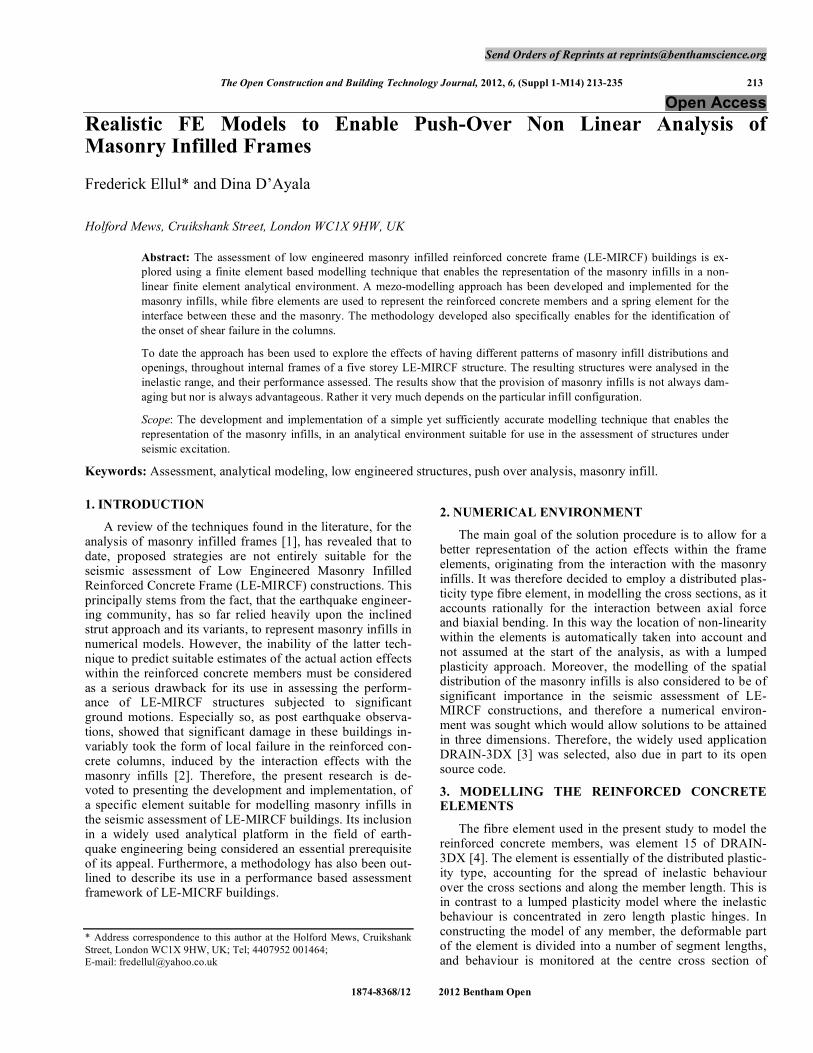
Keeping in mind the behavioural characteristics, all the aforementioned limitations and the primary goal of the ana-lytical solution, (i.e. to enable a better prediction of the ac-tion effects within the frame members), it was therefore de-cided that a generic, simple, robust and efficient approach in describing the masonry behaviour in compression, was to apply an elasto-plastic approach with or without hardening, resulting in the idealised stress-strain relationship shown in Fig. (2).
Fig. (2). Schematic idealisation of a typical stress-strain curve for brickwork masonry in compression, overlaid on particular stress stain curves for different masonry types, as reported in [8].
4.1.1. Elastic Material Response
Though as previously mentioned it is understood that the behaviour of masonry is anisotropic, the rationale of using an
isotropic relationship in the elastic range is due to the fact that with the given masonry materials the confident determi-nation of all the properties required to describe the material numerically cannot be assured and this will be expanded on in the following section. Therefore, the relationship between stress and strain used is given by the standard linear elastic expression for plane stress extended to matrix format for the three dimensional membrane element [10].
!" .D= (1)
4.1.2. Yield Criterion
The physical properties of masonry assemblages are found from the results of experiments on specimens which have only been subjected to the simplest stress conditions. Subsequently, various criteria are developed as hypotheses, in order to predict the response of a masonry structure under any condition of applied stress, and their subsequent valida-tion is done through further tests. This is a determining fac-tor in choosing an appropriate modelling strategy for ma-sonry, because the apparent advantages of using a very so-phisticated approach can be rendered meaningless, if no relevant test data is available for input.
The strength of masonry under stress combinations has been the subject of many investigations and a wide variety of failure criteria have been proposed. These range from critical stress based approaches, such as when the stress at a particu-lar point exceeds the masonry compressive stress, critical strain, critical distortion energy and to complex energy based expressions and fracture mechanics concepts [11].
Masonry is essentially an anisotropic material, yet as stated by Hendry [5], determination of masonry strength under biaxial stress conditions requires specialised equip-ment and is not often reported in literature. This is because to fully define the behaviour of masonry, a large number of tests under a range of biaxial stress states needs to be per-formed [12], which poses considerable experimental difficul-ties both in the complexity of the test set-up and the number of tests required. Since what is ultimately needed is the defi-nition of a failure surface for masonry subjected to biaxial stresses.
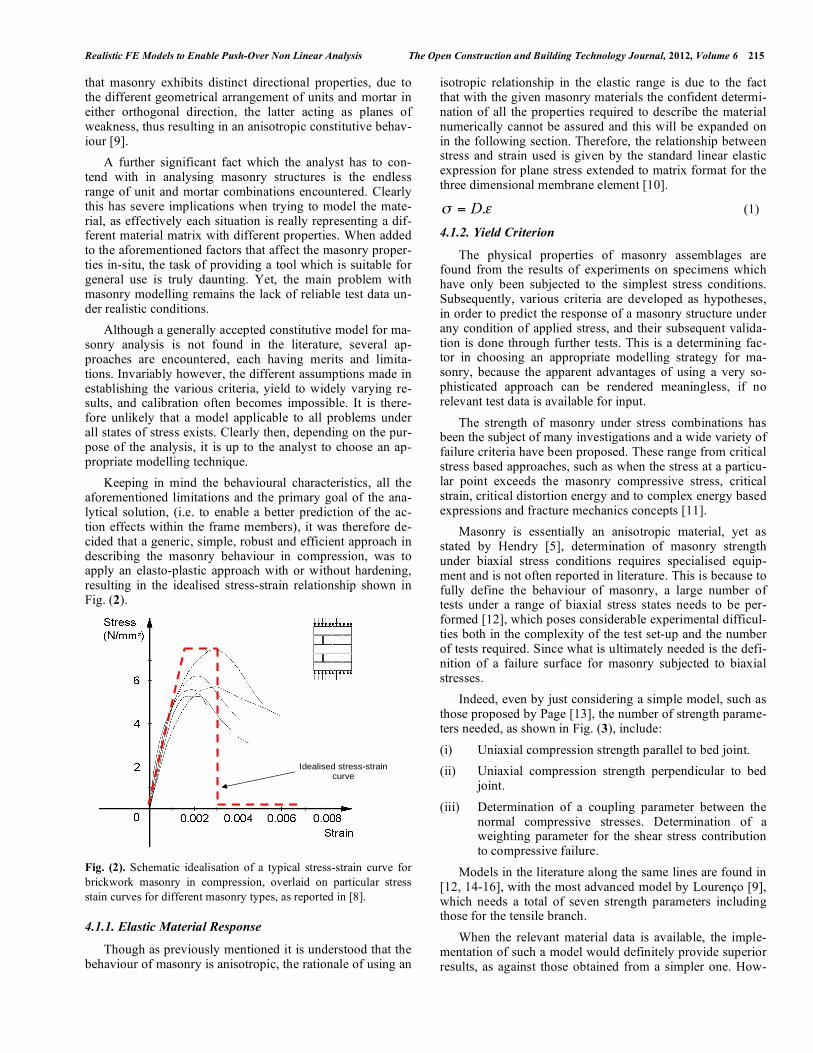
Indeed, even by just considering a simple model, such as those proposed by Page [13], the number of strength parame-ters needed, as shown in Fig. (3), include: (i) Uniaxial compression strength parallel to bed joint. (ii) Uniaxial compression strength perpendicular to bed
joint. (iii) Determination of a coupling parameter between the
normal compressive stresses. Determination of a weighting parameter for the shear stress contribution to compressive failure.
Models in the literature along the same lines are found in [12, 14-16], with the most advanced model by Lourenço [9], which needs a total of seven strength parameters including those for the tensile branch.
When the relevant material data is available, the imple-mentation of such a model would definitely provide superior results, as against those obtained from a simpler one. How-
Idealised stress-strain curve
216 The Open Construction and Building Technology Journal, 2012, Volume 6 Ellul and D’Ayala
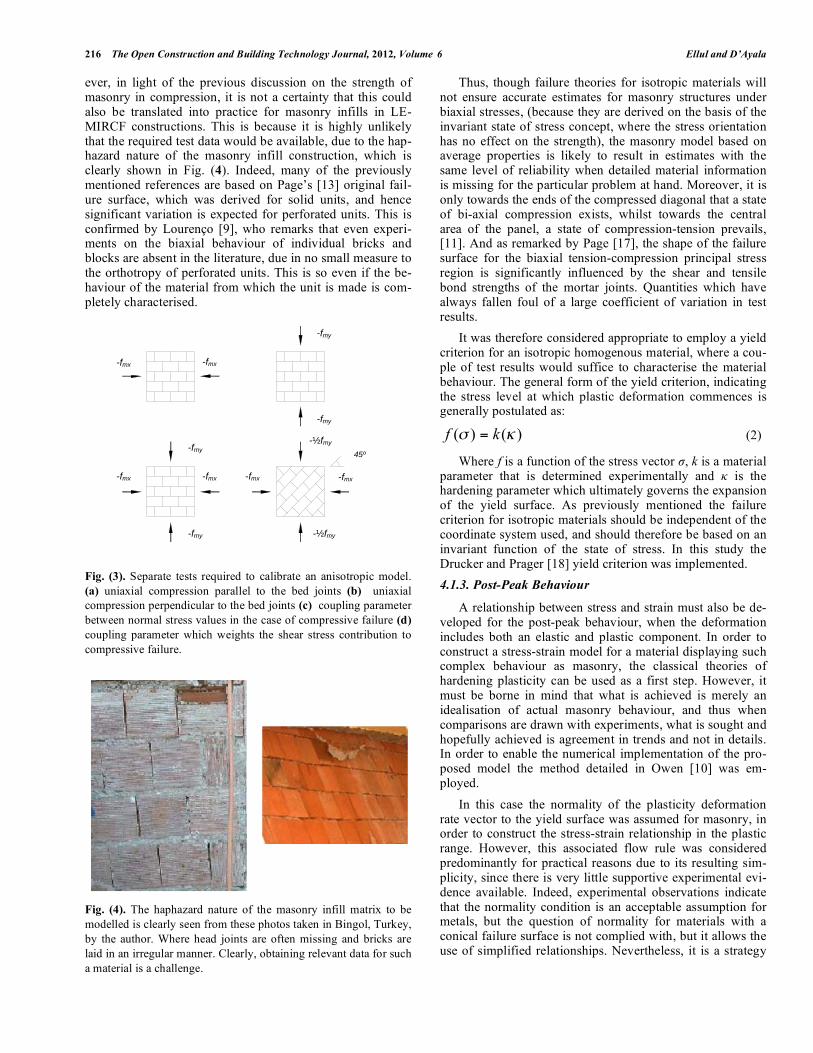
ever, in light of the previous discussion on the strength of masonry in compression, it is not a certainty that this could also be translated into practice for masonry infills in LE-MIRCF constructions. This is because it is highly unlikely that the required test data would be available, due to the hap-hazard nature of the masonry infill construction, which is clearly shown in Fig. (4). Indeed, many of the previously mentioned references are based on Page’s [13] original fail-ure surface, which was derived for solid units, and hence significant variation is expected for perforated units. This is confirmed by Lourenço [9], who remarks that even experi-ments on the biaxial behaviour of individual bricks and blocks are absent in the literature, due in no small measure to the orthotropy of perforated units. This is so even if the be-haviour of the material from which the unit is made is com-pletely characterised.
Fig. (3). Separate tests required to calibrate an anisotropic model. (a) uniaxial compression parallel to the bed joints (b) uniaxial compression perpendicular to the bed joints (c) coupling parameter between normal stress values in the case of compressive failure (d) coupling parameter which weights the shear stress contribution to compressive failure.
Fig. (4). The haphazard nature of the masonry infill matrix to be modelled is clearly seen from these photos taken in Bingol, Turkey, by the author. Where head joints are often missing and bricks are laid in an irregular manner. Clearly, obtaining relevant data for such a material is a challenge.
Thus, though failure theories for isotropic materials will not ensure accurate estimates for masonry structures under biaxial stresses, (because they are derived on the basis of the invariant state of stress concept, where the stress orientation has no effect on the strength), the masonry model based on average properties is likely to result in estimates with the same level of reliability when detailed material information is missing for the particular problem at hand. Moreover, it is only towards the ends of the compressed diagonal that a state of bi-axial compression exists, whilst towards the central area of the panel, a state of compression-tension prevails, [11]. And as remarked by Page [17], the shape of the failure surface for the biaxial tension-compression principal stress region is significantly influenced by the shear and tensile bond strengths of the mortar joints. Quantities which have always fallen foul of a large coefficient of variation in test results.
It was therefore considered appropriate to employ a yield criterion for an isotropic homogenous material, where a cou-ple of test results would suffice to characterise the material behaviour. The general form of the yield criterion, indicating the stress level at which plastic deformation commences is generally postulated as:
)()( !" kf = (2)
Where f is a function of the stress vector σ, k is a material parameter that is determined experimentally and κ is the hardening parameter which ultimately governs the expansion of the yield surface. As previously mentioned the failure criterion for isotropic materials should be independent of the coordinate system used, and should therefore be based on an invariant function of the state of stress. In this study the Drucker and Prager [18] yield criterion was implemented. 4.1.3. Post-Peak Behaviour
A relationship between stress and strain must also be de-veloped for the post-peak behaviour, when the deformation includes both an elastic and plastic component. In order to construct a stress-strain model for a material displaying such complex behaviour as masonry, the classical theories of hardening plasticity can be used as a first step. However, it must be borne in mind that what is achieved is merely an idealisation of actual masonry behaviour, and thus when comparisons are drawn with experiments, what is sought and hopefully achieved is agreement in trends and not in details. In order to enable the numerical implementation of the pro-posed model the method detailed in Owen [10] was em-ployed.
In this case the normality of the plasticity deformation rate vector to the yield surface was assumed for masonry, in order to construct the stress-strain relationship in the plastic range. However, this associated flow rule was considered predominantly for practical reasons due to its resulting sim-plicity, since there is very little supportive experimental evi-dence available. Indeed, experimental observations indicate that the normality condition is an acceptable assumption for metals, but the question of normality for materials with a conical failure surface is not complied with, but it allows the use of simplified relationships. Nevertheless, it is a strategy
-fmy
-fmy
-fmx -fmx
-fmx -fmx
-fmy
-fmy -½fmy
-fmx -fmx
-½fmy
45º
Realistic FE Models to Enable Push-Over Non Linear Analysis The Open Construction and Building Technology Journal, 2012, Volume 6 217
that is commonly assumed for modelling masonry in the non-linear range, as evidenced in various studies [15, 16]. 4.1.4. The Crushing Condition
When the effective stress, defined by the yield function, reaches the ultimate stress f’c, a perfectly plastic response is assumed until the crushing surface is encountered. Beyond a certain strain it is observed that masonry crumbles and the nonlinear constitutive relations are no longer applicable and the material suffers from compressive crushing. However, the exact nature of material response beyond failure is still only qualitatively understood and therefore a physical repre-sentation is frequently employed to allow for stress redistri-bution. In compression, the material loses its strength in all directions upon satisfaction of the given criterion.
The crushing type of masonry fracture is a strain con-trolled phenomenon. The lack of experimental data on ma-sonry ultimate-deformation capacity under multiaxial stress states has resulted in the appropriate strain criterion being developed by simply converting the yield criterion described in terms of stresses directly into strains, as was suggested by Owen and Figueiras [19] for concrete, where:
uIJ2
1'
2')3( !"# =+ (3)
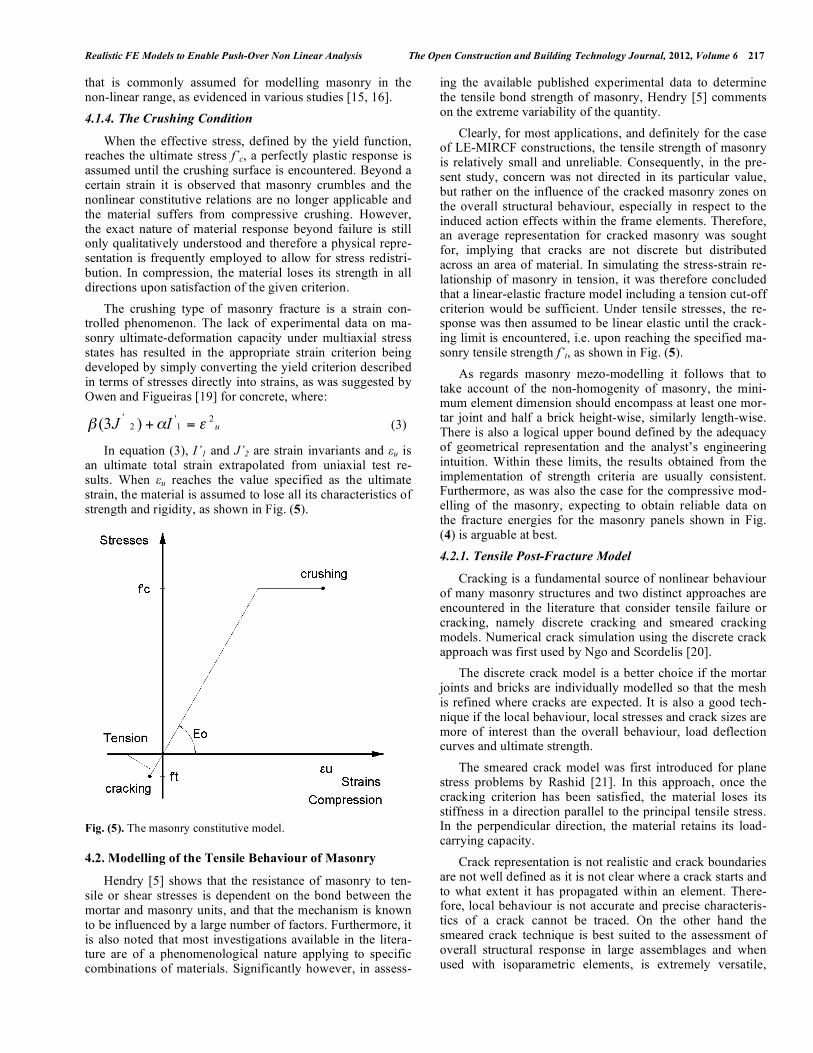
In equation (3), I’1 and J’2 are strain invariants and εu is an ultimate total strain extrapolated from uniaxial test re-sults. When εu reaches the value specified as the ultimate strain, the material is assumed to lose all its characteristics of strength and rigidity, as shown in Fig. (5).
Fig. (5). The masonry constitutive model.
4.2. Modelling of the Tensile Behaviour of Masonry
Hendry [5] shows that the resistance of masonry to ten-sile or shear stresses is dependent on the bond between the mortar and masonry units, and that the mechanism is known to be influenced by a large number of factors. Furthermore, it is also noted that most investigations available in the litera-ture are of a phenomenological nature applying to specific combinations of materials. Significantly however, in assess-
ing the available published experimental data to determine the tensile bond strength of masonry, Hendry [5] comments on the extreme variability of the quantity.
Clearly, for most applications, and definitely for the case of LE-MIRCF constructions, the tensile strength of masonry is relatively small and unreliable. Consequently, in the pre-sent study, concern was not directed in its particular value, but rather on the influence of the cracked masonry zones on the overall structural behaviour, especially in respect to the induced action effects within the frame elements. Therefore, an average representation for cracked masonry was sought for, implying that cracks are not discrete but distributed across an area of material. In simulating the stress-strain re-lationship of masonry in tension, it was therefore concluded that a linear-elastic fracture model including a tension cut-off criterion would be sufficient. Under tensile stresses, the re-sponse was then assumed to be linear elastic until the crack-ing limit is encountered, i.e. upon reaching the specified ma-sonry tensile strength f’t, as shown in Fig. (5).
As regards masonry mezo-modelling it follows that to take account of the non-homogenity of masonry, the mini-mum element dimension should encompass at least one mor-tar joint and half a brick height-wise, similarly length-wise. There is also a logical upper bound defined by the adequacy of geometrical representation and the analyst’s engineering intuition. Within these limits, the results obtained from the implementation of strength criteria are usually consistent. Furthermore, as was also the case for the compressive mod-elling of the masonry, expecting to obtain reliable data on the fracture energies for the masonry panels shown in Fig. (4) is arguable at best. 4.2.1. Tensile Post-Fracture Model
Cracking is a fundamental source of nonlinear behaviour of many masonry structures and two distinct approaches are encountered in the literature that consider tensile failure or cracking, namely discrete cracking and smeared cracking models. Numerical crack simulation using the discrete crack approach was first used by Ngo and Scordelis [20].
The discrete crack model is a better choice if the mortar joints and bricks are individually modelled so that the mesh is refined where cracks are expected. It is also a good tech-nique if the local behaviour, local stresses and crack sizes are more of interest than the overall behaviour, load deflection curves and ultimate strength.
The smeared crack model was first introduced for plane stress problems by Rashid [21]. In this approach, once the cracking criterion has been satisfied, the material loses its stiffness in a direction parallel to the principal tensile stress. In the perpendicular direction, the material retains its load-carrying capacity.
Crack representation is not realistic and crack boundaries are not well defined as it is not clear where a crack starts and to what extent it has propagated within an element. There-fore, local behaviour is not accurate and precise characteris-tics of a crack cannot be traced. On the other hand the smeared crack technique is best suited to the assessment of overall structural response in large assemblages and when used with isoparametric elements, is extremely versatile,

218 The Open Construction and Building Technology Journal, 2012, Volume 6 Ellul and D’Ayala
efficient and economical. It was therefore decided that the smeared cracking approach was the best option for this study and hence was implemented in the modelling technique.
The approach implemented followed Owen and Figuei-ras’ [19] work extended to the 3D case for the membrane element. In so far as the value of the cracked shear modulus, Gc, which represents the reduction in shear strength due to the opening of a crack, in the present work the cracked shear modulus was assumed to be a function of the current tensile strain. Therefore, for masonry cracked in the 1-direction,
)0035.0
1(*25.0 112
!"= GG
c ; 012 =c
G if ε1 ≥ 0.0035 (4)
1213cc
GG =
where G is the uncracked masonry shear modulus and ε1 is the tensile strain in the 1- direction.
For masonry cracked in both directions,
)0035.0
1(*25.0 113
!"= GG
c ; 013 =c
G if ε1 ≥ 0.0035
1312 *5.0cc
GG = (5)
If the crack closes, the uncracked shear modulus G is again assumed in the corresponding direction. Finally, as the cracked masonry is anisotropic a transformation matrix is used to perform the transformation of quantities from the material system of axes to the local reference system of axis.
In reality, both the application of load and the stress re-distribution within the masonry matrix is gradual, however this is not necessarily the case for the numerical solution. Therefore, in order to limit the possibility of numerical in-stabilities which tend to arise due to the sudden release of a high tensile stress due to crack initiation, a procedure for the gradual release of the tensile stress has been implemented, which is termed strain softening. There is a considerable controversy regarding the value of strain at which stress is zero, and regarding the shape of the descending branch. However, for simplicity, the gradual release of the stress component normal to the crack plane which has been adopted in this work is that as shown in Fig. (6), and is de-rived from the work by Owen and Figueiras [19].
Fig. (6). Tensile strain softening model implemented together with loading and unloading.
The process of loading and unloading of cracked ma-sonry is also shown in Fig. (6). Unloading and reloading of the cracked masonry is assumed to follow a linear behaviour, with a fictitious elasticity modulus Ei given by the relation detailed in Owen and Figueiras [19], as:
i
m
iti fE !
!
!" /1
'
##$
%&&'
()=
mit!!! "" (6)
where α, εm are the strain softening parameters and εi is the maximum value reached by the tensile strain at the point considered. If the strain component normal to the crack plane becomes negative, and therefore the crack closes, the masonry acquires the uncracked behaviour in the corre-sponding direction, but the crack direction and the maximum tensile strain continue to be stored.
The normal stress σ1 or stress σ2 are obtained by the fol-lowing expression:
!!"
#$$%
&'=
m
tf(
()* 1'
11
mt!!! ""
1 (7)
or by
i
i
!
!"" 1
1= if
i!! <
1 (8)
where εi is the current tensile strain in the material.
4.3. A Note on the Shear Strength of Masonry
As the unit and mortar geometries are not directly mod-elled, due to the fact that the number of masonry courses are not explicitly accounted for when using the mezo-modelling technique, failure is associated with tension and compression modes in a principal stress space, since the presence of the mortar joints is averaged within a finite element. Though this effectively means that shear failure within the mortar joint is not directly represented, it is indirectly taken into account.
Tomazevic [8] reports of the approach used, which de-fines the shear strength as the maximum value of principal tensile stress developed in a masonry wall of a specified ge-ometry. Wherein, the masonry wall is idealised as an elastic, homogenous and isotropic panel. Therefore, it is assumed that diagonal cracks at shear failure are caused by the princi-pal tensile stresses which develop in the wall when subjected to a combination of vertical and lateral load. By this assump-tion, formation of diagonally oriented cracks, passing through masonry units in the case of a brick masonry wall or passing through stones and mortar in a homogenous stone masonry wall without regular mortar joints can be easily explained. Clearly this approach fits the assumptions made in the solution technique implemented in this study for the masonry infills.
Tomazevic [8] reports that by correlating a large number of tests results, the ratio between the tensile and compressive strength of any type of masonry varies between,
0.03fk<ftk<0.09fk (9) Therefore, making it possible to assess the value of the
masonry tensile strength, if only the value of the compres-sive strength is available.
Realistic FE Models to Enable Push-Over Non Linear Analysis The Open Construction and Building Technology Journal, 2012, Volume 6 219
Finally it is to be noted that with the method employed shear failure on mortar beds occasionally noted in laboratory experiments running along the entire length of the masonry panel are reproduced indirectly when the principle tensile strength is exceeded at a very low angle to the horizontal as per the argument developed above. The overall behaviour of the panel is still captured in this way, with the recognition that the method averages out the presence of cracks since the one to one representation of any cracks is only considered feasible for simulations of specific tests and not for the analysis of an entire structure.
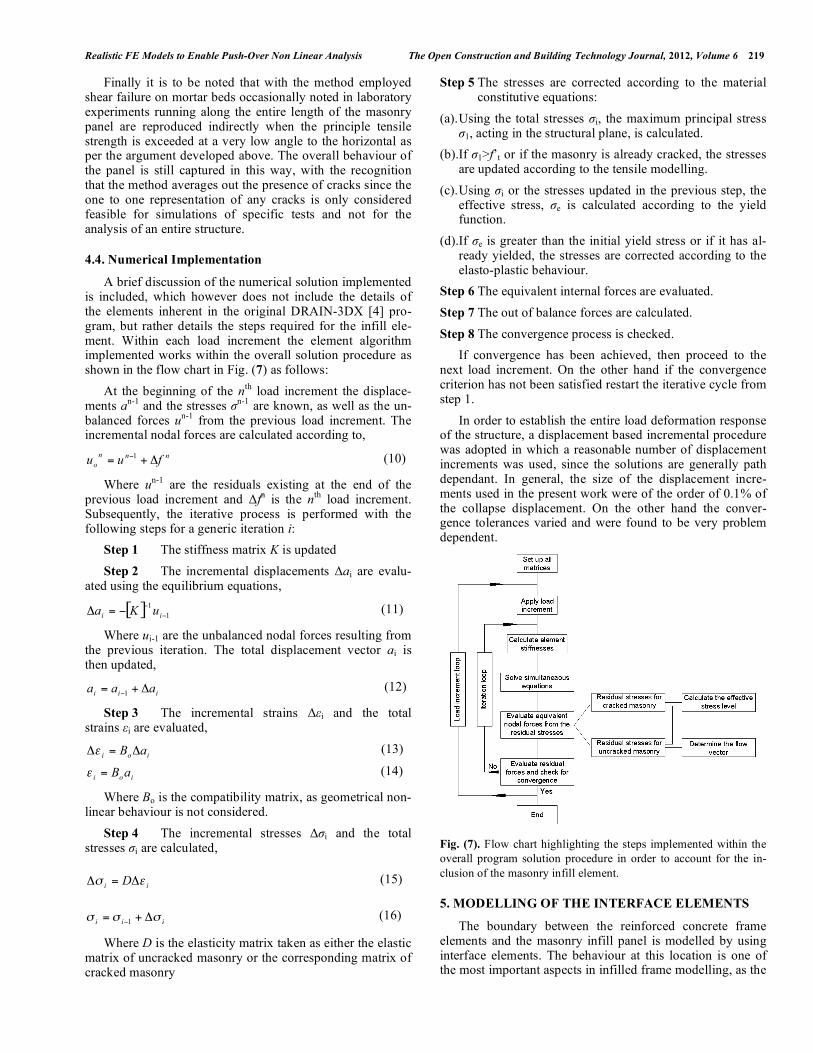
4.4. Numerical Implementation
A brief discussion of the numerical solution implemented is included, which however does not include the details of the elements inherent in the original DRAIN-3DX [4] pro-gram, but rather details the steps required for the infill ele-ment. Within each load increment the element algorithm implemented works within the overall solution procedure as shown in the flow chart in Fig. (7) as follows:
At the beginning of the nth load increment the displace-ments an-1 and the stresses σn-1 are known, as well as the un-balanced forces un-1 from the previous load increment. The incremental nodal forces are calculated according to,
nnn
o fuu !+="1 (10)
Where un-1 are the residuals existing at the end of the previous load increment and Δfn is the nth load increment. Subsequently, the iterative process is performed with the following steps for a generic iteration i:
Step 1 The stiffness matrix K is updated Step 2 The incremental displacements Δai are evalu-
ated using the equilibrium equations,
[ ]1
1
!
!!="
iiuKa (11)
Where ui-1 are the unbalanced nodal forces resulting from the previous iteration. The total displacement vector ai is then updated,
iiiaaa !+= "1
(12)
Step 3 The incremental strains Δεi and the total strains εi are evaluated,
ioiaB !=!" (13)
ioiaB=! (14)
Where Bo is the compatibility matrix, as geometrical non-linear behaviour is not considered.
Step 4 The incremental stresses Δσi and the total stresses σi are calculated,
iiD !" #=# (15)
iii!!! "+= #1
(16)
Where D is the elasticity matrix taken as either the elastic matrix of uncracked masonry or the corresponding matrix of cracked masonry
Step 5 The stresses are corrected according to the material constitutive equations:
(a). Using the total stresses σi, the maximum principal stress σ1, acting in the structural plane, is calculated.
(b).If σ1>f’t or if the masonry is already cracked, the stresses are updated according to the tensile modelling.
(c). Using σi or the stresses updated in the previous step, the effective stress, σe is calculated according to the yield function.
(d).If σe is greater than the initial yield stress or if it has al-ready yielded, the stresses are corrected according to the elasto-plastic behaviour.
Step 6 The equivalent internal forces are evaluated. Step 7 The out of balance forces are calculated. Step 8 The convergence process is checked.
If convergence has been achieved, then proceed to the next load increment. On the other hand if the convergence criterion has not been satisfied restart the iterative cycle from step 1.
In order to establish the entire load deformation response of the structure, a displacement based incremental procedure was adopted in which a reasonable number of displacement increments was used, since the solutions are generally path dependant. In general, the size of the displacement incre-ments used in the present work were of the order of 0.1% of the collapse displacement. On the other hand the conver-gence tolerances varied and were found to be very problem dependent.
Fig. (7). Flow chart highlighting the steps implemented within the overall program solution procedure in order to account for the in-clusion of the masonry infill element.
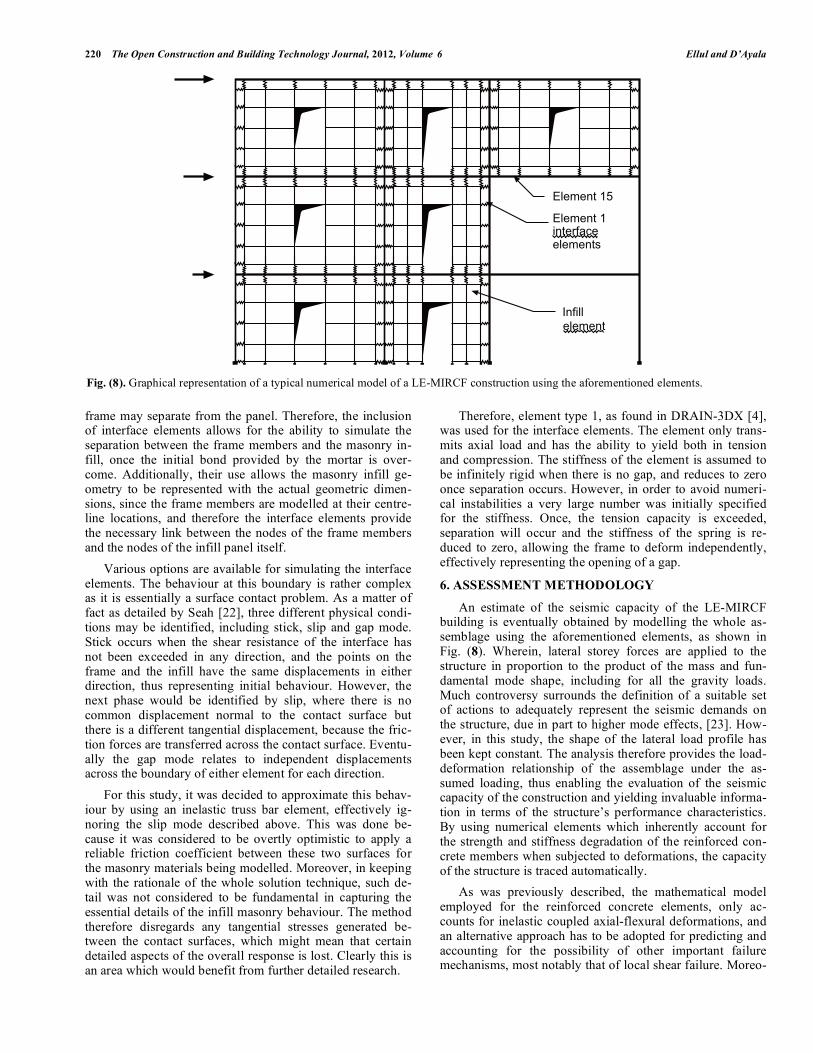
5. MODELLING OF THE INTERFACE ELEMENTS
The boundary between the reinforced concrete frame elements and the masonry infill panel is modelled by using interface elements. The behaviour at this location is one of the most important aspects in infilled frame modelling, as the
220 The Open Construction and Building Technology Journal, 2012, Volume 6 Ellul and D’Ayala
frame may separate from the panel. Therefore, the inclusion of interface elements allows for the ability to simulate the separation between the frame members and the masonry in-fill, once the initial bond provided by the mortar is over-come. Additionally, their use allows the masonry infill ge-ometry to be represented with the actual geometric dimen-sions, since the frame members are modelled at their centre-line locations, and therefore the interface elements provide the necessary link between the nodes of the frame members and the nodes of the infill panel itself.
Various options are available for simulating the interface elements. The behaviour at this boundary is rather complex as it is essentially a surface contact problem. As a matter of fact as detailed by Seah [22], three different physical condi-tions may be identified, including stick, slip and gap mode. Stick occurs when the shear resistance of the interface has not been exceeded in any direction, and the points on the frame and the infill have the same displacements in either direction, thus representing initial behaviour. However, the next phase would be identified by slip, where there is no common displacement normal to the contact surface but there is a different tangential displacement, because the fric-tion forces are transferred across the contact surface. Eventu-ally the gap mode relates to independent displacements across the boundary of either element for each direction.
For this study, it was decided to approximate this behav-iour by using an inelastic truss bar element, effectively ig-noring the slip mode described above. This was done be-cause it was considered to be overtly optimistic to apply a reliable friction coefficient between these two surfaces for the masonry materials being modelled. Moreover, in keeping with the rationale of the whole solution technique, such de-tail was not considered to be fundamental in capturing the essential details of the infill masonry behaviour. The method therefore disregards any tangential stresses generated be-tween the contact surfaces, which might mean that certain detailed aspects of the overall response is lost. Clearly this is an area which would benefit from further detailed research.
Therefore, element type 1, as found in DRAIN-3DX [4], was used for the interface elements. The element only trans-mits axial load and has the ability to yield both in tension and compression. The stiffness of the element is assumed to be infinitely rigid when there is no gap, and reduces to zero once separation occurs. However, in order to avoid numeri-cal instabilities a very large number was initially specified for the stiffness. Once, the tension capacity is exceeded, separation will occur and the stiffness of the spring is re-duced to zero, allowing the frame to deform independently, effectively representing the opening of a gap.
6. ASSESSMENT METHODOLOGY
An estimate of the seismic capacity of the LE-MIRCF building is eventually obtained by modelling the whole as-semblage using the aforementioned elements, as shown in Fig. (8). Wherein, lateral storey forces are applied to the structure in proportion to the product of the mass and fun-damental mode shape, including for all the gravity loads. Much controversy surrounds the definition of a suitable set of actions to adequately represent the seismic demands on the structure, due in part to higher mode effects, [23]. How-ever, in this study, the shape of the lateral load profile has been kept constant. The analysis therefore provides the load-deformation relationship of the assemblage under the as-sumed loading, thus enabling the evaluation of the seismic capacity of the construction and yielding invaluable informa-tion in terms of the structure’s performance characteristics. By using numerical elements which inherently account for the strength and stiffness degradation of the reinforced con-crete members when subjected to deformations, the capacity of the structure is traced automatically.
As was previously described, the mathematical model employed for the reinforced concrete elements, only ac-counts for inelastic coupled axial-flexural deformations, and an alternative approach has to be adopted for predicting and accounting for the possibility of other important failure mechanisms, most notably that of local shear failure. Moreo-
Fig. (8). Graphical representation of a typical numerical model of a LE-MIRCF construction using the aforementioned elements.
��������
��������
������������ ����
�������������
Realistic FE Models to Enable Push-Over Non Linear Analysis The Open Construction and Building Technology Journal, 2012, Volume 6 221
ver, limits also need to be set on the flexural deformation capacity of the members, as a solution might still be obtained even if the concrete in a member has effectively crushed. Clearly therefore, in order to enable a meaningful evaluation of the seismic capacity of a structure, account has to be taken of all possible significant failure modes.
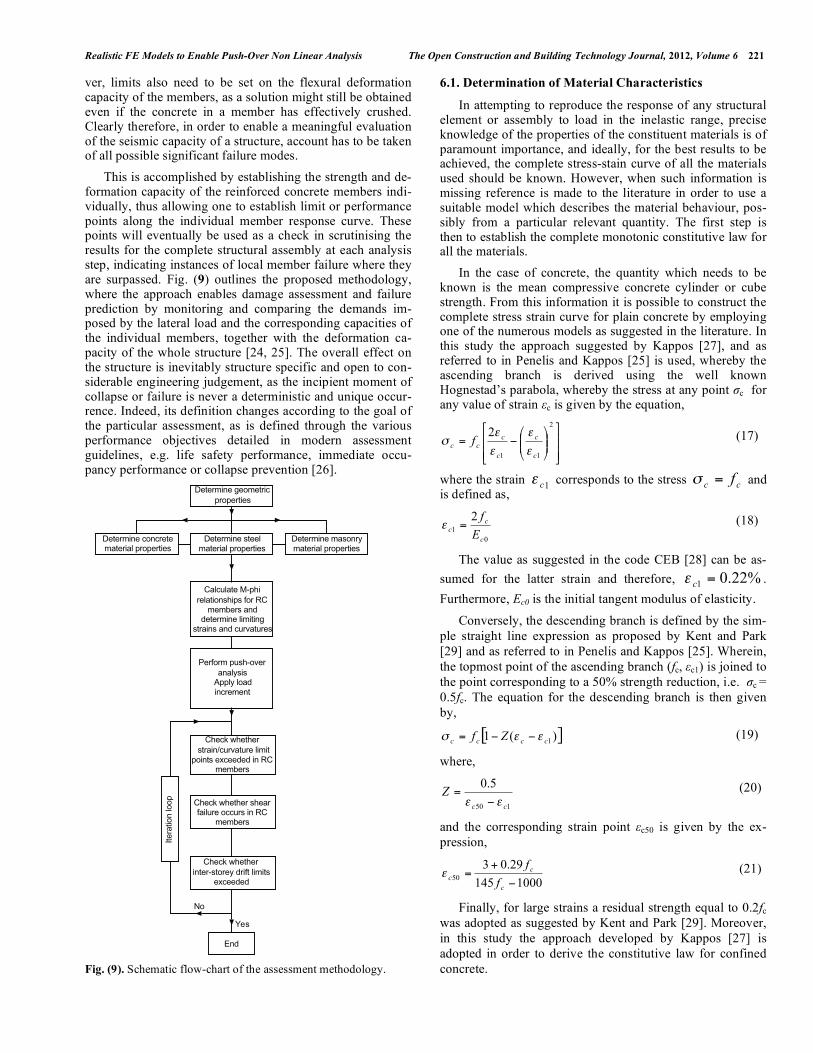
This is accomplished by establishing the strength and de-formation capacity of the reinforced concrete members indi-vidually, thus allowing one to establish limit or performance points along the individual member response curve. These points will eventually be used as a check in scrutinising the results for the complete structural assembly at each analysis step, indicating instances of local member failure where they are surpassed. Fig. (9) outlines the proposed methodology, where the approach enables damage assessment and failure prediction by monitoring and comparing the demands im-posed by the lateral load and the corresponding capacities of the individual members, together with the deformation ca-pacity of the whole structure [24, 25]. The overall effect on the structure is inevitably structure specific and open to con-siderable engineering judgement, as the incipient moment of collapse or failure is never a deterministic and unique occur-rence. Indeed, its definition changes according to the goal of the particular assessment, as is defined through the various performance objectives detailed in modern assessment guidelines, e.g. life safety performance, immediate occu-pancy performance or collapse prevention [26].
Fig. (9). Schematic flow-chart of the assessment methodology.
6.1. Determination of Material Characteristics
In attempting to reproduce the response of any structural element or assembly to load in the inelastic range, precise knowledge of the properties of the constituent materials is of paramount importance, and ideally, for the best results to be achieved, the complete stress-stain curve of all the materials used should be known. However, when such information is missing reference is made to the literature in order to use a suitable model which describes the material behaviour, pos-sibly from a particular relevant quantity. The first step is then to establish the complete monotonic constitutive law for all the materials.
In the case of concrete, the quantity which needs to be known is the mean compressive concrete cylinder or cube strength. From this information it is possible to construct the complete stress strain curve for plain concrete by employing one of the numerous models as suggested in the literature. In this study the approach suggested by Kappos [27], and as referred to in Penelis and Kappos [25] is used, whereby the ascending branch is derived using the well known Hognestad’s parabola, whereby the stress at any point σc for any value of strain εc is given by the equation,
!!
"
#
$$
%
&
''(
)**+
,-=
2
11
2
c
c
c
ccc f
.
.
.
./ (17)
where the strain 1c
! corresponds to the stress cc f=! and is defined as,
0
1
2
c
cc
E
f=! (18)
The value as suggested in the code CEB [28] can be as-sumed for the latter strain and therefore, %22.0
1=
c! .
Furthermore, Ec0 is the initial tangent modulus of elasticity.
Conversely, the descending branch is defined by the sim-ple straight line expression as proposed by Kent and Park [29] and as referred to in Penelis and Kappos [25]. Wherein, the topmost point of the ascending branch (fc, εc1) is joined to the point corresponding to a 50% strength reduction, i.e. σc = 0.5fc. The equation for the descending branch is then given by,
[ ])(1 1cccc Zf !!" ##= (19)
where,
150
5.0
cc
Z!! "
= (20)
and the corresponding strain point εc50 is given by the ex-pression,
1000145
29.03
50
!
+=
c
cc
f
f" (21)
Finally, for large strains a residual strength equal to 0.2fc was adopted as suggested by Kent and Park [29]. Moreover, in this study the approach developed by Kappos [27] is adopted in order to derive the constitutive law for confined concrete.
����������������� �� ������
������������������������� �� ������
���������������������� �� ������ �������� �� ������
����������������
����������� ������������� ������
��������������������������
��������������������
������� ����������������
� ���������������
������������������ ��������������
������!�����������������
����������������������������������
�������
�����������������������������������
�!������
"�
#��
$��
%����
����
���
222 The Open Construction and Building Technology Journal, 2012, Volume 6 Ellul and D’Ayala
6.2. Coupled Axial Flexural Deformation Capacity
Though implicitly accounting for the coupled axial-flexural response, the capacity and corresponding deforma-tion characteristics of the reinforced concrete members are also determined by means of a different fibre model analysis. This is done in order to determine the complete monotonic moment-curvature relationship of the member and hence determine the ultimate curvature of the section. Such a pro-cedure is only necessary because the numerical environment used in the study, outputs frame element results only in terms of curvature rather than strain. The methodology and computer application used for this purpose was RC-COLA [30].
6.3. Determination of Shear Capacity
The ideal flexural strength is only meaningful if it is sup-ported by all other possible behaviour mechanisms not al-ready accounted for. In this case these include the shear strength of the member, bond mechanisms and the strength of the lap splice. The determination of the latter two quanti-ties is always bound to involve numerous uncertainties for an existing LE-MIRCF construction, and reliable results cannot be assured. However, the calculation of the shear strength is a crucial step in the assessment of such a structure.
The methodology used in this study uses a shear strength criterion for evaluating the possibility of shear failure, which is assumed to occur whenever the shear force at any instance, as calculated from the pushover analysis, exceeds the esti-mated shear resistance envelope of the member established according to appropriate design codes. This approach has been taken by many researcher’s previously [24, 31, 32], and is understood to usually be a conservative approach, which nevertheless has the great advantage of simplicity.
Even in this case however the problem is not a trivial one, indeed as stated by Nilson and Winter [33], in spite of many decades of experimental research and the use of ad-vanced analytical tools, shear failure in reinforced concrete members is difficult to predict accurately and not yet fully understood. Therefore, though it is not in the scope of this study to provide an exhaustive understanding of the complex mechanisms involved in the shear strength of concrete, it is inevitable that a few salient points are expanded on. Espe-cially in light of the importance of closely predicting the shear capacity of the reinforced concrete members as part of the assessment process for LE-MIRCF constructions.
The more common and dangerous form of column fail-ures occurring in LE-MIRCF constructions involve the formation of X-type cracking associated with shear failure. Fundamentally such cracking occurs in the concrete when the principle tensile strength is overcome in a particular loca-tion. Therefore, following the argument put forward for beams by Nilson and Winter [33], the main concern in re-gions of high shear forces for any member, becomes that of diagonal tension failure. This results from the combination of shear stress and longitudinal flexural stress which com-bine to give rise to diagonal tension stresses of significant intensity. Members where sufficient transverse reinforce-ment is not provided to counteract the formation of large diagonal tension cracks, are then prone to fail suddenly and catastrophically. This failure mechanism is generally ex-
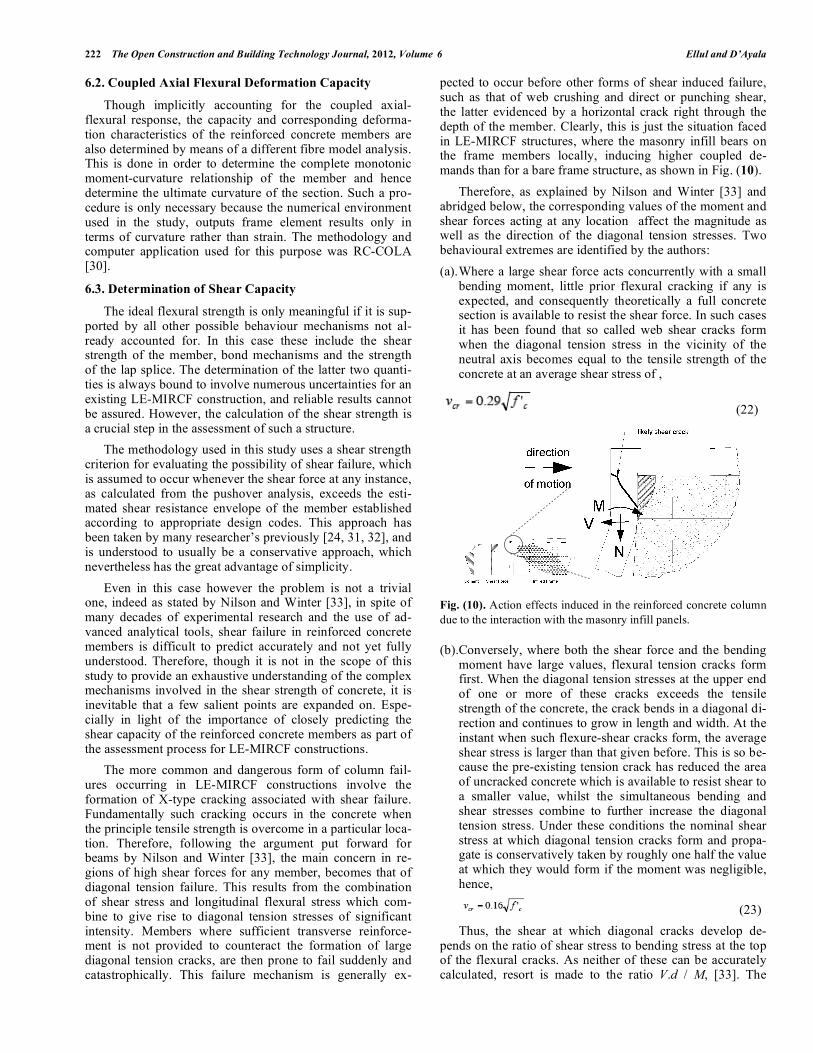
pected to occur before other forms of shear induced failure, such as that of web crushing and direct or punching shear, the latter evidenced by a horizontal crack right through the depth of the member. Clearly, this is just the situation faced in LE-MIRCF structures, where the masonry infill bears on the frame members locally, inducing higher coupled de-mands than for a bare frame structure, as shown in Fig. (10).
Therefore, as explained by Nilson and Winter [33] and abridged below, the corresponding values of the moment and shear forces acting at any location affect the magnitude as well as the direction of the diagonal tension stresses. Two behavioural extremes are identified by the authors: (a). Where a large shear force acts concurrently with a small
bending moment, little prior flexural cracking if any is expected, and consequently theoretically a full concrete section is available to resist the shear force. In such cases it has been found that so called web shear cracks form when the diagonal tension stress in the vicinity of the neutral axis becomes equal to the tensile strength of the concrete at an average shear stress of ,
(22)
Fig. (10). Action effects induced in the reinforced concrete column due to the interaction with the masonry infill panels.
(b).Conversely, where both the shear force and the bending moment have large values, flexural tension cracks form first. When the diagonal tension stresses at the upper end of one or more of these cracks exceeds the tensile strength of the concrete, the crack bends in a diagonal di-rection and continues to grow in length and width. At the instant when such flexure-shear cracks form, the average shear stress is larger than that given before. This is so be-cause the pre-existing tension crack has reduced the area of uncracked concrete which is available to resist shear to a smaller value, whilst the simultaneous bending and shear stresses combine to further increase the diagonal tension stress. Under these conditions the nominal shear stress at which diagonal tension cracks form and propa-gate is conservatively taken by roughly one half the value at which they would form if the moment was negligible, hence,
(23) Thus, the shear at which diagonal cracks develop de-
pends on the ratio of shear stress to bending stress at the top of the flexural cracks. As neither of these can be accurately calculated, resort is made to the ratio V.d / M, [33]. The
Realistic FE Models to Enable Push-Over Non Linear Analysis The Open Construction and Building Technology Journal, 2012, Volume 6 223
nominal shear stress at which diagonal flexure-shear crack-ing develops is then conservatively predicted from the fol-lowing expression,
Error! Objects cannot be created from editing field codes.
(24) Nonetheless, columns are inevitably subjected to signifi-
cant axial loads acting simultaneously with shear and flex-ure. Therefore, the diagonal tension cracking stress is altered by the longitudinal force as it changes the characteristics of the principal tensile stresses, [33]. As a matter of fact axial compression increases the cracking load whilst axial tension decreases it. In this case therefore recourse is made to the method proposed in ACI 318-83 [34], whereby the effect of axial compression is made by using the modified moment M as follows,
(25) The upper limit for the diagonal tension cracking stress is
then,
(26) In the case where members carry significant axial tension
as well as bending and shear, the contribution of the concrete can be taken as,
(27) In conclusion, the shear resistance of a member should
ideally be predicted whilst accounting for the interactive relationship which exists between action effects namely, axial force and moment, as shown in Fig. (10), yet also re-flecting the amount of flexural inelasticity in the member. Traditionally, whenever the truss model is employed to esti-mate the shear strength under earthquake loading, a simple way of accounting for the latter has been to adopt the CEN EC 8 [35] suggestion, whereby the concrete mechanism term, Vcd is neglected in plastic hinge regions [25]. However, as the authors state, this is appropriate for beams with sig-nificant inelasticity, such as for a member with a rotation ductility greater than four. But it is considered conservative for columns with significant axial loading, for which Vcd = 0.33 might be assumed, as suggested by Priestley and Seible [36]. Unfortunately, though convenient, such an approach requires the calculation of the ductility at each stage of the non-linear analysis, in itself a quantity not without some de-gree of controversy [37]. To date, no approach fulfils all these requirements in available published literature, however the calculated shear capacity as predicted from equations (22) to (27) is expected to be conservative.
Nevertheless, the method enables more realistic predic-tions than if only the shear force value from the analysis was compared to the shear capacity of the section without con-sidering the value of the moment action effect on the section. Finally, it is important to mention that the other two types of
shear failure also have to be checked for including diagonal compression failure or web crushing and sliding shear fail-ure. The latter two cases are not expected to be the critical cases for the columns in masonry infilled frames however, and in this study the equations as proposed in CEN EC 8 [35] were used for their calculation. Moreover it is also es-sential to mention that in the above methodology no allow-ance was made for accounting for cyclic shear which results in the degradation of the resistance of the member signifi-cantly. This could be done with the introduction of a corre-sponding factor having a value less than 1, which would be applied to the shear resistance obtained with the aforemen-tioned technique. However, this was not pursued further dur-ing the study due to the lack of experimental data available in the literature on the subject.
7. MODELLING VALIDATION
In order to validate and assess the performance of the modelling methodology described, simulations of experi-mental tests encountered in published literature were carried out. Suitable testing programmes that lend themselves well for this purpose are very few, especially because what is ultimately required is specific data pertaining to the action effects in the reinforced concrete members, (actual values of member forces), as these would provide definitive bench-mark points. However, such detail is rarely available, proba-bly due to the difficulty encountered in physically gathering such information.
Nevertheless, in the absence of such information, a de-tailed description of explicit member damage also provides invaluable knowledge, which enables specific judgements to be drawn on the validity of the proposed methodology. It is important to note however, that the exact reproduction of experimental results is not expected nor is it deemed possible with the approach adopted. What is sought rather is the accu-rate prediction of local damage, such as shear failures occur-ring as a direct result of the frame infill interaction. The ex-periments were chosen in order to encompass a variety of scenarios, including varying number of bays, storeys, infill materials and openings.
The simulation of the experimental programme described in Al-Chaar et al. [38] and Colangelo [39] were chosen as benchmark verification examples undertaken, the results of which can be found in Ellul [2]. Moreover, comparisons were also drawn against simulation results obtained using inclined strut models in order to highlight the differences between the two. From this benchmarking exercise the re-sults as obtained against the Buonopane and White [40] ex-periments is summarised below.
7.1. The Buonopane et al. Experiment
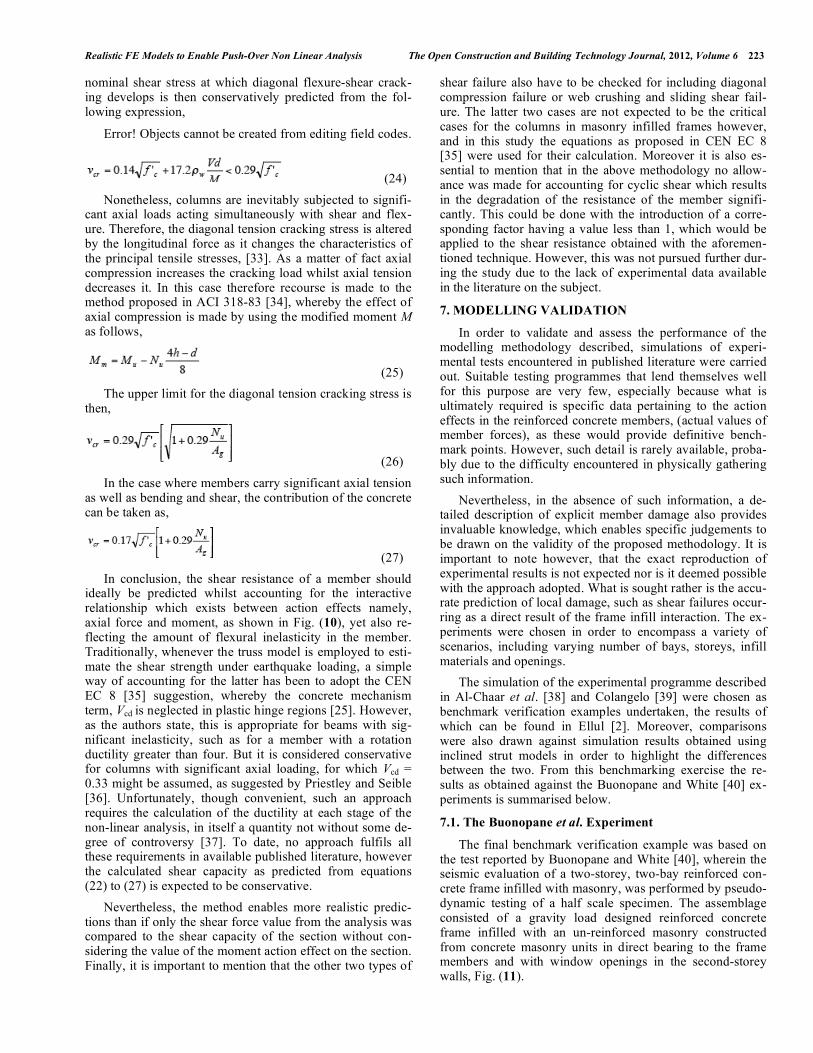
The final benchmark verification example was based on the test reported by Buonopane and White [40], wherein the seismic evaluation of a two-storey, two-bay reinforced con-crete frame infilled with masonry, was performed by pseudo-dynamic testing of a half scale specimen. The assemblage consisted of a gravity load designed reinforced concrete frame infilled with an un-reinforced masonry constructed from concrete masonry units in direct bearing to the frame members and with window openings in the second-storey walls, Fig. (11).
224 The Open Construction and Building Technology Journal, 2012, Volume 6 Ellul and D’Ayala
Four separate pseudo-dynamic tests, each with increasing intensity, were conducted on the same assemblage. The ground motion applied throughout the series was the Taft-Lincoln School S69E record of the event that occurred at Kern County, California, on July 20, 1952, and the initial test was for the case where the peak ground acceleration was scaled to 0.10g. Similarly, the subsequent tests were con-ducted using the same record, but with the peak ground ac-celeration scaled to 0.35g, 0.55g and 0.80g respectively.
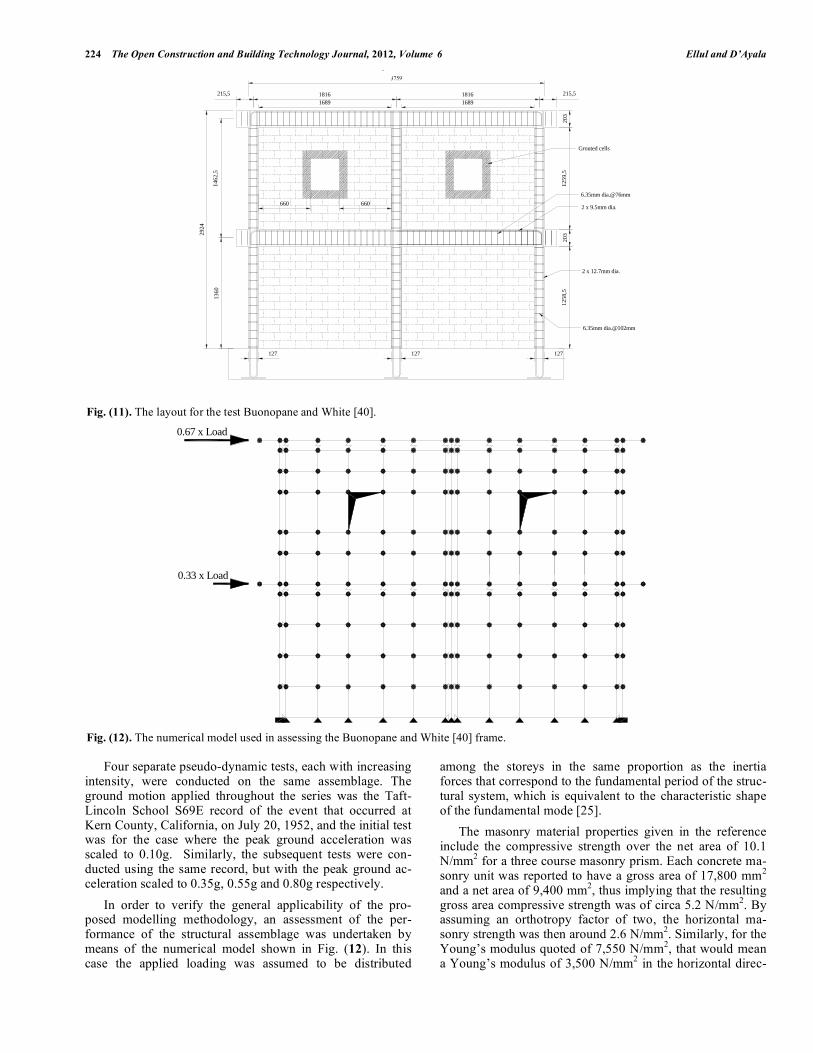
In order to verify the general applicability of the pro-posed modelling methodology, an assessment of the per-formance of the structural assemblage was undertaken by means of the numerical model shown in Fig. (12). In this case the applied loading was assumed to be distributed
among the storeys in the same proportion as the inertia forces that correspond to the fundamental period of the struc-tural system, which is equivalent to the characteristic shape of the fundamental mode [25].
The masonry material properties given in the reference include the compressive strength over the net area of 10.1 N/mm2 for a three course masonry prism. Each concrete ma-sonry unit was reported to have a gross area of 17,800 mm2 and a net area of 9,400 mm2, thus implying that the resulting gross area compressive strength was of circa 5.2 N/mm2. By assuming an orthotropy factor of two, the horizontal ma-sonry strength was then around 2.6 N/mm2. Similarly, for the Young’s modulus quoted of 7,550 N/mm2, that would mean a Young’s modulus of 3,500 N/mm2 in the horizontal direc-
Fig. (11). The layout for the test Buonopane and White [40].
Fig. (12). The numerical model used in assessing the Buonopane and White [40] frame.
20329
24
1360
127
6.35mm dia.@102mm
127127
1258
,5
2 x 12.7mm dia.
660
16891816
1462
,5
660
215,5
Grouted cells
6.35mm dia.@76mm
2 x 9.5mm dia.
215,5
16891816
1259
,520
3
0.33 x Load
0.67 x Load
Realistic FE Models to Enable Push-Over Non Linear Analysis The Open Construction and Building Technology Journal, 2012, Volume 6 225
tion. Moreover, the concrete strength was reported as 30.6 N/mm2, whilst the steel nominal yield stress was of 275 N/mm2.
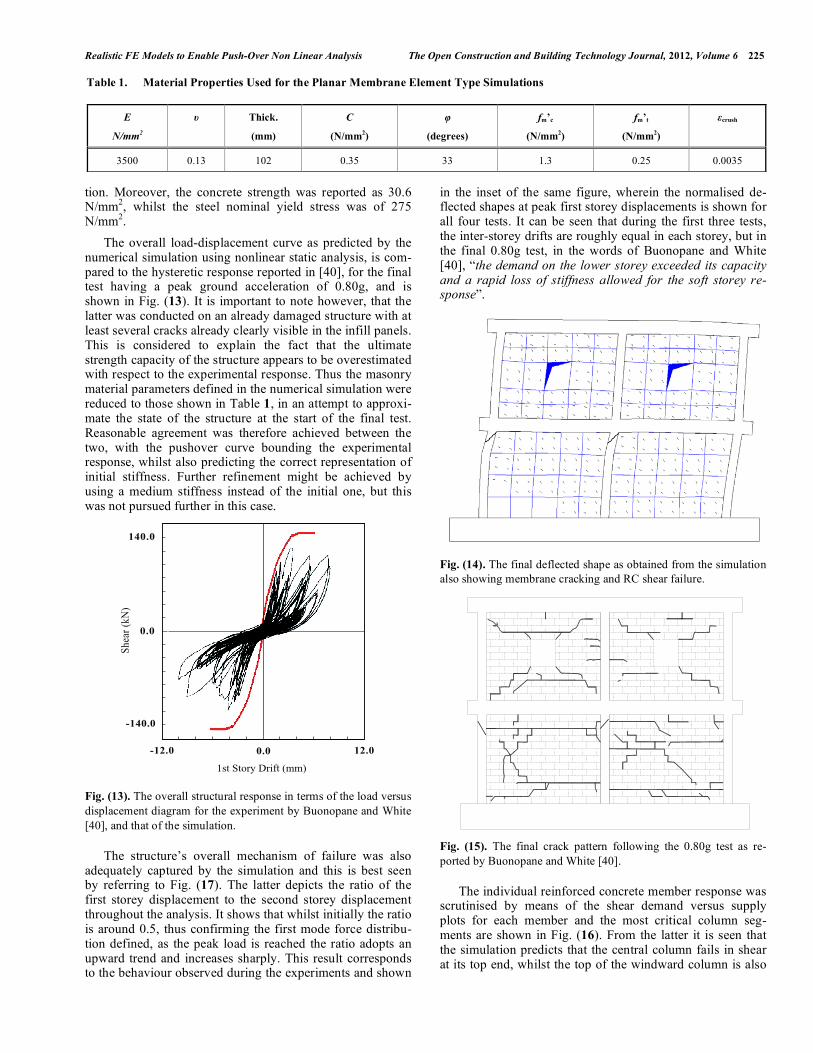
The overall load-displacement curve as predicted by the numerical simulation using nonlinear static analysis, is com-pared to the hysteretic response reported in [40], for the final test having a peak ground acceleration of 0.80g, and is shown in Fig. (13). It is important to note however, that the latter was conducted on an already damaged structure with at least several cracks already clearly visible in the infill panels. This is considered to explain the fact that the ultimate strength capacity of the structure appears to be overestimated with respect to the experimental response. Thus the masonry material parameters defined in the numerical simulation were reduced to those shown in Table 1, in an attempt to approxi-mate the state of the structure at the start of the final test. Reasonable agreement was therefore achieved between the two, with the pushover curve bounding the experimental response, whilst also predicting the correct representation of initial stiffness. Further refinement might be achieved by using a medium stiffness instead of the initial one, but this was not pursued further in this case.
Fig. (13). The overall structural response in terms of the load versus displacement diagram for the experiment by Buonopane and White [40], and that of the simulation.
The structure’s overall mechanism of failure was also adequately captured by the simulation and this is best seen by referring to Fig. (17). The latter depicts the ratio of the first storey displacement to the second storey displacement throughout the analysis. It shows that whilst initially the ratio is around 0.5, thus confirming the first mode force distribu-tion defined, as the peak load is reached the ratio adopts an upward trend and increases sharply. This result corresponds to the behaviour observed during the experiments and shown
in the inset of the same figure, wherein the normalised de-flected shapes at peak first storey displacements is shown for all four tests. It can be seen that during the first three tests, the inter-storey drifts are roughly equal in each storey, but in the final 0.80g test, in the words of Buonopane and White [40], “the demand on the lower storey exceeded its capacity and a rapid loss of stiffness allowed for the soft storey re-sponse”.
Fig. (14). The final deflected shape as obtained from the simulation also showing membrane cracking and RC shear failure.
Fig. (15). The final crack pattern following the 0.80g test as re-ported by Buonopane and White [40].
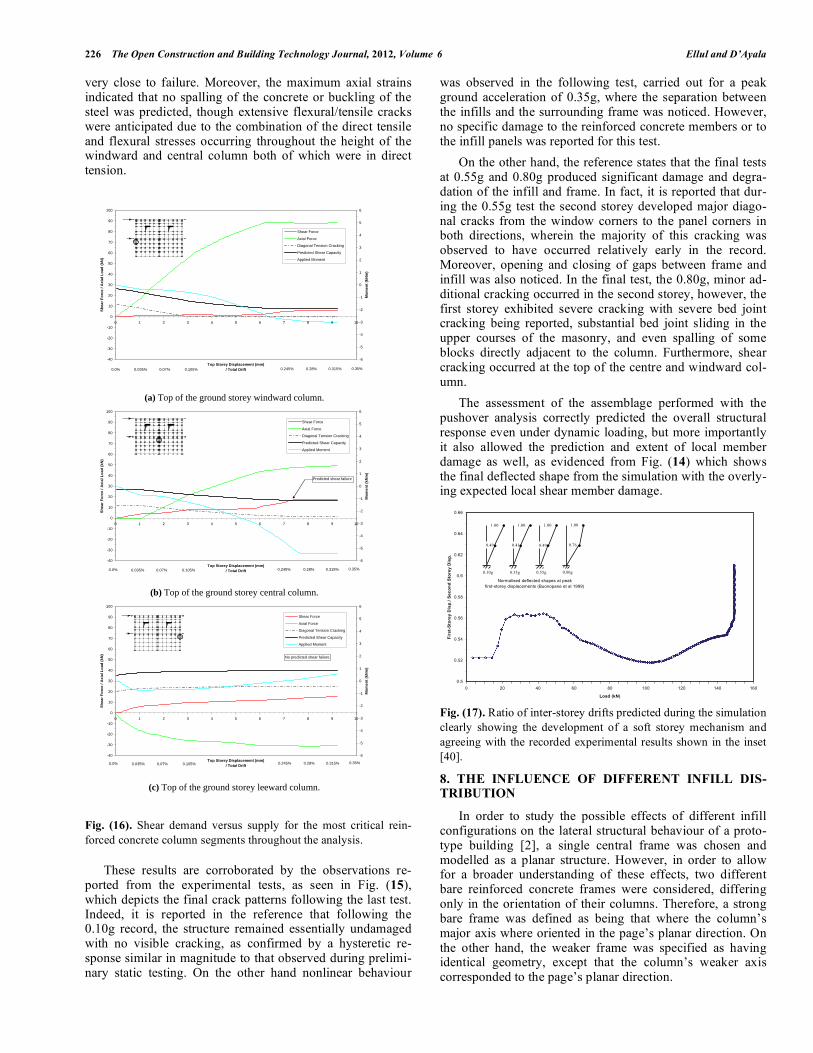
The individual reinforced concrete member response was scrutinised by means of the shear demand versus supply plots for each member and the most critical column seg-ments are shown in Fig. (16). From the latter it is seen that the simulation predicts that the central column fails in shear at its top end, whilst the top of the windward column is also
Table 1. Material Properties Used for the Planar Membrane Element Type Simulations
E
N/mm2
υ Thick.
(mm)
C
(N/mm2)
φ
(degrees)
fm’c
(N/mm2)
fm’t
(N/mm2)
εcrush
3500 0.13 102 0.35 33 1.3 0.25 0.0035
�����
���
������
����� ��� ����
�������������� ���
����
�� ��
�
226 The Open Construction and Building Technology Journal, 2012, Volume 6 Ellul and D’Ayala
very close to failure. Moreover, the maximum axial strains indicated that no spalling of the concrete or buckling of the steel was predicted, though extensive flexural/tensile cracks were anticipated due to the combination of the direct tensile and flexural stresses occurring throughout the height of the windward and central column both of which were in direct tension.
Fig. (16). Shear demand versus supply for the most critical rein-forced concrete column segments throughout the analysis.
These results are corroborated by the observations re-ported from the experimental tests, as seen in Fig. (15), which depicts the final crack patterns following the last test. Indeed, it is reported in the reference that following the 0.10g record, the structure remained essentially undamaged with no visible cracking, as confirmed by a hysteretic re-sponse similar in magnitude to that observed during prelimi-nary static testing. On the other hand nonlinear behaviour
was observed in the following test, carried out for a peak ground acceleration of 0.35g, where the separation between the infills and the surrounding frame was noticed. However, no specific damage to the reinforced concrete members or to the infill panels was reported for this test.
On the other hand, the reference states that the final tests at 0.55g and 0.80g produced significant damage and degra-dation of the infill and frame. In fact, it is reported that dur-ing the 0.55g test the second storey developed major diago-nal cracks from the window corners to the panel corners in both directions, wherein the majority of this cracking was observed to have occurred relatively early in the record. Moreover, opening and closing of gaps between frame and infill was also noticed. In the final test, the 0.80g, minor ad-ditional cracking occurred in the second storey, however, the first storey exhibited severe cracking with severe bed joint cracking being reported, substantial bed joint sliding in the upper courses of the masonry, and even spalling of some blocks directly adjacent to the column. Furthermore, shear cracking occurred at the top of the centre and windward col-umn.
The assessment of the assemblage performed with the pushover analysis correctly predicted the overall structural response even under dynamic loading, but more importantly it also allowed the prediction and extent of local member damage as well, as evidenced from Fig. (14) which shows the final deflected shape from the simulation with the overly-ing expected local shear member damage.
Fig. (17). Ratio of inter-storey drifts predicted during the simulation clearly showing the development of a soft storey mechanism and agreeing with the recorded experimental results shown in the inset [40].
8. THE INFLUENCE OF DIFFERENT INFILL DIS-TRIBUTION
In order to study the possible effects of different infill configurations on the lateral structural behaviour of a proto-type building [2], a single central frame was chosen and modelled as a planar structure. However, in order to allow for a broader understanding of these effects, two different bare reinforced concrete frames were considered, differing only in the orientation of their columns. Therefore, a strong bare frame was defined as being that where the column’s major axis where oriented in the page’s planar direction. On the other hand, the weaker frame was specified as having identical geometry, except that the column’s weaker axis corresponded to the page’s planar direction.
()**
()*+
()*,
()*
()-
()*
()+
(),
()
( ,( +( *( -( (( ,( +( *(
&� �������������������������������"�� ������ �����������������./���������������0001
���
����
��
��
���
����
�
��
���
���
��
��
����� ����� ����� �����
����������������
���� ���� ���� ����
��������
-40
-30
-20
-10
0
10
20
30
40
50
60
70
80
90
100
0 1 2 3 4 5 6 7 8 9 10
Top Storey Displacement (mm)/ Total Drift
Sh
ea
r F
orc
e /
Ax
ial
Lo
ad
(k
N)
-6
-5
-4
-3
-2
-1
0
1
2
3
4
5
6
Mo
me
nt
(kN
m)
Shear Force
Axial Force
Diagonal Tension Cracking
Predicted Shear Capacity
Applied Moment
0.035%0.0% 0.07% 0.35%0.105% 0.245% 0.28% 0.315%
(a) Top of the ground storey windward column.
-40
-30
-20
-10
0
10
20
30
40
50
60
70
80
90
100
0 1 2 3 4 5 6 7 8 9 10
Top Storey Displacement (mm)/ Total Drift
Sh
ea
r F
orc
e /
Ax
ial
Lo
ad
(k
N)
-6
-5
-4
-3
-2
-1
0
1
2
3
4
5
6
Mo
me
nt
(kN
m)
Shear Force
Axial Force
Diagonal Tension Cracking
Predicted Shear Capacity
Applied Moment
Predicted shear failure
0.035%0.0% 0.07% 0.35%0.105% 0.245% 0.28% 0.315%
(b) Top of the ground storey central column.
-40
-30
-20
-10
0
10
20
30
40
50
60
70
80
90
100
0 1 2 3 4 5 6 7 8 9 10
Top Storey Displacement (mm)/ Total Drift
Sh
ea
r F
orc
e /
Ax
ial
Lo
ad
(k
N)
-6
-5
-4
-3
-2
-1
0
1
2
3
4
5
6
Mo
me
nt
(kN
m)
Shear Force
Axial Force
Diagonal Tension Cracking
Predicted Shear Capacity
Applied Moment
No predicted shear failure
0.035%0.0% 0.07% 0.35%0.105% 0.245% 0.28% 0.315%
(c) Top of the ground storey leeward column.
Realistic FE Models to Enable Push-Over Non Linear Analysis The Open Construction and Building Technology Journal, 2012, Volume 6 227
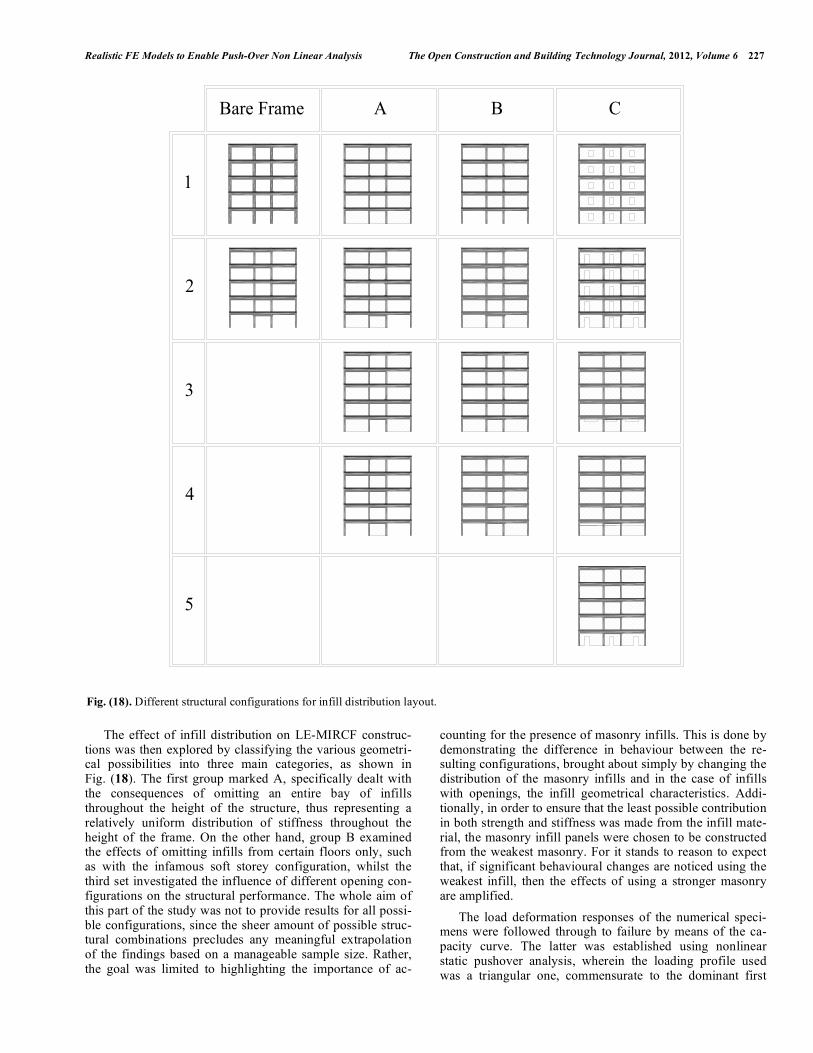
The effect of infill distribution on LE-MIRCF construc-tions was then explored by classifying the various geometri-cal possibilities into three main categories, as shown in Fig. (18). The first group marked A, specifically dealt with the consequences of omitting an entire bay of infills throughout the height of the structure, thus representing a relatively uniform distribution of stiffness throughout the height of the frame. On the other hand, group B examined the effects of omitting infills from certain floors only, such as with the infamous soft storey configuration, whilst the third set investigated the influence of different opening con-figurations on the structural performance. The whole aim of this part of the study was not to provide results for all possi-ble configurations, since the sheer amount of possible struc-tural combinations precludes any meaningful extrapolation of the findings based on a manageable sample size. Rather, the goal was limited to highlighting the importance of ac-
counting for the presence of masonry infills. This is done by demonstrating the difference in behaviour between the re-sulting configurations, brought about simply by changing the distribution of the masonry infills and in the case of infills with openings, the infill geometrical characteristics. Addi-tionally, in order to ensure that the least possible contribution in both strength and stiffness was made from the infill mate-rial, the masonry infill panels were chosen to be constructed from the weakest masonry. For it stands to reason to expect that, if significant behavioural changes are noticed using the weakest infill, then the effects of using a stronger masonry are amplified.
The load deformation responses of the numerical speci-mens were followed through to failure by means of the ca-pacity curve. The latter was established using nonlinear static pushover analysis, wherein the loading profile used was a triangular one, commensurate to the dominant first
5
4
3
2
1
Bare Frame A B C
Fig. (18). Different structural configurations for infill distribution layout.
228 The Open Construction and Building Technology Journal, 2012, Volume 6 Ellul and D’Ayala
mode distribution of the seismic loads. Gravity loads ac-counted for during the analysis included the selfweight of the reinforced concrete members, a finishes surcharge of 1.0 kN/m2 and a live loading of 2.0 kN/m2, only 30% of which was considered for the seismic load combination. Moreover, all infill partitions were assumed to be located on the beams. Their weight was accounted for by assuming a uniform beam load of 3.6 kN/m per metre run of the wall, which was in-cluded in the model by means of an axial load on the beam column joint imparted from the beam reaction.
8.1. Comparison of Structural Behaviour
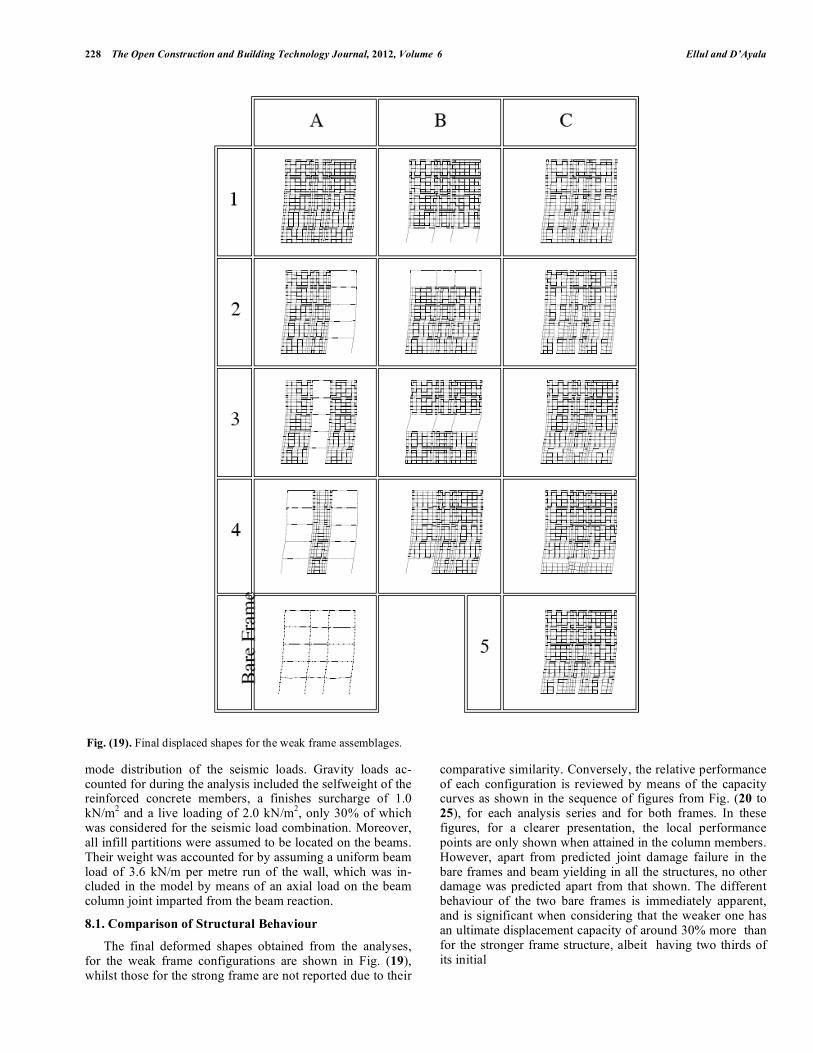
The final deformed shapes obtained from the analyses, for the weak frame configurations are shown in Fig. (19), whilst those for the strong frame are not reported due to their
comparative similarity. Conversely, the relative performance of each configuration is reviewed by means of the capacity curves as shown in the sequence of figures from Fig. (20 to 25), for each analysis series and for both frames. In these figures, for a clearer presentation, the local performance points are only shown when attained in the column members. However, apart from predicted joint damage failure in the bare frames and beam yielding in all the structures, no other damage was predicted apart from that shown. The different behaviour of the two bare frames is immediately apparent, and is significant when considering that the weaker one has an ultimate displacement capacity of around 30% more than for the stronger frame structure, albeit having two thirds of its initial
Fig. (19). Final displaced shapes for the weak frame assemblages.
Realistic FE Models to Enable Push-Over Non Linear Analysis The Open Construction and Building Technology Journal, 2012, Volume 6 229
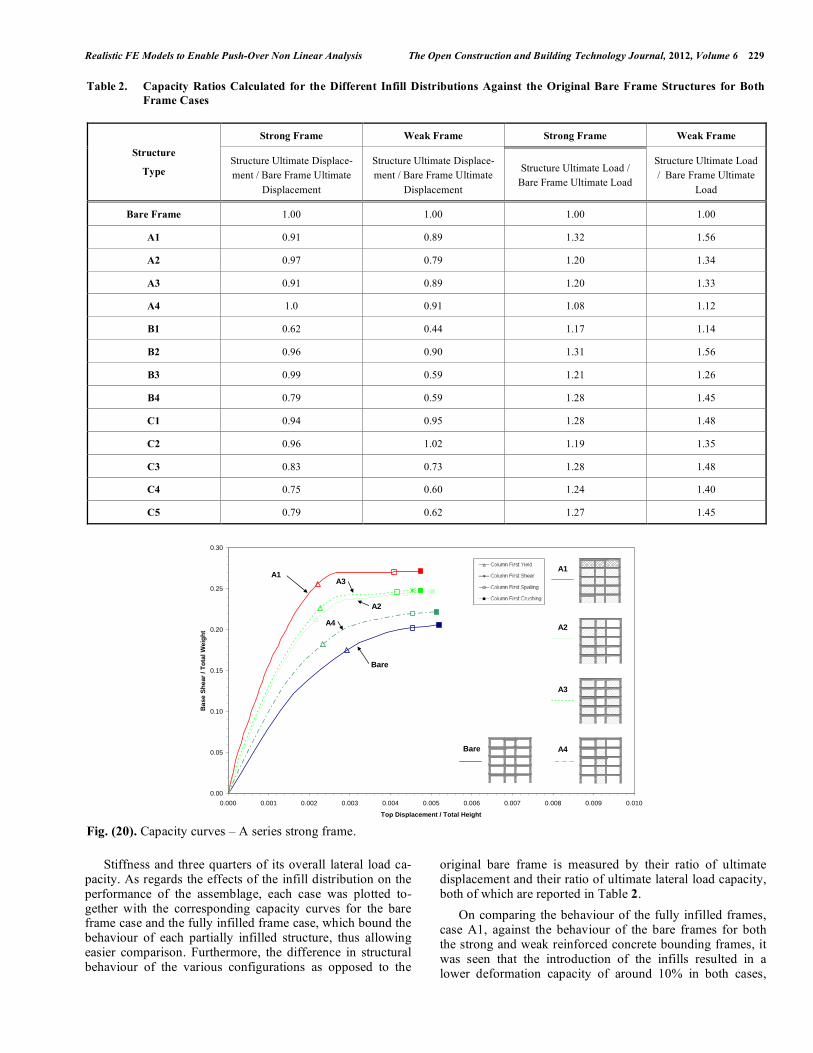
Stiffness and three quarters of its overall lateral load ca-pacity. As regards the effects of the infill distribution on the performance of the assemblage, each case was plotted to-gether with the corresponding capacity curves for the bare frame case and the fully infilled frame case, which bound the behaviour of each partially infilled structure, thus allowing easier comparison. Furthermore, the difference in structural behaviour of the various configurations as opposed to the
original bare frame is measured by their ratio of ultimate displacement and their ratio of ultimate lateral load capacity, both of which are reported in Table 2.
On comparing the behaviour of the fully infilled frames, case A1, against the behaviour of the bare frames for both the strong and weak reinforced concrete bounding frames, it was seen that the introduction of the infills resulted in a lower deformation capacity of around 10% in both cases,
Table 2. Capacity Ratios Calculated for the Different Infill Distributions Against the Original Bare Frame Structures for Both Frame Cases
Strong Frame Weak Frame Strong Frame Weak Frame Structure
Type Structure Ultimate Displace-ment / Bare Frame Ultimate
Displacement
Structure Ultimate Displace-ment / Bare Frame Ultimate
Displacement
Structure Ultimate Load / Bare Frame Ultimate Load
Structure Ultimate Load / Bare Frame Ultimate
Load
Bare Frame 1.00 1.00 1.00 1.00
A1 0.91 0.89 1.32 1.56
A2 0.97 0.79 1.20 1.34
A3 0.91 0.89 1.20 1.33
A4 1.0 0.91 1.08 1.12
B1 0.62 0.44 1.17 1.14
B2 0.96 0.90 1.31 1.56
B3 0.99 0.59 1.21 1.26
B4 0.79 0.59 1.28 1.45
C1 0.94 0.95 1.28 1.48
C2 0.96 1.02 1.19 1.35
C3 0.83 0.73 1.28 1.48
C4 0.75 0.60 1.24 1.40
C5 0.79 0.62 1.27 1.45
Fig. (20). Capacity curves – A series strong frame.
0.00
0.05
0.10
0.15
0.20
0.25
0.30
0.000 0.001 0.002 0.003 0.004 0.005 0.006 0.007 0.008 0.009 0.010
Top Displacement / Total Height
Ba
se
Sh
ear
/ T
ota
l We
igh
t
A1
A2
A3
A4Bare
A1
A2
A3
A4
Bare

230 The Open Construction and Building Technology Journal, 2012, Volume 6 Ellul and D’Ayala
though the overall lateral strength capacity was increased by over 50% for the weak frame and 30% for the strong frame. Furthermore, the gain in initial stiffness caused by the pres-ence of the infills was of 2.5 times for the strong frame case and 3.7 times for the weaker frame, the difference in stiff-ness between the two being reduced to just over 10%.
The effect of omitting the infills entirely from the vertical bays was studied in the analyses series A2 to A4. For the stronger frame configurations, the deformation capacity of these new structures was at least as good as for the fully in-filled frame, in two out of three instances marginally better, whilst the lateral load capacity decreased due to the lower area of infills present, as shown in Fig. (20). Similar conclu-sions were drawn for the weak frame cases, in as far as the strength gain was concerned, whilst the deformation capacity was the same as for the fully infilled case, except for series A2 wherein a decrease of 10% was registered, Fig. (21). In general therefore for this particular structural configuration, the omission of an entire bay of infills throughout its height did not prove detrimental to the structural performance.
However, if the presence of shear failures are considered, then a different scenario is anticipated. In fact for the weak frame, specimens A3 and A4 are predicted to suffer shear
column failures at the top of the ground storey columns, close to the spalling performance point. Hence, if the shear performance point was taken as the displacement limit, the total decrease in predicted displacement capacity would be no less than 15%. For the strong frame configuration, only frame A3 suffers a similar fate, but then just before the con-crete crushing strain is attained, which is understandable given the significant increase in the column depth.
For both the strong and weak frame types, the first yield-ing, spalling and crushing of the columns generally occurred at the same deformation level as for the fully infilled case, and slightly earlier than for the bare frame cases. Finally the similar behaviour of all the configurations in this series, at least in terms of global deformations, is confirmed by refer-ence to Fig. (22), where the inter-storey drifts at predicted collapse are shown for each configuration having the weaker reinforced concrete frame. It can be seen that whereas con-figurations A1, A2 and A3 exhibited a similar mechanism at failure, that of assemblage A4 was more akin to the behav-iour of the bare frame.
On the other hand significant differences in behaviour were noticed for the structures in the B series, which set out to identify behaviour due to significant change in stiffness
0.00
0.05
0.10
0.15
0.20
0.25
0.30
0.000 0.001 0.002 0.003 0.004 0.005 0.006 0.007 0.008 0.009 0.010
Top Displacement / Total Height
Base S
hear
/ T
ota
l W
eig
ht
A1
A2
A3
A4Bare
A1
A2
A3A4
Bare
Fig. (21). Capacity curves – A series weak frame.
Fig. (22). Inter-storey drifts at the ultimate displacement for the A series weak frame.
0
1
2
3
4
5
0 0.25 0.5 0.75 1 1.25
Interstorey Drift Ratio (%)
Sto
rey
Le
ve
l
Bare FrameA1A2A3A4
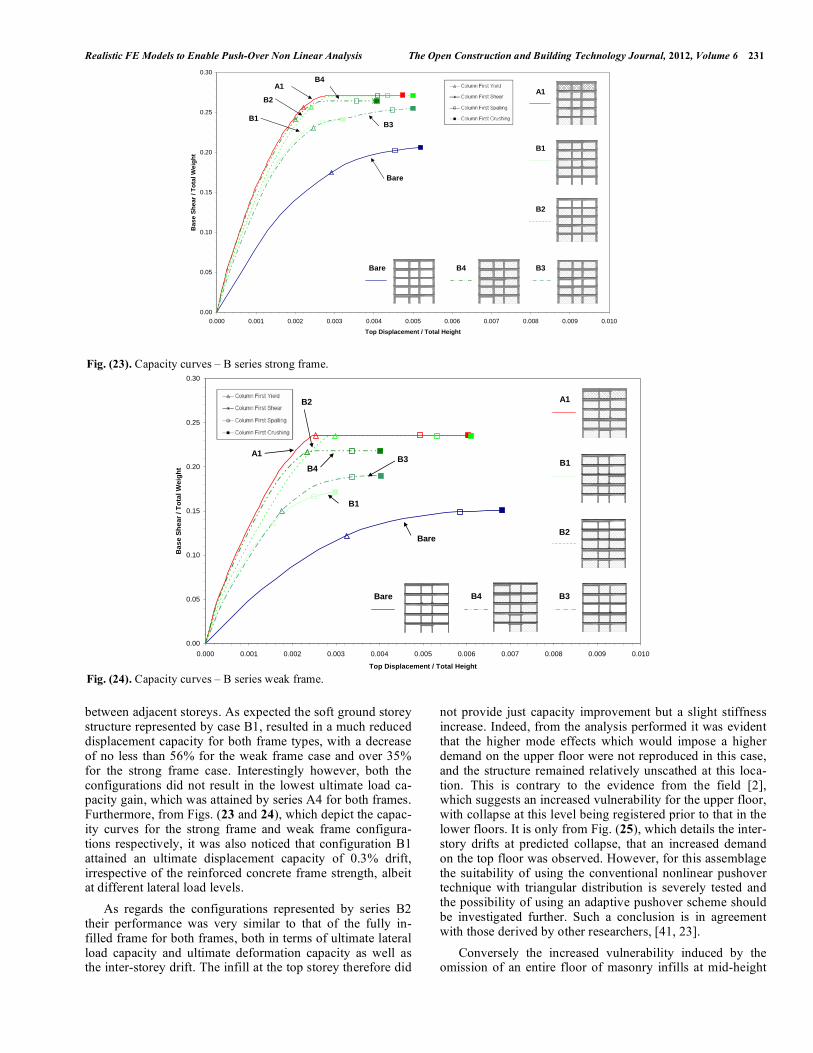
Realistic FE Models to Enable Push-Over Non Linear Analysis The Open Construction and Building Technology Journal, 2012, Volume 6 231
between adjacent storeys. As expected the soft ground storey structure represented by case B1, resulted in a much reduced displacement capacity for both frame types, with a decrease of no less than 56% for the weak frame case and over 35% for the strong frame case. Interestingly however, both the configurations did not result in the lowest ultimate load ca-pacity gain, which was attained by series A4 for both frames. Furthermore, from Figs. (23 and 24), which depict the capac-ity curves for the strong frame and weak frame configura-tions respectively, it was also noticed that configuration B1 attained an ultimate displacement capacity of 0.3% drift, irrespective of the reinforced concrete frame strength, albeit at different lateral load levels.
As regards the configurations represented by series B2 their performance was very similar to that of the fully in-filled frame for both frames, both in terms of ultimate lateral load capacity and ultimate deformation capacity as well as the inter-storey drift. The infill at the top storey therefore did
not provide just capacity improvement but a slight stiffness increase. Indeed, from the analysis performed it was evident that the higher mode effects which would impose a higher demand on the upper floor were not reproduced in this case, and the structure remained relatively unscathed at this loca-tion. This is contrary to the evidence from the field [2], which suggests an increased vulnerability for the upper floor, with collapse at this level being registered prior to that in the lower floors. It is only from Fig. (25), which details the inter-story drifts at predicted collapse, that an increased demand on the top floor was observed. However, for this assemblage the suitability of using the conventional nonlinear pushover technique with triangular distribution is severely tested and the possibility of using an adaptive pushover scheme should be investigated further. Such a conclusion is in agreement with those derived by other researchers, [41, 23].
Conversely the increased vulnerability induced by the omission of an entire floor of masonry infills at mid-height
Fig. (23). Capacity curves – B series strong frame.
Fig. (24). Capacity curves – B series weak frame.
0.00
0.05
0.10
0.15
0.20
0.25
0.30
0.000 0.001 0.002 0.003 0.004 0.005 0.006 0.007 0.008 0.009 0.010
Top Displacement / Total Height
Bas
e S
hea
r / T
ota
l Wei
gh
t
Bare
A1
B1
B2
B3B4
A1
B1
B2
B3
B4
Bare
0.00
0.05
0.10
0.15
0.20
0.25
0.30
0.000 0.001 0.002 0.003 0.004 0.005 0.006 0.007 0.008 0.009 0.010
Top Displacement / Total Height
Ba
se
Sh
ea
r /
To
tal
We
igh
t
A1
Bare
B1
B2
B3B4
A1
B1
B2
B3B4
Bare
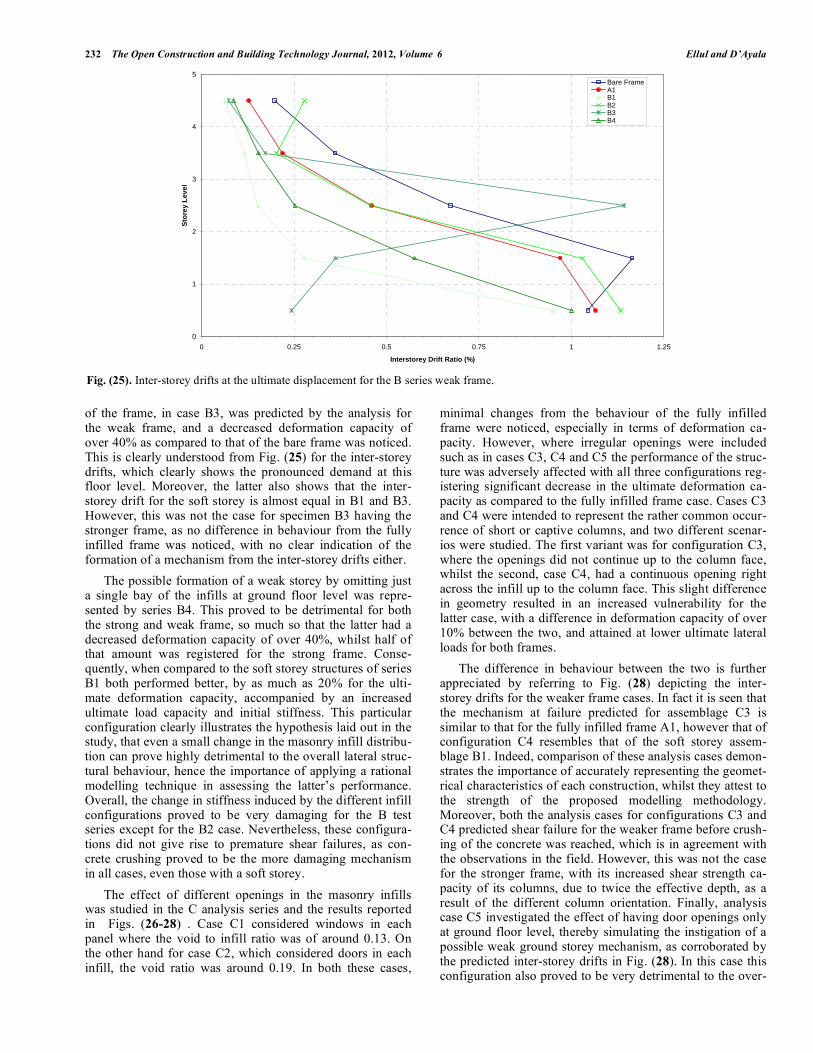
232 The Open Construction and Building Technology Journal, 2012, Volume 6 Ellul and D’Ayala
of the frame, in case B3, was predicted by the analysis for the weak frame, and a decreased deformation capacity of over 40% as compared to that of the bare frame was noticed. This is clearly understood from Fig. (25) for the inter-storey drifts, which clearly shows the pronounced demand at this floor level. Moreover, the latter also shows that the inter-storey drift for the soft storey is almost equal in B1 and B3. However, this was not the case for specimen B3 having the stronger frame, as no difference in behaviour from the fully infilled frame was noticed, with no clear indication of the formation of a mechanism from the inter-storey drifts either.
The possible formation of a weak storey by omitting just a single bay of the infills at ground floor level was repre-sented by series B4. This proved to be detrimental for both the strong and weak frame, so much so that the latter had a decreased deformation capacity of over 40%, whilst half of that amount was registered for the strong frame. Conse-quently, when compared to the soft storey structures of series B1 both performed better, by as much as 20% for the ulti-mate deformation capacity, accompanied by an increased ultimate load capacity and initial stiffness. This particular configuration clearly illustrates the hypothesis laid out in the study, that even a small change in the masonry infill distribu-tion can prove highly detrimental to the overall lateral struc-tural behaviour, hence the importance of applying a rational modelling technique in assessing the latter’s performance. Overall, the change in stiffness induced by the different infill configurations proved to be very damaging for the B test series except for the B2 case. Nevertheless, these configura-tions did not give rise to premature shear failures, as con-crete crushing proved to be the more damaging mechanism in all cases, even those with a soft storey.
The effect of different openings in the masonry infills was studied in the C analysis series and the results reported in Figs. (26-28) . Case C1 considered windows in each panel where the void to infill ratio was of around 0.13. On the other hand for case C2, which considered doors in each infill, the void ratio was around 0.19. In both these cases,
minimal changes from the behaviour of the fully infilled frame were noticed, especially in terms of deformation ca-pacity. However, where irregular openings were included such as in cases C3, C4 and C5 the performance of the struc-ture was adversely affected with all three configurations reg-istering significant decrease in the ultimate deformation ca-pacity as compared to the fully infilled frame case. Cases C3 and C4 were intended to represent the rather common occur-rence of short or captive columns, and two different scenar-ios were studied. The first variant was for configuration C3, where the openings did not continue up to the column face, whilst the second, case C4, had a continuous opening right across the infill up to the column face. This slight difference in geometry resulted in an increased vulnerability for the latter case, with a difference in deformation capacity of over 10% between the two, and attained at lower ultimate lateral loads for both frames.
The difference in behaviour between the two is further appreciated by referring to Fig. (28) depicting the inter-storey drifts for the weaker frame cases. In fact it is seen that the mechanism at failure predicted for assemblage C3 is similar to that for the fully infilled frame A1, however that of configuration C4 resembles that of the soft storey assem-blage B1. Indeed, comparison of these analysis cases demon-strates the importance of accurately representing the geomet-rical characteristics of each construction, whilst they attest to the strength of the proposed modelling methodology. Moreover, both the analysis cases for configurations C3 and C4 predicted shear failure for the weaker frame before crush-ing of the concrete was reached, which is in agreement with the observations in the field. However, this was not the case for the stronger frame, with its increased shear strength ca-pacity of its columns, due to twice the effective depth, as a result of the different column orientation. Finally, analysis case C5 investigated the effect of having door openings only at ground floor level, thereby simulating the instigation of a possible weak ground storey mechanism, as corroborated by the predicted inter-storey drifts in Fig. (28). In this case this configuration also proved to be very detrimental to the over-
Fig. (25). Inter-storey drifts at the ultimate displacement for the B series weak frame.
0
1
2
3
4
5
0 0.25 0.5 0.75 1 1.25
Interstorey Drift Ratio (%)
Sto
rey
Le
ve
l
Bare FrameA1B1B2B3B4
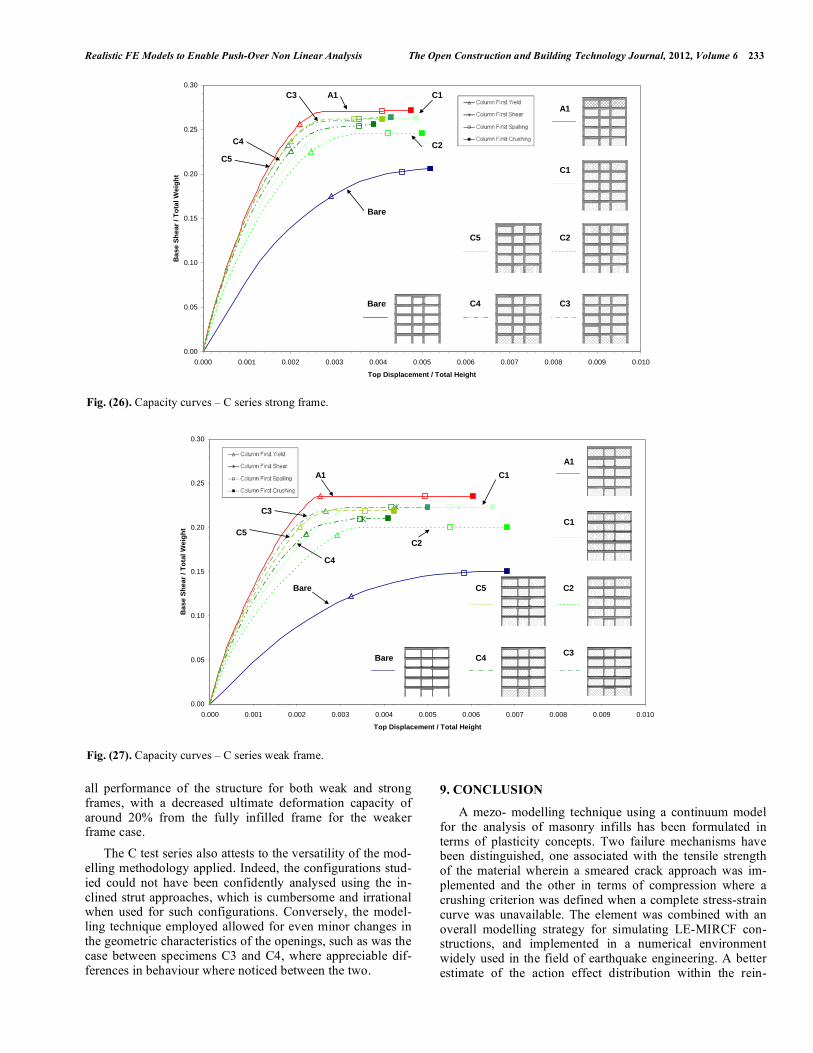
Realistic FE Models to Enable Push-Over Non Linear Analysis The Open Construction and Building Technology Journal, 2012, Volume 6 233
all performance of the structure for both weak and strong frames, with a decreased ultimate deformation capacity of around 20% from the fully infilled frame for the weaker frame case.
The C test series also attests to the versatility of the mod-elling methodology applied. Indeed, the configurations stud-ied could not have been confidently analysed using the in-clined strut approaches, which is cumbersome and irrational when used for such configurations. Conversely, the model-ling technique employed allowed for even minor changes in the geometric characteristics of the openings, such as was the case between specimens C3 and C4, where appreciable dif-ferences in behaviour where noticed between the two.
9. CONCLUSION
A mezo- modelling technique using a continuum model for the analysis of masonry infills has been formulated in terms of plasticity concepts. Two failure mechanisms have been distinguished, one associated with the tensile strength of the material wherein a smeared crack approach was im-plemented and the other in terms of compression where a crushing criterion was defined when a complete stress-strain curve was unavailable. The element was combined with an overall modelling strategy for simulating LE-MIRCF con-structions, and implemented in a numerical environment widely used in the field of earthquake engineering. A better estimate of the action effect distribution within the rein-
Fig. (26). Capacity curves – C series strong frame.
Fig. (27). Capacity curves – C series weak frame.
0.00
0.05
0.10
0.15
0.20
0.25
0.30
0.000 0.001 0.002 0.003 0.004 0.005 0.006 0.007 0.008 0.009 0.010
Top Displacement / Total Height
Ba
se
Sh
ea
r / T
ota
l We
igh
t
A1
Bare
C1
C2
C3C4
C5
Bare
A1 C1
C2
C3
C4
C5
0.00
0.05
0.10
0.15
0.20
0.25
0.30
0.000 0.001 0.002 0.003 0.004 0.005 0.006 0.007 0.008 0.009 0.010
Top Displacement / Total Height
Ba
se
Sh
ea
r / T
ota
l We
igh
t
A1
Bare
C1
C2
C3C4
C5
A1
C1
C2
C3
C4
C5
Bare
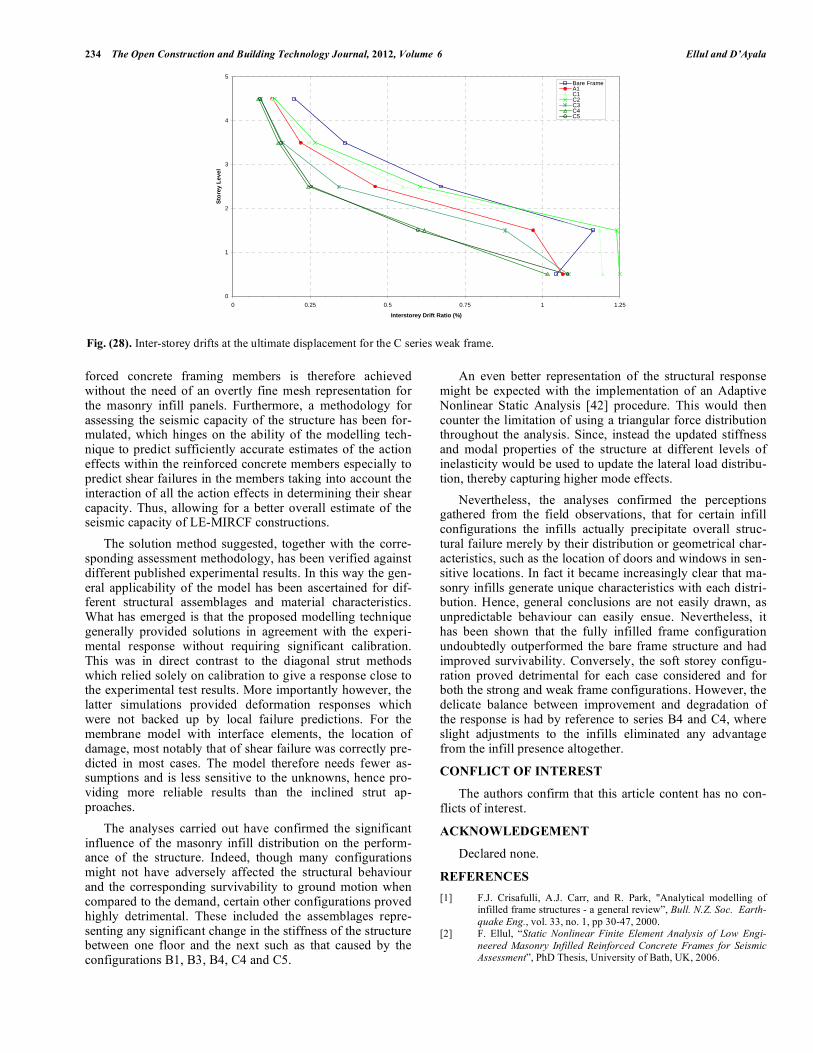
234 The Open Construction and Building Technology Journal, 2012, Volume 6 Ellul and D’Ayala
forced concrete framing members is therefore achieved without the need of an overtly fine mesh representation for the masonry infill panels. Furthermore, a methodology for assessing the seismic capacity of the structure has been for-mulated, which hinges on the ability of the modelling tech-nique to predict sufficiently accurate estimates of the action effects within the reinforced concrete members especially to predict shear failures in the members taking into account the interaction of all the action effects in determining their shear capacity. Thus, allowing for a better overall estimate of the seismic capacity of LE-MIRCF constructions.
The solution method suggested, together with the corre-sponding assessment methodology, has been verified against different published experimental results. In this way the gen-eral applicability of the model has been ascertained for dif-ferent structural assemblages and material characteristics. What has emerged is that the proposed modelling technique generally provided solutions in agreement with the experi-mental response without requiring significant calibration. This was in direct contrast to the diagonal strut methods which relied solely on calibration to give a response close to the experimental test results. More importantly however, the latter simulations provided deformation responses which were not backed up by local failure predictions. For the membrane model with interface elements, the location of damage, most notably that of shear failure was correctly pre-dicted in most cases. The model therefore needs fewer as-sumptions and is less sensitive to the unknowns, hence pro-viding more reliable results than the inclined strut ap-proaches.
The analyses carried out have confirmed the significant influence of the masonry infill distribution on the perform-ance of the structure. Indeed, though many configurations might not have adversely affected the structural behaviour and the corresponding survivability to ground motion when compared to the demand, certain other configurations proved highly detrimental. These included the assemblages repre-senting any significant change in the stiffness of the structure between one floor and the next such as that caused by the configurations B1, B3, B4, C4 and C5.
An even better representation of the structural response might be expected with the implementation of an Adaptive Nonlinear Static Analysis [42] procedure. This would then counter the limitation of using a triangular force distribution throughout the analysis. Since, instead the updated stiffness and modal properties of the structure at different levels of inelasticity would be used to update the lateral load distribu-tion, thereby capturing higher mode effects.
Nevertheless, the analyses confirmed the perceptions gathered from the field observations, that for certain infill configurations the infills actually precipitate overall struc-tural failure merely by their distribution or geometrical char-acteristics, such as the location of doors and windows in sen-sitive locations. In fact it became increasingly clear that ma-sonry infills generate unique characteristics with each distri-bution. Hence, general conclusions are not easily drawn, as unpredictable behaviour can easily ensue. Nevertheless, it has been shown that the fully infilled frame configuration undoubtedly outperformed the bare frame structure and had improved survivability. Conversely, the soft storey configu-ration proved detrimental for each case considered and for both the strong and weak frame configurations. However, the delicate balance between improvement and degradation of the response is had by reference to series B4 and C4, where slight adjustments to the infills eliminated any advantage from the infill presence altogether.
CONFLICT OF INTEREST
The authors confirm that this article content has no con-flicts of interest.
ACKNOWLEDGEMENT
Declared none.
REFERENCES [1] F.J. Crisafulli, A.J. Carr, and R. Park, "Analytical modelling of
infilled frame structures - a general review”, Bull. N.Z. Soc. Earth-quake Eng., vol. 33, no. 1, pp 30-47, 2000.
[2] F. Ellul, “Static Nonlinear Finite Element Analysis of Low Engi-neered Masonry Infilled Reinforced Concrete Frames for Seismic Assessment”, PhD Thesis, University of Bath, UK, 2006.
Fig. (28). Inter-storey drifts at the ultimate displacement for the C series weak frame.
0
1
2
3
4
5
0 0.25 0.5 0.75 1 1.25
Interstorey Drift Ratio (%)
Sto
rey
Le
ve
l
Bare FrameA1C1C2C3C4C5

Realistic FE Models to Enable Push-Over Non Linear Analysis The Open Construction and Building Technology Journal, 2012, Volume 6 235
[3] V. Prakash, G.H. Powell, and S. Campbell, Drain-3DX Base pro-gram description and user guide, Version 1.10, Department of Civil Engineering, University of California, Berkeley, California, 1994.
[4] G.H. Powell, and S. Campbell, Drain-3DX Element description and user guide for element type01, type04, type05, type08, type09, type15 and type17, Version 1.10, Department of Civil Engineering, University of California, Berkeley, California, 1994.
[5] A. Hendry, Structural Masonry, 2nd ed. Macmillan Press: London, 1998.
[6] R.L. Taylor, FEAP – a Finite Element Analysis Program, Version 7.5, User Manual, Department of Civil and Environmental Engi-neering, University of Califonia at Berkeley, Berkeley, California, 2005.
[7] M.D. Kotsovos, and M.N. Pavlovic, Structural concrete, finite element analysis for limit state design, Thomas Telford Publica-tions: London: 1995.
[8] M. Tomazevic, Earthquake-resistant design of masonry buildings, Imperial College Press: London, 1999.
[9] P.B. Lourenço, “Computational Strategies for Masonry Struc-tures”, PhD Thesis. Delft University of Technology, Delft, The Netherlands, p. 210, 1996.
[10] D.R.J. Owen, Finite elements in plasticity, Pineridge Press Limited: Swansea, U.K. 1980.
[11] F.J. Crisafulli, “Seismic Behaviour Of Reinforced Concrete Struc-tures With Masonry Infills”, PhD Thesis. Department of Civil En-gineering, University of Canterbury, New Zealand, p. 404, 1997.
[12] M. Dhanasekar, A.W. Page, and P.W. Kleeman, “The failure of brick masonry under biaxial stresses”, Proc. Inst. Civ. Eng., Part 2, vol. 79, pp. 295-313, 1985.
[13] P.W. Page, “The biaxial compressive strength of brick masonry”, Proc. Inst. Civ. Eng., Part 2, vol. 71, pp. 893-906, 1981.
[14] H.R. Ganz, and B. Thurlimann, Shear design of masonry walls, New Analysis Techniques for Structural Masonry, S.C. Anand, Ed. American Society of Civil Engineers: USA, 1985, pp. 56-70.
[15] A.L. Guha, “Anisotropic elasto-plastic model for masonry walls subjected to bi-axial in-plane loading”, Proceedings of the 6th In-ternational seminar on Structural Masonry for Developing Coun-tries, 11-13 October, India, pp. 171-186, 2000.
[16] P.G. Asteris, and A.D. Tzamtzis, “On the use of a regular yield surface for the analysis of unreinforced masonry walls”, Electron. J. Struct. Eng., vol. 3, pp. 23-42, 2003.
[17] A.W. Page, “The strength of brick masonry under biaxial tension compression”, Int. J. Masonry Constr., vol. 3, Pt. 1, pp. 26-31, 1983.
[18] D.C. Drucker, and W. Prager, “Soil mechanics and plastic analysis or limit design”, Q. Appl. Math., vol. 10, pp. 157-165, 1952.
[19] D.R.J. Owen, and J.A. Figueiras, Finite element software for plates and shells, E. Hinton, Pineridge Press Limited: Swansea, U.K. 1984.
[20] D. Ngo, and A.C. Scordelis, “Finite element analysis of reinforced concrete beams”, ACI J., vol. 64, no. 3, pp. 152-163, 1967.
[21] Y. R. Rashid, “Analysis of prestressed concrete pressure vessels”, Nucl. Eng. Des., vol. 7, pp. 334-344, 1968.
[22] C.K. Seah, “A Universal Approach for the Analysis and Design of Masonry Infilled Frame Structures”, PhD Thesis. Graduate Aca-demic Unit of Civil Engineering, University of New Brunswick, New Brunswick, Canada, 1998.
[23] A.S. Elnashai, “Do we really need inelastic dynamic analysis?”, J. Earthquake Eng., vol. 6, Special Issue 1, pp. 123-130, 2002.
[24] FIB, “Seismic assessment and retrofit of reinforced concrete build-ings”, State-of-the-art report, International Federation for Structural Concrete.
[25] G.G. Penelis, and A.J. Kappos, Earthquake-resistant concrete structures, E & FN Spon: London, p. 572, 1997.
[26] FEMA 356, Prestandard and commentary for the seismic rehabili-tation of buildings, (ASCE 2000). American Society of Civil Engi-neers for the Federal Emergency Management Agency: Washing-ton, D.C. 2000.
[27] A.J. Kappos, “Analytical prediction of the collapse earthquake for R/C buildings: suggested methodology”, Earthquake Eng. Struct. Dyn., vol. 20, no. 2, pp. 167-176. 1991.
[28] CEB, CEB-FIP Model code 1990, Bulletin d’Inf. CEB, 213/214, Lausanne, 1993.
[29] D.C. Kent, and R. Park, “Flexural members with confined con-crete”, J. Struct. Div., ASCE, vol. 97 no. ST7, pp. 1969-1990, 1971.
[30] A.J. Kappos, RCCOLA-90: Program for the inelastic analysis of reinforced concrete cross sections, User’s Manual, Department of Civil Engineering, ESEE Section, Imperial College: London, 1996.
[31] C. Dymiotis, A.J. Kappos, and M.K. Chryssanthopoulos, “Seismic reliability of masonry-infilled RC frames”, J. Struct. Eng., vol. 127, no. 3, pp. 296-305, 2001.
[32] K. Maekawa, A. Pimanmas, and H. Okamura, Nonlinear Mechan-ics of Reinforced Concrete, Spon Press: London, 2003.
[33] A.H. Nilson, and G. Winter, Design of concrete structures, McGraw-Hill Book Co-Singapore, Singapore, 1986.
[34] ACI 318-83, Commentary on Building Code Requirements for Reinforced Concrete, American Concrete Institute: Detroit.
[35] CEN EC 8, Eurocode 8: Design of structures for earthquake resis-tance., Part 1: General rules, seismic actions and rules for build-ings. ENV 1998-1-1, 2004 CEN, Brussels, 2004.
[36] M.J.N. Priestley, and F. Seible, “Performance assessment of dam-aged bridge bents after the Loma Prieta earthquake”, Bull. N.Z. Natl. Soc. Earthquake Eng., vol. 25, no. 1, pp. 44-51, 1992.
[37] T. Paulay, and M.J.N. Priestley, Seismic design of reinforced con-crete and masonry buildings, John Wiley & Sons Inc, NY, p. 744, 1992.
[38] G. Al-Chaar, M. Issa, and S. Sweeney, “Behaviour of masonry-infilled nonductile reinforced concrete frames”, J. Struct. Eng., vol. 128, no. 8, pp. 1055-1063, 2002.
[39] F. Colangelo, “Pseudo-dynamic seismic response of reinforced concrete frames infilled with non-structural brick masonry”, Earth-quake Eng. Struct. Dyn., vol. 34, pp. 1219-1241, 2005.
[40] S.G. Buonopane, and R.N. White, “Pseudodynamic testing of ma-sonry infilled reinforced concrete frame”, J. Struct. Eng., ASCE, vol. 125, no. 6, pp. 578-589, 1999.
[41] M. Dolce, A.J. Kappos, A. Masi, G. Penelis, and M. Vona, “Vul-nerability assessment and earthquake damage scenarios of the building stock of Potenza (Southern Italy) using Italian and Greek methodologies”, Eng. Struct., vol. 28, pp. 357-371, 2005.
[42] S. Antonio, and R. Pinho, “Development and verification of a dis-placement-based adaptive pushover procedure”, J. Earthquake Eng., vol. 8, no. 5, pp. 643-661, 2004.
Received: December 12, 2011 Revised: June 13, 2012 Accepted: June 14, 2012 © Ellul and D’Ayala; Licensee Bentham Open.
This is an open access article licensed under the terms of the Creative Commons Attribution Non-Commercial License (http://creativecommons.org/-licenses/by-nc/3.0/) which permits unrestricted, non-commercial use, distribution and reproduction in any medium, provided the work is properly cited.


![The Technological System [Le Système Technicien] - Jacques Ellul](https://img.pdfslide.us/doc/110x75/577ce7341a28abf1039495c7/the-technological-system-le-systeme-technicien-jacques-ellul.jpg)


![[Jacques Ellul] Propaganda(BookFi.org)](https://img.pdfslide.us/doc/110x75/55cf99ff550346d033a00dca/jacques-ellul-propagandabookfiorg.jpg)