Embed Size (px)
Citation preview

The Online Journal of Science and Technology
Prof. Dr. Aytekin İşman Editor-in-Chief
Prof. Dr. Mustafa Şahin Dündar Editor
Hüseyin Eski Technical Editor
www.tojsat.net January 2019
ISSN 2146-7390

Copyright © 2011 - THE ONLINE JOURNAL OF SCIENCE AND TECHNOLOGY All rights reserved. No part of TOJSAT’s articles may be reproduced or utilized in any form or by any means, electronic or mechanical, including photocopying, recording, or by any information storage and retrieval system, without permission in writing from the publisher. Published in TURKEY
Contact Address:
Prof. Dr. Mustafa Şahin Dündar - TOJSAT, Editor Sakarya-Turkey
The Online Journal of Science and Technology - January 2019 Volume 9, Issue 1
www.tojsat.net Copyright © The Online Journal of Science and Technology

Message from the Editor-in-Chief
Dear Colleagues,
TOJSAT welcomes you. TOJSAT would like to thank you for your online journal interest. The online journal system has been diffused very fast for last ten years. We are happy to see that almost more than 180,000 educators, teachers, parents, and students from around the world have visited for last eight years. It means that TOJSAT has continued to diffuse new trends in science and technology to all over the world since January, 2011. We hope that the volume 9, issue 1 will also successfully accomplish our global science and technology goal.
TOJSAT is confident that readers will learn and get different aspects on science and technology. Any views expressed in this publication are the views of the authors and are not the views of the Editor and TOJSAT. TOJSAT thanks and appreciate the editorial board who have acted as reviewers for one or more submissions of this issue for their valuable contributions. TOJSAT will organize ISTECEurope-2019- International Science & Technology Conference (www.iste-c.net) on July, 2019 in Prague and ISTECAmerica – 2019 on August, 2019 at George Mason University in America. This conference is now a well-known science and technology event. It promotes the development and dissemination of theoretical knowledge, conceptual research, and professional knowledge through conference activities. Its focus is to create and disseminate knowledge about science and technology. ISTEC-2014 conference book has been published at http://www.iste-c.net/istecpubs
For any suggestions and comments on the international online journal TOJSAT, please do not hesitate to fill out the comments & suggestion form.
Call for Papers TOJSAT invites you article contributions. Submitted articles should be about all aspects of science and technology. The articles should be original, unpublished, and not in consideration for publication elsewhere at the time of submission to TOJSAT. Manuscripts must be submitted in English. TOJSAT is guided by its editors, guest editors and advisory boards. If you are interested in contributing to TOJSAT as an author, guest editor or reviewer, please send your CV to editor.
January 01, 2019 Prof. Dr. Aytekin ISMAN Sakarya University
The Online Journal of Science and Technology - January 2019 Volume 9, Issue 1
www.tojsat.net Copyright © The Online Journal of Science and Technology

Message from the Editor
Dear Readers,
Happy New Year.
Welcome to the 1st issue of 2019. Papers were contributed from Yemen to U.S.A. and include selected titles for instance Super Food for Alternative Nutrients: Spirulina Platensis; Challenges in Teaching Global Software Engineering to Undergraduate Students: Course Design. In the new issue you will see these new and interesting topics.
TOJSAT thanks and appreciate the editorial board who have acted as reviewers and their valuable contributions.
TOJSAT invites you article contributions. Submitted articles should be about all aspects of science and technology. The articles should be original, unpublished, and not in consideration for publication elsewhere at the time of submission to TOJSAT and it must be written in English.
Prof.Dr. Mustafa S. Dundar
Editor
The Online Journal of Science and Technology - January 2019 Volume 9, Issue 1
www.tojsat.net Copyright © The Online Journal of Science and Technology

Editor-in-Chief
Prof. Dr. Aytekin İŞMAN - Sakarya University, Turkey
Editor
Prof. Dr. Mustafa Şahin DÜNDAR - Sakarya University, Turkey
Technical Editor
Hüseyin Eski, Sakarya University, Turkey
Editorial Board
Prof. Dr. Ahmet APAY,Sakarya University,Turkey
Prof. Dr. Antoinette J. MUNTJEWERFF,University of Amsterdam,Netherlands
Prof. Dr. Arvind SINGHAL,University of Texas,United States
Prof. Dr. Aytekin İŞMAN,Sakarya University,Turkey
Prof. Dr. Bilal GÜNEŞ,Gazi University,Turkey
Prof. Dr. Brent G. WILSON,University of Colorado at Denver,United States
Prof. Dr. Cafer ÇELİK,Ataturk University,Turkey
Prof. Dr. Chih-Kai CHANG,National University of Taiwan,Taiwan
Prof. Dr. Chin-Min HSIUNG,National Pingtung University,Taiwan
Prof. Dr. Colin LATCHEM,Open Learning Consultant,Australia
Prof. Dr. Deborah E. BORDELON,Governors State University,United States
Prof. Dr. Don M. FLOURNOY,Ohio University,United States
Prof. Dr. Feng-Chiao CHUNG,National Pingtung University,Taiwan
Prof. Dr. Finland CHENG,National Pingtung University,Taiwan
Prof. Dr. Francine Shuchat SHAW,New York University,United States
Prof. Dr. Frank S.C. TSENG,National Kaohsiung First University os Science and Technology,Taiwan
Prof. Dr. Gianni Viardo VERCELLI ,University of Genova,Italy
Prof. Dr. Gilbert Mbotho MASITSA,Universirty of The Free State,South Africa
Prof. Dr. Gregory ALEXANDER,University of The Free State,South Africa
Prof. Dr. Gwo-Dong CHEN,National Central University Chung-Li,Taiwan
Prof. Dr. Gwo-Jen HWANG,National Taiwan University od Science and Technology,Taiwan
Prof. Dr. Hellmuth STACHEL,Vienna University of Technology,Austria
Prof. Dr. J. Ana DONALDSON,AECT Former President,United States
Prof. Dr. Mehmet Ali YALÇIN,Sakarya University,Turkey
Prof. Dr. Mustafa S. DUNDAR,Sakarya University,Turkey
Prof. Dr. Nabi Bux JUMANI,International Islamic University,Pakistan
Prof. Dr. Orhan TORKUL,Sakarya University,Turkey
Prof. Dr. Paolo Di Sia,University of Verona,Italy
Prof. Dr. Ümit KOCABIÇAK,Sakarya University,Turkey
Assoc. Prof. Dr. Kerim KARABACAK-Istanbul University-Cerrahpasa, TURKEY
Assist. Prof. Dr. Engin CAN,Sakarya University,Turkey
Assist. Prof. Dr. Hüseyin Ozan Tekin,Üsküdar University,Turkey
Assist. Prof. Dr. Tuncer KORUVATAN,Turkish Military Academy,Turkey
Dr. Abdul Mutalib LEMAN,Universiti Tun Hussein Onn Malaysia,Malaysia
The Online Journal of Science and Technology - January 2019 Volume 9, Issue 1
www.tojsat.net Copyright © The Online Journal of Science and Technology

Dr. Atilla YILMAZ,Hacettepe University,Turkey
Dr. Bekir SALIH,Hacettepe University,Turkey
Dr. Berrin ÖZCELİK,Gazi University,Turkey
Dr. Burhan TURKSEN,TOBB University of Economics and Technology,Turkey
Dr. Chua Yan PIAW,University of Malaya,Malaysia
Dr. Constantino Mendes REI,Instituto Politecnico da Guarda,Portugal
Dr. Daniel KIM,The State University of New York,South Korea
Dr. Dong-Hoon OH,Universiy of Seoul,South Korea
Dr. Evrim GENÇ KUMTEPE,Anadolu University,Turkey
Dr. Fabricio M. DE ALMEIDA
Dr. Fahad N. ALFAHAD,King Saud University,Saudi Arabia
Dr. Fatimah HASHIM,Universiti Malaya,Malaysia
Dr. Fatma AYAZ,Gazi University,Turkey
Dr. Fonk SOON FOOK,Universiti Sains Malaysia,Malaysia
Dr. Galip AKAYDIN,Hacettepe University,Turkey
Dr. Hasan MUJAJ,University of Prishtina,Kosovo
Dr. Hasan KIRMIZIBEKMEZ,Yeditepe University,Turkey
Dr. Hasan OKUYUCU,Gazi University,Turkey
Dr. Ho Sooon MIN,INTI International University,Malaysia
Dr. Ho-Joon CHOI,Kyonggi University,South Korea
Dr. HyoJin KOO,Woosuk University,South Korea
Dr. Jae-Eun LEE,Kyonggi University,South Korea
Dr. Jaroslav Vesely,BRNO UNIVERSITY OF TECHNOLOGY,Czech Republic
Dr. Jon Chao HONG,National Taiwan Normal University,Taiwan
Dr. Joseph S. LEE,National Central University,Taiwan
Dr. Kendra A. WEBER,University of Minnesota,United States
Dr. Kim Sun HEE,Woosuk University,South Korea
Dr. Latif KURT,Ankara University,Turkey
Dr. Li YING,China Central Radio and TV University,China
Dr. Man-Ki MOON,Chung-Ang University,South Korea
Dr. Abdülkadir MASKAN,Dicle University,Turkey
Dr. Alper Tolga KUMTEPE,Anadolu University,Turkey
Dr. Martha PILAR MéNDEZ BAUTISTA,EAN University, Bogotá,Colombia
Dr. Md Nor Noorsuhada,Universiti Teknologi MARA Pulau Pinang,Malaysia
Dr. Mohamad BIN BILAL ALI,Universiti Teknologi Malaysia,Malaysia
Dr. Mohamed BOUOUDINA,University of Bahrain,Bahrain
Dr. Mohammad Reza NAGHAVI,University of Tehran,Iran
Dr. Mohd Roslan MODH NOR,University of Malaya,Malaysia
Dr. Muhammed JAVED,Islamia University of Bahawalpur,Pakistan
Dr. Murat DİKER,Hacettepe University,Turkey
Dr. Mustafa KALKAN,Dokuz Eylül Universiy,Turkey
Dr. Nihat AYCAN,Muğla University,Turkey
Dr. Nilgün TOSUN,Trakya University,Turkey
Dr. Nursen SUCSUZ,Trakya University,Turkey
Dr. Osman ANKET,Gülhane Askeri Tıp Akademisi,Turkey
Dr. Piotr TOMSKI,Czestochowa University of Technology,Poland
Dr. Raja Rizwan HUSSAIN,King Saud University,Saudi Arabia
Dr. Ramdane YOUNSI,Polytechnic University,Canada
Dr. Rıdvan KARAPINAR,Yuzuncu Yıl University,Turkey
Dr. Rıfat EFE,Dicle University,Turkey
Dr. Ruzman Md. NOOR,Universiti Malaya,Malaysia
Dr. Sandeep KUMAR,Suny Downstate Medical Center,United States
Dr. Sanjeev Kumar SRIVASTAVA,Mitchell Cancer Institute,United States
Dr. Selahattin GÖNEN,Dicle University,Turkey
Dr. Senay CETINUS,Cumhuriyet University,Turkey
Dr. Sharifah Norul AKMAR,University of Malaya,,Malaysia
Dr. Sheng QUEN YU,Beijing Normal University,China
Dr. Sun Young PARK,Konkuk University,South Korea
Dr. Tery L. ALLISON,Governors State University,United States
The Online Journal of Science and Technology - January 2019 Volume 9, Issue 1
www.tojsat.net Copyright © The Online Journal of Science and Technology

Dr. Türkay DERELİ,Gaziantep University,Turkey
Dr. Uner KAYABAS,Inonu University,Turkey
Dr. Wan Mohd Hirwani WAN HUSSAIN,Universiti Kebangsaan Malaysia,Malaysia
Dr. Wan Zah WAN ALI,Universiti Putra Malaysia,Malaysia
Dr. Yueah Miao CHEN,National Chung Cheng University,Taiwan
Dr. Yusup HASHIM,Asia University,Malaysia
Dr. Zawawi ISMAIL,University of Malaya,Malaysia
Dr. Zekai SEN,Istanbul Technical University,Turkey
The Online Journal of Science and Technology - January 2019 Volume 9, Issue 1
www.tojsat.net Copyright © The Online Journal of Science and Technology

Table of Contents
A “SUPER FOOD” FOR ALTERNATIVE NUTRIENTS: Spirulina Platensis 1
Nilay Seyidoglu, Deniz Belenli
A CASE STUDY OF A GRAVITY WALL LOCATED IN THE FISHING PORT AREA 7
Aykut EROL, Zülküf KAYA, Erdal UNCUOĞLU, Hacı Bekir KARA
A COMPARATIVE STUDY OF VARIOUS POROUS ADSORBENTS FOR CO2 ADSORPTION 12
Fatma OĞUZ ERDOĞAN
A NEW PROGRAMMING LANGUAGE 17
Burak Çakır, Mustafa OF
NUMERICAL STUDY USING MIXTURES OF WATER – ETHYLENE GLYCOL BASED NANOFLUIDS ON LAMINAR HEAT TRANSFER OF AN ANNULUS 20
Elif Büyük ÖĞÜT, Koray ÖZDEMİR, Halil İbrahim SARAÇ
A PATTERN RECOGNITION SYSTEM FOR DETECTION OF ROAD SIGNS 33
Bochra TRIQUI, Abdelkader BENYETTOU
ACTIVATING THE DISTANCE LEARNING SYSTEM 39
Burak Çakır, Mustafa OF
ADAPTIVE RELAYING IN ELECTRIC POWER SYSTEM PROTECTION 43
Behçet KOCAMAN, Üzeyir AKCA
AN ASSAY WHETHER EARLY COMMUNICATION (TEACHING TURKISH) METHODS AFFECT THE THINKING PROCESS THROUGH TURKISH AND MATHEMATICS COURSE 47
Nevin ALGÜL
AN INVESTIGATION ON THE EFFECTS OF ECAP ON THIXOTROPIC MICROSTRUCTURE OF AA7075 ALUMINUM ALLOY 53
Ersin Asım GÜVEN
APPLICATION OF THE FMEA FOR ANALYZING DEPENDABILITY OF POWER TRANSFORMER AT HASSI R'MEL GAS FIELD 57
Bouchra NADJI , El laid BOUCHTOB, RazikaTAHI
BIOCHEMICAL PROPERTIES OF POLYPHENOL OXIDASE FROM DAUCUS CAROTA 62
Reyhan Gul Guven, Kemal Guven, Fatma Matpan Bekler, Nurten Aslan
The Online Journal of Science and Technology - January 2019 Volume 9, Issue 1
www.tojsat.net Copyright © The Online Journal of Science and Technology

CHALLENGES IN TEACHING GLOBAL SOFTWARE ENGINEERING TO UNDERGRADUATE STUDENTS: COURSE DESIGN 68
Vinitha Hannah Subburaj, Emily M. Hunt, Angela Spaulding, James D. Webb
COMPARISON OF ACTIVATED CARBON PRODUCED FROM CAROB STONES WITH 4A ZEOLITE FOR ALLURA RED AC DYE ADSORPTION 75
Fatma OĞUZ ERDOĞAN
SYNTHESIS AND ANTIMICROBIAL STUDY OF SOME POLYCYCLIC COMPOUNDS BY [3+2] CYCLOADDITION REACTIONS OF ALDAZINES WITH N-ARYL MALEIMIDES 80
Abdullah Abdalkarim Al–Shara′ey, Mohammed Hadi Al–Douh, Younes S. Gahnem
The Online Journal of Science and Technology - January 2019 Volume 9, Issue 1
www.tojsat.net Copyright © The Online Journal of Science and Technology

A “SUPER FOOD” FOR ALTERNATIVE NUTRIENTS: Spirulina Platensis
Nilay Seyidoglu Tekirdag Namik Kemal University, Veterinary Faculty, Department of Physiology, Tekirdag-TURKEY
Deniz Belenli Tekirdag Namik Kemal University, Veterinary Faculty, Department of Biochemistry, Tekirdag-TURKEY
Abstract: Nutrition provides the growth and maintains function of organism. In recent years, there has been an increase in importance of alternative foods for feeding and health, especially Spirulina platensis. S.platensis is a microalgae called as “Super food” as endorsed by lifestyle personalities, and also has been approved as a health food by the World Health Organization. This study we aimed to evaluate the effects of different doses of S.platensis (500-1000 mg/kg bw) on physiological such as growth, haemotogical and biochemical parameters. During trial the rats were weighed weekly and the haemogram parameters (haematocrit, haemoglobin, red-white blood cell counts, leukocyte subtypes, MCV, MCHC, RDW and PLT) were analyzed. Serum total cholesterol, its fractions (LDL, HDL) and atherogenic indices (TC:HDL-C, LDL-C:HDL-C) were observed. Besides that, serum protein, albumin, globulin and albumin/globulin ratio were determined. Although there were no differences occurred among all groups statistically, all parameters were found in their reference values. However, effects of lower dose of S.platensis showed the best result for those physiological parameters. As a result that, S. platensis with its high concentration of functional nutrients is called as an important alternative therapeutic food and can be said that it can be used safely. Key words: Alternative food, Spirulina, microalgae, health.
Introduction Nutritious is important for physiological functions and also growth mechanism of organism. Belong this issue, a quality nutritious is nedded for a healthy life for both animal and human. Recent years, researchers are interested in interesting food supplements for better health. The selection criterias of these products take into account the strengthening of the immune system, maintenance of growth performance and antioxidant properties, especially protein needs. Among these products, a strong antioxidant Spirulina platensis, which is a natural protein source, rich in vitamins and minerals, has become a focus of interest. Belong to the increase in interest of S.platensis, biotechnological studies about this microalgae have been researched in nowadays.
S. platensis is a microscopic filamentous alga which is rich in polyunsaturated fatty acids, phycocyanin and phenoliccompounds (Richmond, 1992). It also does not contain cellulose on its cell wall. In this respect, S.platensisstimulates the bowel function and digestion rate by activate the useful microorganism such as Bifidobacterium andLactobacillus, and inhibit the harmful bacteries such as E.coli and Candidas. The improvement of absorption offoods and digestion were reported by some researchers (Pulz and Gross, 2004; Vural and Celen, 2005; Dogan,2012). Besides that, phycocyanin content of S.platensis which has antioxidant and antienflamatuar properties,affects positively on erythropoiesis. Researchers also determined that phycocyanin and also polisaccarides in thismicroalgae improve values of the erythrocytes, granulocytes, monocytes and fibroblast cells in bone cell marrow(Hayashi et al. 1994; Cheng-Wu et al., 1994). Hayashi et al. (1994) observed the stimulation effects of S.platensis onactivation of macrophage and leukocyte cells, phagocytosis, interleukin production and immune response in rats. Atthe same time, more toxicological analysis have been studied for usage this microalga as a natural food additive andreliability (Salazar et al., 1998; Yazıcı and Kaynak, 2001; Belay, 2002). On that point, in terms of preventivemedicine or alternative food for health is supported by the macrophage activation and thereby effects on growth andimmune system. S.platensis has an important role on blood protein and lipid. Researchers indicated that (Nakaya etal., 1988; Kanamaru et al., 2005) cholesterol is decreased by inhibition of the cholesterol absorption from jejunumand bile acid resorption from ileum with phycocyanin in S. platensis. Also, it was reported that polyunsaturated fattyacids and phycocyanin in S.platensis may help for this purpose. In addition, the plasma proteins (total protein,albumin, globulin) increased by S.platensis due to its high contents of essential amino acids and protein with valuesranging from 55-65% (Bezerra et al., 2009; Mariey et al., 2012). However, it was only reported that long term ofSpirulina intake may caused gout due to the high protein value (Becker et al., 1986; Araújo et al., 2003). In thisstudy, it’s aimed to evaluate the effects of different doses of S. platensis on hematological and biochemicalparameters of rats that fed a long trial period.
The Online Journal of Science and Technology - January 2019 Volume 9, Issue 1
www.tojsat.net Copyright © The Online Journal of Science and Technology 1
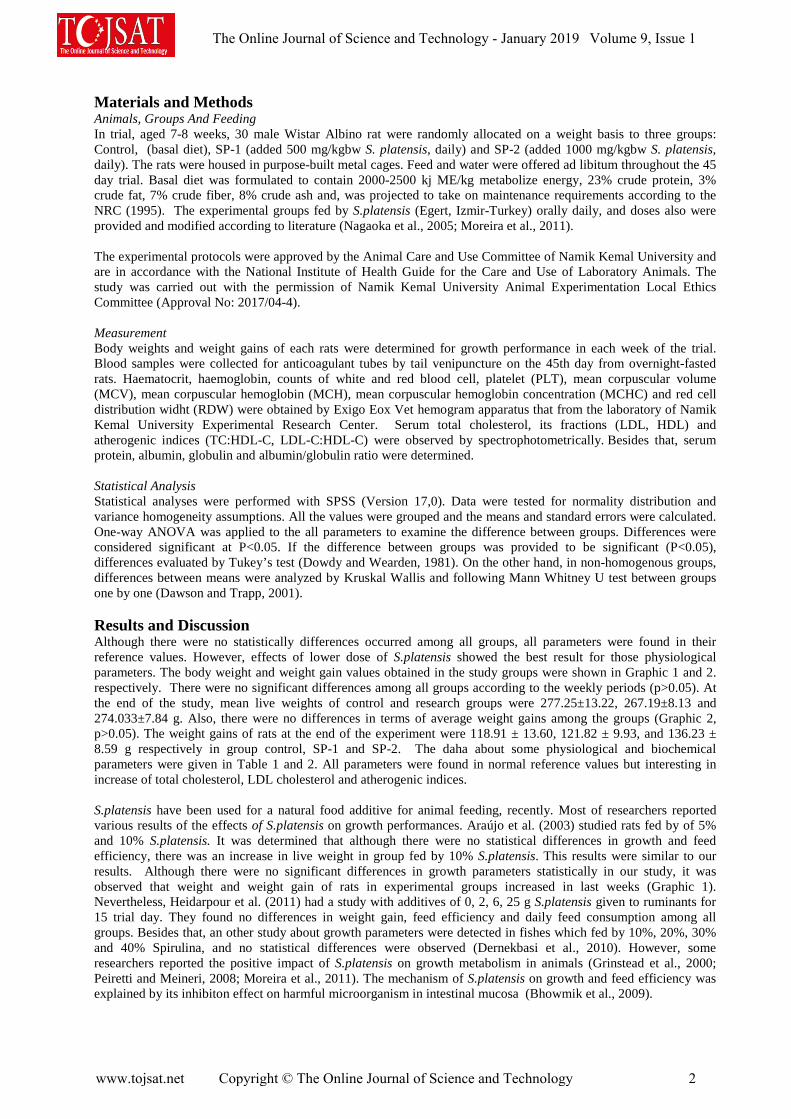
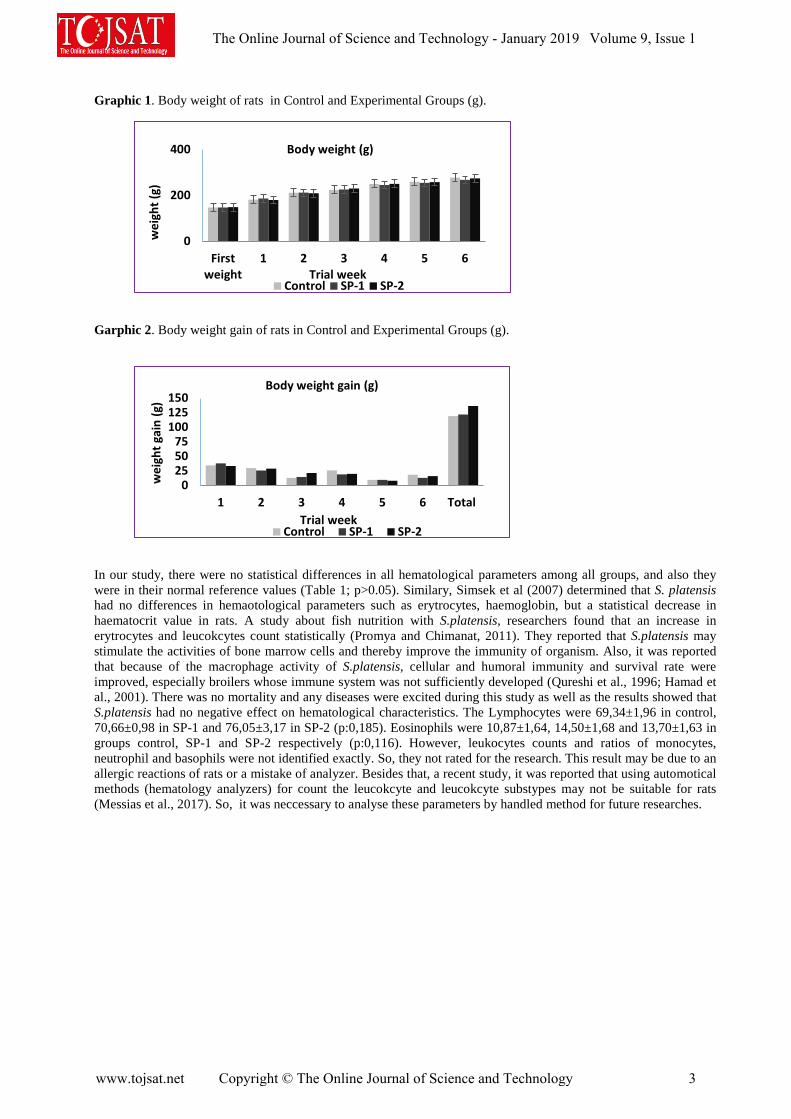
Materials and Methods Animals, Groups And Feeding In trial, aged 7-8 weeks, 30 male Wistar Albino rat were randomly allocated on a weight basis to three groups: Control, (basal diet), SP-1 (added 500 mg/kgbw S. platensis, daily) and SP-2 (added 1000 mg/kgbw S. platensis, daily). The rats were housed in purpose-built metal cages. Feed and water were offered ad libitum throughout the 45 day trial. Basal diet was formulated to contain 2000-2500 kj ME/kg metabolize energy, 23% crude protein, 3% crude fat, 7% crude fiber, 8% crude ash and, was projected to take on maintenance requirements according to the NRC (1995). The experimental groups fed by S.platensis (Egert, Izmir-Turkey) orally daily, and doses also were provided and modified according to literature (Nagaoka et al., 2005; Moreira et al., 2011). The experimental protocols were approved by the Animal Care and Use Committee of Namik Kemal University and are in accordance with the National Institute of Health Guide for the Care and Use of Laboratory Animals. The study was carried out with the permission of Namik Kemal University Animal Experimentation Local Ethics Committee (Approval No: 2017/04-4). Measurement Body weights and weight gains of each rats were determined for growth performance in each week of the trial. Blood samples were collected for anticoagulant tubes by tail venipuncture on the 45th day from overnight-fasted rats. Haematocrit, haemoglobin, counts of white and red blood cell, platelet (PLT), mean corpuscular volume (MCV), mean corpuscular hemoglobin (MCH), mean corpuscular hemoglobin concentration (MCHC) and red cell distribution widht (RDW) were obtained by Exigo Eox Vet hemogram apparatus that from the laboratory of Namik Kemal University Experimental Research Center. Serum total cholesterol, its fractions (LDL, HDL) and atherogenic indices (TC:HDL-C, LDL-C:HDL-C) were observed by spectrophotometrically. Besides that, serum protein, albumin, globulin and albumin/globulin ratio were determined. Statistical Analysis Statistical analyses were performed with SPSS (Version 17,0). Data were tested for normality distribution and variance homogeneity assumptions. All the values were grouped and the means and standard errors were calculated. One-way ANOVA was applied to the all parameters to examine the difference between groups. Differences were considered significant at P<0.05. If the difference between groups was provided to be significant (P<0.05), differences evaluated by Tukey’s test (Dowdy and Wearden, 1981). On the other hand, in non-homogenous groups, differences between means were analyzed by Kruskal Wallis and following Mann Whitney U test between groups one by one (Dawson and Trapp, 2001). Results and Discussion Although there were no statistically differences occurred among all groups, all parameters were found in their reference values. However, effects of lower dose of S.platensis showed the best result for those physiological parameters. The body weight and weight gain values obtained in the study groups were shown in Graphic 1 and 2. respectively. There were no significant differences among all groups according to the weekly periods (p>0.05). At the end of the study, mean live weights of control and research groups were 277.25±13.22, 267.19±8.13 and 274.033±7.84 g. Also, there were no differences in terms of average weight gains among the groups (Graphic 2, p>0.05). The weight gains of rats at the end of the experiment were 118.91 ± 13.60, 121.82 ± 9.93, and 136.23 ± 8.59 g respectively in group control, SP-1 and SP-2. The daha about some physiological and biochemical parameters were given in Table 1 and 2. All parameters were found in normal reference values but interesting in increase of total cholesterol, LDL cholesterol and atherogenic indices. S.platensis have been used for a natural food additive for animal feeding, recently. Most of researchers reported various results of the effects of S.platensis on growth performances. Araújo et al. (2003) studied rats fed by of 5% and 10% S.platensis. It was determined that although there were no statistical differences in growth and feed efficiency, there was an increase in live weight in group fed by 10% S.platensis. This results were similar to our results. Although there were no significant differences in growth parameters statistically in our study, it was observed that weight and weight gain of rats in experimental groups increased in last weeks (Graphic 1). Nevertheless, Heidarpour et al. (2011) had a study with additives of 0, 2, 6, 25 g S.platensis given to ruminants for 15 trial day. They found no differences in weight gain, feed efficiency and daily feed consumption among all groups. Besides that, an other study about growth parameters were detected in fishes which fed by 10%, 20%, 30% and 40% Spirulina, and no statistical differences were observed (Dernekbasi et al., 2010). However, some researchers reported the positive impact of S.platensis on growth metabolism in animals (Grinstead et al., 2000; Peiretti and Meineri, 2008; Moreira et al., 2011). The mechanism of S.platensis on growth and feed efficiency was explained by its inhibiton effect on harmful microorganism in intestinal mucosa (Bhowmik et al., 2009).
The Online Journal of Science and Technology - January 2019 Volume 9, Issue 1
www.tojsat.net Copyright © The Online Journal of Science and Technology 2
0
200
400
Firstweight
1 2 3 4 5 6
wei
ght (
g)
Trial week
Body weight (g)
Control SP-1 SP-2
0255075
100125150
1 2 3 4 5 6 Total
wei
ght g
ain
(g)
Trial week
Body weight gain (g)
Control SP-1 SP-2
Graphic 1. Body weight of rats in Control and Experimental Groups (g). Garphic 2. Body weight gain of rats in Control and Experimental Groups (g). In our study, there were no statistical differences in all hematological parameters among all groups, and also they were in their normal reference values (Table 1; p>0.05). Similary, Simsek et al (2007) determined that S. platensis had no differences in hemaotological parameters such as erytrocytes, haemoglobin, but a statistical decrease in haematocrit value in rats. A study about fish nutrition with S.platensis, researchers found that an increase in erytrocytes and leucokcytes count statistically (Promya and Chimanat, 2011). They reported that S.platensis may stimulate the activities of bone marrow cells and thereby improve the immunity of organism. Also, it was reported that because of the macrophage activity of S.platensis, cellular and humoral immunity and survival rate were improved, especially broilers whose immune system was not sufficiently developed (Qureshi et al., 1996; Hamad et al., 2001). There was no mortality and any diseases were excited during this study as well as the results showed that S.platensis had no negative effect on hematological characteristics. The Lymphocytes were 69,34±1,96 in control, 70,66±0,98 in SP-1 and 76,05±3,17 in SP-2 (p:0,185). Eosinophils were 10,87±1,64, 14,50±1,68 and 13,70±1,63 in groups control, SP-1 and SP-2 respectively (p:0,116). However, leukocytes counts and ratios of monocytes, neutrophil and basophils were not identified exactly. So, they not rated for the research. This result may be due to an allergic reactions of rats or a mistake of analyzer. Besides that, a recent study, it was reported that using automotical methods (hematology analyzers) for count the leucokcyte and leucokcyte substypes may not be suitable for rats (Messias et al., 2017). So, it was neccessary to analyse these parameters by handled method for future researches.
The Online Journal of Science and Technology - January 2019 Volume 9, Issue 1
www.tojsat.net Copyright © The Online Journal of Science and Technology 3

Table 1. Haematological Indices (mean ± SE, n=30).
In addition, S.platensis may inhibit the harmful bacteria in intestine (Bhowmik et al., 2009) and thereby inflammatory agents that secreted by enteric bacteria may affect on globulin synthesis of liver. Some researchers reported different results about effects of Spirulina on protein values. (Bezerra et al., 2009; Moreira et al., 2011; Heidarpour et al., 2011). Although, Moreira et al.(2011) indicated no effect of S. platensis on serum protein levels, Mariey et al.(2012) stated that SP level at 0.2% had a significant increase in plasma total protein, albumin and globulin in laying hens. On the other hand, Bezeria et al. (2009) determined the high serum protein value in lambs fed 0, 5 and 10 g SP. All these researchers suggested that the protein quality and quantity of S. platensis may increase the serum protein level. In recent study, high Spirulina additive showed normal value with control however, in group of lower dose of Spirulina determined insteresting results about cholesterol and its fraction values. All of them are in reference value but interesting in increase of Total cholesterol, LDL cholesterol and atherogenic indices. Total cholesterol (TC) and its fraction, low-density lipoprotein cholesterol (LDL-C), exhibited a rise coupled with a marginal decrease in the level of high-density lipoprotein cholesterol (HDL-C). As a result, increase in the atherogenic indices, TC:HDL-C and LDL-C: HDL-C, was observed. Due to all parameters resulted in their reference value, we can say that different experimental condition or animal may be change the results. However, various studies must be planned for next studies with different aims. Table 2. Biochemical Parameters (mean ± SE, n=30).
Parameters
Groups
Control
Group SP-1 (S. platensis-500mg)
Group SP-2
(S. platensis-1000mg) Cholesterol (mg/dl) 41,18±3,25 51,76±3,4 42,78±2,04 Trygliserid (mg/dl) 107,53±10,87 83,08±12,49 107,41±8,97 Total lipid (mg/dl) 252,19±8,37 257,32±16,07 259,44±5,82 HDL-Cholesterol (mg/dl) 30,89±0,86 25,13±3,16 30,91±2,52 LDLD-Cholesterol (mg/dl) 31,80±3,56 43,25±7,81 33,36±2,52 VLDL-Cholesterol (mg/dl) 21,51±2,17 17,46±2,35 21,48±1,79 LDL/HDL ratio 1,04±0,13 1,46±0,43 1,17±0,17 TC/HDL ratio 1,25±0,07 1,52±0,14 1,43±0,11 Total protein (g/dl) 5,63±0,18 6,06±0,20 5,54±0,08 Albumin (g/dl) 2,36±0,07 2,20±0,07 2,28±0,05 Globulin (g/dl) 3,27±0,21 3,86±0,24 3,27±0,10 Albumin/globulin 0,75±0,07 0,62±0,06 0,70±0,03 Conclusion Good and high quality protein intake from alternative supplements has become important in nowadays. Belong to this issue, researchers attract to attention on the various and natural alternative foods or plants. S. platensis which is an interesting plant among these natural additives has a rich biological content. Nevertheless, all studies about plant additives and the results were indicated the controversial nature effects of S.platensis on weight, weight gain, blood and biochemical parameters.
Parameters
Groups
Control
Group SP-1 (S. platensis-500mg)
Group SP-2
(S. platensis-1000mg) Haematocrit (%) 39,91±1,10 36,55±1,34 34,72±2,34 Haemoglobin (gr/100ml) 15,27±0,35 13,93±0,50 13,34±0,90 Erythrocyte (x106/mm3 ) 7,64±0,19 6,92±0,22 6,71±0,46 Leukocyte (x103/mm3 ) 8,32±0,90 4,73±1,33 10,18±3,97 MCV (fl) 52,22±0,80 52,74±0,62 51,82±0,74 MCH (pg) 20,02±0,24 20,11±0,18 21,99±2,05 MCHC (g/dl) 38,39±0,29 38,14±0,20 34,73±3,77 RDW (%) 15,11±0,34 14,13±0,29 14,34±0,24 PLT (x106 /mm3) 519,83±143,57 573,67±39,37 556,75±171,69
The Online Journal of Science and Technology - January 2019 Volume 9, Issue 1
www.tojsat.net Copyright © The Online Journal of Science and Technology 4
It’s believed that these differences may due to the sexuality of animals, environmental conditions, trial long and also effective doses of S.platensis which have not yet been used. In this study, results showed that long term and high dose of using this microalgae is appropriate for health, but more studies are needed to pointed out the importance of this natural supplement. Acknowledgements This study was supported by grant from the Research Foundations of Namik Kemal University (Project number: NKUBAP.10.GA.16.074). Special thanks are to Eylül Yıldız, Chamza Tsakir and Zumrut Maraz who assisted the study during trial period. References Araújo, K.G.L., Facchinetti, A.D. & Santos, C.P. (2003). Influence of intake of Spirulina biomass on body weight and feed intake in rats. Sci Technology Food, 23(1): 6-9. Becker, E., Jakober, B., Luft, D. & Schmulling, R.M. (1986). Clinical and biochemical evaluations of the alga Spirulina with regard to its application in the treatment obesity. A double blind crossover study. Nutr Rep Int,
33:565-574. Belay, A. (2002). The Potential Application of Spirulina (Arthrospira) as a Nutritional and Therapeutic Supplement in Health Management. In: Houston M (Editor). The Journal of the American Nutraceutical
Association, Scientific Director, Earthrise Nutritionals Inc., California: Calipatria, 5(2):27. Bezerra, L.R., Azevedo Silva, A.M., Azevedo, S.A., Rodrigues, O.G., Azevedo, P.S. & Sousa Mendes, R. (2009). Serum concentrations of proteins and minerals in lambs artificially fed with Spirulina platensis-enriched milk. Acta
Vet Brasíl, 3 (3): 132-137. Bhowmik, D., Dubey, J. & Mehra, S. (2009). Probiotic efficiency of Spirulina platensis - Stimulating growth of lactic acid bacteria. World J Dairy Food Sci, 4(2):160-163. Cheng-Wu, Z., Chao-Tsi, T. & Zhen, Z.T.Y.(1994). The effects of polysaccharide and phycocyanin from Spirulina platensis on peripheral blood and hematopoietic system of bone marrow in mice. Nanjing Univ. China. Pub. in Proc.
of Second Asia Pacific Conf. on Algal Biotech. Univ. of Malaysia. China, 58. Dawson, B. & Trapp, RG. (2001). Basic & Clinical Biostatistics. 3rd Edition, New York: Lange Medical Books/McGraw. Derkenbasi, S., Unal, H., Karayucel, I. & Aral, O. (2010). Effect of Dietary Supplementation of Different Rates of Spirulina ( Spirulina platensis) on Growth and Feed Conversion in Guppy (Poecilia reticulara Peters, 1860).
JAVA, 9(9): 1395-1399. Dogan, M. (2012). Probiyotik Bakterilerin Gastrointestinal Sistemdeki Etki Mekanizması. Gıda Teknolojileri Elektronik Dergisi, 7(1): 20-27. Dowdy, S. & Wearden, S. (1981). Statistics for Research. New York: John Wiley&Sons Press, pp. 262-274. Grinstead, G.S., Tokach, M.D., Dritz, S.S., Goodband, R.D. & Nelssen, J.L. (2000). Effects of Spirulina platensis on growth performance of weanling pigs. Anim Feed Sci Technol, 83: 237–247. Hamad, A.A., Saud, I.A., Ali, A. & Qureshi, M.A. (2001). Enhancement of Chicken Macrophage Phogocytic Function and Nitrite Production by Dietary Spirulina platensis. Immunopharmacol Immunotoxicol, 23(2): 281-289. Hayashi, O., Katoh, T. & Okuwaki, Y. (1994). Enhancement of antibody production in mice by dietary Spirulina platensis. Journal of Nutritional Science and Vitaminology, 40(5):431-41. Heidarpour, A., Fourouzandeh-Shahraki, A.D. & Eghbalsaied, S. (2011). Effects of Spirulina platensis on performance, digestibility and serum biochemical parameters of Holstein calves. AJAR, 6(22): 5061-5065. Kanamaru, Y., Otsuka, A., Hirahashi, T. & Kato, T. (2005). A novel protein cphycocyanin plays a crucial role in the hypocholesterolemic action of Spirulina platensis concentrate in rats. J Nutr, 135: 2425-2430. Mariey, Y.A., Samak, H.R. & Ibrahem, M.A. (2012). Effect of using Spirulına platensis algae as a feed additive for poultry diets: 1- Productive and reproductive performances of local laying hens. Egypt Poult Sci, 32(1): 201-
215. Messias, B.J., Farias, I.P., de Oliveira Messias, I.M., Germano Ramos, A.L. & de Magalhães Caraciolo, M.C. (2017). Automated method and not automated: the evaluation of hematological parameters of rats. R bras Ci Vet,
24(2): 77-80. Moreira, L.M., Rocha, A.S.R., Ribeiro, C.L.G., Rodrigues, R.S. & Soares, L.S. (2011). Nutritional evaluation of single-cell protein produced by Spirulina platensis. AJFS, 5(15):799-805. Nagaoka, S., Shimizu, K., Kaneko, H., Shibayama, F., Morikawa, K., Kanamaru, Y., Otsuka, A., Hirahashi, T. & Kato, T. (2005). A novel protein cphycocyanin plays a crucial role in the hypocholesterolemic action of Spirulina
platensis concentrate in rats. J Nutrition, 135:2425-2430 Nakaya, N., Honma, Y. & Goto, Y. (1988). Cholesterol lowering effect of spirulina. Nutrition Reports Int’l, 37 (6): 1329-1337. NRC. (1995). National Research Council (US) Subcommittee on Laboratory Animal Nutrition. Nutrient
The Online Journal of Science and Technology - January 2019 Volume 9, Issue 1
www.tojsat.net Copyright © The Online Journal of Science and Technology 5

Requirements of Laboratory Animals. 4th Revised Edition, Washington: National Academies Press, pp. 11-79. Peiretti, P.G. & Meineri, G. (2008). Effects of diets with increasing levels of Spirulina platensis on the performance and apparent digestibility in growing rabbits. LIVEST Sci, 118:173-177. Promya, J. & Chimanat, C. (2011). The effects of Spirulina platensis and Cladophora algae on the growth performance, meat quality and immunity stimulating capacity of the African sharptooth catfish (Clarias gariepinus).
IJAB, 13:77-82. Pulz, O. & Gross, W. (2004). Valuable products from biotechnology of microalgae. Appl Microbiol Biotechnol. 65:635-48. Qureshi, M.A., Garlich, J.D. & Kidd, M.T. (1996). Dietary Spirulina platensis enhances humoral and cell- mediated immune function in chickens. Immunopharmacol Immunotoxicol, 18(3): 465-476. Richmond, A. (1992). Mass culture of cyanobacteria. In: Mann N, Carr N. (Editors). Photosynthetic prokaryotes, 2nd Edition, New York: Plenum Press. pp.181-210. Salazar, M., Martinez, E., Madrigal, E., Ruiz, L.E. & Chamorro, G. (1998). Subchronic toxicity study in mice fed Spirulina. J Ethnopharmacol, 62:235-241. Simsek, N., Karadeniz, A., & Karaca, T. (2007). Effects of the Spirulina platensis and Panax ginseng oral supplementation on peripheral blood cells in rats. Revmedvet, 158(10): 483-488. SPSS. Statistical Package for the Social Sciences, SPSS software package for Windows, Version 17.0, Chicago. Vural, T. & Celen, E. (2005). Gastrointestinal Sistemle Dost Mikroorganizmalar ve Probiyotikler. Güncel Gastroenteroloji, 9(3): 115-123. Yazıcı, K. & Kaynak, L. (2001). Deniz Yosunlarının Organik Tarımda Kullanım Olanakları. Türkiye 2. Ekolojik Tarım Sempozyumu, 344-352.
The Online Journal of Science and Technology - January 2019 Volume 9, Issue 1
www.tojsat.net Copyright © The Online Journal of Science and Technology 6

A CASE STUDY OF A GRAVITY WALL LOCATED IN THE FISHING PORT AREA
Aykut EROL, Zülküf KAYA, Erdal UNCUOĞLU, Hacı Bekir KARA Erciyes University, Engineering Faculty, Department of Civil Engineering, Kayseri-Turkey
[email protected], [email protected], [email protected], [email protected]
Abstract: In a technical sense, a gravity wall is defined as any structure that resists soil pressure. The gravity wall is typically a permanent structure constructed in the form of a retaining element for the slope. The advantages of this wall type are that the excavation materials can be used in the walls of these walls, the evaluation of the waste materials and the integrity of nature by adapting to the ground conditions of the weight wall. The gravity wall, which is built between the service road of fishing port and the highway, is about 340 meters in length and varies in height and has a maximum height H = 10.50 meters. During the construction of the road, some parts of the gravity wall which had been built, were collapsed in the form of breakage in the wall as a result of the surcharge load effect caused by mass transfer from the road embankment. Damaged parts of the wall were repaired. In this study, bearing capacity and stability analysis were carried out on the failure cross section (Section-A) which has the height of 5.16 meter along the wall route. GEO5 package program are used in the analyses. The parameters used in analyses were obtained from the laboratory studies and literature. The port area is located in the second degree earthquake zone and the seismic effect was considered in the analysis. Keywords: Gravity Wall, Retaining Structure, Bearing Capacity
Introduction Gravity walls are widely used as earth retaining systems supporting fill slopes adjacent to roads and residential
areas built on reclaimed land (Trandafir, Kamai & Sidle, 2009).
Gravity walls are the most common type of construction for docks because of their durability, ease of construction
and capacity to reach deep seabed levels. The design of gravity walls requires sufficient capacity for three design
criteria; sliding, overturning and allowable bearing stress under the base of the wall. Although the design of gravity
quay walls is reasonably well understood for static loads, analysis under seismic loads is still in being developed
(Alyami et. al., 2007)
One of the advantages of gravity walls is that the waste material can be used during the construction process and
this ensures that the gravity wall is fully integrated into the nature.
In this study, bearing capacity and stability analysis were carried out on the failure cross section (Section-A) which
has the height of 5.16 meter along the wall route.
GEO5 package program is used in the analyses. The parameters used in the analysis were obtained from the
laboratory studies and literature.
Gravity Walls Gravity walls are the earliest known retaining structures. These walls construct from solid concrete or rock roble
mortared together. The lateral forces from backfill is resisted by the weight of wall itself and due to their massive
The Online Journal of Science and Technology - January 2019 Volume 9, Issue 1
www.tojsat.net Copyright © The Online Journal of Science and Technology 7
nature, they develop little or no tension.
The difficulty with retaining walls is that they are often concrete or a similar material which, compared to soil, are
extremely strong. It is not advisable to include the actual strength of the retaining wall in the analysis, due to
potential convergence difficulties. Consider also that failure of retaining walls is usually a result of undercutting
of the retaining wall, not shearing of the concrete itself. For this mode of failure, the strength of the retaining wall
itself becomes inconsequential, but the weight of the wall acting as a stabilizing force is critical.
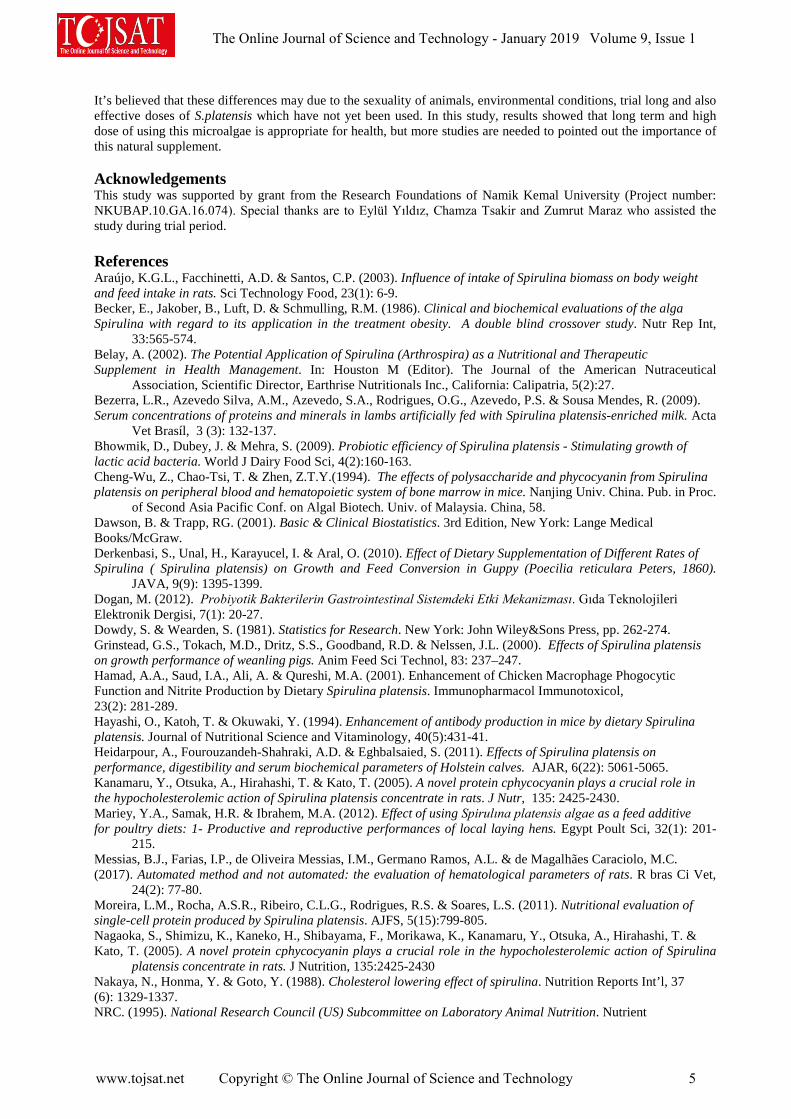
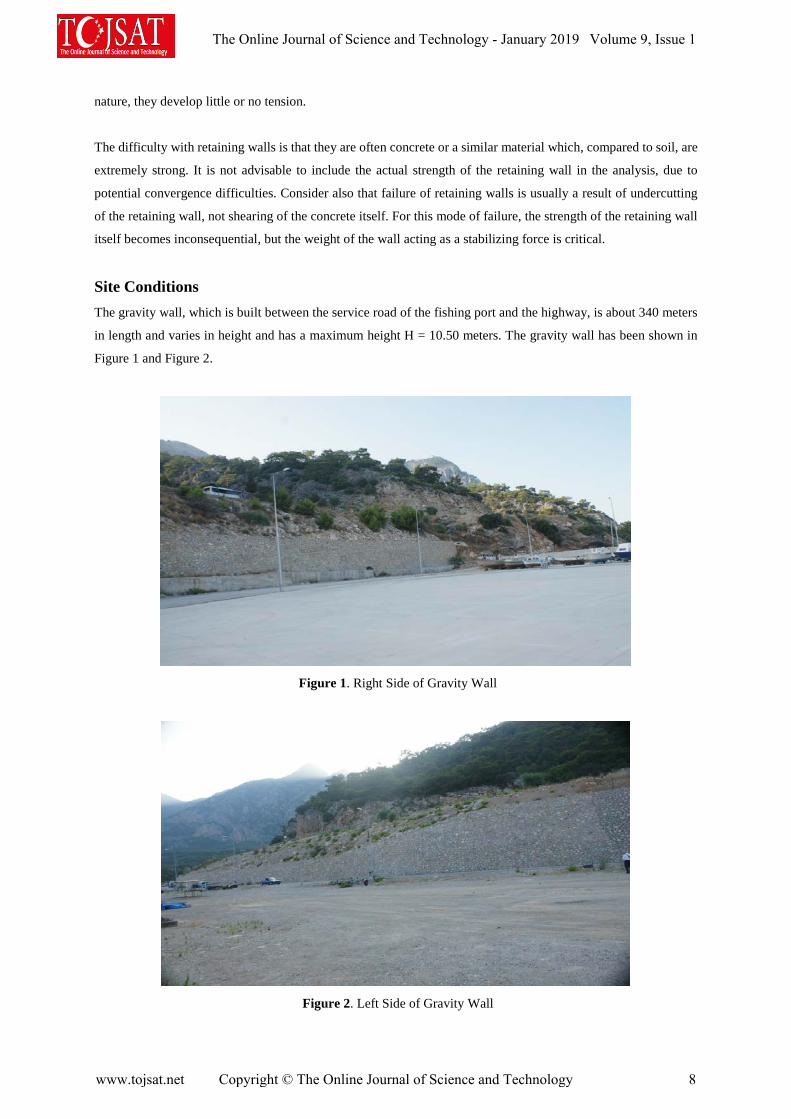
Site Conditions The gravity wall, which is built between the service road of the fishing port and the highway, is about 340 meters
in length and varies in height and has a maximum height H = 10.50 meters. The gravity wall has been shown in
Figure 1 and Figure 2.
Figure 1. Right Side of Gravity Wall
Figure 2. Left Side of Gravity Wall
The Online Journal of Science and Technology - January 2019 Volume 9, Issue 1
www.tojsat.net Copyright © The Online Journal of Science and Technology 8

The soil parameters to be used in numerical analysis are given in Table 1.
Table 1. Soil Parameters Used in Analysis
Soil γ (kN/m³) φ (°) c (kPa)
Soil-I (Behind the Wall) 20.0 37 10
Lime Stone 22.0 35 25
Analysis were carried out under effective stress conditions, assuming that groundwater was not encountered and
necessary drainage precautions are taken.
Highway traffic load is considered as a surcharge pressure of 15 kPa (15 kN/m²) which is effective on embankment.
In analysis of bearing capacity, the bearing capacity value for limestone was taken as 500 kPa.
Figure 3. Section A Used Geo5 Program
Some points (1 to 6) shown in Figure 3.
• Point 1-2 : Soils behind the wall
• Point 3 : Fishing port area service road
• Point 4 : Gravity wall
• Point 5-6 : Limestone
ş
1
2
3
4
5
6
1
2
3
4
5
6
15 kN/m²
The Online Journal of Science and Technology - January 2019 Volume 9, Issue 1
www.tojsat.net Copyright © The Online Journal of Science and Technology 9
Model Analysis The simplified Bishop method neglects the interslices shear forces (Bishop, 1955). The factor of safety equations
is derived by taking moments about the center of rotation. In the other words, the simplified Bishop method
corresponds to the moment equilibrium factor of safety equation. In general, the difference between the simplified
Bishop factor of safety satisfying both force and moment equilibrium, decreases as a particular slip surface has an
increasing planar portion (Fredlund, Krahn & Pufahl, 1981).
As a result of numerical analysis studies made, the factor of safety obtained for overturning and sliding, bearing
capacity and stability are given in Table 2.
When the result of the analysis is evaluated, the factor of safety for section A is greater than the value of 1.50
according to Bishop method. (FS>1.50)
Table 2. Factor of Safety in Numerical Analysis
Analysis Type Factor of Safety
Wall Analysis Overturning Analysis 1.88 > 1.50
Sliding Analysis 1000 > 1.50
Bearing Capacity 1.57 > 1.50
Stability (Bishop-Optimization) 2.19 > 1.50
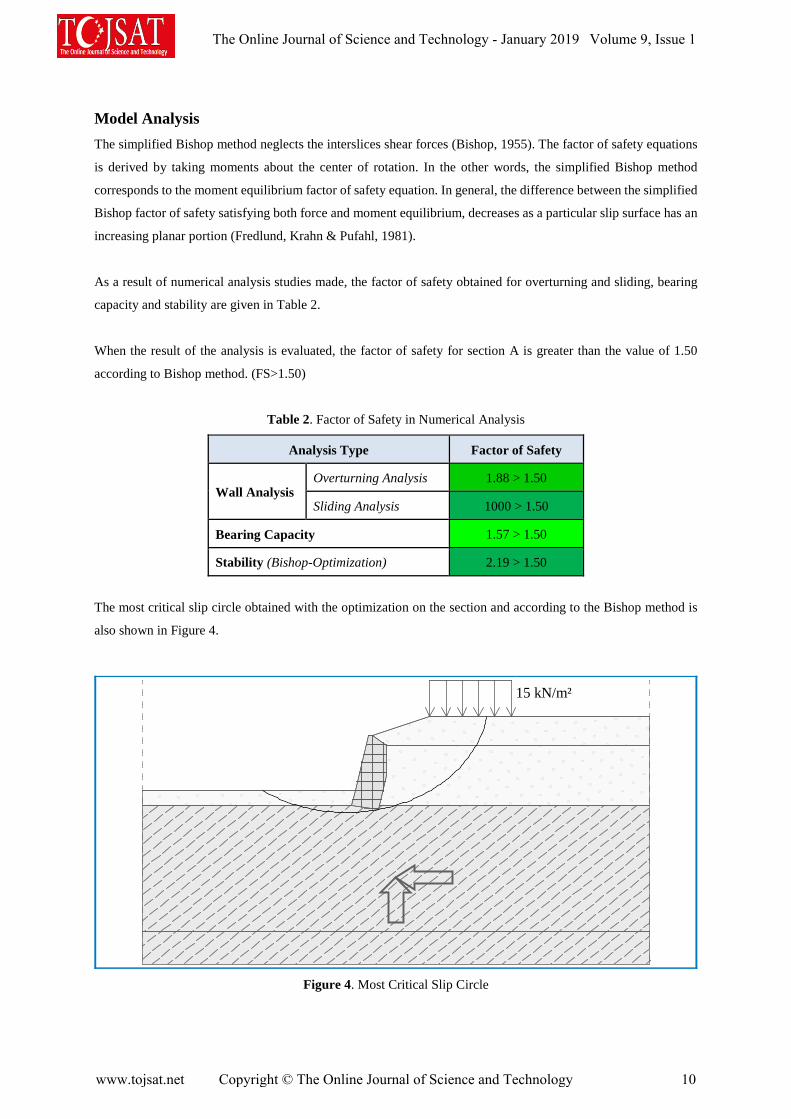
The most critical slip circle obtained with the optimization on the section and according to the Bishop method is
also shown in Figure 4.
Figure 4. Most Critical Slip Circle
15 kN/m²
The Online Journal of Science and Technology - January 2019 Volume 9, Issue 1
www.tojsat.net Copyright © The Online Journal of Science and Technology 10
Conclusion In this study, the factor of safety of the gravity wall were evaluated according to the Bishop method and the critical
slip circle was determined according to numerical analysis. Site conditions and soil profiles were considered in
this study based on literature and site studies.
It has been understood that there are no bearing capacity and settlement problems in the calculations made on the
gravity wall located in the fishing port area. As a result of the numerical analysis, the factor of safety of sufficient
magnitude were obtained in the wall investigations (overturning and sliding), bearing capacity and stability related
to the gravity wall and no problems were observed.
References Alyami, M., Wilkinson, S. M., Rouainia, M., & Cai, F. (2007). Simulation of seismic behaviour of gravity quay
wall using a generalized plasticity model. In Proceedings of the 4th international conference on earthquake
geotechnical engineering, Thessaloniki, Greece.
Bishop, A. W. (1955). The use of the slip circle in the stability analysis of slopes. Geotechnique, 5(1), 7-17.
Fredlund, D. G., Krahn, J., & Pufahl, D. E. (1981). The relationship between limit equilibrium slope stability
methods. In Proceedings of the International Conference on Soil Mechanics and Foundation Engineering
(Vol. 3, pp. 409-416).
Trandafir, A. C., Kamai, T., & Sidle, R. C. (2009). Earthquake-induced displacements of gravity retaining walls
and anchor-reinforced slopes. Soil Dynamics and Earthquake Engineering, 29(3), 428-437.
The Online Journal of Science and Technology - January 2019 Volume 9, Issue 1
www.tojsat.net Copyright © The Online Journal of Science and Technology 11
A COMPARATIVE STUDY OF VARIOUS POROUS ADSORBENTS FOR CO2 ADSORPTION
Fatma OĞUZ ERDOĞAN Kocaeli University, Kocaeli Vocational School, Department of Chemistry and Chemical Processing
Technologies, Kocaeli- TURKEY [email protected]
Abstract: Zeolites, metal organic frameworks (MOFs), carbon nanotubes, polymers, and activated carbons have been commonly used as porous adsorbents for CO2 adsorption. The objective of the study was to prepare low-cost activated carbon from carob stones and compare its adsorption capacities for CO2 with that of commercial mesoporous silica and four zeolites (zeolite, 4A zeolite, ammonium Y and sodium Y zeolites). CO2 adsorption on these porous adsorbents was investigated by using volumetric adsorption apparatus, TriStar II 3020 at room temperature and at pressures up to 900 mmHg. The CO2 adsortion capacities (wt%) were determined using the values of the quantity adsorbed at 900 mmHg. It could be confirmed that chemical activation plays an important role in determining the porous structure and amount of CO2 adsorbed. Keywords: Carob stones, zeolite, 4A zeolite, ammonium Y zeolite, sodium Y zeolite, mesoporous silica, activated carbon.
Introduction Climate change is the result of increasing CO2 and other greenhouse gases (such as CH4, HFCs and F6) emissions. Various technigues (cryogenic separation, absorption and adsorption) for removing CO2 from gas and thus reducing its impact on climate change have been investigated. Adsorption is most commonly used method for the capture and separation of CO2 because of low energy requirements and high adsorption capacity (Liu et al. 2011; Liu et al. 2015; Goel et al. 2016) . Activated carbon, carbon nanotubes, zeolites, mesoporous silica, metal organic frameworks (MOFs), polymers have been commonly used as adsorbents for CO2 adsorption. Activated carbon is produced from variety of raw materials such as cherry stones, apricot stones, cornelian cherry stones, olive stones, wood and coal. Activated carbons can be produced by chemical activation. Chemical activation is a single step method for the preparation of raw material in the presence of chemical agent such as KOH, NaOH, LiOH, ZnCl2 and H3PO4 (Erdogan 2016; Erdogan and Erdogan 2016). There are several study for CO2 adsorption in the literature. Boyjoo et al. (2017) produced activated carbon from Coca Cola® for CO2 adsorption. They found the adsorption capacity of the KOH activated carbon as 5.22 mmol/g. Ramli et al. (2014) investigated the effect of pressure and temperature on the adsorption of CO2 on MCM-41. Sayari et al. (2011) exhibited a high CO2 adsorption capacity 1.55 mmol7g at 55 C. Zeolite like metal organic frameworks with sod and rho topologies have been investigated for CO2 adsorption by Chen et al. (2011). They found the adsorption capacities of sod-zeolite like metal organic framework and rho-zeolite like metal organic framework as 53 and 51 mg/g, respectively. Osler et al. (2017) reported that impregnating chitosan onto multiwalled carbon nanotubes increased their CO2 adsorption capacity by 650%. The main objects of this study are: (i) to study the feasibility of using the activated carbon produced from carob stones as a low-cost adsorbent for CO2 adsorption, (ii) to compare its CO2 adsorption capacity with that of six commercially available typical adsorbents with different porosity and texture, i.e. activated carbon, mesoporous silica and four types zeolites (zeolite, 4A zeolite, ammonium Y and sodium Y zeolites).
Materials and Methods In this study, carob stones were obtained from Antalya in Turkey. The precursor, carob stones were first air dried, then crushed. Then, carob stones were contacted with dilute a 15 vol.% sulfuric acid solution for 12 hours and washed with hot distilled water. Zeolite (Z), 4A zeolite (4AZ), ammonium Y (AYZ) and sodium Y zeolites (SYZ) and mesoporous silica (MCM-41) were purchased from Sigma-Aldrich.
Preparation of the activated carbon: 20 g of dried carob stones (<2 mm) was mixed in a beaker with 200 mL of KOH solution which corresponded to an impregnation ratio of 4:1 (weight of impregnation reagent/weight of carob stones) for 10 hours at 65°C. The mixtures were immersed in the ultrasonic bath for 120 minutes at 65°C and then the impregnated sample was then dried over a night in a moisture oven at 120°C. Then, the impregnated sample was carbonized in a tube furnace (Protherm STF) under N2 flow at a heating rate of 10°C/min up to 700°C for 1 hour. After the activation, the sample was allowed to cool down to the room temperature under N2 flow before its removal from the furnace. The activated sample was washed several times with HCl and hot distilled water to remove residual chemicals until it did not give chloride reaction with AgNO3. The activated sample was dried for 6 hours at 120ºC. Activated sample was stored in a sealed flask and labelled. The pores of activated carbon were
The Online Journal of Science and Technology - January 2019 Volume 9, Issue 1
www.tojsat.net Copyright © The Online Journal of Science and Technology 12

characterized by analysis of N2 adsorption–desorption isotherms at 77 K using Micromeritics ASAP 2020 (Erdogan 2018c).
Characterization of porous adsorbents and CO2 adsorption measurement:The surface physical properties of adsorbents were characterized with an automated gas sorption apparatus (Micromeritics TriStar II 3020 and ASAP 2020) using N2 as adsorbate at -196 °C. Prior to measurements, the porous adsorbents were degassed for 4 hours under vacuum at 300 °C. The BET surface area was calculated using nitrogen adsorption data in the relative pressure (P/P0) range of 0.04 to 0.2. The total pore volume was calculated from the amount of adsorbed nitrogen at P/P0=0.99. The micropore volume of the porous adsorbents was calculated by using the t-method analysis (Erdogan 2017a; 2018a). CO2 adsorption-desorption isotherms of the produced activated carbon and commercially porous adsorbent samples were measured using a Micromeritics TriStar II 3020 instrument, which is a static volumetric apparatus. The equilibrium experiments were conducted at 25 °C and at pressures up to 900 mmHg. The CO2 adsorption capacities were determined using the values of the quantity adsorbed at 900 mmHg.
Results and Discussion The N2 adsorption-desorption isotherms of the activated carbon (AC) is shown in Fig. 1. It can be seen that, activated carbon possessed a combination of type I and type IV isotherms according to IUPAC classification. Appearance of hysteresis loop indicates the presence of mesopores. The isotherm reveals mesoporosity but also strong signs of microporosity
Figure 1.The adsorption-desorption isotherms of activated carbon sample (AC).
0.0 0.2 0.4 0.6 0.8 1.00
100
200
300
400
500
600
Qua
ntity
Ads
orbe
d (c
m3 /g
)
Relative Pressure (P/P0)
The Online Journal of Science and Technology - January 2019 Volume 9, Issue 1
www.tojsat.net Copyright © The Online Journal of Science and Technology 13
Average pore widths and pore volumes were calculated from the nitrogen adsorption isotherm data by t-method analysis. Table 1 gives the values of the BET surface areas, Langmuir surface areas, total pore volumes, micropore volumes and average pore widths which were calculated by using the nitrogen adsorption-desorption data obtained at 77 K. The BET and Langmuir surface areas were found for the AC produced with KOH activation, as 1480.96 and 2288.31 m2/g, respectively. In our previous studies we have reported that the BET surface areas and pore volumes and average pore widths of MCM-41 (Oguz Erdogan and Erdogan 2018), AYZ and SYZ (Erdogan 2018a), Z, 4AZ (Erdogan 2018b). BET surface areas of MCM-41, AYZ, SYZ, Z and 4AZ adsorbents were found as 689.32, 736.92, 766.61, 6.874 and 18.09 m2/g, respectively. Average pore widths for MCM-41 and 4AZ were found as 4.32 ve 19.391 nm, respectively and it was reported that these absorbents have mesoporous structure. Average pore widths for AYZ, SYZ and Z were found as 1.945, 1.918 ve 1.255 nm, respectively and it was reported that these absorbents have microporous structure.
Table 1: Physical characteristics of the activated carbon sample (AC).
BET surface area (m2/g) 1480.96 Langmuir surface area (m2/g) 2288.31 Total pore volume (cm3/g) 0.845 Micropore volume (cm3/g) 0.140 Average Pore Width (nm) 2.283
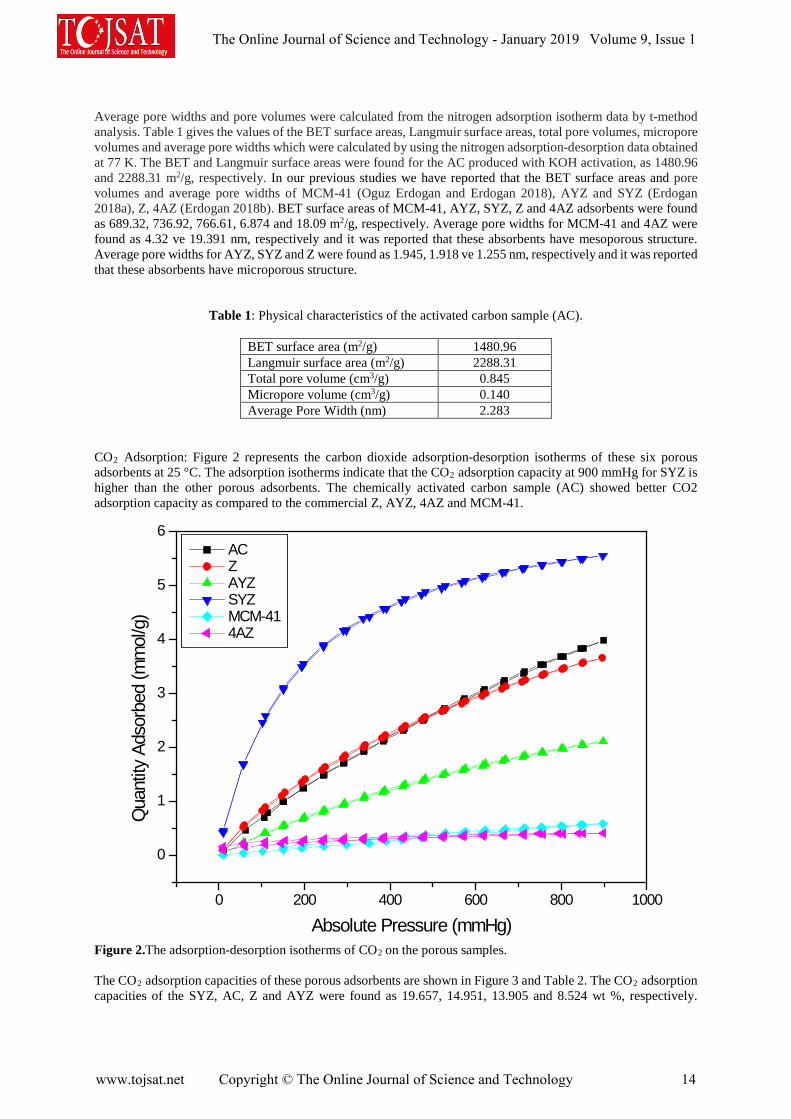
CO2 Adsorption: Figure 2 represents the carbon dioxide adsorption-desorption isotherms of these six porous adsorbents at 25 °C. The adsorption isotherms indicate that the CO2 adsorption capacity at 900 mmHg for SYZ is higher than the other porous adsorbents. The chemically activated carbon sample (AC) showed better CO2 adsorption capacity as compared to the commercial Z, AYZ, 4AZ and MCM-41.
Figure 2.The adsorption-desorption isotherms of CO2 on the porous samples. The CO2 adsorption capacities of these porous adsorbents are shown in Figure 3 and Table 2. The CO2 adsorption capacities of the SYZ, AC, Z and AYZ were found as 19.657, 14.951, 13.905 and 8.524 wt %, respectively.
0 200 400 600 800 1000
0
1
2
3
4
5
6
Qua
ntity
Ads
orbe
d (m
mol
/g)
Absolute Pressure (mmHg)
AC Z AYZ SYZ MCM-41 4AZ
The Online Journal of Science and Technology - January 2019 Volume 9, Issue 1
www.tojsat.net Copyright © The Online Journal of Science and Technology 14

Figure 3.The CO2 adsorption capacity (wt%) collected at 298 K for the AC, Z, AYZ, SYZ, MCM-41 and 4AZ. The CO2 adsorption capacities of the MCM-41and 4A zeolite were found as 2.540 and 1.811 wt %, respectively. The highest CO2 adsorption capacities of 19.657 and 14.951 wt % were achieved with SYZ and AC, respectively. It could be confirmed that KOH activation plays an important role in determining the porous structure and amount of CO2 adsorbed. A similar phenomenon was reported in previous studies (De Andres 2013; Boyjoo et al. 2017).
Table 2: CO2 adsorption capacities (wt%) of porous adsorbents.
Adsorbents CO2 adsorption capacities (wt%) AC 14.951 Z 13.905 AYZ 8.524 SYZ 19.657 MCM-41 2.540 4AZ 1.811
Conclusion We have investigated the adsorption process for CO2 on six typical adsorbent with different texture, surface area and porosity. The CO2 adsorption capacities of the SYZ, AC, Z, AYZ, MCM-41 and 4AZ were found as 19.657, 14.951, 13.905, 8.524, 2.540 and 1.811 wt %, respectively. Microporous zeolites and AC showed higher CO2 adsorption capacities than the mesoporous MCM-41 and 4A zeolite. The CO2 adsorption capacity of commercial 4A zeolite was found to be 1.811wt%, while CO2 adsorption capacity of the KOH activated carbon (AC) was found to be 14.951wt%. This correspound to 8.26 times increase in the CO2 adsorption capacity. The adsorption capacity of activated carbon sample obtained from carob stones for carbon dioxide was higher than the investigated four commercial porous adsorbents. It can be said that chemical activation plays an important role in determining the porous structure and amount of CO2 adsorbed. This study revealed that carob stones based activated carbon can be used as a highly efficient and economically viable adsorbent for carbon dioxide adsorption.
0 200 400 600 800 1000
0
2
4
6
8
10
12
14
16
18
20
22CO
2 Ads
orpt
ion
Capa
city
(wt%
)
Absolute Pressure (mmHg)
AC Z AYZ SYZ MCM-41 4AZ
The Online Journal of Science and Technology - January 2019 Volume 9, Issue 1
www.tojsat.net Copyright © The Online Journal of Science and Technology 15
Acknowledgements The author acknowledges the financial support provided by Kocaeli University Scientific Research Projects Unit. (Project No: 2011/062, 2016/019 HD and 2017/57 HD).
References Boyjoo, Y., Cheng, Y., Zhong, H., Tian, H., Pan, J., Pareek, V.K., Jiang, S.P., Lamonier, J.F., Jaroniec, M., &
Liu, J. (2017). From waste Coca Cola® to activated carbons with impressive capabilities for CO2 adsorption and supercapacitors. Carbon 116, 490-499.
Chen, C., Kim, J., Yang, D.A., & Ahn, W.S. (2011). Carbon dioxide adsorption over zeolite-like metal organic frameworks (ZMOFs) having a sod topology: Structure and ion-exchange effect. Chemical Engineering Journal 168, 3, 21134-1139.
Erdogan, F.O. (2016). Characterization of the activated carbon surface cherry stones prepared by sodium and potassium hydroxide. Analytical Letters 49,7, 1079-1090.
Erdogan, T., & Erdogan F.O. (2016). Characterization of the adsorption of disperse yellow 211 on activated carbon from cherry stones following microwave-assisted phosphoric acid treatment. Analytical Letters 49, 7, 917-928.
Erdogan, F.O. & Erdogan T. (2018). Adsorption of sunset yellow FCF onto MCM-41. The Online Journal of Science and Technology 8, 1, 16-20.
Erdogan, F.O. (2018a). Freundlich, Langmuir, Temkin and Harkins-Jura isotherms studies of adsorption of H2 on porous adsorbents. Chemistry & Chemical Technology, in press.
Erdogan, F.O. (2018b). Freundlich, Langmuir, Temkin, DR and Harkins-Jura isotherm studies of CH4 adsorption on zeolitic and new carbonaceous adsorbents. Macedonian journal of chemistry and chemical engineering, submitted.
Erdogan, F.O. (2018c). Comparative study of sunset yellow dye adsorption onto cornelian cherry stones-based activated carbon and carbon nanotubes. Bulgarian Chemical Communications, in press.
Goel, C., Kaur, H., Bhunia, H., & Bajpai, P.K. (2016). Carbon dioxide adsorption on nitrogen enriched carbon adsorbents: Experimental, kinetics, isothermal and thermodynamic studies. Journal of CO2 Utilization 16, 50-63.
Liu, Z., Grande C.A., Li, P., Yu, J., & Rodrigues, A.E. (2011). Adsorption and desorption of carbon dioxide and nitrogen on zeolite 5A. Separation Science and Technology 46, 434-451.
Liu, Z.S., Peng, Y.H., Huang, C.Y., & Hung M.J. (2015). Application of thermogravimetry and differential scanning calorimetry for the evaluation of CO2 adsorption on chemically modified adsorbents. Thermochimica Acta 602, 8-14.
Osler, K., Twala, N., Oluwasina, O.O., & Daramola, M.O. (2017). Synthesis and performance evaluation of chitosan/carbon nanotube (chitosan/MWCNT) composite adsorbent for post-combustion carbon dioxide capture, in 13th International Conference on Greenhouse Gas Control Technologies, Ghgt-13, T. Dixon, L.Laloui, and S. Twinning, Editors. 2330-2335.
Ramli, A., Sohail, A., & Suzana, Y. (2014). Adsorption behavior of Si-MCM-41 for CO2: Effect of pressure and temperature on adsorption. Chemical Engineering Transactions 39, 271-276.
The Online Journal of Science and Technology - January 2019 Volume 9, Issue 1
www.tojsat.net Copyright © The Online Journal of Science and Technology 16
A NEW PROGRAMMING LANGUAGE
Burak Çakır Kocaeli University, Kocaeli Vocational School, Kocaeli, Turkey
Mustafa OF Kocaeli University, Kocaeli Vocational School, Kocaeli, Turkey
Abstract: Everyone knows that hardware does not mean anything without software. Software is developed by programming languages. One of the most important factors determining the reach of software is the characteristics of the programming language. Many rich applications can be developed with a language that is fast, easy to learn, and has a large library. The aim of this work is to provide information about the Go programming language that a powerful, fast, easy to learn programming language. Go programming language, developed by Google. Many of the deficiencies of traditional programming languages have been eliminated. It appeared in 2009 and 1.0 version was released in 2012. With the Go programming language, fast and sophisticated projects that can work on the web or in a different environment can be produced. It is an open-source programming language that is evident by the notion of rule, flexibility and speed. In a short time, he was among the fastest growing programming languages. Keywords: Programming Languages, Go Programming Language, Software Development, Google, Open Source Software, Web Programming
Introduction The Go language was originally a programming language developed by Google in 2007 by Robert Griesemer, Rob Pike and Ken Thompson. It is a static written language and has a syntax similar to that of C programming language. It provides many advanced built-in types such as garbage collection, type security, dynamic typing, variable-length arrays, and key-value maps. It also provides a rich standard library. The Go programming language was launched in November 2009 and is used in some of Google's systems.
Google, a large technology and company, for years C, C ++, Java, Python and so on. It uses many different programming languages. These technologies have advantages and disadvantages. You may not notice them in small or under-load projects, but they appear in large projects. These are performance, compilation (in large projects may take hours to compile the source code) security, compliance, time management, resources (hardware, money, energy, etc.) can be listed in many headings such as management. For many years, Google has developed both an operating system for internal systems and many technologies and algorithms to solve many problems like these. Go programming language is one of them. The Go programming language has been initiated by Google to solve its problems. Therefore, all features added to or not added to the Go are completely determined by the software experiences of the years. If you look at the Go programming language a little bit, you might see a question like yok “Why not generics?”. The answer of this question from the developer team to summarize; Generics are not fast. The point of view of Go is so clear. The goal is to create a flexible, fast and powerful language with little language capability and rule. In this article, basic features of Go programming language will be explained. The ease of bringing to the software world will be discussed. Sample codes will be explained. GoLang, which is a fast language, will be examined with its basic lines. Go programming language has many similarities to the C programming language.
1. Features of Go Programming LanguageMost important features of Go programming language are listed;
• Compile time is fast.• Support for environment adopting patterns similar to dynamic languages. For example, type inference (b
:= 10 is valid declaration of a variable b of type int)• GoLang programs are simple and safe.• Support for Interfaces and Type embedding.• GoLang is object oriented
The Online Journal of Science and Technology - January 2019 Volume 9, Issue 1
www.tojsat.net Copyright © The Online Journal of Science and Technology 17

To keep the GoLang simple, the following features commonly available in other similar languages are omitted in GoLang;
• Type inheritance • Method or operator overloading • Circular dependencies among packages • Pointer arithmetic • Generic programming
2. Create, Compile Go Programs A Go program lines length can vary from 4 lines to millions of lines. It should be written into one or more text files with the extension ".go". For example, firstapp.go. You can create a Go program use Notepad or Notepad++ in Windows, Nano in Linux, TextEdit in macOS etc. Other, you have to download Go compiler software. You can download golang.org for your operating systems. A compiler is computer software that transforms computer code written in one programming language (the source language) into another programming language (the target language). Compilers are a type of translator that supports digital devices, primarily computers. The name compiler is primarily used for programs that translate source code from a high-level programming language to a lower level language (e.g., assembly language, object code, or machine code) to create an executable program. Now Go Compiler stable version is 1.11. You can download Go compiler from this address: https://golang.org/dl/ Go compiler list (As Operating System): Windows, Linux, macOs, FreeBsd Install Compiler on Windows; After download Go compiler, run “setup”. Compiler will be install to “Go” folder. Setup software will be make all of go environment. You can verify installation Go compiler. Open command line (Cmd) You are ready to create Go programs in Windows. Install Compiler on Linux; $ wget https://dl.google.com/go/go1.11.src.tar.gz $ sudo tar -xvf go1.11.src.tar.gz $ sudo mv go /usr/local Prepare Go Environment; GOROOT is the location where Go package is installed on your system. $ export GOROOT=/usr/local/go GOPATH is the location of your work directory. For example my project directory is ~/GoProjects $ export GOPATH=$HOME/GoProjects Now set the PATH variable to access go binary system wide. $ export PATH=$GOPATH/bin:$GOROOT/bin:$PATH You can verify installation Go compiler. Open command line (Cmd) $ go version go version go1.11 linux/amd64 You are ready to create Go programs in Linux. 3. Go Programming Language Rules In a Go program, the line separator key is a line terminator. That is, individual statements don't need a special separator like “;” in C. fmt.Println(“Hello Students”) fmt.Println(“Go is Wonderful”) Comments; Comments are helping texts in your Go program. These lines are not compiled. In a Go program comments character are “/* */”. /* These lines are comments */ Identifiers; Go identifiers is a name used to identify a variable, function or any user defined item. It must start with a letter (A-Z) or underscore ( _ ) . It can follow any digits (0-9) Example;
The Online Journal of Science and Technology - January 2019 Volume 9, Issue 1
www.tojsat.net Copyright © The Online Journal of Science and Technology 18

section, section1, section2, _oursection section1 = “Computer” section2 = “Accounting” There is not in identifier any punctuation characters. (@,$, %) Go programming language is a case-sensitive language. For example “School” and “school” are different. School = “Kocaeli University” school = “Istanbul University” Conclusions The Go programming language is quite simple and comfortable. It is completely open source. It has a fast compilation structure. Provides increased speed of operation with large data. The standard library is wide. Go programing language is a good choice for programmers who are looking for a new programming language. This article describes the basic characteristics of Go programming language. This language will provide a basis for new programmers. References Donovan, A. A., Alan, Kernighan B., W., The Go Programming Language, 2009, New Jersey, United States Of
America https://www.xenonstack.com/blog/updates/dependency-management-package-golang/, (Access Date :
14.09.2018) https://making.pusher.com/my-5-favourite-features-of-go-and-how-to-use-them/, (Access Date : 18.09.2018) https://en.wikipedia.org/wiki/Compiler (What is Compiler), (Access Date : 20.09.2018) https://golang.org/doc/, (Access Date : 20.09.2018) https://tecadmin.net/install-go-on-ubuntu/, (Access Date : 21.09.2018) http://9p.io/sources/contrib/ericvh/go-plan9/doc/go_talk-20091030.pdf, (Access Date : 22.09.2018)
The Online Journal of Science and Technology - January 2019 Volume 9, Issue 1
www.tojsat.net Copyright © The Online Journal of Science and Technology 19

A NUMERICAL STUDY USING MIXTURES OF WATER - ETHYLENE GLYCOL BASED NANOFLUIDS ON LAMINAR HEAT
TRANSFER OF AN ANNULUS
Elif Büyük ÖĞÜTKocaeli University, Hereke MYO, 41800 Hereke, Kocaeli
Koray ÖZDEMİRKocaeli University Institute of Science, Kocaeli
Halil İbrahim SARAÇ Kocaeli University, Mechanical Engineering Department, Kocaeli
Abstract: In this study, developing laminar flow and heat transfer behaviour of ethylene glycol (EG) and water mixture based SiO2 nanofluids in an annulus have been numerically investigated. A constant heat flux was applied to the inner walls of the annulus with 100 W / m2. Water 100% - EG 0%, water 50% - EG 50% and water 0% - EG 100% mixtures have been utilized as the basefluids. SiO2 nanoparticles have been used with d = 20 nm and volume fractions ϕ =0%-4%. TheReynolds number varies from 200 to 1000. The physical model of the test section mainly consistsof two concentric horizontal cylinders that form an annular space ranging from twointerconnected elliptical tubes with axis ratio (r1/r2=1/2) placed at the centre of a circular cylinderwith major radius of 2r2 with the length of 1 m. Governing equations have been solved with AnsysFluent programme. The velocity distribution, temperature contours, average Nusselt number andthermal-hydraulic performance have been analysed and presented. The effects of nanofluids havebeen examined on heat and flow fields and it has been observed that the heat transfer increasestogether with the nanoparticle volume concentration. When the nanofluid is used in a forcedconvection, the amount of heat transfer increases as the Reynolds number increases. The highestvalue of the average Nusselt number was obtained in the EG based nanofluid with ϕ=4% andRe=1000 as 29.14, and the lowest value was obtained in the water-based nanofluid with ϕ=4%and Re=200 as 5.61. Results show that the use of nanofluid in the annulus channel increases thethermal performance of systems.
Key words: Elliptic annulus, heat transfer, nanofluid, CFD.
Introduction Heat transfer describes the exchange of thermal energy, between physical structures relying at the temperature and pressure, by means of dissipating heat. The essential modes of heat transfer are conduction, convection and radiation. Engineers also consider the transfer of mass of differing chemical species, either cold or hot, to attain heat transfer. Convection is concerned with the transfer of thermal energy in a moving fluid (liquid or gas). It’s far ruled by means of two phenomena: the movement of energy because of molecular vibrations and the massive-scale movement of fluid particles (2018). In preferred, convection is of sorts, forced convection and free convection. Forced convection takes place while a fluid is forced to flow. For example, a fan blowing air over a heat exchanger is an instance of forced convection. In free convection, the majority fluid movement is due to buoyancy effects. As an example, a vertical heated plate surrounded by using quiescent air causes the air surrounding it to be heated. Due to the fact hot air has a decrease density than cold air, the hot air rises. The void is crammed by using cold air and the cycle continues. Mixed convection heat transfer exists whilst natural convection currents are the identical order of importance as pressured flow velocities. The time period “mixed Convection” is also used, and the flows may be inner or external to a bounding floor (Joye, 2003). Annular pipe flow is regularly encountered in engineering applications which includes heat exchangers, combustion systems, and drilling operations inside the oil and gas industry. Furthermore, annular pipe flow gives a perception into the trouble of turbulent flows with curved walls. Commonly, flow in a flat channel generates a symmetrical velocity profile and makes the positions of zero shear stress and most velocity coincident. However, the flow in a concentric annular channel does not result in a symmetric velocity profile. The asymmetric velocity profiles end result from the interaction of flow zones with different Reynolds numbers primarily based at the outer and inner cylinder radii. In the case of annular pipe flow, boundary layers exist and each has a different distribution of turbulent quantities. Furthermore, pipe and channel flows are the restricting cases of annular pipe flow. For a high radius ratio, the
The Online Journal of Science and Technology - January 2019 Volume 9, Issue 1
www.tojsat.net Copyright © The Online Journal of Science and Technology 20

profiles of turbulent quantities near the internal cylinder are just like those of the turbulent channel flow approximately a cylinder in axial go with the flow. Alternatively, the profiles near the outer wall are similar to those of turbulent pipe flow. Notwithstanding the importance of the hassle, the numerical simulation of turbulent pipe flow has received less interest than plane channel flow due to the numerical difficulties in precisely treating curved geometries (Ghaffari Motlagh, Ahn, Hughes, & Calo, 2013). Conceptually, investigation of the heat transfer enhancement in annuluses is vital. The heat transfer enhancement technology has been stepped forward and broadly used inside the heat exchanger applications. One of the extensively used heat transfer enhancement technique is placing distinct fashioned elements with unique geometries in channel flow (Khaled, 2007; Mokhtari Moghari, Akbarinia, Shariat, Talebi, & Laur, 2011; Shoji, Sato, & Oliver, 2003; Zimparov, 2001). The tubes of elliptic cross section have drawn precise interest due to the fact that they were determined to create less resistance to the cooling fluid which ends up in less pumping power (Velusamy, Garg, & Vaidyanathan, 1995). Velusamy and Garg (Velusamy & Garg, 1996) have studied mixed and forced convection fluid flow in ducts with elliptic and circular cross sections. They found that irrespective of the value of the Rayleigh range, the ratio of friction issue at some stage in mixed convection to the corresponding value at some stage in forced convection is low in elliptical ducts in comparison to that in a circular duct in addition to the ratio of Nusselt quantity to friction factor is higher for elliptic ducts in comparison to that for a circular duct. Notwithstanding the truth that the secondary flow in elliptical ducts is very small compared to the move sensible bulk flow, secondary motions play a substantial role by means of cross-flow moving momentum, heat and mass. On the other hand, the principle benefit of the use of elliptic ducts than circular ducts is the boom of heat transfer coefficient (Sakalis, Hatzikonstantinou, & Kafousias, 2001). As a result, heat transfer enhancement in these devices is crucial, nanofluids usage may be play powerful roles to increase heat transfer coefficient. in the course of the beyond decade technology to make particles in nanometre dimensions changed into progressed and a new type of strong–liquid mixture this is referred to as nanofluid, was seemed (Choi, S. U. S., n.d.). The nanofluid is an increase form of fluid containing small quantity of nanoparticles (usually less than 100 nm) which might be uniformly and stably suspended in a liquid. The dispersion of a small amount of solid nanoparticles in conventional fluids inclusive of water or EG modifications their thermal conductivity remarkably. Thermal conductivity of nanofluids has been measured through several authors with specific nanoparticle extent fraction, material and dimension in several base fluids and all findings show that thermal conductivity of nanofluid is higher than the bottom fluids. Among them, Lee et al. (Lee, Choi, Li, & Eastman, 1999) established that oxide ceramic nanofluids including CuO or Al2O3 nanoparticles in water or ethylene-glycol show off more advantageous thermal conductivity. As an instance, the usage of Al2O3 nanoparticles having suggested diameter of thirteen nm at 4.three% quantity fraction expanded the thermal conductivity of water below stationary conditions via 30% (Masuda, Ebata, & Teramae, 1993). However, large particles with an average diameter of 40 nm led an increase of less than 10% (Choi, S. U. S., n.d.)Distinctive ideas were proposed to provide an explanation for this enhancement in heat transfer. Xuan and Li (Xuan, 2000) and Xuan and Roetzel (Xuan & Roetzel, 2000) have recognized two reasons of improved heat transfer with the aid of nanofluids: the increased thermal dispersion because of the chaotic motion of nanoparticles that accelerates energy exchanges inside the fluid and the enhanced thermal conductivity of nanofluid. Then again, Keblinski et al. (Keblinski, Phillpot, Choi, & Eastman, 2002) have studied 4 possible mechanisms that contribute to the increase in nanofluid heat transfer: Brownian motion of the particles, molecular-stage layering of the liquid/particle interface, ballistic heat transfer in the nanoparticle and nanoparticle clustering. Similarly to Wang et al., (Wang, Xu, & Choi, 1999) they showed that the effects of the interface layering of liquid molecules and nanoparticles clustering could offer paths for speedy heat transfer. These days, Izadi et al. (Izadi, Behzadmehr, & Jalali-Vahid, 2009) studied the hydrodynamic and thermal behaviours of an Al2O3/water nanofluid flowing through an annulus underneath a laminar glide regime. In their observe, a single-section version was used for nanofluid simulation. The effects indicated that the particle volume concentration has no considerable effect on the dimensionless axial speed, however affects the temperature subject and increases the heat transfer coefficient. Mirmasoumi and Behzadmehr (Mirmasoumi & Behzadmehr, 2008) investigated the laminar mixed convection heat transfer of Al2O3/water nanofluid flowing thru a horizontal tube numerically. A two-phase aggregate model was used to explain the hydrodynamic and thermal behaviour of the nanofluid. The numerical results indicated that inside the completely developed region the particle concentration has insignificant results on the hydrodynamic parameters, whilst it has crucial results at the thermal parameters. Furthermore, the consequences showed that nanoparticle concentration is higher at the lowest of the take a look at tube and on the close to wall region. However, Akbarinia (Akbarinia, 2008) and Akbarinia and Behzadmehr (Akbarinia & Behzadmehr, 2007) numerically investigated the fully developed laminar mixed convection of Al2O3/water nanofluid flowing through a horizontal curved tube. In their research, 3-dimensional elliptic governing equations were used. The results of the buoyancy pressure, centrifugal pressure and particle concentration on the heat transfer performance have been provided. The results confirmed that the particle concentration has no direct impact on the secondary flow, axial velocity and pores and skin friction coefficient. However, while the buoyancy pressure is more important than the centrifugal pressure, the impact of particle concentration at the entire fluid temperature can affect the hydrodynamic parameters. Furthermore, the consequences also indicated that the buoyancy force decreases the Nusselt number while the
The Online Journal of Science and Technology - January 2019 Volume 9, Issue 1
www.tojsat.net Copyright © The Online Journal of Science and Technology 21

particle concentration has a high quality impact on the heat transfer enhancement and on the skin friction reduction. In this paper, a numerical investigation on heat transfer performance and flow fields of different nanofluids flows through elliptic annulus in a laminar and turbulent flow regimes. The three-dimensional continuity, Navier–Stokes and energy equations are solved by using finite volume method (FVM) and the SIMPLE algorithm scheme is applied to examine the effects of laminar and turbulent flow on heat transfer characteristics. Dawood et al (Dawood, Mohammed, Sidik, & Munisamy, 2015) evaluated the effects of four different types of nanoparticles, Al2O3, CuO, SiO2 and ZnO, with different volume fractions (0.5–4%) and diameters (25–80 nm) under constant heat flux boundary condition using water as a base fluid The Reynolds number of laminar flow was in the range of 200 ≤ Re ≤ 1500, while for turbulent flow it was in the range of 4000 ≤ Re ≤ 10,000. The results have shown that SiO2–water nanofluid has the highest Nusselt number, followed by ZnO–water, CuO–water, Al2O3–water, and lastly pure water. They showed that the Nusselt number for all cases increases with the volume fraction but it decreases with the rise in the diameter of nanoparticles. In all configurations, the Nusselt number increases with Reynolds number. In their study, it is found that the glycerine–SiO2 shows the best heat transfer enhancement compared with other tested base fluids.
As seen in those and/or similar works, heat transfer mechanisms in annulus can be very complicated and this geometry might be regarded in many commercial set up. Consequently, the existing work targets to investigate some behaviours of nanofluid flow in an elliptic annulus. As a result, the results of volume fraction and specific base fluids comprised of water and ethylene glycol mixtures on the thermodynamics and hydrodynamics parameters of a 3-D laminar forced convection through an elliptic concentric annulus were studied. Effect of water and ethylene glycol volume fractions were addressed as EG fractions ranges from 0% to 100% with a 50% increment. This research covers Reynolds range within the range of 200 ≤ Re ≤ 1000 (laminar) with a diameter of 20 nm silicon oxide (SiO2) nanoparticle. Different volume fractions SiO2 nanoparticles within the base fluids ranged from 0% to 4% were also considered. Outcomes of pursuits which include Nusselt wide variety for laminar forced convection heat transfer in an elliptic annulus were stated to illustrate the impact of nanofluids on these parameters.
Physical Model
The physical model of the test section mainly consists of two concentric horizontal cylinders used to form an annular space ranging from an integrated double elliptical tube placed at the center of a circular cylinder. The outer cylinder was made from aluminium of 20 mm outer diameter, 1 mm thickness, and 500 mm length. The inner elliptic cylinder was made of aluminium with a major radius (r2) of 10 mm and a length of 500 mm that had an axis ratio (r1/r2=1/2). The internal wall of the annular space (elliptic tube surface) was maintained under constant heat flux (qh).Whereas the external wall of the annular space (circular cylinder surface) was kept insulated (Tc). The schematic diagram of the annular space under consideration and coordinate system are shown in Figure 1.
Figure 1. Schematic diagram of the computational domain of annulus.
Pure water, pure ethylene glycol (EG) and water and EG mixtures as the base fluids are selected and the thermophysical properties assumed to be temperature independent. The thermo-physical properties of base fluids and SiO2 nano particle material used for simulation are shown in Table 1.
r1 r2
R
L
The Online Journal of Science and Technology - January 2019 Volume 9, Issue 1
www.tojsat.net Copyright © The Online Journal of Science and Technology 22

Table 1: The thermophysical properties of different nanoparticles and different base fluids at T = 300 K.
Thermo-physical property Unit 100%W-
0%EG 50%W-50%EG
0%W-100%EG SiO2
Density, ρ kg/m3 997,1 1071,1 1132 2200 Specific heat, cp J/kgK 4180 3300 2349 703
Dynamic viscosity, µ kg/ms 0,0009 0,0034 0,0151 - Thermal conductivity, k W/mK 0,613 0,37 0,258 1,2
Thermal expansion coefficient, β
1/K 0,00021 0,00039 0,00057 0,0000055
Geometry and the governing equations The phenomenon under consideration is governed by the steady three-dimensional form of the continuity; the time-averaged incompressible Navier–Stokes equations and energy equation are used to describe the heat transfer in the annuals. Heat is transferred between the fluids through the wall which is separating them. Several assumptions were made on the operating conditions of the annulus: (i) the annulus operates under steady-state conditions and three-dimensional; (ii) the nanofluid is Newtonian and incompressible; (iii) the fluid is in single phase and the flow is laminar; (iv) the external heat transfer effects are ignored; (v) the outer walls of the annulus are adiabatic; and (vi) constant thermophysical properties are considered for the nanofluid.
The governing equations for flow and heat transfer in the annulus are as follows (Edition, Ashgriz, & Mostaghimi, 2002):
Continuity equation:
∂ρ∂t
+∇∙(ρv)=0 (1)
Momentum equation:
ρDvDt
=∇∙τİJ-∇p+ρF (2)
Energy equation:
ρDeDt
+ρ∙(∇v)=∂Q∂t
-∇∙q+Φ (3)
Where v is the fluid velocity vector, F is the body forces, q represents heat transfer by conduction and Φ is the dissipation term. These governing equations along with the given boundary conditions are solved to obtain the fluid temperature distribution and pressure drop along the annulus. These data were then used to examine the thermal and flow fields along the annulus.
Boundary conditions
At the elliptic inlet, different velocities depending on the values of Reynolds number were used, and the outlet temperature was taken as Tin = 300 K. The constant heat flux used was 100 W/m2 to heat up the inside walls. At the domain outlet the flow and heat transfer are assumed to be fully developed. The boundary condition can be expressed as follows:
At the inlet of annulus:
ur=uθ=uz=0 and T=Tin (4)
At the fluid wall interface:
The Online Journal of Science and Technology - January 2019 Volume 9, Issue 1
www.tojsat.net Copyright © The Online Journal of Science and Technology 23
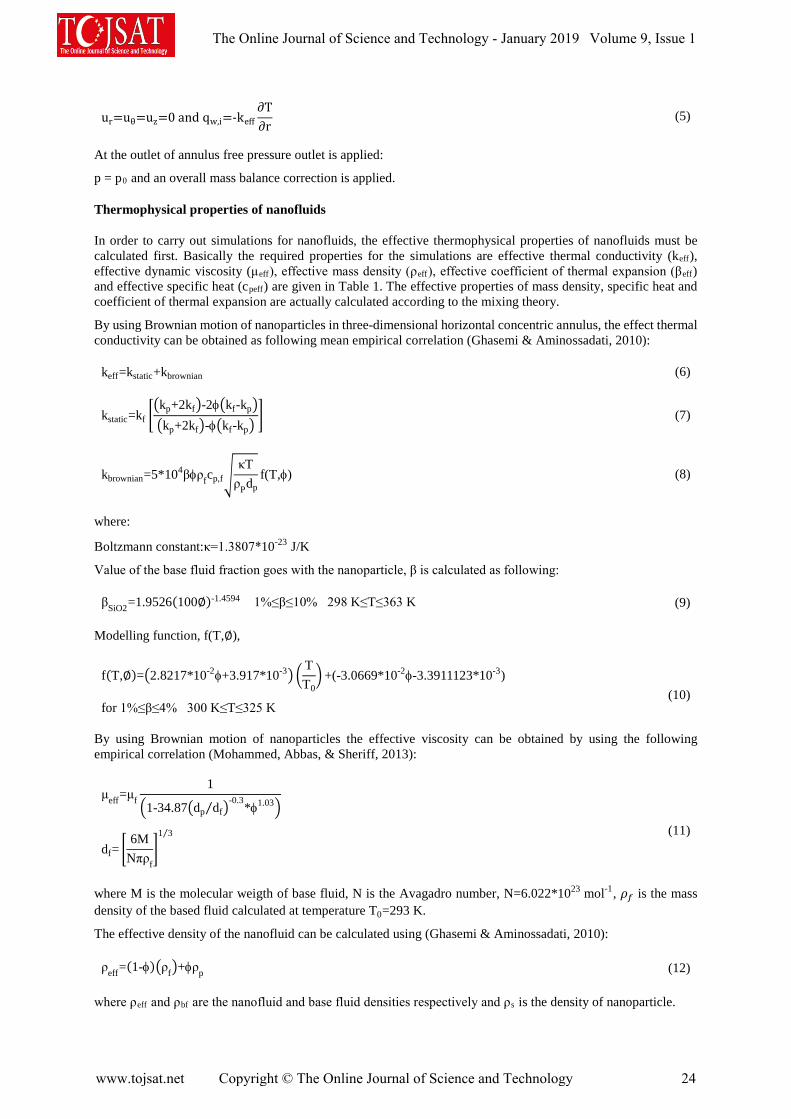
ur=uθ=uz=0 and qw,i=-keff∂T∂r
(5)
At the outlet of annulus free pressure outlet is applied:
p = p0 and an overall mass balance correction is applied.
Thermophysical properties of nanofluids
In order to carry out simulations for nanofluids, the effective thermophysical properties of nanofluids must be calculated first. Basically the required properties for the simulations are effective thermal conductivity (keff), effective dynamic viscosity (μeff), effective mass density (ρeff), effective coefficient of thermal expansion (βeff) and effective specific heat (cpeff) are given in Table 1. The effective properties of mass density, specific heat and coefficient of thermal expansion are actually calculated according to the mixing theory.
By using Brownian motion of nanoparticles in three-dimensional horizontal concentric annulus, the effect thermal conductivity can be obtained as following mean empirical correlation (Ghasemi & Aminossadati, 2010):
keff=kstatic+kbrownian (6)
kstatic=kf ��kp+2kf�-2φ�kf-kp��kp+2kf�-φ�kf-kp�
� (7)
kbrownian=5*104βφρfcp,f�κT
ρPdpf(T,φ) (8)
where:
Boltzmann constant:κ=1.3807*10-23 J/K
Value of the base fluid fraction goes with the nanoparticle, β is calculated as following:
βSiO2=1.9526(100∅)-1.4594 1%≤β≤10% 298 K≤T≤363 K (9)
Modelling function, f(T,∅),
f(T,∅)=�2.8217*10-2φ+3.917*10-3� �TT0�+(-3.0669*10-2φ-3.3911123*10-3)
for 1%≤β≤4% 300 K≤T≤325 K
(10)
By using Brownian motion of nanoparticles the effective viscosity can be obtained by using the following empirical correlation (Mohammed, Abbas, & Sheriff, 2013):
μeff=μf1
�1-34.87�dp df⁄ �-0.3*φ1.03�
df= �6M
Nπρf�
1 3⁄
(11)
where M is the molecular weigth of base fluid, N is the Avagadro number, N=6.022*1023 mol-1, 𝜌𝜌𝑓𝑓 is the mass density of the based fluid calculated at temperature T0=293 K.
The effective density of the nanofluid can be calculated using (Ghasemi & Aminossadati, 2010):
ρeff=(1-φ)�ρf�+φρp (12)
where ρeff and ρbf are the nanofluid and base fluid densities respectively and ρs is the density of nanoparticle.
The Online Journal of Science and Technology - January 2019 Volume 9, Issue 1
www.tojsat.net Copyright © The Online Journal of Science and Technology 24
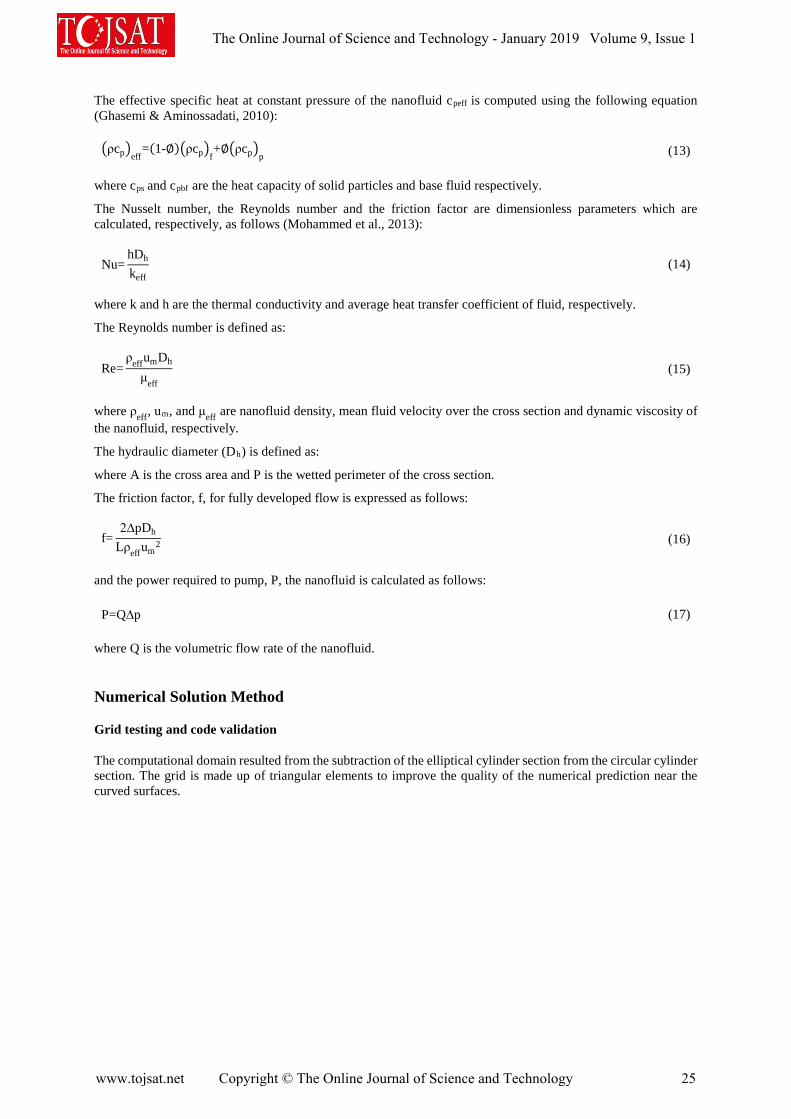
The effective specific heat at constant pressure of the nanofluid cpeff is computed using the following equation (Ghasemi & Aminossadati, 2010):
�ρcp�eff=(1-∅)�ρcp�f
+∅�ρcp�p (13)
where cps and cpbf are the heat capacity of solid particles and base fluid respectively.
The Nusselt number, the Reynolds number and the friction factor are dimensionless parameters which are calculated, respectively, as follows (Mohammed et al., 2013):
Nu=hDh
keff (14)
where k and h are the thermal conductivity and average heat transfer coefficient of fluid, respectively.
The Reynolds number is defined as:
Re=ρeffumDh
μeff (15)
where ρeff, um, and μeff are nanofluid density, mean fluid velocity over the cross section and dynamic viscosity of the nanofluid, respectively.
The hydraulic diameter (Dh) is defined as:
where A is the cross area and P is the wetted perimeter of the cross section.
The friction factor, f, for fully developed flow is expressed as follows:
f=2∆pDh
Lρeffum2 (16)
and the power required to pump, P, the nanofluid is calculated as follows:
P=Q∆p (17)
where Q is the volumetric flow rate of the nanofluid.
Numerical Solution Method
Grid testing and code validation
The computational domain resulted from the subtraction of the elliptical cylinder section from the circular cylinder section. The grid is made up of triangular elements to improve the quality of the numerical prediction near the curved surfaces.
The Online Journal of Science and Technology - January 2019 Volume 9, Issue 1
www.tojsat.net Copyright © The Online Journal of Science and Technology 25

Figure 2. Computational grid of the elliptic annulus.
As shown in Figure 2 the computational grid of the elliptic annulus, built through the mesh generation, three grids types with elements count 153636, 1164822 and 8846771 show no much difference in the values of average Nusselt number and average fanning friction factor. Thus, the grid with 153636 elements is selected in this study as it is found to provide a more stable grid independent solution and due to the fact that resulting in a lower computational cost.
The code validation was done based on the geometry and boundary conditions which were used by (Shah & London, 1978). They studied the thermal characteristics of laminar and turbulent convection heat transfer in a concentric annulus with constant heat flux boundary condition. In this case, the results of the Nusselt number variation were compared with the predictions of the following well-known Shah equation for laminar flows under the constant heat flux boundary condition in the fully developed region as shown in Figure 3. To validate the accuracy of the numerical solutions, the Nusselt number (Nu) and the friction factor times Reynolds number (fRe) of the concentric annular is compared with the theoretical data. It is clearly seen that the deviation between the numerical results and the theoretical data is very low. Therefore, the present numerical predictions have reasonable accuracy.
Figure 3. Model comparison Nu (upper) and fRe (lower)
Numerical implementation A numerical steady-state simulation of the flow field through 3D elliptic concentric annulus is considered to investigate and solve complex fluid flow and heat transfer model. The commercial available CFD software, FLUENT was used to solve the governing equations of continuity, momentum and energy. The numerical computations were performed by solving the governing conservations along with the boundary conditions using the finite volume method (FVM). It is based on the control volume method; COUPLED algorithm is used to deal with the problem of velocity and pressure coupling. The pressure staggering option (second order) scheme is used to solve pressure equations. The diffusion term in the momentum and energy equations was approximated by second-order central difference which gives a stable and more accurate solution. In addition, a second-order
The Online Journal of Science and Technology - January 2019 Volume 9, Issue 1
www.tojsat.net Copyright © The Online Journal of Science and Technology 26
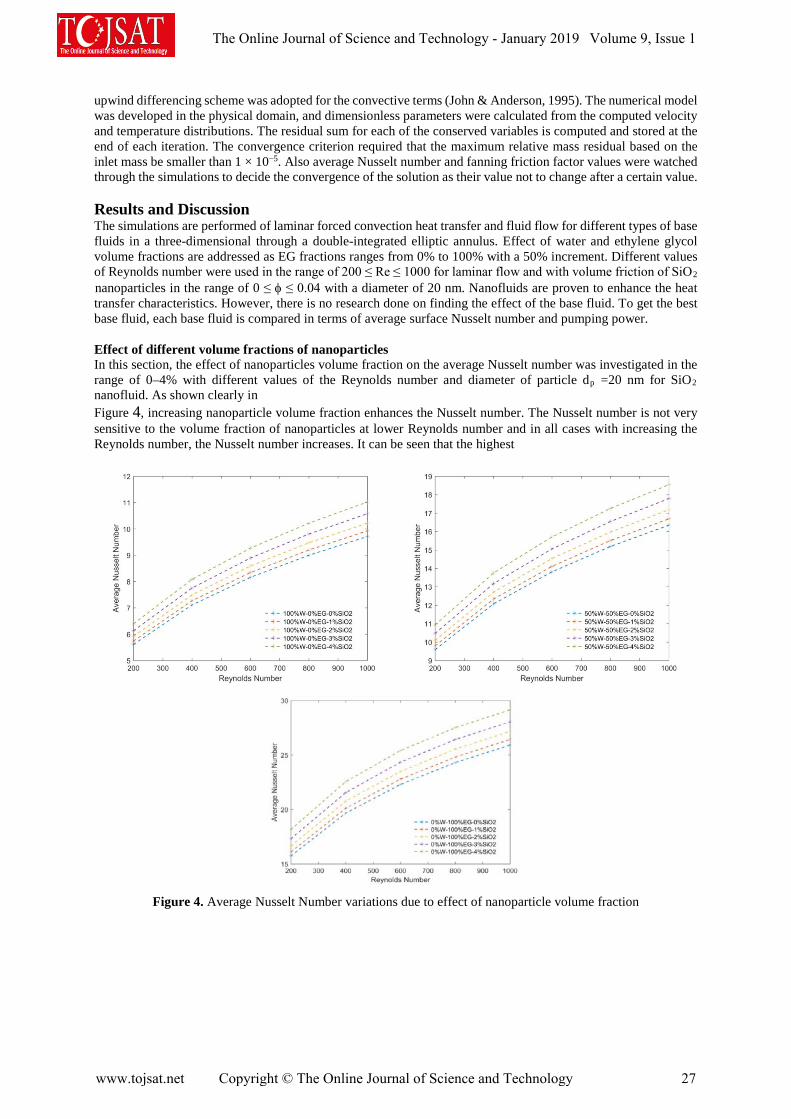
upwind differencing scheme was adopted for the convective terms (John & Anderson, 1995). The numerical model was developed in the physical domain, and dimensionless parameters were calculated from the computed velocity and temperature distributions. The residual sum for each of the conserved variables is computed and stored at the end of each iteration. The convergence criterion required that the maximum relative mass residual based on the inlet mass be smaller than 1 × 10⁻⁵. Also average Nusselt number and fanning friction factor values were watched through the simulations to decide the convergence of the solution as their value not to change after a certain value. Results and Discussion The simulations are performed of laminar forced convection heat transfer and fluid flow for different types of base fluids in a three-dimensional through a double-integrated elliptic annulus. Effect of water and ethylene glycol volume fractions are addressed as EG fractions ranges from 0% to 100% with a 50% increment. Different values of Reynolds number were used in the range of 200 ≤ Re ≤ 1000 for laminar flow and with volume friction of SiO2
nanoparticles in the range of 0 ≤ φ ≤ 0.04 with a diameter of 20 nm. Nanofluids are proven to enhance the heat transfer characteristics. However, there is no research done on finding the effect of the base fluid. To get the best base fluid, each base fluid is compared in terms of average surface Nusselt number and pumping power. Effect of different volume fractions of nanoparticles In this section, the effect of nanoparticles volume fraction on the average Nusselt number was investigated in the range of 0–4% with different values of the Reynolds number and diameter of particle dp =20 nm for SiO2 nanofluid. As shown clearly in Figure 4, increasing nanoparticle volume fraction enhances the Nusselt number. The Nusselt number is not very sensitive to the volume fraction of nanoparticles at lower Reynolds number and in all cases with increasing the Reynolds number, the Nusselt number increases. It can be seen that the highest
Figure 4. Average Nusselt Number variations due to effect of nanoparticle volume fraction
The Online Journal of Science and Technology - January 2019 Volume 9, Issue 1
www.tojsat.net Copyright © The Online Journal of Science and Technology 27
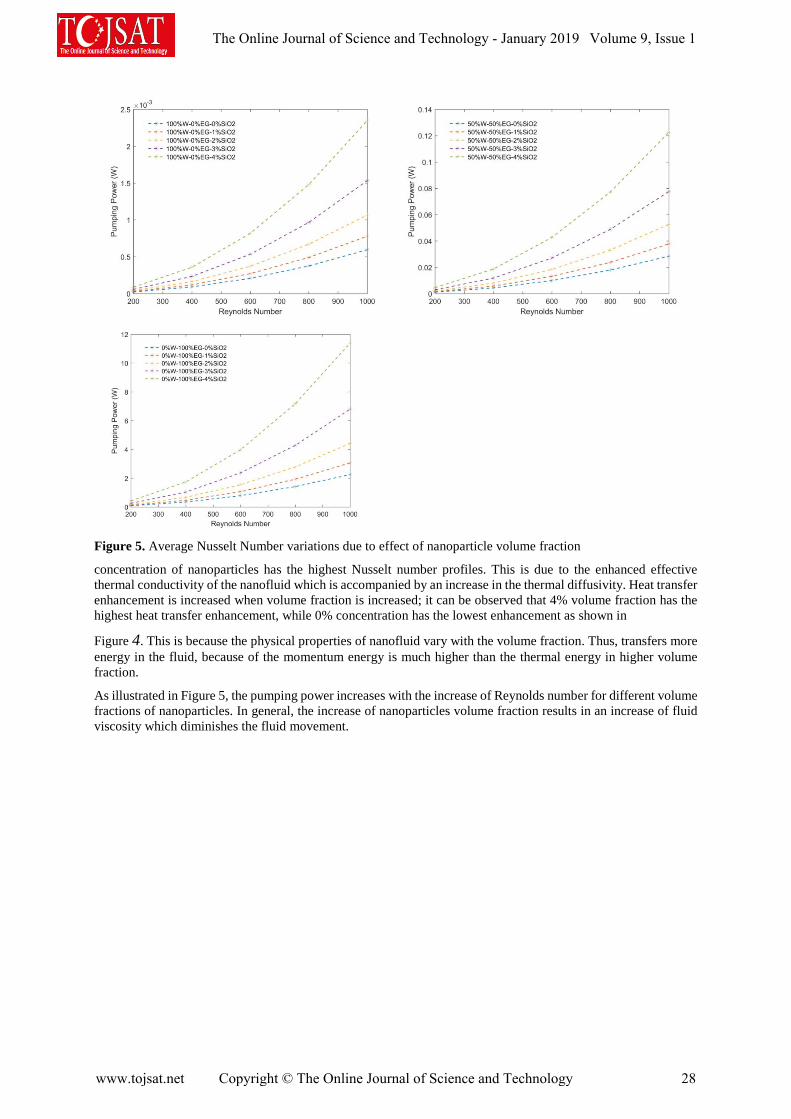
Figure 5. Average Nusselt Number variations due to effect of nanoparticle volume fraction
concentration of nanoparticles has the highest Nusselt number profiles. This is due to the enhanced effective thermal conductivity of the nanofluid which is accompanied by an increase in the thermal diffusivity. Heat transfer enhancement is increased when volume fraction is increased; it can be observed that 4% volume fraction has the highest heat transfer enhancement, while 0% concentration has the lowest enhancement as shown in
Figure 4. This is because the physical properties of nanofluid vary with the volume fraction. Thus, transfers more energy in the fluid, because of the momentum energy is much higher than the thermal energy in higher volume fraction.
As illustrated in Figure 5, the pumping power increases with the increase of Reynolds number for different volume fractions of nanoparticles. In general, the increase of nanoparticles volume fraction results in an increase of fluid viscosity which diminishes the fluid movement.
The Online Journal of Science and Technology - January 2019 Volume 9, Issue 1
www.tojsat.net Copyright © The Online Journal of Science and Technology 28
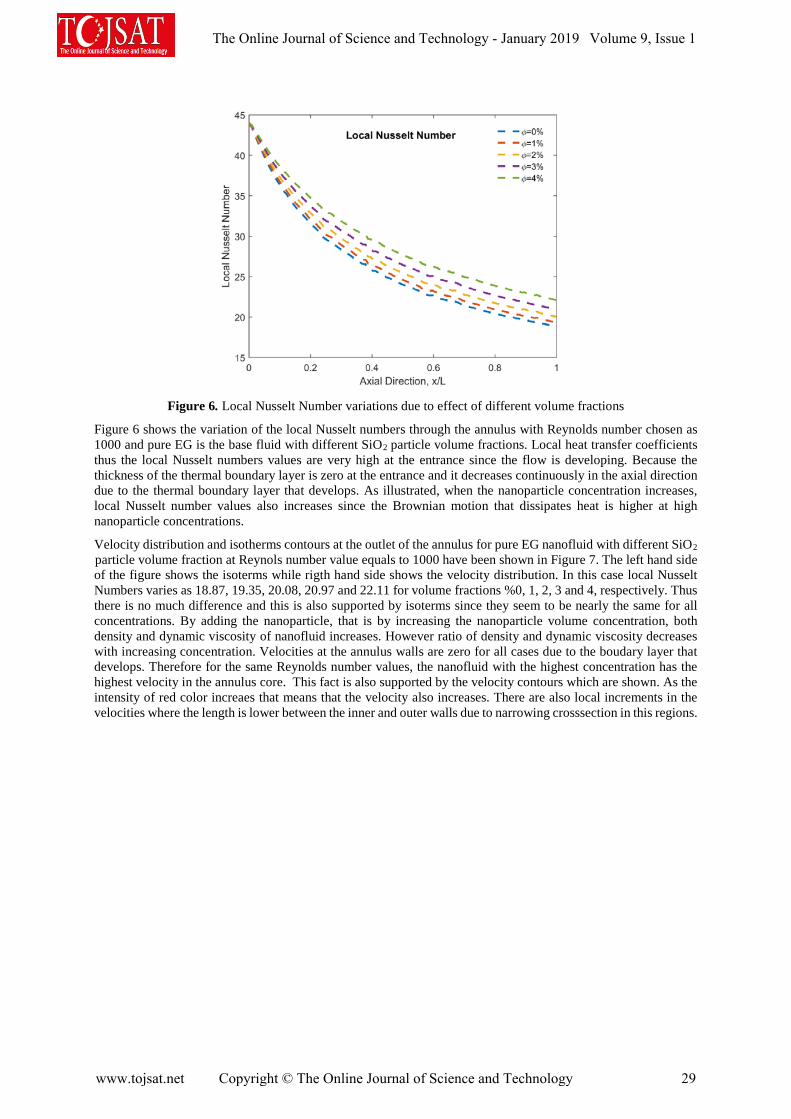
Figure 6. Local Nusselt Number variations due to effect of different volume fractions
Figure 6 shows the variation of the local Nusselt numbers through the annulus with Reynolds number chosen as 1000 and pure EG is the base fluid with different SiO2 particle volume fractions. Local heat transfer coefficients thus the local Nusselt numbers values are very high at the entrance since the flow is developing. Because the thickness of the thermal boundary layer is zero at the entrance and it decreases continuously in the axial direction due to the thermal boundary layer that develops. As illustrated, when the nanoparticle concentration increases, local Nusselt number values also increases since the Brownian motion that dissipates heat is higher at high nanoparticle concentrations.
Velocity distribution and isotherms contours at the outlet of the annulus for pure EG nanofluid with different SiO2 particle volume fraction at Reynols number value equals to 1000 have been shown in Figure 7. The left hand side of the figure shows the isoterms while rigth hand side shows the velocity distribution. In this case local Nusselt Numbers varies as 18.87, 19.35, 20.08, 20.97 and 22.11 for volume fractions %0, 1, 2, 3 and 4, respectively. Thus there is no much difference and this is also supported by isoterms since they seem to be nearly the same for all concentrations. By adding the nanoparticle, that is by increasing the nanoparticle volume concentration, both density and dynamic viscosity of nanofluid increases. However ratio of density and dynamic viscosity decreases with increasing concentration. Velocities at the annulus walls are zero for all cases due to the boudary layer that develops. Therefore for the same Reynolds number values, the nanofluid with the highest concentration has the highest velocity in the annulus core. This fact is also supported by the velocity contours which are shown. As the intensity of red color increaes that means that the velocity also increases. There are also local increments in the velocities where the length is lower between the inner and outer walls due to narrowing crosssection in this regions.
The Online Journal of Science and Technology - January 2019 Volume 9, Issue 1
www.tojsat.net Copyright © The Online Journal of Science and Technology 29

Figure 7. Isotherms (left) contours and velocity distribution (rigth) and for varying volume fractions
SiO2 0% SiO2 0%
SiO2 1% SiO2 1%
SiO2 2% SiO2 2%
SiO2 3% SiO2 3%
SiO2 4% SiO2 4%
The Online Journal of Science and Technology - January 2019 Volume 9, Issue 1
www.tojsat.net Copyright © The Online Journal of Science and Technology 30

Conclusion Numerical simulations for laminar forced convection heat transfer and fluid flow characteristics in a double integrated elliptic annulus using various nanofluids as the working fluids were presented. A three dimensional grid setup was built in order to simulate the geometry using Computational Fluid Dynamics (CFD) software. Using finite volume method (FVM), the governing equations were deciphered and correlated to case study, provided with some particular assumptions. The emphasis is given on the heat transfer enhancement resulting from various parameters, which include base fluid types and volume fraction of nanoparticle. The results were obtained through the numerical simulation that gives the highest Nusselt number. It is found that SiO2 EG nanofluid gives the highest Nusselt number while pure water gives the lowest Nusselt number. The Nusselt number is remarkably increased with the increments of nanoparticle volume fraction and Reynolds number. However use of EG in such microchannels sharply increases the required pumping power. This may be a drawback for this nanofluid if there is no available space for larger size pumps. References Akbarinia, A. (2008). Impacts of nanofluid flow on skin friction factor and Nusselt number in curved tubes with
constant mass flow. International Journal of Heat and Fluid Flow, 29(1), 229–241. https://doi.org/10.1016/j.ijheatfluidflow.2007.05.003
Akbarinia, A., & Behzadmehr, A. (2007). Numerical study of laminar mixed convection of a nanofluid in horizontal curved tubes. Applied Thermal Engineering, 27(8–9), 1327–1337. https://doi.org/10.1016/j.applthermaleng.2006.10.034
Choi, S. U. S., 1995. (n.d.). “Enhancing Thermal Conductivity of Fluids With Nanoparticles,” Developments and Applications of Non-Newtonian Flows, Report No. FED-231/MD-66.
Dawood, H. K., Mohammed, H. A., Sidik, N. A. C., & Munisamy, K. M. (2015). Numerical investigation on heat transfer and friction factor characteristics of laminar and turbulent flow in an elliptic annulus utilizing nanofluid. International Communications in Heat and Mass Transfer, 66, 148–157. https://doi.org/10.1016/j.icheatmasstransfer.2015.05.019
Edition, S., Ashgriz, N., & Mostaghimi, J. (2002). An introduction to computational fluid dynamics. Fluid flow handbook. McGraw-Hill … (Vol. M). Retrieved from http://www.mie.utoronto.ca/labs/mussl/cfd20.pdf
Ghaffari Motlagh, Y., Ahn, H. T., Hughes, T. J. R., & Calo, V. M. (2013). Simulation of laminar and turbulent concentric pipe flows with the isogeometric variational multiscale method. Computers and Fluids, 71, 146–155. https://doi.org/10.1016/j.compfluid.2012.09.006
Ghasemi, B., & Aminossadati, S. M. (2010). Brownian motion of nanoparticles in a triangular enclosure with natural convection. International Journal of Thermal Sciences, 49(6), 931–940. https://doi.org/10.1016/j.ijthermalsci.2009.12.017
Izadi, M., Behzadmehr, A., & Jalali-Vahid, D. (2009). Numerical study of developing laminar forced convection of a nanofluid in an annulus. Int J Therm Sci, 48, 2119–2129.
John, D., & Anderson, J. R. (1995). Computational fluid dynamics: the basics with applications. P. Perback, International ed., Published.
Joye, D. D. (2003). Pressure drop correlation for laminar , mixed convection , aiding flow heat transfer in a vertical tube, 24, 260–266. https://doi.org/10.1016/S0142-727X(02)00238-2
Keblinski, P., Phillpot, S., Choi, S., & Eastman, J. (2002). Mechanisms of heat flow in suspension of nanosized particles (nanofluids). International Journal of Heat and Mass Transfer, 45, 855–863.
Khaled, A. R. A. (2007). Heat transfer enhancement in hairy fin systems. Applied Thermal Engineering, 27(1), 250–257. https://doi.org/10.1016/j.applthermaleng.2006.04.012
Lee, S., Choi, S. U.-S., Li, S., & Eastman, J. A. (1999). Measuring Thermal Conductivity of Fluids Containing Oxide Nanoparticles. Journal of Heat Transfer, 121(2), 280. https://doi.org/10.1115/1.2825978
Masuda, H., Ebata, A., & Teramae, K. (1993). Alteration of thermal conductivity and viscosity of liquid by dispersing ultra-fine particles. Netsu Bussei, 7(4), 227–233. Retrieved from http://en.journals.sid.ir/ViewPaper.aspx?ID=312989
Mirmasoumi, S., & Behzadmehr, A. (2008). Numerical study of laminar mixed convection of a nanofluid in a horizontal tube using two-phase mixture model. Applied Thermal Engineering, 28(7), 717–727.
Mohammed, H. A., Abbas, A. K., & Sheriff, J. M. (2013). Influence of geometrical parameters and forced
The Online Journal of Science and Technology - January 2019 Volume 9, Issue 1
www.tojsat.net Copyright © The Online Journal of Science and Technology 31

convective heat transfer in transversely corrugated circular tubes. International Communications in Heat and Mass Transfer, 44, 116–126. https://doi.org/10.1016/j.icheatmasstransfer.2013.02.005
Mokhtari Moghari, R., Akbarinia, A., Shariat, M., Talebi, F., & Laur, R. (2011). Two phase mixed convection Al2O3-water nanofluid flow in an annulus. International Journal of Multiphase Flow, 37(6), 585–595. https://doi.org/10.1016/j.ijmultiphaseflow.2011.03.008
Sakalis, V. D., Hatzikonstantinou, P. M., & Kafousias, N. (2001). Thermally developing flow in elliptic ducts with axially variable wall temperature distribution. International Journal of Heat and Mass Transfer, 45(1), 25–35. https://doi.org/10.1016/S0017-9310(01)00124-7
Shah, R. K., & London, A. L. (1978). Laminar Flow Forced Convection in Ducts. Laminar Flow Forced Convection in Ducts. https://doi.org/10.1016/B978-0-12-020051-1.50022-X
Shoji, Y., Sato, K., & Oliver, D. R. (2003). Heat transfer enhancement in round tube using wire coil: Influence of length and segmentation. Heat Transfer?Asian Research, 32(2), 99–107. https://doi.org/10.1002/htj.10072
Velusamy, K., & Garg, V. K. (1996). Laminar mixed convection in vertical elliptic ducts. International Journal of Heat and Mass Transfer, 39(4), 745–752. https://doi.org/10.1016/0017-9310(95)00163-8
Velusamy, K., Garg, V. K., & Vaidyanathan, G. (1995). Fully developed flow and heat transfer in semi-elliptical ducts. International Journal of Heat and Fluid Flow, 16(2), 145–152. https://doi.org/10.1016/0142-727X(94)00019-9
Wang, X. W., Xu, X. F., & Choi, S. U. S. (1999). Thermal conductivity of nanoparticle-fluid mixture. Journal of Thermophysics and Heat Transfer, 13(4), 474–480. https://doi.org/10.2514/2.6486
Xuan, Y. (2000). Heat transfer enhancement of nanofluids, 7.
Xuan, Y., & Roetzel, W. (2000). Conceptions for heat transfer correlation of nano ¯ uids, 43, 3701–3707. https://doi.org/doi.org/10.1016/S0017-9310(99)00369-5
Zimparov, V. (2001). Enhancement of heat transfer by a combination of three-start spirally corrugated tubes with a twisted tape. International Journal of Heat and Mass Transfer, 44(3), 551–574. https://doi.org/10.1016/S0017-9310(00)00126-5
The Online Journal of Science and Technology - January 2019 Volume 9, Issue 1
www.tojsat.net Copyright © The Online Journal of Science and Technology 32
A PATTERN RECOGNITION SYSTEM FOR DETECTION OF ROAD SIGNS
Bochra TRIQUI, Abdelkader BENYETTOU
Center for Artificial Intelligent, USTO-MB University, Algeria
[email protected] [email protected]
Abstract: Road sign identification in images is an important issue, especially for vehicle safety and road management applications. It is usually tackled in three stages: detection, recognition and tracking, and evaluated as a whole. To progress towards better algorithms, we focus in this article on the first stage of the process, namely road sign detection. We focus our work on a feature-based approach to build geometrical models of various kind of shapes: triangle, square, and circle form.
Keywords: Road Signs, Detection, Pattern Recognition.
Introduction The purpose of this article is to develop a program that can detect or even recognize signs in a photo. The applications of this project are many: by equipping the camera cars and this program, we will be able not only to offer assistance to the driver (he will no longer need to search the panels since they will be displayed on a screen on the dashboard), but one could also consider a car autopilot, which would need to know the rules particular places where it rolls, and thus detect and recognize the panels.
The presented work in this paper proposes recognition system for detection of road signs, and is organized as follows: In the first section, we introduced the problematic and then examined related works to classify method of recognition of road signs in Section 2. The third section presents details works .Our experimental results and conclusion are presented in Section 4.
Related Works In the literature, we find several techniques applying various methods, the goal of which is to simplify the detecting of road signs; we have been interested in the following works: A recent example of a learning-based detector is an attentive cascade of classifiers selected by Adaboost (Baro et al., 2009). The size of the input window of a detector is 30x30 (minimum size of detectable panels). This makes it possible to detect circular and triangular panels: four detectors are constructed, respectively modeling the danger panels, to give up Passage, Prohibition and Obligation. This approach gets the following results: - Circle Prohibition: 70% detections for 3.34% false positives per image,- Obligation circle: 60% detections for 0.82% false positives per image,- Danger triangle: 65% detections for 2.21% false positives per image,- triangle Give way: 75% detections for 2. 5% false positives by picture.
In (Ruta et al., 2009), the authors compare the detection of circular panels by transform from Hough to that obtained by a cascade of boosted classifiers and select the Hough transform for a geometric approach, the detection of panels is done from the outlines of the image. Thus, in (Fang et al., 2003) self-associating neural networks, whose weights are set to correspond to the desired form (circle, triangle, octagon), serve as nonlinear filters convolving the image at the level of of gray and the Hue canal. A fuzzy inference system exploits the two maps obtained to detect the panels. This process processes an image in 1 to 2 seconds, and is integrated into a tracking and recognition system, but the results are presented as illustrations only. Speed limit detection is also provided by a Hough transform by (Miura et al., 2000), the panels rectangular information being detected by a colorimetric thresholding in YUV followed by a horizontal and vertical projection of the gradient and a Kanji recognition. The performances of this approach are only illustrated by some examples.
The Online Journal of Science and Technology - January 2019 Volume 9, Issue 1
www.tojsat.net Copyright © The Online Journal of Science and Technology 33
In (Garcia-Garrido et al., 2006), they use a Hough transform to detect circles (speed limit or stop) or lines for triangles. Their approach selects closed contours in a certain width / height ratio range, which reduces robustness to out-of-plane rotations. In (Piccioli et al., 1996), regions of interest are selected based on a thresholding in the Hue-Saturation HSV plane. Polygons are fitted to the linear contours chains, and assuming that the triangles are neither inclined nor distorted by perspective, equilateral triangles with a horizontal side and two slope sides are searched. This algorithm depends largely on the segmentation by the color, and it is strongly constrained in terms of orientation (it is restricted to the panels seen under a fronto-parallel perspective). In the case of grayscale image sequences, (Barnes et al., 2003) use Radial Symmetry Transformation TSR with the same validation steps for the detection of 40 and 60 mph speed limit panels. (Caraffi et al., 2008) propose a detection of the signs of the end of speed limitation in grayscale image sequences. Their approach is to detect light / dark / light transitions: a Hough transform for circles validates successful candidates, and time filtering is required to eliminate many false alarms. These filtering steps are not necessary in the approach we propose. According to our analysis, the TSR is a monovariate transformation where each contour point votes in several accumulators (one per scale) regardless of its neighborhood. This induces a relatively large number of false positives. In the generalized symmetry transformation TSG, introduced by Reisfeld (Reisfeld et al., 1995), each vote comes from a pair of points. This transformation is particularly suitable for highlighting radial and axial symmetries. It acts as a bivariate Hough transform, which reduces the number of false alarms and makes it less sensitive to noise than a single-crystal transformation. Panel detection methods The panel detection algorithms in a still image can be arranged according to the following three categories: - colorimetric modeling: a related component segmentation based on a color model is performed. The regions of interest are then validated by a recognition algorithm or an appearance model. These methods are the fastest but also the least robust to variations in lighting conditions; - geometric modeling: the contours of the image are analyzed by a structural or global approach. These methods are generally more robust than photometric ones because they process the gradient of the image, and can process grayscale images; - methods with learning: a classifier (cascade, SVM, neural networks) is trained on the basis of examples. It is applied on a sliding window that traverses the image on several scales. These methods combine geometry and photometry but can be a costly step in computing time. They require the constitution of a learning base by type of panels, tedious step when the number of objects to be detected is large. Evaluation of algorithms To evaluate our algorithm, a database of 700 photos was provided by the training supervisor. These photos are accompanied by data: A solution mask, that is to say a binary image where the pixels corresponding to the panels are at 1 and the others at 0. An annotation, that is to say a text file describing the position of the panels, their size, and their type. These data will allow us to test our algorithm in many cases. In fact, this image database contains images where the panels are clearly visible, but also images where the panels are less visible (high inclination with respect to the camera, brightness too low, brightness too high, signs deteriorated, it contains even some signs that a man would have trouble noticing!). We will consider the following: - the true positives (noted TP): the places where the algorithm says there is a panel, and that there is actually one. - false positives (denoted TN): the places where the algorithm says that there are no signs, and that there is not any. - False Positives (FP): The places where the algorithm believes there is a panel, but there is not actually one. - false negatives (FN): places where the algorithm believes there are no signs but there is actually one. We will then consider: - Precision: TP / (TP + FP). - Accuracy: (TP + TN) / (TP + TN + FP + FN).
The Online Journal of Science and Technology - January 2019 Volume 9, Issue 1
www.tojsat.net Copyright © The Online Journal of Science and Technology 34

- The specificity: TN / (TN + FP) - Sensitivity: TP / (TP + FN). These values, as well as the duration of execution of each function will allow us to compare the different methods that we will test, in order to choose the best ones, and to know their advantages and disadvantages. The results of the tests of the best functions will be given in annexes. Search Triangles And Squares Segment Search The first step to finding triangles or squares, is to look for segments. For this, matlab offers functions that perform Hough transforms so that you can find segments (and indeed, the documentation is very well done). We will therefore look for a dozen segments that these functions will suggest to us. They will return struct array whose attributes point1 and point2 can allow us to find these segments.
(a) Sign to detect (b) Segments detected
Figure 1: Segment detection
Once these segments are found, we will try to merge the points that are not too far from each other: it is likely that the detection of the segments is of poor quality, so we must expect that the segments detecting the panel edges do not touch each other perfectly. The method that has been chosen is to separate the geometric information from the topological information. We will build a table containing the location of points, and for each segment, we will test the proximity of its ends with the points that are already in the table. If the distance is small, we will consider that the two points are the same, otherwise we will add the current point to the table. We will then construct an array of integer pairs (that is, a matrix of size 2 × n) where two indices on the same column will mean that these indices form a segment. So we end up the arrival with a graph: these nodes and these arcs. Search triangles it is important to note that most triangular panels are either white panels with red edges or blue square panels containing a white triangle and a pictogram. In any case, there will be a strong contrast between the colors at the borders of the triangles, which would not be the case if, for example, we had a red sign on a red background. To find the triangles in an image, we will start looking for the paths of length 2 (that is to say containing 3 points) in the graph. So we will calculate the three angles of this triangle, and if each is worth 60° to 10°, we will retain the triangle. Assuming that the windows are well placed, we can suppose that in a window, there will be only one triangular panel, its area will be large and the triangle will be towards the middle of the window. As a result, only the triangle that has the best rating (we can for example note the triangles with a linear combination between the area and distance of the center of gravity of the triangle in the center of the window). We could also remove triangles that have no horizontal side.
The Online Journal of Science and Technology - January 2019 Volume 9, Issue 1
www.tojsat.net Copyright © The Online Journal of Science and Technology 35

Search rectangles Unlike the previous case, the rectangular panels have no sharp edges, and therefore the detection of the segments that are the contours of the panels is significantly less effective. One can easily understand why by looking at this particular case of a parking sign :
(a) Image originale (b) Image de contours
Figure 2 : Difficult case We see on the image of the outlines (calculated with the canny filter) that the edges of the panel are not visible. From there, the function of detection of matlab segments will not give any good, and a method like the one above will not work. It was still implemented (to the extent that this problem was identified after the tests). Several techniques have have been tried: - search for parallel segments and creation of the quadrilateral - search for perpendicular segments and creation of the quadrilateral However, all these methods proved to be unsuccessful since the edges signs were poorly detected, it had to be particularly generous in accepting what we consider it as segments. From there, too much noise makes quadrilaterals are detected anywhere and whenever we have a window somewhere, we can be sure that this method will find a quadrilateral. This is hardly going to help us for the future. An idea to overcome this problem is to use a finer contour detector, but this has not been implemented. Search circles A circle detection function based on a Hough transformation was provided by the training supervisor. It has therefore been used on a smoothed contour image (since a circle viewed in perspective is no longer really a circle, so we have to leave a little room for this detection for have good results). It works well in many cases, but sometimes gives results for the least strange. A proposal solution One solution is to work on an outline image rather than an image that tells you about the colors. The idea was to follow these steps: 1. Calculate a contour image of the image 2. Calculate a distance map of contours 3. Drag a window (this time with a shape: triangular or circular ...) We will keep the windows that minimize the sum of the pixels in the distance map, the idea being that since a panel is closed, the pixels inside the panel will be close to the edges and therefore of low value in the distance map. Threshold used in our study Dynamic thresholding 1 :function [red, blue] = Threshold1D(im, v1, v2) 2 :% Compute the red threshold 3 : red = im(:,:,1)./(im(:,:,2) + im(:,:,3)) > v1; 4 :% Compute the blue threshold 5 : blue = im(:,:,3) ./ im(:,:,1) > v2 & im(:,:,3) ./ im(:,:,2) > v2; 6 :% Dynamic threshold 7 : if sum(red(:)) + sum(blue(:)) > numel(red(:))/25 8 : [red,blue] = Threshold1(im,v1+0.1,v2+0.1); 9 : end 10 :end
The Online Journal of Science and Technology - January 2019 Volume 9, Issue 1
www.tojsat.net Copyright © The Online Journal of Science and Technology 36

However, it will be noticed that this method mixes red and blue colors. Indeed, if a red wall is detected, the blue threshold will be increased, and the detection of the blue panels will be degraded. So we did a second version of dynamic thresholding as well. Table 1: Table of results with threshold1 and threshold2.
1: function [red, blue] = Threshold2D(im, v1, v2) 2 :% Compute the thresholds 3 :red = Red(im, v1); 4 :blue = Blue(im, v2); 5 :end 6 :function red = Red(im, v1) 7 :% Compute the red threshold of the image 8 : red = im(:,:,1)./(im(:,:,2) + im(:,:,3)) > v1; 9 : If there is more than 5% pixels that are white, 10 : % increase the threshold 11 : if sum(red(:)) / numel(red(:)) > 0.05 12 : red = Red(im,v1+0.1); 13 : end 14 : end 15 : function blue = Blue(im,v2) 16 : % Compute the blue threshold of the image 17 : blue = im(:,:,3) ./ im(:,:,1) > v2 & im(:,:,3) ./ im(:,:,2) > v2; 18 : If there is more than 5% pixels that are white, 19 : %increase the threshold 20: if sum(blue(:)) / numel(blue(:)) > 0.05 21 : blue = Blue(im, v2+0.1); 22 : end 23 : end Experiment Results Threshold results The threshold2 is the dynamic thresholding that simultaneously modifies the red and blue thresholding (same value for the threshold). The threshold1 is the one that treats red and blue separately. Results for windows and shapes We obtain these results with an average execution time of 2.1342s per image. Table 2: Table of results.
Technique Average time per image
Precision Accuracy
Specificity
Sensitivity
Threshold1
0.1364s 14.6791% 97.5053% 97.6732% 70.095 9%
Threshold2
0.1526s 9.0567% 95.4536 % 95.8943% 79.9986 %
shapes
Precision Accuracy Sensitivity
Windows
31.9978% 26.1959% 59.0956%
triangles
62.5551% 40.3409% 53.1835%
circles
12.6706% 8.6782% 21.5947%
The Online Journal of Science and Technology - January 2019 Volume 9, Issue 1
www.tojsat.net Copyright © The Online Journal of Science and Technology 37

Images results The results images are available on this link. Red boxes represent enlarged windows (They have been enlarged to make sure that the entire panel is in the window). Red circles, and the cyan triangles represent the detected forms. The cyan rectangles are the smallest rectangles containing the detected shapes (for the triangles, they have been widened further since we suppose to have detected the inner border of the panel). Conclusion This work enabled us, on the one hand, to become even more familiar with the matlab language, and to review the techniques used in image processing and computer vision. It was also useful to see the difficulties commonly encountered in computer vision, namely the search for an algorithm that is effective in all conditions. Computer vision is a compelling topic that can be quite frustrating as it seems impossible to have an algorithm that delivers very good results. References Baro X., Escalera S., Vitria J., Pujol O., P.Radeva. (2009). Traffic Sign Recognition Using Evolutionary Adaboost
Detection and Forest-ECOC Classification, IEEE Transactions on Intelligent Transporation Systems, vol. 10, (pp. 113-126).
Ruta A., Porikli F., Watanabe S., Li Y. (2009). In-vehicle camera traffic sign detection and recognition, Machine Vision and Applications.
Fang C., Chen S., Fuh C. (2003). Road sign detection and tracking, IEEE Transactions on Vehicular Technology, vol. 52, n° 5, (pp. 1329-1341).
Miura J., Tsuyoshi K., Shirai Y. (2000). An Active Vision System for Real-Time Traffic Sign Recognition, Proceedings of IEEE Intelligent Transportation Systems Conference (ITSC’00),(pp. 52-57).
Garcia-Garrido M., Sotelo M., Martin-Gorostiza E. (2006). Fast traffic sign detection and recognition under changing lighting conditions, Proceedings of IEEE Intelligent Transportation Systems Conference (ITSC’06), Toronto, Canada, (pp. 811-816).
Piccioli G., Micheli E. D., Parodi P., Campani M. (1996). Robust method for road sign detection and recognition , Image and Vision Computing, vol. 14, n° 3, (pp. 209-223).
Barnes N., Zelinsky A., Fletcher L. (2003). Traffic sign recognition and analysis for intelligent vehicles , Image and Vision Computing, vol. 21, n° 3,(pp. 247-258).
Caraffi C., Cardarelli E., Medici P., Porta P., Ghisio G., Monchiero G. (2008). An algorithm for Italian de-restriction signs detection , IEEE Intelligent Vehicles Symposium, (pp. 834-840).
Reisfeld D., Wolfson H., Yeshurun Y. (1995). Context Free Attentional Operators : the Generalized Symmetry Transform , International Journal of Computer Vision, vol. 14, n° 2, (pp. 119-130).
The Online Journal of Science and Technology - January 2019 Volume 9, Issue 1
www.tojsat.net Copyright © The Online Journal of Science and Technology 38
ACTIVATING THE DISTANCE LEARNING SYSTEM
Burak Çakır Kocaeli University, Kocaeli Vocational School, Kocaeli, Turkey
Mustafa OF Kocaeli University, Kocaeli Vocational School, Kocaeli, Turkey
Abstract: In this study, the basic elements of the distance learning management system will be explained. It will provide basic information about Moodle, a distance learning management system running on a web browser. It will be emphasized that the Moodle education system, an open source remote learning management system, is a very popular educational system. The creation and generalization of a distance learning management system that can be activated on a cloud computing system running on a server will be practically explained. As a result, it will be explained that the server infrastructure required for the installation of a distance learning management system which can be accessed from any environment where the internet is available can be easily obtained by the cloud computing system. In a very short period of time, a distance learning management system with full features in terms of training infrastructure may become operative. The main aim is to express that the remote learning management system, which will meet the educational needs of people without face-to-face training, is easily applicable.
Keywords: Distance education, Moodle, BigblueButton, Moodlecloud, Live Conference Systems
Introduction With each passing day, information technologies are developing and becoming an integral part of our lives. It has now become very easy to obtain information with mobile phones, tablet computers, desktops or laptops. Education opportunities have also had its share from this technology. Distance Education, which has an infrastructure based on Internet technologies, has been accessible to everyone. Educational institutions, voluntary organizations, private firms and many other institutions can enjoy the training they want to offer to their trainees independently from the place. A learning management system (LMS; Learning Management System) can be prepared in a very short time due to the expansion of the distance education system and the development of Internet technologies.
In this study, the basic elements of distance education system are explained. Basic information about Moodle, a distance learning system based on Internet technologies, will be given. Creating and managing a distance education system that can work on cloud computing system will be explained in practice. In this way, a separate cost expenditure will not be made for the server infrastructure required for the operation of the distance education system. In a very short time, the full-featured remote education system will be able to work.
The main aim is to express that the distance education system that will meet the educational needs of the students who do not have face to face education is easily applicable and to provide the necessary attention to the subject.
1. Distance EducationDistance education is a modern education system in which students and instructors are not required to attend the school or education institution, live, video, audio and interactive courses are taught in a virtual environment. It is a type of education which is completely independent from time and place. Distance Education System, for those who have not completed their education by entering the intensive pace of business life, and who cannot go to the universities they have gained in distant cities due to financial difficulties, provide the education they want in very favorable conditions.
In the Distance Education System, both instructors and students do not come to any educational institution or any designated place for education, they do not leave their country or city to attend classes. Everyone registered to the program at any point in the world, on the road, travel, vacation, business trip and so on. With a portable computer with a wired or wireless Internet connection, they can effectively participate in the classroom in virtual classrooms or follow the registered trainings.
Virtual lessons, such as blackboard, PowerPoint applications, videos, case studies, multimedia tools, animated texts and many current educational tools are used as in formal education. Students who cannot participate in the
The Online Journal of Science and Technology - January 2019 Volume 9, Issue 1
www.tojsat.net Copyright © The Online Journal of Science and Technology 39

course on time or want to follow again can access the courses recorded in the archive at any time, regardless of the time and space limitation, they can follow the courses at their own time and place. Especially with the development of open-source software philosophy, open-source live course server systems such as BigBlueButton have made virtual lessons much more effective. The Distance Education System also provides serious opportunities for disabled students. Students with disabilities who do not have an associate, bachelor or master’s degree due to transportation problems have the opportunity to attend classes under the same conditions as the other students. Courses in the distance education system can be performed in a virtual classroom environment. Academicians and students can connect to the system from any environment with internet connection and participate in class. In the virtual classroom environment, academicians can tell the lesson, use the blackboard and even share the applications on their computer with the students. Students can also be connected to the lesson with audio and video, ask questions and make file sharing. Concurrent courses can be recorded, and then all students can follow that course any time they want. 1.1. Learning Management System (LMS) LMS is software that runs on web browsers designed to perform remote training activities. In English, Learning Management System is produced from the first letters of the words. The basic tasks of learning management systems, presenting learning material, sharing and presenting learning material, managing lessons, taking homework, taking exams, providing feedback on these homework and exams, organizing learning materials, keeping students, teachers and system records, creating reports. The LMS may consist of many contents. Registration component: It is the component that takes the basic information about the participants in the education by including the individuals who will participate in the education and training activities. Many websites have very similar features with the sign-up screen. Content presentation component: The component with the management-based features required for all teaching and learning activities. Course component: This is the component where the students will have access to the contents of the education and training, access to the course resources and other course contents. Testing and evaluation component: It is the component in which the evaluation (examination) to be performed as a result of the learning and teaching activity is prepared and applied. Reporting component: It is the component that provides the learning, teaching and system administrators the data related to the entire education and training process based on various criteria. With the SCORM technique, which paves the way for interactive training, students can receive self-education. SCORM is a standard for e-learning based learning management systems. SCORM, which is named after the first letters of the Sharable Content Object Reference Model, refers to the reference model for shareable content objects. Mobility has been adopted to standardize features such as reusability. Fixed presentation content, animated animations, videos, sound recordings, quizzes and many more educational contents can be found in a SCORM package. Although the process of preparing these packages requires technical knowledge, the basic computer usage and the Internet literacy of a tutorial with SCORM objects has become very easy with the appropriate software. Articulate, Adobe Captivate software to create these objects can be easily. SCORM is an interactive environment created with web technology. The most common open source learning management systems are listed below;
• Moodle (http://www.moodle.org) • Sakai (http://www.sakaiproject.org) • ILIAS (https://www.ilias.de) • Atutor (http://www.atutor.ca)
The most common commercial learning management systems are listed below; • Blackboard LMS (http://www.blackboard.com)
The Online Journal of Science and Technology - January 2019 Volume 9, Issue 1
www.tojsat.net Copyright © The Online Journal of Science and Technology 40

• Alms (http://alms.com.tr) 1.2. Moodle LMS Moodle is an acronym for the “Modular Object-Oriented Dynamic Learning Environment”. Moodle; It is a free, open source, object-oriented, dynamic distance education system. The Moodle current version is Moodle 3.5.2+. Moodle is able to run under MySQL and PostgreSQL database systems and in any environment that supports PHP language. Moodle, Apache + Php + Mysql trio provides a fast and effective LMS service. The official site is http://www.moodle.org. Http://download.moodle.org address can be used to download the installation files. The installation stages are quite simple. 2. Cloud Computing System While it is not known exactly when the term cloud computing is known (Estimated 1950s), this concept is the most generic name given to the Internet-based information services that can be shared among users by using the server computers and similar devices connected to the Internet. It is about the provision of services to be taken by using software at minimum level without the need for service infrastructure by the user. Cloud computing provides services based on three basic models. These are Software as a Service, Platform as a Service, Infrastructure as a Service. With cloud computing, data, applications and many other information services are stored in the server systems of the provider or organization. Ease of use is one of the great benefits. Google Drive, Microsoft OneDrive, cloud services are the obvious. With mobile, tablet, laptop or desktop computer access, data can be accessed continuously wherever an Internet connection is available. While cloud computing has good sides, it also has bad sides. The presence of data in a server system that is unaware of the user can lead to unpredictable results if the trust agreement is compromised. For example, cloud computing is one of the bad results that the country has cut off its support on a country or company basis. In terms of security, countries must have their own cloud computing server systems. 3. Moodlecloud Lms Moodlecloud is a system that enables the most current version of Moodle LMS to be put into service on a cloud system. This system is available at http://www.moodlecloud.com. The server needs for which the LMS is needed in the specified system are provided from a publicly available server pool on the cloud. In this way, a full-featured LMS can be created very quickly. For this, the server software does not need to be installed and configured on user computers. In addition, there is no need for a separate study for server maintenance and configuration services through the creation of LMS in the cloud system. With Moodlecloud, a full-featured LMS can be created in minutes. The free version includes the following features;
• Current latest version of Moodle LMS • Free BigBlueButton (Virtual Lesson / Conference Server) use • Up to 50 Users, 200 MB disk space, Basic themes and add-ons, • One Moodle site per phone number at account creation, • Up to 10 user live lessons with BigBlueButton (Virtual Lesson)
3.1. Creating a Distance Learning System from Moodlecloud You will see the steps to create an LMS via Moodlecloud in below; Step 1; A new account is created by accessing http://www.moodlecloud.com. Switch to free account creation pages. Step 3; The code entered in the mobile phone and entered a strong password is set for access to the LMS management. In the final screen, the LMS has become available in the cloud system. You can now log in to the sample LMS at https://education1.moodlecloud.com. User name is “admin”. Conclusions Distance education systems provide facilities for those who want to receive and give education. As mentioned above, it is clear that an LMS can be created in a very short time. Every trainer or person with Internet usage information can create this system immediately. Distance education is an education system that can be used effectively in primary, secondary, high school and university education.
The Online Journal of Science and Technology - January 2019 Volume 9, Issue 1
www.tojsat.net Copyright © The Online Journal of Science and Technology 41

Educational institutions, trainers have a great task in this regard. It is necessary to bring this education method together with the students as soon as possible. In this system, where the necessary infrastructure is an excuse, as mentioned above, the LMS will be ready at a very low cost. It is our greatest hope that the instructors and administrators who are able to see that the future education system is a distance education system is urgently transitioned to these education systems. References https://www.teknologweb.com/lms-nedir, (Access Date: 10.06.2018) https://www.apereo.org/projects/sakai-project , (Access Date: 13.07.2018) https://confluence.sakaiproject.org/display/DOC/Sakai+11+System+Requirements, (Access Date: 13.04.2018) https://azure.microsoft.com/tr-tr/overview/what-is-paas, (Access Date: 16.07.2018) OF M., (2017, Kasım), Scorm Nesneleri İle Etkileşimli Eğitim, International Conference on New Horizons And
Education, Proceedings Book Volume 3, ISSN:2146-7358, 64-72
The Online Journal of Science and Technology - January 2019 Volume 9, Issue 1
www.tojsat.net Copyright © The Online Journal of Science and Technology 42

ADAPTIVE RELAYING IN ELECTRIC POWER SYSTEM PROTECTION
Behçet KOCAMAN Bitlis Eren University Electrical and Electronic Engineering Bitlis Turkey
Üzeyir AKCA Kocaeli University Kocaeli Vocational School Kocaeli Turkey
Abstract: No matter how good the design and construction of electrical power systems, various faults and disturbances are encountered during their operation. Protection systems are used to minimize the effects of faults and disturbances on the network elements as well as to limit the danger of human life. Appropriate solutions can be produced to prevent faulty operation in electrical power systems. One of these solutions is the adaptive relaying. Adaptive relaying defines protection schemes that conform settings and logic of operations based on the prevailing conditions of the system. These adjustments can contribute to avoid repeating of miss-operation. Adjustments could include well changing relay parameters, the logging of data for post-mortem analysis and communication throughout the system. The electrical distribution system is considered one of the most complicated machines in existence in many countries. Electrical phenomena in such a complex system can inflict serious damages. This requires damage prevention from protection schemes. There was a safety problem between capacity to deliver power and the demand until last years. The protection schemes worked on dependability allowing the disconnection of lines and transformers with the purpose of isolating the damaged element. In this paper, adaptive protection schemes for electric power system protection will be discussed, one of which is communication.
Keywords: Adaptive relaying, Protection scheme, Power system protection
Introduction The method of delivering energy in the form of electricity to businesses and homes was one of the most complicated systems in many countries all over the world. Later, power engineers are forced to push the limits on the capacity of what they can deliver with the current system. This has led to many changes in the approach of electricity distribution, specifically a sophisticated approach in the methods of protective relaying. It is only possible to manually change the settings of the conventional protection relays used in electrical power systems once they have been adjusted. This process cannot be performed automatically. Therefore, it is very difficult to use this type of protection when the load flow changes frequently. For situations where the load current frequently changes, a protection system must be used which can adapt to these changes. This protection system is called the adaptive protection system. The adaptive protection checks the current information in the network and the status of the breakers, calculates the load flow again if a change is detected, and changes the relay settings accordingly. For the application of this protection system, the relays have to communicate with a main center, otherwise the calculations cannot be transferred back to the relays after the changes. Furthermore, the communication should be very fast in case the fault can occur at any time(Özveren, 2015) A system is usually looked at in terms of its reliability when describing its protective relaying (Horowitz and Phadke, 2008). They noted that this reliability spectrum has two extremes, dependability and security. According to them, “a system is said to be dependable if it will react for any type of fault but may also operate inappropriately when not needed. A system is said to be secure if it will not react inappropriately or unnecessarily, but it may not react if there is indeed a fault”. They pointed out that many engineers preferred to select the dependability side of the spectrum to clear any possible problematic condition because for many positions there were alternative delivery paths. Also, they noted that constraints on the growth of the infrastructure have caused to increased system stress, which helps to possible operation of dependable protection schemes. The power system is divided into protection zones defined by the equipment and the available circuit breakers. Six categories of protection zones are possible in each power system: (1) generators and generator–transformer units, (2) transformers, (3) buses, (4) lines (transmission, subtransmission, and distribution), (5) utilization equipment (motors, static loads, or other), and (6) capacitor or reactor banks (when separately protected). Most of these zones are illustrated in Figure 1. Although the fundamentals of protection are quite similar, each of these six categories has protective relays, specifically designed for primary protection, that are based on the characteristics of the equipment being protected (Blackburn and Domin, 2006)
• This study is presented in International Science and Technology Conference (ISTEC), July 18-20, 2018Paris, France
The Online Journal of Science and Technology - January 2019 Volume 9, Issue 1
www.tojsat.net Copyright © The Online Journal of Science and Technology 43
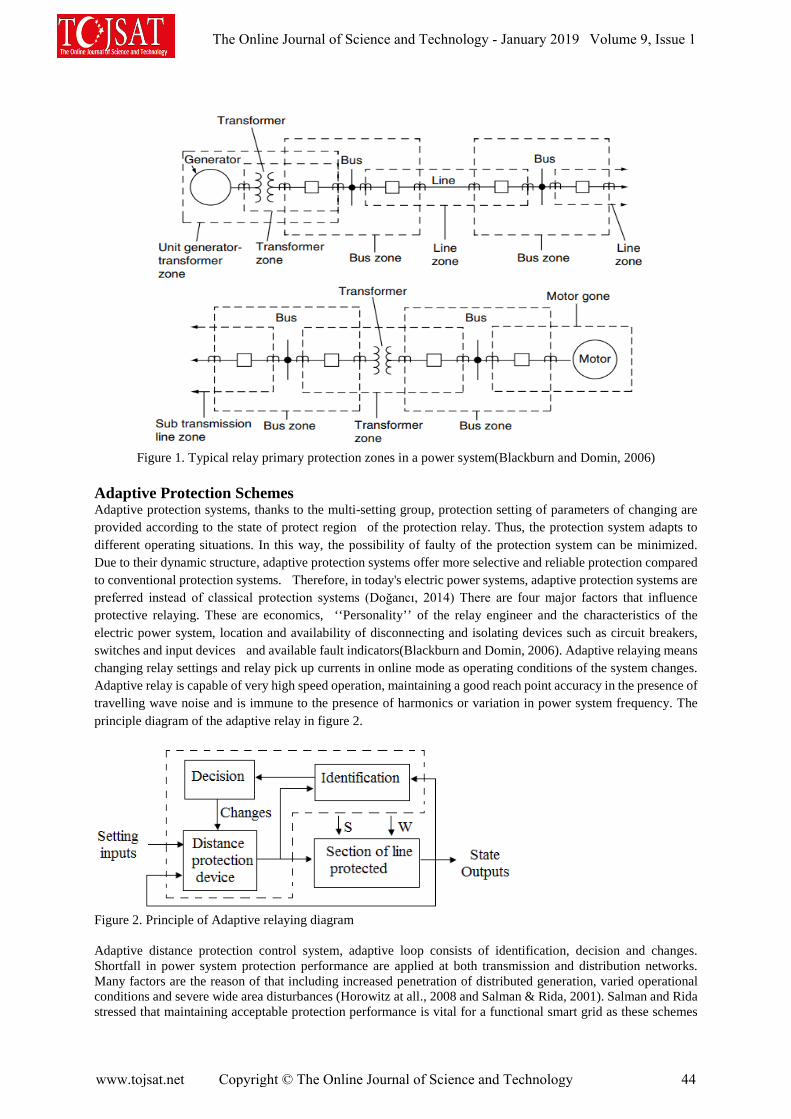
Figure 1. Typical relay primary protection zones in a power system(Blackburn and Domin, 2006)
Adaptive Protection Schemes Adaptive protection systems, thanks to the multi-setting group, protection setting of parameters of changing are provided according to the state of protect region of the protection relay. Thus, the protection system adapts to different operating situations. In this way, the possibility of faulty of the protection system can be minimized. Due to their dynamic structure, adaptive protection systems offer more selective and reliable protection compared to conventional protection systems. Therefore, in today's electric power systems, adaptive protection systems are preferred instead of classical protection systems (Doğancı, 2014) There are four major factors that influence protective relaying. These are economics, ‘‘Personality’’ of the relay engineer and the characteristics of the electric power system, location and availability of disconnecting and isolating devices such as circuit breakers, switches and input devices and available fault indicators(Blackburn and Domin, 2006). Adaptive relaying means changing relay settings and relay pick up currents in online mode as operating conditions of the system changes. Adaptive relay is capable of very high speed operation, maintaining a good reach point accuracy in the presence of travelling wave noise and is immune to the presence of harmonics or variation in power system frequency. The principle diagram of the adaptive relay in figure 2.
Figure 2. Principle of Adaptive relaying diagram Adaptive distance protection control system, adaptive loop consists of identification, decision and changes. Shortfall in power system protection performance are applied at both transmission and distribution networks. Many factors are the reason of that including increased penetration of distributed generation, varied operational conditions and severe wide area disturbances (Horowitz at all., 2008 and Salman & Rida, 2001). Salman and Rida stressed that maintaining acceptable protection performance is vital for a functional smart grid as these schemes
The Online Journal of Science and Technology - January 2019 Volume 9, Issue 1
www.tojsat.net Copyright © The Online Journal of Science and Technology 44
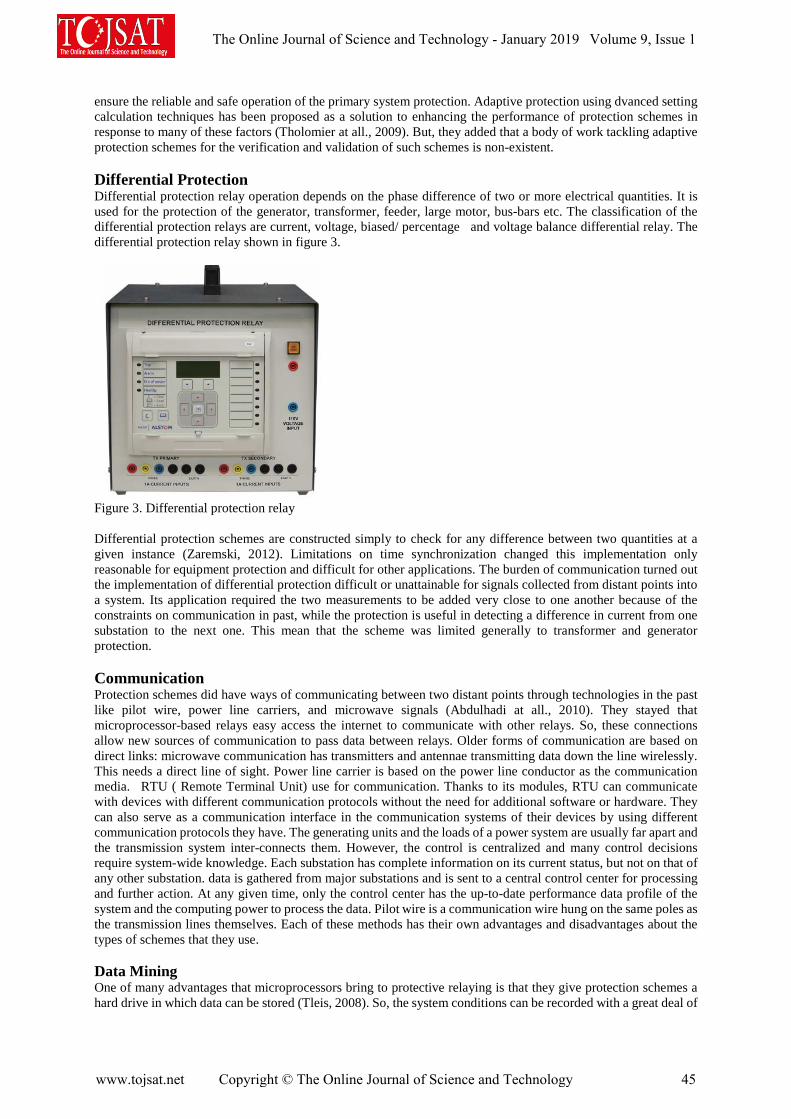
ensure the reliable and safe operation of the primary system protection. Adaptive protection using dvanced setting calculation techniques has been proposed as a solution to enhancing the performance of protection schemes in response to many of these factors (Tholomier at all., 2009). But, they added that a body of work tackling adaptive protection schemes for the verification and validation of such schemes is non-existent. Differential Protection Differential protection relay operation depends on the phase difference of two or more electrical quantities. It is used for the protection of the generator, transformer, feeder, large motor, bus-bars etc. The classification of the differential protection relays are current, voltage, biased/ percentage and voltage balance differential relay. The differential protection relay shown in figure 3.
Figure 3. Differential protection relay Differential protection schemes are constructed simply to check for any difference between two quantities at a given instance (Zaremski, 2012). Limitations on time synchronization changed this implementation only reasonable for equipment protection and difficult for other applications. The burden of communication turned out the implementation of differential protection difficult or unattainable for signals collected from distant points into a system. Its application required the two measurements to be added very close to one another because of the constraints on communication in past, while the protection is useful in detecting a difference in current from one substation to the next one. This mean that the scheme was limited generally to transformer and generator protection. Communication Protection schemes did have ways of communicating between two distant points through technologies in the past like pilot wire, power line carriers, and microwave signals (Abdulhadi at all., 2010). They stayed that microprocessor-based relays easy access the internet to communicate with other relays. So, these connections allow new sources of communication to pass data between relays. Older forms of communication are based on direct links: microwave communication has transmitters and antennae transmitting data down the line wirelessly. This needs a direct line of sight. Power line carrier is based on the power line conductor as the communication media. RTU ( Remote Terminal Unit) use for communication. Thanks to its modules, RTU can communicate with devices with different communication protocols without the need for additional software or hardware. They can also serve as a communication interface in the communication systems of their devices by using different communication protocols they have. The generating units and the loads of a power system are usually far apart and the transmission system inter-connects them. However, the control is centralized and many control decisions require system-wide knowledge. Each substation has complete information on its current status, but not on that of any other substation. data is gathered from major substations and is sent to a central control center for processing and further action. At any given time, only the control center has the up-to-date performance data profile of the system and the computing power to process the data. Pilot wire is a communication wire hung on the same poles as the transmission lines themselves. Each of these methods has their own advantages and disadvantages about the types of schemes that they use. Data Mining One of many advantages that microprocessors bring to protective relaying is that they give protection schemes a hard drive in which data can be stored (Tleis, 2008). So, the system conditions can be recorded with a great deal of
The Online Journal of Science and Technology - January 2019 Volume 9, Issue 1
www.tojsat.net Copyright © The Online Journal of Science and Technology 45
precision and synchronization. He stayed that this small piece provides the ability to automatically scan data for preset limits. The recorded data can be used to detect incorrect relay settings. Tleis also pointed out that an obsolete relay setting could be described as a setting. This system was applied to protect a part of the system that has developed or changed significantly. Conclusions For situations where the load current frequently changes, a protection system must be used which can adapt to these changes. This protection system is also called adaptive protection system. The adaptive protection checks the current information in the network and the status of the breakers, calculates the load flow again if a change is detected, and changes the relay setting values accordingly. In the adaptive protection process, a RTU and SCADA (Supervisory Control and Data Acquisition) based system is preferred if both the number and the distance of the protection relays to communicate with each other are too high. By establishing the supervisory zone, which is a simple way to help a relay distinguish between a fault condition and a load encroachment, the relay can better react to stressed system state abnormalities. We believe that the stressed system conditions have proven to be more common and will continue to become more common as power system engineers are forced to do more with less. Also, when this concept is applied correctly it will not receive much notoriety. When the innovations made possible by the new tools given to protection engineers, prevention of blackouts and improvement of system stability are no matter. References Abdulhadi, I.F, Burt, G.M., Dysko, A. Zhang, R. and Fitch, J. (2010). The evaluation of distance protection
performance in the presence of Quadrature Boosters in support of a coordinated control strategy. In Developments in Power System Protection. Managing the Change, 10th IET International Conference on, pp. 1-5.
Blackburn, J. L. , Domin, T. J. (2006). Protective Relaying: Principles and Applications, CRC Press, NW, USA. Catterson, V.M., Davidson, E.M. and McArthur, S.D.J. (2011). Embedded Intelligence for Electrical Network
Operation and Control. IEEE Intelligent Systems, vol. 26, no. 2, pp. 38-45. Chapman, S.J. (2002). Electric machinery and power system fundamentals. Boston: McGraw-Hill. Doğancı, A.Ç. (2014) Elektrik Dağıtım Sistemlerinde Adaptif Koruma, İstanbul Teknik Üniversitesi Fen
Bilimleri Enstitüsü, Yüksek Lisans Tezi, İstanbul. Grainger, J.J. and Stevenson, W.D. (1994). Power system analysis. New York: McGraw- Hill. Horowitz, S., Novosel, D., Madani, V. and Adamiak, M. (2008). System-wide Protection. Power and Energy
Magazine, IEEE, vol. 6, no. 5, pp. 34-42. Horowitz, S.H. and Phadke, A.G. (2008). Power System Relaying (3rd Edition). John Wiley & Sons. Özveren F. (2015), Mikroşebekelerin Aşırı Akım Rölesi İle Adaptif Ve Entegre Korunması, İstanbul Teknik
Üniversitesi Fen Bilimleri Enstitüsü, İstanbul. Salman, S.K and Rida, I.M (2001). Investigating the impact of embedded generation on relay settings of utilities
electrical feeders. Power Delivery, IEEE Transactions on, vol. 16, no. 2, pp.246 -251. Tholomier, D, Paraiso, D. and Apostolov, A. (2009). Adaptive protection of transmission lines. In Power Systems
Conference, (PSC), pp. 1-14. Tleis, N. (2008). Power Systems Modelling and Fault Analysis: Theory and Practice. Elsevier, USA. Vassell, G.S. (1991). Northeast Blackout of 1965. Power Engineering Review, IEEE, 11(1): p. 42- 53. Zaremski, B. Z. (2012). The Advancement of Adaptive Relaying in Power Systems Protection. Thesis submitted
to the faculty of the Virginia Polytechnic Institute and State University in partial fulfillment of the requirements for the degree of Master of Science In Electrical Engineering, USA.
The Online Journal of Science and Technology - January 2019 Volume 9, Issue 1
www.tojsat.net Copyright © The Online Journal of Science and Technology 46

AN ASSAY WHETHER EARLY COMMUNICATION (TEACHING TURKISH) METHODS AFFECT THE THINKING PROCESS
THROUGH TURKISH AND MATHEMATICS COURSE
Nevin ALGÜL T.R. Marmara University, Faculty of Communication, Radio, Television and Cinema Department,
Department of Visual Communication Design – TURKEY
[email protected], [email protected]
Abstract: The scientific knowledge asserts that the language learning center of the human species is designed in a way to understand the whole better than the single parts. In other words, inductive method which is particularly applicable and necessary for the scientific field, is superseded by deduction method due to its superiority when it comes to learning a language. It is necessary to conduct studies whether the teaching method of the native language affects the thinking process and on the cause-and-effect relationships. Immediate motivation of people is not possible. This process is performed gradually and the initial stages are of great importance in the formation of the governance of the masses. An individual who can see single parts but can not see the whole (the big picture as colloquially expressed by the Western), can not think analytically, has an underdeveloped reasoning ability or not at all developed; does teaching method of native language have any effect on creating people who cannot make a whole out of relevant parts or ,as literally expressed by native of Anatolia, in creating people who cannot tie up the ends of the ropes? How does the early communication method of 'mathematical' knowledge, a must for life, affect the ability to grasp and apply it? What does it have to do with using Turkish language?
As it can be seen from the above paragraph, this assertion has two goals: The first one is as follows by means of an example from social sciences: It is based on how the teaching method of native language can influence the thinking process through a practice to complicate the task of language learning center in brain, that is contrary to its functioning. And the second one: With use of an example from life sciences, will be starting discussion with respect to the effect of not teaching abstract mathematical knowledge through concrete examples on thinking process, its consequences, and how the way of teaching mathematics influences language skills since 'linguistic' is based on mathematics.
Key words: Induction, Deduction, Analytical Thinking, Reasoning, Early Communication Method, Big Picture, Mathematics Skills, Turkish Skills
Introduction
"Idea + Phrase+ Articulation= hat is Human."
Stanislavsky
The language, which is considered as a universal and ancient quality as man's making of tools, helps to hand the inheritance of social experience down from generation to generation. Language skill is naturally regarded as one of the primary differences between man and animal (Taşer, 200: 49). All members of a society can tell others what they see, hear, experience, and do by use of the same symbols in the language (Taşer, 200: 47).
"Man's achievements rest upon the use of symbols"
Alfred Korzybski
The Online Journal of Science and Technology - January 2019 Volume 9, Issue 1
www.tojsat.net Copyright © The Online Journal of Science and Technology 47

Language is a more advanced phenomenon than simply handing down traditions, customs, information, experiments. At the same time it affects the legacy left; in short, language makes the tradition rational (Taşer, 200: 47). The main focus of the article originates from this. Why does a society resist to change their trials and experiences according to reason and science? Although this is available in the nature and development of the language, why is there a movement in the opposite direction of this structure in some societies? The particular focus of this paper is to discuss this question with respect to our society in which we are born.
"Any method that improves thinking also improves speaking; and vice versa any method that improves speaking improves thinking as well ."
AT Weaver; MV Ness
What are the factors that can cause disruption in the normal development of thought? Is it due to the fact that customs and traditions assume a role of religious elements? When religion and language considered in the same context, language acts like a link as expressed by Confucius. Contrary to popular belief, it is not the religion that holds together like glue. At best, it might be transfer of religious elements, but in any case this does not exhibit a permanent characteristic, and history witnesses that. To rephrase, the possible external dynamics that can influence the formation of thinking: Is the teaching method of Turkish and Mathematics constitute the main problematic question of the article?
A large majority of the population in our society we live in experiences problems with the use of mathematics and language. Our mathematical knowledge is weak and we generally fail to practice it in our lives. It does not make our life easier, on the contrary, it can make our life more difficult if the information that is taught creates confusion. However, mathematics is there to make us understand the life and make it easier. Using hand like an abacus- counting on the fingers is common and those who have never attended a school can get ripped off less in market. Our sense of direction has not improved as well. However, our society descends from ancestors who were quite good at using world map.
The teachers, who are native speakers of English Language with pedagogical formation (on writing, note-taking, listening, reading) have attempted to divert tendency of public high school graduates on whole sentence, instead of constantly focusing on the parts of sentences and trying to learn separately. The first time this is experienced by the author of this paper is when she was a student at preparation class in YADYOK (the school of foreign languages) at Bosporus University, and at that time the idea of making a paper on this topic has come to her mind. Teachers did not experienced such a difficulty with international students, however they were constantly obliged to motivate public high school graduates to focus on whole sentence instead of its constituents (actually, this should be easy to achieve later on due to the nature of language). The graduates of Italian High School, Saint Michel French High School, Saint Benoit High School, Notre Dame de Sion French High School - all of which excels at providing a proper education even for a second foreign language, do not have such a problem. As author of this paper, hereby, I would like to share my personal experiences pertaining to that time. In YADYOK at Bosporus University, I have participated in the same language courses together with some of the graduates of the aforementioned high schools, and I have my personal observations thereof. No matter in which language they were trained in their high schools, they had a proper language learning experience such that, with some effort, they would not be even required to be participate in an English preparation class. In those days, I have found the answer to my question on functioning of the language learning center in brain when I have read a sentence by Noam Chomsky in his book borrowed from the library at Bosporus University. The functioning principle of the language learning center in brain is based on the requirement of "deduction" (Chomsky, 2001: 20).. Now the puzzle is completed for me, who has graduated from high school with a certificate of commendation, with high grades in English, had opportunity to spent time with people from different societies, and had a pen friend since my early childhood - That's why, in this society, there is a colloquial saying as follows:
If you want to learn a language, live in the country where it is spoken or have boyfriend or girlfriend, who is a native speaker of the language to be learnt. (Or you may use a more direct translation of what is explicitly meant here: without French kiss, you can't learn French.) Why ? Because you learn as a whole. Just like a baby learning to speak. Hereby, it is emphasized that exposure to whole sentence, observing action and reaction - also referred
The Online Journal of Science and Technology - January 2019 Volume 9, Issue 1
www.tojsat.net Copyright © The Online Journal of Science and Technology 48

to as interaction- and communication depend on presence of interaction. (Please revise this part: etkileşim ....etkileşim olmasına bağlıdır) After such interaction, which tense should be used, should the verb be at the end of sentence? A baby can start talking with simple and grammatically correct sentences without caring if it is a head-final language or not Then wearing red ribbon was clear to me. Why was red ribbon so important?
The answer to this question lies in how we talk. Let's discuss it in more detail.
How Do We Talk?
Speaking a quality of human race. The emergence and development of languages have naturally been directly or indirectly a field of interest to a wide range of different sciences such as anthropology, ethnology, sociology, psychology, linguistic, psycholinguistic, social psychology... (Taşer, 2000: 39-40). The air exhaled from lungs strikes at a great speed to the throat and mouth and causes vibrations. The sound is vibration heard through the ear, and the physiological elements will not focused on in this paper.
G. Herbert Mead claims that speaking is possible though "meaningful others". The people who really care about themselves will be the meaningful others of a baby. Every day, a baby observes the meaningful as a whole. Baby follows communication with itself and with others. When water is requested, it sees that a glass of water is served. A baby hears a plethora of sentences about diaper, baby poop or baby pee and / or physical appearance such as hair, head, hands, eyes, legs etc. when diapered. A baby notices that attention is drawn on its hair when we say you have such lovely hairs, or on hands when we say you have such lovely hands and similarly to legs, foot etc. A baby does not hear hundreds of sentences only about itself but also about everyday life. The important point here is to communicate using correct, long or short sentences. There should be no discourse attributed to the baby language such as sounds like eh, neh, heh, owh, eairh in baby talk making a false assumption that it is a baby after all. It should not be forgotten that a baby is a small yet inexperienced person, but with some genetic traits. The more qualified communication a baby is exposed, the more quickly it will develop its skills. We can figure out the importance of the quality of the language used in communication based on correlation between language and intelligence. The more stimuli stimulates brain, the better they are for a baby. As Maria Mentessori has said, there are some assertions that a baby should be communicated with even if it is still in mother's womb since a baby is ready to perceive you. That is referred to as interaction. The receiver and the transmitter face each other. In other words, it contains the principle of reciprocity: action and reaction are observed, a reciprocal exchange is experienced and the definition of communication is based on this. Communication is only possible through interaction and there would be no conversation if there is no interaction.
Child psychiatrists and psychologists say that lack of interaction can lead to mental retardation in children. It is even asserted that in unilateral (one-sided) communication - such as leaving the child in front of the TV screen - interaction would be out of question, speech problems such as delayed speech or mental retardation may be experienced. If there is interaction, there is speech.
We learned to speak through interaction and what is clear by now is that a baby born into an environment where native language is tried to be taught with split parts (words will be uttered in syllables, tenses will be focused on, sentences will be studied as separate words and so on) either will be able to talk late or suffer from other problems due to confusion. Trial-and-error is required. In other words, this trial should be done with a baby (it is objectionable to have such trials from human aspects). Science may suggest that the results may be similar to those encountered in babies exposed to unilateral communication.
Well! How did we learn our
native language? Let's analyze...
How did we learn native language (Turkish)? The method that we learned our native language: In a nutshell: First 29 letters are taught. We wrote and studied. Then they gave us syllable cards: A lot of syllables cards such as fa-ther, moth-er, ap-pple. Then we proceeded with sentences. Transition from letters to syllable cards was made with use of addition method. By adding syllables
The Online Journal of Science and Technology - January 2019 Volume 9, Issue 1
www.tojsat.net Copyright © The Online Journal of Science and Technology 49

after each other. First "f" then an "a", this is "fa", similarly "t", "h", "e", "r", "ther", thus "faaaaaaaaaa" "theeeeeer". By repeating the letter "a", so many similar syllables were studied over and over again by spelling, writing and memorizing. Then it was time to use 'sentence cards'. Ali throw the ball. Run, Ayşe run. Ali caught the ball. Ayşe run towards Ali. These were the kinds of first basic sentence forms. What addition method was preferred? Does it originate from a tradition that has existed in this society before? This tradition is based on pronunciation of the Qur'an. It is based on pronunciation of Arabic letters one after another without knowledge of Arabic grammar. A small book called Elif Ba (made of the first two letters in Arabic language just like the word "alphabet" is constituted from Alpha and Beta in Greek alphabet) is a step by step guide for pronunciation of Qur'an and is generally pronounced under supervision of a Muslim scholar. It is a method based on teaching only the pronunciation of the Qur'an without any idea about meaning and this method has similar characteristics. For example: if the letter "b" has a Fathah (short vowel mark on it), it is pronounced with a short /a/ (like the initial sound in English word "up"), and it is taught with addition of sounds just like "ba". Was it made a false assumption based on such a tradition that it make mastery of reading easier. Is this how it is taught since the early days? Since it coincides with the adoption of Latin Alphabet on 1 November 1928, were they convinced that it could only be taught in this way? (Please revise). In this paper, there are no answers to these questions and they are are intended to be researched. At that time, they did not have this knowledge about the functioning of the language learning center in brain, and it was thought that this habit in the society would facilitate the mastery of reading, it did not evolve within time according to reason and science. Now the knowledge that science offers us is that this method makes learning difficult. It can cause situations that hinder analytical thinking, may interrupt the ability to see whole picture (able to see individually, but incapable of seeing the whole), and cause short-term memory due to correlate things. Although this method is abandoned for a specific period, all of the teachers are trained in inductive method. When we analyze the characteristics of a language to transfer the knowledge, it can be clearly predicted that long years will be required for transformation.
How is mathematics, essential for life, lectured? In which way is Turkish language mathematical? How does deficiencies in teaching of mathematics affects usage of Turkish?
Life is based on mathematics, and mathematics is based on formulas. There is a logic in formulas, but it is necessary to introduce this logic to children in commensurate with mental development of children in order to encourage children to love mathematics. Until the age of eleven, human beings can not grasp abstract knowledge in general. Introducing mathematics through concrete examples will make it easier to learn and this is the way to build a solid foundation. Comprehension of the logic behind mathematics depends on establishing a solid foundation. If this is not done, multiplication table nightmare starts to haunt, one cannot make up peace with mathematics no matter what, and identifying directions, giving directions, using maps might be a nightmare.
Moreover, language knowledge is also based on mathematics. Individuals with no exposure to the mathematical knowledge through the right method remains weak in terms of linguistic knowledge. Many people fail to separate "de" in Turkish language, having the meaning of "also", which should be separated from the word it follows. Short-term memorization is immediately forgotten when the examinations are over and many other similar examples can be given. The language can not be fully mastered somehow. Of course, it should be noted that generalization is made here. Depending on location, such difficulties may be experienced to some extent or we can observe that such problems are still experienced in society-wide. Eventually, what happens?
Conclusion "Experimenting with the genetics of the formation of thinking (with the functioning of the language learning center in brain) from the very beginning will only serve to (create) shape minds or shaped minds. If this is done, people can easily be manipulated through ad hoc means (internalized motifs, cultural codes, etc.), then nothing will be rejected or found odd by them, because they might already have ceased to question such means." Nevin Algül
The Online Journal of Science and Technology - January 2019 Volume 9, Issue 1
www.tojsat.net Copyright © The Online Journal of Science and Technology 50
"The universe is entirely based on mathematics. Mathematical knowledge is essential to understand the world, make sense of it, and make our life easier. Teaching of mathematics by use of a method contrary to the developmental stages of the human brain can serve to make a contribution to not only raising people who cannot find their way, give directions, use maps, but also people who has no real knowledge about grammar of native language, and accordingly no real mastery of native language."
Nevin Algül
How does an individual feel that? They may not feel, but they may be exposed to an inferiority complex. Student gets six years of foreign language education (foreign language is taught through induction method), let alone speaking, fails to speak in simple sentences, and has never enjoyed grammar and mathematics throughout all study period. How many adults are there out to know multiplication table by heart? Student gets red ribbon later than classmates and thus receive a nasty blow by native language before life really begins. What happens then? The feeling of inferiority complex may develop. A feeling emblazoned in his or her unconscious (in the first quarter of 2000, the definition of subconscious concept has changed and it is redefined as our attitudes and behaviors that are shaped through our life experiences (Mlodinov, 2013: 21-23) Unity of education is a must. All schools are affiliated to the Ministry of National Education by the Law on Unity of Education, enacted under law No. 430 on March 03, 1924, and enforced on March 06, 1924 by TGNA (http: //mevzuat.meb.gov.tr/html/110.html), and thus unity of education is ensured (If definition of education includes to make changes in attitude and behavior through information transfer, then would it not be more appropriate to call it unity of teaching-education?) The fact that there may be a difference between the methods of transferring information in schools of foreign origin and state-owned schools is within the scope of this paper, but it should be discussed if such differences in methods cause creation of different minds, exposure to foreign culture, feeling close to it, receiving information as it should be, and formation of a naturally dominant ruling class. If native language is not taught by means of induction, it may end up in a group of people who cannot establish causa - effect relation, who can comprehend events independently but cannot make a whole out of it, who close the door on reasoning, who readily accept dogmas and never question them, and who has a week memory. This may even be the reason for short-term memory. To create masses that assimilates the cultural codes of the social circle in which they are born without questioning them. It is very easy to manipulate such people through the instruments of religion, ideology, race. If you deprive man of ability to question (reasoning, comparison, correlating events but doing all these things in an objective and sound manner), man attempt to give a meaning to his presence through religion, ideology, race, factions, groups, even NGOs (civil society organizations) and in this context someone who considers to be a very modern person and some other person who is considered to be very narrow-minded can be put in the same equation. It should not be forgotten that the cultural character of the family, namely the first social environment, plays a decisive role in the quality of education a person gets, and covers up its deficiencies. The greatest evil here is that it is not noticed that objective thinking is a plus for the future of the humanity and societies and that minds can become a putty in the hands of imperialist powers as 'programmed minds', ignoring the fact that science also supports this assertion. Now it will be very easy to make all these 'programmed minds' to welcome people, who have the same appearance with them serving others. The real task here is under responsibility of who call themselves as "intellectuals". This can be solved with a brain to see and understand the situation and courage to disclose it. It is the way to use the science. Of course, the facts need to be updated in line with scientific knowledge. One can come out and prove that two plus two may not always equal to four. It would be possible through these 'intellectuals' to establish an order for cultivation of a viewpoint in people in which the doors to reasoning would be wide open. A society should be able to solve the events through the instrument of reasoning and science, and also to be able to do crosscheck such reasoning via science. It is possible to have all kinds of beliefs and belief systems that will keep the human being alive, but common ground should be science. All other ways would create manipulable societies, which can only lead to a transformation into a society that enriches others, is easily driven away from here to there, and even collapses. World governance is based on commercial intelligence. The rulers who are keen on domination want a
The Online Journal of Science and Technology - January 2019 Volume 9, Issue 1
www.tojsat.net Copyright © The Online Journal of Science and Technology 51

manipulable consumers suitable for the perception management, who can think in parallel with rulers' interests, masses that contribute all their resources to rulers, and actually they do create such people. Today, the means of manipulation are still religion, language, race, democracy (even all NGOs), all religions, belief systems, yoga, ayurveda, astrology as they abuse. That is to say, all the teachings that exist for their own purposes can be transformed into abuse-liable means. These tools may vary. For the continuation and continuity of society it is necessary to establish language policies, which are independent of dominant powers, and put reasoning and science on its focus. References Chomsky, Noam(2001), Dil ve Zihin, Ankara: Ayraç Yayınevi. Mlodinov, Leonard(2013), Subliminal- Bilinçdışınız davranışlarınızı nasıl yönetir?, İstanbul: Oku-yan Us. Taşer, Suat(2002), Konuşma Eğitimi, İstanbul: Papirüs Yayınevi. Kitap Matbaacılık. Web-site: http://mevzuat.meb.gov.tr/html/110.html
The Online Journal of Science and Technology - January 2019 Volume 9, Issue 1
www.tojsat.net Copyright © The Online Journal of Science and Technology 52
AN INVESTIGATION ON THE EFFECTS OF ECAP ON THIXOTROPIC MICROSTRUCTURE OF AA7075 ALUMINUM
ALLOY
Ersin Asım GÜVEN
University of Kocaeli Faculty of Engineering Department of Mechanical Engineering 41380 Kocaeli, TURKEY [email protected]
Abstract: With Zn as the primary alloying addition, alloy from the 7000 family offers higher tensile strength than many steel especially in T6 temper. These family are widely employed for aircraft, wheels and major structural components, due to its high strength-to-density ratio. Semi-solid forming has many advantages such as able to produce high density material, long tool life, less production forge and near net shape. Also less liquid fraction then cast, results as less shrinkage. Semi-solid products are more durable then cast ones because of non-dendritic microstructure and less porosity, also cheaper than both cast and forged products. ECAP is an operation that involves simple shear deformation by severe plastic deformation processes. However, the material will not be subjected to any cross sectional changes. No cross sectional changing is the most important feature that distinguishes it from conventional methods. In this study, one of the most important wrought alloys for aerospace applications, AA7075 was used. In order to get the best semi-solid forming feedstock, thixotrophic character has been determined in terms of predeformation rate, heating temperature and holding time. Keywords: AA7075, Semi-solid Processing, ECAP
Introduction With copper as the main alloying addition, alloys from the 7XXX family offer high strength at low specific weight and are widely employed in the form of forged parts for aircraft structural components (I.J. Polmear 1996 and J.E. Hatch 1984). However, they suffer low forging speeds, require high pressures (M. Goncalves 2002) and are thus assigned a low forging index. Hence, it is very attractive to forge these alloys in the semi-solid state for technical as well as economic reasons. Thixoforging process offers higher productivity, lower pressures and energy consumption, longer die life and more uniform microstructures than conventional forging at competitive cost (K. Kiuchi 2014)
Semi-solid research and develop studies are ongoing and usually contain pre-feedstock preparations and semi-solid forming. Forming of a metal in semi-solid state can only be managed with a material which has globular microstructure showing thixotropic behaviour (Kirkwood 1994; Choi and Park 1998; Tzimas and Zavaliangos 2000). Although different methods have been invented in order to get this microstructure, most of them are complex and need special apparatus (Bergsma 1996; Tzimas and Zavaliangos 2000; Margarido and Robert 2003; Liu et al. 2003). But SIMA process, based on partially melting, recrystallization and occurring of equiaxed globular microstructure, is easy to use, has simple equipment and minimum subsequent problems. Thus, researchers widely prefer SIMA process (Young et al. 1983; Yong et al. 2001; Dong et al. 2003; Zoqui 2003; Chayong et al. 2004; Wang et al. 2008; Akar 2011). While casting and forging of aluminium alloys in the semi-solid state have received a great deal of attention in recent years M.C. Flemings (1991) and Birol (2001) there are very few reports on ECAP based thixoforging (S.K. Kim 2007). In this study, feed stock of semi-solid forging will be deformed by ECAP (Equal Channel Angular Pressing) which is one of the severe plastic deformation processes. ECAP is an operation that involves simple shear deformation. While squire or circular cross sectioned material is passed into the “L” shaped die, which have horizontal and vertical channels with an inner angle (Φ) and an outer angle (Ψ), will be severe plastic deformed by shear forges at the intersection of two channels. However, the material will not be subjected to any cross sectional changes. No cross sectional changing is the most important feature that distinguishes it from conventional methods.
Materials and Methods The EN AW-7075 alloy (Table 1) was supplied as industrially cast bar in T4 temper. Differential scanning calorimetry (DSC) was employed to determine the solidus and liquidus temperatures and thus the solidification interval of the present alloy. 3mm diameter disc samples, weighting about 30 mg were cut and placed into alumina pans in an argon atmosphere using a SETARAM Labysys DSC unit. The samples were heated at a rate of 2.5 Kmin-1 between 450 C and 700 C. The heat flow vs. temperature curves obtained by DSC were used to calculate the change in liquidsolid fractions with temperature.
The Online Journal of Science and Technology - January 2019 Volume 9, Issue 1
www.tojsat.net Copyright © The Online Journal of Science and Technology 53
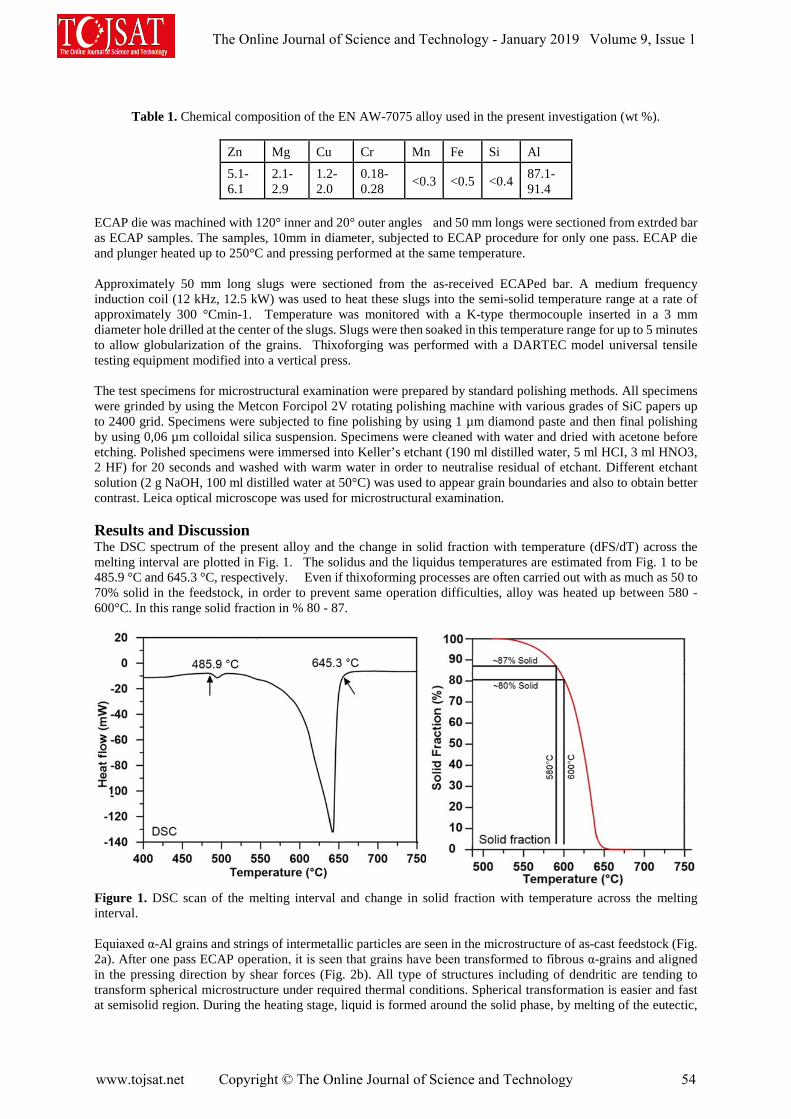
Table 1. Chemical composition of the EN AW-7075 alloy used in the present investigation (wt %).
Zn Mg Cu Cr Mn Fe Si Al 5.1-6.1
2.1-2.9
1.2-2.0
0.18-0.28 <0.3 <0.5 <0.4 87.1-
91.4
ECAP die was machined with 120° inner and 20° outer angles and 50 mm longs were sectioned from extrded bar as ECAP samples. The samples, 10mm in diameter, subjected to ECAP procedure for only one pass. ECAP die and plunger heated up to 250°C and pressing performed at the same temperature. Approximately 50 mm long slugs were sectioned from the as-received ECAPed bar. A medium frequency induction coil (12 kHz, 12.5 kW) was used to heat these slugs into the semi-solid temperature range at a rate of approximately 300 °Cmin-1. Temperature was monitored with a K-type thermocouple inserted in a 3 mm diameter hole drilled at the center of the slugs. Slugs were then soaked in this temperature range for up to 5 minutes to allow globularization of the grains. Thixoforging was performed with a DARTEC model universal tensile testing equipment modified into a vertical press. The test specimens for microstructural examination were prepared by standard polishing methods. All specimens were grinded by using the Metcon Forcipol 2V rotating polishing machine with various grades of SiC papers up to 2400 grid. Specimens were subjected to fine polishing by using 1 µm diamond paste and then final polishing by using 0,06 µm colloidal silica suspension. Specimens were cleaned with water and dried with acetone before etching. Polished specimens were immersed into Keller’s etchant (190 ml distilled water, 5 ml HCI, 3 ml HNO3, 2 HF) for 20 seconds and washed with warm water in order to neutralise residual of etchant. Different etchant solution (2 g NaOH, 100 ml distilled water at 50°C) was used to appear grain boundaries and also to obtain better contrast. Leica optical microscope was used for microstructural examination. Results and Discussion The DSC spectrum of the present alloy and the change in solid fraction with temperature (dFS/dT) across the melting interval are plotted in Fig. 1. The solidus and the liquidus temperatures are estimated from Fig. 1 to be 485.9 °C and 645.3 °C, respectively. Even if thixoforming processes are often carried out with as much as 50 to 70% solid in the feedstock, in order to prevent same operation difficulties, alloy was heated up between 580 - 600°C. In this range solid fraction in % 80 - 87.
Figure 1. DSC scan of the melting interval and change in solid fraction with temperature across the melting interval. Equiaxed α-Al grains and strings of intermetallic particles are seen in the microstructure of as-cast feedstock (Fig. 2a). After one pass ECAP operation, it is seen that grains have been transformed to fibrous α-grains and aligned in the pressing direction by shear forces (Fig. 2b). All type of structures including of dendritic are tending to transform spherical microstructure under required thermal conditions. Spherical transformation is easier and fast at semisolid region. During the heating stage, liquid is formed around the solid phase, by melting of the eutectic,
The Online Journal of Science and Technology - January 2019 Volume 9, Issue 1
www.tojsat.net Copyright © The Online Journal of Science and Technology 54
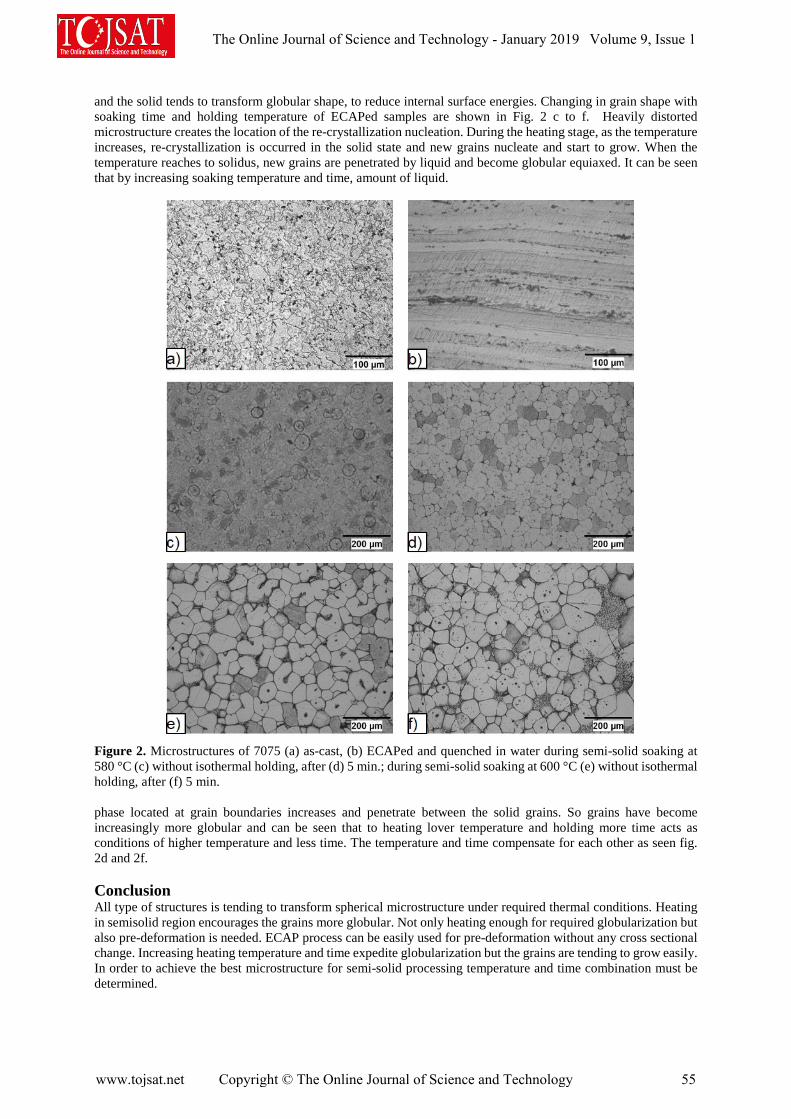
and the solid tends to transform globular shape, to reduce internal surface energies. Changing in grain shape with soaking time and holding temperature of ECAPed samples are shown in Fig. 2 c to f. Heavily distorted microstructure creates the location of the re-crystallization nucleation. During the heating stage, as the temperature increases, re-crystallization is occurred in the solid state and new grains nucleate and start to grow. When the temperature reaches to solidus, new grains are penetrated by liquid and become globular equiaxed. It can be seen that by increasing soaking temperature and time, amount of liquid.
Figure 2. Microstructures of 7075 (a) as-cast, (b) ECAPed and quenched in water during semi-solid soaking at 580 °C (c) without isothermal holding, after (d) 5 min.; during semi-solid soaking at 600 °C (e) without isothermal holding, after (f) 5 min. phase located at grain boundaries increases and penetrate between the solid grains. So grains have become increasingly more globular and can be seen that to heating lover temperature and holding more time acts as conditions of higher temperature and less time. The temperature and time compensate for each other as seen fig. 2d and 2f. Conclusion All type of structures is tending to transform spherical microstructure under required thermal conditions. Heating in semisolid region encourages the grains more globular. Not only heating enough for required globularization but also pre-deformation is needed. ECAP process can be easily used for pre-deformation without any cross sectional change. Increasing heating temperature and time expedite globularization but the grains are tending to grow easily. In order to achieve the best microstructure for semi-solid processing temperature and time combination must be determined.
The Online Journal of Science and Technology - January 2019 Volume 9, Issue 1
www.tojsat.net Copyright © The Online Journal of Science and Technology 55

References Akar, N. (2001) AA2024 alaşımında sima yöntemi ile tiksotropik yapı üretimi üzerine yeniden ısıtma sıcaklığının
etkisi, J. Fac. Eng. Arch. Gazi Univ., 26, 381-388. Bergsma, S. G.(1996) Casting, thermal transforming and semi-solid forming aluminum alloys, US Patent &
Trademark Office, 5.571.346, 2-5. Birol Y., Güven E. A. and Çapan L. (2011), Mater Sci Tech-Lond 27 1851. Chayong, S., Atkinson, H. V., Kapranos, P. (2004) Multistep induction heating regimes for thixoforming 7075 aluminium alloy, Materials Science and Technology, 20, 490-496. Choi, C., Park, H. J. (1998) Microstructural characteristics of aluminum 2024 by cold working in the sima process,
Journal of Materials Processing Technology, 82, 107-116. Dong, J., Cui, J. Z., Le, Q. C., Lu, G. M. (2003) Liquidus semi solid casting reheating and thixoforming of a
wrought aluminum alloy 7075, Materials Science and Engineering, A345, 234–242. Haghdadi, N., Zarei-Hanzaki, A., Heshmati-Manesh, S., Abedi, H.R., Hassas-Irani, S.B. (2013) The semisolid
microstructural evolution of aseverely deformed A356 aluminum alloy, Materials and Design, 49, 878–887.
I.J. Polmear (1996) Light Alloys – Metallurgy of the Light Metals, Halsted Press, London. J.E. Hatch (1984) Aluminium Properties and Physical Metallurgy, ASM, Metals Park, Ohio. Kapranos, P., Ward, P. J., Atkinson, H. V., Kirkwood, D. H. (2000) Near net shaping by semi-solid metal
processing, Materials and Design 21, 387-394. Kirkwood, D. H. (1994) Semisolid metal processing, International Materials Reviews, 39, 173- 189. Liu, D., Atkinson, H. V., Kapranos, P., Jirattiticharoen, W., Jones, H. (2003), Microstructural evolutionand tensile
mechanical properties of thxiformed high performace aluminium alloys, Materials Science & Engineering, A361, 213-224.
Margarido, M., Robert, M. H. (2003). Influence of thermomechanical treatments on the production of rheocast slurries by partial melting, Journal of Materials Processing Technology, 133, 149–152.
M.C. Flemings (1991) Metall. Trans. A, 22A, 957-981. M. Goncalves, M.G. Martins, W.Z. Misiolek & W.H. VanGeertruyden (2002): Mater. Sci. Forum, 396-402, 393-
398. S.K. Kim, Y.Y. Yoon, H.H. Jo (2007) J. Mater. Process. Technol., 187-188, 354–357. Tzimas, E., Zavaliangos, A. (2000) A comparative characterization of near-equiaxed microstructures as produced
by spray casting, magnetohydrodynamic casting and the stres induced, melt activated process, Materials Science and Engineering A, A289, 217-227.
Wang, J. G., Lin, H. Q., Li, Y. Q., Jiang, Q. C. (2008) Effect of initial as-cast microstructure on semisolid microstructure of AZ91D alloy during the strain-induced melt activation process, Journal of Alloys and Compounds, 457, 251-258.
Yong, L. S., Hwan, L. J., Seon, L. Y. (2001) Characterization of Al 7075 alloy after cold working and heating in the semi-solid temperature range, Journal of Materials Processing Technology, 111, 42-47.
Young, K. P., Kyonka, C. P., Courtois, J. A. (1983) Fine grained metal composition US Patent & Trademark Office, 4.415.374, 1-4.
Zoqui, E. J. (2003) Morphological analysis of ssm Al-4,5 wt. % Cu measured by the rheocast quality ındex, Journal of Materials Processing Technology, 143-144, 195-201.
The Online Journal of Science and Technology - January 2019 Volume 9, Issue 1
www.tojsat.net Copyright © The Online Journal of Science and Technology 56
APPLICATION OF THE FMEA FOR ANALYZING DEPENDABILITY OF POWER TRANSFORMER AT HASSI R'MEL GAS FIELD
Bouchra NADJI , El laid BOUCHTOB, RazikaTAHI
Laboratoire d'Electrification des Entreprises Industrielles, Faculté des Hydrocarbures et de la Chimie,Université M'Hamed Bouguara de Boumerdes,Algeria
[email protected], [email protected]
Abstract:Transformers are essential elements in electrical network. These equipments are classically constructed out of copper, steel, paper and insulating oil. Transformers have been used worldwide for many years and their availability and reliability is a major concern for all electricity users. This paper describes the use of the failure modes analysis and their effects (FMEA) for analyzing the dependability of power Transformer in boosting station at Hassi R'Mel gas field in Algeria..
Keywords: Transformer, Dependability, Power, FMEA, failure, Availability
Introduction The south Algeria has natural ressources, among which the hydrocarbon reserves, hence the presence of a wide range of products related to oil and gas fields. For the separation of these products and their derivatives, Algeria has acquired and installed the large treatment complexes, such as the Hassi R'mel complex. The overall plan for gas installations located on the Hassi R'mel field is designed to allow a rational exploitation of the deposit and recover the maximum of liquid. In the installations implemented, three boosting stations were installed . In the central zone, we find SBC. This is a gas discharge unit; it increases the pressure and maintains the deposit flow of the modules supply. The SBC complex is powered by two arrivals and a generator in emergencies. All energy distribution is made using substations in the complex. The Boosting unit is considered the strategic point of the HASSI R'MEL region. Therefore, it must be always available and reliable. The transformer 30 / 5,5KV,10MVA is the essential element in it electrical network of this Boosting station and it’s reliability is more important. Analyzing the dependability parameters of industrial systems such transformer can be done with different methods. The famous method has been used; the failure modes analysis and their effects (FMEA).The FMEA is an inductive technique, it adds to identify the failure modes of an item, the causes of each mode and the effects on the function of the item. The results of FMEA are generally represented into a table.
Materials and Methods Failure modes and effects analysis (FMEA) is a procedure by which each potential failure mode in a system is analyzed to determine the results or effects there of on the system and to classify each potential failure mode according to its severity. It has been used firstly on 1960 in aeronautic for analyzing air plans security, A.Villemeur (1988).
First and in order to make the rest of the paper clear, we take these definitions: failure: Termination of the ability of an item to perform its required functions. failure cause: The circumstances during design, manufacture, or use which have led to failure; syn: root cause. failure mode: The manner in which failure occurs; generally categorized as electrical, mechanical, thermal, and contamination. Before applying the FMEA to our system, we will describe the different constraints that may occur during operation.
Constraints and associated defects:
-constraint: Each transformer is sized to take a number of nominal constraints (mechanical, dielectric, thermal)due to disturbances (lightning strike, short circuit, etc .) , which partially reflect the operating conditions. Someof these constraints may cause defects, or impact the life of a transformer.
The Online Journal of Science and Technology - January 2019 Volume 9, Issue 1
www.tojsat.net Copyright © The Online Journal of Science and Technology 57

- Failure: Accidental change affecting normal operation. In this work a defect will be seen as an internal physical problem visually identifiable by an expert, during access to the active part, which can stop or having stopped the normal operation of the device.
-Symptom: Sign indicative of a material situation. In our case,a given internal defect will generate one or more symptoms. Symptoms may be highlighted following analysis of available information.
In this work, a defect is the result of a constraint that could not be contained. Any defect will manifest itself by symptoms that one will try to qualify by different information and means of measurement. The transformer being a complex object located in a tank, its internal access is not obvious and the visual confirmation of these internal defects is not so either, especially the removal of transformer windings operation is never innocuous, and relatively expensive. In the worst case, it is sometimes possible to go to the explosion of the transformer.
The différents constraints of a transformateur, J.Sanchez (2011) are :Dielectrics stress and overvoltage , Electrodynamic and overcurrent constraints; Electrical constraints;Thermal constraints (overloads, hot spots and aging);Contraintes électromagnétiques et courants de Foucault ; Contraintes mécaniques (vibrations, fuites et transport ions, fuites et transport). All these constraints can therefore be the cause of various defects within a transformer.
Results and Discussion Table 1,2 and 3 represent the synthesis of FMEA applied to our transformer using the results published by B.William 2000.It is noted that a large part of the failures of the elements of these tables have a direct impact on the insulators which themselves affect the availability transformer availability.
In transformers and more particularly in power transformers, insulating solids provide several functions. They are used to mechanically maintain the windings and to materialize the coolant circulation channels . By their dielectric nature, the papers isolate electrically the coils between them. In addition, their porosity allows them to be impregnated by the insulating liquid and coolant circulating in the transformer. The dielectric stress characterizes the voltage withstand of the various transformer elements. This dielectric strength within the transformer is related to the paper insulator ( to insulate the conductors) , dielectric oil( immerses the whole of transformer active and bushing. For Normal constraints(stress), the transformer must normally withstand its nominal AC voltage .
For abnormal stress, the two most important normalized dielectric stresses are lightning strikes ( 1452KV in 200µs) and shocks (1050 kV in 200 μs), which are very brief high voltage phenomena.
The dielectric stress can cause several faults; priming and partial discharges. If the characteristics of the insulators degrade too much, due to excessive internal humidity for example, or are forced beyond their limits then it can develop; Priming devices under voltage:
- Between them: as between windings or between turns. - With the mass: as the initiation of a crossing or a winding to the tank or to the magnetic circuit.
Partial discharges: Inside an insulation, classically solid in transformers. These are micro local dumps that tend to spread over time.
All these defects create carbon, which is conductive, thus impacting the dielectric strength locally. This phenomenon being irreversible, it is impossible to find a normal operation following a dielectric priming.
The Online Journal of Science and Technology - January 2019 Volume 9, Issue 1
www.tojsat.net Copyright © The Online Journal of Science and Technology 58
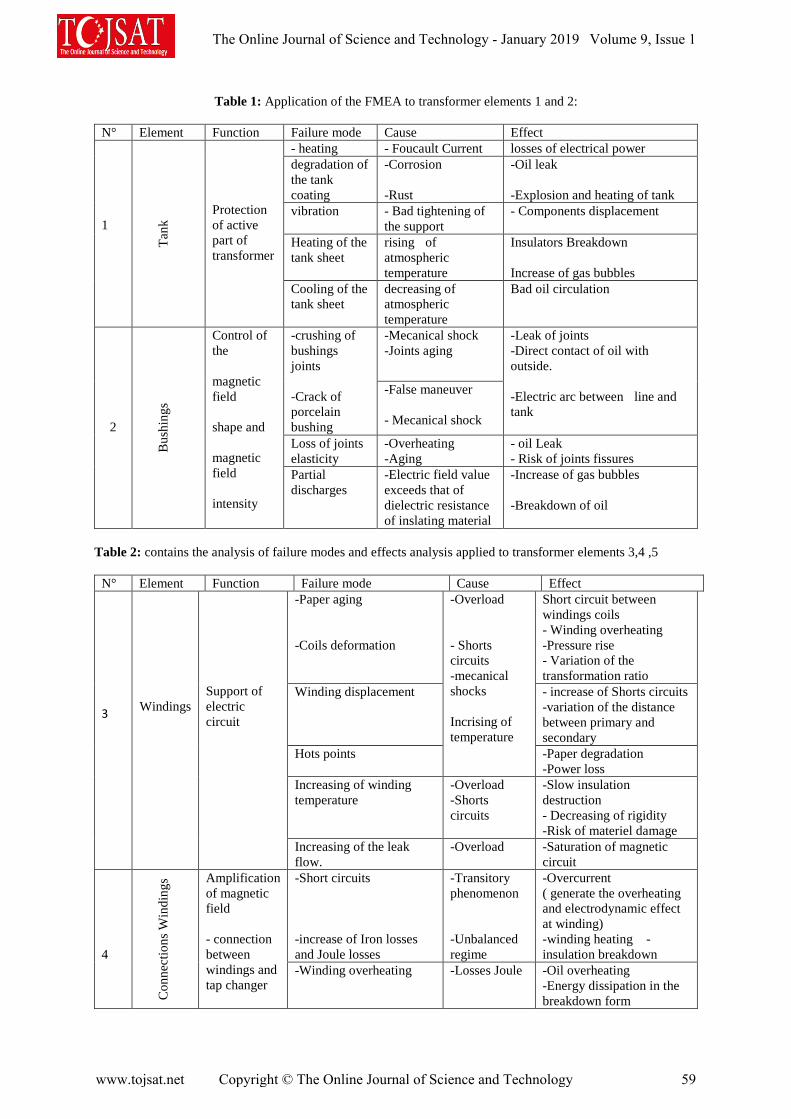
Table 1: Application of the FMEA to transformer elements 1 and 2:
N° Element Function Failure mode Cause Effect 1
Tank
Protection of active part of transformer
- heating - Foucault Current losses of electrical power degradation of the tank coating
-Corrosion -Rust
-Oil leak -Explosion and heating of tank
vibration - Bad tightening of the support
- Components displacement
Heating of the tank sheet
rising of atmospheric temperature
Insulators Breakdown Increase of gas bubbles
Cooling of the tank sheet
decreasing of atmospheric temperature
Bad oil circulation
2 B
ushi
ngs
Control of the magnetic field shape and magnetic field intensity
-crushing of bushings joints -Crack of porcelain bushing
-Mecanical shock -Joints aging
-Leak of joints -Direct contact of oil with outside. -Electric arc between line and tank
-False maneuver - Mecanical shock
Loss of joints elasticity
-Overheating -Aging
- oil Leak - Risk of joints fissures
Partial discharges
-Electric field value exceeds that of dielectric resistance of inslating material
-Increase of gas bubbles -Breakdown of oil
Table 2: contains the analysis of failure modes and effects analysis applied to transformer elements 3,4 ,5
N° Element Function Failure mode Cause Effect 3
Windings
Support of electric circuit
-Paper aging -Coils deformation
-Overload - Shorts circuits -mecanical shocks Incrising of temperature
Short circuit between windings coils - Winding overheating -Pressure rise - Variation of the transformation ratio
Winding displacement - increase of Shorts circuits -variation of the distance between primary and secondary
Hots points -Paper degradation -Power loss
Increasing of winding temperature
-Overload -Shorts circuits
-Slow insulation destruction - Decreasing of rigidity -Risk of materiel damage
Increasing of the leak flow.
-Overload -Saturation of magnetic circuit
4
C
onne
ctio
ns W
indi
ngs Amplification
of magnetic field - connection between windings and tap changer
-Short circuits -increase of Iron losses and Joule losses
-Transitory phenomenon -Unbalanced regime
-Overcurrent ( generate the overheating and electrodynamic effect at winding) -winding heating -insulation breakdown
-Winding overheating -Losses Joule -Oil overheating -Energy dissipation in the breakdown form
The Online Journal of Science and Technology - January 2019 Volume 9, Issue 1
www.tojsat.net Copyright © The Online Journal of Science and Technology 59

-Association of windings connections
-short Circuit between winding and connections
-Insulation aging ( liquid,solid)
-Liquids breakdown -appearance of gas bubbles
-direct contact with tank -Single phase short circuit ,phase/ground
-Overheating Bad tightening
Variation of connection resistance -Overheatimg of oils
5
Insu
latio
n
Cooling of internal components
-Viscosity decrease
-Variation of internal temperature
-Difficult of oil circulation between coils,-Malfunction of the cooling function
- Change of oil color -Inflammation of hydrocarbon constituents
-Impurities -Poor detection of oil state. -Changement of oil color, -Changement of oil characteristics
Overheating -Arc of pre-breakdown
-Gravitational settling -Presence of solid particles
-Reduction of rigidity voltage of dielectric -Breakdown oil
-Overheating of oil Presence of leakage current
Dielectric losses
Table 3: contains the analysis of failure modes and effects analysis applied to insulation (element 5)
N Element Function Failure mode Cause Effect
5
Insu
latio
n
Isolation -Electric arc -Variation of oil dielectric capacitance
-Presence of humidity in paper
-Carbonization -Internal destruction of transformer - Variation of output voltage at secondary -Reduction of breakdown voltage -Increasing of impurities -Oil breakdown
-Presence of humidity in oil
-Deterioration of paper
-Increasing acidity
presence of ions Chemical reaction between the copper of windings and oil
Increasing of value of oil dielectric capacitance
contamination of oil by humidity
chemical reactions between molecules
Increasing of partial discharges -Increasing of breakdown number
The Online Journal of Science and Technology - January 2019 Volume 9, Issue 1
www.tojsat.net Copyright © The Online Journal of Science and Technology 60

Conclusion Using the FMEA for analyzing the dependability parameters is very important, it permit to find the critical points of the considered system. This method is a contribution to the study of the dependability of the power transformer, it’s allowed us to perform the functional analysis of our system namely the transformer. The identification of the modes, causes and effects of the failures of each element is important information for transformer diagnostics. References A.Villemeur (1988) Sûreté de fonctionnement des systèmes industriels.book . B. William, (2000), Analysis of Transformer failures,Proceedings of the sixty Ninth Annual International
Conference on Doble Clients. J.Sanchez (2011),aide au diagnostic de defaults des transformations de puissance Thése doctorat de l’université
de Grenoble,France. M.Karakache,B.Nadji ( 2004),Application of the FMEA and FTA for Analyzing Dependability of Generator
Phase Fault Protection System, IEEE Vehicular Power and Propulsion'04
The Online Journal of Science and Technology - January 2019 Volume 9, Issue 1
www.tojsat.net Copyright © The Online Journal of Science and Technology 61
BIOCHEMICAL PROPERTIES OF POLYPHENOL OXIDASE FROM DAUCUS CAROTA
Reyhan Gul Guven1, Kemal Guven2, Fatma Matpan Bekler3, Nurten Aslan1
1Dicle University, Education Faculty, Mathematic and Science Teaching Section, Diyarbakir, Turkey 2 Dicle University, Science Faculty, Molecular Biology and Genetics Section, Diyarbakir, Turkey
3 Dicle University, Science Faculty, Biology Section, Diyarbakir, Turkey Email: [email protected]
Abstract Polyphenol oxidase (PPO) is a very important enzyme that is responsible for the enzymatic browning of vegetables and fruits, which is undesired process and need to be prevented in food technology. In this study, PPO from Daucus carota pell (carrot) was extracted and some of its biochemical properties were investigated. The optimum temperature and pH of PPO were found to be 40 °C and 8.0, respectively. The Lineweaver – Burk plot analysis of the PPO was carried out and the Km and Vmax values were determined for the substrate catechol. We also found that some inhibitors such as SDS and sodyum azide inhibit the enzyme activity. This is the first study on characterisation of PPO from Daucus carota bark that may provide new insight into how to overcome the enzymatic browning.
Keywords: Polyphenol oxidase, Daucus carota, inhibition, characterisation.
Introduction Polyphenol oxidases (PPO; EC 1.14.18.1) belong to a set of copper containing metalloenzymes that are members of oxidoreductases, which catalyze the oxidation of a wide range of phenolic compounds by utilizing molecular oxygen (Queiroz, et al. 2008).
Polyphenol oxidases are widely spread in nature. They can be found in almost all living organisms including animals, plants, bacteria and fungi. PPO is important because it is responsible for skin, eye, inner ear and hair melanization, as well as browning in fruits and vegetables (Marín-Zamora et al., 2005). Particularly, when a plant gets a bruise, cut or damage, the enzyme leads to the oxidation of some phenolic compounds to form a polymer structure, resulting in protection of the plant against insects or microorganisms (VanGelder, et al., 1997). This process causing enzymatic browning of fruits and vegetables is undesirable in food technology as it results in loss of quality. In plant tissues, the browning pigments lead to organoleptic and nutritional modifications, thus depreciating the quality of the food product (Friedman, 1996; Sanchez-Ferrer et al., 1995).
Carrots (Daucus carota), one of the important root vegetables, are known for their nutrient contents β-carotene besides appreciable amount of vitamins and minerals (Walde et al. 1992). Phenolics in carrots are present throughout the roots but are highly concentrated in the periderm tissue (Mercier et al. 1994) Therefore, the higher level of phenolics and antioxidant properties in carrot peel treated as the waste in the processing industry could be considered for value-added utilization (Oviasogie et al.2009).
The inhibition of PPO activity and thus inhibition of browning is a big challenge for fruit and vegetable industry (Mayer, 2006). The purification and characterisation of this enzyme in many plants would lead to biotechnological control of its activity.
PPO characteristics have been studied in a wide variety of plants such as apple (Aydin et al., 2015), banana (Ünal, 2007), potato (Lourenço et al., 1992), broccoli (Gawlik-Dziki et al., 2007), ispir sugar bean (Sakiroglu et al., 2013), and Ataulfo mango (Cheema & Sommerhalter, 2015). This is the first report on the purification and characterisation of PPO from Daucus carota in order to understand how the enzymatic browning can be prevented in food technology. In the present study, PPO from Daucus carota was extracted and the kinetic parameters for catechol substrate was determined.
The Online Journal of Science and Technology - January 2019 Volume 9, Issue 1
www.tojsat.net Copyright © The Online Journal of Science and Technology 62
Material And Methods Materials and reagents The Daucus carota used in this study was purchased from a local market in Diyarbakir City, Turkey and frozen at -25 °C until used. Catechol was purchased from Merck (Darmstadt, Germany) Co. All chemicals used in this study were of analytical grade. Preparation and extraction of PPO from Daucus carota Five grams of Daucus carota bark were homogenized in the extraction solution (100 ml of 0.1 M phosphate buffer containing 4% PEG at pH 6.5 and 10 mM ascorbic acid) by using a blender for 5 min. The crude extract samples were centrifuged at 15000 g for 20 min at 4ºC. The homogenate was then filtered. Enzyme activity PPO activity was determined using a spectrophotometric method based on the initial rate of increase in absorbance at 420 nm. Enzyme activity was assayed in 3 ml of reaction mixture consisting of 0.1 ml substrate (0.1 M catechol) and 0.1 ml enzyme preparation in 0.1 M phosphate buffer (pH 6.5). PPO activity was determined by measuring the absorbance at 420 nm using an spectrometer. The blank consisted of 2.9 ml buffer and 0.1 ml substrate. PPO activity was assayed in triplicate and one enzyme unit was defined as the amount of enzyme that produces a rise of 0.001 absorbance in one minute at 420 nm. Effect of pH and temperature on PPO activity The effect of pH on PPO activity was determined using 0.1 mL of enzyme preparation, 0.1 mL of 0.1 M catechol and finally topped-up to 3 mL with 0.1 M sodium acetate buffer (pH 2-5) or 0.1 M sodium phosphate buffer (pH 6.0-9.0). Enzyme activity was measured spectrophotometrically in this buffering range according to the procedure described for the PPO activity assay. The optimum pH corresponding to the highest PPO activity was used for the study in order to determine the effect of inhibitors and temperature on enzyme activity. PPO activity was determined at different reaction temperatures in the range of 20-70°C using catechol as substrate. Analyses were performed in triplicate under the standard mixing conditions. The Effect of Buffer Concentration The effect of buffer concentration on the PPO enzyme was studied using 0.1-0.4 M concentrations of phosphate buffer using catechol as subsrate at an optimum pH. Enzyme kinetics and substrate specificity Michaelis-Menten constant (Km) and maximum velocity (Vmax) values of PPO were calculated using the substrates catechol (1-10 mM), under the optimized pH and temperature conditions. Km and Vmax values of PPO for substrate were obtained from a plot of 1/V versus 1/[S] by the method of Lineweaver and Burk (1934). Measurements were carried out in triplicate. Effects of inhibitors The effects of several inhibitors (EDTA, sodium azide, SDS) on PPO activity were studied. PPO activities were measured at (0.5 mM) inhibitor concentrations with substrate concentration of 3.3 mM. Results And Discussion Activity of Enzyme The activity of crude enzyme of Daucus carota was 40 units/ml. Sanni (2016) found result with two species of African mango obtaining the activity of crude enzyme values of 86.4 and 100 units/ml. Effect of pH and temperature As shown in Figures 1 and 2, optimum pH and temperature values were found to be pH 8.0 and 40 °C, respectively using the catechol as substrate. The previous studies also raported that optimum pH values were 7.0 for parsley (Lin et al., 2016), pH 5.5 for ispir sugar bean (Sakiroglu et al., 2013) using catechol as a substrate. It had been previously shown that different plant types exhibited different and similar optimum temperatures, such as 40 ºC for artichoke (Doğan et al.,2005), and for corn tassel (Gul Guven et al., 2015) using catechol as the substrate.
The Online Journal of Science and Technology - January 2019 Volume 9, Issue 1
www.tojsat.net Copyright © The Online Journal of Science and Technology 63

Figure 1. Effect of pH on PPO activity
Figure 2. Effect of temperature on PPO activity Determination of Ionic Strength The effect of ionic strenght on thr PPO enzyme was studied using 0.1-0.4 M concentrations of phosphate buffer using catechol as subsrate at an optimum pH. PPO enzyme at a buffer concentration 0.1 M was determined.
0
20
40
60
80
100
120
2 3 4 5 6 7 8 9 10
Rela
tive
activ
ity %
pH
0
20
40
60
80
100
120
20 30 40 50 60 70
Rela
tive
activ
ity %
Temperature 0C
The Online Journal of Science and Technology - January 2019 Volume 9, Issue 1
www.tojsat.net Copyright © The Online Journal of Science and Technology 64

Figure 3: The effect of buffer concenration Kinetic characteristics of PPO The variation in the Daucus carota PPO activity was determined as a function of substrate (catechol) concentration. For the determination of Michaelis-Menten constant (Km) and maximum velocity (Vmax) values of the enzyme, PPO activities were measured using the concentrations of catechol (1-10 mM) as substrates under optimized pH and temperature conditions. A plot of 1/V versus 1/[S] was drawn by the method of Lineweaver and Burk (1934) to calculate Km and Vmax values of purslane PPO for each substrate. Substrate specificity (Vmax/Km) was also calculated by using the data obtained on the Lineweaver-Burk plot. The Km and Vmax values obtained from the plot analysis of PPO were found as 21 mM and 1701 abs/min. for catechol. There have been many studies reported on the kinetics of PPO in different plant species, using catechol as substrate. The Km value is a measure of the affinity of the enzyme fort he substrate. A smaller Km value means higher affinity of the enzyme with the substrate and vice versa. Km values were found to vary in Hemşin apple (Aydin et al., 2015), mamey (Palma- Orozco et al., 2014) and Chinese Toon (Wang et al., 2013) as 6.8 mM, 44 mM and 10.059 mM, respectively.
Figure 4: Lineweaver-Burk plots for PPO activity with catechol as subsrate Effect of inhibitor The present study is the first report on the inhibition of PPO activity in Daucus carota. The effects of several inhibitors (SDS, EDTA, sodyum azide) on PPO activities were measured at 0.5 mM inhibitor concentration with 4 mM concentration of catechol.
00,005
0,010,015
0,020,025
0,030,035
0,040,045
0,05
0,1 0,2 0,4
Spec
ific
activ
ity
Buffer concentration (M)
The Online Journal of Science and Technology - January 2019 Volume 9, Issue 1
www.tojsat.net Copyright © The Online Journal of Science and Technology 65

Figure 5: The inhibition of PPO Conclusions In conclusion, PPO is a very important enzyme that is responsible for the enzymatic browning of vegetables and fruits, which is undesired process and need to be prevented in food technology. This work reports the extraction and characterization of PPO from Daucus carota the first time. The pH and temperature optima were found to be 8.0 and 40 °C for catechol. In this work, sodium azide, SDS and EDTA were found to inhibit the enzyme activity by 66 %, 37 % and 11 %, respectively. A buffer concentration of 0.1 M at was determined for PPO activitye. The Km and Vmax values obtained from the plot analysis of PPO were found as 21 mM and 1701 abs/min. for catechol, respectively. References Aydin, B., Gulcin,I., Alwasel S.H. (2015). Purification and Characterization of Polyphenol Oxidase from Hemşin
Apple (Malus communis L.). International Journal of Food Properties, 18:12, 2735-2745. Cheema, S., Sommerhalter, M.(2015) .Characterization of polyphenol oxidase activity in Ataulfo mango. Food
Chemistry, 171, 382-387. Dogan, S.; Turan, Y.; Erturk, H.; Arslan, O. Characterization and purification of polyphenol oxidase from
artichoke (Cynara scolymus L.). Journal of Agriculture and Food Chemistry 2005; 53, 776–785. Friedman, M. (1996).Food browning and its prevention: An overview. J.Agric.Food Chem.,44,631–653. Gawlik-Dziki, U., Szymanowska, U., Baraniak, B. (2007). Characterization of polyphenol oxidase from broccoli
(Brassica oleracea var. botrytis italica) florets. Food Chem, 105,1047-1053. Gul Guven, R., Aslan, N., Guven, K., Matpan Bekler, F., Acer, O. (2016). Purification and characterization of
polyphenol oxidase from corn tassel.Cellular and Molecular Biology.62,13,6-11. Lin, H., Ng, A.W.R., Wong, C. W. (2016). Partial purification and characterization of polyphenol oxidase from
Chinese parsley (Coriandrum sativum). Food Science and Biotechnology, 25(S): 91-96. Lineweaver, H., Burk, D.(1934). The determination of enzyme dissociation constants. Journal of American
Chemical Society , 56, 658-666. Lourenço E.J., Neves V.A., Da Silva M.A. (1992). Polyphenol Oxidase from Sweet Potato: Purification and
Properties. J Agric Food Chem, 40:2369-2373. Marín-Zamora, M.E., Rojas-Melgarejo, F., García-Cánovas, F., García-Ruíz, P.A.(2005). Cinnamic ester of D‐
sorbitol for immobilization of mushroom tyrosinase. Journal of Chemical Technology and Biotechnology, 80,1356–1364.
Mayer, A. M. (2006). Polyphenol oxidases in plants and fungi: Going places? A review. Phytochemistry, 67, 2318-2331.
Mercier JJ, Arul J, Julien C. Effect of food preparation on the isocoumarin 6-methoxymellein content of UV-treated carrots. Food Res Int. 1994;27:401–404.
Oviasogie OP, Okoro D, Ndiokwere CL. Determination of total phenolic amount of some edible fruits and vegetables. Afr J Biotechnol. 2009;8:2819–2820.
Palma-Orozco, G., Marrufo-Hernández, NA., Sampedro, JG., Nájera, H. (2014). Purification and partial biochemical characterization of polyphenol oxidase from mango (Mangifera indica cv. Manila).J Agric Food Chem., 8;62(40):9832-9840.
The Online Journal of Science and Technology - January 2019 Volume 9, Issue 1
www.tojsat.net Copyright © The Online Journal of Science and Technology 66

Queiroz, C., Lopes, M. L. M., Fialho, E., Valente-Mesquita, V. L. (2008). Polyphenol oxidase: Characteristics and mechanisms of browning control. Food Reviews International,24 (4):361-375
Sakiroglu, H., Yılmaz, E., Erat M., Öztürk, A.E.(2013).Selected properties of polyphenol oxidase obtained from ispir sugar bean .International Journal of Food Properties, 16, 1314–1321.
Sanchez-Ferrer, A., Rodriguez-Lopez, JN., Garcia-Carnovas, F., Garcia-Carmona, F. (1995).Biochim Biophys Acta,1247,1–11.
Sanni, D.M. (2016). Isolation, partial purification and characterization of polyphenoloxidase from two species of African Mango seeds (Irvingia gabonensis and Irvingia wombolu).Advances in Biochemistry. 4(4): 47-52.
Unal, M.U. (2007). Properties of polyphenol oxidase from Anamur banana (Musa cavendishii). Food Chem, 100: 909-913.
VanGelder, C. W. G., W. H. Flurkey., & H. J. Wichers. (1997). Sequence and structural features of plant and fungal tyrosinases. Phytochemistry,45 (7),1309-1323.
Walde, S.G., Math, R.G., Chakkarvarthı, A,. Rao, D.G.(1992). Preservation of carrots by dehydration techniques. A review. Indian Food Packer 46, 37–42.
Wang, C., Zhang, J.-F., Zhang, Y., & Cheng., Bing. (2013). Characterization and Inhibitors of Polyphenol Oxidase from Chinese Toon. Food Biotechnology,27 (3), 261-278.
The Online Journal of Science and Technology - January 2019 Volume 9, Issue 1
www.tojsat.net Copyright © The Online Journal of Science and Technology 67
CHALLENGES IN TEACHING GLOBAL SOFTWARE ENGINEERING TO UNDERGRADUATE STUDENTS: COURSE DESIGN
Vinitha Hannah Subburaj West Texas A&M University, School of Engineering, Computer Science, Mathematics,
Texas-USA [email protected]
Emily M. Hunt West Texas A&M University, School of Engineering, Computer Science, Mathematics, Texas-
Angela Spaulding West Texas A&M University, Killgore Research Center, Texas-
James D. Webb West Texas A&M University, IoT Innovation Laboratory, Texas-
Abstract: Unlike many courses in the field of computer science, teaching software engineering comes with a set of challenges. These major challenges can be categorized into five aspects, namely: (1) incorporating a case study based approach to the design of lectures and assignments, (2) including projects from a range of domains, technology, and platforms, (3) keeping up with rapid evolution of technology, (4) setting up a developmentenvironment enabling students to understand the impact of geographical, social, and culturalimplications on software development, and (5) having students understand the fact thatsoftware development is not simply a technical activity, but involves facilitating effectiveoperation of teams. Since software systems have now become an integral part of almostevery single industry, producing students who can develop and maintain systems that spanacross various industries is critical. This paper describes each of these challenges andpossible approaches towards overcoming these challenges. The focus of this paper willaddress the challenges of creating a course within an undergraduate computer sciencecurriculum to teach global software engineering. Due to the globalization of softwaredevelopment activities, industries are looking at recruiting students who are equipped withskills needed to deal with challenges around global software engineering. Designinginstructional materials and assessment tools to develop this unique mix of skill sets isaddressed in this paper. We also discuss both the traditional and non-traditional aspects ofteaching software engineering to computer science students.
Keywords: Global software engineering, Course design, Challenges
Introduction Software engineering has become an important course in the CS curriculum. Students entering into software engineering companies are expected to have a wide range of skills sets ranging from communication to purely technical skills. Most importantly, today’s computing industries operate across the globe where either their customers are from a different country or their development team operates from another country. Industries hiring CS students have a general observation that our students struggle with projects that require them to be operating in a global environment. Organizations have started to research and invest on bringing Global Software Engineering (GSE) into classrooms and teach students the needed skill set enabling them to succeed in a global project development environment. This paper is also one such effort of teaching GSE to undergraduate CS students and add it as a required course into the CS curriculum.
The Online Journal of Science and Technology - January 2019 Volume 9, Issue 1
www.tojsat.net Copyright © The Online Journal of Science and Technology 68

Global Software Engineering involves software engineering practices carried over a global setting. Today’s software development activities get distributed across the globe mainly to lower the development cost. By outsourcing development tasks to low-wage countries, the overall software development cost can be brought down. This introduces a scenario of global software development team who have to operate together to build a reliable software product. To remain competitive in the market, software companies have to deliver a product that gets used by global customers. This furthermore adds on challenges of building a software product that should satisfy requirements from multi-cultural settings, varying political, ethical, and societal backgrounds. Global software development teams have to ensure proper communication and planning to overcome language and time zone barriers. Non – functional aspects of the software like look and feel, ease of use, and aesthetics vary across the globe. If a software is built for global customers, then care should be taken to ensure that these non-functional aspects get addressed during the software design.
Teaching software engineering to Undergraduate students has become challenging due to the complex nature of evolving software systems. Simulating real world software development inside a classroom setting is not easy due to several resource constraints. Educators have been working on pedagogies that can effectively simulate the real- world software development experience for students. Teaching global software engineering is even more challenging compared to teaching software engineering. Simulating a global software engineering environment to teach the principles and practices of global software engineering is very challenging. In this paper, a sample syllabus is presented for educators to use in their curriculum. The global software engineering course design proposed in this paper has been done after careful analysis and through the experience of many years of offering software engineering coursework.
The rest of this paper is organized with a related work section, a teaching software engineering section, a global software engineering – course design section, and a summary section.
Related Work
Urban [11] addressed software engineering on the web through a graduate level course on software requirements and specifications. The course project involved the development of a web-based software tool that implemented the ANSI/IEEE standard on software requirements specifications. The graduate course was offered during the Fall 1998 semester. The concepts developed in the graduate course were followed through into an undergraduate senior-level software engineering project two course sequence during 1999. There were several other IEEE software engineering standards developed into web-based software engineering tools during subsequent years. Deiters, Constanze, et al. [4] stated that depending on the stakeholder located in a particular region, the distribution of the software development projects varies. There must always be a good combination of theory and practice for a software engineering program in a university. The paper brings forth the concepts behind the common teaching atmosphere for global software engineering called the GlobSELab. Based on the feedbacks obtained from the participants, the GlobSELab was added to the course. The lab describes the teaching intentions, project management, and quality assurance. Motivated by the experiences of the distributed practical course, foreign universities were invited to create a platform that correlate more of an industrial reality. The course will be of great benefit to provide solutions to typical problems of global software engineering.
Paasivaara, Maria, et al. [10] developed a course where they incorporated the concepts of distributed Scrum in a global software engineering (GSE) environment. The course adapts a combination of both agile methodologies and industry best practices. The previously used GSE courses used plan-driven methods. Whereas the distributed Scrum method is unique in assessing the student expectations and learning. A mixed-method approach has been employed to assess the learning, distributed collaboration, building trust, and inter-cultural collaboration. The results obtained from the analysis of data before, during, and after the course yielded the discussion about the
The Online Journal of Science and Technology - January 2019 Volume 9, Issue 1
www.tojsat.net Copyright © The Online Journal of Science and Technology 69

challenges in applying the skills, strategies to overcome the challenges, and the strategy effectiveness. Hence, distributed Scrum in combination with GSE would be considered as an important course design.
Lescher, Christian, et al. [6] in their paper have stated that GSE has brought forth several new challenges in the market. Some of them are geographic separation, various time zones, cultural and language barriers which causes a delay in the communication and often leads to quality and cost issues. In the paper, GSE was taught in two different classrooms in order to compare them with the traditional classroom setting. This approach resulted in the reflection on GSE key effects on communication issues, and distribution delay. This effort is intended to expand the work on interactive GSE exercises and to extend the set of exercises by evaluating additional exercises for teaching GSE.
Nordio, Martin, et al. [9] discussed several challenges that a software engineering student will face in distributed software development. A software engineering course was taught using globally distributed projects with an aim to prepare the student to meet such challenges. The paper presents the experience regarding an approach used to teach distributed software engineering. Even though the approach is an old method, improvements have been made based on the lessons learned by the authors. The API design has an important role in this approach. In addition, this approach has an emphasis on the development of communication skills as almost 30% of the time is spent by the student in a project by corresponding to communication. Beecham, Sarah, et al. [1] adopted a Global Teaming Model framework to describe the requirements of global software development. From the assessment of three small or medium sized enterprises (SME), GTM practices that are relevant to SMEs have been identified. Assessment was also done on the gap between practices addressed by GSE-Ed literature and the needs of SMEs engaged in GSD. Seven GTM practices were relevant and two were lacking. The analysis brings forth the complexity involved in the roles and responsibilities of the instructors in GSE-Ed courses. Hence, students face the reality that practitioners of SMEs need to actively participate in the education process. Beecham, Sarah, et al. [2] have also conducted a study in offering different options to CS educators teaching CS courses in a global setting. They specifically focussed on learning GSE theory and learning GSE by doing. Studies that take a hybrid approach of combining theory and practice were also included in this paper.
Matthes, Florian, et al. [8] stated that international aspects must be included in the education of software engineers along with technology and management. The paper described an applied approach that involved 43 participants at 5 different distributed academic institutions. The paper presented the lessons learned from recommendations by teaching staff and students. The approach introduced is expected to serve as a base foundation for similar GSE ventures.
Li, Yang, et al. [7] stated that software engineering is now facing challenges due to globalization. Many industries ensure global competitiveness by transferring a part of their development activities to distributed countries. Instructors face the problem of incorporating skills related to recent developments in global software engineering. The paper describes the exercises required for teaching GSE in a single class room and report the experiences. The students gain experience to work with various time zones and time management. Hence, such exercises could be included in the course curricula.
Kuhrmann, Marco, and Jürgen Münch [5] stated the importance to understand the need for interdisciplinary teamwork for a successful project execution. A course unit discussed in this paper, was used to create an awareness among students regarding the role of communication in distributed software development. The course unit presents: 1) an environment in which students can learn distributed agile software and 2) a controlled experiment instrument for organizing a small software project to be carried out in virtual teams. Some of the challenges faced by the students are to overcome the limitations, set up teams, and develop the application. The results due to poorly organized communication indicated that there were issues regarding technical, architecture and developmental resources. Hence, the lack of communication protocols can impact the team's coordination and performance.
Damian, Daniela, et al. [3] presented a framework for teaching GSD skills in collaboration with three universities. The findings from their research show that the students learned to recognize the importance of effective communication between clients and developers and how the GSD environment influenced the communication.
The Online Journal of Science and Technology - January 2019 Volume 9, Issue 1
www.tojsat.net Copyright © The Online Journal of Science and Technology 70

Teaching software engineering
The following are the issues and some solutions on addressing those issues while teaching software engineering. (1) incorporating a case study based approach to the design of lectures and assignments,
Adopting a single case study throughout the course work has proven not to be successful while covering different concepts of software engineering. While the other extreme of using too many case studies inside the coursework have also often confused the students. The approach that has proven to be useful is usually to take two different case study examples for preparing the lecture materials and use two or more complete different ones for coming up with assignments and in-class activities. Through this approach, the students get to understand the concepts by applying them to just enough case study examples. Usually referring to more than one textbook for case studies and also looking out for more real-world examples to help them understand the real-life scenarios has proved to be very successful.
(2) including projects from a range of domains, technology, and platforms,
Selecting appropriate projects from a range of domains, technology, and platforms is a key factor in teaching software engineering. By including projects from different domains, we can prepare students with skills sets needed to be successful in the real-world. A real challenge is developing these projects and preparing the students with the background information needed. For instance, if we include software projects from the healthcare domain, how do we prepare students with the background information on healthcare industries in general to help them build projects in this domain? How much time do we spend investigating the domain before we let the students perform the actual development? One of the solution to this problem is to have a system analysis and design course as a pre-requisite to this course where we can focus on teaching students analysis and design techniques. Requirements analysis techniques, such as root-cause analysis, informal benchmarking, observation, and outcome analysis, can be used to investigate the problems that come from different domains.
(3) keeping up with rapid evolution of technology,
The projects of choice and the technology used during software development should reflect current technology. By keeping up with the technology, we not only teach students on how to build with latest technology, but also use the latest CASE tools and techniques to aid project development. This situation is crucial and challenging due to rapid growth of software technology. By letting the students do technical feasibility analysis during the initial stages of project development, incorporating the use of CASE tools during software development, and the choice of hardware and software based on the industry needs will help handle this situation.
(4) setting up a development environment for enabling students to understand the impact of
geographical, social, and cultural implications on software development, and This challenging aspect addresses problems beyond just solving the problem and implementing a solution. Students usually try to overlook this phase and underestimate the importance. The non-functional aspects of software development needs to be included during the early phases of software development. Conducting a pre and post mortem analysis with respect to these aspects during software project development will help students understand and experiment the impact of geographical, social, and cultural implications during software development.
(5) having students understand the fact that software development is not simply a technical activity,
but involves facilitating effective operation of teams. Teamwork is an essential skill required for software engineering jobs. Efficient team management skills and their effective operation is key to successful completion of the project. Students come in with varying interoperable skill sets and are required to learn the importance of being responsible team players. Some of the proven methods of helping students to work efficiently in teams include: effective team formation, practice of recording team meeting minutes, maintaining an anonymous online team resolution center where students can report team problems and get solutions, having 2-3 teamwork assessments done during the course of project development, and having a percentage of the grade assigned for effectively working in teams.
The Online Journal of Science and Technology - January 2019 Volume 9, Issue 1
www.tojsat.net Copyright © The Online Journal of Science and Technology 71

GSE – Course Design
The prerequisite of this course should be a Requirements Engineering or System Analysis and Design course. Students should be able to clearly state the non-functional aspects of the project, such as the geographical, social, and cultural implications as requirements. Course design of a GSE course is provided in Appendix A. The course description, objectives, and the major components of the course are highlighted in the syllabus. 50% of the total weight has been assigned to global project development and the components with descriptions are detailed in Table 1.
This course provides the students with an opportunity that in the GSE course is unique when considering that many other course for group projects puts together students who immediately begin development of the software from a problem statement. The team formation activities that occur early in the GSE course will set the stage for enhanced communication, member strength analysis, and project management aspects.
The concepts in the GSE course adds a level of complexity to a software engineering course project that is not experienced in most other software engineering projects. The success of the students will transfer into software engineers who are industry ready.
Summary
Current literature clearly supports the need for global software engineering courses at the undergraduate level. This paper has provided the motivation and survey of earlier efforts for the development of global software engineering courses in a CS curriculum which includes issues and relevant solutions in teaching software engineering. The authors present GSE – Course Design which elaborated on one instance of a GSE course at the course information level including the syllabus that will be used during implementation fall 2018. The next step will be to gather data on the further design and implementation of the stated GSE course. Through continuous process improvement, the constituents will help drive course enhancements.
Appendix A CS – XXXX - Global Software Engineering
Prerequisites Requirements Engineering or System Analysis and Design Course Descriptions This course teaches the essential skills necessary to develop software systems in a global environment. This course will cover fundamental topics of a global software engineering life cycle process from requirements specifications to testing of a completed software system in a global setting. The course has an emphasis on essential communication skills required by the students to effectively conduct the software development process in a global setting. This course is project based involving practical implications along with team work. Projects for this course will be approved by the instructor in advance and will be originating from different countries. A major part of the course will involve students to work with global stakeholders to design and develop software systems. Students will be supervised and are expected to be well organized while working with team members and developing their presentation and management skills. Objectives After completion of the course, students will be able to
• Select appropriate software life cycle process models to be used for global software development • Describe and apply fundamentals of software engineering methodologies and techniques to build projects
on a global setting • Recognize the importance and challenging aspects of gathering software requirements especially when the
customers are geographically distant • Translate software requirements to design, design to code, and then test the software system based on
appropriate global software engineering methodologies • Choose appropriate CASE tools, models, design patterns, architecture, and programming language for
global software engineering • Employ team work – that includes project management skills, interpersonal, and communication skills in a
global setting • Describe different software testing methodologies that have been effective with global software engineering
The Online Journal of Science and Technology - January 2019 Volume 9, Issue 1
www.tojsat.net Copyright © The Online Journal of Science and Technology 72
Grading Policy
Class attendance and participation 5% Homework/Lab assignments 15% Project 50% Exam (2 midterms 10% each, 1 final 10%) : 30% Total: 100%
Table 1: Project Grade Distribution Here is the breakdown of how the project grade is being calculated.
S.No Tasks Description Weights 1. Project plan and feasibility
analysis During the first two weeks, students are required to establish communication with their global customer as directed by the instructor. They are required to come up with a project plan and also conduct feasibility study.
5%
2. Decide on a software life cycle model and establish modes of contact with the global customer
Choice of a suitable software development life cycle (SDLC) model along with effective modes of communication between the team and customer is very important.
5%
3. Requirements analysis Based on the choice of SDLC, this phase would differ. A good understanding of the requirements is essential for all project development.
10%
4. Design Design and implementation will be done by the project teams with constant feedback from their global customer.
15%
5. Implementation 20% 6. Testing Testing will be done by another team different
from the ones who developed this project. Test data and the methodology should be clearly specified by the project developers. The other team should consider themselves working in a different country and follow the practices followed in that specific country to conduct the testing.
10%
7. Appropriate use of software tools Post-mortem analysis of what went well and what can be improved
The appropriate use of technology will be weighed as a factor contributing to the performance of the project members. Factors that led to success and failure of the project will be documented by the student.
10%
8. Documentation Meeting minutes
Documentation of the entire project development along with the minutes recorded during every meeting should be reported.
10%
9. Customer evaluation and feedback
Rubrics will be provided to the customers for evaluating the teams working on their requirements.
5%
10. Final Presentation 10% Total: 100%
The Online Journal of Science and Technology - January 2019 Volume 9, Issue 1
www.tojsat.net Copyright © The Online Journal of Science and Technology 73

References Beecham, Sarah, et al. "Challenges and recommendations for the design and conduct of global software engineering
courses: A systematic review protocol." Tech. Rport Lero_TR_2015_01 (2015). Beecham, Sarah, Tony Clear, and John Noll. "Do we teach the right thing?: A comparison of global software
engineering education and practice." Proceedings of the 12th International Conference on Global Software Engineering. IEEE Press, 2017.
Damian, Daniela, Allyson Hadwin, and Ban Al-Ani. "Instructional design and assessment strategies for teaching global software development: A framework." Proceedings of the 28th International Conference on Software engineering. ACM, 2006.
Deiters, Constanze, et al. "Glose-lab: Teaching global software engineering." Global Software Engineering (ICGSE), 2011 6th IEEE International Conference on. IEEE, 2011.
Kuhrmann, Marco, and Jürgen Münch. "Distributed software development with one hand tied behind the back: A course unit to experience the role of communication in GSD." Global Software Engineering Workshops (ICGSEW), 2016 IEEE 11th International Conference on. IEEE, 2016.
Lescher, Christian, Yang Li, and Bernd Bruegge. "Teaching global software engineering: Interactive exercises for the classroom." Global Software Engineering (ICGSE), 2014 IEEE 9th International Conference on. IEEE, 2014.
Li, Yang, et al. "Teaching global software engineering by simulating a global project in the classroom." Proceedings of the 47th ACM Technical Symposium on Computing Science Education. ACM, 2016.
Matthes, Florian, et al. "Teaching global software engineering and international project management." Proceedings of the 3rd International Conference on Computer Supported Education. Noordwijkerhout, Netherlands. 2011.
Nordio, Martin, et al. "Teaching software engineering using globally distributed projects: The DOSE course." Proceedings of the 2011 Community Building Workshop on Collaborative Teaching of Globally Distributed Software Development. ACM, 2011.
Paasivaara, Maria, et al. "Teaching students global software engineering skills using distributed scrum." Software Engineering (ICSE), 2013 35th International Conference on. IEEE, 2013.
Urban, Joseph. “Software engineering on the web.” Proceedings of the 3rdInternational Conference on Business Information Systems, Springer, 1999.
The Online Journal of Science and Technology - January 2019 Volume 9, Issue 1
www.tojsat.net Copyright © The Online Journal of Science and Technology 74
COMPARISON OF ACTIVATED CARBON PRODUCED FROM CAROB STONES WITH 4A ZEOLITE FOR ALLURA RED AC DYE
ADSORPTION
Fatma OĞUZ ERDOĞAN Kocaeli University, Kocaeli Vocational School, Department of Chemistry and Chemical Processing
Technologies, Kocaeli- TURKEY [email protected]
Abstract: The objective of the study was to prepare low-cost activated carbon from carob stones (Ceratonia siliqua) and compaire its adsorption behavior for allura red dye with that of a commercial 4A zeolite. The carob stones activated carbon (AC) and commercial 4A zeolite (4AZ) were characterized BET surface area, micropore volume, total pore volume, average pore size. Adsorption of a food dye, allura red, by AC and 4AZ was examined. The experimental adsorption equilibrium data were compared with the Langmuir and Freundlich isotherm models and the isotherm model parameters were determined. Pseudo-first-order and pseudo-second-order equations were fitted to the kinetic data, and the rate constants were evaluated. Results showed that activated carbon produced from carob stones is suitable for the adsorption of allura red food dye and could be used as a low cost effective adsorbent in the treatment of the industrial wastewater. Keywords: Carob stones, 4A zeolite, activated carbon, allura red, food dye.
Introduction Activated carbon is one of the widely used adsorbents in removal of food dyes because of its large surface area, pore size distribution and high adsorption capacities. Activated carbon is produced from variety of raw materials such as cherry stones, apricot stones, cornelian cherry stones, olive stones, wood and coal. Activated carbons can be produced by chemical activation. Chemical activation is a single step method for the preparation of raw material in the presence of chemical agent such as KOH, NaOH, LiOH, ZnCl2 and H3PO4 (Erdogan 2016; Erdogan and Erdogan 2016). Philip (1996) produced activated carbon from apricot stones by activation with H3PO4. The highest spesific surface area and micropore volume and mean pore radius were found as 1603 m2/g, 0.752 cm3/g, 9.4 Å, respectively. Erdogan (2016) produced activated carbons from cherry stones by KOH and NaOH treatments. The highest specific surface area and micropore volume were found as 1380 m2/g and 0.630 cm3/g, respectively. Li et al. (2008) prepared coconut shell based activated carbons at carbonization temperatures ranging from 400-1000 °C. In their study, BET surface area and micropore volume of the sample obtained were 1926 m2/g and 0.931 cm3/g, respectively. Erdogan and Erdogan (2016) prepared activated carbon by chemical treatment (H3PO4) from cherry stones for dye adsorption. Zeolites are microporous and crystalline silicates commonly used as adsorbents in various chemical reaction. Dyes are widely used in food, textile paper and cosmetic industries. Allura red belongs to the monoazo class of synthetic food colourants. Chemically it is identified as Red No. 40 and this compound is disodium6-hydroxy-5-(2methoxy-5-methyl-4-sulphophenylazo)-2-naphthalenesulphonate (Sánchez-Duarte et al. 2012). The main objects of this study are: (i) to study the feasibility of using the activated carbons produced from carob stones as a low-cost adsorbent for the removal of allura red dye, (ii) to compare its adsorption behavior for food dye to that of a commercial 4A zeolite (iii) to determine the applicability of various isotherm models (Langmuir and Freundlich) to find out the best-fit isotherm equation and (iv) to determine kinetic parameters and explain the nature of the adsorption.
Materials and Methods In this study, carob stones were obtained from Antalya in Turkey. The precursor, carob stones were first air dried, then crushed. Then, carob stones were contacted with dilute a 15 vol.% sulfuric acid solution for 12 hours and washed with hot distilled water. 4A zeolite (4AZ) was purchased from Sigma-Aldrich.
Preparation of the activated carbon: 20 g of dried carob stones (<2 mm) was mixed in a beaker with 200 mL of LiOH solution which corresponded to an impregnation ratio of 4:1 (weight of impregnation reagent/weight of carob stones) for 10 hours at 65°C. The mixtures were immersed in the ultrasonic bath for 120 minutes at 65°C and then the impregnated sample was then dried over a night in a moisture oven at 120°C. Then, the impregnated sample was carbonized in a tube furnace (Protherm STF) under N2 flow at a heating rate of 10°C/min up to 700°C for 1 hour. After the activation, the sample was allowed to cool down to the room temperature under N2 flow before its removal from the furnace. The activated sample was washed several times with HCl and hot distilled water to remove residual chemicals until it did not give chloride reaction with AgNO3. The activated sample was dried for
The Online Journal of Science and Technology - January 2019 Volume 9, Issue 1
www.tojsat.net Copyright © The Online Journal of Science and Technology 75
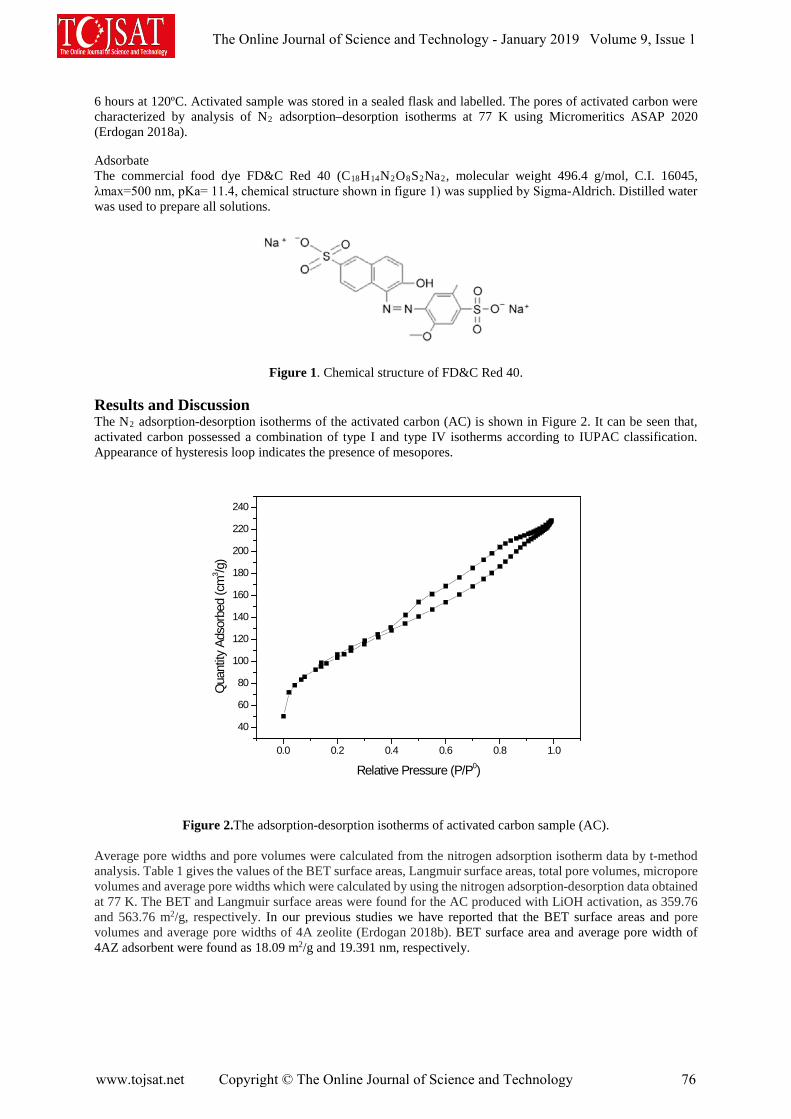
6 hours at 120ºC. Activated sample was stored in a sealed flask and labelled. The pores of activated carbon were characterized by analysis of N2 adsorption–desorption isotherms at 77 K using Micromeritics ASAP 2020 (Erdogan 2018a).
Adsorbate The commercial food dye FD&C Red 40 (C18H14N2O8S2Na2, molecular weight 496.4 g/mol, C.I. 16045, λmax=500 nm, pKa= 11.4, chemical structure shown in figure 1) was supplied by Sigma-Aldrich. Distilled water was used to prepare all solutions.
Figure 1. Chemical structure of FD&C Red 40. Results and Discussion The N2 adsorption-desorption isotherms of the activated carbon (AC) is shown in Figure 2. It can be seen that, activated carbon possessed a combination of type I and type IV isotherms according to IUPAC classification. Appearance of hysteresis loop indicates the presence of mesopores.
Figure 2.The adsorption-desorption isotherms of activated carbon sample (AC). Average pore widths and pore volumes were calculated from the nitrogen adsorption isotherm data by t-method analysis. Table 1 gives the values of the BET surface areas, Langmuir surface areas, total pore volumes, micropore volumes and average pore widths which were calculated by using the nitrogen adsorption-desorption data obtained at 77 K. The BET and Langmuir surface areas were found for the AC produced with LiOH activation, as 359.76 and 563.76 m2/g, respectively. In our previous studies we have reported that the BET surface areas and pore volumes and average pore widths of 4A zeolite (Erdogan 2018b). BET surface area and average pore width of 4AZ adsorbent were found as 18.09 m2/g and 19.391 nm, respectively.
0.0 0.2 0.4 0.6 0.8 1.0
40
60
80
100
120
140
160
180
200
220
240
Qua
ntity
Ads
orbe
d (c
m3 /g
)
Relative Pressure (P/P0)
The Online Journal of Science and Technology - January 2019 Volume 9, Issue 1
www.tojsat.net Copyright © The Online Journal of Science and Technology 76

Table 1: Physical characteristics of the activated carbon sample (AC).
BET surface area (m2/g) 359.76 Langmuir surface area (m2/g) 563.76 Total pore volume (cm3/g) 0.349 Micropore volume (cm3/g) 0.023 Average Pore Width (nm) 3.880
Allura Red Adsorption: Figure 3 and 4 present the adsorption isotherms of allura red as the relationship between the amount of dye adsorbed per unit mass of a given porous adsorbents and time. Fig. 3 shows that the adsorption capacities at equilibrium (qe) decreased with an increase in adsorbent dose from 0.005 to 0.05 g/LThis corroborates the reports of our previous study (Erdogan and Erdogan 2016). Figure 4 showed that the adsorption capacities at equilibrium (qe) decreased with an increase in adsorbent dose from 0.05 to 0.2 g/L. This is explained as a consequence of partial aggregation, which occurs at high adsorbent amount resulting in decreased active sites. Similar results have been reported for the sorption of various adsorbate onto various adsorbents in literatüre (Erdogan and Erdogan 2016, 2018).
Figure 3. Effects of adsorbent dosage and contact time on the adsorptive uptake of allura red dye onto the carob stones-derived adsorbent (conditions: C0=20 mg/L; temperature=30 °C).
Figure 4. Effects of adsorbent dosage and contact time on the adsorptive uptake of allura red dye onto 4A zeolite adsorbent (conditions: C0=20 mg/L; temperature=30 °C).
0 50 100 150 200 250-10
0
10
20
30
40
50
60
70
80
AC
q e (m
g/g)
t (min)
0.005 g 0.01 0.05
0 50 100 150 200 250 300
0.0
0.1
0.2
0.3
0.4
0.5
0.6
4AZ
q e (m
g/g)
t (min)
0.05 g 0.1 0.2
The Online Journal of Science and Technology - January 2019 Volume 9, Issue 1
www.tojsat.net Copyright © The Online Journal of Science and Technology 77

The equilibrium adsorption isotherms are essential to the practical design and optimization of adsorption process. The adsorption isotherm describes how adsorbates interact with adsorbents. The equilibrium data of allura red dye adsorption onto activated carbon and 4A zeolite were explored using the isotherm model of Langmuir and Freundlich. The parameters obtained of the two isotherm models were calculated and represented in Table 2. The correlation coefficients descended in the order of: Langmuir> Freundlich for AC. Langmuir adsorption isotherms constants related to adsorption capacity, Q0 were found as 94.877 and 0.048 mg/g for AC and 4AZ, respectively. The relatively large adsorption capacity for AC could be attributed to its relatively large surface area (359.76 m2/g) and total pore volume (0.349 cm3/g). The results revealed that the adsorption of food dye on carob stones-based activated carbon was best described by the Langmuir isotherm, indicating the adsorption was homogeneous and a monolayer was present.
Table 2: Freundlich and Langmuir isotherm constants for the adsorption allura red onto AC and 4AZ at 30 °C
Isotherms Parameters
Freundlich KF (mg/g)(L/mg)1/n 1/n R2
AC 32.926 0.321 0.236 4AZ 6.2E-14 10.43 0.066 Langmuir Q0 (mg/g) KL (L/mg) R2 AC 94.877 0.421 0.718 4AZ 0.048 0.052 0.023
Langmuir adsorption isotherm constant related to adsorption capacity, Q0 were found as 94.877 mg/g. To confirm the favorability of the adsorption, the separation factor RL was calculated by the following equation;
0
11L
L
RK C
=+
where the adsorption process to be either unfavorable (RL > 1), linear (RL = 1), favorable (0 < RL < 1) or irreversible (RL = 0). Here, the value of RL was found to be 0.106 and 0.490 for AC and 4AZ, respectively, which further confirmed that the Langmuir isotherm was favorable for of food dye on two adsorbents.
Adsorption kinetics provides an understanding of the mechanism of adsorption, which in turn governs mass transfer and the equilibrium time. Allura red was adsorbed on adsorbents as a function of time. Pseudo-first-order and pseudo-second-order models have been obtained at the temperatures of 30 °C for the various adsorbent amount (0.005, 0.01 and 0.05 g for AC and 0.05, 0.1 and 0.2 g for 4AZ). The regression coefficients (R2) were evaluated for all models. The results are shown in Table 3. As shown in Table 3, the highest R2 values were obtained for the pseudo-second order kinetic model and the experimental qe values matched well with the calculated data. The higher regression coefficients indicated that the pseudo-second-order model was a better fit than the pseudo-first-order model. Therefore, it can be said that the pseudo-first-order model is not suitable to explain the adsorption process accurately. Similar results have been found for the our previous study (Erdogan and Erdogan 2016).
Table 3: Kinetic model parameters for the adsorption of allura red dye onto AC at different adsorbent dosage.
Pseudo first order Pseudo second order
T(°C) mads(g/L)
qe,exp(mg/g)
k1(min)1
qe,cal(mg/g) R2 k2(g/mgmin) qe,cal(mg/g) R2
30
0.005 69.653 0.0305 60.218 0.977 8.86E-4 74.294 0.990
0.01 52.838 0.0468 47.913 0.948 1.92E-3 55.928 0.988
0.05 10.441 0.650 51.395 0.934 0.0858 10.526 0.999
The Online Journal of Science and Technology - January 2019 Volume 9, Issue 1
www.tojsat.net Copyright © The Online Journal of Science and Technology 78

Kinetic parameters for the removal of allura red by 4AZ are represented in Table 4. The results for the 4AZ showed good agreement with the two kinetic models, especially with the pseudo-second order kinetic model except for 0.05 g adsorbent, suggesting the presence of chemisorption for 4AZ.
Table 4: Kinetic model parameters for the adsorption of allura red dye onto 4AZ at different adsorbent dosage.
Pseudo first order Pseudo second order
T(°C) mads(g/L)
qe,exp(mg/g)
k1(min)1
qe,cal(mg/g) R2 k2(g/mgmin) qe,cal(mg/g) R2
30
0.05 0.5769 0.0212 0.4627 0.730 -30.42 1.52E-4 0.086
0.1 0.4362 0.0421 0.714 0.915 0.106 0.452 0.984
0.2 0.1829 0.0339 0.163 0.963 0.538 0.188 0.998
Conclusion The present investigation showed that biowaste carob stones can be effectively used as a raw material for the preparation of activated carbon via chemical activation using LiOH. The BET surface area and total pore volume of produced activated carbon were 359.76 m2/g and 0.349 cm3/g, respectively. This activated carbon (AC) and commercial 4A zeolite (4AZ) were used to remove allura red food dye from aqueous solutions at various temperature. In a batch of adsorption studies, the efficiency of allura red dye adsorption by AC or 4AZ increased with adsorbent dosage, but the equilibrium adsorption capacity decreased significantly. Adsorption capacities of allura red dye onto AC and 4AZ were 94.877 and 0.048 mg/g, respectively. The Freundlich and Langmuir isotherm models were used for the mathematical description of the adsorption of allura red dye onto AC or 4AZ at 30 °C and the results suggested that the adsorption equilibrium data fitted well to the Langmuir model for AC. The pseudo-first order and pseudo-second order models were used to analyze the data obtained for allura red dye adsorption onto the prepared activated carbon and 4AZ. The kinetic calculations show that the adsorption followed the pseudo-second order model for AC. This study has revealed that carob stones based activated carbon can be used as a highly efficient and economically viable adsorbent for allura red dye removal from aqueous solutions.
Acknowledgements The author acknowledges the financial support provided by Kocaeli University Scientific Research Projects Unit. (Project No: 2011/062, 2016/019 HD and 2017/57 HD).
References Erdogan, F.O. (2016). Characterization of the activated carbon surface cherry stones prepared by sodium and
potassium hydroxide. Analytical Letters 49,7, 1079-1090. Erdogan, T., & Erdogan F.O. (2016). Characterization of the adsorption of disperse yellow 211 on activated
carbon from cherry stones following microwave-assisted phosphoric acid treatment. Analytical Letters 49, 7, 917-928.
Erdogan, F.O. & Erdogan T. (2018). Adsorption of sunset yellow FCF onto MCM-41. The Online Journal of Science and Technology 8, 1, 16-20.
Erdogan, F.O. (2018b). Freundlich, Langmuir, Temkin, DR and Harkins-Jura isotherm studies of CH4 adsorption on zeolitic and new carbonaceous adsorbents. Macedonian journal of chemistry and chemical engineering, submitted.
Erdogan, F.O. (2018a). Comparative study of sunset yellow dye adsorption onto cornelian cherry stones-based activated carbon and carbon nanotubes. Bulgarian Chemical Communications, in press.
Li, W., Yang, K., Peng, J., Zhang, L., Guo, S., & Xia, H. (2008). Effects of carbonization temperatures on characteristics of porosity in coconut shell chars and activated carbons derived from carbonized coconut shell chars. Industrial Crops and Products 2, 190-198.
Philip, C.A. J. (1996). Chem. Tech. Biotechnol. 67, 248-254. Sánchez-Duarte, R.G., Sánchez-Machado, D.I., López-Cervantes, J., & Correa-Murrieta A. (2012). Adsorption
of allura red dye by cross-linked chitosan from shrimp waste. Water Science & Technology 65, 618-623.
The Online Journal of Science and Technology - January 2019 Volume 9, Issue 1
www.tojsat.net Copyright © The Online Journal of Science and Technology 79

SYNTHESIS AND ANTIMICROBIAL STUDY OF SOME POLYCYCLIC COMPOUNDS BY [3+2] CYCLOADDITION REACTIONS OF
ALDAZINES WITH N-ARYL MALEIMIDES
Abdullah Abdalkarim Al–Shara′ey1, Mohammed Hadi Al–Douh*2 and Younes S. Gahnem3
1Department of Chemistry, Faculty of Applied Science, Taiz University, Taiz, Yemen 2Chemistry Department, Faculty of Science, Hadhramout University, Mukalla, Yemen
3Department of Chemistry, Faculty of Education, Aden University, Aden, Yemen
* [email protected], Tel: +967 772255650, : https://orcid.org/0000-0001-9777-2653
Abstract: In good yields, the cycloaddition reactions between 1,4-bis[(aryl) benzylidene]hydrazine 1 and 2 with N-aryl maleimides 3(a-e) were produced 2,9-bis(aryl)-5,12-bis(aryl)-1,5,8,12-tetraazatetracyclo[6,6,0,3,70,10,140] tetradecane-4,6,11,13-tetraone 4,5(a-e). These compounds were directed toward hydrogenation, hydrolysis and dehydrogenation reactions to afford the expected derivatives 6,7(a-e), 8(b,d,e), 9d, 10(c,d) and 11(a,b), respectively. The new synthesized compounds were assigned using elemental analysis, mass spectroscopy, infrared and proton nuclear magnetic resonance spectroscopy. However, the microbial activity of these compounds were studied.
Keywords: Criss-Cross cycloaddition; 1,3-dipolar reaction; Aldazines; Hydrazones; Antimicrobial.
Introduction There are large group of reactions [3+2] cycloadditions in which five membered heterocyclic compounds are prepared by addition of 1,3-dipolar compounds to double bonds. This reaction is quite useful in the synthesis of alkaloids (Broggini and Zecchi, 1999; Choi et al., 2005; Morita et al., 2005). Examples of dipolarophiles are alkenes, alkynes and molecules that possess related heteroatom functional groups (such as carbonyls and nitriles). Not all alkenes undergo 1,3-dipolar cycloaddition equally. Well the reaction is most successful for those that are good dienophiles in the Diels-Alder reaction (Smith, 2013). Electron withdrawing groups on the dipolarophile normally favor an interaction of the LUMO of the dipolarophile with the HOMO of the dipolar compounds that leads to the formation of the new bonds, whereas electron-donating groups on the dipolarophile normally favor the inverse of this interaction (Huisgen et al., 1964; Sustmann, 1971; Sustmann and Trill, 1972).
Additionally, the 1,3-dipolar cycloaddition known as the Huisgen cycloaddition or Huisgen reaction, if the reaction of a 4π e-zwitterionic system as the 1,3-dipolar with a 2π e-neutral system dipolarophile to form a five membered heterocycles. The number of σ bonds increase at the expense of π bonds (Huisgen, 1963a,b, 1984). In the presence work, we used the 1,4-bis[(aryl) benzylidene] hydrazine 1 and 2 as the 1,3-dipolar to react with N-aryl maleimides 3a-e as dipolarophile to synthesis new derivatives of 2,9-bis(aryl)-5,12-N,N′-bis(aryl)-1,5,8,12-tetraazatetracyclo [6,6,0,3,70,10,140] tetradecane-4,6,11,13-tetraone at the respective 4, 5(a-e), (Schemes 1 and 2). The antimicrobial activity of these derivatives were studied.
Cl
NN
Cl
N
O
O
RFused
R: a = H, b = CH3, c = Br, d = NO
2, e = I.
1 3 a-e 4 a-e
N
N
N
N
R
R
O
O
O
O
Cl
Cl
Figure 1: The reaction of produce 2,9-bis(aryl)-5,12-N,N′-bis (aryl)-1,5,8,12-tetraazatetracyclo[6,6,0,3,70,10,140] tetradecane-4,6,11,13-tetraone 4a-e.
The Online Journal of Science and Technology - January 2019 Volume 9, Issue 1
www.tojsat.net Copyright © The Online Journal of Science and Technology 80
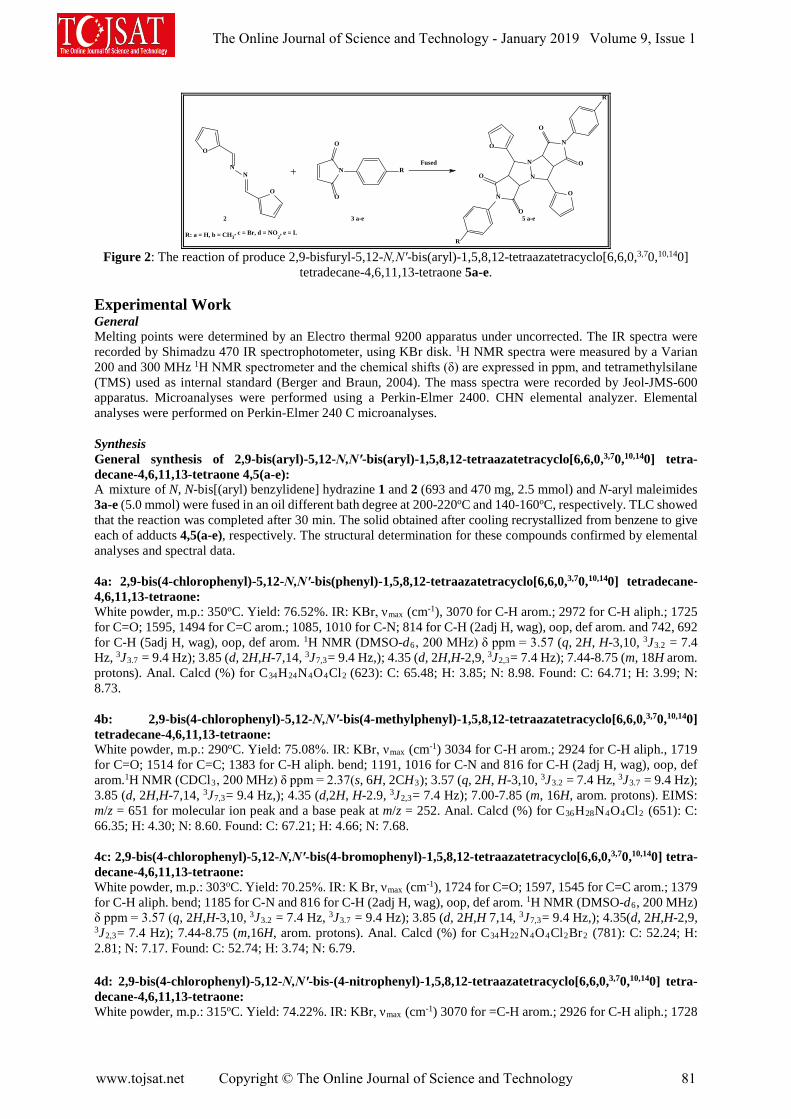
NN
N
O
O
RFused
R: a = H, b = CH3, c = Br, d = NO
2, e = I.
O
O
2 3 a-e 5 a-e
N
N
N
N
R
R
O
O
O
O
O
O
Figure 2: The reaction of produce 2,9-bisfuryl-5,12-N,N′-bis(aryl)-1,5,8,12-tetraazatetracyclo[6,6,0,3,70,10,140]
tetradecane-4,6,11,13-tetraone 5a-e. Experimental Work General Melting points were determined by an Electro thermal 9200 apparatus under uncorrected. The IR spectra were recorded by Shimadzu 470 IR spectrophotometer, using KBr disk. 1H NMR spectra were measured by a Varian 200 and 300 MHz 1H NMR spectrometer and the chemical shifts (δ) are expressed in ppm, and tetramethylsilane (TMS) used as internal standard (Berger and Braun, 2004). The mass spectra were recorded by Jeol-JMS-600 apparatus. Microanalyses were performed using a Perkin-Elmer 2400. CHN elemental analyzer. Elemental analyses were performed on Perkin-Elmer 240 C microanalyses. Synthesis General synthesis of 2,9-bis(aryl)-5,12-N,N′-bis(aryl)-1,5,8,12-tetraazatetracyclo[6,6,0,3,70,10,140] tetra-decane-4,6,11,13-tetraone 4,5(a-e): A mixture of N, N-bis[(aryl) benzylidene] hydrazine 1 and 2 (693 and 470 mg, 2.5 mmol) and N-aryl maleimides 3a-e (5.0 mmol) were fused in an oil different bath degree at 200-220oC and 140-160oC, respectively. TLC showed that the reaction was completed after 30 min. The solid obtained after cooling recrystallized from benzene to give each of adducts 4,5(a-e), respectively. The structural determination for these compounds confirmed by elemental analyses and spectral data. 4a: 2,9-bis(4-chlorophenyl)-5,12-N,N′-bis(phenyl)-1,5,8,12-tetraazatetracyclo[6,6,0,3,70,10,140] tetradecane-4,6,11,13-tetraone: White powder, m.p.: 350oC. Yield: 76.52%. IR: KBr, νmax (cm-1), 3070 for C-H arom.; 2972 for C-H aliph.; 1725 for C=O; 1595, 1494 for C=C arom.; 1085, 1010 for C-N; 814 for C-H (2adj H, wag), oop, def arom. and 742, 692 for C-H (5adj H, wag), oop, def arom. 1H NMR (DMSO-d6, 200 MHz) δ ppm = 3.57 (q, 2H, H-3,10, 3J3.2 = 7.4 Hz, 3J3.7 = 9.4 Hz); 3.85 (d, 2H,H-7,14, 3J7,3= 9.4 Hz,); 4.35 (d, 2H,H-2,9, 3J2,3= 7.4 Hz); 7.44-8.75 (m, 18H arom. protons). Anal. Calcd (%) for C34H24N4O4Cl2 (623): C: 65.48; H: 3.85; N: 8.98. Found: C: 64.71; H: 3.99; N: 8.73. 4b: 2,9-bis(4-chlorophenyl)-5,12-N,N′-bis(4-methylphenyl)-1,5,8,12-tetraazatetracyclo[6,6,0,3,70,10,140] tetradecane-4,6,11,13-tetraone: White powder, m.p.: 290oC. Yield: 75.08%. IR: KBr, νmax (cm-1) 3034 for C-H arom.; 2924 for C-H aliph., 1719 for C=O; 1514 for C=C; 1383 for C-H aliph. bend; 1191, 1016 for C-N and 816 for C-H (2adj H, wag), oop, def arom.1H NMR (CDCl3, 200 MHz) δ ppm = 2.37(s, 6H, 2CH3); 3.57 (q, 2H, H-3,10, 3J3.2 = 7.4 Hz, 3J3.7 = 9.4 Hz); 3.85 (d, 2H,H-7,14, 3J7,3= 9.4 Hz,); 4.35 (d,2H, H-2.9, 3J2,3= 7.4 Hz); 7.00-7.85 (m, 16H, arom. protons). EIMS: m/z = 651 for molecular ion peak and a base peak at m/z = 252. Anal. Calcd (%) for CR36RHR28RNR4ROR4RClR2R (651): C: 66.35; H: 4.30; N: 8.60. Found: C: 67.21; H: 4.66; N: 7.68. 4c: 2,9-bis(4-chlorophenyl)-5,12-N,N′-bis(4-bromophenyl)-1,5,8,12-tetraazatetracyclo[6,6,0,3,70,10,140] tetra-decane-4,6,11,13-tetraone: White powder, m.p.: 303oC. Yield: 70.25%. IR: K Br, νmax (cm-1), 1724 for C=O; 1597, 1545 for C=C arom.; 1379 for C-H aliph. bend; 1185 for C-N and 816 for C-H (2adj H, wag), oop, def arom. 1H NMR (DMSO-d6, 200 MHz) δ ppm = 3.57 (q, 2H,H-3,10, 3J3.2 = 7.4 Hz, 3J3.7 = 9.4 Hz); 3.85 (d, 2H,H 7,14, 3J7,3= 9.4 Hz,); 4.35(d, 2H,H-2,9, 3J2,3= 7.4 Hz); 7.44-8.75 (m,16H, arom. protons). Anal. Calcd (%) for C34H22N4O4Cl2Br2 (781): C: 52.24; H: 2.81; N: 7.17. Found: C: 52.74; H: 3.74; N: 6.79. 4d: 2,9-bis(4-chlorophenyl)-5,12-N,N′-bis-(4-nitrophenyl)-1,5,8,12-tetraazatetracyclo[6,6,0,3,70,10,140] tetra-decane-4,6,11,13-tetraone: White powder, m.p.: 315oC. Yield: 74.22%. IR: KBr, νmax (cm-1) 3070 for =C-H arom.; 2926 for C-H aliph.; 1728
The Online Journal of Science and Technology - January 2019 Volume 9, Issue 1
www.tojsat.net Copyright © The Online Journal of Science and Technology 81
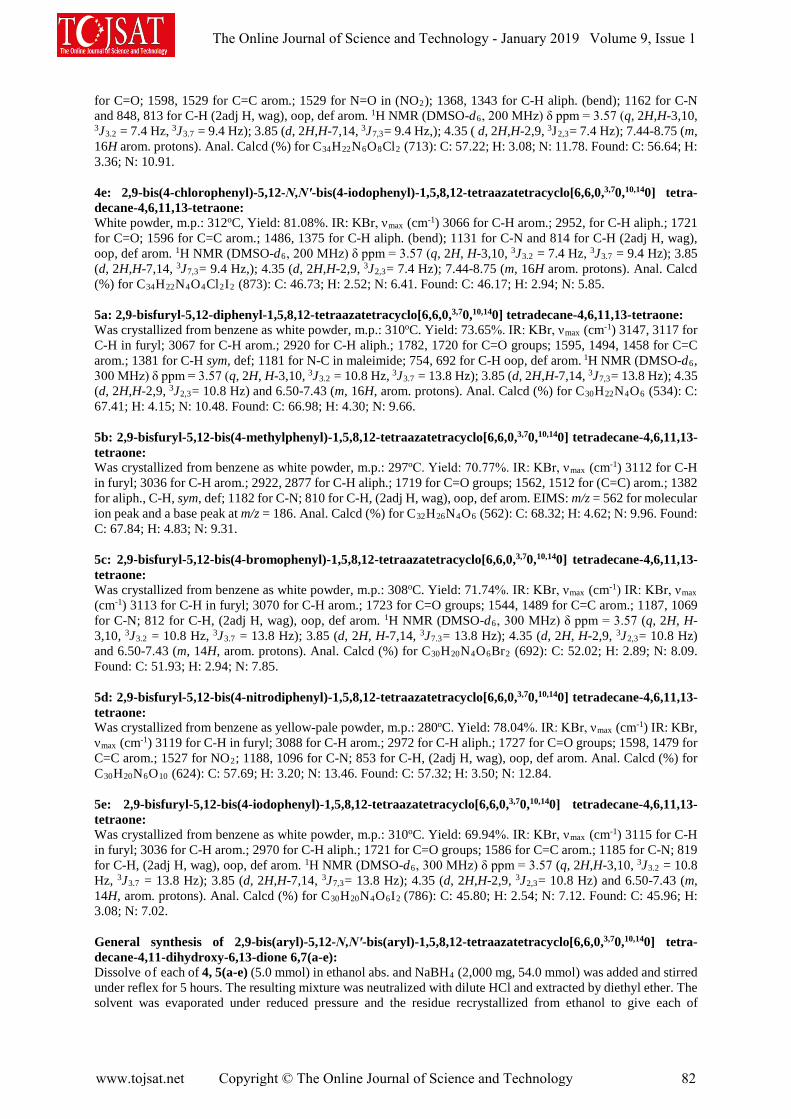
for C=O; 1598, 1529 for C=C arom.; 1529 for N=O in (NO2); 1368, 1343 for C-H aliph. (bend); 1162 for C-N and 848, 813 for C-H (2adj H, wag), oop, def arom. 1H NMR (DMSO-d6, 200 MHz) δ ppm = 3.57 (q, 2H,H-3,10, 3J3.2 = 7.4 Hz, 3J3.7 = 9.4 Hz); 3.85 (d, 2H,H-7,14, 3J7,3= 9.4 Hz,); 4.35 ( d, 2H,H-2,9, 3J2,3= 7.4 Hz); 7.44-8.75 (m, 16H arom. protons). Anal. Calcd (%) for C34H22N6O8Cl2 (713): C: 57.22; H: 3.08; N: 11.78. Found: C: 56.64; H: 3.36; N: 10.91. 4e: 2,9-bis(4-chlorophenyl)-5,12-N,N′-bis(4-iodophenyl)-1,5,8,12-tetraazatetracyclo[6,6,0,3,70,10,140] tetra-decane-4,6,11,13-tetraone: White powder, m.p.: 312oC, Yield: 81.08%. IR: KBr, νmax (cm-1) 3066 for C-H arom.; 2952, for C-H aliph.; 1721 for C=O; 1596 for C=C arom.; 1486, 1375 for C-H aliph. (bend); 1131 for C-N and 814 for C-H (2adj H, wag), oop, def arom. 1H NMR (DMSO-d6, 200 MHz) δ ppm = 3.57 (q, 2H, H-3,10, 3J3.2 = 7.4 Hz, 3J3.7 = 9.4 Hz); 3.85 (d, 2H,H-7,14, 3J7,3= 9.4 Hz,); 4.35 (d, 2H,H-2,9, 3J2,3= 7.4 Hz); 7.44-8.75 (m, 16H arom. protons). Anal. Calcd (%) for C34H22N4O4Cl2I2 (873): C: 46.73; H: 2.52; N: 6.41. Found: C: 46.17; H: 2.94; N: 5.85. 5a: 2,9-bisfuryl-5,12-diphenyl-1,5,8,12-tetraazatetracyclo[6,6,0,3,70,10,140] tetradecane-4,6,11,13-tetraone: Was crystallized from benzene as white powder, m.p.: 310oC. Yield: 73.65%. IR: KBr, νmax (cm-1) 3147, 3117 for C-H in furyl; 3067 for C-H arom.; 2920 for C-H aliph.; 1782, 1720 for C=O groups; 1595, 1494, 1458 for C=C arom.; 1381 for C-H sym, def; 1181 for N-C in maleimide; 754, 692 for C-H oop, def arom. 1H NMR (DMSO-d6, 300 MHz) δ ppm = 3.57 (q, 2H, H-3,10, 3J3.2 = 10.8 Hz, 3J3.7 = 13.8 Hz); 3.85 (d, 2H,H-7,14, 3J7,3= 13.8 Hz); 4.35 (d, 2H,H-2,9, 3J2,3= 10.8 Hz) and 6.50-7.43 (m, 16H, arom. protons). Anal. Calcd (%) for C30H22N4O6 (534): C: 67.41; H: 4.15; N: 10.48. Found: C: 66.98; H: 4.30; N: 9.66. 5b: 2,9-bisfuryl-5,12-bis(4-methylphenyl)-1,5,8,12-tetraazatetracyclo[6,6,0,3,70,10,140] tetradecane-4,6,11,13-tetraone: Was crystallized from benzene as white powder, m.p.: 297oC. Yield: 70.77%. IR: KBr, νmax (cm-1) 3112 for C-H in furyl; 3036 for C-H arom.; 2922, 2877 for C-H aliph.; 1719 for C=O groups; 1562, 1512 for (C=C) arom.; 1382 for aliph., C-H, sym, def; 1182 for C-N; 810 for C-H, (2adj H, wag), oop, def arom. EIMS: m/z = 562 for molecular ion peak and a base peak at m/z = 186. Anal. Calcd (%) for C32H26N4O6 (562): C: 68.32; H: 4.62; N: 9.96. Found: C: 67.84; H: 4.83; N: 9.31. 5c: 2,9-bisfuryl-5,12-bis(4-bromophenyl)-1,5,8,12-tetraazatetracyclo[6,6,0,3,70,10,140] tetradecane-4,6,11,13-tetraone: Was crystallized from benzene as white powder, m.p.: 308oC. Yield: 71.74%. IR: KBr, νmax (cm-1) IR: KBr, νmax (cm-1) 3113 for C-H in furyl; 3070 for C-H arom.; 1723 for C=O groups; 1544, 1489 for C=C arom.; 1187, 1069 for C-N; 812 for C-H, (2adj H, wag), oop, def arom. 1H NMR (DMSO-d6, 300 MHz) δ ppm = 3.57 (q, 2H, H-3,10, 3J3.2 = 10.8 Hz, 3J3.7 = 13.8 Hz); 3.85 (d, 2H, H-7,14, 3J7.3= 13.8 Hz); 4.35 (d, 2H, H-2,9, 3J2,3= 10.8 Hz) and 6.50-7.43 (m, 14H, arom. protons). Anal. Calcd (%) for C30H20N4O6Br2 (692): C: 52.02; H: 2.89; N: 8.09. Found: C: 51.93; H: 2.94; N: 7.85. 5d: 2,9-bisfuryl-5,12-bis(4-nitrodiphenyl)-1,5,8,12-tetraazatetracyclo[6,6,0,3,70,10,140] tetradecane-4,6,11,13-tetraone: Was crystallized from benzene as yellow-pale powder, m.p.: 280oC. Yield: 78.04%. IR: KBr, νmax (cm-1) IR: KBr, νmax (cm-1) 3119 for C-H in furyl; 3088 for C-H arom.; 2972 for C-H aliph.; 1727 for C=O groups; 1598, 1479 for C=C arom.; 1527 for NO2; 1188, 1096 for C-N; 853 for C-H, (2adj H, wag), oop, def arom. Anal. Calcd (%) for C30H20N6O10 (624): C: 57.69; H: 3.20; N: 13.46. Found: C: 57.32; H: 3.50; N: 12.84. 5e: 2,9-bisfuryl-5,12-bis(4-iodophenyl)-1,5,8,12-tetraazatetracyclo[6,6,0,3,70,10,140] tetradecane-4,6,11,13-tetraone: Was crystallized from benzene as white powder, m.p.: 310oC. Yield: 69.94%. IR: KBr, νmax (cm-1) 3115 for C-H in furyl; 3036 for C-H arom.; 2970 for C-H aliph.; 1721 for C=O groups; 1586 for C=C arom.; 1185 for C-N; 819 for C-H, (2adj H, wag), oop, def arom. 1H NMR (DMSO-d6, 300 MHz) δ ppm = 3.57 (q, 2H,H-3,10, 3J3.2 = 10.8 Hz, 3J3.7 = 13.8 Hz); 3.85 (d, 2H,H-7,14, 3J7,3= 13.8 Hz); 4.35 (d, 2H,H-2,9, 3J2,3= 10.8 Hz) and 6.50-7.43 (m, 14H, arom. protons). Anal. Calcd (%) for C30H20N4O6I2 (786): C: 45.80; H: 2.54; N: 7.12. Found: C: 45.96; H: 3.08; N: 7.02. General synthesis of 2,9-bis(aryl)-5,12-N,N′-bis(aryl)-1,5,8,12-tetraazatetracyclo[6,6,0,3,70,10,140] tetra-decane-4,11-dihydroxy-6,13-dione 6,7(a-e): Dissolve of each of 4, 5(a-e) (5.0 mmol) in ethanol abs. and NaBH4 (2,000 mg, 54.0 mmol) was added and stirred under reflex for 5 hours. The resulting mixture was neutralized with dilute HCl and extracted by diethyl ether. The solvent was evaporated under reduced pressure and the residue recrystallized from ethanol to give each of
The Online Journal of Science and Technology - January 2019 Volume 9, Issue 1
www.tojsat.net Copyright © The Online Journal of Science and Technology 82

compounds 6, 7(a-e), respectively. The structural determination for these compounds confirmed by elemental analyses and spectral data. 6a: 2,9-bis(4-chlorophenyl)-5,12-N,N′-diphenyl-1,5,8,12-tetraazatetracyclo[6,6,0,3,70,10,140] tetradecane-4,11-dihydroxy-6,13-dione: Orange powder, m.p.: 185oC. Yield: 74.36%. IR: KBr, νmax (cm-1) 3500, 3316 for -OH; 3062 for =C-H arom.; 2960, 2926 for C-H aliph.; 1676 for C=O; 1600, 1542 for C=C arom.; 1446, 1388 for C-H aliph. bend; 1194 for C-N; 1094, 1014 for C-O; 830 for C-H (2adj H, wag), oop, def. arom. and 754, 692 for C-H (5adj H, wag), oop, def arom. 1H NMR (DMSO-d6, 200 MHz) δ ppm = 3.05 (q, 2H, H-3.10); 3.5-5.00 (br, 8H, for H-2,4,7,9,11,14 and 2OH), 7.00-7.80 (m, 18H, arom. protons). EIMS: m/z = 627 for molecular ion peak and a base peak at m/z = 124. Anal. Calcd (%) for C34H28N4O4Cl2 (627): C: 65.07; H: 4.46; N: 8.93. Found: C: 65.31; H: 3.99; N: 8.84. 6b: 2,9-bis(4-chlorophenyl)-5,12-N,N′-bis(4-methylphenyl)-1,5,8,12-tetraazatetracyclo[6,6,0,3,70,10,140] tetradecane-4,11-dihydroxy-6,13-dione: Orange powder, m.p.: 200oC, Yield: 73.93%. IR: KBr, νmax (cm-1) 3500, 3316 for -OH groups; 3070 for =C-H arom.; 2922 for C-H aliph.; 1672 for C=O groups; 1606, 1520 for C=C arom.; 1408, 1308 for C-H aliph. bend; 1178, 1206 for C-N; 1092 for C-O and 818 for C-H (2adj H, wag), oop, def arom. 1H NMR (CDCl3, 300 MHz) δ ppm = 1.27 (s,2H,2OH); 2.34 (s,6H,2CH3); 3.5-4.5 (m,6H,H-2,3,7,9,10,14); 5.50 (d,2H,H-4,11); 3.4-4.2 (m,5H,H-2,4,7,9,11); 7.20-7.70 (m, 16H, arom. protons). EIMS: m/z = 655 for molecular ion peak and a base peak at m/z =186. Anal. Calcd (%) for C36H32N4O4Cl2 (655): C: 65.95; H: 4.88; N: 8.54. Found: C: 66.29; H: 4.56; N: 8.18. 6c: 2,9-bis(4-chlorophenyl)-5,12-N,N′-bis(4-bromophenyl)-1,5,8,12-tetraazatetracyclo[6,6,0,3,70,10,140] tetra-decane-4,11-dihydroxy-6,13-dione: Orange powder, m.p.: 187oC. Yield: 71.36%. IR: KBr, νmax (cm-1) 3552, 3426 for -OH groups; 3052 for =C-H arom.; 2968 for C-H aliph; 1672 for C=O groups; 1596, 1490 for C=C arom; 1302 for C-H aliph (bend); 1206 for C-N; 1012 for C-O and 824 for C-H (2adj H, wag), oop, def arom. 1H NMR (DMSO-d6, 200 MHz) δ ppm = 3.05 (q,2H,H-3,10); 3.5-5.00 (br, 8H, for H-2,4,7,9,11,14 and 2OH), 7.00-7.80 (m,16H, arom. protons) Anal. Calcd (%) for C34H26N4O4Cl2Br2 (785): C: 51.97; H: 3.31; N: 7.13. Found: C: 52.34; H: 3.74; N: 6.83. 6d: 2,9-bis(4-chlorophenyl)-5,12-N,N′-bis-(4-nitrophenyl)-1,5,8,12-tetraazatetracyclo[6,6,0,3,70,10,140] tetra-decane-4,11-dihydroxy-6,13-dione: Orange powder, m.p.: 160oC. Yield: 69.19%. IR: KBr, νmax (cm-1) 3534 for -OH groups; 3030 for =C-H arom.; 2920 for C-H aliph.; 1718 for C=O groups; 1600, 1506 for C=C arom; 1336 for C-H aliph. bend; 1182 for C-N, 1108, 1070 for C-O and 836 for C-H (2adj H, wag), oop, def arom. EIMS: m/z = 717 for molecular ion peak and a base peak at m/z = 125. Anal. Calcd (%) for C34H26N6O8Cl2 (717): C: 56.90; H: 3.62; N: 11.71. Found: C: 56.61; H: 3.33; N: 11.31. 6e: 2,9-bis(4-chlorophenyl)-5,12-N,N′-bis(4-iodophenyl)-1,5,8,12-tetraazatetracyclo[6,6,0,3,70,10,140] tetra-decane-4,11-dihydroxy-6,13-dione: Colorless powder, m.p.: 204oC. Yield: 67.96%. IR: KBr, νmax (cm-1) 3564 for –OH groups; 3070 for C-H arom.; 2924, 2890 for C-H aliph.; 1668 for C=O groups; 1596, 1530 for C=C arom; 1400 for C-H aliph. bend; 1240, for C-N 1092, 1010 for C-O; and 820 for C-H (2adj H, wag), oop, def arom. 1H NMR (DMSO-d6, 200 MHz) δ ppm = 3.05 (q,2H,H-3,10); 3.5-5.00 (br,8H,H-2,4,7,9,11,14 and 2OH), 7.00-7.80 (m,16H, arom. protons) Anal. Calcd (%) for C34H26N4O4Cl2I2 (877): C: 46.52; H: 2.96; N: 6.38. Found: C: 46.27; H: 3.14; N: 5.98. 7a: 2,9-bisfuryl-5,12-bis(phenyl)-1,5,8,12-tetraazatetracyclo[6,6,0,3,70,10,140] tetradecane-4,11-dihydroxy-6,13-dione: Orange powder, m.p.: 289oC. Yield: 67.79%. IR: KBr, νmax (cm-1) 3550 for -OH groups; 3113 for C-H in furyl; 3065 for C-H arom.; 2921 for C-H aliph.; 1686 for C=O groups; 1598, 1490 for C=C arom.; 1383 for aliph.; C-H, asym, def; 1183 for C-N and 749, 690 for C-H, (5adj H, wag), oop, def arom. EIMS: m/z = 538 for molecular ion peak and a base peak at m/z = 95. Anal. Calcd (%) for C30H26N4O6 (538): C: 66.91; H: 4.83; N: 10.41. Found: C: 66.74; H: 4.67; N: 9.98. 7b: 2,9-bisfuryl-5,12-bis(4-methylphenyl)-1,5,8,12-tetraazatetracyclo[6,6,0,3,70,10,140] tetradecane-4,11-di-hydroxy-6,13-dione: Colorless powder, m.p.: 185oC. Yield: 68.68%. IR: KBr, νmax (cm-1) 3580 for -OH groups; 3119 for C-H in furyl; 3088 for C-H arom.; 2920, 2854 for C-H aliph.; 1696 for C=O groups; 1604, 1524 for C=C arom.; 1450, 1406 for aliph., C-H, asym, def); 1188 for C-N, 1136 for C-O and 816 for C-H, (2adj H, wag), oop, def arom. Anal. Calcd (%) for C32H30N4O6 (566): C: 67.84; H: 5.30; N: 7.89. Found: C: 68.15; H: 4.97; N: 9.72.
The Online Journal of Science and Technology - January 2019 Volume 9, Issue 1
www.tojsat.net Copyright © The Online Journal of Science and Technology 83

7c: 2,9-bisfuryl-5,12-bis(4-bromophenyl)-1,5,8,12-tetraazatetracyclo[6,6,0,3,70,10,140] tetradecane-4,11-di-hydroxy-6,13-dione: Orange powder. m.p.: 170oC. Yield: 65.03%. IR: KBr, νmax (cm-1) 3580 for -OH groups; 3112 for C-H in furyl; 3070 for C-H arom.; 1682 for C=O groups; 1596, 1528 for C=C arom.; 1146 for C-N, 1074 for C-O and 824 for C-H, (2adj H, wag), oop, def arom. 1H NMR (DMSO-d6, 200 MHz) δ ppm = 3.05 (q,2H,H-3,10); 3.5-5.00 (br,8H,H-2,4,7,9,11,14 and 2OH), 7.00-7.80(m, 14H, arom. protons). Anal. Calcd (%) for C30H24N4O6Br2 (696): C: 51.72; H: 3.44; N: 8.04. Found: C: 52.13; H: 3.69; N: 8.18. 7d: 2,9-bisfuryl-5,12-bis(4-nitrophenyl)-1,5,8,12-tetraazatetracyclo[6,6,0,3,70,10,140] tetradecane-4,11-di-hydroxy-6,13-dione: Brown powder. m.p.: 115oC. Yield: 74.04%. IR: KBr, νmax (cm-1) 3570 for -OH groups; 3112 for C-H in furyl; 3080, 3030 for C-H arom.; 2922 for C-H aliph.; 1700 for C=O groups; 1598, 1504 for C=C arom.; 1196 for C-N, 1110 for C-O and 842 for C-H, (2adj H, wag), oop, def arom. 1H NMR (DMSO-d6, 200 MHz) δ ppm = 3.05(q,2H,H-3,10); 3.5-5.00 (br,8H,H-2,4,7,9,11,14 and 2OH), 7.00-7.80 (m,14H, arom. protons). Anal. Calcd (%) for C30H24N6O10 (628): C: 57.32; H: 3.82; N: 13.37. Found: C: 57.69; H: 4.05; N: 12.84. 7e: 2,9-bisfuryl-5,12-bis(4-iodophenyl)-1,5,8,12-tetraazatetracyclo[6,6,0,3,70,10,140] tetradecane-4,11-dihydr-oxy-6,13-dione: Brown powder. m.p.: 184oC. Yield: 72.01%. IR: KBr, νmax (cm-1) 3570 for -OH groups; 3112 for C-H in furyl; 3070 for C-H arom.; 2924 for C-H aliph.; 1682 for C=O groups; 1588, 1524 for C=C arom.; 1146 for C-N, 1062, 1008 for C-O and 818 for C-H, (2adj H, wag), oop, def arom. EIMS: m/z = 790 for molecular ion and a base peak at m/z = 218. Anal. Calcd (%) for C30H24N4O6I2 (790): C: 45.56; H: 3.03; N: 7.08. Found: C: 45.43; H: 3.38; N: 7.23. General synthesis of 2,6-bis(aryl)-3,7-dicarboxy-4,8-N,N′-bis(aryl carbonylamide)-1,5-diazadicyclooctane 8(b,d,e) and 9d: Dissolve of each of 4b-e and 5d (5.0 mmol) in 20 ml of 20% aqueous NaOH was stirred under reflux for 2 hours. After cooling the resulting mixture neutralized with (0.01 M) HCl and extracted by chloroform. The solvent evaporated under reduced pressure and the residue recrystallized from ethanol to give each of compounds 8b-e and 9d, respectively. The structural determination for these compounds confirmed by elemental analyses and spectral data. 8b: 2,6-bis(4-chlorophenyl)-3,7-dicarboxy-4,8-N,N′-bis(4-methylphenyl carbonylamide)-1,5-diazadicyclo-octane: Orange powder, m.p.: 260oC. Yield: 73.23%. IR: KBr, νmax (cm-1) 3500-2400 for -OH in carboxylic groups; 2896, 2876 for C-H aliph.; 1700 for C=O groups; 1600 for C=C arom.; 1522 for N=O; 1424, 1394 for C-H aliph. bend; 1174 for C-N; 1092 for C-O and 812 (s) for C-H (2adj H, wag), oop, def arom. 1H NMR (DMSO-d6, 300 MHz) δ ppm = 2,40 (s,6H,2CH3), 3.62 (q,2H,H-3,7 3J3.2 = 10.8 Hz, 3J3.7 = 13.8 Hz), 4.04 (d,2H,H-4,8 3J7,3= 13.8 Hz), 4.30 (d,2H,H-2,6 3J2,3= 10.8 Hz), 6.95 -7.60 (m, 18H, arom. and amide protons), 10.87 (s,2H,2OH protons). EIMS: m/z = 687 for molecular ion peak and a base peak at m/z = 64. Anal. Calcd (%) for C36H32N4O6Cl2 (687): C: 62.88; H: 4.65; N: 8.15. Founds: C: 61.71; H: 4.36; N: 7.88. 8d: 2,6-bis(4-chlorophenyl)-3,7-dicarboxy-4,8-N,N′-bis(4-nitrophenyl carbonylamide)-1,5-diazadicyclooct-ane: Orange powder, m.p.: 228oC, Yield: 79.27%. IR: KBr, νmax (cm-1) 3500-2550 for -OH in carboxylic groups; 2922, 2888 for C-H aliph.; 1716 for C=O groups; 1598 for C=C arom.; 1492 for N=O; 1424,1340 for C-H aliph. bend; 1152 for N-C; 1092 for C-O and 830 for C-H (2adj H, wag), oop, def. arom. 1H-NMR (DMSO-d6, 200 MHz) δ ppm = 3.0-4.5 (m,6H,H-2,3,4,6,7,8), 7.00-7.80 (m,18H, arom. and amide protons); 11.00 (s,2H,2OH). EIMS: m/z = 749 for molecular ion peak and a base peak at m/z = 221. Anal. Calcd (%) for C34H26N6O10Cl2 (749): C: 54.47; H: 3.47; N: 11.21. Founds: C: 54.69; H: 3.97; N: 10.95. 8e: 2,6-bis(4-chlorophenyl)-3,7-dicarboxy-4,8-N,N′-bis(4-iodophenyl carbonylamide)-1,5-diazadicyclooct-ane: Orange powder, m.p.: 197oC, Yield: 71.92%. IR: KBr, νmax (cm-1) 3500-2400 for -OH in carboxylic groups; 2896 for C-H aliph.; 1678 for C=O groups; 1598 ,1528 for C=C arom.; 1488, 1390 for C-H aliph. bend; 1186 for C-N; 1094 for C-O and 822 (s) for C-H (2adj H, wag), oop, def arom. 1H-NMR (DMSO-d6, 200 MHz) δ ppm = 3.0-4.5 (m,6H,H-2,3,4,6,7,8), 7.00-7.80 (m, 18H, arom. and amide protons); 11.00 (s,2H,2OH). Anal. Calcd (%) for C34H26N4O6Cl2I2 (911): C: 44.78; H: 2.85; N: 6.14. Founds: C: 44.30; H: 3.32; N: 6.21.
The Online Journal of Science and Technology - January 2019 Volume 9, Issue 1
www.tojsat.net Copyright © The Online Journal of Science and Technology 84

9d: 2,6-bisfuryl-3,7-dicarboxy-4,8-bis(N-p-nitrophenyl carbonylamide)-1,5-diazadicyclooctane: Orange powder. m.p.: 350oC. Yield: 66.67%. IR: KBr, νmax (cm-1) 3330-2500 for -NH, -OH groups; 1686 for C=O groups; 1588 C=C arom., 1492 for NO2; 1146 for C-N, 1116, 992 for C-O and 854 for C-H, (2adj H, wag), oop, def arom. 1H NMR (DMSO-d6, 200 MHz) δ ppm = 3.00-4.00 (m,6H,H-2,3,4,6,7,8); 6.50-7.80 (m,16H, arom. and amide protons) and 11.00 (s,2H, for carboxyl protons). Anal. Calcd (%) for C30H24N6O12 (660): C: 54.54; H: 3.63; N: 12.72. Founds: C: 55.00; H: 4.11; N: 13.16. General synthesis of 2,9-bis(aryl)-5,12-N,N′-bis(aryl)-1,5,8,12-tetraazatetracyclo[6,6,0,3,70,10,140] tetradeca-3,10-diene-4,6,11,13-tetraone 10(c,d) and 11(a,b): Dissolve of each of 4c-d and 5a-b (5.0 mmol) in 20 ml of nitrobenzene was stirring under reflux for 5 hours. After cooling the solid obtained was filtrated and recrystallized from acetone to give each of compounds 10c-d and 11a-b, respectively. The structural determination for these compounds confirmed by elemental analyses and spectral data. 10c: 2,9-bis(4-chlorophenyl)-5,12-N,N′-bis(4-bromophenyl)-1,5,8,12-tetraazatetracyclo[6,6,0,3,70,10,140] tetradeca-3,10-diene-4,6-,11,13-tetraone: White powder, m.p.: 269oC.Yield: 79.79%. IR: KBr, νmax (cm-1) 2914 for C-H aliph.; 1720 for C=O groups; 1630, 1512 for C=C aliph. and arom.; 1490, 1377 for C-H aliph. bind; 1177 for C-N; 1090 for C-O and 824 for C-H (2adj H), oop, def arom. 1H NMR (DMSO-d6, 300 MHz) δ ppm = 4.9 (m,2H,H-2,9), 7.27-8.37 (m,16H, arom. protons). Anal. Calcd (%) for C34H18N4O4Cl2Br2 (777): C: 52.50; H: 2.31; N: 7.20. Founds: C: 52.14; H: 2.34; N: 7.26. 10d: 2,9-bis(4-chlorophenyl)-5,12-N,N′-bis(4-nitrolphenyl)-1,5,8,12-tetraazatetracyclo[6,6,0,3,70,10,140] tetradeca-3,10-diene-4,6,-11,13-tetraone. Colorless powder, m.p.: 290oC. Yield: 84.87%. IR: KBr, νmax (cm-1) 2919 for C-H aliph.; 1726 for C=O groups; 1598, 1526 for C=C aliph. and arom.; 1492 for N=O; 1342 for C-H aliph. bend; 1163 for N-C; 1015 for C-O and 830 for =C-H (2adj H, wag), oop, def. arom. 1H NMR (DMSO-d6, 300 MHz) δ ppm = 4.9 (m,2H,H-2,9), 7.27-8.37 (m,16H, arom. protons). EIMS: m/z = 709 for molecular ion peak and a base peak at m/z = 217. Anal. Calcd (%) for C34H18N6O8 Cl2 (709): C: 57.54; H: 2.53; N: 11.84. Founds: C: 56.56; H: 2.60; N: 11.46. 11a: 2,9-bisfuryl-5,12-diphenyl-1,5,8,12-tetraazatetracyclo[6,6,0,370,10,140] tetradeca-3,10-diene-4,6,11,13-tetraone: White powder. m.p.: 297oC. Yield: 83.52%. IR: KBr, νmax (cm-1) 3119 for C-H in furyl; 3030 for C-H arom.; 2922 for C-H aliph.; 1716 for C=O groups; 1630, 1496 for C=C arom.; 1196 for C-N, 1110 for C-O and 743, 692 (s) for C-H (5adj H, wag), oop, def arom. 1H NMR (DMSO-d6, 300 MHz) δ ppm = 4.9 (m,2H,H-2,9), 7.27-8.37 (m,14H, arom. protons). Anal. Calcd (%) for C30H18N4O6 (530): C: 67.92; H: 3.39; N: 10.56. Founds: C: 67.55; H: 4.08; N: 10.43. 11b: 2,9-bisfuryl-5,12-bis(4-methylphenyl)-1,5,8,12-tetraazatetracyclo[6,6,0,370,10,140] tetradeca-3,10-diene-4,6,11,13-tetraone: White powder. m.p.: 298oC. Yield: 77.58%. IR: KBr, νmax (cm-1) 3119 for C-H in furyl; 3075, 3036 for C-H arom.; 2980 for C-H aliph.; 1721 for C=O groups; 1629, 1511 for C=C arom.; 1378 for aliph., C-H, sym, def, 1110 for C-O and 810 (s) for C-H (2adj H, wag), oop, def arom. Anal. Calcd (%) for C32H22N4O6 (558): C: 68.81; H: 3.94; N: 10.03. Founds: C: 68.31; H: 4.43; N: 9.99. Methodology of antimicrobial activity The filter paper disc method was performed in Nutrient agar for bacteria and Dox agar for fungi (Abdel-Rahman et al., 2002). These agar media were incubated with bacteria or fungi, respectively. The filter paper disc (6 mm diameter) saturated with a solution of each compound (10 mg/mL of DMSO) were incubated in agar media. The incubation time was 48 hours at 37oC for bacteria and 28oC for fungi. Discs saturated with compounds and free DMSO were used as control. Ciprofloxacin and Griseofulvin were used as a reference for evaluation of antibacterial (Lundstrom, 1983) and antifungal activities (Scrowston, 1981). By this manner some of the newly synthesized compounds were screened in vitro for their antibacterial activity against two strain of bacteria (Pseudomonas aeruginosa as –ve Gram and Staphylococcus aureus as +ve Gram) and two species of fungi (Aspergillus niger and Aspergillus terreus).
The Online Journal of Science and Technology - January 2019 Volume 9, Issue 1
www.tojsat.net Copyright © The Online Journal of Science and Technology 85
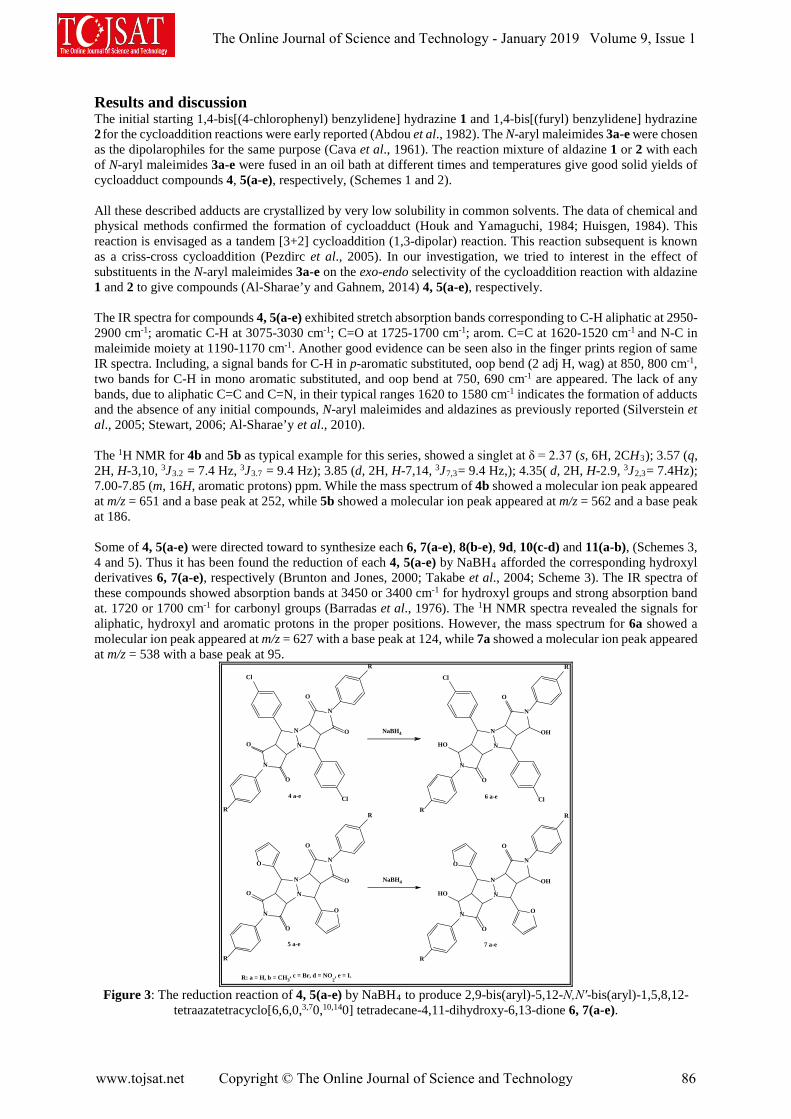
Results and discussion The initial starting 1,4-bis[(4-chlorophenyl) benzylidene] hydrazine 1 and 1,4-bis[(furyl) benzylidene] hydrazine 2 for the cycloaddition reactions were early reported (Abdou et al., 1982). The N-aryl maleimides 3a-e were chosen as the dipolarophiles for the same purpose (Cava et al., 1961). The reaction mixture of aldazine 1 or 2 with each of N-aryl maleimides 3a-e were fused in an oil bath at different times and temperatures give good solid yields of cycloadduct compounds 4, 5(a-e), respectively, (Schemes 1 and 2). All these described adducts are crystallized by very low solubility in common solvents. The data of chemical and physical methods confirmed the formation of cycloadduct (Houk and Yamaguchi, 1984; Huisgen, 1984). This reaction is envisaged as a tandem [3+2] cycloaddition (1,3-dipolar) reaction. This reaction subsequent is known as a criss-cross cycloaddition (Pezdirc et al., 2005). In our investigation, we tried to interest in the effect of substituents in the N-aryl maleimides 3a-e on the exo-endo selectivity of the cycloaddition reaction with aldazine 1 and 2 to give compounds (Al-Sharae’y and Gahnem, 2014) 4, 5(a-e), respectively. The IR spectra for compounds 4, 5(a-e) exhibited stretch absorption bands corresponding to C-H aliphatic at 2950-2900 cm-1; aromatic C-H at 3075-3030 cm-1; C=O at 1725-1700 cm-1; arom. C=C at 1620-1520 cm-1 and N-C in maleimide moiety at 1190-1170 cm-1. Another good evidence can be seen also in the finger prints region of same IR spectra. Including, a signal bands for C-H in p-aromatic substituted, oop bend (2 adj H, wag) at 850, 800 cm-1, two bands for C-H in mono aromatic substituted, and oop bend at 750, 690 cm-1 are appeared. The lack of any bands, due to aliphatic C=C and C=N, in their typical ranges 1620 to 1580 cm-1 indicates the formation of adducts and the absence of any initial compounds, N-aryl maleimides and aldazines as previously reported (Silverstein et al., 2005; Stewart, 2006; Al-Sharae’y et al., 2010). The 1H NMR for 4b and 5b as typical example for this series, showed a singlet at δ = 2.37 (s, 6H, 2CH3); 3.57 (q, 2H, H-3,10, 3J3.2 = 7.4 Hz, 3J3.7 = 9.4 Hz); 3.85 (d, 2H, H-7,14, 3J7,3= 9.4 Hz,); 4.35( d, 2H, H-2.9, 3J2,3= 7.4Hz); 7.00-7.85 (m, 16H, aromatic protons) ppm. While the mass spectrum of 4b showed a molecular ion peak appeared at m/z = 651 and a base peak at 252, while 5b showed a molecular ion peak appeared at m/z = 562 and a base peak at 186. Some of 4, 5(a-e) were directed toward to synthesize each 6, 7(a-e), 8(b-e), 9d, 10(c-d) and 11(a-b), (Schemes 3, 4 and 5). Thus it has been found the reduction of each 4, 5(a-e) by NaBH4 afforded the corresponding hydroxyl derivatives 6, 7(a-e), respectively (Brunton and Jones, 2000; Takabe et al., 2004; Scheme 3). The IR spectra of these compounds showed absorption bands at 3450 or 3400 cm-1 for hydroxyl groups and strong absorption band at. 1720 or 1700 cm-1 for carbonyl groups (Barradas et al., 1976). The 1H NMR spectra revealed the signals for aliphatic, hydroxyl and aromatic protons in the proper positions. However, the mass spectrum for 6a showed a molecular ion peak appeared at m/z = 627 with a base peak at 124, while 7a showed a molecular ion peak appeared at m/z = 538 with a base peak at 95.
R: a = H, b = CH3, c = Br, d = NO
2, e = I.
4 a-e
5 a-e
N
N
N
N
R
R
O
O
O
O
Cl
Cl
N
N
N
N
R
R
O
O
O
O
O
O
6 a-e
7 a-e
N
N
N
N
R
R
HO
O
O
OH
Cl
Cl
N
N
N
N
R
R
HO
O
O
OH
O
O
NaBH4
NaBH4
Figure 3: The reduction reaction of 4, 5(a-e) by NaBH4 to produce 2,9-bis(aryl)-5,12-N,N′-bis(aryl)-1,5,8,12-
tetraazatetracyclo[6,6,0,3,70,10,140] tetradecane-4,11-dihydroxy-6,13-dione 6, 7(a-e).
The Online Journal of Science and Technology - January 2019 Volume 9, Issue 1
www.tojsat.net Copyright © The Online Journal of Science and Technology 86
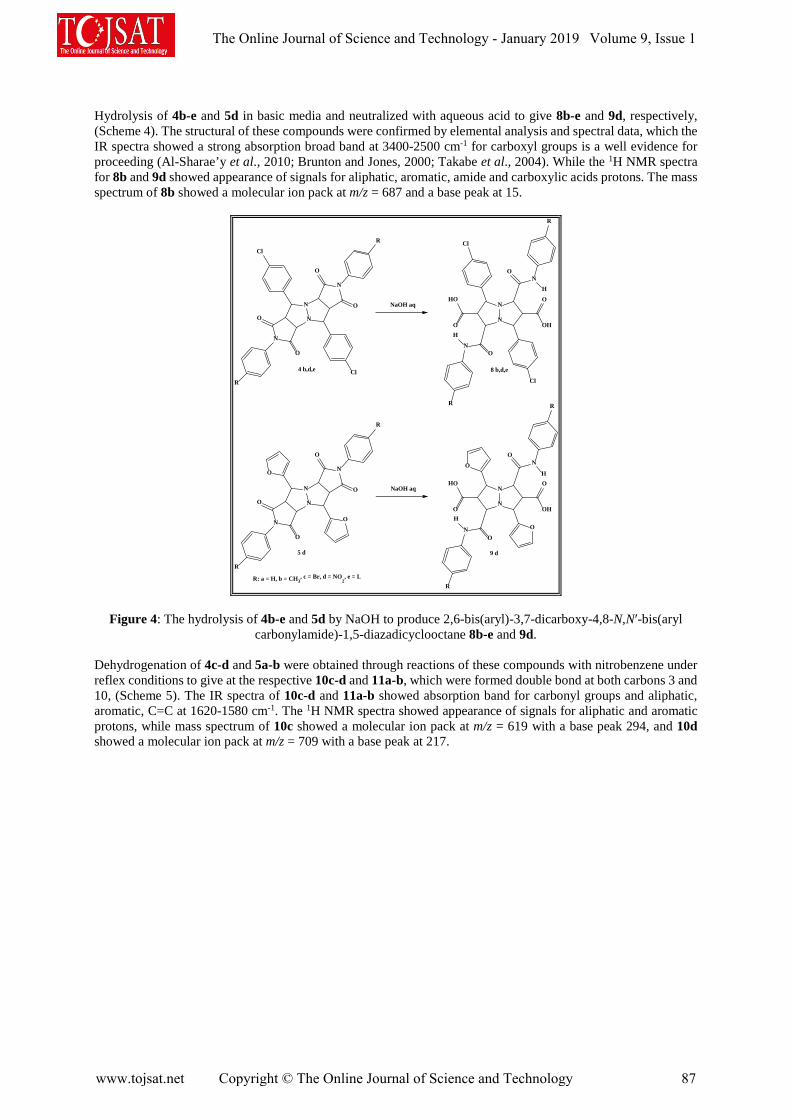
Hydrolysis of 4b-e and 5d in basic media and neutralized with aqueous acid to give 8b-e and 9d, respectively, (Scheme 4). The structural of these compounds were confirmed by elemental analysis and spectral data, which the IR spectra showed a strong absorption broad band at 3400-2500 cm-1 for carboxyl groups is a well evidence for proceeding (Al-Sharae’y et al., 2010; Brunton and Jones, 2000; Takabe et al., 2004). While the 1H NMR spectra for 8b and 9d showed appearance of signals for aliphatic, aromatic, amide and carboxylic acids protons. The mass spectrum of 8b showed a molecular ion pack at m/z = 687 and a base peak at 15.
R: a = H, b = CH3, c = Br, d = NO
2, e = I.
4 b,d,e
5 d
N
N
N
N
R
R
O
O
O
O
Cl
Cl
N
N
N
N
R
R
O
O
O
O
O
O
8 b,d,e
9 d
N
N
N
N
R
R
HO
O
O
OH
Cl
Cl
N
N
N
N
R
R
HO
O
O
OH
O
O
NaOH aq
NaOH aq
OH
HO
OH
HO
Figure 4: The hydrolysis of 4b-e and 5d by NaOH to produce 2,6-bis(aryl)-3,7-dicarboxy-4,8-N,N′-bis(aryl carbonylamide)-1,5-diazadicyclooctane 8b-e and 9d.
Dehydrogenation of 4c-d and 5a-b were obtained through reactions of these compounds with nitrobenzene under reflex conditions to give at the respective 10c-d and 11a-b, which were formed double bond at both carbons 3 and 10, (Scheme 5). The IR spectra of 10c-d and 11a-b showed absorption band for carbonyl groups and aliphatic, aromatic, C=C at 1620-1580 cm-1. The 1H NMR spectra showed appearance of signals for aliphatic and aromatic protons, while mass spectrum of 10c showed a molecular ion pack at m/z = 619 with a base peak 294, and 10d showed a molecular ion pack at m/z = 709 with a base peak at 217.
The Online Journal of Science and Technology - January 2019 Volume 9, Issue 1
www.tojsat.net Copyright © The Online Journal of Science and Technology 87

R: a = H, b = CH3, c = Br, d = NO
2, e = I.
4 c,d
5 a,b
N
N
N
N
R
R
O
O
O
O
Cl
Cl
N
N
N
N
R
R
O
O
O
O
O
O
10 c,d
11 a,b
N
N
N
N
R
R
O
O
O
O
Cl
Cl
N
N
N
N
R
R
O
O
O
O
O
O
Nitrobenzene
Nitrobenzene
Figure 5: The dehydrogenation reaction of 4c-d and 5a-b by nitrobenzene to produce 2,9-bis(aryl)-5,12-N,N′-bis(aryl)-1,5,8,12-tetraazatetracyclo[6,6,0,3,70,10,140] tetradeca-3,10-diene-4,6,11,13-tetraone 10c-d and 11a-b.
Estimation of antimicrobial activity Some of the synthesized compounds were using screened in vitro for their antimicrobial activities. Most of the bacterial pathogens tested were resistant to synthesized compounds. Each of 4d, 5b-d and 9d show moderate activity against Aspergillus niger, while slightly effect for other compounds against some bacterial and fungi species as shown on Table 1. Interestingly, compounds 4d, 5d, 8d and 9d have the same core structures in bis-aryl pyrazolo[1,2-a]pyrazole and two 4-nitrophenyl functional groups. Shared functional groups in 4d and 5d have two diamides, while in both 8d and 9d have twice of each carboxylic acids and amides comparing to other tested compounds, Figure 6. We believe that functional groups increase an effecting against Aspergillus niger comparing with Aspergillus terreus.
4d: G =
N
N
N
N
O
O
O
O
O2N
NO2G
G
Cl
1
5d: G =O
1
8d: G = Cl
1
9d: G =O
1
N
N
N
N
O2N
NO2
HO
O
O
OH
G
G
OH
HO
Figure 6: The structures of 4d, 5d and 9d which have moderate activity against Aspergillus niger.
The Online Journal of Science and Technology - January 2019 Volume 9, Issue 1
www.tojsat.net Copyright © The Online Journal of Science and Technology 88
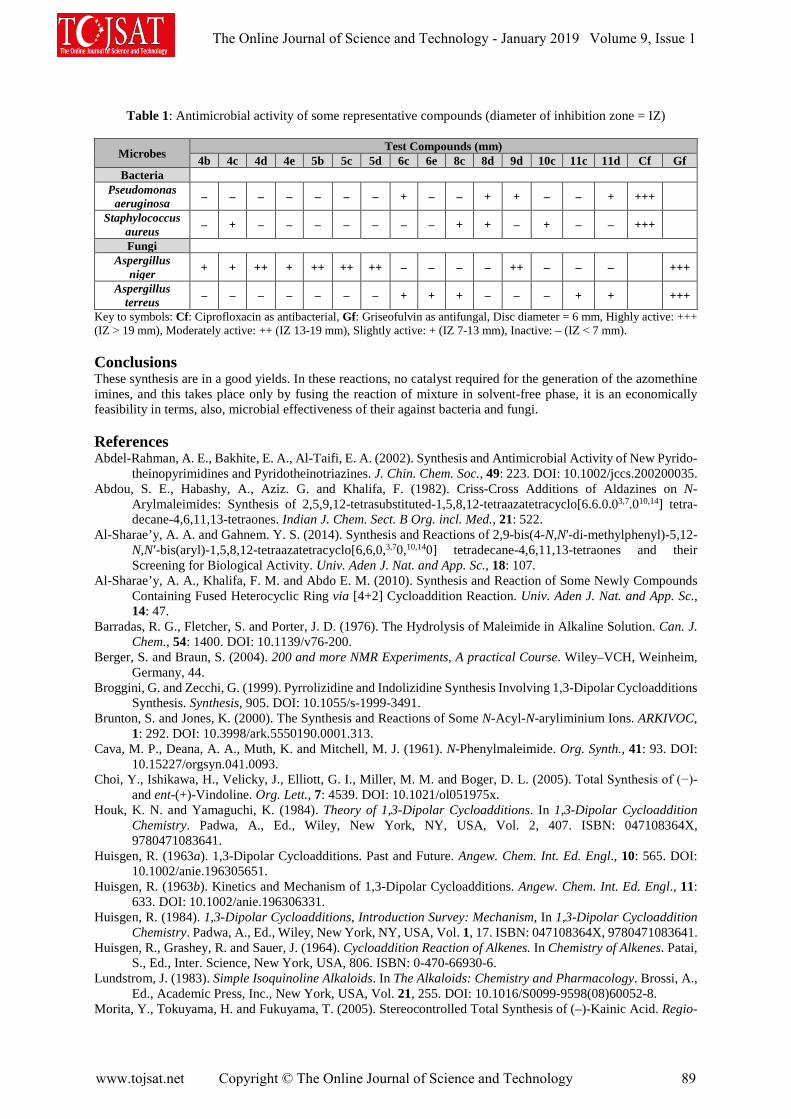
Table 1: Antimicrobial activity of some representative compounds (diameter of inhibition zone = IZ)
Microbes Test Compounds (mm) 4b 4c 4d 4e 5b 5c 5d 6c 6e 8c 8d 9d 10c 11c 11d Cf Gf
Bacteria Pseudomonas
aeruginosa – – – – – – – + – – + + – – + +++
Staphylococcus aureus – + – – – – – – – + + – + – – +++
Fungi Aspergillus
niger + + ++ + ++ ++ ++ – – – – ++ – – – +++
Aspergillus terreus – – – – – – – + + + – – – + + +++
Key to symbols: Cf: Ciprofloxacin as antibacterial, Gf: Griseofulvin as antifungal, Disc diameter = 6 mm, Highly active: +++ (IZ ˃ 19 mm), Moderately active: ++ (IZ 13-19 mm), Slightly active: + (IZ 7-13 mm), Inactive: – (IZ ˂ 7 mm). Conclusions These synthesis are in a good yields. In these reactions, no catalyst required for the generation of the azomethine imines, and this takes place only by fusing the reaction of mixture in solvent-free phase, it is an economically feasibility in terms, also, microbial effectiveness of their against bacteria and fungi. References Abdel-Rahman, A. E., Bakhite, E. A., Al-Taifi, E. A. (2002). Synthesis and Antimicrobial Activity of New Pyrido-
theinopyrimidines and Pyridotheinotriazines. J. Chin. Chem. Soc., 49: 223. DOI: 10.1002/jccs.200200035. Abdou, S. E., Habashy, A., Aziz. G. and Khalifa, F. (1982). Criss-Cross Additions of Aldazines on N-
Arylmaleimides: Synthesis of 2,5,9,12-tetrasubstituted-1,5,8,12-tetraazatetracyclo[6.6.0.03,7.010,14] tetra-decane-4,6,11,13-tetraones. Indian J. Chem. Sect. B Org. incl. Med., 21: 522.
Al-Sharae’y, A. A. and Gahnem. Y. S. (2014). Synthesis and Reactions of 2,9-bis(4-N,N'-di-methylphenyl)-5,12-N,N′-bis(aryl)-1,5,8,12-tetraazatetracyclo[6,6,0,3,70,10,140] tetradecane-4,6,11,13-tetraones and their Screening for Biological Activity. Univ. Aden J. Nat. and App. Sc., 18: 107.
Al-Sharae’y, A. A., Khalifa, F. M. and Abdo E. M. (2010). Synthesis and Reaction of Some Newly Compounds Containing Fused Heterocyclic Ring via [4+2] Cycloaddition Reaction. Univ. Aden J. Nat. and App. Sc., 14: 47.
Barradas, R. G., Fletcher, S. and Porter, J. D. (1976). The Hydrolysis of Maleimide in Alkaline Solution. Can. J. Chem., 54: 1400. DOI: 10.1139/v76-200.
Berger, S. and Braun, S. (2004). 200 and more NMR Experiments, A practical Course. Wiley–VCH, Weinheim, Germany, 44.
Broggini, G. and Zecchi, G. (1999). Pyrrolizidine and Indolizidine Synthesis Involving 1,3-Dipolar Cycloadditions Synthesis. Synthesis, 905. DOI: 10.1055/s-1999-3491.
Brunton, S. and Jones, K. (2000). The Synthesis and Reactions of Some N-Acyl-N-aryliminium Ions. ARKIVOC, 1: 292. DOI: 10.3998/ark.5550190.0001.313.
Cava, M. P., Deana, A. A., Muth, K. and Mitchell, M. J. (1961). N-Phenylmaleimide. Org. Synth., 41: 93. DOI: 10.15227/orgsyn.041.0093.
Choi, Y., Ishikawa, H., Velicky, J., Elliott, G. I., Miller, M. M. and Boger, D. L. (2005). Total Synthesis of (−)- and ent-(+)-Vindoline. Org. Lett., 7: 4539. DOI: 10.1021/ol051975x.
Houk, K. N. and Yamaguchi, K. (1984). Theory of 1,3-Dipolar Cycloadditions. In 1,3-Dipolar Cycloaddition Chemistry. Padwa, A., Ed., Wiley, New York, NY, USA, Vol. 2, 407. ISBN: 047108364X, 9780471083641.
Huisgen, R. (1963a). 1,3-Dipolar Cycloadditions. Past and Future. Angew. Chem. Int. Ed. Engl., 10: 565. DOI: 10.1002/anie.196305651.
Huisgen, R. (1963b). Kinetics and Mechanism of 1,3-Dipolar Cycloadditions. Angew. Chem. Int. Ed. Engl., 11: 633. DOI: 10.1002/anie.196306331.
Huisgen, R. (1984). 1,3-Dipolar Cycloadditions, Introduction Survey: Mechanism, In 1,3-Dipolar Cycloaddition Chemistry. Padwa, A., Ed., Wiley, New York, NY, USA, Vol. 1, 17. ISBN: 047108364X, 9780471083641.
Huisgen, R., Grashey, R. and Sauer, J. (1964). Cycloaddition Reaction of Alkenes. In Chemistry of Alkenes. Patai, S., Ed., Inter. Science, New York, USA, 806. ISBN: 0-470-66930-6.
Lundstrom, J. (1983). Simple Isoquinoline Alkaloids. In The Alkaloids: Chemistry and Pharmacology. Brossi, A., Ed., Academic Press, Inc., New York, USA, Vol. 21, 255. DOI: 10.1016/S0099-9598(08)60052-8.
Morita, Y., Tokuyama, H. and Fukuyama, T. (2005). Stereocontrolled Total Synthesis of (–)-Kainic Acid. Regio-
The Online Journal of Science and Technology - January 2019 Volume 9, Issue 1
www.tojsat.net Copyright © The Online Journal of Science and Technology 89

and Stereoselective Lithiation of Pyrrolidine Ring with the (+)-Sparteine Surrogate. Org. Lett., 7: 4337. DOI: 10.1021/ol051408+.
Pezdirc, L., Jovanovski, V., Bevk, D., Jakse, R., Pirc, S., Meden, A., Stanovnik, B. and Svete, J. (2005) Stereocontrol in Cycloadditions of (1Z,4R*,5R*)-1-Arylmethylidene-4-benzoylamino-5-phenylpyrazolidin-3-on-1-azomethine Imines. Tetrahedron, 61: 3977. DOI: 10.1016/j.tet.2005.02.049.
Scrowston, R. M. (1981). Recent Advances in the Chemistry of Benzo[b]thiophenes. In Advances in Heterocyclic Chemistry. Katrizky, A. R. and Boulton, A. J. Ed., Academic Press, Inc., New York, USA, Vol. 29, 171. DOI: 10.1016/S0065-2725(08)60788-6.
Silverstein, R. M., Webster, F. X. and Kiemle, D. J. (2005). Spectrometric Identification of Organic Compounds. Wiley-VCH, New York, USA, 72.
Smith, M. B. (2013). March’s Advanced Organic Chemistry Reactions, Mechanisms, and Structure. 7th Ed., John Wiley & Sons, Inc., Hoboken, New Jersey, USA, 1020. ISBN: 978-0-470-46259-1.
Stewart, F. P. (2006). Vibrational Spectroscopy of N-Phenylmaleimide. Spectro. Chemica Acta Part A, 63: 544. DOI: 10.1016/j.saa.2005.06.001.
Sustmann, R. (1971). A Simple Model for Substituent Effects in Cycloaddition Reactions. I. 1,3-Dipolar Cycloadditions. Tetrahedron Lett., 29: 2717. DOI: 10.1016/S0040-4039(01)96961-8.
Sustmann, R. and Trill, H. (1972). Substituent Effects in 1,3-Dipolar Cycloadditions of Phenyl Azide. Angew. Chem. Int. Ed. Engl., 11: 838. DOI: 10.1002/anie.197208382.
Takabe, K., Bessho J., Shimotsu, Y., Mizumoto, S., Mase, N. and Yoda, H. (2004). Convenient Synthesis of Pulchellalactam (I), a CD45 Protein Tyrosine Phosphatase Inhibitor from the Marine Fungus Corollospora pulchella, and Its Related Compounds. Heterocycles, 63: 1013. DOI: 10.3987/COM-04-10030.
The Online Journal of Science and Technology - January 2019 Volume 9, Issue 1
www.tojsat.net Copyright © The Online Journal of Science and Technology 90