Embed Size (px)
Citation preview
i
The Oil Trading Markets, 2003 – 2010:
Analysis of market behaviour and possible policy responses
Adair Turner, Jon Farrimond, and Jonathan Hill
WPM 421
April 2011
1 Prepared for publication in the Oxford Review of Economic Policy, Volume 27, Issue1.

ii
The contents of this paper are the authors‟ sole responsibility. They do
not necessarily represent the views of the Oxford Institute for Energy
Studies or any of its members.
Copyright © 2011
Oxford Institute for Energy Studies
(Registered Charity, No. 286084)
This publication may be reproduced in part for educational or non-profit purposes without
special permission from the copyright holder, provided acknowledgment of the source is
made. No use of this publication may be made for resale or for any other commercial
purpose whatsoever without prior permission in writing from the Oxford Institute for
Energy Studies.
ISBN
978-1-907555-24-4

iii
In this working paper, Adair Turner et al. consider price movements in the oil trading
markets between 2003 and 2010, and provide an analysis of factors which potentially
explain the significant trends in this period. The authors also discuss the impact of different
forms of oil price volatility and propose the type that matters most from an economic
standpoint is medium-term price trends. The authors then discuss possible public policy
actions that could be employed to prevent or mitigate such trends, with the paper
concluding that proposals solely related to the operation of the financial markets will not
address the fundamental drivers of instability.

iv
Contents
1. Executive summary ......................................................................................................... 1
2. Introduction ..................................................................................................................... 6
3. The oil market structure and its impact on pricing ...................................................... 7
Important features of oil markets and their consequences ................................................. 7
4. What forms of volatility matter most and why? ........................................................ 13
Which of these volatilities or price trends matter in terms of their impact on the
economy? ......................................................................................................................... 13
5. Commodity market theory ........................................................................................... 16
Basic theory: oil as a storable and exhaustible resource .................................................. 16
Storability ..................................................................................................................... 16
Exhaustibility ............................................................................................................... 16
6. The ‘speculation debate’............................................................................................... 19
The prima-facie case for increased „speculation‟ ............................................................ 19
How might financial speculators drive or stabilise the market price? ............................. 22
A possible theory of speculative drivers of volatility ................................................... 25
A possible theory of the stabilising role of speculation ............................................... 27
How to decide if speculation is driving prices ............................................................. 28
7. Circumstantial evidence ............................................................................................... 29
Oil prices in dollars and other currencies ................................................................... 33
Interpretations of OPEC intentions ............................................................................. 34
Crude oil prices and oil product prices ....................................................................... 36
Circumstantial evidence - conclusion .......................................................................... 37
8. Direct evidence .............................................................................................................. 39
Movements in the net long positions of financial investors ......................................... 39
Changes of net investment flows into the commodity funds ......................................... 44
Spot/futures differential ............................................................................................... 45
Changes in inventories and in production ................................................................... 46
A possible reasonable judgement on the causes of oil price movements ..................... 46
9. Possible policy responses .............................................................................................. 49
Financial market regulation: defining relevant objectives ............................................... 49
Distinguishing between orderly market concerns and „speculation‟ ............................... 50
If „speculation‟ is a problem, is it more prominent in UK financial oil markets? ........... 52
Are there policies that could dampen harmful oil price volatility? ................................. 53
Conclusion ....................................................................................................................... 56
References ........................................................................................................................... 57
v
Figures
Figure 1: Estimated global investment inflows into long-only commodity index funds................... 20
Figure 2: Global investment inflows into long-only oil exchange-traded products (ETPs) .............. 20
Figure 3: ICE Brent and NYMEX WTI crude oil front-month future prices, 2003-2009 ................. 29
Figure 4: IEA estimates of OPEC production vs. the price of Brent and WTI crude oil front month
prices, 2006-2011 .............................................................................................................................. 31
Figure 5: Brent crude oil front-month vs. five-year futures price, 2006-2010 .................................. 32
Figure 6: WTI crude oil front-month is US Dollars and Euros (rebased), 2000-2010 ...................... 34
Figure 7: Argus Diesel NWE 10ppm differential to Argus North Sea Dated Crude Oil ($/bl), 2001-
2010 ................................................................................................................................................... 36
Figure 8: Argus Fuel Oil NWE 3.5% differential to Argus North Sea Dated Crude Oil ($/bl), 2001-
2010 ................................................................................................................................................... 37
Figure 9: Producers, merchants, processors, and users net positions, June 2006 to November 2009
........................................................................................................................................................... 40
Figure 10: Swap dealers‟ net positions, June 2006 to November 2009 ............................................. 41
Figure 11: Managed money long-only positions, June 2006 to November 2009 .............................. 41
Figure 12: Managed money net positions, June 2006 to November 2009 ........................................ 42
Figure 13: Oil prices and combined managed money and swap dealers net position, futures plus
options, June 2006 to October 2009 .................................................................................................. 42

1
1. Executive summary
Oil market structure, theory and hypothesis
There are several inherent features of oil supply and demand that are relevant to any study
of crude oil price volatility. Important features include competing price and income
elasticities, a bifurcated and complex supply response, variable data quality, single
currency pricing, and the interaction of multiple refined oil product markets whose discrete
elasticities of supply and demand can and do have an impact on the general elasticities of
the crude oil market.
These inherent features mean that even if there was little or no speculative activity, the oil
price would likely exhibit significant volatility. These structural features could also mean
that pure financial investment may – at least to some degree and for short periods –
accentuate the price trends, though it is also possible in other instances for such investment
to moderate price movements.
We recognise that, unlike other markets such as equities, the potential for momentum
effects and divergences from equilibrium values in the oil market is somewhat constrained
by the link to the physical spot market. However, by observing the growth in financial
investments during the last decade, we recognise that it is possible to construct theoretical
arguments that suggest financial investor involvement (passive or active) could play a role
in driving future and spot prices away from fundamental equilibria on a temporary basis.
Although market volatility can be measured over many different time periods – minutes,
hours, days, weeks, months - we argue that the key time period for public policy makers to
focus on should be price movements over a number of quarters or half-years. This is
because this is the relevant timeframe for considering a transmission effect to the real
economy (unlike very short-term volatility) but which also has the potential to be
influenced by the speculative activity of either commercial or financial participants
(probably unlike very long-term price trends over five-year-by-five-year time horizons).
In order to assess the impact of speculation on oil prices we consider two important
theories related to the storability (Working) and exhaustibility (Hotelling) of oil. Both of
these theories are closely related because reserves can be thought of as „in the ground

2
inventories‟. They carry the important implication that, in a rational and well-functioning
market, changes in the futures price only have implications for the spot price if they change
decisions about inventory holdings, production levels and oil consumption. If they do not
produce such effects, the balance of supply and demand in the spot market will be
unchanged and the spot price will not change. Changes in inventory levels or production
volumes are, therefore, important tests of whether financial speculation in futures is driving
changes in the spot price.
Overall judgement on oil price movements
The available evidence illustrates that oil price movements between 2003 and 2010 are
largely explicable in fundamental terms, even if it is impossible analytically to determine
whether those movements were precisely appropriate in fundamental terms, or to some
degree also influenced by financial investment flows.
In the first half of 2008, there was an extreme upswing in oil prices, which, certainly in
scale, is difficult to fully explain on the basis of fundamentals. However the same price
rise cannot be explained by direct evidence of effects from financial speculative investment
either. Indeed there is some evidence that pure financial investment flows actually
decreased in this period.
We suggest that the 2008 price surge in spot and short-term futures prices occurred against
the background of wide spread expectations that „medium-term fundamentals‟ (i.e. over a
one to five-year period) would remain tight for some time, and as a result should be driving
prices substantially higher. This suggests that expectations of tighter medium-term
fundamentals worked through their influence on the behaviour and position-taking of
commercial participants (physical oil producers, suppliers and consumers), as much as (and
indeed perhaps more than) through the behaviour of pure financial investors.
However, the exact transmission mechanisms by which the expectations of „future
fundamentals‟ were able to change spot market prices without evidence of effects on
inventory or production, which the Working/Hotelling theories suggest should be evident,
remains unclear and worthy of further analysis.

3
Overall, though, this is a market which, as described by Christopher Allsopp and Bassam
Fattouh2, is characterised by „multiple equilibria‟, with a wide „range of indeterminacy‟
within which the price can settle. Thus, the vulnerability to potential instability derives
from the structural character of the market, not simply from the presence of speculative
financial investors.
Possible policy responses
It is important to understand that financial market regulation in the UK, and in the vast
majority of other key jurisdictions, has focused to date on combating market abuse and
promoting orderly and liquid markets. The UK financial regulator has never had
responsibilities related to „excessive speculation‟. However, our analysis leads us to
conclude that if „speculation‟ is a problem in established financial oil markets it is no more
prevalent, and probably less prevalent, in the UK.
There has been much debate about whether „excessive speculation‟ should be, and indeed
even can be, controlled. The often heralded solution to this supposed „excessive
speculation‟ problem is to limit the proportion of a specific contract any one investor can
hold through the use of position limits or other position management techniques.
However, even if there is a adverse effect arising from the entry into the market of a class
of pure financial investors, limiting the percentage of any one contract that can be held by
any one investor would not be an effective response, since multiple investors each holding
positions below the percentage limit could, conceivably, still have a large aggregate effect.
Nor would it make sense to calibrate a regulatory regime which seeks to limit the
participation of one class of investor given that, as we noted earlier, medium-term market
expectations affect prices through the position taking of both commercial and financial
participants.
2 Allsopp, C., and Fattouh , B. “Oil Prices: Fundamentals or Speculation?” presentation at the Bank of
England, 13 June 2008.
Fattouh, B. (2010), “Oil Market Dynamics Through the Lens of the 2002-2009 Price Cycle", Oxford Institute
for Energy Studies, WPM 39 January 2010.

4
There is, therefore, a disconnect in the discussion of objectives and policy tools. Position
management techniques (including position limits) on specific contracts are clearly relevant
as tools for addressing issues of market abuse, ensuring the short-term orderliness of
markets and limiting discrete forms of speculation relating to individual participants in
individual contracts. However these tools are largely irrelevant to the issues of overall
medium-term price trends. We see no evidence that these tools, where they have been
used, have had a systematic impact on such trends.
If medium-term price trends do diverge from “rational fundamental” equilibrium, then
different policy tools would be required to attempt to address this. Given the structural
roots of this instability, the issue is whether there are any public policies that could help
address the primary causes of potentially harmful price trends.
In thinking about policy responses we distinguish between three categories of policies, and
aim to be clear about how they relate to the key economic issue.
I. Policies that are not relevant to the economically important medium-term price
trends but are important in relation to other issues
These include financial regulatory policies such as implementing an effective regime
to ensure markets are orderly and to combat market abuse. Position management
techniques (including position limits) are examples of such relevant regulatory tools.
II. Policies that are, or might be, relevant to medium-term price trends but do not
address the fundamental drivers of oil price volatility and whose feasibility
remain unclear
These include limits on the absolute level of pure financial investment in the oil
market, transaction taxes to limit the potential for short-term capital gain, and
strategic petroleum reserves being used as a countercyclical „buffer‟ during economic
cycles - these are all logistically difficult to implement and therefore unlikely to
make a major difference in the oil market.
III. Policies that would address the fundamental drivers of oil price volatility but
raise issues well beyond financial regulation
These would have to be policies that could help stabilise expectations for the
medium-term equilibrium price, with clear market expectations of both floor and
ceiling levels. This would require a developed and regular dialogue between the key

5
producer groups and consumer nations. We also consider that current initiatives to
enhance the quality and scope of fundamental data could help contribute to less
volatile oil prices by reducing the range of possible interpretations of current and
future fundamentals.
Conclusion
The key focus for public policy makers should be medium-term price trends because of the
potentially harmful economic impact these can have. However, we consider the objective
of controlling medium-term price movements through financial market regulation alone to
be both misaligned and unachievable. This is because the financial regulatory tools
currently being considered, such as position management techniques (including position
limits), would not have a meaningful impact on this key issue. The overall conclusion is
that, if there are policies which can make a difference to the key economic issue they would
have to address the fundamental drivers of instability, rather than issues solely related to
the operation of the financial markets.

6
2. Introduction
In recent years there has been significant debate over movements in oil prices – in
particular, whether oil prices are being driven by speculative financial investment rather
than fundamentals. This is a subject already covered by numerous studies and one which
has generated considerable controversy. The attention given to this topic is well deserved
since oil is of the highest economic significance, having macro-economic impact on growth
and because oil products are key consumables affecting household incomes. Further, the
international nature of oil production, consumption and trade means that consequences are
far reaching.
The paper discusses why volatility in oil markets matters and considers what types of
volatility are most significant. The discussion also includes both qualitative and
quantitative analysis, covering oil market fundamentals and the behaviour of financial
markets in the period, including analysis of data from the US CFTC‟s Commitment of
Trader Reports, as well as data on investment inflows to commodity markets published by
other commentators. In the quantitative analysis, consideration is given of how Working
and Hotelling effects apply to or can be used to explain the observed market behaviour.
The later sections of the paper consider possible public policy responses to the observed
market behaviours. Policy responses on a market of such potentially high impact must be
carefully considered to avoid prejudicial consequences from incompletely considered
proposals.
This scope of this paper is limited to the period 2003 – 2010. Price trends in 2011 are not
considered, but the authors acknowledge significant price movements during this year and
that these justify further study.
7
3. The oil market structure and its impact on pricing
Important features of oil markets and their consequences
There are several inherent features of oil supply and demand that are relevant to any study
of oil price volatility. These inherent features mean that even if there was little or no
speculative activity, the oil price would likely exhibit significant volatility. We may also
infer, however, that these structural features also increase the extent to which financial
speculation could have a volatility-inducing effect. There are seven features we consider to
be important.
1. The balance of elasticities
The price elasticity of demand for the oil complex3 is relatively low because of its
inherently high-value uses, high non-US OECD fuel taxes and price subsidies in several
emerging markets. Price elasticity may well have fallen over recent years, as more
emerging-market economies are now consuming proportionately more oil for use in
transportation, where there are very few substitutes, than was the case previously.
Traditionally, emerging market economies have largely consumed oil for the purposes of
heating and electricity production, where there are substitutes. That is not to say, however,
that demand for oil is completely unresponsive to price signals. For example, there is
evidence to suggest that the high and rising price of diesel (a key oil product) in the period
2004 to 2008 did limit demand for this oil product.
The price elasticity of oil supply is also low for a number of reasons. In non-OPEC4
countries most oil fields are typically running at or near full capacity, restricting the ability
of oil operators in those countries to increase supply as prices rise. In countries where there
is currently spare capacity (e.g. Saudi Arabia), the reaction of supply to demand is
determined, in part, by expectations of future oil prices, with the objective of maximising
the value of reserves.
3 By „oil complex‟ we mean crude oil and the oil products that result from the refining process.
4 Organization of the Petroleum Exporting Countries

8
Long lead-in times between initial exploration and actual oil field production further limit
the price elasticity of oil supply. This is particularly noteworthy given the potential for
supply responses to be mistimed – either through the inability to bring sufficient levels of
oil supply on stream during times of rising demand or, conversely, through new oil fields
coming on stream at a time of reduced demand, causing supply gluts.
Income elasticity of demand is quite high because as people get richer, their demand for
products and services that are in some way reliant on oil consumption, particularly car
travel, tends to rise rapidly. The high income elasticity effects dominate the comparatively
low price elasticity effects. The oil market price is therefore strongly influenced by any
changes in the expected level of short to medium-term income growth, particularly income
growth in major emerging markets.
The combination of these effects makes for natural price volatility. Indeed, the persistence
of such natural price fluctuations may be, at least to some degree, self-perpetuating i.e.
inherent price volatility creates greater uncertainty around the returns available from
investments in both supply-side projects and other physical commodity assets. This can
create a disincentive to invest, resulting in periods of underinvestment followed by price
increases.
2. A bifurcated supply
There is a bifurcated supply, which is divided between:
OPEC supply: this has in some, but not all, cases low marginal costs of additional
supply. Short-term supply may be increased by producing more oil from available
spare supply capacity. Medium to long-term supply may be increased by drilling
more wells to tap both new and proven reserves. The majority of OPEC reserves are
governed by national oil companies that typically have exclusivity over exploring
and developing resources.
Non-OPEC supply: this has, in most cases, either high marginal costs or physical
impossibility of additional short-term supply. Although advances in technology are
continually extending the boundary of what is considered to be extractable reserves,
the non-OPEC supply response in the medium to long-term still faces high marginal
costs related to exploration and production. The factors arise because the best
9
prospects for non-OPEC supply are largely confined to highly complex production
environments (e.g. deep water wells or tar sand projects) and because increased
investment often produces a major supply-chain cost response. International oil
companies are largely confined to operating in non-OPEC oil reserves.
This bifurcated market means that, even if price bears some relationship to short or long-
term marginal cost, prices may vary widely between the floor of the lowest-cost producer‟s
marginal costs and, after a period of investment, a ceiling set by high marginal costs in
new-territories such as complex deep water projects. In a non-exhaustible product market,
this huge divergence of marginal costs would have no necessary impact on price volatility,
since the low marginal cost producer will always produce at maximum capacity. But in an
exhaustible resource market, the lowest-cost producer does not run at full capacity even if it
could, because it is balancing sales now against potentially more profitable sales in the
future.
3. The supply responses
The two different supply sectors have specific and difficult-to-predict supply responses.
OPEC operates with complex objectives and political processes. In part, it attempts to
achieve an optimal balance of demand today against demand in the future. In part, it is
driven by desire for short-term cash flow, even if this is not a rational long-term
maximization strategy. Yet this is set against a desire that prices should not become so high
as to drive consumers to seriously invest in reducing oil dependency. It is also partly
influenced by political factors. The complex interplay of these different considerations,
which appear to be of varying importance to different members of OPEC and will naturally
change in importance over time, makes it difficult to develop any predictive model of
OPEC‟s price behaviour. In addition, the simple logistics of forming an agreed policy
amongst such a large group of oil producing countries can leave OPEC open to the risk that
responses to immediate price pressures may not be immediate enough to stabilise markets.
Non-OPEC supply is dominated by private enterprise oil companies, which seek to
maximise shareholder value of the assets and reserves under management. However,
because supply industry costs vary with demand, owing to limits on highly specific skills
and equipment, this creates uncertainty over the marginal costs of supply in the expensive
10
non-OPEC environments. In turn, this makes future expected prices partly the determinants
of marginal costs rather than vice versa.
4. Supply-side lags
Supply-side lags are a further important feature of the oil market. Any decisions from oil
producers to increase production take time to feed through into real output because of the
necessity to transport, store, and refine the crude oil. This means that supply-side
responses to changes in demand, especially increases in demand, can never be immediate.
It is possible, therefore, for price trends in both the crude oil and oil product markets to
persist for significant periods before any supply-side production changes take effect.
5. The interaction of supply and demand dynamics in multiple refined oil product
markets
Market dynamics in the refined oil product markets are just as important as those in the
crude oil market. The interaction of supply and demand dynamics in these markets
includes the following factors:
The refined products markets are subject, in degrees, to the general elasticities of
the crude oil market, discrete product market elasticities of supply (e.g. refinery
capacity), and discrete product market elasticities of demand. These factors are
clearly linked as the discrete elasticities of the product market can have an impact
on the general elasticities of the crude oil market, and vice versa.
The Gross Product Worth (GPW)5 of refined products is never stable. This is partly
due to changes in the input costs of crude oil, and partly a function of the fluid
prices of the relative oil products, which are subject to their own supply and
demand fundamentals. Refining margins and individual product „crack spreads‟6 are
therefore an important component of oil price dynamics.
5 Gross product worth is the sum of the individually weighted values of all refined oil product components of
crude oil, with each product weighted according to its proportionate share in the yield of a single barrel of
crude oil.
6 The differential between the price of crude oil and petroleum products extracted from it.

11
Oil products are refined to set specifications and industry standards, though these
are subject to change over time. Changes to these agreed standards represent a shift
in the dynamics that make up oil product fundamentals7.
Oil product markets are both numerous and diverse, some of which are highly
specialised. Such bespoke products are not conducive to being widely traded, giving
rise to illiquid markets and a lack of clear long-term price signals for those
particular products. This can be a source of product price volatility.
6. Data quality
Oil market data varies in quality across different parts of the world. There are important
uncertainties about the facts of production, consumption and inventory build up (and thus
spare production capacity) in some key oil producing countries. For example, the oil
market is largely reliant on estimates of OPEC output because actual figures of official
monthly production and inventory data are not available.
Even where this data is available there is uncertainty over actual levels of production,
consumption and inventory holdings (i.e. „real‟ supply and demand). This is attributable to
inherent time lags in data publication and revisions, the low level of reliability the market
can place on some of the data available, and a general lack of transparency in some
countries (notwithstanding the valuable Joint Oil Data Initiative (JODI)8). In particular,
consumption and demand statistics are notoriously difficult to quantify in any precise
manner.
In addition, the precise amount of total proven oil reserves across the globe (and thus
optimal depletion strategies) will never be able to be calculated with precise accuracy
because of geological uncertainties over the precise size of individual oil fields and
maximum extraction rates. This factor is of particular relevance to key potential marginal
oil producers, such as some members of OPEC.
7 For example, a tightening of regulations in many countries limiting the level of sulphur content in diesel
products continues to add to the demand for low-sulphur fuel, and has at times tested refiners‟ ability to refine
a sufficient quantity.
8 See http://www.jodidata.org/WJODI.shtm for more on the Joint Oil Data Initiative.

12
Uncertainty around the precise veracity of the available oil market data makes it difficult to
accurately assess recent and current market fundamentals. This factor facilitates a broader
range of interpretations about current and future fundamentals, meaning a greater range of
oil price are possible than would otherwise be the case if the market had full and perfect
information.
7. Dollar pricing
Crude oil markets are priced in one currency (the US dollar), but oil is produced, consumed
and traded globally. The strength or weakness of the US dollar therefore affects the price of
oil in other currencies. If one-way directional movements between the US dollar and other
currencies are prolonged and sustained enough, this will have one of two effects: the
currency movements will be directly reflected in the price of crude oil, particularly if the
pricing currency of oil, the US dollar, is subject to a particular strength or weakness against
a broad basket of other currencies; or the currency movements will be reflected in the
supply and demand patterns of non-US countries‟ crude oil production and consumption.
Combined impact of the seven factors
The combination of these seven features means that, even if there were no financial
speculators active in the oil market, and the formation of prices were solely based on the
forecasts and commercial activities of producers, refiners, and consumers (which are
themselves to a degree speculative), it would be likely at times to display very significant
price volatility. Conversely, at other times, the oil market would be likely to display
reasonable stability if, for example, demand settled at a level where there was significant
spare low-marginal-cost capacity9.
But these factors also mean that, if financial speculation does induce movements away
from fundamental values, the inherent volatility of the oil market and complex interplays of
the participants involved could lead to a larger divergence from „true fundamental‟ values
than would occur in a market where the complexities arising from the structures and
dynamics of the oil market were not present.
9 As alluded to earlier, in the oil market this low-marginal-cost capacity is, in effect, controlled by OPEC.

13
4. What forms of volatility matter most and why?
Market volatility can be measured over many different time periods – minutes, hours, days,
weeks, months. The conventional use of the term volatility in oil markets refers to price
movements over five-day and 25-day periods. Price movements that span more than a
single month are typically described as price „trends‟ or „cycles‟, as opposed to volatility. A
definition of „volatility‟ is higher frequency movements in oil prices where there is
variability about the mean. „Cyclicality‟, in contrast, can be understood as lower frequency
trends in oil prices where there is evolution of the mean.
A market could be characterised by many different price patterns. It could be highly
volatile minute-by-minute, or hour-by-hour, but not subject to any major price trends or
notable developments in cycles on a quarter-by-quarter or year-by-year basis.
Alternatively, prices could vary a great deal quarter-by-quarter in a market which is not
highly volatile, minute-by-minute. And the impact of „financial speculation‟ on volatility
and price trends may be partly determined by the time period over which „financial
speculators‟ are taking positions, ranging from algorithmic traders focusing on minute-by-
minute (or second-by-second) movements to investors taking a point of view about whether
oil will go up or down over the next six months or year.
Which of these volatilities or price trends matter in terms of their impact on
the economy?
We believe that it is price swings, such as those that took the front month price of both
Brent and WTI crude oil futures from around $60 per barrel in early 2007, to over $145 in
mid-2008, back down to $40 in Q1 2009, and up to the start of a subsequent period of
relatively range-bound prices from June 2009 onwards10
. These price swings are potentially
economically harmful because they can:
induce macroeconomic volatility and complicate monetary policy implementation;
10We do acknowledge that the run-up in the oil price to the high seen in 2008 could be seen to have started as
early as 2004. However, clearly the final stages of that „bull run‟, i.e. from late 2007 onwards, were far more
accelerated than the period from 2004 to mid-2007.
14
create difficulties in business planning assumptions for oil consumers;11
fail to provide sustained price signals to guide long-term investment in oil
production capacity; and
fail to give the long-term sustained price signals required to guide long-term
investment in low-carbon alternatives to oil.
In contrast to these effects, very short-term volatility (e.g. intra-day or day by day) is less
likely to be less concerning. This is because very short-term price movements are less
likely to affect the real economy, particularly for those physical transactions that are priced
with full or partial reference to the daily settlement prices of oil benchmarks, averaged over
several days. We do however recognise that such short-term price movements may have
implications for efficient and orderly market operation in the following ways:
in physical markets, intra-day volatility increases the importance of market timing
for producers and consumers selling or sourcing crude oil;
in financial markets, short-term volatility could create „unnecessary‟ cash-flow
issues for hedging companies required to meet margin calls; and
algorithmic trading may pose other regulatory risks if, for example, errant
algorithms result in disorderly markets.
As for the long-term price trends (e.g. over five-year-by-five-year time horizons) it is
unlikely „speculation‟ by either commercial or financial participants influences price in any
meaningful manner. Although these long-term price cycles have the potential to be
economically destabilising, they are almost certainly driven by fundamentals in oil supply
and demand, not by „financial speculation‟, except to the extent that price trends in a
quarter-by-quarter or half-year-by-half-year sense might have an impact on the level of
investment and, as a result, change future fundamentals.
11 Although oil prices can be hedged, which provides price certainty during the period of the hedge, this does
not protect companies against the risk that other oil-using companies in the same sector have either a different
strategy or no hedging strategy at all. Nor does it protect oil consumers against the exposure to high or low oil
prices when the initial hedge lapses;

15
The key focus of the debate on speculation should therefore be on the movements over a
number of quarters or half-years, such as the phenomena witnessed during the steep 2007
to 2008 oil price rises, the subsequent severe collapse in price from the middle of 2008 to
early 2009, and the following recovery of short term prices up until June 2009.

16
5. Commodity market theory
Basic theory: oil as a storable and exhaustible resource
Two characteristics of oil (as of other hard commodities) have implications for the
relationship between future and spot prices.
Storability
This has the implication (set out by Working (1949)) that oil can be bought in the spot
market, put in inventory, and then delivered or sold to meet a future sale liability. As a
result, the futures price and the spot price should in theory be related by the formula:
Futures Price = Spot Price (1+ Interest Rate for relevant time period) + Storage Cost – Convenience Yield,
where the convenience yield is the extra value which physical users of oil (e.g. refiners)
place on holding actual oil rather than just a promise of the delivery of oil.
As a result of this relationship, inventory-holding decisions should be influenced by
movements in the differential between future and spot prices. If future prices increase, then
(everything else being equal) the incentive to store oil increases. This should result in
inventories increasing, transferring some of the oil supply for immediate delivery to a later
date, tightening the current spot market fundamentals. The spot price should then rise to re-
establish equilibrium conditions. If futures prices fall below the equilibrium relationship
with spot prices, there is an incentive to run down inventories, resulting in a greater supply
of oil available for immediate delivery, and spot prices should fall. It is also important to
note the circularity of these factors in that, for example, changes in inventory levels can and
do affect market prices.
Exhaustibility
In addition, however, oil is an exhaustible resource and producers therefore know that at
some stage it will run out. To optimise their return, they should consider the optimal
balance between producing oil today at today‟s spot price, and producing tomorrow at the
expected future price or the price available in the futures market. Hotelling (1931)
illustrated that, for producers to be indifferent between these two options, the expected
price or current futures price of oil has to equal the spot price plus the rate of rate of return
that the producer could receive on investments, or the interest it would have to pay on
17
borrowings. Therefore, the price of an exhaustible resource net of marginal extraction costs
(the „net price‟) should at any time be expected to increase at the rate of interest/return
between one period and the next.
The implications of storability and exhaustibility and the insights of Working and Hotelling
are closely related, as reserves can be thought of as „in the ground inventories‟. However,
there are many real-life complexities that make it difficult to observe the precise Working
and Hotelling relationships at any one time. These include:
new discoveries of crude fields, which mean there is uncertainty around the exact
rate of exhaustibility;
the length of time taken for changes in the spot/futures differential to result in
changes to inventory holdings („lag effect‟);
varying perceptions of the convenience yield (which to a certain extent must cover
market expectations about future supply and demand);
different interest rates or rates of return relevant for different producers and for
inventory holders in different economic positions;
different net marginal costs between different sources of oil;
imperfect information; and
the operation of the producers‟ organisation, OPEC.
There are also apparent limitations to the Working model. As noted earlier, the dynamics
of crude oil prices are influenced not only by factors specific to crude oil supply and
demand, but also by the complex relationships in specific oil product markets (which the
Working model does not explicitly allow for). The model also makes no attempt to
determine what a “correct” spot price should be; the model assumes the spot price to be
given, and it merely draws a relationship between this and the futures price.
However, the theories do carry the important implication that, in a rational and well-
functioning market, changes in the futures price only have implications for the spot price if
they change decisions about inventory holdings, production levels and oil consumption. If

18
they do not produce such effects, the balance of supply and demand in the spot market will
be unchanged and the spot price will not change. Changes in inventory levels or production
volumes are, therefore, important tests of whether financial speculation in futures is driving
changes in the spot price.

19
6. The ‘speculation debate’
The prima-facie case for increased ‘speculation’
Three different measures indicate significant change in the dynamics of the oil market over
the last 15 and, in particular, the last five years.
First, over the last 15 years there has been an enormous increase in the volume of trading
activity on the oil futures market. For example, crude oil futures on New York Mercantile
Exchange (NYMEX) and ICE Futures Europe12
increased from an average daily volume of
approximately 149,000 contracts (the paper equivalent of 149m barrels) in 1994 to
1,019,567 contracts (1,020m barrels) in 2009.13
Annual oil trading volumes (expressed on a
notional underlying basis) have therefore gone from approximately 1.51 times total annual
global consumption to approximately 8.45 times in 15 years14
.
Second, between 1994 and 2001 total open interest15
in the NYMEX and ICE Futures
Europe crude oil futures contracts was growing at relatively stable rate, remaining in a
range of 500,000 – 700,000 open contracts. However from 2002 onwards, open interest
increased rapidly, reaching approximately 2.45 million contracts by the end of 2009.
Third, inflows into new commodity investment products, such as index funds and oil-
linked exchange traded products (ETPs), were relatively minor until about 2003. Although
it is hard to be precise about these trends, it is apparent that investments in such products
have increased dramatically over the subsequent seven years.
Exposure to returns from a commodity index fund is typically achieved through an over-
the-counter (OTC) transaction, usually through a swaps dealer. It is currently not possible
to obtain complete, reliable and regular data for investments into OTC commodity market
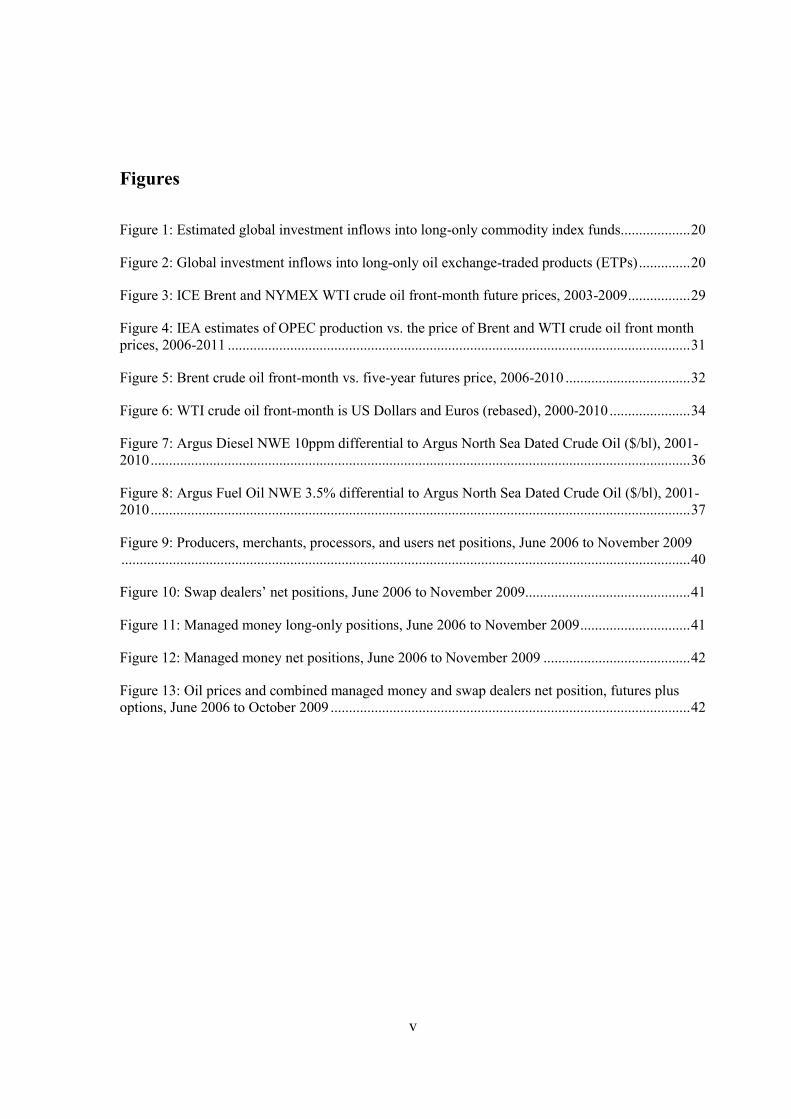
index funds. Figure 1 shows an estimate of this activity. The transparent nature of the
12 Formerly the International Petroleum Exchange.
13 Combined figures provided by NYMEX and ICE Futures Europe.
14 Ratios calculated as exchange volumes / global consumption. Global consumption figures obtained from
BP Statistical Review of World Energy (1994 & 2009).
15 The total number of futures contracts that have been transacted and are yet to expire or be closed out.

20
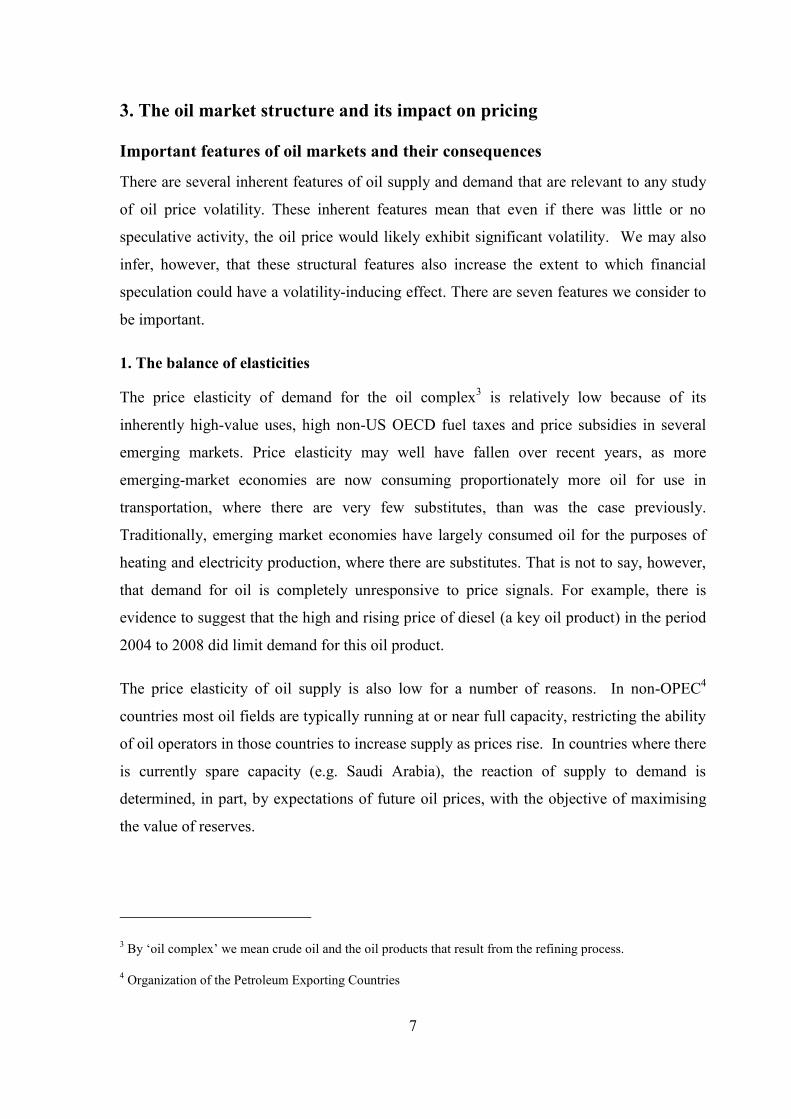
exchange-traded products market means it is possible to accurately track inflows flow into
ETPs, shown in Figure 2.
Figure 1: Estimated global investment inflows into long-only commodity index funds
-10
-5
0
5
10
15
20
Q1 05
Q1 06
Q1 07
Q1 08
Q1 09
Q1 10
40
50
60
70
80
90
100
110
120
130Estimated inflow s into commodity indices - $bn (LHS)Quarterly average WTI oil prices - $/bbl (RHS)
Source: Barclays Capital Commodities Research
Figure 2: Global investment inflows into long-only oil16
exchange-traded products
(ETPs)
-2
-1
0
1
2
3
Jan-0
7
Jul-0
7
Jan-0
8
Jul-0
8
Jan-0
9
Jul-0
9
Jan-1
0
Jul-1
0
Infl
ow
s (
bil
lio
ns $
)
0.0
20.0
40.0
60.0
80.0
100.0
120.0
140.0
160.0
Oil
pri
ce
Inflows into global on-exchange oil ETPs Monthly average oil price
Source: Barclays Capital Commodities Research
16 Oil here refers to WTI, Brent, Heating Oil and Gas Oil exchange-traded derivative contracts.

21
These different measures of increased market activity could be explained by a number of
different factors, some, but not all, of which suggest increased pure financial investor
involvement.
The increase in average daily trading may be understood by a confluence of the following
factors:
increased trading activity by commercial participants (producers and consumers)
using the futures market more actively for hedging purposes;
a more diverse population of participants trading in oil markets, driven by the move
to electronic trading, a factor that has become increasingly prominent throughout
the last decade. Electronic trading undoubtedly opened the oil market up further to
new users, particularly high-volume intra-day, low-position-holding traders; and
the drive for diversification into a new asset class by the investment management
industry. Although long-term passive commodities investment is probably less of a
contributing factor to higher volumes than other trends, it is a direct indicator of
more active financial investor involvement.
The notable increase in oil futures contract open interest from about 2002 onwards is a
direct result of one of two trends:
participants holding larger positions in any one futures contract; or
more participants taking longer-term views expressed via positions in longer-term
futures contracts.
It is reasonable to conclude that both factors are present, with physical participants
increasing hedging activity and speculative traders buying and holding contracts (especially
index funds from the middle of the last decade onwards). Both of these factors may, in
turn, be influenced by the prevailing pattern of price relationships in the futures markets.
For example, in deep contango17
markets we might expect greater levels of storage activity
and futures contract sales by commercial participants to lock in profits available from the
17 In a „contango‟ market the price of a commodity for future delivery is higher than the spot price.
22
prevailing market price „spreads‟. This would result in a rise in open interest, particularly
where these trades are left on for some months. We note that both Brent and WTI futures
curves were mostly in contango, to differing degrees but particularly at the front end of the
curve, throughout most of the period 2005 to mid-2007, and in deep contango in late 2008
and early 2009.
How might financial speculators drive or stabilise the market price?
The possible impact of financial investors on futures and spot prices would depend on their
investment and trading strategies.
Passive index investors, who are investing money in commodity markets and holding that
investment for long-term gain, typically hold funds in the most liquid short-term futures
months.18
Within this group it is also important to distinguish between:
investors and fund managers who are holding commodities as a target allocation or
fixed proportion of a portfolio with several asset classes, and who will therefore
tend to sell when the price rises and buy when it falls to maintain portfolio shares
(though with the precise behaviour determined by the price movement of all other
asset classes as well);
investors whose holdings do not vary in this fixed proportion way. The flow of such
investors into and out of the market (e.g. subscribing to and then withdrawing
money from index funds or ETPs) may in turn be influenced by price movements in
three different ways:
- in a momentum fashion (prices have increased and are therefore
assumed to be going up further);
- in a countervailing fashion (prices have moved down, signalling a
buying opportunity); and
18 We acknowledge that second generation commodity index funds and ETFs may be changing this traditional
characteristic.

23
- in a manner driven by the prevailing market price structure of the
futures curve (it is accepted by market participants that
backwardated markets make long-only investments more appealing
than contango markets because of the „roll yield‟ effect).
In contrast, there are other investors and fund managers who are taking a more active view
on potential market movements. Though active investors will often be managing funds to a
given mandate, the strategies employed are more flexible than those of passive investors.
This is because active investors can express long and short views over varying timeframes
and positions can be easily calibrated to accord with changing views on market conditions
and developing market fundamentals. These active investors can, in turn, be divided into
(at least) the following categories:
Physical producers and consumers, who for the most part hedge, but can at times
speculate;
Physical commodity trading and logistics specialists that utilise futures markets
both for hedging strategies and to optimise physical positions;
„Pure‟ speculative active investors, who can be further sub-divided into:
- algorithmic/intra-day traders looking to exploit small pricing anomalies
or expressing short-term views;
- active investors with points of view relevant to short-term (i.e. over the
next few months) movements in prices, with this point of view based on
detailed analysis of both movements in inventories and short-term
supply and demand conditions;
- active investors with a point of view of medium-term (i.e. one to three
years ahead) trends in prices, with this point of view dependent on
fundamental analysis and forecasts of supply and demand;
- active investors following momentum strategies by observing trends in,
for example, the volume of passive investment funds committed to the

24
market, then using these trends to infer potential movements in prices,
and investing behind these momentum movements in a way which then
accentuates the momentum19
.
In general, however, sophisticated active investors tend not to take large one-way
directional „bets‟. Trading tends to occur in „spreads‟, either between months or other
related commodities, meaning that such participants are rarely exposed to any „flat price‟
risk. This somewhat limits the potential for momentum investing. It should also be noted
that where participants‟ activity spans the physical and financial markets, the exchange-
traded leg of a trade may be just one component of a broader, more complex trading
strategy.
The term „financial investors‟ can, therefore, include participants that are conducting
fundamental analysis and those that are not. It can also include participants who are rational
in their assessment of future prospects, some who are irrational momentum players, and
some who are entirely rational momentum players (i.e. they are aware of an unsustainable
herd effect, but rationally decide to ride the momentum for a period of time before getting
out in time, ahead of the subsequent price correction).
We know from other liquid financial markets (e.g. equity markets) that this combination of
different investor types and strategies can produce significant divergence from the values
which are in some sense „rational‟, „equilibrium‟, or „fundamental‟. In the equities market,
these divergences can be extreme and sustained for several years (e.g. the internet bubble
of 1998 to 2001, or Japanese equities in the late 1980s).
In the oil market, however, the potential for these momentum effects and divergences from
equilibrium values is somewhat constrained by the link to the physical spot market as
defined by the Working (storable goods) and Hotelling (exhaustible resource) relationships.
Equity prices can diverge massively and for long periods from equilibrium values because
the range of possible estimates of future cash flows is very wide, and because there is no
„physical market‟ which has to clear, irrespective of points of view on future potential
19 We understand, however, that this form of trading is not as prevalent in commodity markets as it is in
equity markets and it is unlikely that many active managers will pursue such strategies in isolation, i.e. it may
be one consideration among a number of fundamental factors.

25
value. In the equity markets, the only values that exist are those based on expectations of
future events. The oil market has a physical reality as well.
A possible theory of speculative drivers of volatility
Despite this important difference, however, it is possible to define ways in which inflows
from financial investors could at times drive movements in oil futures prices, and by
extension the corresponding spot price, without regard to fundamental factors.
It is evident that we have moved from an era in which few long-only investors invested in
oil (or other commodities) to one in which commodities became a significant asset class.
This commitment of new money into the futures market could change the prior existing
supply and demand equilibrium, pushing up the futures price.20
This should then push up
the spot price via Working/Hotelling type effects. The increase in the spot price might then
validate the bullish investments, encouraging further investment in a self-reinforcing
momentum effect.
Such a self-reinforcing effect could be accentuated if, in addition to passive index investors
building up new long positions, there were also active momentum players investing on the
expectation that the passive investors would, for a period of time, drive a price increase.
While at some time it is assumed that this self-reinforcing effect has to meet the reality of
spot market supply and demand balances, it is possible to imagine a divergence between
the current market price and the price that would be justified by „true fundamentals‟ which
is sustained for a considerable period of time.21
20 This change in sentiment could be induced by a period of a significant rise in oil prices which was itself
initially based on fundamental factors.
21 In the scenario described the logical response of passive long-only investors would be, to a degree, driven
by the relative price structure of the futures price curve. For example, if strong contango markets persisted
for a long time, passive long-only money would be likely to exit. Equally, the price structure of the futures
curve may limit how far a higher futures price (which, under the described scenario, is purported to be driven
by increased financial investment) affects the spot price. For instance, in a steeply backwardated market,
even if futures prices increased, it may well be the case that the backwardation persists. The net effect would
be that the increase in the futures price would not prove to be enough of an incentive for producers to divert
oil for immediate spot delivery (where prices are higher) to future sales (where prices are lower). That is to
say that in backwardated markets, it is not clear whether a temporary boost to future prices would necessarily
affect inventory storage levels.

26
However, it is also true that the longer the expectation of an actual change to the demand
and supply balance is not validated, the more likely it is that the divergence will unwind
due to an „unfulfilled expectations‟ effect. This may have implications for the future
behaviour of long-only investors as a result of the losses they might then face. Balancing
the self-reinforcing effect, the unfulfilled expectations effect would imply that divergences
from fundamental values could not be sustained for long periods.
Complex links between the futures markets, physical markets and products market may
also tend to limit the scale of price divergence from „true fundamentals‟. A market which
is focused on complex relativities and spreads (between different crudes, different products
and different dates) may be less likely to be subject to self-reinforcing divergence from
equilibrium than one focused primarily on overall price levels (like the equity market).
Despite the complexities, however, it seems clear that if a major new category of investor
enters the market with the intent of building and holding long-only positions, and if the
possibility of this investment flow had not previously been allowed for in the price
discovery process, it is inevitable that there will be a temporary boost to futures prices and
possibly, therefore, to spot prices. However, the materiality of the futures price rise would
depend on factors including:
the amount of new money entering the market and the time period over which it
was invested (i.e. $100m regularly flowing into crude futures every month would
likely have less of an impact on prices than $600m flowing into the market every
six months. This is because the financial flows would be “absorbed” by the market
over a longer time period).
the amount of unfilled but resting selling orders in an exchange order book above
the current market price that would otherwise have been left unfilled if financial
flows had not been present i.e. in deep and liquid markets, it may take significantly
more long-only funds to move the price to a given level compared to a market
where such liquidity did not exist; and
the timing and scale of a subsequent influx of selling interest from active investors
that may deem the higher futures price created by the long-only financial flows to
be „too high‟.
27
A possible theory of the stabilising role of speculation
Conversely, however, there are also ways in which the presence of financial investors could
stabilise markets, off-setting to a degree the previously discussed inherent features of oil
price volatility that are present even if financial speculators are absent.
In particular, if there are passive long-only investors who have already achieved their
desired allocation (i.e. have gone through the initial step of entering the market for the first
time) and who now follow a strategy of keeping a balanced or fixed proportion portfolio of
various asset classes, then these investors will now tend to be systematic sellers of the
market when prices rise and buyers when prices fall, playing a stabilising anti-momentum
role.
If there are thoughtful active investors who truly do analyse the fundamentals of supply and
demand carefully, and do so more effectively than the commercial participants (producers
and consumers), then their activity can help make the market more efficient by reflecting
changes in fundamental factors in the oil futures price. For example, it could be envisaged
that collectively such participants drive the price higher in anticipation of a future tightness
of supply and demand, potentially reducing the extreme volatility that could result from the
more sudden realisation of emerging supply and demand imbalances.
The existence of active traders – taking both long and short positions – can also help
increase the day-by-day liquidity of markets, increasing the ability of producers and
consumers to match future commercial needs in large quantity and at finer bid-offer
spreads. However, this day-by-day liquidity may well be neutral in its effect on the
medium-term (e.g. quarter-by-quarter) price trends which are most concerning, i.e.
providing greater liquidity day-by-day may neither help to moderate medium-term price
swings nor accentuate them.
Overall, therefore, we recognise that it is possible to construct theoretical arguments that
suggest financial investor involvement (passive or active) could play a role in driving
future and spot prices away from fundamental equilibria, but could also play a role in
offsetting divergences. The challenge, therefore, is to define empirical tests of its actual
impact.

28
How to decide if speculation is driving prices
Two categories of empirical evidence can be brought to bear to test whether „speculation‟
has played a role in driving oil prices above or below equilibrium values in particular
periods:
Circumstantial evidence – whether or not movements in prices can be reasonably
explained by fundamental non-financial factors or whether „it must have been
speculation‟ since no other explanation seems possible.
Direct evidence – drawing on data relating to net long positions of different
categories of market participants, the timing of new investment flows, spot/future
price differentials, and changes in inventories and production levels.
29
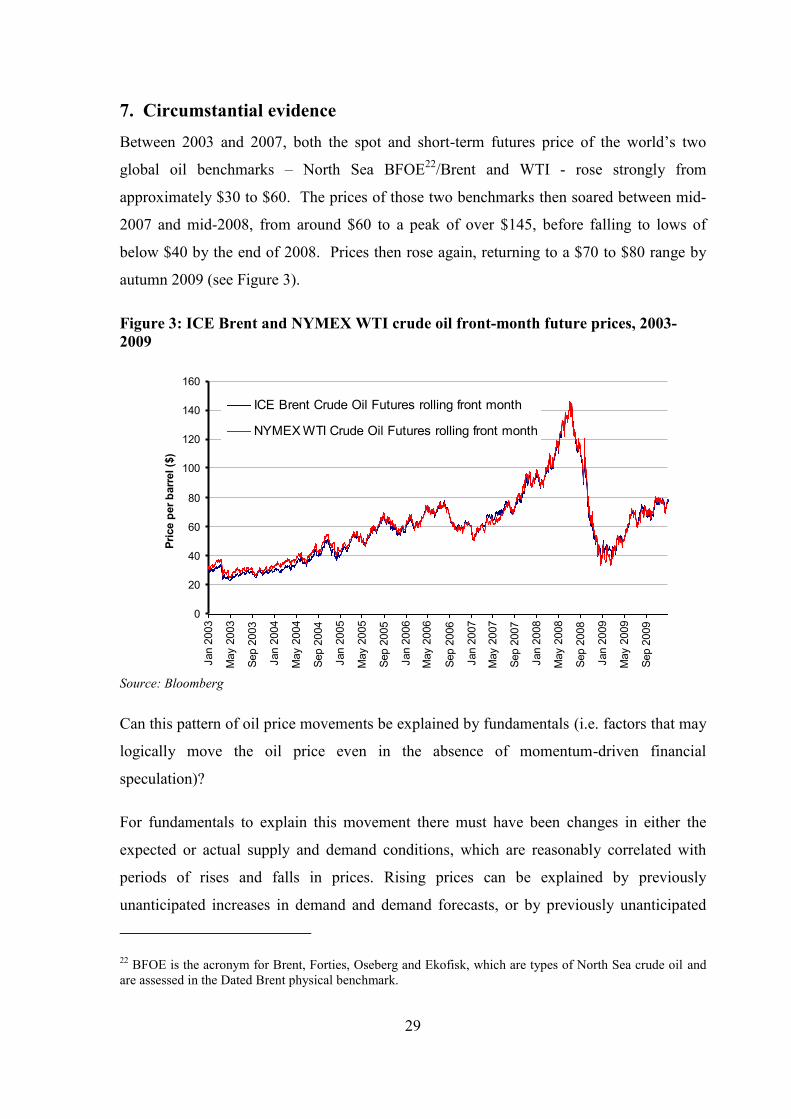
7. Circumstantial evidence
Between 2003 and 2007, both the spot and short-term futures price of the world‟s two
global oil benchmarks – North Sea BFOE22
/Brent and WTI - rose strongly from
approximately $30 to $60. The prices of those two benchmarks then soared between mid-
2007 and mid-2008, from around $60 to a peak of over $145, before falling to lows of
below $40 by the end of 2008. Prices then rose again, returning to a $70 to $80 range by
autumn 2009 (see Figure 3).
Figure 3: ICE Brent and NYMEX WTI crude oil front-month future prices, 2003-
2009
0
20
40
60
80
100
120
140
160
Jan 2
003
May 2
003
Sep 2
003
Jan 2
004
May 2
004
Sep 2
004
Jan 2
005
May 2
005
Sep 2
005
Jan 2
006
May 2
006
Sep 2
006
Jan 2
007
May 2
007
Sep 2
007
Jan 2
008
May 2
008
Sep 2
008
Jan 2
009
May 2
009
Sep 2
009
Pri
ce p
er
barr
el ($
)
ICE Brent Crude Oil Futures rolling front month
NYMEX WTI Crude Oil Futures rolling front month
Source: Bloomberg
Can this pattern of oil price movements be explained by fundamentals (i.e. factors that may
logically move the oil price even in the absence of momentum-driven financial
speculation)?
For fundamentals to explain this movement there must have been changes in either the
expected or actual supply and demand conditions, which are reasonably correlated with
periods of rises and falls in prices. Rising prices can be explained by previously
unanticipated increases in demand and demand forecasts, or by previously unanticipated
22 BFOE is the acronym for Brent, Forties, Oseberg and Ekofisk, which are types of North Sea crude oil and
are assessed in the Dated Brent physical benchmark.
30
tightness and changes to perceptions of tightness in supply; falling prices can be explained
by previously unanticipated decreases in demand and demand forecasts, or increased
availability, or perceived availability, of supply.
Analysis in the Bank of England‟s Quarterly Bulletin for Q3 2009 (Bank of England, 2009)
suggests that, between 2003 and 2007, the trend in demand tended to keep running ahead of
each 12-month, or similar range, forecast. Over these years, non-OPEC oil production
forecasts tended to get adjusted down. Combining these demand and supply factors, it is
apparent that composite measures of „oil market tightness‟ increased, in particular between
2005 and 2007. While it is impossible to work out whether the movements in price were of
the scale or the precise timing that can be fully explained by these demand and supply
changes, the Quarterly Bulletin argues that „the analysis suggests therefore that shifts to oil
demand growth, coupled with the surprisingly inelastic response of supply to higher prices,
are directionally in line with the increase in oil price over 2003 to 2007‟.
However, using this analytical approach, it appears more difficult to provide a fundamental
explanation of price movements during much of 2008. There was a strong acceleration of
the price increase in the first half of 2008 (with both Brent and WTI front month futures
prices reaching peak of over $145 in early July). Demand did continue to grow in the first
half of 2008 as emerging economies proved resilient in the face of the growing financial
crisis, but total demand growth was slightly below that anticipated towards the end of 2007.
On the supply side there does appear to have been some unanticipated tightness. However,
putting the supply and demand pictures together, there is no clear evidence that the oil
market was tighter than anticipated. Similarly, the fact that the oil price began its fall in
July (three months before growth forecasts began to be revised down) appears difficult to
explain using this analytical approach alone.
The continued and very rapid fall in prices after September 2008 is, however, clearly
understandable given:
the dramatic reductions in economic growth and oil demand, and in short-term
forecasts of growth and demand, which occurred from October 2008 onwards, as the
scale of the financial crisis became clear;

31
de-stocking by industrial and commercial consumers who were motivated to
maximise cash holdings given extreme uncertainties about future credit supply. This
further curtailed spot demand for crude oil; and
the lagged impact of the OPEC production cuts. Meaningful reductions in estimated
OPEC output were only noticeable from November 2008 when demand had already
been falling significantly for a number of months. By December 2008, when prices
were already reaching their lows, it is estimated that OPEC production had only
fallen to 29.6 million barrels, a level which is comparable to production throughout
much of 2007 (a period characterised by strong and growing demand, not the
scenario of weak demand witnessed in December 2008). OPEC production is
estimated to have only reached a nadir of 27.7 million barrels in March 2009 (see
Figure 4).
Figure 4: IEA estimates of OPEC production vs. the price of Brent and WTI crude oil
front month prices, 2006-2011
0
20
40
60
80
100
120
140
160
Jan 2
006
Apr
2006
Jul 2
006
Oct 2006
Jan 2
007
Apr
2007
Jul 2
007
Oct 2007
Jan 2
008
Apr
2008
Jul 2
008
Oct 2008
Jan 2
009
Apr
2009
Jul 2
009
Oct 2009
Jan 2
010
Apr
2010
Jul 2
010
Oct 2010
Jan 2
011
Pri
ce p
er
barr
el ($
)
20000
22000
24000
26000
28000
30000
32000
34000
36000
38000
40000
Th
ou
san
d b
arr
els
per
day
Brent front month price
WTI front month price
Estimated OPEC total production
Source: IEA, Bloomberg
Equally, the pattern of oil prices during 2009 appears reasonably linked to fundamental
developments. In early 2009 the fundamental picture was mixed; the severe drop in global
demand was weighing heavily on the spot and near-term futures oil price, but the expected
return to demand growth over the medium-term (coupled with possible tightness in supply)
was providing greater support for longer-dated oil prices. As Figure 5 shows, this resulted
in a deep contango market structure, with the front-month Brent futures price trading

32
within a $40-$50 range throughout January 2009 and the long-dated five-year forward
price stabilising between a $65-$75 price range.
Figure 5: Brent crude oil front-month vs. five-year futures price, 2006-2010
0
20
40
60
80
100
120
140
160
Feb 2
006
Jun 2
006
Oct 2006
Feb 2
007
Jun 2
007
Oct 2007
Feb 2
008
Jun 2
008
Oct 2008
Feb 2
009
Jun 2
009
Oct 2009
Feb 2
010
Jun 2
010
Oct 2010
Pri
ce p
er
barr
el ($
)
Front month rolling Brent price
5 year rolling Brent price
Source: Bloomberg
The front-month Brent futures price subsequently remained depressed for a number of
months, though it did eventually rise above $60 in early June 2009. Front-month prices
then remained locked in a $60-$80 price range throughout the remainder of 2009 and up to
April 2010. This range-bound price probably persisted for so long because of the fragile
state of the global economic recovery. Prices remained in contango throughout this period
but from late October 2010 front-month prices notably broke above $80 and have gradually
continued to rise towards and above $100 since, converging with the five-year price in the
process.
This pattern appears to make sense, given:
the depression of global growth and oil demand in spring 2009;
the expectation – reflected in the long-dated forward – that recovery would occur
over the medium term; and
the fact that global recovery in 2009 and 2010 then proceeded faster than was
forecast in early 2009 with, for instance, International Monetary Fund (IMF) World

33
Economic Outlook forecast of global growth in 2010 being raised from 1.9% (in its
April 2009 report) to 4.8% (in the October 2010 report).
Overall, therefore, the influence of fundamentals can be seen in most phases of oil price
movement between 2003 and 2010, but with an apparent anomaly in the first half of 2008.
It is not possible analytically to identify if fundamentals fully explain the precise size of
each price trend movement, but at least in terms of directions most of them appear to make
some fundamental sense.
It is also, however, important when we analyse „fundamentals‟ to consider three other
factors:
the difference between the oil price in dollars and in other currencies;
the logical responses to OPEC communication of intentions as well as to the actual
reality of supply and demand; and
supply and demand developments within oil products markets as well as in oil crude
markets.
Oil prices in dollars and other currencies
Oil prices are conventionally quoted in US dollars and most crude oil supply contracts are
denominated in US dollars. However, the underlying demand for crude oil and its refined
products arises in economies throughout the world, with relative price and income elasticity
effects therefore influenced to a degree by the local currency price as much as by the dollar
price. Part of the apparent volatility of the oil price therefore simply reflects movements in
the US dollar versus other currencies. Measured in Euros, for instance, the oil price
increase from 2002 to 2007, and the sharp peak in 2008, looks less dramatic than when
measured in US dollars as Figure 6 below demonstrates.
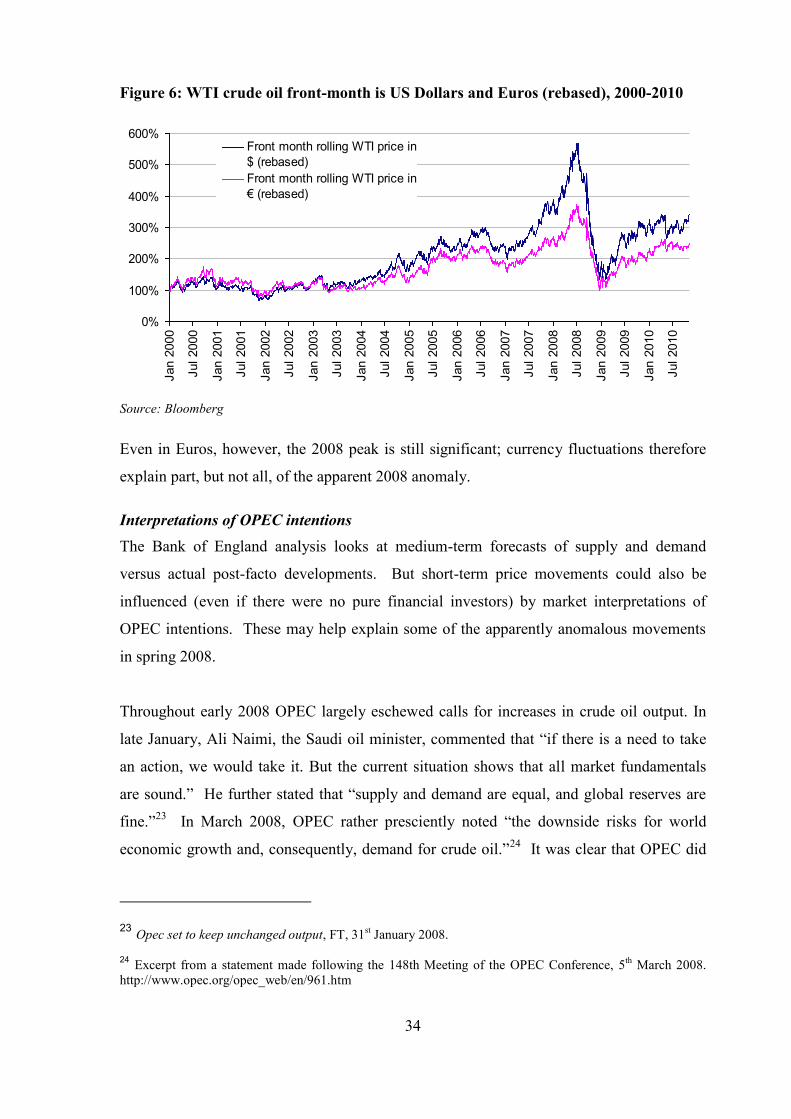
34
Figure 6: WTI crude oil front-month is US Dollars and Euros (rebased), 2000-2010
0%
100%
200%
300%
400%
500%
600%
Jan 2
000
Jul 2000
Jan 2
001
Jul 2001
Jan 2
002
Jul 2002
Jan 2
003
Jul 2003
Jan 2
004
Jul 2004
Jan 2
005
Jul 2005
Jan 2
006
Jul 2006
Jan 2
007
Jul 2007
Jan 2
008
Jul 2008
Jan 2
009
Jul 2009
Jan 2
010
Jul 2010
Front month rolling WTI price in
$ (rebased)
Front month rolling WTI price in
€ (rebased)
Source: Bloomberg
Even in Euros, however, the 2008 peak is still significant; currency fluctuations therefore
explain part, but not all, of the apparent 2008 anomaly.
Interpretations of OPEC intentions
The Bank of England analysis looks at medium-term forecasts of supply and demand
versus actual post-facto developments. But short-term price movements could also be
influenced (even if there were no pure financial investors) by market interpretations of
OPEC intentions. These may help explain some of the apparently anomalous movements
in spring 2008.
Throughout early 2008 OPEC largely eschewed calls for increases in crude oil output. In
late January, Ali Naimi, the Saudi oil minister, commented that “if there is a need to take
an action, we would take it. But the current situation shows that all market fundamentals
are sound.” He further stated that “supply and demand are equal, and global reserves are
fine.”23
In March 2008, OPEC rather presciently noted “the downside risks for world
economic growth and, consequently, demand for crude oil.”24
It was clear that OPEC did
23 Opec set to keep unchanged output, FT, 31st January 2008.
24 Excerpt from a statement made following the 148th Meeting of the OPEC Conference, 5
th March 2008.
http://www.opec.org/opec_web/en/961.htm
35
not at this stage believe any increase in output was necessary, further noting that “the
market is well-supplied, with current commercial oil stocks standing above their five-year
average.”25
This view, however, was clearly not shared by the market as prices continued
to rise.
In early May front-month Brent and WTI crude oil futures prices rose above $120. At this
point Saudi Arabia did act, announcing an increase in production of 300,000 barrels per
day on 10th
May following continued pressure from the US to do so.26
Prices, however,
remained volatile and increased further after the announcement. Further OPEC output
increases announced at the Jeddah Conference on 22nd
June 2008 also failed to stem the
price rise. Fears were being expressed by some commentators that militant attacks on
supplies in the Niger Delta would wipe out the 200,000 b/d supply increase from Saudi
Arabia it had announced would take effect from July.27
Rising tensions between Israel and
Iran were also stoking market nervousness. By July, however, prices began to fall. The
timing of these price developments may reflect a delayed acceptance by the market that the
previously announced OPEC supply increases would actually occur and would be sufficient
to offset other factors.
The move towards significant reversals of the increases in Saudi output were not evident
until OPEC met in Vienna on 24th
October 2008, when it announced that members had
agreed “to decrease the current OPEC-11 production ceiling of 28.808 million barrels a day
by 1.5 mb/d, effective 1 November 2008.”28
The OPEC meeting occurred over a month
after Lehman Brothers had filed for bankruptcy, and thus after market participants had
already begun to anticipate an economic slowdown.
Lags in the market response to stated changes in OPEC intentions therefore complicate any
analytical distinction between „fundamentals‟ and „speculative‟ influences. They do not
25 Ibid
26 Some commentators believe the Saudi increase was prompted by the imminent visit of the then US
president George W. Bush to Saudi Arabia, who met King Abdullah on 16 May 2008.
27 “Saudi oil output increase set to be wiped out by Nigeria crisis”, FT, 23
rd June 2008.
28 Excerpt from a statement made following the 150th (Extraordinary) Meeting of the OPEC Conference, 24
th
October 2008. http://www.opec.org/opec_web/en/947.htm

36
provide a full explanation of the 2008 price surge, but they may help explain why it went
quite so high and why it was not reversed earlier.
Crude oil prices and oil product prices
It is important to understand that the impact of oil prices on the economy is determined not
just by the crude oil price, but by complexities in the oil products market. A particularly
notable factor is the refining capacity available for specific products. It is apparent from
the data over 2003 to 2008 that demand for transport fuel (in particular low-sulphur diesel)
was increasing rapidly but relevant refinery capacity was unable to keep pace. Although
refiners were increasing refinery runs of crude oil in an attempt to increase output of low-
sulphur diesel, it appears they were unable to fully meet this rise in demand. As a
consequence of these higher refinery runs, however, refineries were at the same time also
producing additional supplies of other distillate products in excess of current demand. As a
result, at the crude oil price peak of early 2008, diesel prices rose to a peak of over a $50
premium to crude oil, and the prices of other products traded at large discounts to crude oil,
as Figures 7 and 8 demonstrate.
Figure 7: Argus Diesel NWE29
10ppm30
differential to Argus North Sea Dated Crude
Oil ($/bl), 2001-2010
0
10
20
30
40
50
60
Ja
n 2
00
1
Ja
n 2
00
2
Ja
n 2
00
3
Ja
n 2
00
4
Ja
n 2
00
5
Ja
n 2
00
6
Ja
n 2
00
7
Ja
n 2
00
8
Ja
n 2
00
9
Ja
n 2
01
0
Pri
ce
pe
r b
arr
el ($
)
Argus Diesel NWE 10ppm differential
to Argus North Sea Dated
Source: Argus Media
29 North-west Europe
30 Parts per million

37
Figure 8: Argus Fuel oil NWE 3.5% differential to Argus North Sea Dated Crude Oil
($/bl), 2001-2010
-50
-45
-40
-35
-30
-25
-20
-15
-10
-5
0Jan 2
001
Jan 2
002
Jan 2
003
Jan 2
004
Jan 2
005
Jan 2
006
Jan 2
007
Jan 2
008
Jan 2
009
Jan 2
010
Jan 2
011
Pri
ce p
er
barr
el ($
)
Argus Fuel oil NWE 3.5% differential
to Argus North Sea Dated
Source: Argus Media
From the point of view of transport fuel users, the oil price peak of early 2008 was
therefore even more dramatic than the trend in crude oil prices would suggest.
Circumstantial evidence - conclusion
Taking all the evidence into account, the reasonable conclusion is that across most of 2003
to 2010, price movements were directionally explicable by changes in fundamentals, even
if it is impossible analytically to determine whether those movements were precisely
appropriate in fundamental terms, or to some degree also influenced by financial
investment flows.
The one exception to this is early 2008, where it is difficult to discern any flow of
previously unanticipated information relevant to the supply/demand balance, which should
logically have produced such a large price surge. However, as we discuss later, it is also
difficult to identify patterns of financial investment position-taking or of new financial
flows that can alternatively explain this phenomenon.
So what did occur? One thing which is clear is that, throughout autumn 2007 and early
2008, there was much talk of future possible price increases, with discussion of „peak oil‟
limits on oil supply, declining spare global production capacity of crude oil and forecasts of
sustained future increases in demand. In fact, some leading analysts did predict that prices

38
would go above $100 per barrel well ahead of that development. The price surge in spot
and short-term futures prices therefore occurred against the background of wide spread
expectations that „medium-term fundamentals‟ (i.e. over a one to five-year period) would
remain tight for some time, and as a result should be driving prices substantially higher.
These expectations do seem to have played a role in driving actual price increases. But the
exact transmission mechanisms by which these „future fundamentals‟ were able to change
spot market prices without evidence of effects on inventory or production, which the
Working/Hotelling theories suggest should be evident, remains unclear and worthy of
further analysis.31
However, even if expectations were able to drive prices in a way which was not driven by
fundamentals, the absence of clear evidence of increased financial investment in this period
suggests that these expectations worked through their influence on the behaviour and
position-taking of commercial participants (physical oil producers, suppliers and
consumers), as much as (and indeed perhaps more than) through the behaviour of pure
financial investors.
31
The limitations to the Working model we outlined earlier seem pertinent, notably the influence of the
supply and demand factors in the products market and the degree to which markets were largely in
backwardation during the run up to oil price peaks in 2008. Additionally, factors that impact the spot and the
futures price simultaneously also seem relevant, such as the available capacity (i.e. spare global supply) that
links “above ground” inventories to “in the ground” inventories. A reduction in spare global production
capacity is usually interpreted by the market as a bullish signal for higher oil prices because as the cushion of
spare global capacity is reduced, the risk of an unplanned outage in the current oil production chain leading to
a crystallised supply disruption increases. Critically, it is possible to envisage these factors affecting both the
spot and futures prices simultaneously and without observing all of the Working/Hotelling effects previously
described.

39
8. Direct evidence
Whether financial speculation was driving prices in any time period can be more directly
assessed by considering:
whether periods of price increases correlate with periods in which financial
investors held or increased net long positions in exchange-traded markets;
whether periods over which prices increased correlate with periods in which
significant new flows of passive long-only financial investments were committed to
the market;
whether movements in the futures price tend to lead the spot increase (e.g. if it is
evident an increase in futures market price contango preceded an increase in the
spot price); and
whether rising futures and then spot prices are accompanied by the rises in
inventory holdings or reductions in production, which the Working (storable
resource) and Hotelling (exhaustible resource) relationships suggest.
Movements in the net long positions of financial investors
The U.S. Commodity Futures Trading Commission (CFTC) has for many years gathered
data on the positions held by „commercial‟ and „non-commercial‟ investors across a
number of futures markets, including the energy contracts trading on NYMEX. The
„commercial‟ category has historically included positions held by investment banks and
swap dealers which could comprise some or all of the following:
dealing on behalf of, or holding matching positions against, underlying commercial
trades;
dealing on behalf of, or holding matching positions against, underlying financial
investors; or
proprietary positions.
Therefore the historic split between commercial and non-commercial positions only
imperfectly and uncertainly relates to a true division between commercial and financial
investors. This is to some extent understandable given the difficulty in categorically
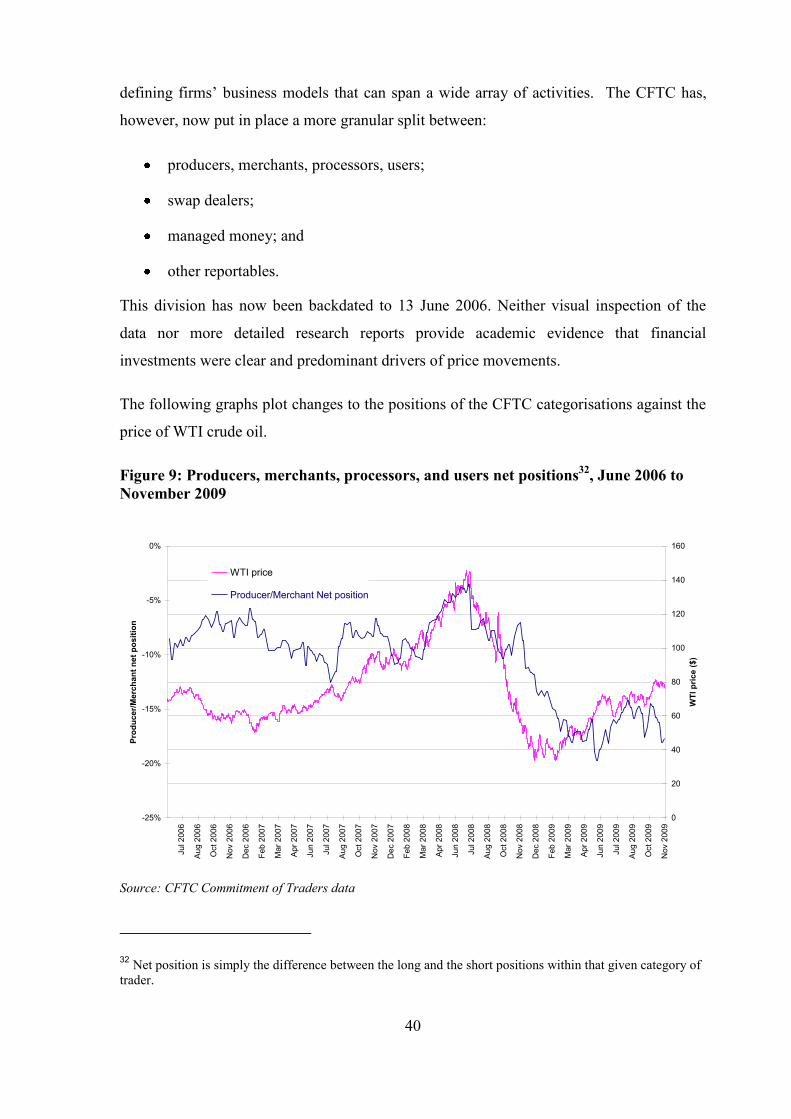
40
defining firms‟ business models that can span a wide array of activities. The CFTC has,
however, now put in place a more granular split between:
producers, merchants, processors, users;
swap dealers;
managed money; and
other reportables.
This division has now been backdated to 13 June 2006. Neither visual inspection of the
data nor more detailed research reports provide academic evidence that financial
investments were clear and predominant drivers of price movements.
The following graphs plot changes to the positions of the CFTC categorisations against the
price of WTI crude oil.
Figure 9: Producers, merchants, processors, and users net positions32
, June 2006 to
November 2009
0
20
40
60
80
100
120
140
160
No
v 2
00
9
Oct
20
09
Au
g 2
00
9
Ju
l 2
00
9
Ju
n 2
00
9
Ap
r 2
009
Mar
200
9
Fe
b 2
00
9
De
c 2
00
8
No
v 2
00
8
Oct
20
08
Au
g 2
00
8
Ju
l 2
00
8
Ju
n 2
00
8
Ap
r 2
008
Mar
200
8
Fe
b 2
00
8
De
c 2
00
7
No
v 2
00
7
Oct
20
07
Au
g 2
00
7
Ju
l 2
00
7
Ju
n 2
00
7
Ap
r 2
007
Mar
200
7
Fe
b 2
00
7
De
c 2
00
6
No
v 2
00
6
Oct
20
06
Au
g 2
00
6
Ju
l 2
00
6
WT
I p
rice
($
)
-25%
-20%
-15%
-10%
-5%
0%
Pro
du
cer/
Merc
ha
nt
ne
t p
os
itio
n
WTI price
Producer/Merchant Net position
Source: CFTC Commitment of Traders data
32 Net position is simply the difference between the long and the short positions within that given category of
trader.

41
Figure 10: Swap dealers’ net positions, June 2006 to November 2009
0
20
40
60
80
100
120
140
160
No
v 2
00
9
Oct
20
09
Au
g 2
00
9
Ju
l 2
00
9
Ju
n 2
00
9
Ap
r 2
009
Mar
200
9
Fe
b 2
00
9
De
c 2
00
8
No
v 2
00
8
Oct
20
08
Au
g 2
00
8
Ju
l 2
00
8
Ju
n 2
00
8
Ap
r 2
008
Mar
200
8
Fe
b 2
00
8
De
c 2
00
7
No
v 2
00
7
Oct
20
07
Au
g 2
00
7
Ju
l 2
00
7
Ju
n 2
00
7
Ap
r 2
007
Mar
200
7
Fe
b 2
00
7
De
c 2
00
6
No
v 2
00
6
Oct
20
06
Au
g 2
00
6
Ju
l 2
00
6
WT
I p
rice
($
)
0%
2%
4%
6%
8%
10%
12%
14%
16%
18%
20%
Sw
ap
de
ale
rs n
et
po
sit
ion
s
WTI price ($)
Swap dealers net positions(%)
Source: CFTC Commitment of Traders data
Figure 11: Managed money long-only positions, June 2006 to November 2009
0
20
40
60
80
100
120
140
160
No
v 2
00
9
Oct
20
09
Au
g 2
00
9
Ju
l 2
00
9
Ju
n 2
00
9
Ap
r 2
00
9
Ma
r 2
00
9
Fe
b 2
00
9
De
c 2
00
8
No
v 2
00
8
Oct
20
08
Au
g 2
00
8
Ju
l 2
00
8
Ju
n 2
00
8
Ap
r 2
00
8
Ma
r 2
00
8
Fe
b 2
00
8
De
c 2
00
7
No
v 2
00
7
Oct
20
07
Au
g 2
00
7
Ju
l 2
00
7
Ju
n 2
00
7
Ap
r 2
00
7
Ma
r 2
00
7
Fe
b 2
00
7
De
c 2
00
6
No
v 2
00
6
Oct
20
06
Au
g 2
00
6
Ju
l 2
00
6
WT
I p
rice
($
)
0%
2%
4%
6%
8%
10%
12%
14%
16%
18%
Ma
na
ge
d m
on
ey lo
ng
-on
ly p
ositio
n
WTI price ($)
Managed money long-only positions
Source: CFTC Commitment of Traders data

42
Figure 12: Managed money net positions, June 2006 to November 2009
0
20
40
60
80
100
120
140
160
No
v 2
00
9
Oct
20
09
Au
g 2
00
9
Ju
l 2
00
9
Ju
n 2
00
9
Ap
r 2
009
Mar
200
9
Fe
b 2
00
9
De
c 2
00
8
No
v 2
00
8
Oct
20
08
Au
g 2
00
8
Ju
l 2
00
8
Ju
n 2
00
8
Ap
r 2
008
Mar
200
8
Fe
b 2
00
8
De
c 2
00
7
No
v 2
00
7
Oct
20
07
Au
g 2
00
7
Ju
l 2
00
7
Ju
n 2
00
7
Ap
r 2
007
Mar
200
7
Fe
b 2
00
7
De
c 2
00
6
No
v 2
00
6
Oct
20
06
Au
g 2
00
6
Ju
l 2
00
6
WT
I p
rice
($
)
-15%
-10%
-5%
0%
5%
10%
15%
20%M
an
ag
ed
mo
ne
y n
et
po
sit
ion
s
WTI price ($)
Managed money net positions (%)
Source: CFTC Commitment of Traders data
Figure 13: Oil prices and combined managed money and swap dealers net position,
futures plus options, June 2006 to October 2009
0
20
40
60
80
100
120
140
160
Jun 2
006
Aug 2
006
Oct 2006
Dec 2
006
Feb 2
007
Apr
2007
Jun 2
007
Aug 2
007
Oct 2007
Dec 2
007
Feb 2
008
Apr
2008
Jun 2
008
Aug 2
008
Oct 2008
Dec 2
008
Feb 2
009
Apr
2009
Jun 2
009
Aug 2
009
Oct 2009
Dec 2
009
Feb 2
010
Apr
2010
Jun 2
010
Aug 2
010
Oct 2010
Pri
ce p
er
barr
el
($)
0
50000
100000
150000
200000
250000
To
tal
net
po
sit
ion
s
WTI price ($)
Total net positions
Source: J.P. Morgan, Bloomberg, CFTC
Figures 9 to 13 show price movements alongside changes in different categories of
position. A prima facie visual inspection of these figures suggests that there is not a clear

43
and continuous correlation between prices and managed money positions (both long-only
and net). There are periods where prices and managed money positions seem to be
somewhat correlated, but equally periods when positions and prices move in opposite
directions.
There are also no obvious correlations between prices and swap dealers‟ positions (both
long-only and net). If anything, from July 2008 onwards, net swap dealer positions seem
negatively correlated with price. The magnitude of either managed money or swap dealers‟
position changes do not seem to bear any obvious correlation to the magnitude of price
movements on a consistent basis.
Figure 13 shows that the combined managed money and swaps dealers‟ net positions were
falling as oil prices rose from $100 to their peak. Furthermore, from November 2008,
combined managed money and swaps dealers‟ net positions rose sharply as prices
continued to decline and then remain depressed for some time. In these two time periods,
therefore, this suggests behaviour more consistent with a „stabilising countercyclical‟ effect
than with a „momentum reinforcing‟ effect;
Even where there appears to be correlation, the crucial issue is the direction of causality.
One possible interpretation of those periods where net long positions appear to move
alongside price movements could be that both are responding to fundamentals. For
example, a JP Morgan research report, which uses econometric analysis of weekly CFTC
COT data between June 2006 and October 2009 to understand whether commodity
derivatives activity has become an independent and material driver of commodity
(particularly oil) prices, concludes that:
‘Prices and positions move together largely because both react at the same time to
fundamental information on the supply and demand balance for commodities… when
signals emerge that demand for commodities is growing faster than supply and inventories
are thus set to tighten, prices rise while funds and banks raise their long positions in
futures at the same time’.33
33 J.P. Morgan Global Commodities Research (2009), „Commodity prices and futures positions’.
44
In an attempt to resolve the issue of the direction of causality, a number of research studies
have used „Granger tests‟. The data available for these statistical analyses is imperfect,
making definitive conclusions impossible, but the key studies so far conducted have not
found strong evidence that „speculative trading‟ (i.e. pure financial investment) has been a
major driver of oil price trends.
Harris and Buyuksahin (2009) analyse trading activity in the Crude Oil Futures Market for
two periods: July 2000 to June 2004, and July 2004 to March 2009. They disaggregate
trading activity into different trader categories. For both periods they find little evidence
that speculative activity and trading by swap dealers (taken as an imperfect proxy for
passive index funds) cause oil price changes. Their results instead suggest that oil price
changes precede position changes by these investors.
Brunetti and Buyuksahin (2009) conduct a similar analysis for a time period from January
2005 to March 2009 and come to similar conclusions. They also analyse natural gas, corn
and equity futures markets. They reach the general conclusion that, with the exception of
equity futures, that price changes precede position changes of speculative investors and
swap dealers. The result for equity markets is not surprising since these markets are
inherently populated by investors who could be defined as „speculative‟, as there is no
„physical market‟ distinct from the financial instrument traded.
Both studies find that oil price movements are likely to precede position movements by
financial investors (i.e. Granger causality exists in that direction). Conversely, they do not
find that position movements precede oil price movements (i.e. no Granger causality was
found in this direction).
This analysis therefore tends to suggest that speculative-driven trading does not have a
proven and major influence on price trends in commodity markets over the time periods we
are most concerned about.
Changes of net investment flows into the commodity funds
Information on investment flows into oil markets is imperfect, particularly in over-the-
counter (OTC) markets. However, estimated figures we obtained from Barclays Capital
(see Figure 1) seem to suggest that there were significant flows of new investment money
45
into commodity index funds over the 2005/6 period.34
This new money may have been
attracted by the fact that a price rise driven by fundamentals was already occurring. But at
least to some degree and for some time period, this entry of new money could logically
have given some further momentum to that price rise. Conversely, however, money moved
out of commodity index funds investment in 2007/8, and then returned into commodities in
2009, a pattern more consistent with the „countercyclical stabilising‟ investment story than
the „momentum reinforcing‟ story.35
Equally, the patterns of inflows into on-exchange oil ETPs do not offer any obvious signs
of strong correlation in the run up to price peak in mid-2008 (see Figure 2). In fact,
between December 2009 and June 2010 the inflows into on-exchange ETPs again seem to
be more consistent with the „countercyclical stabilising‟ effect.
Spot/futures differential
In early 2005 the near-term futures prices of Brent and WTI began to move above the spot
price in a contango relationship, which grew gradually and, for the most part, persisted
quite consistently until mid-2007. This is mild evidence for, or at least consistent with, the
spot price being pulled up by a future price, perhaps itself being driven in part by financial
investment. However from summer 2007 to May 2008 (the period of most rapid oil price
growth) the spot price was above the future price (backwardation) which, if anything,
would tend to make it less likely that futures speculation was driving the spot price. The
degree of inference that should be attached to the spot/futures relationship is unclear, but at
very least this relationship provides no evidence positively to suggest a major role for
speculation in the 2007 to 2008 price surge.
34 We note that the data presented in Figure 1 represents estimated inflows into commodity index funds as a
whole, rather than just the oil component. However, oil is known to be the largest component in many
indices, and the data can therefore be taken to be an indicative guide of oil-related index fund activity (at least
directionally if not necessarily in scale). .
35 The information that supports this assessment of commodity indices is incomplete and, because a large part
of this activity is OTC, is not fully transparent. Improving the quality of data on net new investment flows is
therefore a priority to better understand market price dynamics.
46
Changes in inventories and in production
Given the Working and Hotelling relationships, any increase in futures prices driven by
financial investors can only drive an increase in spot prices if inventories are increased or if
production is reduced in response.
As the Bank of England Quarterly Bulletin (Bank of England, 2009) concludes:
‘OECD inventories did not increase substantially between late 2006 and the mid-2008
period, and data provided by the Joint Oil Data Initiative suggests that total inventories in
30 countries for which data are available fell by about 7% over this period.’
It also states:
‘OPEC spare capacity reached a trough in the first half of 2008 making it unlikely that
they were building up inventories under the ground’.
However, this is not conclusive evidence against a speculative effect on inventories,
because we cannot isolate other factors at work. For example, if physical oil market
operators in early 2008 believed that the demand increases of the previous year would not
last, then the trend in inventories, absent any financial speculation, might have been a
reduction (i.e. one would assume that physical producers, in this instance, would look to
run down inventories in anticipation of a downturn in demand). However, this natural
inclination to reduce inventories might then have been offset by Working/Hotelling type
increases induced by financial investment in futures contracts, leaving inventory levels
more static than they otherwise would have been. Without knowing the counter-factual, it
is not possible to exclude the possibility of a financial-investment-induced effect on prices,
inventories and production.
There is, though, certainly no clear evidence of inventories or production adjustments that
would strongly prove the influence of rising futures prices on the spot price.
A possible reasonable judgement on the causes of oil price movements
The evidence considered does not allow a definite conclusion on whether or to what extent
financial speculation influences oil price trends. We suggest, though, that the available
circumstantial and direct evidence could suggest the following judgements:

47
There were strong fundamental forces driving a rising oil price from 2003 to 2008,
and a major part of the rise up to the beginning of 2008 can therefore be justified on
fundamental grounds. The broad upswing in price up to 2008 clearly, however,
made the oil futures market an attractive investment option, resulting in significant
financial investment. Theory tells us that the unanticipated entrance of a new group
of investors must, in the phase in which they built up their desired positions, have
tended to increase the price. Theory would further suggest that a self-reinforcing
effect might then have come into play, with some active players investing on a
momentum strategy basis. Speculative investment flows could, therefore, have
played some role in the precise timing and scale of the 2003 to 2008 general
upswing in oil prices.
In the first half of 2008, there was an extreme upswing in oil prices, which,
certainly in scale, is difficult to fully explain on the basis of fundamentals.
However the same price rise cannot be explained by direct evidence of the effects
of financial speculative investment either. Indeed there is some evidence that pure
financial investment flows actually decreased in this period. One possible
explanation is that the January to June 2008 price upswing was driven by strong
expectations of future developments in oil supply and demand, with the behaviour
of purely commercial participants (physical oil producers, suppliers and consumers)
just as important, and indeed probably more important, than that of pure financial
investors. There are however inherent difficulties in assessing participants‟
historical forward-looking expectations, and the financial data of investment flows
are incomplete, leaving a still imperfectly understood period.
From around September 2008 to the period of range-bound oil price stability from
June 2009 onwards, movements in oil prices are, at least directionally,
understandable in terms of fundamental developments in oil supply and demand.
The role of „speculation‟ in accentuating trends cannot be excluded, but major
fluctuation following the broad pattern discovered would have occurred even if pure
financial investment were absent.
Overall, the key conclusion is that oil market supply and demand is characterised by a
number of structural features, which are likely to make it susceptible to large to medium-
48
term price movements even in the absence of pure financial investors. These structural
features could also mean that pure financial investment may – at least to some degree and
for short periods – accentuate the price trends, though it is also possible in other instances
for such investment to moderate price movements. The available evidence illustrates that
oil price movements between 2004 and 2009 are largely explicable in fundamental terms,
though, with some uncertainty remaining about price rises in the first half of 2008; and it
suggests that fundamental factors are likely to be more important drivers of price than
speculative. It does not, however, enable us to reach a definitive and quantified conclusion
on the extent and duration of any additional price volatility introduced by the presence of
pure financial investors.

49
9. Possible policy responses
Financial market regulation: defining relevant objectives
It is important in the debate about possible future regulation of the financial oil markets to
distinguish between three different possible concerns and objectives:
I. Liquidity
A liquid market is one in which there are many active buyers and sellers willing to transact
at prices agreed today, both in the spot market and with reference to a wide variety of
multiple delivery dates in the future, enabling end-users of the market (producers or oil-
purchasing companies) to hedge their risks on a flexible basis and in a timely manner.
Liquidity can be measured in a number of ways via, for instance, total value of contracts
traded, via the availability of bids and offers, or via the bid-offer spreads at which it is
possible to transact at any given quantity.36
A reasonable level of liquidity is in principle a desirable objective, but it does not follow
that „more liquidity is always limitlessly beneficial‟ since beyond some point there must be
diminishing marginal returns to additional liquidity. It is also possible that more liquidity,
while in some ways benefiting end-users, could also, by facilitating pure speculation,
produce more variable medium-term price trends (though whether it actually does so of
course depends on whether financial speculation accentuates or stabilises price trends
driven by fundamentals). It is therefore theoretically possible for increased liquidity
simultaneously to reduce short-term (e.g. intra-day or day-by-day) volatility and to increase
medium-term (quarter-by-quarter) price trend variability (although some commentators
suggest commodity markets have not yet reached this point).37
36 We also recognise that consideration of timeframes is important when defining liquidity. It is often the
case, for example, that markets are more liquid at certain times of the day, or certain months of the year, than
others. It is also relevant to consider the market depth (i.e. the number of available bids and offers) and the
size of the transactions being executed. It might be possible, for example, to execute small orders very easily
in a liquid market over a very short timeframe (e.g. in seconds, or milliseconds), but in the same market larger
orders may remain unfilled for longer periods because a lack of market depth.
37 Brunetti, C., and Buyuksahin, B. (2009), „Is Speculation Destabilizing?‟.

50
II. Market abuse
It is clearly desirable to have an effective regulatory regime to combat market abuse.
Legislative and regulatory frameworks should be designed to ensure that markets are fair
and orderly, that investors are afforded suitable protections, and that market abuse by
market participants is prevented as far as possible and, where it occurs, is detected and
dealt with appropriately. Confidence that markets are clean, fair and orderly should in
itself help promote liquidity.
III. Medium-term cyclicality
It might also be desirable from a public policy point of view to seek to limit potentially
destabilising medium-term (e.g. quarter-by-quarter) movements in prices if it is clear these
are not justified by fundamentals but are instead accentuated by either financial speculation
or the self-fulfilling expectations of commercial participants (i.e. producer and consumer)
in the market.
When taken together these three sets of objectives could, in theory, be in conflict. For
example, while the increased involvement of pure financial participants („speculators‟) may
deliver increased liquidity that delivers some benefits to end-users, both directly and by
making certain abusive strategies more difficult, it could in theory produce simultaneous
increased variability in medium-term price trends.
Distinguishing between orderly market concerns and ‘speculation’
It is important to understand that financial market regulation in the UK, and in the vast
majority of other key jurisdictions, has in the past focused exclusively on the first two
objectives. It has aimed to prevent abusive behaviour and to create an environment in
which markets are orderly and reasonable liquidity can be achieved. However the UK
financial regulator has not pursued any specific objectives in relation to the scale of
speculative activity and the medium-term price trends.
There has been much debate about whether „excessive speculation‟ should be, and indeed
even can be, controlled. However this term is not consistently defined and its broader
application can appear unclear. We suggest it is possible to sub-divide the perceived impact
of „excessive speculation‟ into „discrete‟ and „collective‟ forms. Discrete forms of
excessive speculation refer to excessively large positions held by a single financial

51
participant („speculator‟). This is relevant to either short-term price movements (intra-day
or day-by-day) or general market orderliness. Collective forms of excessive speculation
refer to excessively large amounts of speculative capital invested in the market as a whole.
This is relevant to concerns about possible impacts on medium-term price movements
(quarter-by-quarter).
The often heralded solution to this supposed „excessive speculation‟ problem is to limit the
proportion of a specific contract any one investor can hold through the use of position
limits. We recognise that position limits, and other position management techniques, can be
effective in preventing some forms of market abuse and ensuring markets remain orderly.
These regulatory tools should apply to both commercial and financial participants and are
relevant to discrete forms of excessive speculation.
However we do not believe that position management techniques (including position
limits) are relevant to the collective form of excessive speculation. For example, these
regulatory tools cannot be effective in preventing any possible adverse impact arising from
the aggregate scale of pure financial investment. If there is an adverse effect arising from
the entry into the market of a class of pure financial investors, which is as yet unproven,
limiting the percentage of any one contract that can be held by any one investor would not
be an effective response. This is because multiple investors each holding positions below
the percentage limit could, conceivably, still have a large aggregate effect. Indeed, we see
no evidence that these tools, where they have been used, have had a systematic impact on
medium-term price trends.
Nor would it make sense to calibrate a regulatory regime which seeks to limit the
participation of one class of investor given that, as we noted earlier, medium-term market
expectations affect prices through the position taking of both commercial and financial
participants.
There is, therefore, a disconnect in the discussion of objectives and policy tools. Position
management techniques (including position limits) on specific contracts are clearly relevant
as tools for addressing issues of market abuse, ensuring the short-term orderliness of
markets and limiting discrete forms of speculation relating to individual participants in
individual contracts. However they are largely irrelevant to the issues of collective
speculation and overall medium-term price trends. If medium-term price trends do diverge

52
from “rational fundamental” equilibrium, then different policy tools would be required to
attempt to address this.
If ‘speculation’ is a problem, is it more prominent in UK financial oil markets?
When considering this question, it would be irrelevant if the volatility of prices in UK
financial oil markets was broadly similar to comparative markets elsewhere: this follows
simply from arbitrage conditions. It could be possible, for example, for there to be more
„pure speculative‟ activity in the UK-based market, and for this to drive volatility both in
the UK and associated markets in other jurisdictions.
Instead, it is important to consider whether the level of activity by speculative investors in
oil markets is greater in the UK when compared to other similar and well established
markets. The most obvious point of comparison for UK financial oil markets is the US. Our
analysis leads us to conclude that if „speculation‟ is a problem in established financial oil
markets it is no more prevalent, and probably less prevalent, in the UK. The best public
data to support this conclusion is the exchange-traded WTI futures contract, which has
significant pools of liquidity in both the UK and the US. Analysis of CFTC Commitment of
Traders data shows that in the UK-based ICE Futures Europe WTI futures contract, the
participation of identifiable financial investors is proportionally less important than in the
US-based NYMEX WTI futures contract (although, as noted before, we recognise there are
limitations to this data set).
There are also no obvious reasons related to different regulatory frameworks which lead us
to expect „speculation‟ to be more prevalent in UK financial oil markets. Although the US
regime does have a formal mandate which requires it to curb „excessive speculation‟,
which the UK does not, the measures CFTC has taken to date are tailored to general market
orderliness and tackling market abuse issues – important but distinct objectives.
Both the US and UK regulatory regimes for financial oil markets are, therefore, in practice
calibrated to ensuring orderly markets and combating market abuse. For the purposes of
managing large positions the CFTC uses quantified specific contract position limits; the
FSA applies a regime that requires all UK-based derivatives exchanges to perform
continuous monitoring of all positions in all contracts. The FSA believes that the UK‟s
position management approach is more effective than a hard position limit approach.

53
However, debates about effectiveness are only relevant to the debate about market abuse
and market orderliness, but not to concerns about the medium-term price impact of
„speculation‟.
Are there policies that could dampen harmful oil price volatility?
The key concern from an overall economic point of view is whether excessive medium-
term trends in oil prices can drive macro-economic volatility, undermine business planning
assumptions and fail to provide the long-term price signals required to drive long-term
investment, whether in additional oil supply or in low carbon alternatives.
Large medium-term swings in oil prices are inherently likely to occur, given the structural
characteristics of the market, and would do so even if there were no role of pure financial
investors. This is a market which, as described by Christopher Allsopp and Bassam
Fattouh38
, is characterised by „multiple equilibria‟, with a wide „range of indeterminacy‟
within which the price can settle. In such a market, financial speculation could conceivably
play a role in accentuating the pace of movement between alternative equilibria, but the
vulnerability to potential instability derives from the structural character of the market, not
simply from the presence of speculative financial investors.
Given the structural roots of this instability, the issue then is whether there are any public
policies that could help address the primary causes of potentially harmful price trends. We
distinguish between three categories of policies, and aim to be clear about how they relate
to the key economic issue.
I. Policies that are not relevant to the economically important medium-term price
trends but are important in relation to other issues
These include financial regulatory policies such as implementing an effective regime to
ensure markets are orderly and to combat market abuse. One way the FSA and CFTC
pursue this is through position management techniques, including position limits.
38 Allsopp, C., and Fattouh , B. “Oil Prices: Fundamentals or Speculation?” presentation at the Bank of
England, 13 June 2008.
Fattouh, B. (2010), “Oil Market Dynamics Through the Lens of the 2002-2009 Price Cycle", Oxford Institute
for Energy Studies, WPM 39 January 2010.

54
II. Policies that are, or might be, relevant to medium-term price trends but do not
address the fundamental drivers of oil price volatility and whose feasibility
remain unclear:
These include:
Limits on the absolute level of certain categories of investment, on either
commercial or speculative participants, in the oil market. These might be
relevant if it were in future proved (as it has not yet been) that financial
speculation was a major driver of medium-term price instability. However, there
would be considerable logistical difficulties in implementing such a policy that
would in effect amount to a global limit scheme, potentially restricting
investment for all market participants, probably making it unworkable in
practice. It is appropriate, though, to keep the possible impact of financial
speculation on prices under periodic review.39
Transaction taxes to limit the potential for short-term capital gain. This is
unlikely to make a major difference in the oil market, given that the scale of
volatility deriving from fundamental factors is so great that potential gains are
likely to be comparatively large when compared to any transaction tax that is set
low enough not to interfere with legitimate and necessary real trading and
hedging activities.
Strategic petroleum reserves being used as a countercyclical „buffer‟ during
economic cycles i.e. national inventory reserves could be built up during times
of economic contraction and weak global demand, and sold back into the market
during times of strong economic growth to smooth price trends. In order to
achieve any meaningful impact such action would likely require global
39
In assessing this issue, however, it is important to recognise the possibility that some speculative activity
can perform a „counter-cyclical stabilising‟ rather than a „momentum reinforcing‟ role and that commercial
participants (i.e. producers, oil companies, and industrial users) themselves can and do execute speculative
trading strategies in anticipation of price changes, so that the ability in practice to distinguish „natural‟ from
„pure financial‟ participants is very limited.
55
coordination. However there are difficulties in determining what point the
reserves should be increased and released, and huge sums of capital would be
required to administer such a scheme.
III. Policies that would address the fundamental drivers of oil price volatility but
raise issues well beyond financial regulation
These would have to be policies that could help stabilise expectations for the medium-term
equilibrium price, with clear market expectations of both floor and ceiling levels. This
would require a developed and regular dialogue between the key producer groups and
consumer nations. The behaviour of OPEC would be central to the feasibility of such a
policy. The challenge is that, as a group of producing countries, OPEC has much more
apparent incentives to help establish a floor than a ceiling.
During the period of relatively range-bound prices, between the summer of 2009 and
summer of 2010, it could be argued that, in respect to a floor, the widely reported statement
by Saudi Arabia‟s King Abdullah that $75 is a „fair‟ price may have created the expectation
that significant falls below an approximate $60–80 range were unlikely. Provided OPEC
acts in what would be expected to be a rational manner for its own interests, by restricting
production, it may be able to place a floor under price oscillations.
It is unclear, however, whether policies could be agreed and sustainably enforced, which
could create strong enough „feedback loops on the upside‟ to prevent a leap to a
significantly higher equilibrium arising under some circumstance. A ceiling would require
OPEC to be able and willing to increase production to prevent price increases, but it is not
clear that OPEC will always consider this in its own interest, except to the extent that it was
clear that prolonged high oil prices were significantly constraining global economic
growth.40
It appears that OPEC, observing the long-term increase in prices from 2000 to
2010, has concluded that the demand-destruction effect of higher prices is neither as large
nor as permanent as it used to fear. This was borne out by OPEC‟s statements around
March 2008, when prices first broke above $100 on a consistent basis, that the market was
well supplied and the higher prices were not supply-driven.
40 There has been an apparent response by certain OPEC members increasing production in response to the
general rise in oil prices we have seen from about December 2010 onwards. However, these are single
producer initiatives rather than a collective OPEC decision.
56
The lack of an organised consumer response to high oil prices further perpetuates the
difficulty in placing a ceiling on prices. There is no consumer equivalent of OPEC, and the
reasons for this are somewhat obvious – the demand side of the equation is so much more
globally dispersed than the reasonably well concentrated supply side (OPEC countries
account for over 40% of global oil production).
It may be, therefore, that OPEC discipline will dampen future volatility by constraining
downward swings, but there are no obvious feasible policies that can prevent the
phenomenon of occasional significant upswings, with the long-term equilibrium level to a
degree indeterminate.
However enhancing the quality and scope of fundamental data would at least provide the
market with better information on which it can base price discovery. This could help
contribute to less volatile oil prices by reducing the range of possible interpretations of
underlying fundamental data. Whilst improved transparency of the financial market is
important, greater transparency of physical market fundamentals would be of greatest
significance.41
Conclusion
The key focus for public policy makers should be medium-term price trends because of the
potentially harmful economic impact these can have. However, we consider the objective
of controlling medium-term price movements through financial market regulation alone to
be both misaligned and unachievable. This is because the financial regulatory tools
currently being considered, such as position management techniques (including position
limits), would not have a meaningful impact on this key issue. The overall conclusion is
that, if there are policies which can make a difference to the key economic issue they would
have to address the fundamental drivers of instability, rather than issues solely related to
the operation of the financial markets.
41 The work of IOSCO‟s Task Force on Commodity Futures Markets ( www.iosco.org ) and other initiatives,
regulatory and legislative are to be welcomed in this regard.
57
References
Allsopp, C., and Fattouh, B. “Oil Prices: Fundamentals or Speculation?” presentation at the
Bank of England, 13 June 2008.
Bank of England (2009), „What Can Be Said About the Rise and Fall in Oil Prices?‟.
Quarterly Bulletin, 2009 Q3, London, Bank of England.
Brunetti, C., and Buyuksahin, B. (2009), „Is Speculation Destabilizing?‟, available at
http://ssrn.com/abstract=1393524
BP (2004 & 2009), „Statistical Review of World Energy‟.
Fattouh, B. (2010), “Oil Market Dynamics Through the Lens of the 2002-2009 Price
Cycle", Oxford Institute for Energy Studies, WPM 39 January 2010.
Harris, J. H., and Buyuksahin, B. (2009), „The Role of Speculators in the Crude Oil Futures
Market‟, available at http://ssrn.com/abstract=1435042
Hotelling, H. (1931), „The Economics of Exhaustible Resources‟, Journal of Political
Economy, 39.
International Monetary Fund (IMF) (April 2009 and October 2010), World Economic
Outlook.
J.P. Morgan Global Commodities Research (2009), ‘Commodity prices and futures
positions’, 16 December 2009,
Working, H. (1949), „The Theory of Price of Storage‟, American Economic Review, 39.