Embed Size (px)
Citation preview
The Ohio Perinatal Quality Collaborative: What Have We Learned in the First 5 Years ?
• Origins
• Goals
• Methods
• Funding
• Projects
• Successes
• Problems
• Lessons
• Future
Jay D. Iams MD
Obstetrics Lead, Ohio Perinatal Quality Collaborative Frederick P. Zuspan Professor Emeritus of Obstetrics & Gynecology The Ohio State University Wexner Medical Center Disclosures: Contracts with Elsevier as an Associate Editor of: Am J Obstet Gynecol Creasy & Resnik’s Maternal Fetal Medicine Research funding from NICHD, CWRU, & CCHMC (for OPQC) No Commercial Affiliations, Speaker’s Bureaus, Consultancies, or Stock
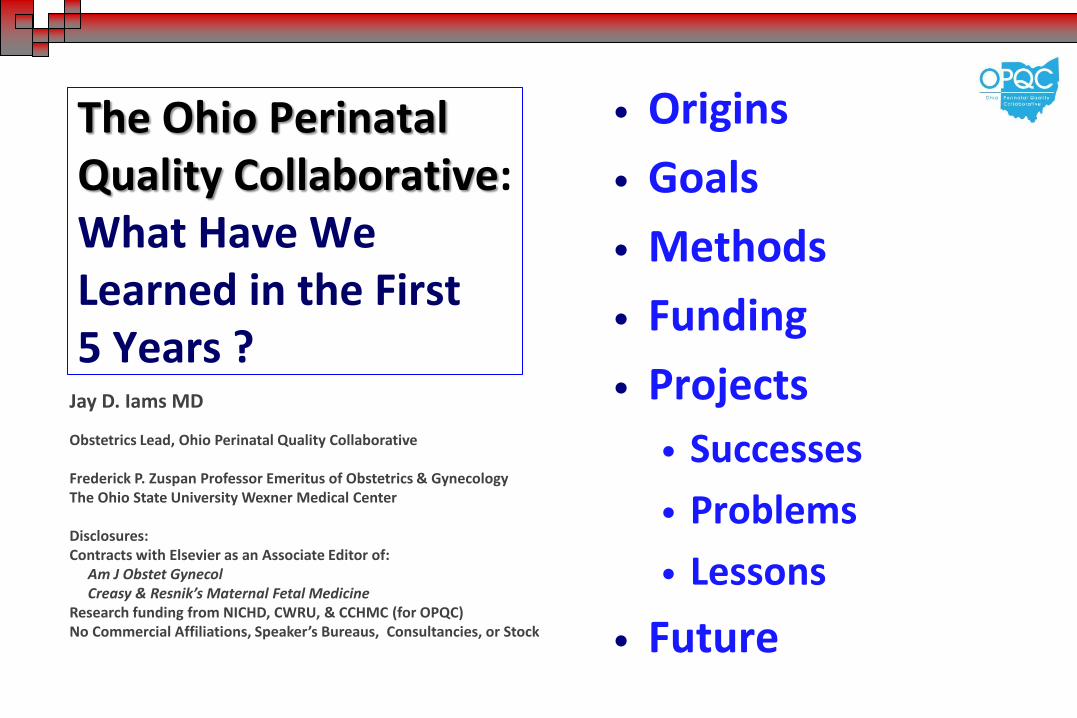
Who Is OPQC?
Ohio Department of Job & Family Services
Ohio Department of Health – Vital Stats
Ohio Medicaid
Ohio AAP, ACOG, MoD
Peds + OB Content & Q.I. Leaders
“OPQC Central”
Secure Central De-identified Data Processing
Staff at Ohio Maternity & Children’s Hospitals
Ohio Families Affected by Prematurity
Start up $$ from CMS ODJFS OPQC
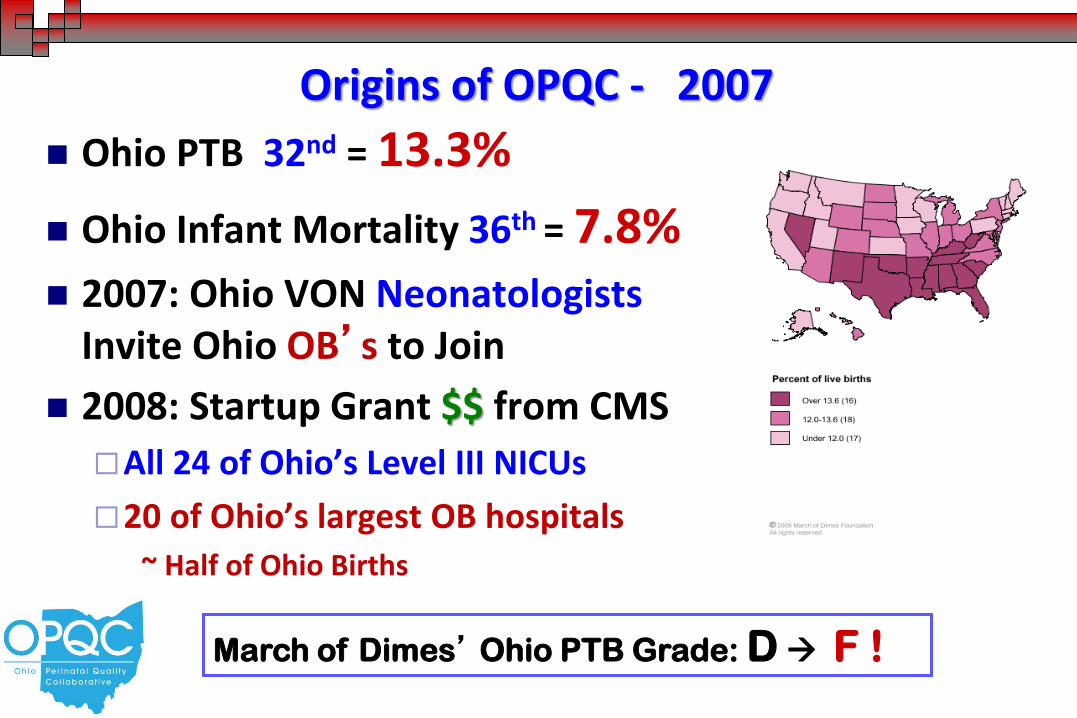
Origins of OPQC - 2007
Ohio PTB 32nd = 13.3%
Ohio Infant Mortality 36th = 7.8% 2007: Ohio VON Neonatologists
Invite Ohio OB’s to Join
2008: Startup Grant $$ from CMS
All 24 of Ohio’s Level III NICUs
20 of Ohio’s largest OB hospitals
~ Half of Ohio Births
March of Dimes’ Ohio PTB Grade: D F !
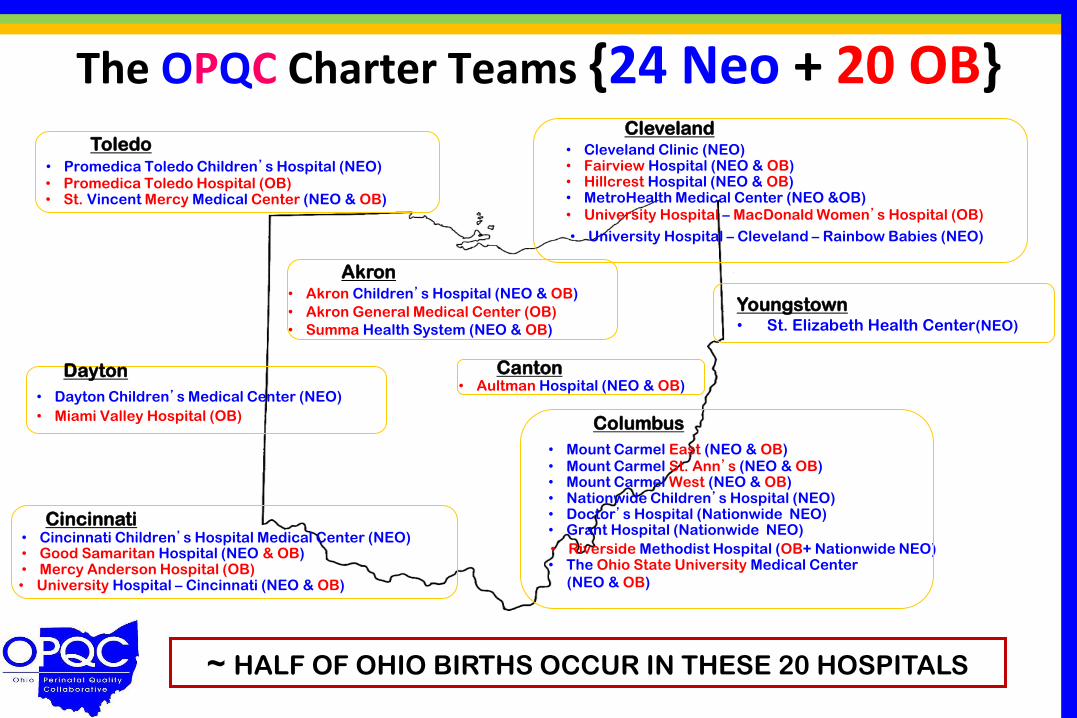
The OPQC Charter Teams {24 Neo + 20 OB}
• Cincinnati Children’s Hospital Medical Center (NEO) • Good Samaritan Hospital (NEO & OB)
• Aultman Hospital (NEO & OB)
• Akron Children’s Hospital (NEO & OB)
• Akron General Medical Center (OB)
• Cleveland Clinic (NEO)
• Dayton Children’s Medical Center (NEO)
• Fairview Hospital (NEO & OB) • Hillcrest Hospital (NEO & OB)
• Mercy Anderson Hospital (OB)
• MetroHealth Medical Center (NEO &OB)
• Miami Valley Hospital (OB)
• Mount Carmel East (NEO & OB)
• Nationwide Children’s Hospital (NEO) • Doctor’s Hospital (Nationwide NEO) • Grant Hospital (Nationwide NEO)
• Promedica Toledo Children’s Hospital (NEO) • Promedica Toledo Hospital (OB)
• Riverside Methodist Hospital (OB+ Nationwide NEO)
• St. Vincent Mercy Medical Center (NEO & OB)
• Summa Health System (NEO & OB)
• The Ohio State University Medical Center
(NEO & OB) • University Hospital – Cincinnati (NEO & OB)
• University Hospital – Cleveland – Rainbow Babies (NEO)
• University Hospital – MacDonald Women’s Hospital (OB)
• Mount Carmel West (NEO & OB) • Mount Carmel St. Ann’s (NEO & OB)
Cleveland
Akron
Youngstown • St. Elizabeth Health Center(NEO)
Canton Dayton
Cincinnati
Toledo
Columbus
~ HALF OF OHIO BIRTHS OCCUR IN THESE 20 HOSPITALS
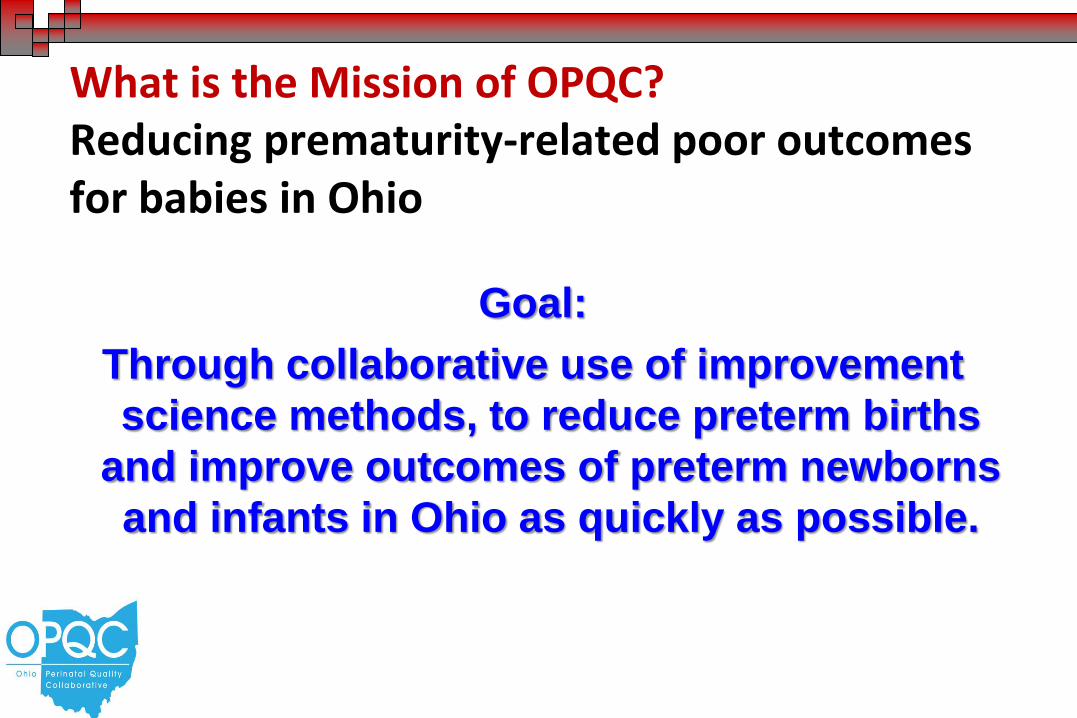
Goal:
Through collaborative use of improvement
science methods, to reduce preterm births
and improve outcomes of preterm newborns
and infants in Ohio as quickly as possible.
What is the Mission of OPQC? Reducing prematurity-related poor outcomes for babies in Ohio

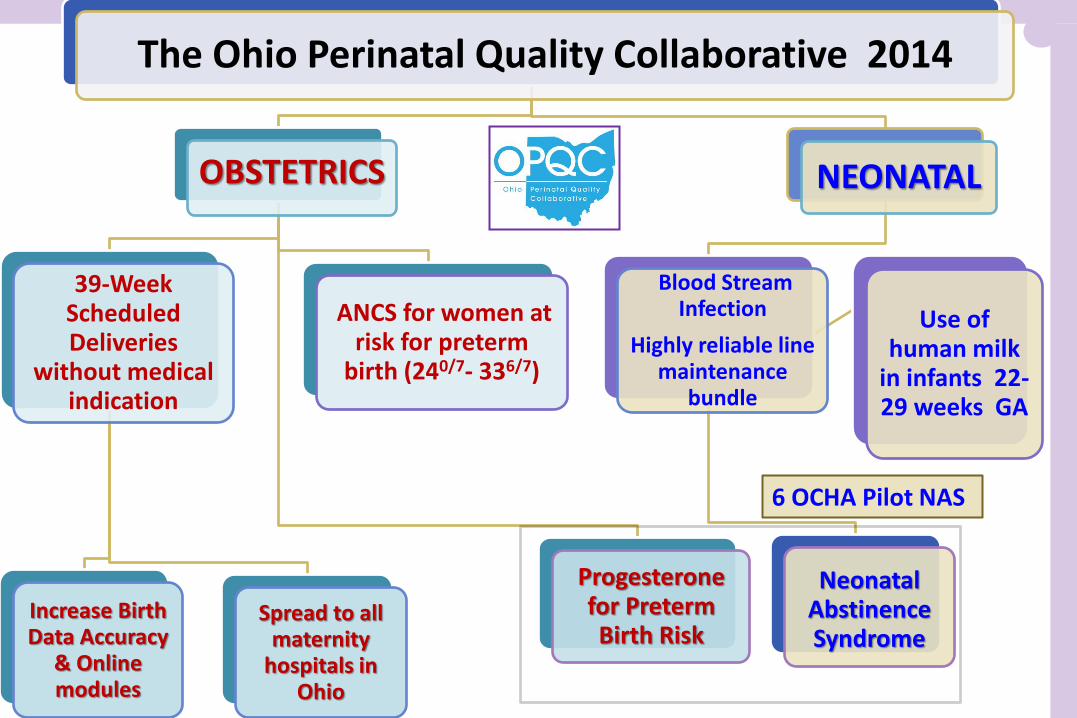
The Ohio Perinatal Quality Collaborative 2014
OBSTETRICS
ANCS for women at risk for preterm
birth (240/7- 336/7)
39-Week Scheduled Deliveries
without medical indication
Increase Birth Data Accuracy
& Online modules
Spread to all maternity
hospitals in Ohio
Progesterone for Preterm Birth Risk
NEONATAL
Blood Stream Infection
Highly reliable line maintenance
bundle
Neonatal Abstinence Syndrome
Use of human milk
in infants 22-29 weeks GA
6 OCHA Pilot NAS
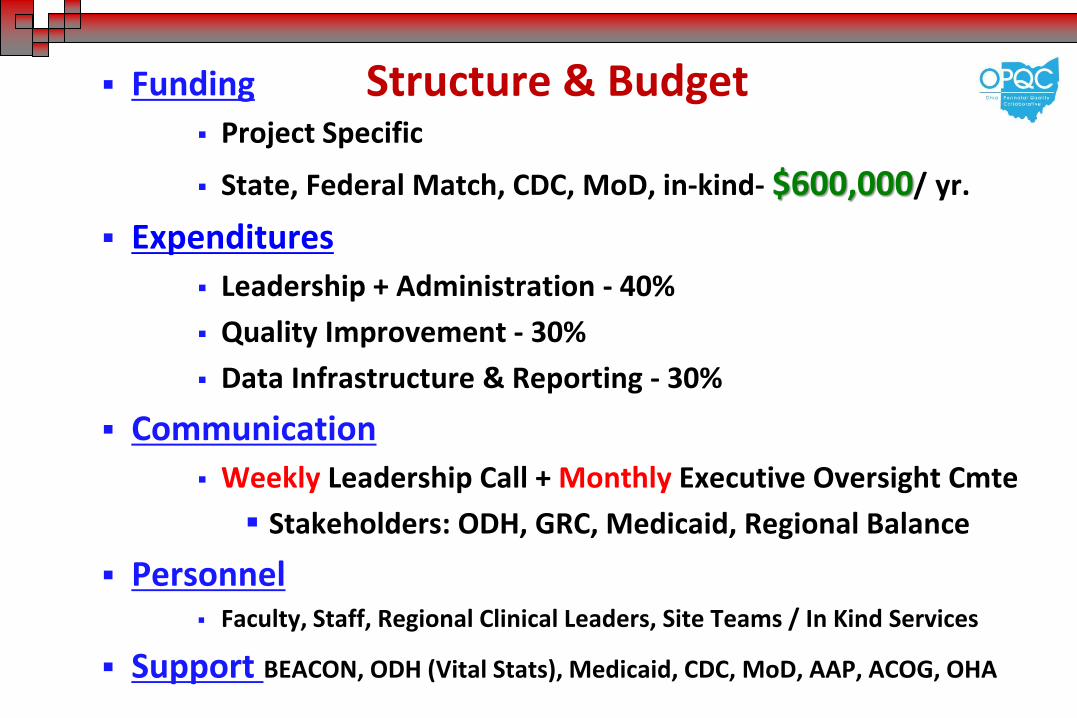
Structure & Budget Funding
Project Specific
State, Federal Match, CDC, MoD, in-kind- $600,000/ yr.
Expenditures
Leadership + Administration - 40%
Quality Improvement - 30%
Data Infrastructure & Reporting - 30%
Communication
Weekly Leadership Call + Monthly Executive Oversight Cmte
Stakeholders: ODH, GRC, Medicaid, Regional Balance
Personnel Faculty, Staff, Regional Clinical Leaders, Site Teams / In Kind Services
Support BEACON, ODH (Vital Stats), Medicaid, CDC, MoD, AAP, ACOG, OHA
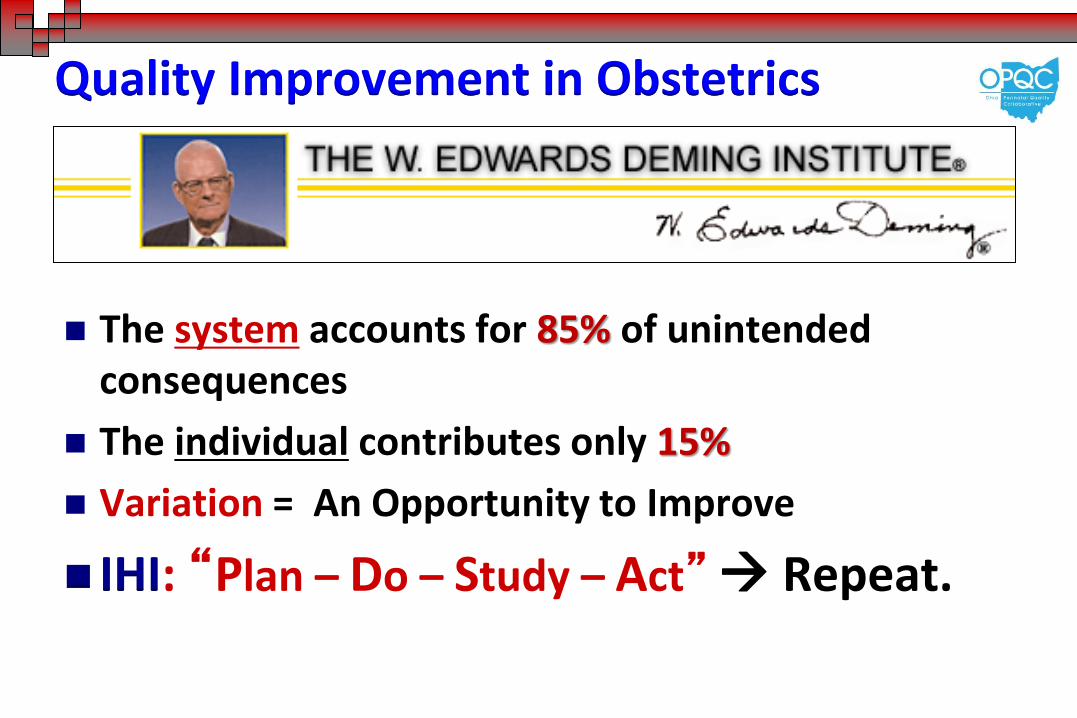
Quality Improvement in Obstetrics
The system accounts for 85% of unintended consequences
The individual contributes only 15%
Variation = An Opportunity to Improve
IHI: “Plan – Do – Study – Act” Repeat.
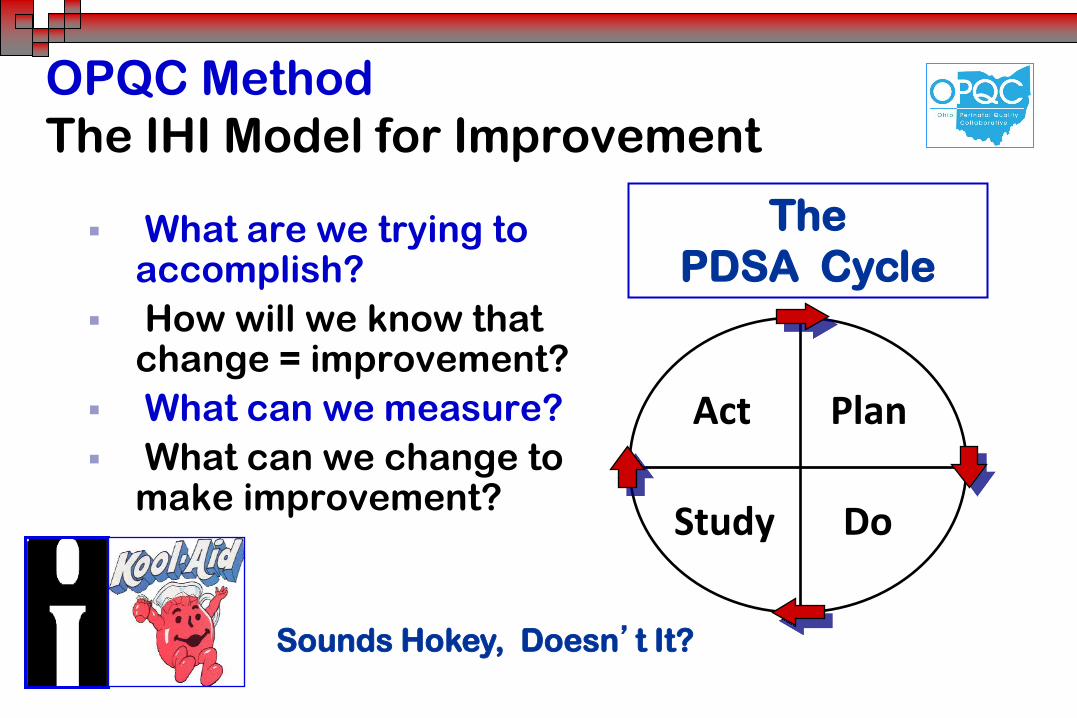
OPQC Method
The IHI Model for Improvement
What are we trying to accomplish?
How will we know that change = improvement?
What can we measure?
What can we change to make improvement?
Act Plan
Study Do
The
PDSA Cycle
Sounds Hokey, Doesn’t It?
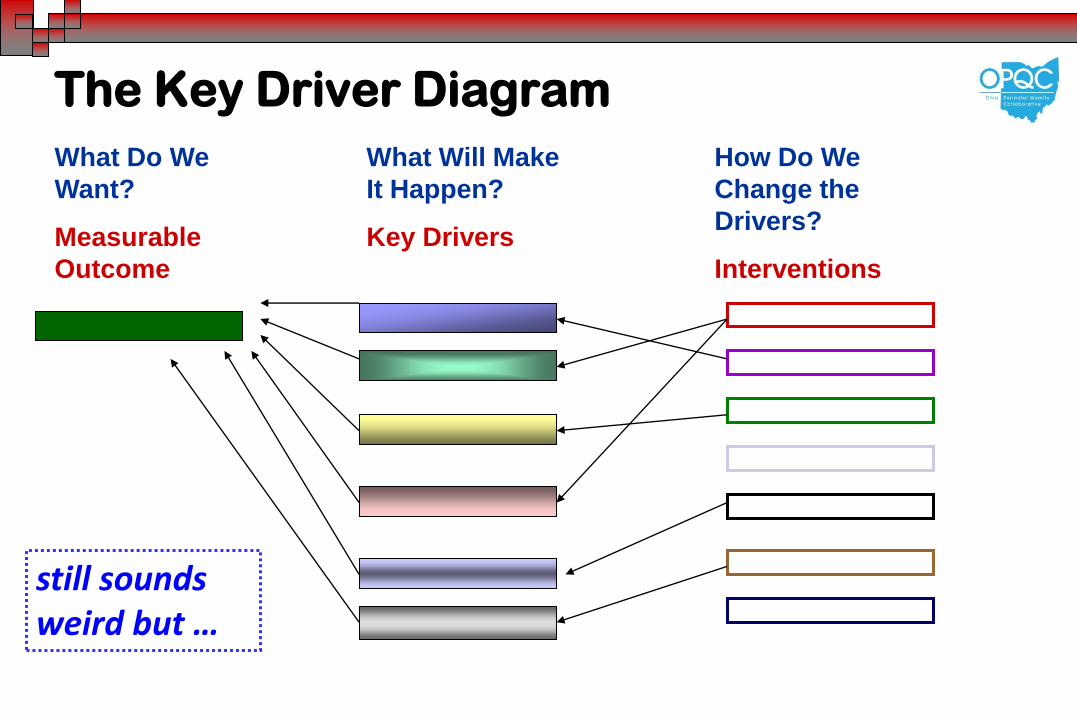
The Key Driver Diagram
What Do We
Want?
Measurable
Outcome
What Will Make
It Happen?
Key Drivers
How Do We
Change the
Drivers?
Interventions
still sounds weird but …
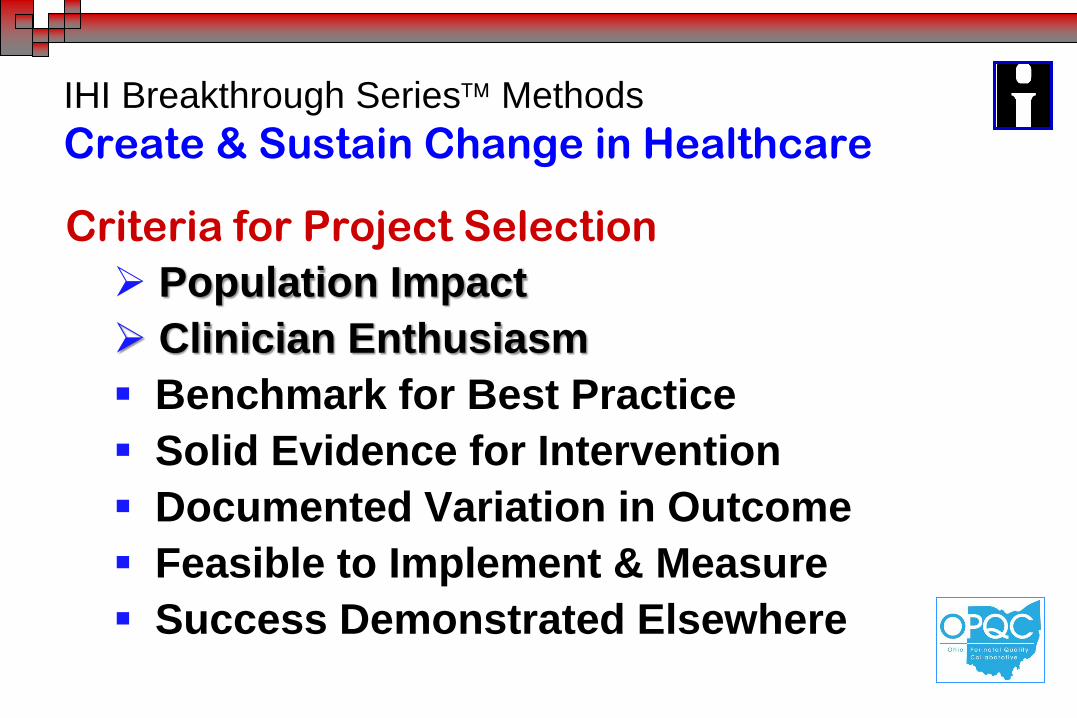
IHI Breakthrough Series Methods
Create & Sustain Change in Healthcare
Criteria for Project Selection
Population Impact
Clinician Enthusiasm
Benchmark for Best Practice
Solid Evidence for Intervention
Documented Variation in Outcome
Feasible to Implement & Measure
Success Demonstrated Elsewhere
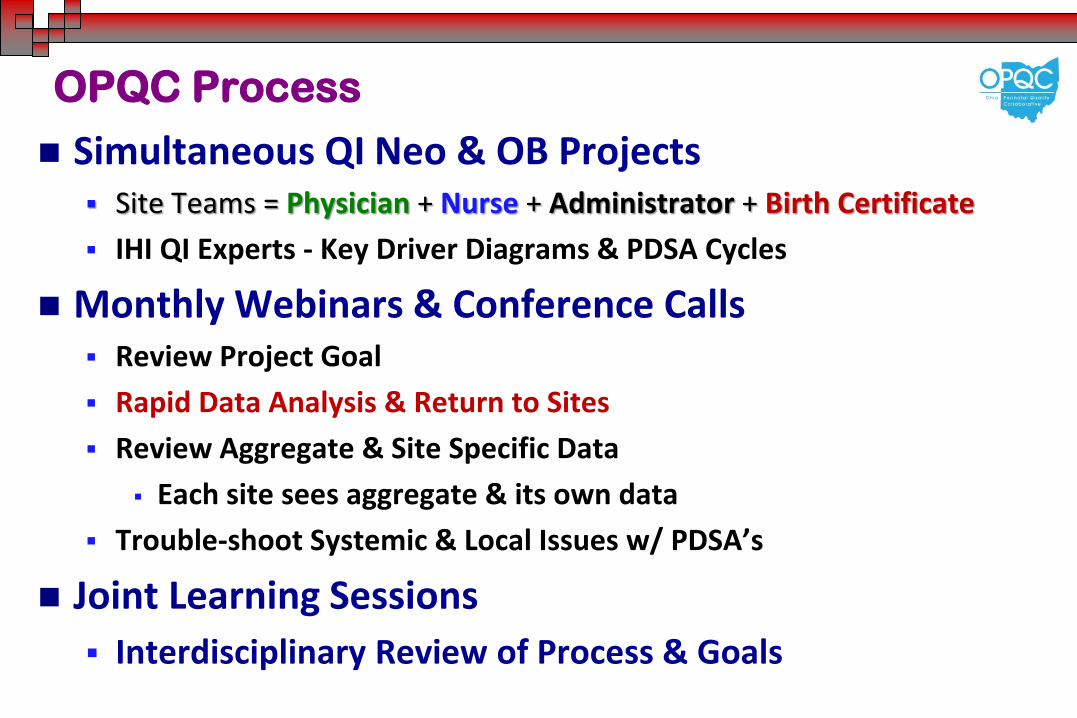
OPQC Process
Simultaneous QI Neo & OB Projects Site Teams = Physician + Nurse + Administrator + Birth Certificate
IHI QI Experts - Key Driver Diagrams & PDSA Cycles
Monthly Webinars & Conference Calls Review Project Goal
Rapid Data Analysis & Return to Sites
Review Aggregate & Site Specific Data
Each site sees aggregate & its own data
Trouble-shoot Systemic & Local Issues w/ PDSA’s
Joint Learning Sessions
Interdisciplinary Review of Process & Goals
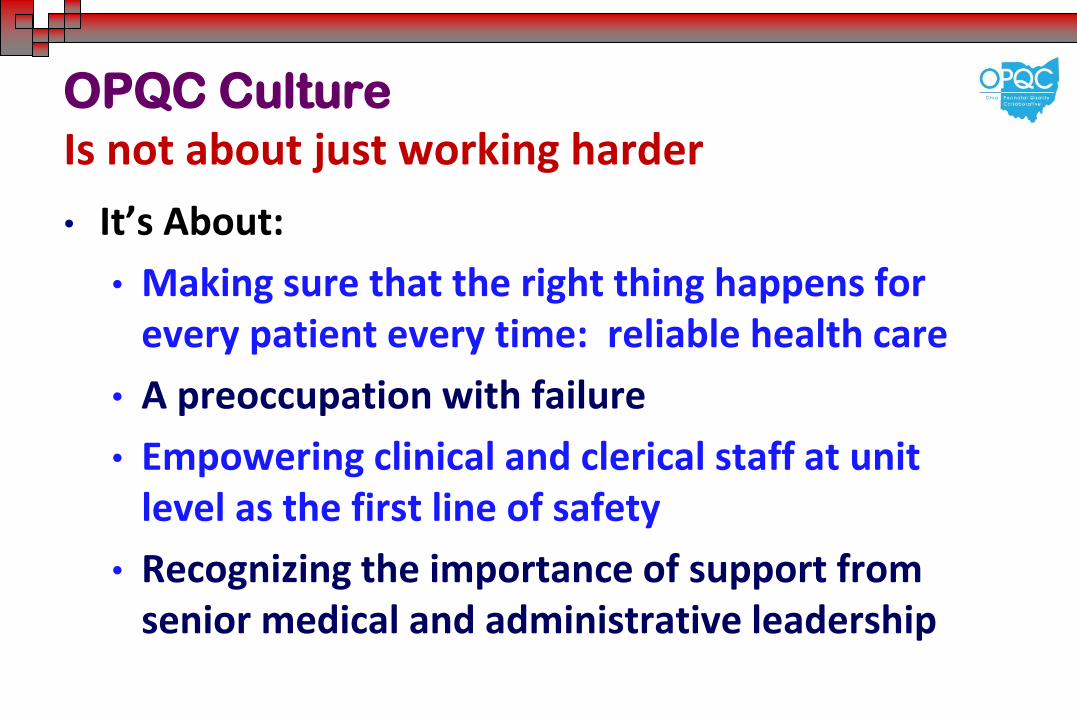
OPQC Culture Is not about just working harder
• It’s About:
• Making sure that the right thing happens for every patient every time: reliable health care
• A preoccupation with failure
• Empowering clinical and clerical staff at unit level as the first line of safety
• Recognizing the importance of support from senior medical and administrative leadership
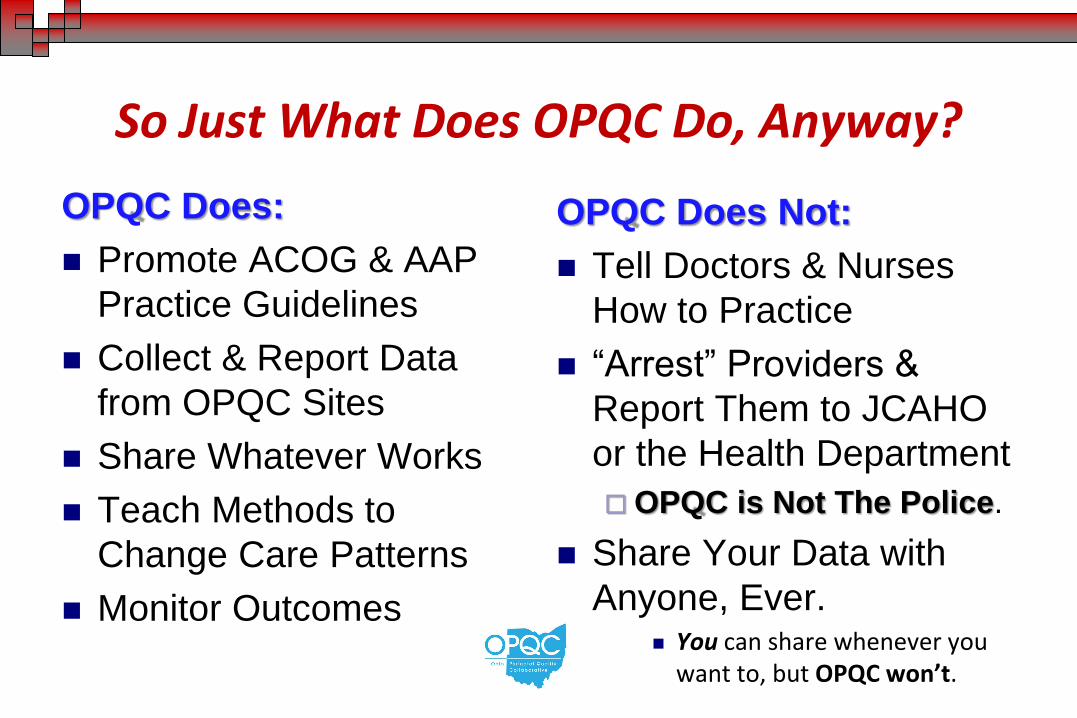
So Just What Does OPQC Do, Anyway?
OPQC Does:
Promote ACOG & AAP
Practice Guidelines
Collect & Report Data
from OPQC Sites
Share Whatever Works
Teach Methods to
Change Care Patterns
Monitor Outcomes
OPQC Does Not:
Tell Doctors & Nurses
How to Practice
“Arrest” Providers &
Report Them to JCAHO
or the Health Department
OPQC is Not The Police.
Share Your Data with
Anyone, Ever. You can share whenever you
want to, but OPQC won’t.
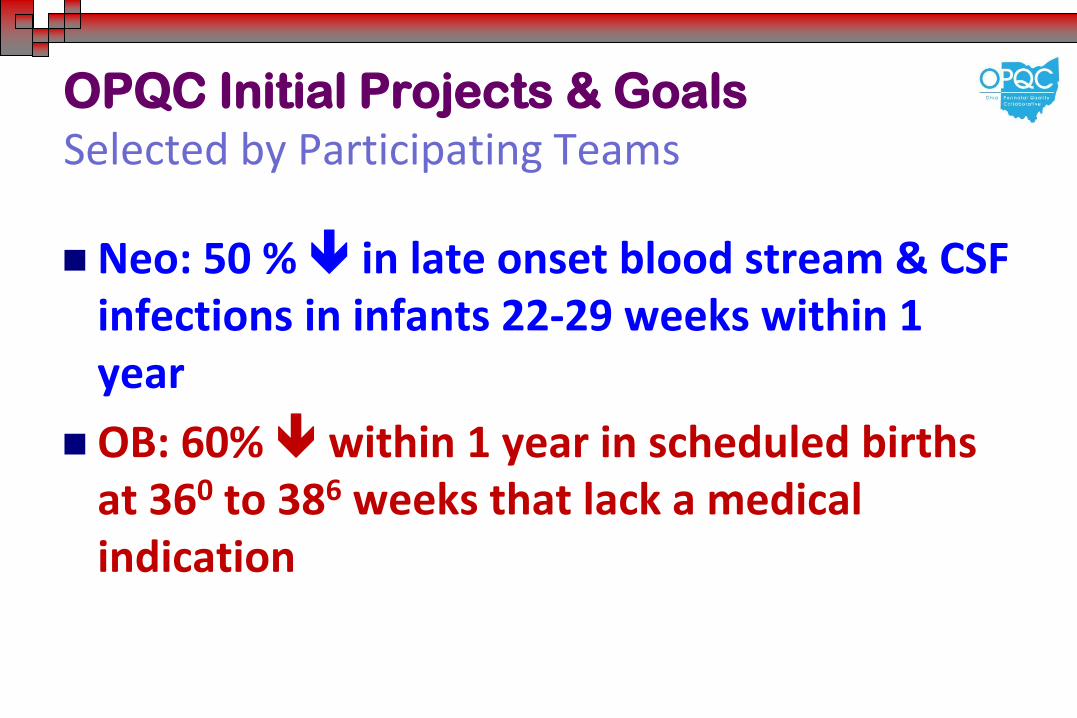
OPQC Initial Projects & Goals Selected by Participating Teams
Neo: 50 % in late onset blood stream & CSF infections in infants 22-29 weeks within 1 year
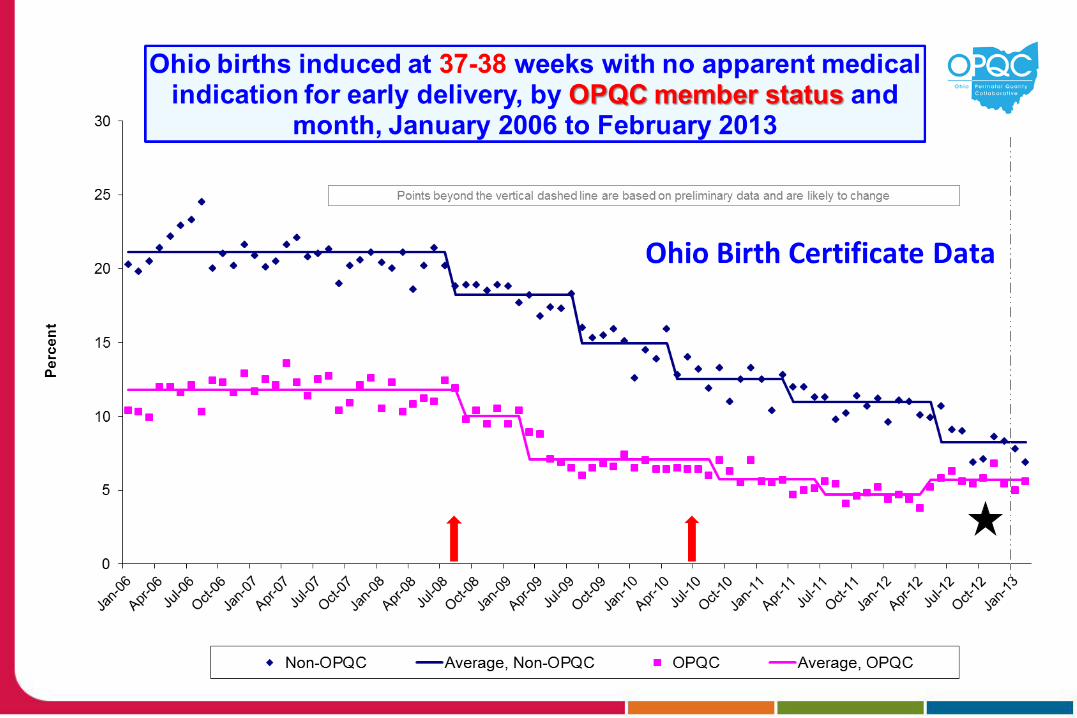
OB: 60% within 1 year in scheduled births at 360 to 386 weeks that lack a medical indication
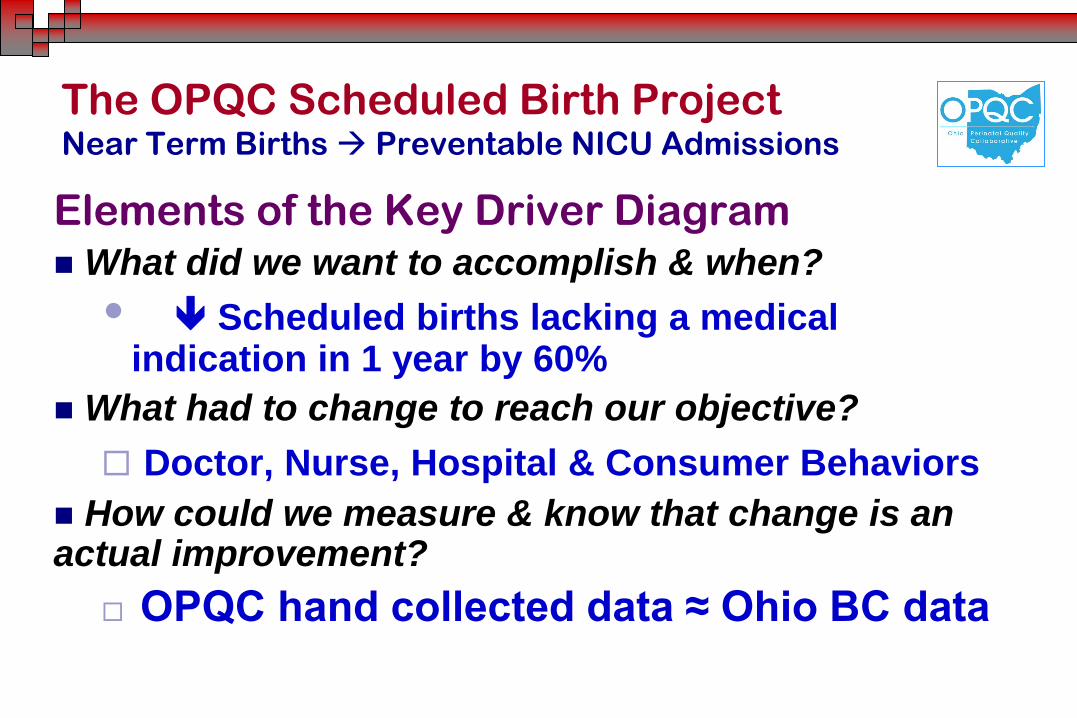
The OPQC Scheduled Birth Project Near Term Births Preventable NICU Admissions
Elements of the Key Driver Diagram What did we want to accomplish & when?
Scheduled births lacking a medical indication in 1 year by 60%
What had to change to reach our objective?
Doctor, Nurse, Hospital & Consumer Behaviors
How could we measure & know that change is an actual improvement?
OPQC hand collected data ≈ Ohio BC data
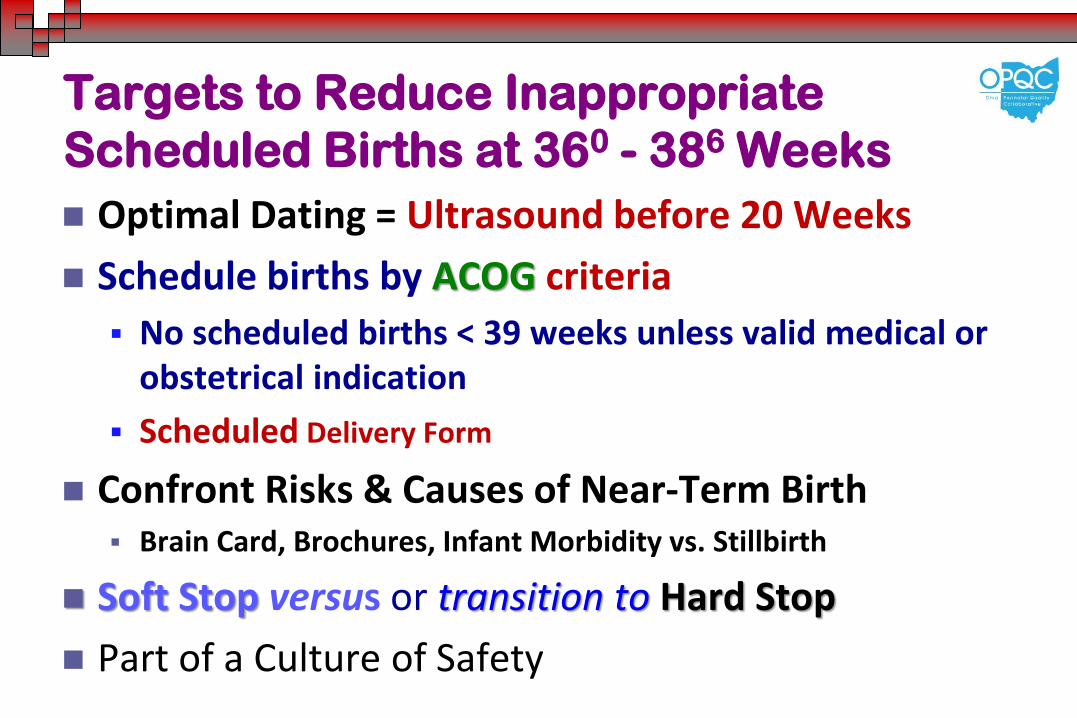
Targets to Reduce Inappropriate
Scheduled Births at 360 - 386 Weeks
Optimal Dating = Ultrasound before 20 Weeks
Schedule births by ACOG criteria
No scheduled births < 39 weeks unless valid medical or obstetrical indication
Scheduled Delivery Form
Confront Risks & Causes of Near-Term Birth Brain Card, Brochures, Infant Morbidity vs. Stillbirth
Soft Stop versus or transition to Hard Stop
Part of a Culture of Safety
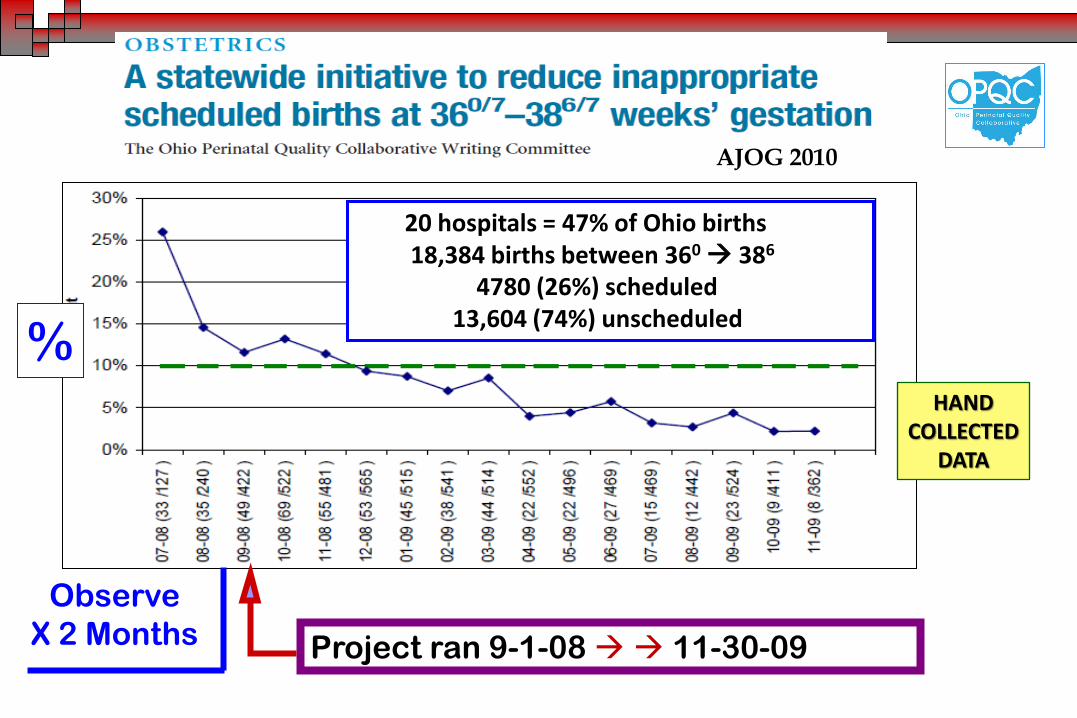
Observe
X 2 Months Project ran 9-1-08 11-30-09
%
20 hospitals = 47% of Ohio births 18,384 births between 360 386
4780 (26%) scheduled 13,604 (74%) unscheduled
AJOG 2010
HAND COLLECTED
DATA
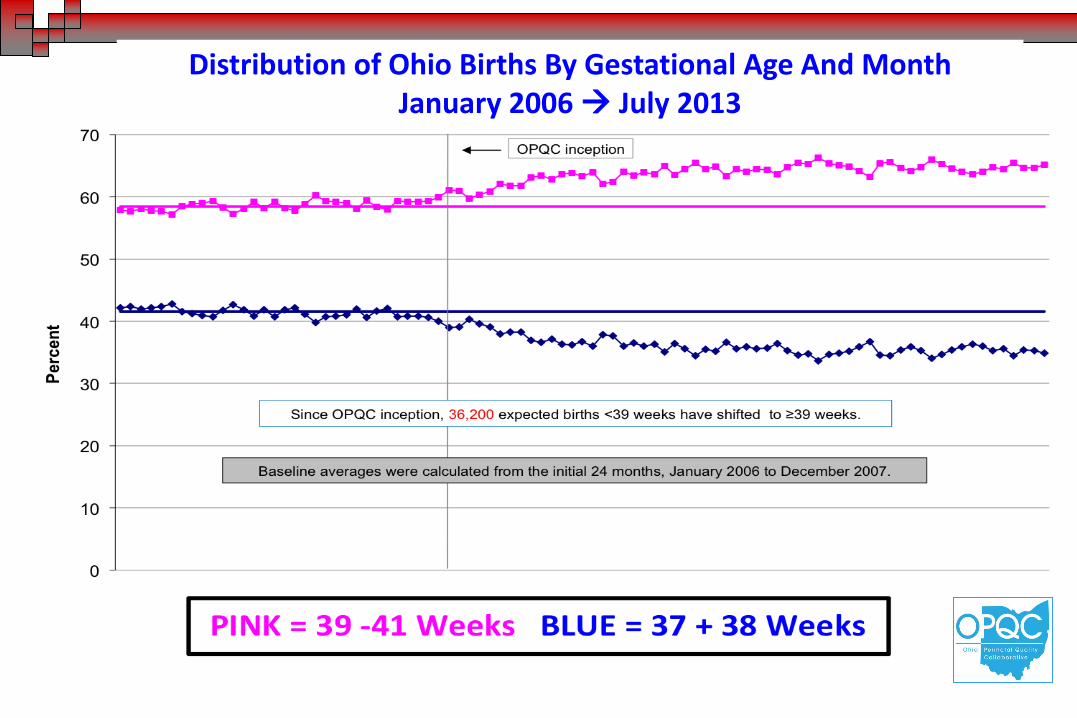
Distribution of Ohio Births By Gestational Age And Month January 2006 July 2013
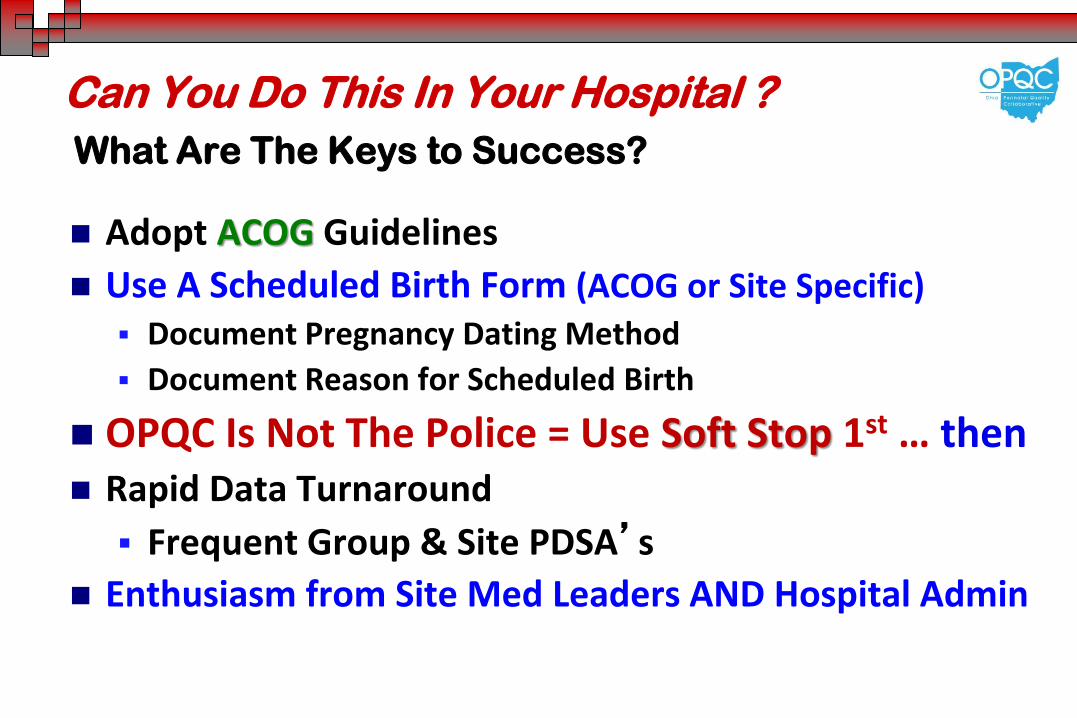
Can You Do This In Your Hospital ?
What Are The Keys to Success?
Adopt ACOG Guidelines
Use A Scheduled Birth Form (ACOG or Site Specific)
Document Pregnancy Dating Method
Document Reason for Scheduled Birth
OPQC Is Not The Police = Use Soft Stop 1st … then Rapid Data Turnaround
Frequent Group & Site PDSA’s
Enthusiasm from Site Med Leaders AND Hospital Admin
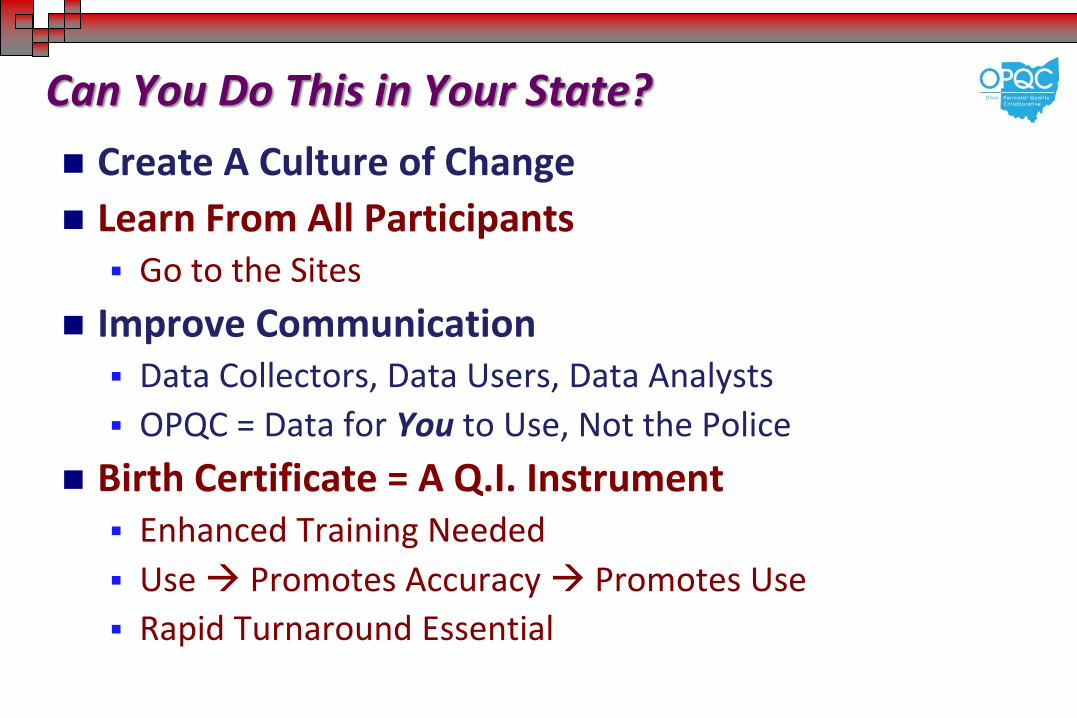
Can You Do This in Your State?
Create A Culture of Change
Learn From All Participants Go to the Sites
Improve Communication Data Collectors, Data Users, Data Analysts
OPQC = Data for You to Use, Not the Police
Birth Certificate = A Q.I. Instrument Enhanced Training Needed
Use Promotes Accuracy Promotes Use
Rapid Turnaround Essential
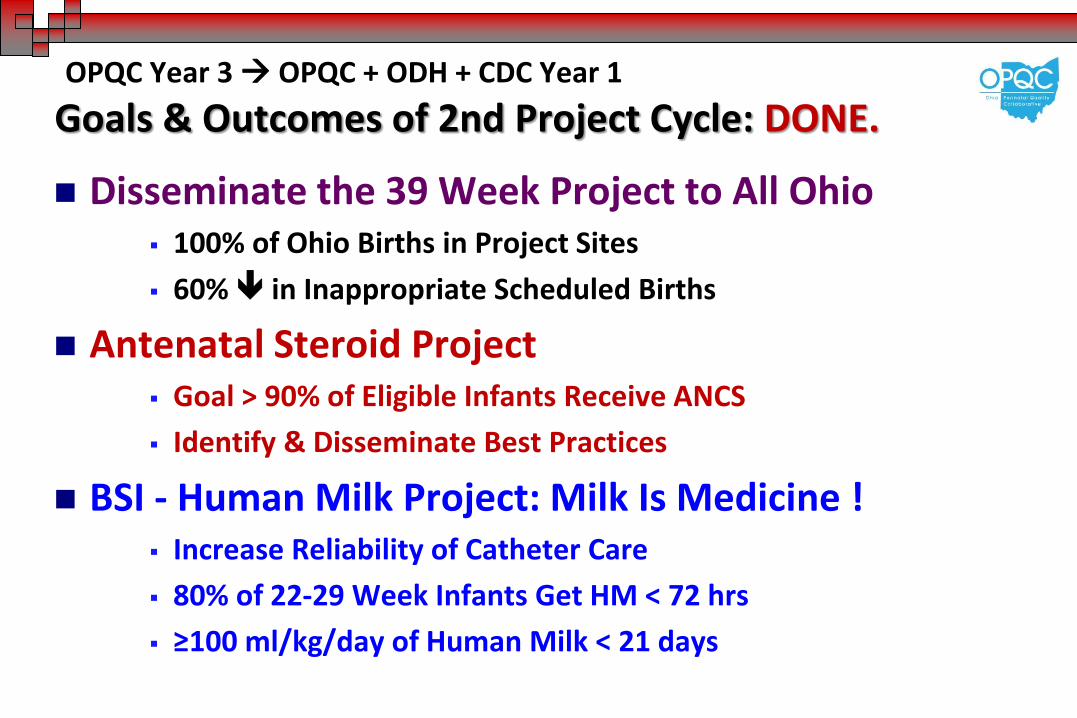
OPQC Year 3 OPQC + ODH + CDC Year 1
Goals & Outcomes of 2nd Project Cycle: DONE.
Disseminate the 39 Week Project to All Ohio 100% of Ohio Births in Project Sites
60% in Inappropriate Scheduled Births
Antenatal Steroid Project Goal > 90% of Eligible Infants Receive ANCS
Identify & Disseminate Best Practices
BSI - Human Milk Project: Milk Is Medicine ! Increase Reliability of Catheter Care
80% of 22-29 Week Infants Get HM < 72 hrs
≥100 ml/kg/day of Human Milk < 21 days
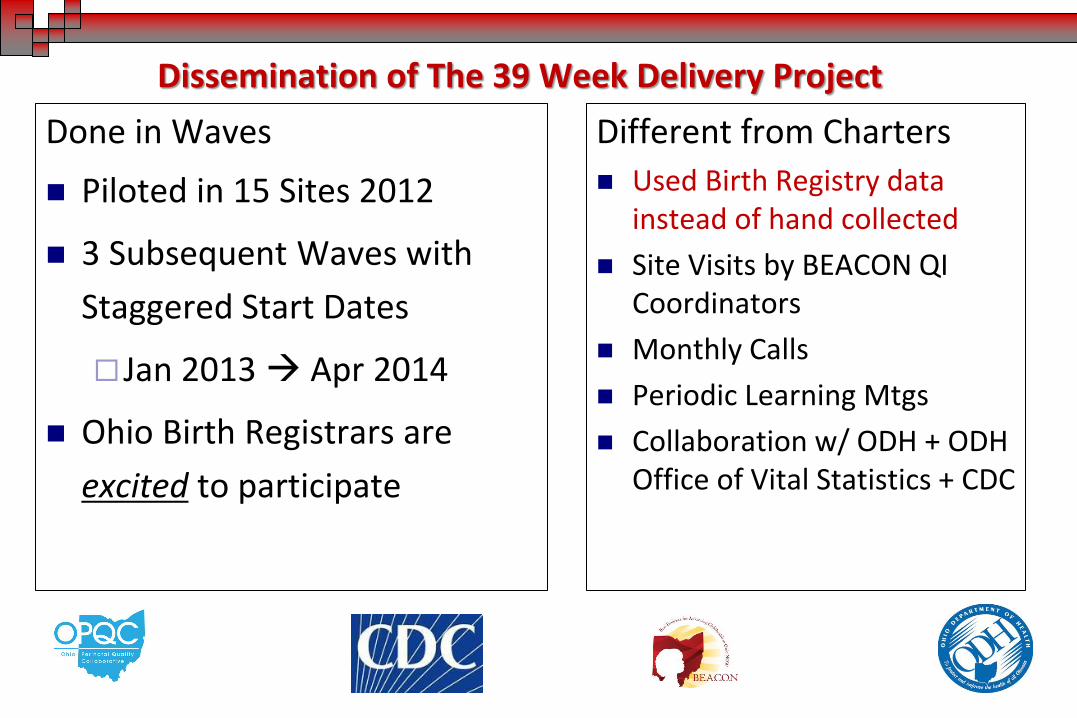
Different from Charters
Used Birth Registry data instead of hand collected
Site Visits by BEACON QI Coordinators
Monthly Calls
Periodic Learning Mtgs
Collaboration w/ ODH + ODH Office of Vital Statistics + CDC
Dissemination of The 39 Week Delivery Project
Done in Waves
Piloted in 15 Sites 2012
3 Subsequent Waves with
Staggered Start Dates
Jan 2013 Apr 2014
Ohio Birth Registrars are
excited to participate
Henry County
Wood
County Bluffton
Mercy Tiffin
Mary
Rutan
Atrium
McCullough-
Hyde
Fort
Hamilton
Holzer
Medical
Berger Health
Licking
Memorial Doctor’s
Coshocton
East Liverpool
Firelands
Trinity
Fisher-Titus
Samaritan
Wooster
Union
Lakewood
Lake
West
U.H. Geauga
Galion
Toledo
Mercy St.
Vincent
Miami Valley
Hospital
Mercy Anderson
UH Cincinnati
Good Samaritan TriHealth
Aultman
St. Elizabeth
Health Center
Akron General
Akron Children’s MFM Summa Health System
Mt. Carmel East
Mt. Carmel West
Mt. Carmel St. Ann’s
Riverside Methodist
OSU
Fairview
UH Case
MacDonald
Hillcrest Metro Health
The Christ Hospital
Bay Park
St. Rita’s
Lima
Blanchard
Valley
Southview
Good Samaritan
Premier
Kettering
Bethesda
North
Southern
Ohio
Fairfield
Lancaster
Genesis
Bethesda
Mercy Canton
Lake East
Ashtabula
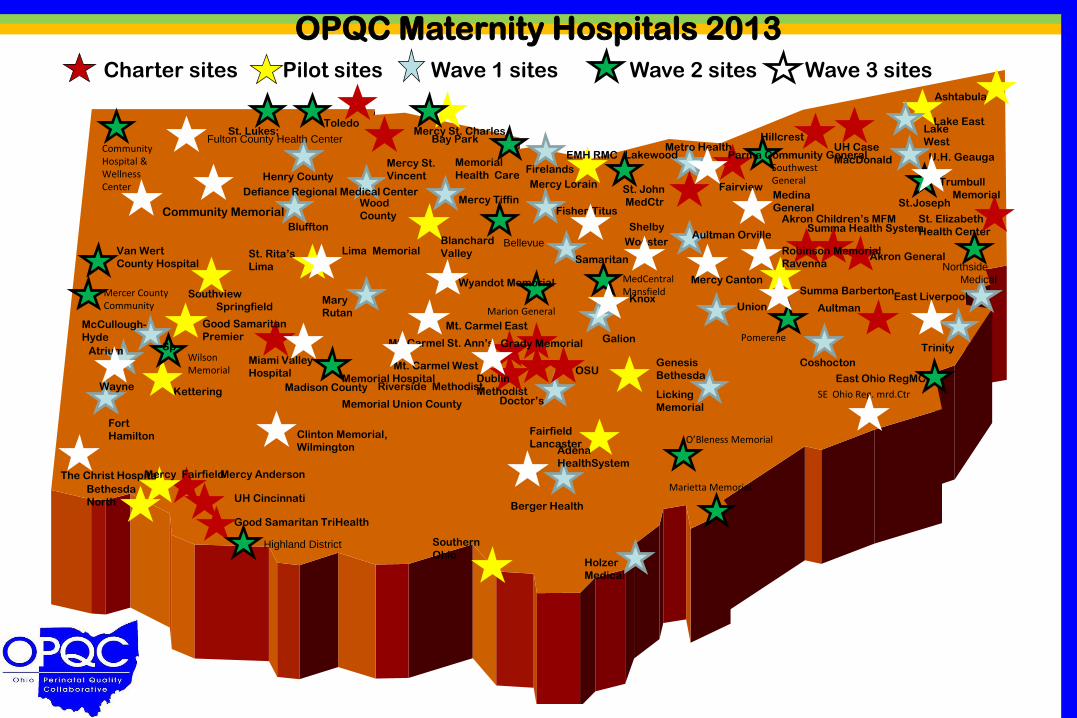
OPQC Maternity Hospitals 2013
Charter sites XPilot sites Wave 1 sites X Wave 2 sites Wave 3 sites
Community Hospital & Wellness Center
Van Wert
County Hospital
Mercer County Community
Wilson Memorial
Highland District
Madison County
Marietta Memorial
O’Bleness Memorial
SE Ohio Reg. mrd.Ctr
Northside
Medical
Trumbull
Memorial
Pomerene
MedCentral Mansfield
Marion General
Southwest General
St. John
MedCtr
Memorial
Health Care Mercy Lorain
Bellevue
• St. Lukes;
Mercy St. Charles
Adena
HealthSystem
Dublin
Methodist
Grady Memorial
Robinson Memorial
Ravenna
Lima Memorial
Wyandot Memorial
Defiance Regional Medical Center
Memorial Hospital
Memorial Union County
Community Memorial
Knox
Sp
Aultman Orville
East Ohio RegMC
St.Joseph
Clinton Memorial,
Wilmington
Mercy Fairfield
Wayne
Medina
General
Summa Barberton
EMH RMC Parma Community General
Fulton County Health Center
Springfield
Shelby
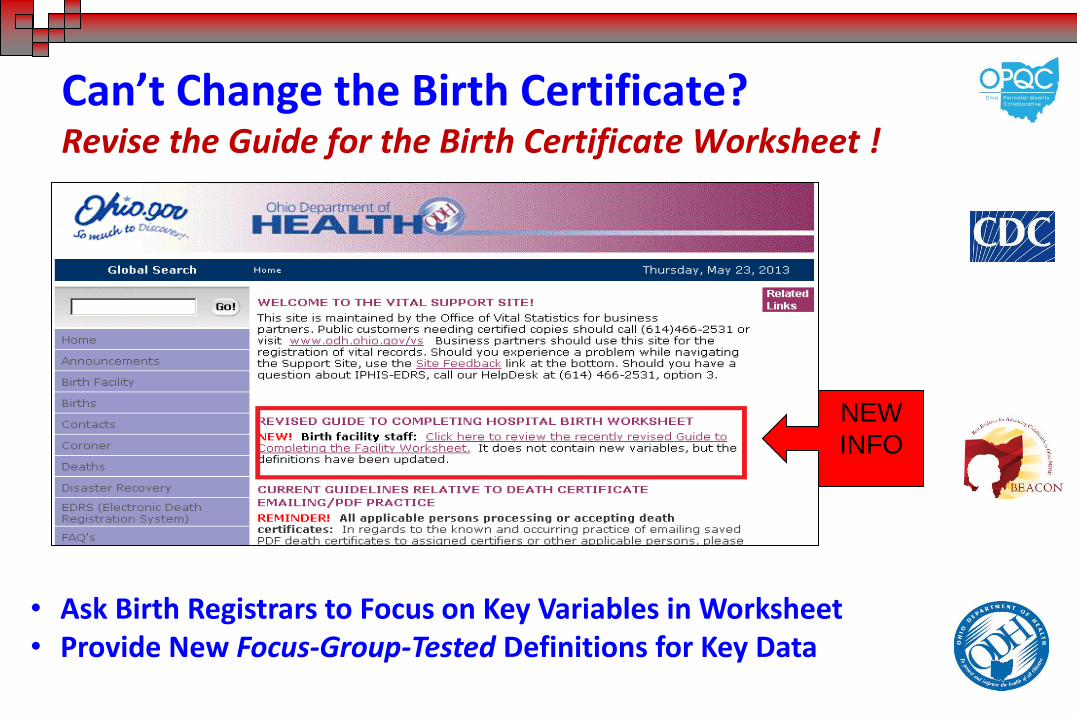
Can’t Change the Birth Certificate? Revise the Guide for the Birth Certificate Worksheet !
NEW
INFO
• Ask Birth Registrars to Focus on Key Variables in Worksheet • Provide New Focus-Group-Tested Definitions for Key Data
Results of Phase 1 39 Week Dissemination Project
Hospital Birth Certificate Staff STILL Excited !!
Major Misunderstandings on Major Outcomes
Determination of Gestational Age - Rounding Up!
Definition of Preeclampsia
Recognition of Antenatal Steroid Rx
Definition of Breast Feeding at Discharge
Aggregate Rate Declined Significantly
Significant Improvement in 10 of 15 Sites
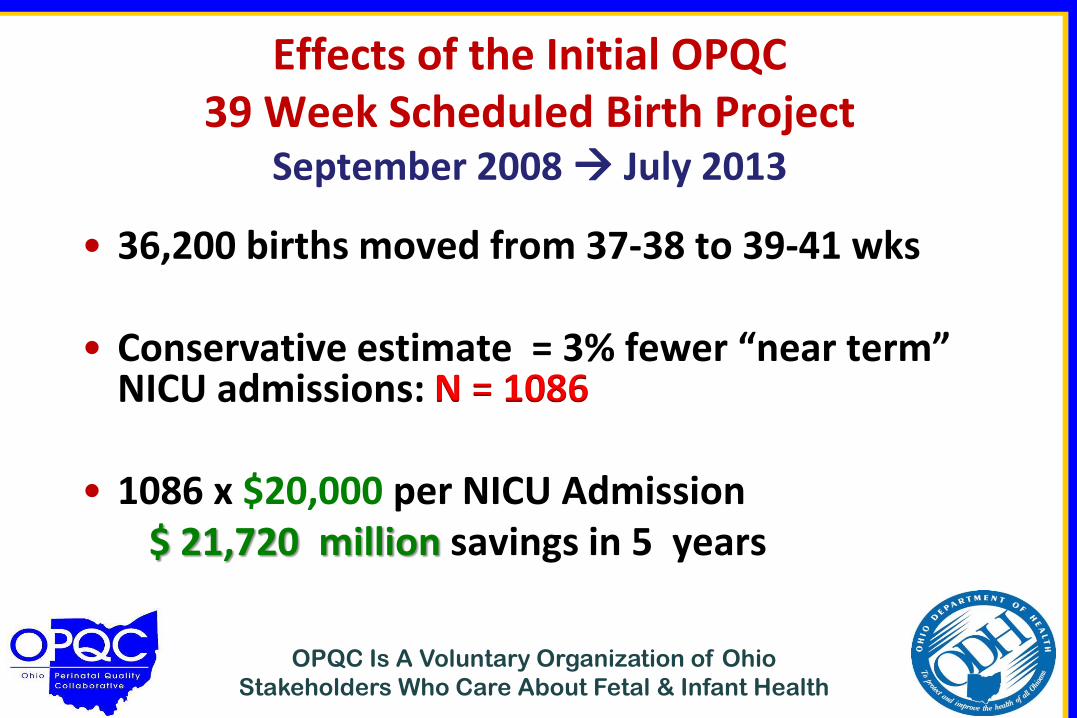
Effects of the Initial OPQC 39 Week Scheduled Birth Project
September 2008 July 2013
• 36,200 births moved from 37-38 to 39-41 wks • Conservative estimate = 3% fewer “near term”
NICU admissions: N = 1086 • 1086 x $20,000 per NICU Admission $ 21,720 million savings in 5 years
OPQC Is A Voluntary Organization of Ohio
Stakeholders Who Care About Fetal & Infant Health
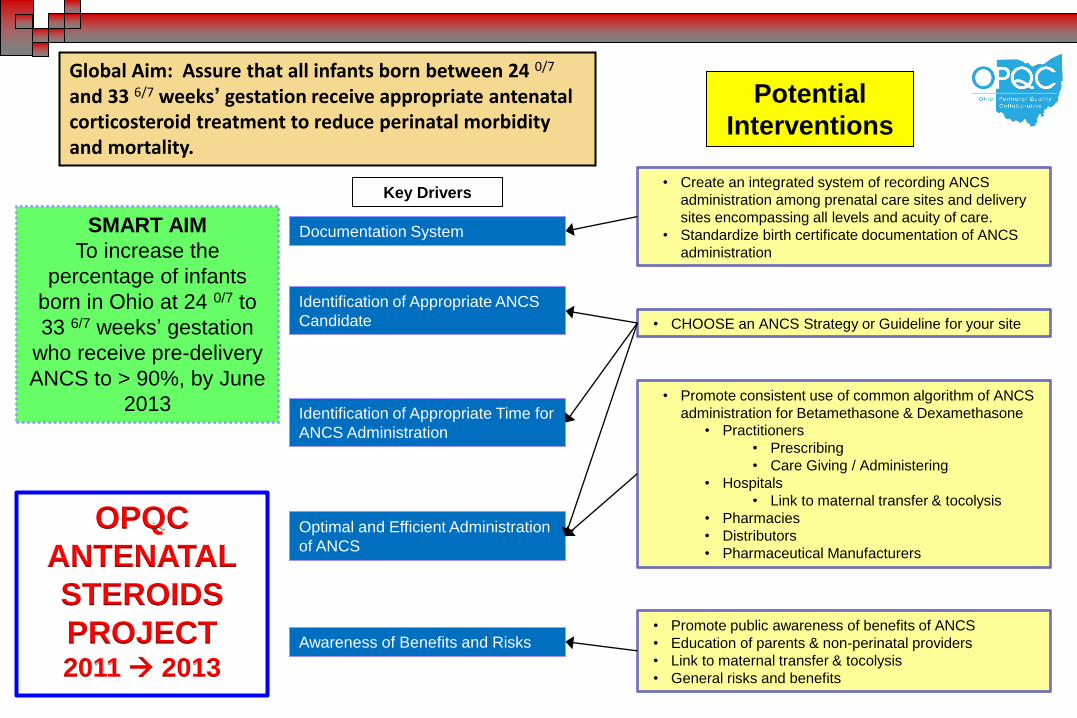
SMART AIM
To increase the
percentage of infants
born in Ohio at 24 0/7 to
33 6/7 weeks’ gestation
who receive pre-delivery
ANCS to > 90%, by June
2013
Global Aim: Assure that all infants born between 24 0/7 and 33 6/7 weeks’ gestation receive appropriate antenatal corticosteroid treatment to reduce perinatal morbidity and mortality.
Key Drivers
Documentation System
Identification of Appropriate Time for
ANCS Administration
Optimal and Efficient Administration
of ANCS
Awareness of Benefits and Risks
Potential
Interventions
Identification of Appropriate ANCS
Candidate
• Promote public awareness of benefits of ANCS
• Education of parents & non-perinatal providers
• Link to maternal transfer & tocolysis
• General risks and benefits
• Promote consistent use of common algorithm of ANCS
administration for Betamethasone & Dexamethasone
• Practitioners
• Prescribing
• Care Giving / Administering
• Hospitals
• Link to maternal transfer & tocolysis
• Pharmacies
• Distributors
• Pharmaceutical Manufacturers
• CHOOSE an ANCS Strategy or Guideline for your site
• Create an integrated system of recording ANCS
administration among prenatal care sites and delivery
sites encompassing all levels and acuity of care.
• Standardize birth certificate documentation of ANCS
administration
OPQC
ANTENATAL
STEROIDS
PROJECT 2011 2013
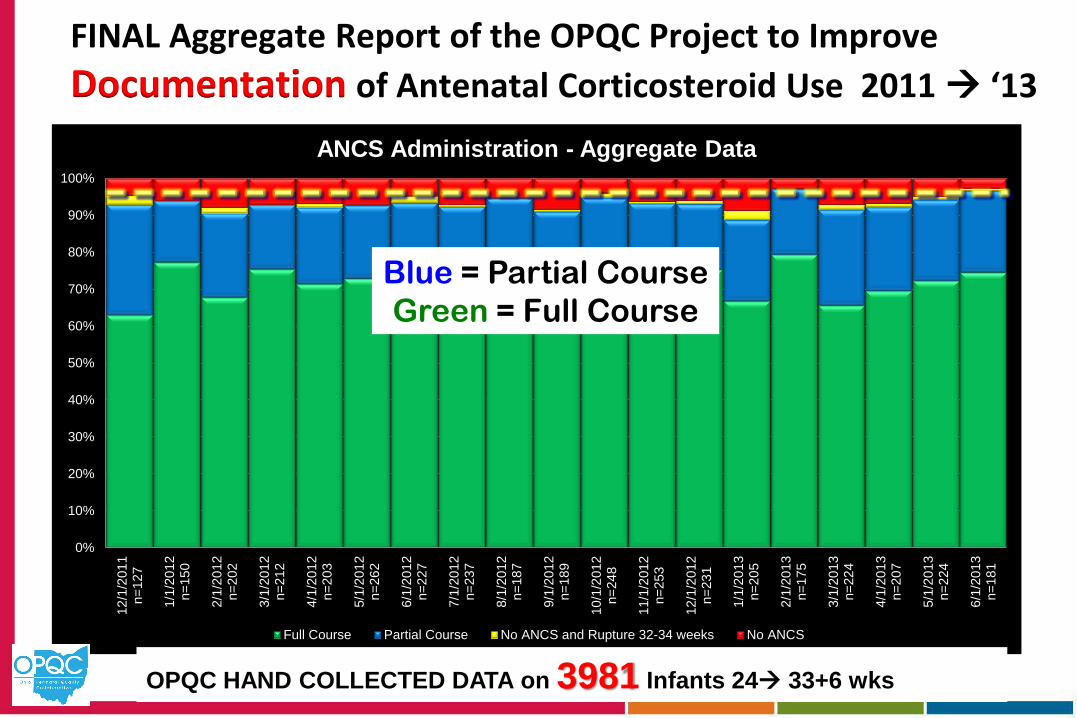
FINAL Aggregate Report of the OPQC Project to Improve
Documentation of Antenatal Corticosteroid Use 2011 ‘13
0%
10%
20%
30%
40%
50%
60%
70%
80%
90%
100%
12
/1/2
011
n=
12
7
1/1
/20
12
n=
15
0
2/1
/20
12
n=
20
2
3/1
/20
12
n=
21
2
4/1
/20
12
n=
20
3
5/1
/20
12
n=
26
2
6/1
/20
12
n=
22
7
7/1
/20
12
n=
23
7
8/1
/20
12
n=
18
7
9/1
/20
12
n=
18
9
10
/1/2
012
n=
24
8
11
/1/2
012
n=
25
3
12
/1/2
012
n=
23
1
1/1
/20
13
n=
20
5
2/1
/20
13
n=
17
5
3/1
/20
13
n=
22
4
4/1
/20
13
n=
20
7
5/1
/20
13
n=
22
4
6/1
/20
13
n=
18
1
ANCS Administration - Aggregate Data
Full Course Partial Course No ANCS and Rupture 32-34 weeks No ANCS
OPQC HAND COLLECTED DATA on 3981 Infants 24 33+6 wks
Blue = Partial Course
Green = Full Course
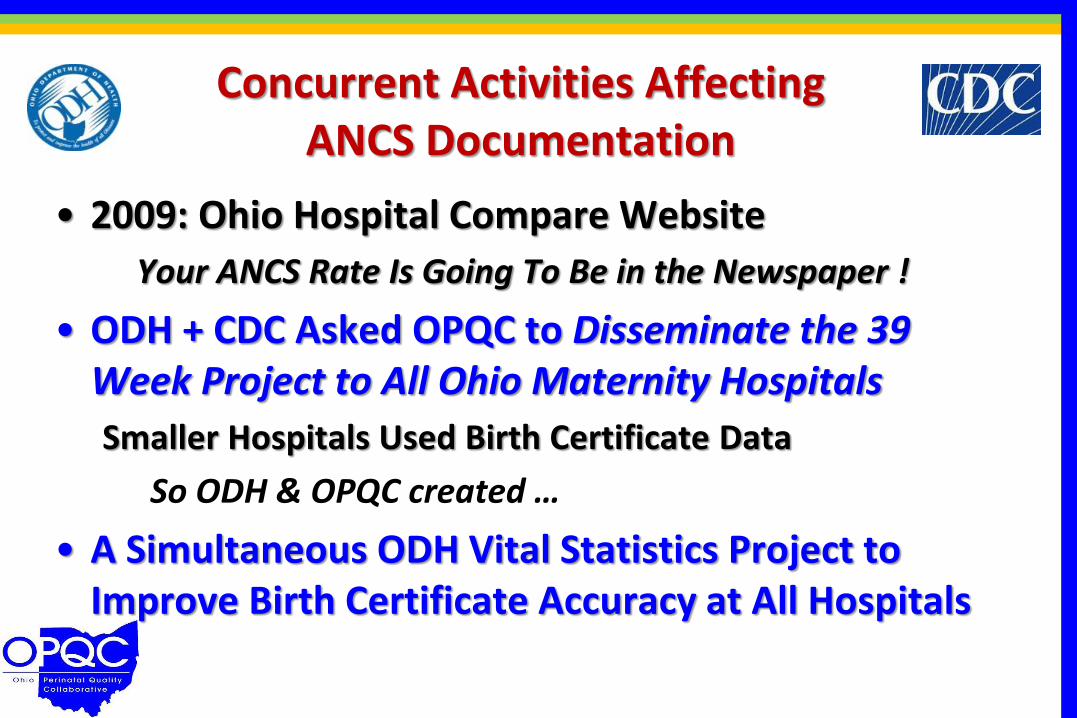
Concurrent Activities Affecting ANCS Documentation
• 2009: Ohio Hospital Compare Website
Your ANCS Rate Is Going To Be in the Newspaper !
• ODH + CDC Asked OPQC to Disseminate the 39 Week Project to All Ohio Maternity Hospitals
Smaller Hospitals Used Birth Certificate Data
So ODH & OPQC created …
• A Simultaneous ODH Vital Statistics Project to Improve Birth Certificate Accuracy at All Hospitals
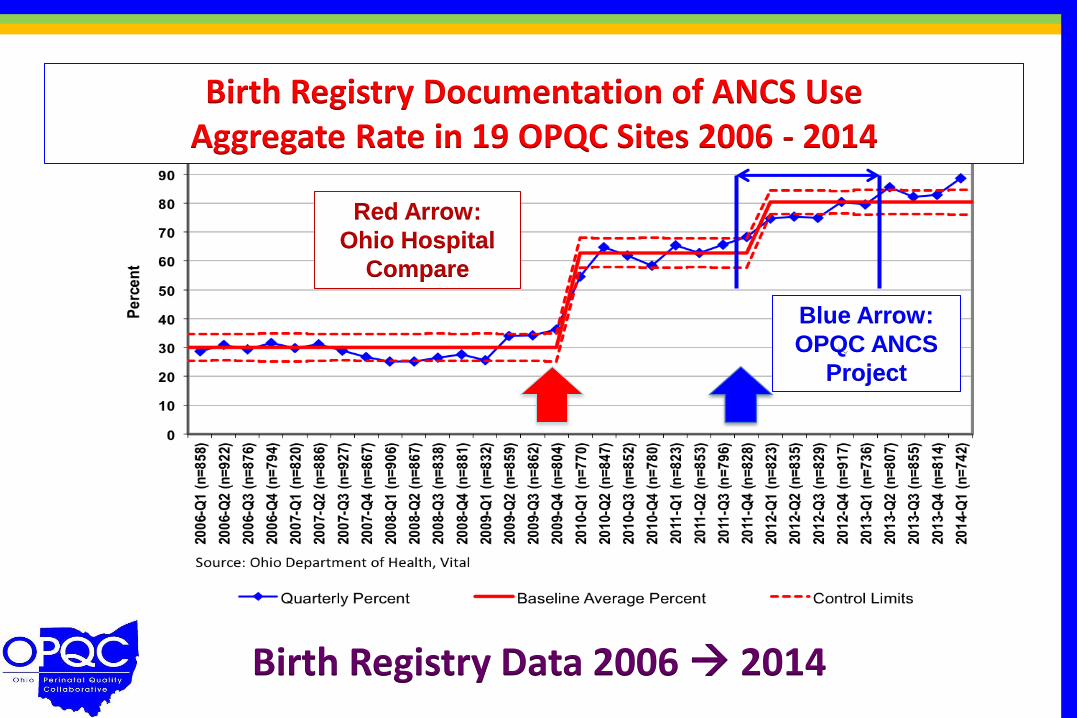
Birth Registry Documentation of ANCS Use Aggregate Rate in 19 OPQC Sites 2006 - 2014
Birth Registry Data 2006 2014
Red Arrow:
Ohio Hospital
Compare
Blue Arrow:
OPQC ANCS
Project
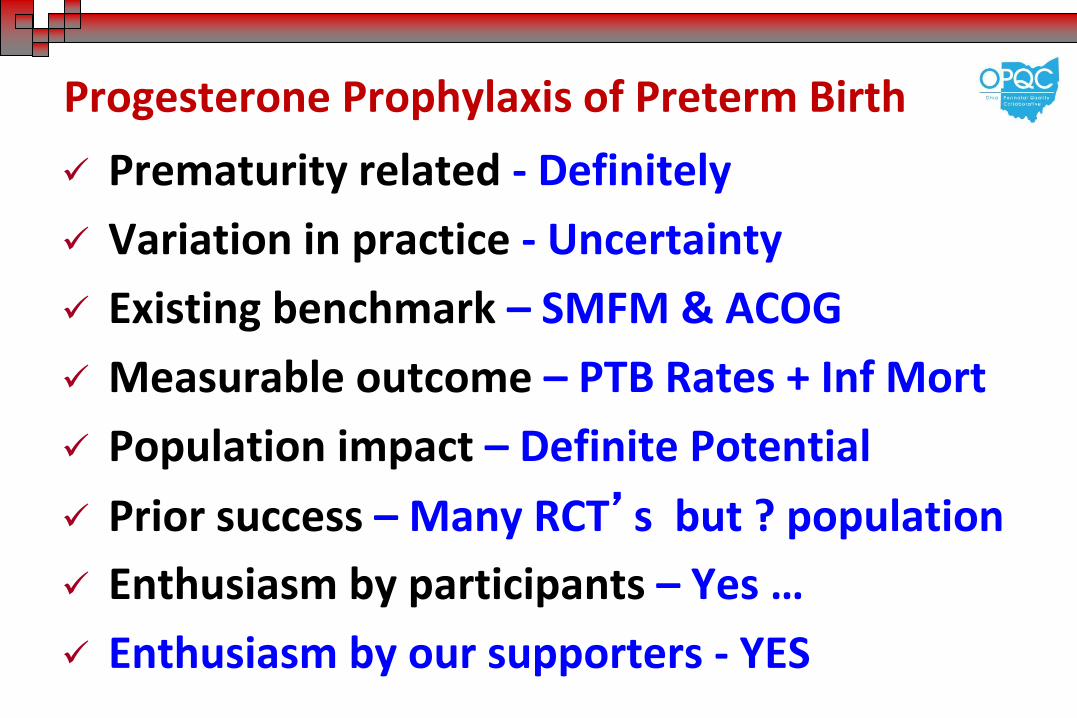
Progesterone Prophylaxis of Preterm Birth
Prematurity related - Definitely
Variation in practice - Uncertainty
Existing benchmark – SMFM & ACOG
Measurable outcome – PTB Rates + Inf Mort
Population impact – Definite Potential
Prior success – Many RCT’s but ? population
Enthusiasm by participants – Yes …
Enthusiasm by our supporters - YES
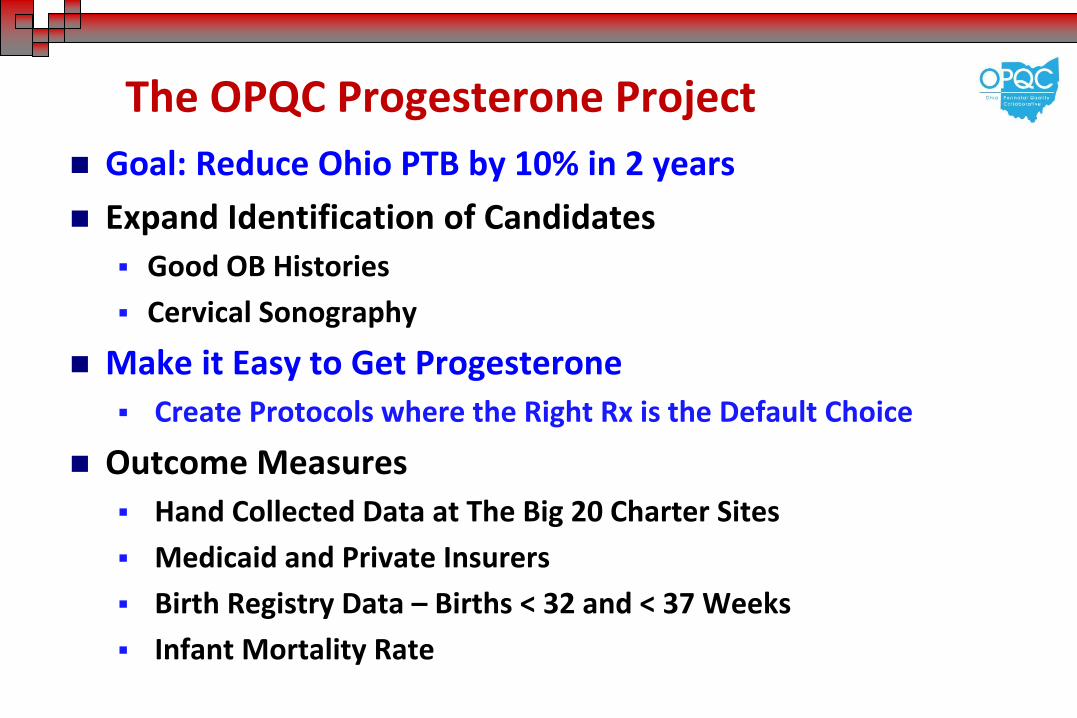
The OPQC Progesterone Project
Goal: Reduce Ohio PTB by 10% in 2 years
Expand Identification of Candidates
Good OB Histories
Cervical Sonography
Make it Easy to Get Progesterone
Create Protocols where the Right Rx is the Default Choice
Outcome Measures
Hand Collected Data at The Big 20 Charter Sites
Medicaid and Private Insurers
Birth Registry Data – Births < 32 and < 37 Weeks
Infant Mortality Rate
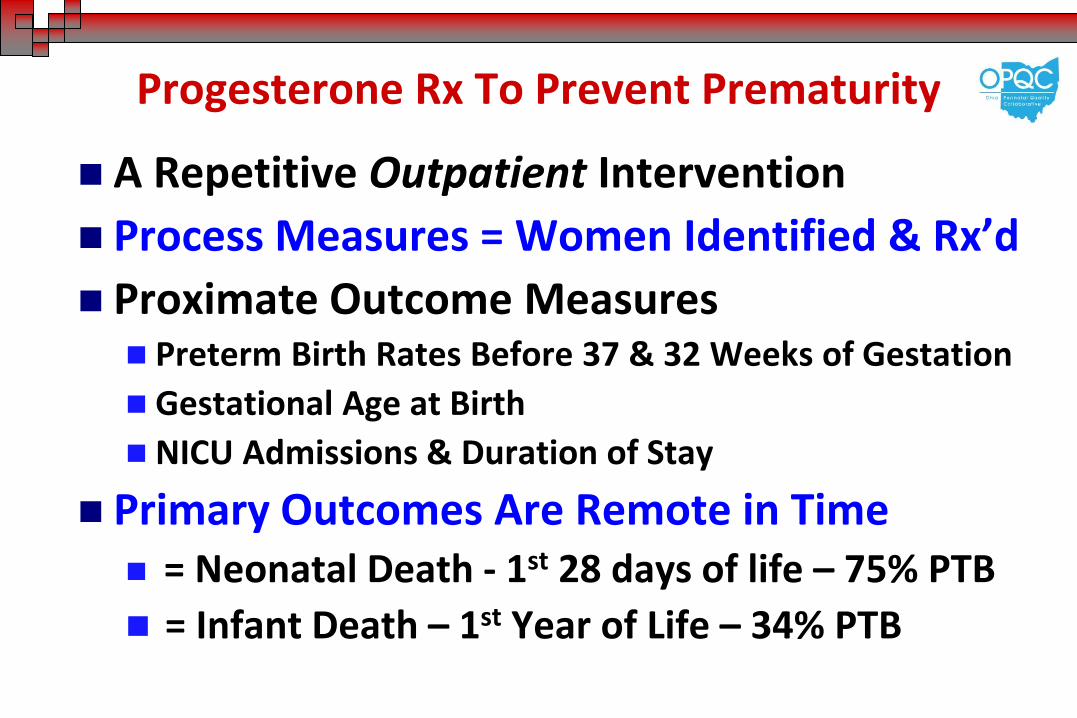
Progesterone Rx To Prevent Prematurity
A Repetitive Outpatient Intervention
Process Measures = Women Identified & Rx’d
Proximate Outcome Measures Preterm Birth Rates Before 37 & 32 Weeks of Gestation
Gestational Age at Birth
NICU Admissions & Duration of Stay
Primary Outcomes Are Remote in Time = Neonatal Death - 1st 28 days of life – 75% PTB
= Infant Death – 1st Year of Life – 34% PTB
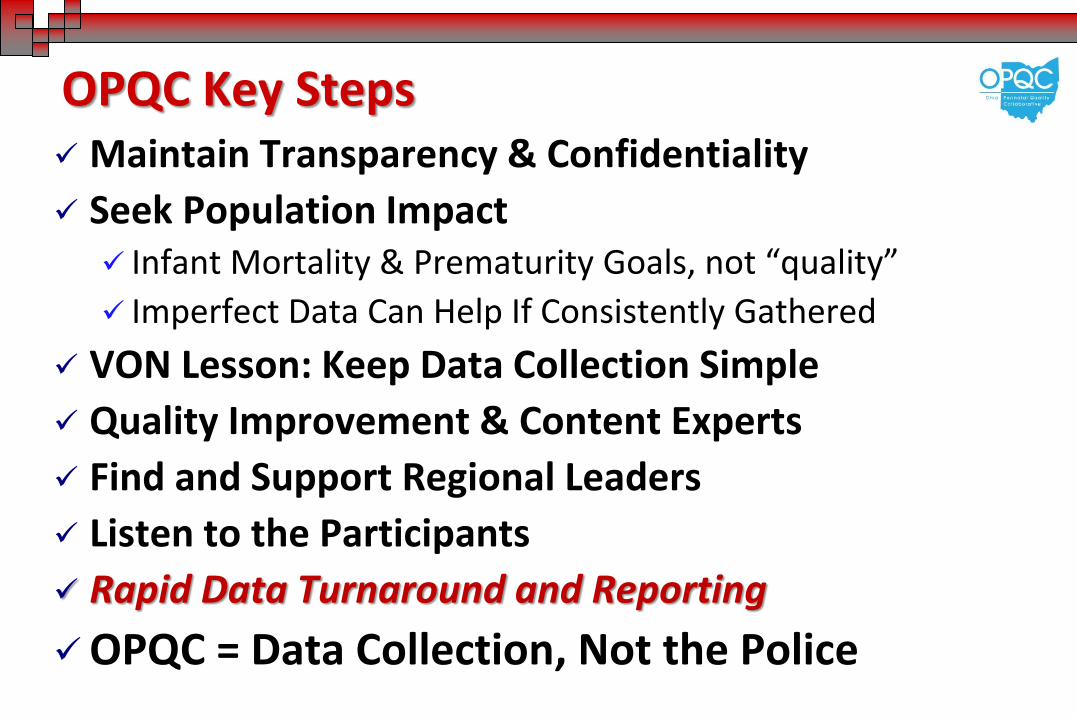
OPQC Key Steps Maintain Transparency & Confidentiality
Seek Population Impact Infant Mortality & Prematurity Goals, not “quality”
Imperfect Data Can Help If Consistently Gathered
VON Lesson: Keep Data Collection Simple
Quality Improvement & Content Experts
Find and Support Regional Leaders
Listen to the Participants
Rapid Data Turnaround and Reporting
OPQC = Data Collection, Not the Police
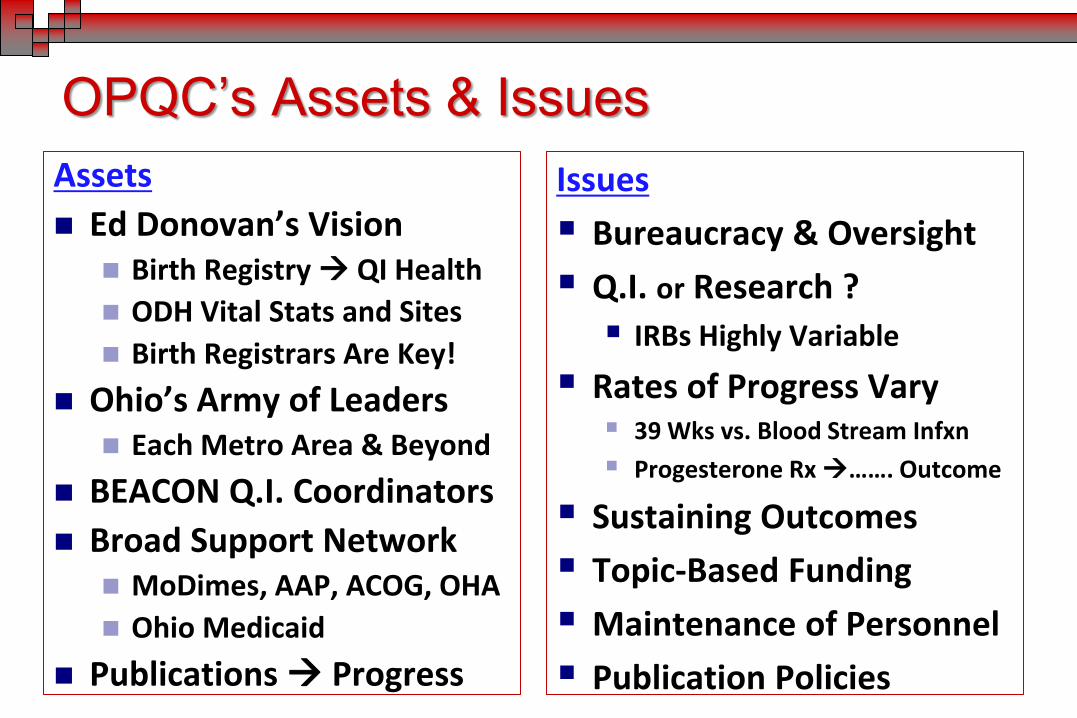
OPQC’s Assets & Issues
Assets
Ed Donovan’s Vision Birth Registry QI Health
ODH Vital Stats and Sites
Birth Registrars Are Key!
Ohio’s Army of Leaders Each Metro Area & Beyond
BEACON Q.I. Coordinators
Broad Support Network MoDimes, AAP, ACOG, OHA
Ohio Medicaid
Publications Progress
Issues
Bureaucracy & Oversight
Q.I. or Research ?
IRBs Highly Variable
Rates of Progress Vary 39 Wks vs. Blood Stream Infxn
Progesterone Rx ……. Outcome
Sustaining Outcomes
Topic-Based Funding
Maintenance of Personnel
Publication Policies
The Ohio Perinatal Quality Collaborative 2014
OBSTETRICS
ANCS for women at risk for preterm
birth (240/7- 336/7)
39-Week Scheduled Deliveries
without medical indication
Increase Birth Data Accuracy
& Online modules
Spread to all maternity
hospitals in Ohio
Progesterone for Preterm Birth Risk
NEONATAL
Blood Stream Infection
Highly reliable line maintenance
bundle
Neonatal Abstinence Syndrome
Use of human milk
in infants 22-29 weeks GA
6 OCHA Pilot NAS


![Prevention of Perinatal Group B Streptococcal Disease...Prevention of perinatal group B streptococcal disease: revised guidelines from CDC. MMWR 2002;51[No. RR-11]). MMWR 2002;51[No](https://img.pdfslide.us/doc/110x75/5f42e3ddef027a47746d60b7/prevention-of-perinatal-group-b-streptococcal-prevention-of-perinatal-group.jpg)