Embed Size (px)
Citation preview

1
Assisted by:
Report on
January, 2011
Raipur

2
Contents
1. INTRODUCTION AND BACKGROUND ............................................................................. 1
2. STATE’S POLICY ON EDUCATION ................................................................................... 6
3. DIFFERENT SCHEMES IN EDUCATION PROGRAM OF THE STATE .................................... 15
4. ANALYSIS OF BUDGET ALLOCATION AND COMPONENTS IN THE PAST .......................... 20
5. CONSIDERATIONS FOR MTEF AND PROJECTIONS OF ADDITIONAL EXPENDITURE ......... 28
6. MTEF PROJECTIONS AND RESOURCE REQUIREMENTS ................................................. 35
7. SUGGESTIONS FOR SECTOR REFORM AND DATA FOR BETTER PROJECTIONS ................ 44

3
LIST OF TABLES
TABLE 1 : Number of Schools under different management in Chhattisgarh .................................. 3
TABLE 2 : Overall dropout rate at primary level ................................................................................... 3
TABLE 3 : Dropout rates among Schedule Caste Students at Primary level .................................. 4
TABLE 4 : Dropout rates at Upper primary level .................................................................................. 4
TABLE 5 : Eligible Student population and Enrolment ........................................................................ 5
TABLE 6 : Revenue Expenditure on Education (Percentage) .......................................................... 23
TABLE 7 : Capital Expenditure on Education (Percentage) ............................................................. 24
TABLE 8 : Percentage of Revenue and Capital Expenditure of Expenditure on Education ........ 24
TABLE 9 : Component wise expenditure as a percentage of Total Expenditure on General
Education Year wise ............................................................................................................................ 26
TABLE 10 : Projection of Enrolment of Children ................................................................................. 29
TABLE 11 : Projected Students enrolment and students’ enrolment in Government Schools .... 30
TABLE 12 : Number of Government Schools ..................................................................................... 31
TABLE 13 : Requirement of Teachers as per norms and estimated gap ....................................... 32
TABLE 14 : Projected positions of teachers and student teacher ratio ........................................... 33
TABLE 15 : Schools requiring different infrastructure ........................................................................ 34
TABLE 16 : School Education Expenditure in the State of Chhattisgarh ........................................ 37
TABLE 17 : Scenarios of growth in Expenditure on school education in Chhattisgarh ................ 38
TABLE 18 : Projected Scenarios of Expenditure on School Education as percentage of Total
Government Expenditure in Chhattisgarh ........................................................................................ 38
TABLE 19 : Projected Scenarios of Expenditure on School Education as a percentage of GSDP
in Chhattisgarh ..................................................................................................................................... 39
TABLE 20 : Resource Envelopes for School Education .................................................................... 39
TABLE 21 : Projection of different components of expenditure on School Education .................. 40
TABLE 22 : Projection of Plan, Non-Plan and Central Share of expenditure on School Education
in Chhattisgarh ..................................................................................................................................... 41
TABLE 23 : Projection of additional teacher requirement ................................................................. 41
TABLE 24 : Additional Resource Requirements ................................................................................ 42
TABLE 25 : Increase in Enrolment ....................................................................................................... 42
TABLE 26 : Additional Resource requirements for Mid-day Meals .................................................. 42
TABLE 27 : Additional Requirements for Capital Expenditure ......................................................... 43
TABLE 28 : Resource Requirement after adjusting for additional Requirements .......................... 44

4
LIST OF ACRONYMS
ARSE Annual Report of the Department of School Education
BE Budget Estimate
CS Central Schemes
CSS Centrally Sponsored Schemes
DIET District Institute for Education training
DPI Department of Public Instruction
EC-SPP European Commission State Partnership Programme
GER Gross Enrolment Ratio
GSDP Gross State Domestic Product
INR Indian Rupees
KGVB Kasturba Gandhi Balika Vidyalaya
MTEF Medium Term Expenditure Framework
NPEGEL National Program of Education of Girls at Elementary Level
PHED Public Health Engineering Department
RE Revised estimate
RGI Registrar General of India
RGSM Rajiv Gandhi Siksha Mission
SBSE State Board for Secondary Education
SC Schedule Caste
SCERT State Council for Education Research and Training
SSA Sarva Siksha Abigyan
ST Schedule Tribe

5
EXECUTIVE SUMMARY
Chhattisgarh is a recently formed state, carved out from the erstwhile state of
Madhya Pradesh. The state government has been making efforts to reduce poverty
and improve human development. Efforts towards the same have been constrained
by the lack of systematic planning and budgeting based on a robust Medium Term
Fiscal Framework (MTFF) and Medium Term Expenditure Framework (MTEF).
European Commission State partnership Program (EC-SPP) has been supporting
Chhattisgarh Government through providing budget support especially in the areas of
education, Health, minor forest Produce and decentralization of development
activities. The purpose of providing Technical Assistance (TA) in the preparation of
MTEF is to strengthen linkages between policy, planning and budgeting to allow for
more effective use of public resources. Though significant progress has been made
to improve literacy in the state there are still areas where significant progress has to
be made especially in the areas of reducing drop out rates, bringing student teacher
ratio to the desired levels, increasing the availability of schools and in improving the
quality of education.
School Education in Chhattisgarh is handled mainly by two departments namely the
Department of Education and the Department of Tribal Welfare. The Department of
School Education works with the State Council for Education Research and Training
(SCERT) that is responsible for the development of curricula and also the
development and recommendation of text books to be adopted by the educational
institutions. The District Institute for Educational Training (DIET) is responsible for
training of Teachers. The State Board for Secondary Education is responsible for
secondary education and examinations in the state.
Department of School Education is responsible for training of teachers, curricula
development, development of text-books, standards of instructions, evaluation,
examination and certification and research in the area of primary, upper primary and
secondary education. It is responsible for the development of policy, strategy, setting
goals, and programmes for implementation. It also manages government schools
and oversees the performance of schools supported by government funds.
The purpose of developing MTEF is to estimate the financial requirements for a
particular Department/sector of the government for a period of 3-5 years in the future.
The MTEF not only provides the requirement of resources but also examines the
feasibility of availability of resources by comparing the requirements with past

6
allocations, overall government expenditure, economic growth of the state and the
overall revenue generation.
MTEF has the feature of linking up the goals set out in the national and state policies
and examines the requirement of resources required to achieve the goals within the
time frame set out. It examines the current status of the indicators as set out in the
policies and calculates the gap and examines the possibility of attaining the goals
and the constraints that are impacting the achievement of the goals.
The process of developing MTEF has been carried out in close coordination and
discussion with the Department of School Education and targets in terms of
enrolment, provision of infrastructure, the training and recruitment of teachers for
filling the existing gaps have been arrived at through these interactions. These have
been taken into account in the preparation of MTEF. The methodology for developing
MTEF is provided in the flow chart below:
Department MTEF
Building Blocks
Analysis of past
trends in allocation
And utilization
Policy Governing
Department
Functions
Assessment of
Current gaps and
future needs
Resource
Envelopes
Arrive at possible
Scenarios to meet
Current needs
Additional Resource
Implication to fulfill short/
Medium/long term
Targets/goals
Phasing of filling up HR
And infrastructure gaps
& resource implication
Likely scenario for business
As usual
Estimation of additional
Resource requirement
Estimation of additional
Resource requirement
Iterative Exercise to
arrive at MTEF
Expenditure on primary, upper primary and secondary education has been steadily
increasing since the formation of the State, except in the year 2004-05, when it was
less than the previous year. It has fluctuated between 14 to 16 percent of the total
budgetary expenditure. The plan allocations have been very high especially during
the last few years reflected in the year-on-year growth in the allocations.

7
State’s resources in the education sector are derived from the allocations of the
state, EC-SPP resources which have a component of education and allocation from
the Central Government on account of the centrally Sponsored Schemes and Central
Government schemes.
The plan part of the revenue expenditure has been showing an increasing trend and
the share of the plan and non-plan expenditure has almost become equal. The
central assistance has also increased considerably especially in the later years and
has almost an equal share as that of plan and non-plan expenditure.
The capital expenditure by its very nature will fall entirely in the plan category. The
share of the central government on capital account has been fluctuating in the earlier
years but has increased steadily to form a significant share in the capital expenditure
of the state.
The components of expenditure clearly indicate that salaries form a significant part of
overall expenditure in elementary as well as secondary education. Elementary
education accounts for 70-72 percent of the overall expenditure while secondary
education accounts for about 20 percent of the expenditure. The other 8 percent is
accounted for by adult education, language development, general education, youth
and sports activities, art and culture development and capital expenditure.
The State of Chhattisgarh formulated and adopted a comprehensive policy on
education providing for all round development of the personality of the student
population. The school education in the state is governed by the state policy.
Universal access to primary education is the first step towards universal access to
upper primary education. Unless this is achieved, universal access to upper primary
education, the target of achieving this by 2010, will not be possible. The State is far
behind the realisation of this goal, in the age group of 6-11 which is identified as the
group for primary education. According to 2001 census, Chhattisgarh had a
population of around 4.7 million in the age group of 6-14. Of these almost half the
population was female. The ST component of the population was 1.52 million with
0.75 million girls. The SC population was 0.58 million with around 0.28 million girls.
The state has taken a number of initiatives towards universal access of primary
education by way of incentives, and meeting the cost, which would normally be met
by the parents of children going to the primary schools. These have financial
implications, and if these have to be met by the State exchequer, it will require
enhancement of budget and reordering of priorities.

8
From the analysis of the policy the following have been taken into account for
preparation of MTEF:
Increasing enrolment of students and increasing retention at each level to
achieve near universal primary education by steadily increasing enrolment as
considered feasible
Provision of mid-day meals to increase retention and provide nutrition
Provision of free text books and incentives especially for girl students from
disadvantaged sections of the population
Phasing of recruitment of teachers over the next three years to achieve the
desired student teacher ratio in each level
Provision of infrastructure to schools in terms of class rooms, building and
other facilities over the next three years
Based on the past trends and allocations the year on year growth rate has been
estimated. The scenario of allocation in the future has been based on the above
trendsand projected for the next three years. The different scenarios have been
analyzed for their feasibility through the following criteria:
The representative nature as a percentage of the overall state budgetary
expenditure allocation
Its representative nature as a percentage of the state’s Gross Domestic
Product
Its proximity to allocations in the recent past.

9
Based on the above it has been derived that the growth scenario of 25 percent every
year over the preceding year would be most appropriate. This has been used to
arrive at the projection of overall resource envelope and then breaking it down to the
details required for budgetary allocations. The estimated requirements are as follows:
(INR 00000)
Year Total Projected resource Envelope for education (Revenue)
Plan Non-Plan Central Share
2011-12 406041 122043 168892 115106
2012-13 505421 151966 209426 144029
2013-14 626986 188651 259688 178647
Total Projected resource envelope for education (Capital)
Plan Non-Plan Central Share
2011-12 66656 63016 0 3640
2012-13 74058 69544 0 4514
2013-14 80640 75043 0 5597

1
1. INTRODUCTION AND BACKGROUND
1.1. Background
School Education in Chhattisgarh is handled mainly by two departments namely the
Department of Education and the Department of Tribal Welfare. The Department of
School Education works with the State Council for Education Research and Training
(SCERT) that is responsible for the development of curricula and also the
development and recommendation of text books to be adopted by the educational
institutions. The District Institute for Educational Training (DIET) is responsible for
training of Teachers. The State Board for Secondary Education is responsible for
secondary education and examinations in the State.
Department of School Education is responsible for training of teachers, curricula
development, development of text-books, standards of instructions, evaluation,
examination and certification and research in the area of primary, upper primary and
secondary education. It is responsible for the development of policy, strategy, setting
goals, and programmes for implementation. It also manages government schools
and oversees the performance of schools supported by government funds.
The Rajiv Gandhi Siksha Mission (RGSM) is responsible for implementing the Sarva
Siksha Abigyan (SSA) the universal access to primary education. Under this scheme
of the central government the RGSM works closely with the Department of Public
Instruction. This scheme opens schools where required and also appoints Siksha
Karmis (teachers) as necessary.
Similar scheme for the universal access to upper primary education is known as the
Rashtriya Madhyamik Siksha Abigyan. This is being implemented by a separate
structure.
Chhattisgarh Board of Secondary Education is responsible for secondary education
in the state and conducts examination at the secondary level.
Chhattisgarh Text Book Corporation is responsible for publication of text books and
its distribution in the state.
Department of Tribal Welfare has the responsibility for management of schools
established and funded under its budget for the tribal areas of the State.

2
The school education can be divided into elementary education consisting of primary,
upper primary (Classes I-VIII), high school consisting of class IX & X and higher
secondary education consisting of classes XI and XII.
A number of departments are responsible for education in the State of Chhattisgarh,
especially at the level of professionally oriented higher education. Department of
Higher Education is responsible for non professional higher education and
management of universities, other than those excluded by assignment of jurisdiction
to another department. Higher education in the domain of agriculture, veterinary,
medicine, nursing, and engineering is the responsibility of respective functional
departments.
Responsibility for allocations and expenditure is divided within the government, as
each head of Grants is managed by a different department, which may not be
responsible for the implementation of the state and national policy on elementary and
secondary education. The budget of school education department provides for
expenditure on management of government run and assisted schools and their
expansion, training of teachers, research and other related areas; the budget
allocated to Department of Tribal Welfare is for the management of government
schools, which include residential schools.

3
1.2. Education in Chhattisgarh
Chhattisgarh is a newly formed state carved out from erstwhile Madhya Pradesh and
has come into existence from 1st Nov 2000. The enrolment and number of schools
have grown over time but is yet to reach closer to the target of elementary education
to all.
The number of schools in Chhattisgarh as at end of 2009-10 under different
managements is provided below in Table 1:
TABLE 1 : Number of Schools under different management in Chhattisgarh
Standard
Education
Tribal SSA EDN Granted
Tribal Granted
Madarsas
Private
Community Participated
Total
Primary 12869 11394 9277 178 65 208 2741 0 36732
Upper Primary
3341 2837 7525 57 41 21 1926 0 15748
High School
718 463 0 0 10 0 733 284 2208
Higher Secondary
845 546 0 78 20 20 1007 128 2644
17773 15240 16802 313 136 249 6407 412 57332
Source: Annual reports of the Department 2009-10
1.3. Dropout from system
The dropout rate in primary education over the three years is provided in Table 2
TABLE 2 : Overall dropout rate at primary level
Year Total
M F T
2006-07 11.92 11.34 11.65
2007-08 7.53 8.47 7.99
2008-09 10.54 11.61 11.05
Source: Annual Report of the Department, 08-09, 07-08 & 06-07

4
The dropout rates are significant in the schedule caste and schedule tribes and it is
observed that these are significantly higher. In 2007-08 the dropout rates are lower
because the dropout rates in the schedule caste and schedule tribe are almost the
same as that of the other regular students. Table 3 provides the dropout rates at the
primary level among schedule caste and schedule tribe students.
TABLE 3 : Dropout rates among Schedule Caste Students at Primary level
(Percent)
Year SC ST
M F T M F T
2006-07 21.49 24.08 22.78 31.44 31.83 31.63
2007-08 6.58 8.19 7.36 9.89 10.94 10.4
2008-09 18.96 29.68 24.18 7 14.35 10.44
Source: Annual Report of the Department, 08-09, 07-08 & 06-07
The dropout rates in upper primary level is provided in Table 4
TABLE 4 : Dropout rates at Upper primary level (Percent)
Upper Primary
Total SC ST
M F T M F T M F T
2006-07 9.31 5.09 7.45 15.13 10.34 13.03 20.93 20.97 20.94
2007-08 6.38 7.41 6.88 6.33 8.07 7.22 7.88 8.71 8.26
2008-09 10.14 5.00 7.12 11.48 13.95 12.60 3.00 30.00 13.00
Source: Annual Report of the Department, 08-09, 07-08 & 06-07
The significant contribution to the dropout rates is again from the scheduled caste
and scheduled tribe student population at the upper primary levels. Hence, if the
state has to reduce the overall rates of dropout at different levels of primary
education then the drive needs to be among the SC/ST student population through
special drives. The Department of tribal Welfare also needs to act towards reducing
the dropout rates.
The following Table 5 provides the eligible student population and enrolment of
students in different classes. The eligible student population has been calculated

5
from the projection of population in different years from the Registrar General of
India, census population projection for different states. The enrolment has been
taken from the statistics of enrolment in the year 2009-10 in different classes
available with the Department of Education.
TABLE 5 : Eligible Student population and Enrolment
Class
Eligible
student
population
Enrolment in
respective
classes
Enrolment percent
I 717870 758611 105.68
II 708000 672255 94.95
III 698070 645892 92.53
IV 688020 609135 88.53
V 677820 549017 81
VI 667530 489456 73.32
VII 657120 441785 67.23
VIII 646590 405715 62.75
IX 635910 286115 44.99
X 625020 250896 40.14
XI 618750 161075 26.03
XII 612570 141921 23.17
The enrolment in Class 1 is more than 100percent as the enrolment from
other age group also takes place.
Source: Population eligible for enrolment from RGI Projections & Enrolment from
Statistics Maintained by DPI
It can be observed that the enrolment of the eligible population is more than
90percent in class’s I-III while it drops significantly in the other levels of primary and
upper primary classes. There is significant drop in the movement of students from
upper primary to high school education. This drop is due to the following reasons:
Dropout because of the board Exam being conducted at Class VIII
Non-availability of separate school for girls at the high school level

6
Considering this dropout rate the government has decided to discontinue the
conducting of board exams at the level of Standard VIII. Further, the government is
also contemplating to build additional class rooms in the existing upper primary
schools in order to encourage girl students to continue their education. These steps
are expected to reduce the dropout rates at this level.
1.4 Expenditure on School Education
Expenditure on primary, upper primary and secondary education has been steadily
increasing since the formation of the State, except in the year 2004-05, when it was
less than the previous year. It has fluctuated between 14 to 16 percent of the total
budgetary expenditure. The plan allocations have been very high especially during
the last few years reflected in the year-on-year growth in the allocations. A significant
aspect of the budgetary allocation has been the recognition of the needs of school
education on capital account.
2. STATE’S POLICY ON EDUCATION The State of Chhattisgarh formulated and adopted a comprehensive policy on
education providing for all round development of the personality of the student
population. The main features of this policy relating to school education sector can be
stated as follows:
1. Free and compulsory education for children in the age group of 6 to 14.
2. Education for all without discrimination between different communities and
gender.
3. Uniformity in primary education.
4. Development of community games.
5. Universal access to education to be made effective.
6. Providing access to education to children deprived of education facilities.
7. Construction of ashram schools in colonies where workers/labour reside.
8. Improving the implementation of mid-day meal and nutrition programmes.
9. Ensuring enrolment of students.
10. Spreading consciousness about education among the guardians.

7
The policy document indicates the action that would be required to be taken for the
implementation of the policy. Some of the points listed for action have financial
implications, the full impact need to be worked out to fix priorities for action.
2.1 Universal access to Primary and Upper Primary Education
Universal access to primary education is the first step towards universal access to
upper primary education. Unless this is achieved, universal access to upper primary
education, the target of achieving this by 2010, will not be possible. The State is far
behind the realisation of this goal, in the age group of 6-11 which is identified as the
group for primary education. According to 2001 census, Chhattisgarh had a
population of around 4.7 million in the age group of 6-14. Of these almost half the
population was female. The ST component of the population was 1.52 million with
0.75 million girls. The SC population was 0.58 million with around 0.28 million girls.
The state has taken a number of initiatives towards universal access of primary
education by way of incentives, and meeting the cost, which would normally be met
by the parents of children going to the primary schools. These have financial
implications, and if these have to be met by the State exchequer, it will require
enhancement of budget and reordering of priorities.
The State, in its education policy, has set the goal of universal access to upper
primary education by the year 2010. The present level of enrolment (2008-09) in
class VI is 0.516 million. This has to be seen in the context of the student population
in the age group of 11 to 14. This would mean additional enrolment at class VI level
by at least another 20 percent. If one looks to the enrolment figures of class I for the
last three years, and the decline in numbers in each class in subsequent year, and if
this is arrested, there would be need to create facilities for the upper primary level by
at least 60 percent, as also for each class after class I in an appropriate manner.
Apart from the provision of teachers, school space and teaching learning manner,
there will be need for provision of funds for other support given to children.
The areas requiring attention are stated below:
a. Enrolment of students
A significant point to note is that the figures of enrolment of children at the primary
level is gradually coming down while it should be the other way around. Children
in the age group of 6-11 were around 3 million in the year 2001. Going by the
normal rate of growth as reported in the 2001 census for the State, there would be
8
around 3.5 to 3.6 million children in this group who should be in the primary
school. The system will have to provide for the schooling of children who are still
out of the school, as well as the annual addition. This would require a provision in
the budget for opening of new schools, or providing additional teachers to teach
the new entrants every year.
b. Dropout Rate
Dropout rate has been fluctuating. From a little over 11 per cent in 2006-07, it
came down to a little over 7 per cent in 2007-08 and then again crossed the figure
of 11 per cent. What is significant is that while the high figure reported for 2006-07
was on account of the high drop-out rate among the SC/ST. In 2008-09, it has
been due to SC which has been reported and also due to general category
candidates as the dropout among the tribal children is below the reported average.
But what is significant is that if these children remain in the primary schools, there
would be extra cost on various counts. The dropout rate at the upper primary level
has been hovering around 7 per cent.
c. Mid-day Meals
Mid-day meals are provided to children studying in primary and upper primary
schools in the State. The cost is shared between the Centre and the State. In the
case of primary schools, the cost of the mid-day meal per child is fixed at INR.
3.60 Per day; Centre provides INR.2.38 while State’s share is INR. 1.22 In the
case of upper primary school, the cost of the meal per child has been fixed at INR.
4.00 Per child; Centre provides INR. 3.02 While the state bears the remaining cost
of Rs.0.98 for which provision is made in the State budget. Budgetary provisions
are spread over different heads. In addition, the Centre also funds for the
construction of kitchens. The cost is shared between the centre and the state
governments. If the enrolment of students done at class I level is retained at
subsequent classes, as also at the upper primary level, budgetary support will
need to be enhanced by 60 to 70 per cent.
d. Free Supply of Books
Students of class I to VIII are provided books free of cost. In the year 2008-09,
3.244 million students were enrolled at the primary classes and 14.07 at upper
primary classes. In the same year, the provision for books was only INR. 320.4
million in the budget. The average cost of the books per candidate was INR 147

9
at the primary level, and INR 258 at the upper primary level. At this rate, provision
of INR 840 million should have been made in the budget. There is a provision for
supply of free school books to primary and upper primary students under the state
schemes, and the requirements over and above the state budget is met every
year from the SSA budget.
e. Free Supply of Uniforms
Girl students of class I to V belonging to the schedule caste and scheduled tribe
community are provided free school uniform. The total number of SC/ST students
enrolled at the primary level in 2008-09 is 1.471 million. The amount provided in
the state budget for uniforms was only INR 80 million. If the cost of uniform is
taken at INR 250 per student, the amount required would be around INR.370
million. And if the dropout level is reduced and the retention of the students getting
admission at class I level is maintained in the higher primary classes, funds
required will be much more.
f. Teacher –Student Ratio
There has been a wide fluctuation in the number of teachers during the last three
years resulting in the fluctuation in teacher-student ratio. Teacher-student ratio
came down from 1:50 in the primary schools and 1:43 in the upper primary
schools in 2006-07 to 1:38 and 1:30 respectively in 2007-08. It increased to 1:44
at the primary and 1:34 at the upper primary level in 2008-09, largely because of a
fall in the number of teachers at both levels. It may also be mentioned that number
of students enrolled at the primary and upper primary level has also gone down. If
the norms laid down at the national level are to be adhered to, more teachers
would be required. If the goal of universal access to primary and upper is to be
attained, and enrolment level of class I is maintained in higher classes, the
number of teachers required for teaching will have to be significantly increased
and provided for in the budget. The reason for this high ratio may be due to the
large number of promotions from the primary to the upper levels.
g. Teaching of English
The State Policy on Education states that the teaching of English language will be
made compulsory from class I. Arrangements will be made for content based
training for them. This would require teachers competent to teach English as a
language. Provision for training of existing teachers and recruitment of new

10
teachers capable of teaching English as a language will require budgetary
support. The number of ELTI and DCE are being increased with funds from the
Central Government.
h. Training of Teachers and Improvement in the Quality of Education
An important goal set by the State in its policy on education is to ensure uniformity
in standards of attainment level of children getting primary education through
different stream i.e. non-formal, education guarantee, and different types of
schools. The quality of education has to be up-graded at national level.
Improvement in the quality of education involves the induction of teachers who
have good and up to date knowledge of the subject and state of the art
pedagogical skills with capability to build rapport with the children. It would also
involve better teacher-student ration than what exists at present.
Training of teachers is another area for action highlighted in the State policy. Only
56 per cent of the teachers at the primary and upper primary level are trained.
Since schools have to be run and teaching has to be done, a programme needs to
be drawn up to send teachers for training in a phased manner. State has to
ensure that in future only trained candidates are appointed as teachers, and in
case it is not possible, appointed untrained persons are sent for training in a
phased manner. Training of teachers has to be provided for in the state budget in
accordance with a previously approved programme that ensures completion of the
process in a reasonable period of time. Currently 20 days of training to each
teacher is being provided under the state budget. Further, in house training is
being sought for.
Apart from training of untrained teachers, teachers have also to be sent for in-
house training to improve their pedagogical skills and up-date their knowledge of
the subject. Provision has to be made for this also to ensure that all teachers have
exposure after a certain interval of time. This would also require provision of funds
from the state budget. Under RMSA the training of teachers is being planned for.
Secondary Education
State Policy on Education provides for strengthening of the secondary education,
and improvement in its quality. At present (2008-09) only 29 per cent children
enrolled in class I and 47 per cent in class VI are able to reach up to the level of
class IX. It is still less at class XI level; only 15 per cent of those enrolled in class I,

11
24 percent of those enrolled VI, and 51 percent of those enrolled in class IX are
able to find a place at that level. With improvement in the retention at the primary
and upper primary level, and attainment of the target of universal access by 2010,
the number of students seeking admission at class IX and class XII will also go up
requiring opening of more schools every year. In any expenditure planning, this
aspect has to be kept in view, as it would be difficult for a student to find gainful
employment at 14+ ages when he/she leaves the upper primary system.
A number of areas have been identified for action; more important ones having
large financial implications are indicated below:
a. Training of Teachers
A large number of untrained teachers are teaching at the High School (27 per
cent) and Higher Secondary (33 percent) level in 2008-09. Provision has to be
made for training of these teachers in a phased manner. This has financial
implication and has to be provided for in the budget. The Rashtriya Madhayamik
Siksha Abigyan is planning for training teachers at the high school level.
b. Up-grading Skills in English, Mathematics and Science.
The State Policy on Education has listed the up-grading of the skills of the
teachers in Mathematics, English and Science by organizing programmes for in-
service training. This has financial implication has to be provided for in the
budget. Up-grading of the skills is important for improving the quality of
education and attaining national level standards.
c. Cycles for the High School ST students in Tribal Blocks
State Policy on Education provides for free distribution of cycles in tribal blocks
to tribal girls studying in high school. Cycles have to be provided to new entrants
every year at class IX. This has financial implication and has to be provided for in
the budget.
d. Vocalization of Education
State Policy for Education emphasises the need for employment oriented
secondary education. Vocational education related to forest produce, medicinal
plants, computer education, sewing, soap manufacturing, basket making,
agarbatti manufacturing have been specifically mentioned. The State has yet to

12
start work on the vocalisation of education. This will have financial implication
and has to be provided for in the budget.
e. Career Guidance and Counselling
Career guidance and counselling have been given importance in the State Policy
on Education. Students at the High School and Higher Secondary level need to
be suitably guided about job opportunities as well as assessment of their
aptitude for vocations and higher education. This is a specialised job and
requires specialists in the school who could be available for providing suitable
guidance. Teachers from the existing system have to be trained for this purpose,
who apart from normal teaching, could take up this responsibility. This has
financial implication.
State Policy on Education identifies a lot more areas for action in the school
education sector. These include strengthening of SCERT, setting up of SIEMAT,
constitution of Board of Secondary Education, scholarship for meritorious students,
sports facilities at the school level, adult education, library, up-grading of College of
Education, pre-primary education etc. All these have financial implications and
looking to the availability of resources, have to be provided for and prioritised.
Eleventh Five Year Plan and Elementary Education
The Eleventh Five Year Plan, at the national level, has laid down the following targets
for attainment:
a. Universal enrolment of 6-14 age group children including hard to reach
segment.
b. Substantial improvement in quality and standards with the ultimate objective
to achieve standards of Kendriya Vidyalayas (KVs) under the Central Board
of Secondary Education (CBSE) pattern.
c. All gender, social, and regional gaps in enrolments to be eliminated by 2011-
12.
d. One year pre-school education (PSE) for children entering primary school.
e. Dropout at the primary level to be eliminated and the dropout rate at the
elementary level to be reduced from over 50 per cent to 20 per cent by 2011-
12.

13
f. Universalised MDMS at elementary level by 2008-09.
g. Universal coverage of ICT at UPS by 2011-12.
h. Significant improvement in learning conditions with emphasis on learning
basic skills, verbal and quantitative.
i. All EGS centres to be converted into regular primary schools.
j. All States/UT to adopt NCERT Monitoring Tools.
State Policy on Education already contains some of the salient features of the targets
set for attainment during the Eleventh Five Year Plan.
Secondary Education and the Eleventh Five Year Plan
The targets for the secondary sector set in the national document on the Eleventh
Five Year Plan are stated below:
a. Raise the minimum levels of education to class X and universalize access to
secondary education.
b. Ensure good quality secondary education with focus on Science,
Mathematics and English.
c. Major reduction in gender, social and regional gaps in enrolments, dropouts,
and school retention.
d. Provide a secondary school within five km of every habitation.
e. Provide secondary school within 7-8 km of every habitation.
f. Gross enrolment ratio (GER) to increase from 52 per cent in 2004-05 to 75
per cent by 2011-12 at the secondary level.
g. The combined GER at the secondary and senior secondary level to increase
from 40 per cent to 65 per cent during the same period
State has to go a long way towards access to secondary and senior secondary
education both in terms of numbers and quality of education.
Availability of Schools
A primary school has to be available within a distance of 1 km and an upper primary
school has to be available within a distance of three km. to the children. In the case
14
of High School, the norm is 7-8 km. During the last two years, not many primary and
upper primary schools have been opened in the state. The State has been
concentrating in opening new High School and Higher Secondary Schools.
Sarva Shiksha Abhiyan (SSA)
Sarva Shiksha Abhiyan, a centrally sponsored scheme, is implemented by the Rajiv
Gandhi Shiksha Mission in Chhattisgarh. Funds are placed at its disposal directly by
the Centre and the State. The objectives of SSA are:
a. Access to education to all children in the age group of 6-14.
b. Enrolment and retention of all children up to class VIII.
c. Elimination of gender, social and regional gaps in the access to primary
education by 2007 and to upper primary education by 2010.
d. Universal retention by 2010.
The scheme has been under implementation since 2002-03. Contribution made by
the Centre is a net addition to the resources of the State; the State’ contribution is
already accounted for in the state’s expenditure on school education. These funds
have been used for opening new primary and upper primary schools, recruitment of
teachers and construction of class rooms and schools.
Sarva Shiksha Abhiyan is expected to meet the needs and targets set for universal
access to primary and upper primary education in the State, but are the resources
made available are adequate? Looking to the position of expenditure under the SSA,
another area of concern is whether adequate institutional arrangements have been
created to spend the funds and provide the necessary withal for achieving the targets
and goals set in the State Policy on Education and the National goals set in the
Eleventh Five Year Plan.

15
3. DIFFERENT SCHEMES IN EDUCATION PROGRAM OF THE
STATE 3.1 Establishment of Madarasa Board
To make Urudu learning effective and to popularize it, the Board has been
established. The institution along with their religious development is engaged in
school teaching. This has been recognized and is provided a onetime grant.
3.2 Establishment of Sanskrit Board
To make Sanskrit learning effective and to popularize it, this Board has been
established. The Board will be entrusted with the development of Sanskrit learning
and will be provided grant for infrastructure and meeting its recurring cost.
3.3 Chhattisgarhi Bhasha Parishad
Chhattisgarh Academy has been established for the development of Chhattisgarh
dialect and is provided grants.
3.4 Award for Teachers
The teachers with extraordinary calibre in the field of education are recognized and
are awarded for this. One teacher from each district is chosen and is rewarded.
3.5 Formation of Typing Board
Typing Board is working in the state and is engaged in conducting examination in
Hindi and English typing and short hand in Hindi and English.
3.6 National Fitness Core
School Education department has been concerned with the physical fitness of the
students and therefore is providing for gymnasium in the school campus.
3.7 European Commission
The Government of Chhattisgarh under partnership program with EC under the SPP
program is providing support to ongoing schemes and in a few schemes for primary
and higher secondary level education.
3.8 State Literacy Program
A state level office is being established for this purpose.

16
3.9 Adult Education and Literacy Program
Under this program the illiterates and neo-literates in the age group 15-35 is targeted.
This is run by the district level offices established.
3.10 Sakshar Bharat Yojna
This is a centrally sponsored scheme for illiterates and AEC.
3.11 Child Education Centre
The state has 757 child education centres. There are approximately 9500 children
engaged in learning at these centres.
3.12 Primary Education
The state government has always accorded a high priority for the development of
education. Primary education forms the base of the educational pyramid.
Considerable importance has been given for enrolment and retention of children in
primary education to achieve 100percent retention by 2012. In order to achieve this
enrolment drive is carried out every year. The expenditure is proposed for
quantitative improvement of education, infrastructure and payment of salaries and
allowances in the tenth five year plan and annual plan for achieving universal access
to primary education.
3.13 Grant for Community participation in Schools
The state has attached importance to community participation in primary education.
178 primary schools and 57 middle schools are being run by Education Committees.
The cost of these schools is met by the government.
3.14 Supply of Free Text Books in primary schools
The scheme of providing free text books to students studying in class I to VII has
been continued from the tenth plan. This is being done to encourage enrolment and
retention.
3.15 Uniform to girl students
In order to reduce the dropout rate of girl children and to increase enrolment of girl
students especially in SC/ST/OBC the girl students from this category studying in
class I to V are provided free uniform.
17
3.16 Increasing Middle schools
In the state the ratio of primary to upper primary schools under the management of
the Department of Education is 1:2.44. This is still below the SSA norm of 1:2. There
could be new schools in the upper primary and these will be funded under this
scheme.
3.17 Training of Teachers for English teaching in Primary Schools
The government is aiming to improve the quality of English education in primary
schools. In order to improve the quality provision of in-service training of teachers in
teaching methodology is provided for.
3.18 Student Accident Insurance Policy
This is being carried out annually and the government in the past two years has
targeted 6,500,000 students.
3.19 Mid Day Meal Scheme for Primary Schools
This scheme is implemented for providing hot cooked meal to school children of
classes I to V in primary schools run by state government. The scheme is run for at
least 230 days per year. The cost per child is INR 3.30 per child. INR 1.28 is the
share of the state government and the balance is provided by the Central
Government.
3.20 Mid Day Meal Scheme for Middle School
The mid day meal scheme is implemented for providing hot cooked meal to school
children of classes 6 to 8 in middle schools run by state government. The program is
run at least for 246 days per year. The cost per child is INR 4.00 per day with a state
share of INR0.98.
3.21 Sarva Shiksha Abhiyan/NPE GEL/ KGAVY
The scheme for SSA was started in 2001-02 with the objective of providing universal
access to elementary education. The objectives of this scheme are to provide useful
and relevant elementary education to all eligible children in the age group 6 to 14
years by the year 2010.
18
The national Program for Education of Girls at Elementary Level (NPEGEL) as a
component of the scheme of SSA was started in 2003-04. The main objectives are to
provide access and to facilitate retention of girls and ensure greater participation of
women and girls in the field of education and to improve the quality of education
through various interventions and stress upon the relevance and quality of girls
education for their empowerment.
The Government of India has approved Kasturba Gandhi Balika Vidyalaya (KGVB)
scheme with the objective of reducing the gender disparities in rural areas and
among disadvantaged communities.
3.22 Other Schemes
Grant to sainik school
Training of Yoga
Grants to local body for primary school
Strengthening DIETS
Government Library
Grant pay to Shiksha Karmi Class I to VIII
Re-construction of middle school building
Re-construction of Primary School building
Government High School and Higher secondary school establishment
expenditure
Streamlining of SCERT
Grant to community participated high school and higher secondary schools
Pusthakalaya Yojna for High/Higher Secondary schools
Grant to local body for higher secondary school
Chhattisgarh Suchna Shakti Yojna
Distribution of bicycles to girls
Establishment of Sainik School
19
Formation of Simat
English Language teaching improvement
District Centres for English
Supply of free text books in high schools for SC/ST students studying in
government high schools
Merit scholarship for class 10 to 12
Provision of High/Higher secondary school repair work
Satellite based education
Conduct of national exam
Use of ICT
Scholarship to middle school students
Grant pa y to shiksha Karmis class 9 to 12
Construction of high/higher secondary school buildings
Construction of girls hostel
Establishment of model school
The above are illustrative list of schemes and are not an exhaustive list and the
department may wish to add to this list every year to make it exhaustive.

20
4. ANALYSIS OF BUDGET ALLOCATION AND COMPONENTS
IN THE PAST
4.1 Expenditure on Education
Education, including school education, is a spending department of the government.
With the commitment for free and compulsory education to every child in the age
group of 6-14, no income or resource can be generated to finance expenditure. Even
at the secondary level, it is difficult to make students pay for it when the target is near
universal access of education at the High School level during the Eleventh Five Year
Plan. Income of a large segment of population is at below the poverty line, and a still
large segment of population lives at the margin of poverty. Education, at the school
level, cannot be expected to generate resources to meet even a small percentage of
the expenditure incurred every year.
State’s resources in the education sector are derived from provisions in the budget,
support from the European Commission State Partnership Programme (EC-SPP)
which has a component for education, and funds flowing from the Centre under the
centrally sponsored schemes (CSS) and central sector schemes. Centre’s
contribution in three centrally sponsored schemes, namely, Sarva Shiksha Abhiyan
(SSA), Kasturba Gandhi Balika Vidyalaya Scheme (KGBVS), and National
Programme for Education of Girls at Elementary Level (NPEGEL) goes direct to the
RGSM; the flow of funds under other CSS/CS and European Commission forms part
of the budgetary resources of the State. Centre’s contribution to RGSM is a net
additional resource to the education sector over and above the budgetary provisions.
RGSM is responsible for the implementation of the two special schemes for the
education of girls Kasturba Gandhi Balika Vidyalaya (KGBV) and the National
programme for Girls at Elementary Level (NPEGEL), apart from SSA.
The expenditure on state education as a percentage of the total government
expenditure has been increasing steadily over the years. It was about 10.74percent
in 2001-02 but has increased up to 11.6percent in 2008-09. However it has further
increased to 14.82percent in 2009-10 if the Revised Estimate is taken and it stands
at 15.9percent if the Budget estimates are taken for 2010-11. This clearly indicates
that education is a priority in the state government agenda. The following graph
provides the growth in Expenditure in Education as a percentage of Total
Expenditure.

21
If the expenditure on education is considered as a percentage of Gross State
Domestic product a similar trend of increase is observed.
4.2 Expenditure per student
The expenditure student has also been showing an increasing trend over the past
years. The following graph shows the trend in expenditure per student:
The above has been derived by dividing the total eligible student population by the
total expenditure on education. However, this needs to be adjusted for enrolment in
the education institutions of the government and exclude the number of students
enrolled in the private schools. These adjustments will only increase the expenditure
per student.
1.00
10.00
100.00
1 2 3 4 5 6 7 8 9 10
Series1
Expenditure Per Student (INR)
0
500
1000
1500
2000
2500
3000
3500
1 2 3 4 5 6 7 8 9 10
22
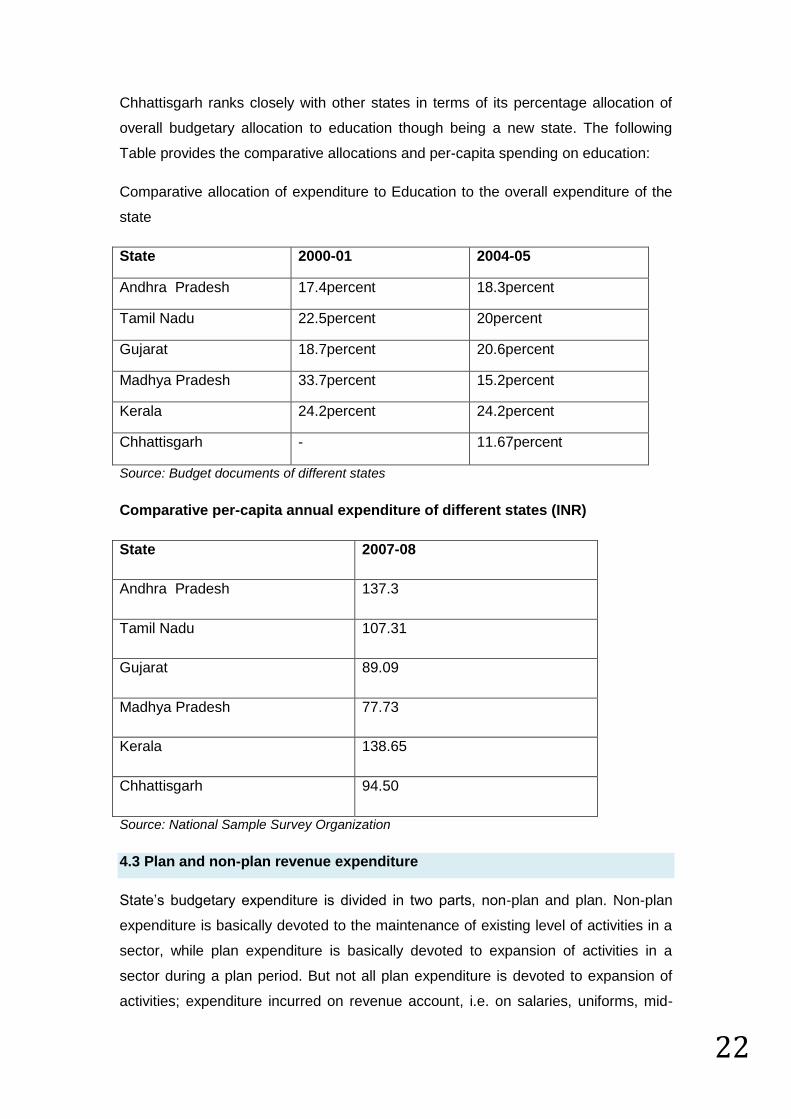
Chhattisgarh ranks closely with other states in terms of its percentage allocation of
overall budgetary allocation to education though being a new state. The following
Table provides the comparative allocations and per-capita spending on education:
Comparative allocation of expenditure to Education to the overall expenditure of the
state
State 2000-01 2004-05
Andhra Pradesh 17.4percent 18.3percent
Tamil Nadu 22.5percent 20percent
Gujarat 18.7percent 20.6percent
Madhya Pradesh 33.7percent 15.2percent
Kerala 24.2percent 24.2percent
Chhattisgarh - 11.67percent
Source: Budget documents of different states
Comparative per-capita annual expenditure of different states (INR)
State 2007-08
Andhra Pradesh 137.3
Tamil Nadu 107.31
Gujarat 89.09
Madhya Pradesh 77.73
Kerala 138.65
Chhattisgarh 94.50
Source: National Sample Survey Organization
4.3 Plan and non-plan revenue expenditure
State’s budgetary expenditure is divided in two parts, non-plan and plan. Non-plan
expenditure is basically devoted to the maintenance of existing level of activities in a
sector, while plan expenditure is basically devoted to expansion of activities in a
sector during a plan period. But not all plan expenditure is devoted to expansion of
activities; expenditure incurred on revenue account, i.e. on salaries, uniforms, mid-

23
day meals etc. on plan account creates a commitment for meeting that expenditure in
the subsequent years of a plan period as activities taken up in the previous years
under the plan have to be kept at that level in subsequent years. Expenditure
incurred on the maintenance of these activities, included in the plan expenditure,
does not lead to any expansion. Sometimes, expenditure incurred in the previous
plan continues to be financed in the subsequent plan as plan expenditure. A high
revenue component in the plan expenditure, even though the plan may be large,
reduces the space for taking up new activities.
The plan part of the revenue expenditure has been showing an increasing trend
indicating that new schemes and projects have been included over a period of time
and this is quite encouraging that the state has been experimenting with including
new schemes as part of its plan for the school education. The states share in Plan
and Non-Plan aspect of the budget has almost become equal.
However, if the Central share in the school education is examined it has been
showing a steady increasing trend especially in the later years and has almost an
equal share as that of the state plan and non-plan expenditure. This can be attributed
to the contribution of the central government in terms of the mid-day meal scheme
and also through the SSA scheme. This dependence needs to be carefully weighed
and sustainability of these schemes carefully examined. The following Table provides
the share of different aspects of allocation in percentage terms:
TABLE 6 : Revenue Expenditure on Education (Percentage)
Years Plan Non-Plan Central Share Total
2001-02 14.16 82.72 3.12 100
2002-03 23.09 76.79 0.15 100
2003-04 30.36 64.03 5.61 100
2004-05 33.60 54.17 12.23 100
2005-06 28.28 54.21 17.51 100
2006-07 28.01 46.75 25.24 100
2007-08 29.50 40.97 29.53 100
2008-09 28.16 33.48 28.36 100
Source: Finance Accounts of Various Years

24
4.4 Plan, non-plan capital expenditure
The capital expenditure by its very nature will fall entirely in the plan category. The
share of the centre was fluctuating in the earlier years but has increased steadily to
form a significant share in the capital expenditure of the state.
The following Table indicates the relative share of the plan and central government
shares:
TABLE 7 : Capital Expenditure on Education (Percentage)
Years Plan Non-Plan Central Share Total
2001-02 93.3 0.00 6.70 100
2002-03 100 0.00 0 100
2003-04 67.75 0.00 32.25 100
2004-05 91.86 0.00 8.14 100
2005-06 93.07 0.00 6.03 100
2006-07 89.95 0.00 10.95 100
2007-08 79.79 0.00 20.21 100
2008-09 87.50 0.00 12.42 100
Source: Finance accounts of Various Years
4.5 Share of Revenue and Capital expenditure
The share of capital expenditure has been below 10percent in all the nine years for
which the actual expenditure incurred in the school education. This clearly shows that
there has been very limited investment in the education infrastructure by the state
government. The following Table provides the share of revenue and capital
expenditure in percentage terms of the total expenditure in school education:
TABLE 8 : Percentage of Revenue and Capital Expenditure of Expenditure on Education
Revenue Capital Total
2001-02 99.78 0.22 100
2002-03 99.19 0.81 100
2003-04 96.06 3.94 100
2004-05 95.90 4.10 100
2005-06 94.62 5.38 100
2006-07 91.85 8.15 100
2007-08 90.95 9.05 100
2008-09 91.75 8.23 100
Source: Derived from Finance Accounts of various Years

25
4.6 Components of revenue Expenditure
The expenditure of the school expenditure department has some important features
to be kept in view in any exercise for the preparation of the MTEF.
More than 90 per cent of the budgetary expenditure is on revenue account
though in recent years, it has come down from more than 98 per cent to
around 91 per cent
Non-plan expenditure is entirely on revenue account; there is no provision in
the capital account for renovation and up-gradation of existing capital assets
or their replacement.
The component of expenditure on salary is very high, though it is coming down
as percentage of revenue expenditure largely due to increase in expenditure on
mid-day meals and teachers training. This applies to non-plan and plan
expenditure alike
Though year on year budgetary expenditure of the school education
department has been increasing, the extent of the rate of growth has been quite
volatile. It has ranged between 15 to 47 per cent.
Non-plan expenditure as a percentage of total budgetary expenditure has been
coming down in recent years.
The state’s contribution to RGSM for its contribution on account of the three
CSSs implemented forms part of the plan expenditure. To that extent, the
amount available to State for fixing its own priorities gets reduced.
Due to high component of expenditure on revenue account for which
commitments continue to the next year, the space available for planning the
medium term expenditure framework is very small. It can only be with regard to
additional budgetary provisions over and above the expenditure committed in
the previous year on revenue account. Even this additional provision has to
provide for inflation to ensure that services are maintained at previous year’s
level as also the usual increments to the salaried staff of the department.
The relative share of the different components is provided in the following Table:

TABLE 9 : Component wise expenditure as a percentage of Total Expenditure on General Education Year wise
Components of
Expenditure
2001-02 2002-03 2003-04 2004-05 2005-06 2006-07 2007-08 2008-09
Salary 73.44 71.94 59.20 54.69 52.33 46.40 34.19 44.15
Direction and Administration 2.03 2.01 1.67 1.81 1.36 1.17 0.85 0.91
Text Books 0.38 0.20 0.13 0.03 0.09 0.82 0.45 0.75
Mid Day Meal 0.00 0.00 0.00 0.00 0.00 2.17 9.38 13.07
Teachers Training 0.13 0.16 0.12 0.11 0.49 0.08 0.40 0.14
Education to All 0.00 0.00 0.00 0.00 0.00 5.17 14.89 5.09
Special Component Plan for
SC
0.57 1.44 14.20 2.87 2.28 5.19 3.99 0.51
Tribal Sub Plan 1.21 2.21 0.65 16.43 16.74 12.55 7.22 6.37
Other 1.09 0.87 0.60 0.90 73.30 0.35 1.03 0.54
TOTAL Elementary
Education
78.84 78.83 76.57 76.82 74.65 73.91 72.42 71.53
Salary 19.07 19.28 15.02 13.26 13.17 11.56 10.10 13.20
Direction and Administration 0.02 0.00 0.00 0.00 0.00 0.12 0.10 0.08
Text Books 0.00 0.00 0.00 0.00 0.07 0.06 0.07 0.06
Teachers Training 0.52 0.13 0.08 0.07 0.13 0.14 0.09 0.15

Components of
Expenditure
2001-02 2002-03 2003-04 2004-05 2005-06 2006-07 2007-08 2008-09
Special Component Plan for
SC
0.17 0.25 1.46 2.53 2.09 2.19 1.65 1.30
Tribal Sub Plan 0.45 0.33 2.49 5.30 5.41 4.62 4.80 4.37
Other 0.28 0.11 1.06 0.17 0.05 0.20 1.73 0.21
Total Secondary 20.47 20.11 20.10 21.32 20.93 18.88 18.53 19.35
Adult Education 0.15 0.00 0.11 0.06 0.05 0.08 0.09 0.06
Language Development 0.15 0.00 0.11 0.06 0.05 0.08 0.09 0.06
General Education 0.25 0.26 0.23 0.19 0.19 0.31 0.98 2.36
Sports and Youth 0.78 0.89 0.75 0.74 0.74 0.74 0.62 0.59
Art and Culture 0.47 0.61 0.73 1.01 0.63 1.04 0.73 0.74
Capital Exp. 0.22 0.81 3.95 4.11 5.38 6.37 7.13 6.97
Total School Education
Expenditure
100.00 100.00 100.00 100.00 100.00 100.00 100.00 100.00
Source: Derived from Finance Accounts for Education, GOC

28
5. CONSIDERATIONS FOR MTEF AND PROJECTIONS OF ADDITIONAL
EXPENDITURE 5.1 Students Enrolment
This is the basic projection that needs to be carried out in order to ascertain the adequacy of
number of schools at the different levels as well as calculate the sufficiency of the number of
teachers.
According to the Annual Report of the Department of School Education (ARSE), the total
intake in class I in 2008-09 was 844673 students, while there were only 525433 students
enrolled in class V, a drop of nearly 38 percent. What is important for the MTEF is not the
number of students who do not go to the next higher class in the primary system at present,
but what will need to be provided for if every child enrolled in class I is retained in the next
higher class for the next four years. The present rate of induction in class I have been
assumed for the next four years as also for the upper primary and high school system for
discussion later. Implicit in this is the assumption that all children in the age group of 6+ are
enrolled in class I and that no one is left out, and that the present rate of growth in the
population is maintained.
The enrolment for 2009-10 has been collected from the Department of Education and has
been used as the basis for projection of population of students in each class from class I to
class 8 and certain norms have been used for high school and higher secondary school
enrolment.
In order to commence the enrolment in Class 1 the number of eligible children in the age
group for that year has been taken as the basis. The projections for different age groups
have been made by the Registrar General of Census and the same has been taken for use.
The eligible population in the four years has been taken as the basis for enrolment in class 1
in that particular year. It has been assumed that the retention will be 100percent in the
subsequent years as the children progress in education.

29
The following table provides the projection of students in the different classes in the four
years to follow:
TABLE 10 : Projection of Enrolment of Children
2010-11 2011-12 2012-13 2013-14
Class 1 727740 737550 747270 756960
Class 2 720680 727740 737550 747270
Class 3 638642 720680 727740 737550
Class 4 666834 638642 720680 727740
Class 5 643536 680170 638642 720680
Class 6 582908 675712 680170 638642
Class 7 523347 612053 720680 680170
Class 8 475161 549514 642655 720680
Class 9 237581 274757 321328 360340
Class 10 249460 237581 274751 321328
Class 11 261933 249460 237581 274751
Class 12 275029 261933 249460 237581
The above Table provides the number of students in all schools including those enrolled in
private schools. These have been used to derive the number of students in the Government
Schools. The following assumptions have been made to derive the student population in the
government schools:
85 percent of the students in Class 1-5 will be in government schools
85 percent of the students in Class 6-8 will be in government schools
50 percent of the students in classes 9-10 and in classes 11-12 will be in
Government schools
These assumptions have to be made because the segregated statistics of enrolment of
students in the government schools in each class is separately not available.

30
The derivation of number of students in different classes based on the above assumptions is
provided in the following Table:
TABLE 11 : Projected Students enrolment and students’ enrolment in Government Schools
2010-11 2011-12 2012-13 2013-14
Total students in Class 1-5
3281857 3531409 3598509 3690200
Total students in Class 1-5 in Government Schools
2789579 3001698 3058733 3136670
Total Students in Class 6-8
1386820 1605225 1857928 1972780
Total Students in Class 6-8 in Government Schools
1178797 1364441 1579239 1676863
Total students in Class 9-10
642060 728481 827175 944913
Total Students in Class 9-10 in Government Schools
321030 364240 413587 472456
Total students in Class 11-12
470302 417339 473512 539422
Total Students in Class 11-12 in Government Schools
235151 208670 236750 269711
The above projection will be used to calculate the following:
Cost of midday meal scheme for 1-8
Cost of text book supply
Additional requirement of teachers and schools/or classrooms
Provision of uniforms

31
Since the dropout rate is steep between classes 5 and 6 the government may be considering
the construction of additional class rooms in the existing elementary girls’ school in order to
make available middle schools separately for girls. The implication for the number of teachers
will also be worked out and taken for MTEF. The additional enrolment expected due to the
lifting of the Board exam has been already factored into the projections.
5.2 Estimation of Requirement of Teachers
Currently the total number of teachers/lecturers in government schools is separately not
available in a compiled form. It is available for all schools in the state together. Therefore it
has been necessary to carry out an exercise of working out the number of teachers currently
in position at the different schools under the government.
The number of schools that are there in the state has been split up by using the following
assumptions:
85percent of the schools in the primary and upper primary in the state will be
government schools
50percent of the schools in the high school and higher secondary schools will be
government schools.
The following are the number of schools in the different levels in the state managed by the
education department and tribal welfare department:
TABLE 12 : Number of Government Schools
Primary 33540
Upper Primary 13703
High School 1181
Higher Secondary 1391
The Department of Finance vide its instruction Endorsement #/Plan/B-03/Set Up/08/178
dated29/05/2008 has spelt out the pattern of teaching staff at different levels of schools and
the additional requirements beyond a specified number of students in a school. Using this
norm the number of teachers required has been worked out. In order to estimate the
requirement of teachers the following assumptions have been position made:
70 percent of the schools in the primary and upper primary level will be normal
student load schools and

32
90 percent of the schools in the high and higher secondary levels will be normal
student load schools
The requirement of teachers and gap in the number of teachers is provided in the following
Table:
TABLE 13 : Requirement of Teachers as per norms and estimated gap
Level of school
Number of schools
Number of Teachers
Total Teacher Requirement
Teachers In Position
Gap in teacher availability
sanctioned
Primary-normal load 23478 3 70434
89282 31462 Primary-high load 10062 5 50310
Upper Primary- Normal Load 9592 5 47960
45895 29841 Upper Primary High Load 4111 7 28776
High School- Normal Load 1063 8 8504
6103 3817 High School- High Load 118 12 1416
Higher Secondary- Normal Load
1252 16 20032
14152 11070 Higher Secondary- High Load
139 25 3475
Vocational and Computer Teachers
1715
It is estimated that there is a huge gap of teachers that needs to be filled up over a period of
time. The same was discussed with the department and it was informed that 25percent of
the gap will be filled up by 2011-12 and another 40percent of the gap will be filled in 2012-13
and the balance 35percent will be filled up by 2013-14. Accordingly the requirement of
additional salary requirements and teachers training has been taken into account.

33
If the gap is filled then the following will be the student teacher ratio in different years in the
state:
TABLE 14 : Projected positions of teachers and student teacher ratio
2010-11 2011-12 2012-13 2013-14
Number of students in Primary School
2789579 3001698 3058733 3136670
Number of Teachers in Primary
89282 97147 111305 122317
Student Teacher Ratio
31:01:00 31:01:00 28:01:00 26:01:00
Number of students in Upper Primary School
1178797 1364441 1579239 1676863
Number of Teachers in Upper Primary
45895 53355 65291 75735
Student Teacher Ratio
26:01:00 26:01:00 25:01:00 23:01
Number of students in High School
321030 364240 413587 472456
Number of Teachers in High School
6103 7057 8583 9918
Student Teacher Ratio
52:01:00 51:01:00 48:01:00 47:01:00
Number of students in Higher Secondary School
235151 208670 236750 269711
Number of Teachers in Higher Secondary School
14152 16920 21348 25222
Student Teacher Ratio
17:01 12:01 11:01 11:01
The above analysis shows that if the department is able to fill the gap of the required number
of teachers then there is no additional requirement of teachers in the next 5 years even if the
enrolment were to substantially increase in the higher secondary level. However, at the high
school level the number of Teachers will require increase. In the case of primary and upper
primary levels the teachers will be adequate over the next five years but will have to be
reviewed based on the enrolment. At the high school level if separate school for girls were to
be provided then additional teachers will be required to teach at these schools. However, this

34
has not been taken into account in the current MTEF. It is expected that reallocation of
teachers can be initially carried out and the position reviewed later.
5.3 Infrastructure Facilities required over MTEF Period
The statistics available with the department clearly indicate that the following will be the
infrastructure required:
Sanitation facility in the different schools
Boundary wall for the schools
Building for school in the high school and higher secondary schools
Schools in the primary/upper primary level whose building are in very bad status
Schools in the primary and upper primary level whose building require repair
New class room for separate school for girls
The number required in each category is provided below:
TABLE 15 : Schools requiring different infrastructure
Primary Upper
Primary High
school
Higher secondary
School
Building Nil Nil 374 154
Toilets 6324 1866 268 179
Drinking water
1907 1315 225 82
Very bad status building
1210 140 5 27
Buildings requiring repair
240 60 1 15
Boundary wall
6490 2887 266 273
Additional Rooms Required
0 0 650 750
Source: Statistics of DPI
The above requirements will be phased out over the next three years as discussed with the
department. The requirement of new buildings in the high school and higher secondary
schools will be phased over a three year period. The sanitation facility will be provided by

35
Public Health Engineering Department over the next two years and this will have no
implication of resources for the department. The facility for drinking water will be phased out
over the next three years. The buildings in critically bad condition will be replaced with new
building in the next one year. The boundary wall will be provided to all schools requiring the
same by three years time. Additional rooms required in the different levels of schools will be
provided in the first year of MTEF.
6. MTEF PROJECTIONS AND RESOURCE REQUIREMENTS
Planning for MTEF requires an assessment of the likely availability of resources from all
sources and the goals envisaged in the policy document which have to be achieved in a given
frame of time. An analysis of the budgetary and non-budgetary resources made available in
the past few years for school education has been done in the preceding paragraphs. A few
salient features of the state policy on education in so far it relates to elementary and
secondary education as also the goals set in the national Eleventh Five year Plan document
have been described. The goals, inter alia, set are universal access tofu primary education by
2007, upper primary education by 2010, higher education by the end of Eleventh Five Year
Plan with retention of students up to 75 per cent in upper primary School and a retention of
65 per cent for High and Higher Secondary School combined. It would be seen that the state
has to go a long way for achievement of these goals within the stipulated frame of time.
Education, especially school education, unlike many other areas, has an intrinsic time frame
in which goals can be achieved, even if adequate resources are made available. A child
cannot be made to jump the classes or do two or three classes in a year for realisation of the
goal of universal access of primary, upper primary or secondary education. He has to traverse
a path; students in class II will come from students enrolled in class I or students in class VI
will come from those who pass out from class V. However, it has been planned that the
students will be provided bridge course in order that the children of the appropriate age group
are admitted into the classes relevant for their age. Those who are out of the school cannot be
put in an appropriate class on the basis of age because switching over from one class to
another class also involves a learning process. The Eleventh Five year Plan document also
stipulates that students getting under schooling system, education guarantee, alternate
school, non-formal etc., will be brought into the formal schooling system during the plan
period.
A plan for universal access to school education up to primary, upper primary or high school
level necessarily involves a comprehensive planning for five, eight and ten years, which could

36
form the basis for allocation of financial resources. It also involves a great degree of physical
planning requiring identification of areas where schools have to be opened according to
norms, teachers, subject-wise, who need to be recruited, training which needs to be imparted
to them, construction of classes and school buildings, preparation of learning material
including text books, incentives to students where children are economically deprived, and
socially barred by circumstances to avail the facilities under the existing environment. No
comprehensive report has been made available which addresses these issues in the context
of universal access in a comprehensive manner. Data available in the Annual Reports of the
Department has formed the basis for developing a framework for the achievement of goals set
for the realisation of universal access to primary, upper primary and high school education. It
has necessarily to cover a period of ten years, but for the purpose of MTEF a shorter period of
five years could be taken as the basis for allocation of resources and fixation of targets. Other
areas indicated in the state policy or the national Eleventh Plan document has not specifically
been included in this exercise, though they could remain a part of the budgeting.
Priorities of the State
State of Chhattisgarh has indicated a very high priority for the realisation of the goal of
universal access to primary; upper primary and secondary education over all other goals and
objectives set in the National Policy on Education, State Policy on Education, and the Five
year Plans. However, as indicated earlier, mere provision of required funds and infra-structure
will not shorten the period which is necessary for the realisation of this goal; children move
from one class to another class after the completion of an academic year. Keeping this in
view, the requirements of funds have been worked out on the assumption that children in one
class will be retained in the next class in the next academic year. If this is maintained,
universal access to primary education in the next four years, upper primary education in
seven years and secondary education in nine to eleven years can be achieved. However, it
should be noted that funds are the only one of the main constraints in the attainment of this all
important goal; a movement will have to be built for the children in the school after their initial
enrolment in class I.
6.1 Analysis of Trend in Education expenditure
Resource Envelope
State has been giving a very high priority to the school education in recent years. It has
reflected in the budgetary allocations made in the last four years’ showing an annual increase
of over 20 per cent in the allocations. Even in the budget estimates for the year 2010-11, an
increase of 19percent per cent is contemplated. The availability of funds should therefore not
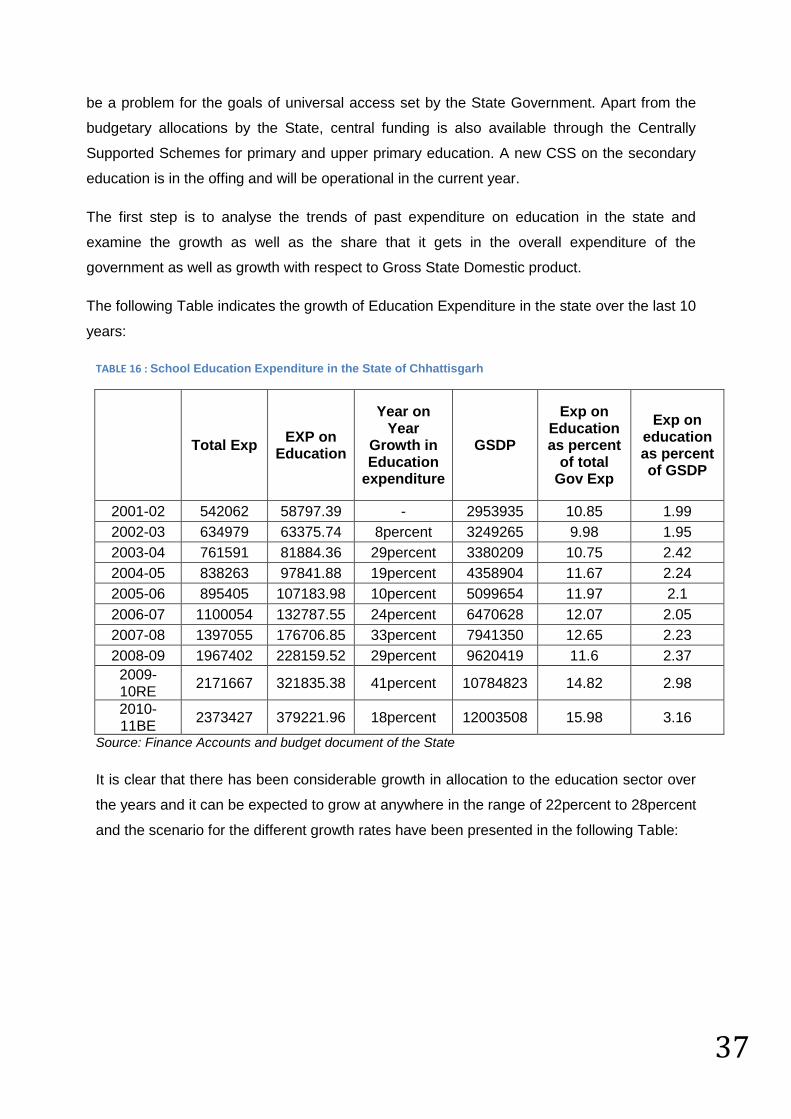
37
be a problem for the goals of universal access set by the State Government. Apart from the
budgetary allocations by the State, central funding is also available through the Centrally
Supported Schemes for primary and upper primary education. A new CSS on the secondary
education is in the offing and will be operational in the current year.
The first step is to analyse the trends of past expenditure on education in the state and
examine the growth as well as the share that it gets in the overall expenditure of the
government as well as growth with respect to Gross State Domestic product.
The following Table indicates the growth of Education Expenditure in the state over the last 10
years:
TABLE 16 : School Education Expenditure in the State of Chhattisgarh
Total Exp EXP on
Education
Year on Year
Growth in Education
expenditure
GSDP
Exp on Education as percent
of total Gov Exp
Exp on education as percent of GSDP
2001-02 542062 58797.39 - 2953935 10.85 1.99
2002-03 634979 63375.74 8percent 3249265 9.98 1.95
2003-04 761591 81884.36 29percent 3380209 10.75 2.42
2004-05 838263 97841.88 19percent 4358904 11.67 2.24
2005-06 895405 107183.98 10percent 5099654 11.97 2.1
2006-07 1100054 132787.55 24percent 6470628 12.07 2.05
2007-08 1397055 176706.85 33percent 7941350 12.65 2.23
2008-09 1967402 228159.52 29percent 9620419 11.6 2.37
2009-10RE
2171667 321835.38 41percent 10784823 14.82 2.98
2010-11BE
2373427 379221.96 18percent 12003508 15.98 3.16
Source: Finance Accounts and budget document of the State
It is clear that there has been considerable growth in allocation to the education sector over
the years and it can be expected to grow at anywhere in the range of 22percent to 28percent
and the scenario for the different growth rates have been presented in the following Table:
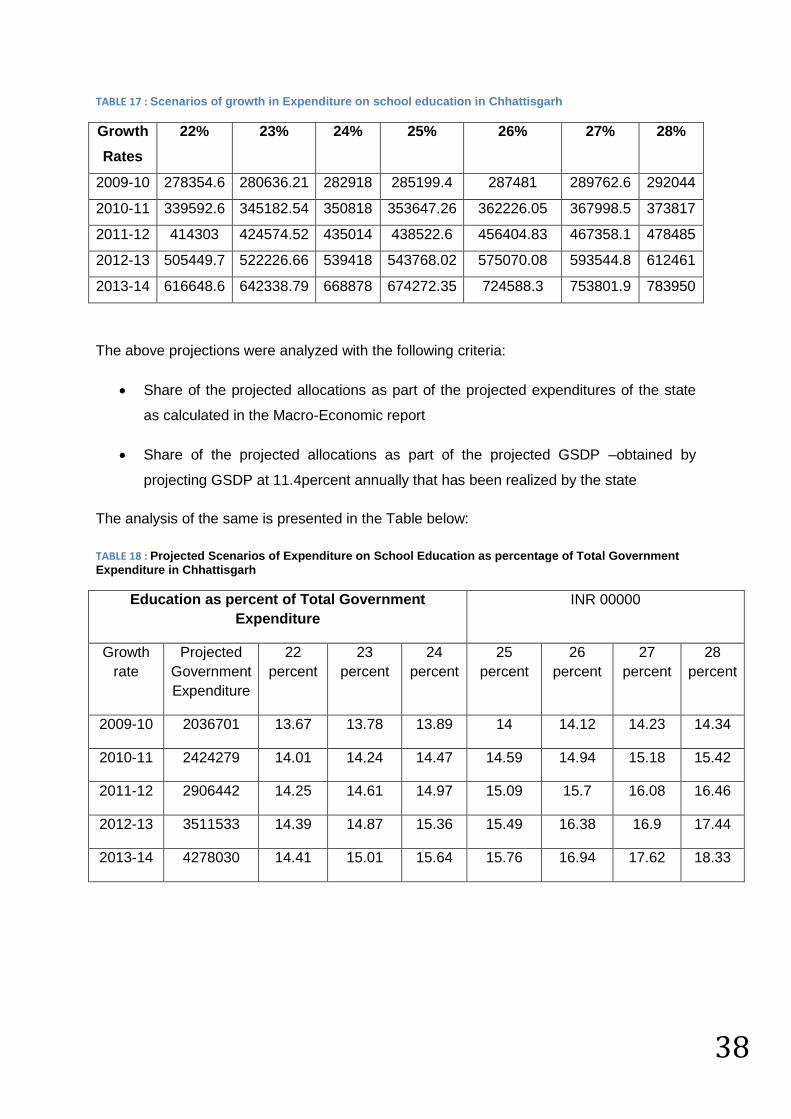
38
TABLE 17 : Scenarios of growth in Expenditure on school education in Chhattisgarh
Growth
Rates
22% 23% 24% 25% 26% 27% 28%
2009-10 278354.6 280636.21 282918 285199.4 287481 289762.6 292044
2010-11 339592.6 345182.54 350818 353647.26 362226.05 367998.5 373817
2011-12 414303 424574.52 435014 438522.6 456404.83 467358.1 478485
2012-13 505449.7 522226.66 539418 543768.02 575070.08 593544.8 612461
2013-14 616648.6 642338.79 668878 674272.35 724588.3 753801.9 783950
The above projections were analyzed with the following criteria:
Share of the projected allocations as part of the projected expenditures of the state
as calculated in the Macro-Economic report
Share of the projected allocations as part of the projected GSDP –obtained by
projecting GSDP at 11.4percent annually that has been realized by the state
The analysis of the same is presented in the Table below:
TABLE 18 : Projected Scenarios of Expenditure on School Education as percentage of Total Government
Expenditure in Chhattisgarh
Education as percent of Total Government
Expenditure
INR 00000
Growth
rate
Projected
Government
Expenditure
22
percent
23
percent
24
percent
25
percent
26
percent
27
percent
28
percent
2009-10 2036701 13.67 13.78 13.89 14 14.12 14.23 14.34
2010-11 2424279 14.01 14.24 14.47 14.59 14.94 15.18 15.42
2011-12 2906442 14.25 14.61 14.97 15.09 15.7 16.08 16.46
2012-13 3511533 14.39 14.87 15.36 15.49 16.38 16.9 17.44
2013-14 4278030 14.41 15.01 15.64 15.76 16.94 17.62 18.33
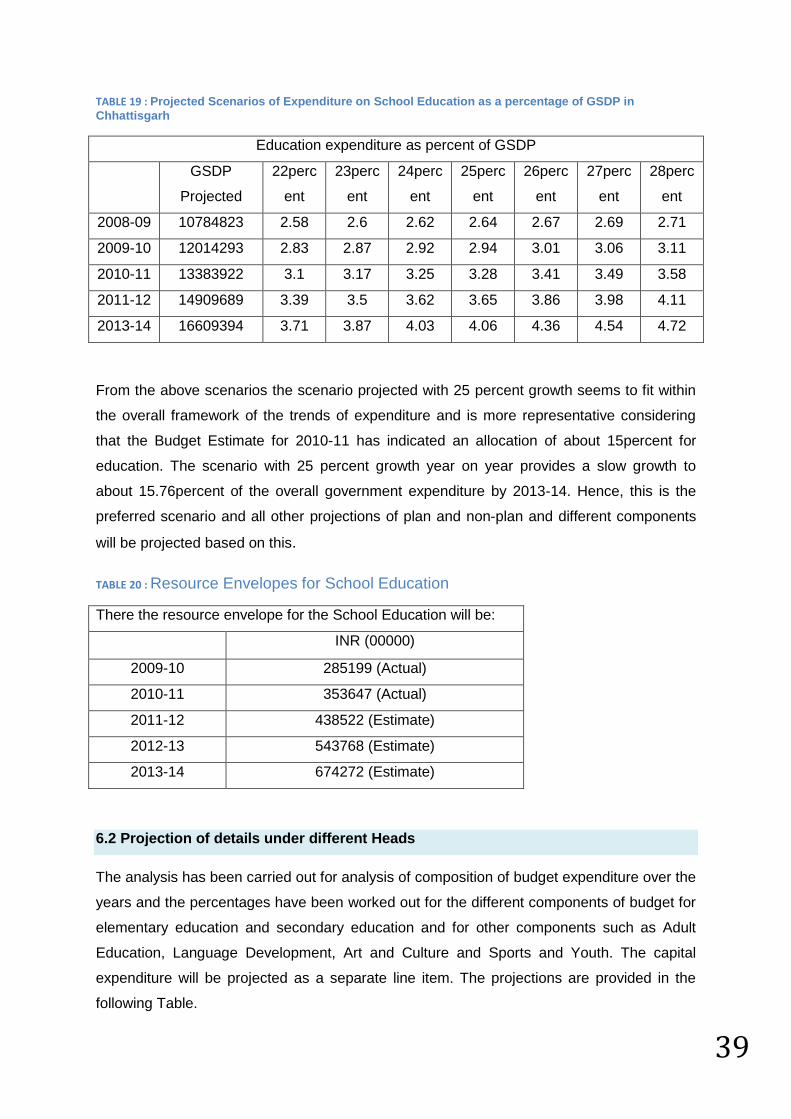
39
TABLE 19 : Projected Scenarios of Expenditure on School Education as a percentage of GSDP in
Chhattisgarh
Education expenditure as percent of GSDP
GSDP
Projected
22perc
ent
23perc
ent
24perc
ent
25perc
ent
26perc
ent
27perc
ent
28perc
ent
2008-09 10784823 2.58 2.6 2.62 2.64 2.67 2.69 2.71
2009-10 12014293 2.83 2.87 2.92 2.94 3.01 3.06 3.11
2010-11 13383922 3.1 3.17 3.25 3.28 3.41 3.49 3.58
2011-12 14909689 3.39 3.5 3.62 3.65 3.86 3.98 4.11
2013-14 16609394 3.71 3.87 4.03 4.06 4.36 4.54 4.72
From the above scenarios the scenario projected with 25 percent growth seems to fit within
the overall framework of the trends of expenditure and is more representative considering
that the Budget Estimate for 2010-11 has indicated an allocation of about 15percent for
education. The scenario with 25 percent growth year on year provides a slow growth to
about 15.76percent of the overall government expenditure by 2013-14. Hence, this is the
preferred scenario and all other projections of plan and non-plan and different components
will be projected based on this.
TABLE 20 : Resource Envelopes for School Education
There the resource envelope for the School Education will be:
INR (00000)
2009-10 285199 (Actual)
2010-11 353647 (Actual)
2011-12 438522 (Estimate)
2012-13 543768 (Estimate)
2013-14 674272 (Estimate)
6.2 Projection of details under different Heads
The analysis has been carried out for analysis of composition of budget expenditure over the
years and the percentages have been worked out for the different components of budget for
elementary education and secondary education and for other components such as Adult
Education, Language Development, Art and Culture and Sports and Youth. The capital
expenditure will be projected as a separate line item. The projections are provided in the
following Table.

40
TABLE 21 : Projection of different components of expenditure on School Education
Components of Expenditure
2011-12 2012-13 2013-14
Elementary Education
Salary 49percent 214876 266446 330393
Direction and Administration
1.25percent 5482 6797 8428
Text Books 0.75percent 3289 4078 5057
Mid Day Meal 10percent 43852 54377 67427
Teachers Training 0.50percent 2193 2719 3371
Education to All 5percent 21926 27188 33714
Special Component Plan for SC
1percent 4385 5438 6743
Tribal Sub Plan 5percent 21926 27188 33714
Other 1percent 4385 5438 6743
TOTAL Elementary 73.50percent 322314 399669 495590
Secondary Education
Salary 10percent 43852 54377 67427
Direction and Administration
0.10percent 439 544 674
Text Books 0.10percent 439 544 674
Teachers Training 0.30percent 1316 1631 2023
Special Component Plan for SC
1percent 4385 5438 6743
Tribal Sub Plan 4percent 17541 21751 26971
Other 0.20percent 877 1088 1349
Total Secondary 15.70percent 68849 85373 105861
Adult Education 0.10percent 439 544 674
Language Development
0.10percent 439 544 674
General Education 1percent 4385 5438 6743
Sports and Youth 0.60percent 2631 3263 4046
Art and Culture 0.70percent 3070 3806 4720
Capital Exp. 8.30percent 36397 45133 55965
Total School Education
Expenditure
438524 543770 674273

41
6.3 Projection details of Plan and non-Plan Expenditure
Out of the resources projected above it can be stated that the composition will be as follows:
TABLE 22 : Projection of Plan, Non-Plan and Central Share of expenditure on School Education in
Chhattisgarh
Year Total Projected resource Envelope for education (Revenue)
Plan Non-Plan Central Share
2009-10 261527 78458 109841 73228
2010-11 324296 97289 136204 90803
2011-12 402125 120637 168892 112596
2012-13 498635 149590 209426 139619
2013-14 618307 185492 259688 173127
Year Total Projected resource envelope for education (Capital)
Plan Non-Plan Central Share
2009-10 23672 21304 0 2368
2010-11 29353 26417 0 2936
2011-12 36397 32757 0 3640
2012-13 45133 40619 0 4514
2013-14 55965 50368 0 5597
6.4 Calculation of additional resource requirements
Additional Teachers
The additional number of teachers that will be added at the different levels have been
worked out for the next three years commencing from 2011-12 to 2013-14.
TABLE 23 : Projection of additional teacher requirement
Primary
Upper
Primary
High
School
Higher
secondary Total
2011-12 7865 7460 1526 2768 19619
2012-13 14158 11936 1526 1335 32048
2013-14 11012 10444 1335 3874 26665

42
The implication on resource requirement:
TABLE 24 : Additional Resource Requirements
Year Additional resource
requirement
2011-12 235
2012-13 384
2013-14 319
Mid Day meals
Increase in enrolment:
TABLE 25 : Increase in Enrolment
Year Primary Upper Primary Total
2011-12 212119 185644 397763
2012-13 57035 214798 271833
2013-14 77937 97624 175561
The cost of mid day meal is taken at INR 3.60 per student per day for 230 days in a year.
The requirement is divided into state share and central share for each year by taking the
ratio of 1.28:2.32 for primary school. The same is taken at INR 4.00 per student per day at
upper primary level with state: Centre at 0.98:3.02. The additional requirements are:
TABLE 26 : Additional Resource requirements for Mid-day Meals
Year State Share Central Share Total
2011-12 1171 2510 3681
2012-13 1757 4410 6167
2013-14 2221 5520 7741

43
Text Books and Uniforms
The number of students that has been projected as increase has been taken as the basis
and it has been worked out as 10percent more than in 2008-09 than in the budget. The
additional requirement will be not significant and hence has not been separately considered.
Training of Teachers
This is also not a significant contributor to the overall expenditure of the department and
hence has not been separately considered.
Expenditure on Capital Account for schools
The requirement of amenities in the different schools has been worked out and is provided in
the Table below:
TABLE 27 : Additional Requirements for Capital Expenditure
2011-12 2012-13 2013-14
Buildings 12000 16000 14240
Drinking Water 15 25 40
Buildings that are critically
bad reconstructed 8000 5400 2560
Repair of buildings 644 0 0
Boundary Wall 6000 6000 7836
Additional Class Rooms 3600 1500 0
Total 30259 28925 24675

44
6.5 Adjusted Resource Requirements taking into account additional Requirements
TABLE 28 : Resource Requirement after adjusting for additional Requirements
Year Total Projected resource Envelope for education (Revenue)
Plan Non-Plan Central Share
2009-10 261527 78458 109841 73228
2010-11 324296 97289 136204 90803
2011-12 406041 122043 168892 115106
2012-13 505421 151966 209426 144029
2013-14 626986 188651 259688 178647
Year Total Projected resource envelope for education (Capital)
Plan Non-Plan Central Share
2009-10 23672 21304 0 2368
2010-11 29353 26417 0 2936
2011-12 66656 63016 0 3640
2012-13 74058 69544 0 4514
2013-14 80640 75043 0 5597
7. SUGGESTIONS FOR SECTOR REFORM AND DATA FOR BETTER
PROJECTIONS 7.1 Data base and MIS
The current data available with the different administrative divisions of the Directorate of
Public Instruction especially the Government School Administrative Machinery, The SSA and
the MSA do not tally. Therefore, it is suggested that a basic stocktaking is carried out and a
baseline is created which will be reliable and robust and enable better planning. The data
required in terms of current enrolment in different classes, number of teachers and actual
status of the school in terms of infrastructure requirements, number of teachers trained and
number requiring training etc. need to be collected. The gender desegregation also needs to
be collected. If a week is devoted for this purpose using the teachers then the data base can
be created.
A clear Management Information System will have to be designed and implemented in order
that the routine MIS can provide the data required for monitoring and managing school
education in the state. Considering the high volume of investment going into this area this
has been suggested.

45
7.2 Bringing administration of school education under one department
The current management arrangement for the school education is fragmented within the
state. There are a number of agencies that are responsible for these aspects. This is
causing considerable difficulty in managing and administering the schools and also results in
duplication of expenditure as well as flow of resources. Therefore it is suggested that he
administration is streamlined and brought under a single agency. If it is not feasible to bring it
under a single agency it may be necessary to constitute a high level coordination
mechanism in order to overcome the issues that have been highlighted.
7.3 Analysis of schools for over/under staffing
In the execution of MTEF overall averages have been taken for projection and calculation
purposes. Detailed analysis of each school in the different categories needs to be carried
out in order to identify schools that have overstaffing as per norms and those schools that
have staff below the norms. This needs to be carried out to improve the quality of teaching.
7.4 Human resource Planning
It is essential that over a period of the next year the Department carries out a detailed
Human resource Planning Exercise to analyse the age pattern of the current teachers and
the rates of retirement each year in order that the position based on the current staffing
pattern can be arrived at for each year in the future. This will enable the department to
identify any large scale retirements that will occur in any particular year and be able to plan
for it much ahead of that.
7.5 Enrolment drives and crash courses
The state has been doing well in terms of drives to enrol students in Class 1. However,
considering the age of the children it may be necessary to examine the age of the children
and put them through a crash course or bridge course to enable them to be enrolled in the
appropriate classes as per their age. This needs to be planned for if the universal access to
primary education is to become a reality.
7.6 Investment in capital structure
The capital outlay on education has been low in the past ten years and it will be necessary to
increase the investment in capital structures to increase the literacy rate and formation of
human capital in the state. Further, the government can carry out investment planning in

46
order that a sinking fund can be created to meet the future needs of the education such as
mid day meals, text books and uniforms through the return from these funds and also make
the schemes sustainable if the centrally sponsored and shared schemes were to close in
future.
7.7 Carrying out MTEF Periodically
It is necessary to carry out MTEF periodically every year in order that it can be rolled over for
the next three years and the requirement of resources is estimated to meet the policy
objectives in the area of education. This will provide a basis for negotiations with the finance
department on the budget allocations and will also increase the commitment to this sector.
This has to be looked at in the context of the overall sect oral MTEF that needs to be carried
out for the state.
7.8 Creation of an MTEF and MIS Cell
It is suggested that an MTEF and MIS cell be created within the Education department either
by contracting staff or by deputing interested staff in order that the personnel can be trained
and the exercise carried out regularly.