Embed Size (px)
Citation preview

Shifting the Paradigms of Health and Safety in Mining
SUMMER 2014
VOLUME 2 ISSUE 2 THE OFFICIAL JOURNAL OF THE WORLD COAL INDUSTRY
Energy Poverty in India and What’s Needed to Address It
Evaluating Safety and Health in Australia’s Mining Sector
An Analysis of the Interdependence Between China’s Economy and Coal
CO
RN
ERSTO
NE
THE O
FFICIA
L JOU
RN
AL O
F THE W
OR
LD C
OA
L IND
USTR
Y
SUM
MER
2014 • VO
LUM
E 2, ISSUE 2
Anthony HodgePresident International Council on Mining and Metals

1
Our mission is to defend and grow marketsfor coal based on its contribution to a higherquality of life globally, and to demonstrate andgain acceptance that coal plays a fundamentalrole in achieving the least cost path to a sustainable low carbon and secure energy future.
The World Coal Association has been influencing policy at the highest level for almost 30 years. No other organisation works on a global basis on behalf of the coal industry.
Our membership comprises the world’s major international coal producers and stakeholders. WCA membership is open to organisations with a stake in the future of coal from anywhere in the world.
The WCA has recently appointed Harry Kenyon-Slaney, Chief Executive of Rio Tinto Energy, as its new Chairman. It is an exciting time for the WCA and for the global coal industry. If you have an interest in the future of the coal industry, contact us to see how you can get involved: [email protected]
www.worldcoal.orgwww.worldcoal.org/extracttwitter.com/worldcoalwww.youtube.com/worldcoalfacebook.com/WorldCoalAssociation
Alpha Natural Resources Inc
WCA Associate Corporate Members
PT Adaro IndonesiaAnglo American Arch Coal IncBHP Billiton Bowie Resource Partners LLCCaterpillar Global MiningChina National Coal Group
Asociación Nacional De Empresarios De ColombiaASSOCARBONIAssociação Brasileira do Carvão MineralAssociation of British Mining Equipment CompaniesChina National Coal AssociationCoal Association of CanadaCoal Association of New Zealand
GE MiningGlencoreJoy GlobalKarakan InvestKatowicki Holding Weglowy S.A.Mitsubishi Development Pty LtdOrica Ltd
CoalImp - Association of UK Coal ImportersFossil Fuel FoundationGerman Coal AssociationIndonesian Coal Mining AssociationIranian Mines & Mining Industries Development& Renovation OrganizationJapan Coal Energy CenterMinerals Council of AustraliaMongolian Coal Association
Peabody EnergyRio Tinto EnergyShenhua GroupLLC VostsibugolWhitehaven Coal LimitedXcoal Energy & Resources
National Mining AssociationQueensland Resources CouncilShaanxi Institute of Geological SurveySvenska Kolinstitutet
WCA Members
WCA Associate Members
Milton CatelinWCA Chief Executive
WCA_advert_h273 x w206mm 18 June 2014.indd 1 18/06/2014 10:45

www.cornerstonemag.net 1
The current issue of Cornerstone focuses on mining energy poverty and safety. These two issues are connected by a common thread: Every person on this planet deserves to live and work in safe conditions.
Indoor air pollution caused from combustion of solid fuels, generally used by those without modern energy access, is one of the most important health and environ-mental problems facing our world today. Clean-burning cookstoves, safer solid fuels in the near term, and widespread electrification are necessary to reduce this deadly indoor air pollution and the associated unsafe living conditions—especially for women and children. Increased access to modern energy services can also offer greater opportunity for people to support themselves through gainful employment.
Providing enough electricity to combat energy poverty will require more energy from all sources, including coal, which is projected to provide about 50% of the on-grid additions. It is no secret that developing countries have relied on coal to increase electrification rates, the best example of which has occurred in China. India now stands to follow suit and today is investing in coal. Balancing climate and energy poverty considerations must become an important part of the energy dia-logue, but climate concerns cannot be a reason to keep billions of people living in unsafe conditions without modern energy access.
Although coal must play a role in lifting people out of poverty and to support job-creating industrialization, coal must be produced responsibly. As the content for this issue was under preparation the coal mine disaster in Turkey served as a reminder that some places do not yet practice robust health and safety standards.
Much of the safety-focused content in this issue is based on the successes achieved with modern mining that emphasizes health and safety. In the U.S. and Australia, for example, such a focus has led to a dramatic drop in accidents compared to past averages. Recently, however, both countries have struggled with plateaus and even spikes in their safety results, inspiring renewed efforts to continue to progress toward zero-fatality goals.
Much of the world’s coal is mined in China, where there is sufficient space to improve safety. Fortunately, there have been some recent indications of progress fueled by government support. From 2002 to 2013, fatal accidents decreased by 90%. The largest coal mining company in China, Shenhua Group, has developed a preemptive risk control system that has led to the lowest fatality rate of any coal producer in China; the implementation of this system is now spreading throughout China. Combined with an emphasis on fewer, larger, and more modern mines, there is reason to hope that mining safety will continue to improve in China.
To quote an article from this issue, “Although the minerals industry accepts that inherent hazards exist, there is no reason for working in the industry to be dan-gerous.” I hope that the successful safety programs discussed in this issue will encourage knowledge sharing around robust health and safety systems so that coal can play a responsible role in increasing the opportunity for everyone to have a healthy, productive life.
A Common Thread of Safety
FROM THE EDITOR
Holly Krutka Executive Editor, Cornerstone
2
CONTENTS
FROM THE EDITORA Common Thread of SafetyHolly Krutka, Cornerstone
VOICESCommitment to SafetyMilton Catelin, World Coal Association
Modern Energy: The “Golden Thread” That Connects People, Economies, and ProgressGregory H. Boyce, Peabody Energy
Studying the Dominance of Coal in China’s Energy MixZhang Kehui, China Shenhua Energy Co., Ltd
Hedging CarbonJim Spiers, Tri-State Generation and Transmission Association, Inc.
ENERGY POLICYAdvancing the Alleviation of Energy PovertyNicholas Newman, Cornerstone
Energy Poverty in India and What’s Needed to Address ItAnil Razdan, Energy and Environment Foundation
Balancing South Africa’s Energy Poverty and Climate Change CommitmentsNikki Fisher, Anglo American
Europe Struggles to Pay Its Energy Bill Aleksandra Tomczak, World Coal Association
11
15
36
1
911
1521
25
3630
39
4 Cover Story
Shifting the Paradigms of Health and Safety in Mining Anthony Hodge
Based on their most recent safety-focused conference, the head of ICMM explains why global mining industry leaders believe that there are two fundamental drivers for improvements in health and safety performance: 1) People come first, meaning that caring for the people in the industry should be the driver of all decision-making and 2) health and safety are values, not priorities. Whereas a priority can change over time, a value does not.
www.cornerstonemag.net 3
STRATEGIC ANALYSISShenhua Group’s Preemptive Risk Control System: An Effective Approach for Coal Mine Safety ManagementHao Gui, Shenhua Group
Evaluating Safety and Health in Australia’s Mining SectorMelanie Stutsel, Minerals Council of Australia
CORESafety®: A System to Overcome the Plateau in U.S. Mine Safety and Health ManagementBruce Watzman, National Mining Association
Sustainable Charcoal: A Key Component of Total Energy Access?Aaron Leopold, Practical Action
An Analysis of the Interdependence Between China’s Economy and Coal Xie Heping, Wu Gang, Sichuan UniversityLiu Hong, National Development and Reform Commission
TECHNOLOGY FRONTIERSSynergetic Technologies for Coal and Gas Extraction in ChinaYuan Liang, Huainan Mining Group
The Global Need for Clean Coal Technologies and J-COAL’s Roadmap to Get ThereUichiro Yoshimura, Toshiro Matsuda, Japan Coal Energy Center
GLOBAL NEWSCovering global business changes, publications, and meetings
LETTERS
42
57
72
4753
5762
6772
7880
42
Chief EditorGu Dazhao, Katie Warrick
Executive EditorHolly Krutka, Liu Baowen
Responsible EditorChi Dongxun, Li Jingfeng
Copy EditorLi Xing, Chen Junqi, Zhang Fan
Production and LayoutJohn Wiley & Sons, Inc.
CORNERSTONE (print ISSN 2327-1043, online ISSN 2327-1051) is published four times a year on behalf of the World Coal Association by Wiley Periodicals Inc., a Wiley Company 111 River Street, Hoboken, NJ 07030-5774.Copyright © 2014 World Coal Association
Editorial OfficeShenhua Science and Technology Research Institute Co., Ltd 006 mailbox Shenhua Science and Technology Park, Future Science & Technology City, Changping District Beijing 102211, China
Phone: +86 10 57336026 Fax: +86 10 57336014
Email: [email protected] (Chinese) Email: [email protected] (English) Website: www.cornerstonemag.net Visit our Group on LinkedIn Twitter: @Cornerstone_Mag
The content in Cornerstone does not necessarily reflect the views of the World Coal Association or its members.
Official Journal of the World Coal Industry
Published by John Wiley & Sons, Inc.
Sponsored by Shenhua Group Corporation Limited

4
In 2001, the International Council on Mining and Metals (ICMM) was founded to improve sustainable development performance in the global mining and metals industry.
Today, we bring together 22 mining and metals companies as well as 33 national and regional mining associations and global commodity associations to address core sustainable development challenges.
ICMM serves as an agent for change and continual improve-ment on issues relating to mining and sustainable development. Today, no issue is more important than that of the health and safety of the global mining workforce.
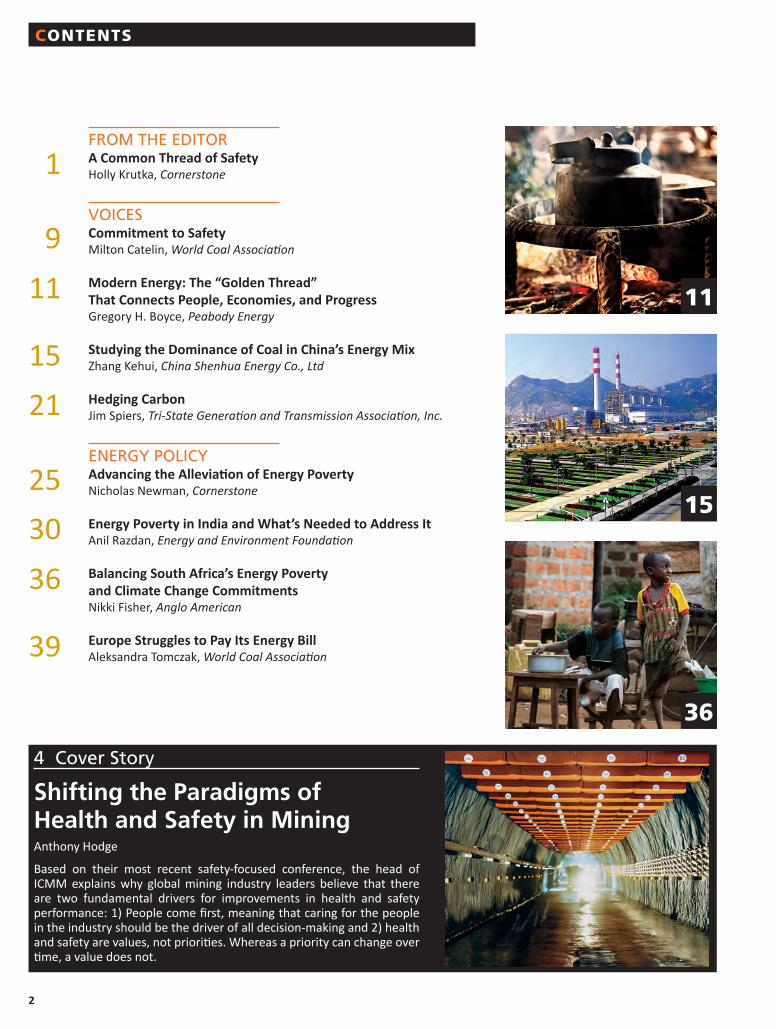
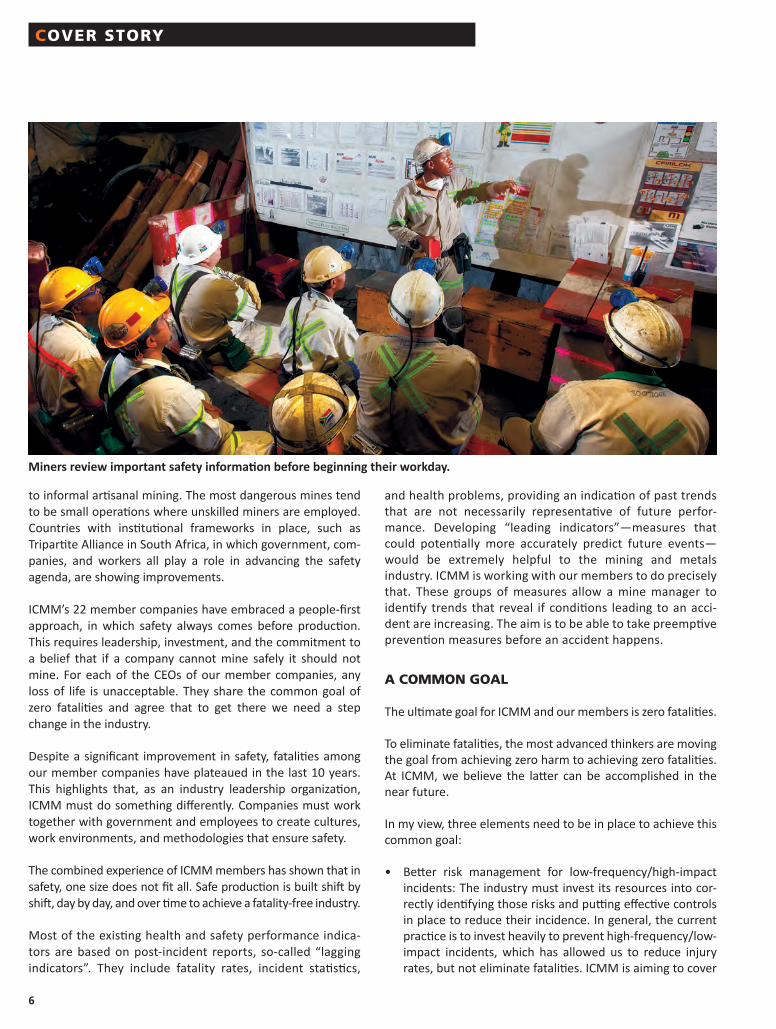
In 2012, ICMM held its second Health and Safety Conference in Santiago, Chile. From this meeting came two overarching themes that we believe must act as the fundamental driv-ers for improvements in the health and safety of the global mining industry: 1) People come first, meaning that caring for the people in our industry should be the driver of all decision-making and 2) health and safety are values, not priorities. Whereas a priority can change over time, a value does not. If the global mining industry hopes to obtain and secure the social license to operate, health and safety must always be at the core of our business.
Shifting the Paradigms of Health and Safety in Mining
By Anthony HodgePresident International Council on Mining and Metals
COVER STORY
4
“If the global mining
industry hopes to obtain and
secure the social license to operate,
health and safety must always be
at the core of our business.”

www.cornerstonemag.net 5
PEOPLE FIRST
The first priority of the global mining industry must be to pre-vent fatalities. Although the industry has made great efforts to reduce injuries, fatalities continue to occur. Human life is more important than production, so the thinking around min-ing health and safety must shift. Health and safety are first and foremost about the well-being of people. Improving health and safety is centered on building relationships with every person at every level: It is about building trust; it is about enacting the belief that human life and well-being are more important than production or economic value.
At ICMM events, chief executives, senior vice presidents, and technical workers have spoken with passion about how important it is to engage emotions in order to develop the appropriate approach to safety—how those in the industry have to make the issue personal before there will be success in communicating the importance of a culture of safety.
Engagement is not just about talking to stakeholders, or ap-pealing to their logic or their cognitive processes. Engagement at an emotional level promotes buy-in and participation at all levels of the operation. Most importantly, listening to stake-holders is the only true route to genuine engagement.
SAFETY IS A VALUE
Safety is a moral imperative, it is not a competitive issue. Traditionally, safety has been framed as a business priority, with the case for safety often made in terms of enhanced productivity and reduced costs. Information about safety man-agement measures generally has not been shared between companies, as it could be perceived to aid competitors.
Recently the industry has seen a radical shift from this per-spective, as evidenced at ICMM’s 2012 conference. The belief that safety is not a competitive issue was reinforced by many speakers, who noted that this now opens opportunities for collaboration in addressing common safety challenges. The significant level of willingness to collaborate on safety—as companies on the same journey toward a safe and healthy workforce, facing the same challenges—was an ardent refrain.
The safety performance journey has evolved to the current paradigm wherein behavior plays a crucial role in achieving safety targets. Yet we still see a gap between where the indus-try is currently, and achieving zero fatalities. Priorities change, especially in response to external pressures; values should not.
Considering safety a value extends the message beyond employ-ees, to all the people with whom the industry interacts, including contractors, families, and communities. A call was made for the
emotional connection with safety to be made by appealing to hearts and souls, recognizing the strong role that emotions play in realigning toward a values-based safety culture.
WHERE WE STAND TODAY: A NEED TO DEFINE INDICATORS
Finding comprehensive data and statistics on mining safety and regulations is a major challenge. There is no one-stop shop for safety data for the industry globally. Even when data can be extracted from different companies’ sustainability reports, national chambers of mines, and other organizations such as the International Labour Organization, comparing those numbers can lead to inaccurate conclusions because of the difference in reporting calendars and the definition of the indicators (what and how different organizations measure and define injuries or accidents).
Clearly, health and safety conditions vary from country to country. Even within an individual country, there can be wide disparity from mine to mine because the mining industry is very diverse—ranging from large operations with thousands of workers to small operations and, in numerous countries,
ICMM, led by Anthony Hodge, is working to bring together stakeholders at all levels to promote engagement about improving health and safety in mining.
6
to informal artisanal mining. The most dangerous mines tend to be small operations where unskilled miners are employed. Countries with institutional frameworks in place, such as Tripartite Alliance in South Africa, in which government, com-panies, and workers all play a role in advancing the safety agenda, are showing improvements.
ICMM’s 22 member companies have embraced a people-first approach, in which safety always comes before production. This requires leadership, investment, and the commitment to a belief that if a company cannot mine safely it should not mine. For each of the CEOs of our member companies, any loss of life is unacceptable. They share the common goal of zero fatalities and agree that to get there we need a step change in the industry.
Despite a significant improvement in safety, fatalities among our member companies have plateaued in the last 10 years. This highlights that, as an industry leadership organization, ICMM must do something differently. Companies must work together with government and employees to create cultures, work environments, and methodologies that ensure safety.
The combined experience of ICMM members has shown that in safety, one size does not fit all. Safe production is built shift by shift, day by day, and over time to achieve a fatality-free industry.
Most of the existing health and safety performance indica-tors are based on post-incident reports, so-called “lagging indicators”. They include fatality rates, incident statistics,
and health problems, providing an indication of past trends that are not necessarily representative of future perfor-mance. Developing “leading indicators”—measures that could potentially more accurately predict future events—would be extremely helpful to the mining and metals industry. ICMM is working with our members to do precisely that. These groups of measures allow a mine manager to identify trends that reveal if conditions leading to an acci-dent are increasing. The aim is to be able to take preemptive prevention measures before an accident happens.
A COMMON GOAL
The ultimate goal for ICMM and our members is zero fatalities.
To eliminate fatalities, the most advanced thinkers are moving the goal from achieving zero harm to achieving zero fatalities. At ICMM, we believe the latter can be accomplished in the near future.
In my view, three elements need to be in place to achieve this common goal:
• Better risk management for low-frequency/high-impact incidents: The industry must invest its resources into cor-rectly identifying those risks and putting effective controls in place to reduce their incidence. In general, the current practice is to invest heavily to prevent high-frequency/low-impact incidents, which has allowed us to reduce injury rates, but not eliminate fatalities. ICMM is aiming to cover
Miners review important safety information before beginning their workday.
COVER STORY

www.cornerstonemag.net 7
this gap with guidance on risk management set to be pub-lished later this year.
• A collaborative approach to share lessons learned and experiences: Health and safety is not a competitive is- sue, all in the industry lose (financially and in terms of reputation) when one member experiences a loss of life. Therefore, we must act openly and welcome all mecha-nisms that will help us share what we learn along the way. ICMM can, and is, playing a pivotal role.
• Leadership: This is the key; no initiative will succeed with-out a visible commitment from all levels of leadership. Leaders set the tone that enables or disables good health and safety performance. But leadership has to move beyond the well-intentioned rhetoric: We must match our words with actions.
For organizations looking at their health and safety strategies, these three elements should be included in any planning to make an impact.
A PAINFUL REMINDER
Last month, I was with 22 of our member company CEOs when the news broke of the terrible mining accident in Turkey. Along with my colleagues at ICMM, we were all deeply saddened and concerned.
The accident in Soma is an occasion for the industry as a whole to pause and reflect, while continuing with our commitment to improve safety performance. We hope that once the inves-tigation around the accident is complete and the root causes of the accident are known, its lessons are shared with the global mining industry. This type of knowledge sharing is the key to achieving continuous improvements in safety.
ADVANCING A GLOBAL AGENDA OF SAFETY
Our first major conference, aimed at reviewing practices, assessing progress, and considering actions to achieve the health and safety goals our members share, was convened in Johannesburg in 2006. At that event, we saw that, as an industry, we should be proud of the way we have made the well-being of our workers a priority and a core part of our busi-ness. We also saw that much more was needed to improve the industry’s performance.
At our second major health and safety conference in Santiago, Chile, we welcomed several CEOs and 300 health and safety ex-perts to discuss the most pressing issues for our industry. Again we saw evidence of significant progress. But we also saw a con-tinuing fatality rate that remains high and unacceptable.
Key themes from the conference represent a foundation on which ICMM continues to build its health and safety efforts. These themes are summarized in Table 1.
It was evident from the material presented at the 2012 con-ference that leading organizations understand that health and
safety programs are critical. Keeping employees, families, and communities safe and healthy is at the core of how the global mining industry must operate to have a profitable long-term business. Therefore, improving health and safety performance is, in itself, improving business. They cannot be decoupled.
In the words of Chuck Jeannes, CEO of Goldcorp: “It is self- evident that poor safety performance is indicative of poor bus- iness performance.” However, it is necessary to explore what it will take to make those health and safety programs effective and have a positive effect on achieving our business goals.
THE ROAD AHEAD IS PAVED WITH CHALLENGES
The first challenge is opening up the space for collaboration and ensuring that the industry speaks about things that go wrong as openly and transparently as possible. Commitment in the industry to a good health and safety performance does not always match actions, and a facilitator for collaboration can be a good way forward. At ICMM, we are striving to serve the industry in this important role of facilitator.
Second, leadership in health and safety needs to be highly per-sonal and value-based. It is difficult to design the right training to instil value-based leadership, which brings us back to the importance of aligning our company values to enable leaders to accept change and admit where we are vulnerable.
Last, but most important, we have to recognize that there is no simple solution. Health and safety are multifactorial complex issues, which require an integrated approach. This integration must be at all levels and of all types: using multidisciplinary teams; integrating programs, processes, systems, and models; and cutting across company boundaries into communities.
This investment decision is simple for our member companies. There is consensus among the leadership organizations of our
“Leaders set the tone that
enables or disables good health
and safety performance.“

8
industry: Improved health and safety is good practice and good business.
ENSURING A SAFER ROAD
Safety is not just about technology and rules; ultimately it is about people and leadership. It is about making sure every person in the mine—from employees, to contractors, to visi-tors—has the right and the responsibility to stop and flag when they see or suspect that an unsafe behavior is going on. It is about having an organizational culture with a zero fatalities
goal and placing respect for human health and safety above all else. Safety before production is what makes the most busi-ness sense and our CEOs know this; we hope ICMM can help to spread this approach to health and safety throughout the industry.
Safety is a journey, and different companies are at different stages on that journey. Safety is also a non-competitive issue; the industry as a whole should be able to learn something from every tragedy and incorporate the lessons learned into the way we work.
COVER STORY
TABLE 1. Safety themes forming the foundation of ICMM’s health and safety efforts
Theme Message Challenge
Overarching theme:People first
Care for people as the driver of all decisions within the mining industry, with everyone taking personal and collective ownership of their areas of respons- ibility and influence.
Actions do not mirror stated intentions, and the genuine difficulties in making this a reality are not discussed as openly as they could be.
Theme 1:Shifting paradigms
Safety is a value, not a priority, and therefore highly personal. Deep values are consistent; priorities change.
Not everybody is willing to undergo the personal transformation process required to implement this. Health does not receive as much attention as does safety—it remains a business imperative, rather than a value.
Theme 2:Leadership
Leadership for health and safety is highly personal, based in the leader’s values, which are acted out consistently, rooted in care and concern for people. Everybody is a leader in their own right and takes ownership for the influence that they have on others.
There is not enough of this type of leader-ship in the industry. It is difficult to train people in the qualities of courageous leadership needed for a transformation in health and safety performance.
Theme 3:Collaboration and learning through sharing experience
Workers, supervisors, managers, and executives need to work together internally through robust and more open communication. Such communication is equally needed between mining companies. High levels of transparency and willingness to change are needed for the level of collaboration required between the sector and those outside it.
Aligning the values across diverse groups depends on the willingness of all to accept change and to admit vulnerability.
Theme 4:Integrated well-being
The complexity of health and safety issues demands an integrated approach. The integration is at all levels and of all types: using multidisciplinary teams; inte-grating programs, processes, systems, and models; and cutting across company boundaries into commu-nities, for partnerships.
Simplifying complexity is difficult, and has no “silver bullet”. That all of this takes time is a significant challenge; production pressures, cynicism, and disappointments threaten efforts in this regard.

www.cornerstonemag.net 9
VOICES
By Milton CatelinChief Executive, World Coal Association
Nothing is more important to the coal industry than ensuring our people return home safely at the end of the working day. A combination of rigorous safety
processes, employee training, new technologies, and better communication has led to significant improvements in safety in coal mining globally. The articles in this issue of Cornerstone, including from a number of WCA members, demonstrate the level of commitment to improving safety performance globally.
However, the pursuit of safety is a continual process. The recent accident at the Soma mine in Turkey was a tragic reminder of the need for constant vigilance on safety and the vital importance of the highest safety standards and practices across all mining operations.
The members of the WCA are committed to working across the industry at a global level to share our knowledge about safe work practices and to encourage all companies in the coal industry to set the same high standards. We will be contacting the Turkish government to offer our support to ensure that lessons are learned from this disaster and to share the knowl-edge and expertise of our members.
SAFETY IN OUR OPERATIONS
As leaders of the global coal industry, WCA members are expected to operate with the highest standards when it comes to ensuring the safety of our workers. All WCA members are expected to deploy state-of-the-art safety systems and to share knowledge, wherever possible, and work cooperatively to help make that happen.
WCA members place four core components at the heart of ensuring workplaces are as safe as possible:
• Implement a culture of risk management—identifying hazards, undertaking risk assessments, and implementing controls are crucial steps in reducing the risk of incidents.
• Work in partnership with our people—empowering them to share concerns and being open to suggestions for improved performance.
• Safety is everyone’s responsibility—people in every aspect of our operations have a role to play in creating a safe workplace.
• Safety and health can always be improved—a workplace learning culture can always apply new ideas for improving safety and learn lessons from mistakes.
LEADERSHIP
There are many examples of the work that is being carried out by coal companies and associations to make further progress on safety. In 2013, the WCA launched the “Leadership and Excellence Awards” to recognize outstanding achievement and innovation in the international coal industry and its value chain. The awards also aim to help drive further environmental and safety improvements and innovation across the industry.
Commitment to Safety
“The members of the WCA are
committed to working across the
industry at a global level to share our
knowledge about safe work practices
and to encourage all companies … to
set the same high standards.”
Working across the global industry to share knowledge about safe work practices is an important part of improving safety.

10
One of the four awards presented—the WCA Award for Leadership on Mining Safety—recognized projects or prod-ucts that enhance the coal industry’s safety record. The award was presented to the Shenhua Group, in recognition of their extensive program to improve safety at their operations. This work included establishing a modern safety management phi-losophy and corporate culture, actively exploring and applying a Coal Mine Preemptive Risk Control System, raising invest-ment on safe production and technological innovation, and training employees to improve their competence.
Perhaps Shenhua’s approach to safety was best summarized by Harry Kenyon-Slaney, WCA’s new Chairman and Chief Executive of Rio Tinto Energy, who sat on the judging panel:
Shenhua’s achievement in safety performance across a diverse range of coal mines is truly very impressive. Such high levels of sustained performance require a strong commitment to safety throughout the entire company and the management systems and processes to deliver against that vision. There can be nothing more important than the well-being of our employees. Shenhua is to be congratulated for world-class safety outcomes.
The runner-up for the WCA Award for Leadership on Mining Safety was the U.S. National Mining Association (NMA), which was recognized for its important work on safety through the CORESafety® program. In addition, Greg Boyce, Chairman and
Chief Executive Officer of Peabody Energy and a key figure in the development of CORESafety®, alongside other industry leaders, was also recently awarded the 2014 WCA Chairman’s Special Award in recognition of his global leadership on mining safety.
FURTHER IMPROVEMENTS
This level of leadership and commitment on safety is essen-tial to ensuring we continue to make improvements in safety standards. For WCA members, the goal is the elimination of fatalities, injuries, and workplace illnesses in operations. Our members believe in the continuous improvement in safety performance and, to that end, the WCA has committed to
• Publish, on an annual basis, information about action taken across our member companies to improve safety performance;
• Develop a reporting framework across our membership to provide statistical information about our safety performance.
To reiterate, ensuring our people return home safely at the end of the working day is of the utmost importance to the WCA. For WCA members, safety is a value and it is fundamen-tal to the way we do all things; we must continue to work to ensure our workplaces are as safe as possible.
If you would like a copy of the WCA Commitment to Safety, please email [email protected] or visit www.worldcoal.org
“Ensuring our people return
home safely at the end of the
working day is of the utmost
importance to the WCA.”
VOICES
World Coal AssociationLeadership &Excellence Awards

www.cornerstonemag.net 11
By Gregory H. BoyceChairman and CEO, Peabody Energy
Access to modern energy is as basic as food, water, or shelter, enabling a high standard of living, and helping people live longer and better. Every single one of the
UN Millenium Development Goals depends on energy. Yet one of every two citizens in the world—about 3.5 billion people—awaken each day with little or no access to energy (see Figure 1).1–3 For these people there is no enduring light, no refrigerators to keep food fresh, no clean, safe way to warm their homes.
Most shocking of all, is the weight of this blight on our chil-dren. As many as 1.2 billion children are growing up today without proper electricity.1 About half the primary school chil-dren in the developing world attend schools with no power, cooling, or heat.4 Tragically, some 17,000 children die each day from the lack of resources that electricity brings—clean water, adequate food, better sanitation, and access to medicine.5
Billions in South Asia and Sub-Saharan Africa spend their days foraging for wood, biomass, or dung for fuel to cook meals for their families or heat dwellings, a load that falls heaviest on women and children. Young girls are often held back from school to help their mothers who are responsible for this daily chore.
This perpetual hunt for fuel, and the smoke from daily fires, result in staggering consequences. By some estimates, each
hour of exposure to indoor fire has the same effect of expo-sure to 400 cigarettes.6 Debilitating illness results. Lives are lost prematurely. Quality of life is sorely diminished. Household air pollution from indoor fires has been estimated to be the fourth leading cause of death globally.
Household air pollution from indoor fires results in a stunning 100 million years of life prematurely lost each year, based on Disability Adjusted Life Years (DALY), a metric established by the World Health Organization. Each DALY represents one year of healthy life lost to disease.
The world cannot allow these conditions to continue. Energy poverty is the largest human and environmental crisis facing the world today. Solving this problem must become job one for all of us.
LACK OF ENERGY IS DEVASTATING TO THE ENVIRONMENT
For billions, the daily use of primitive biomass for cooking and heating is a matter of daily survival. Yet this practice releases dense soot and smoke into indoor and outdoor environments, which has terrible impacts to human health and is bad for the environment. Gathering and burning wood and other biomass leads to massive deforestation, erosion, land degradation, and contaminated water supplies.
As local forests decline, women walk whatever distance it takes to keep their families warm and fed. In areas such as South Darfur, this commute can be seven hours per day.7 In Africa alone, deforestation is estimated to equal the annual loss to forest across an area the size of Switzerland.8
Across India, South Asia, and elsewhere in the developing world where as many as three billion people depend on bio-mass; they burn biomass at the astounding rate of two tons per family per year. In the aggregate, this releases one billion tons of carbon dioxide into the atmosphere.9
Modern Energy: The “Golden Thread” That Connects People, Economies, and Progress
FIGURE 1. Half the world’s seven billion people lack adequate energy access for basic needs, and as many as 1.2 billion are children. Some 17,000 children die each day from the lack of resources that electricity brings.1–3
“Energy poverty is the largest
human and environmental crisis
facing the world today.”

12
We need to recognize the enormous health and environmen-tal benefits in ending energy poverty, eliminating household air pollution, and increasing access to low-cost electricity. Everyone in the world deserves to live as well as those in devel-oped nations. Let’s use more energy, more cleanly, every day, with coal as a major part of the solution. Coal is a fundamental environmental solution when turned into electricity and synthetic natural gas at a large scale, and can eliminate the dev-astating human and environmental effects of energy poverty.
LACK OF ENERGY CREATES AN UGLY ECONOMIC SPIRAL
Lack of energy hurts families and children. It also stalls per-sonal and professional growth, creating a wicked economic spiral. Consider the story of Muhammad Latif, an entrepre-neur who built a thriving textile factory in Pakistan thanks to a start-up loan from his father. In the late 1990s, his factory flourished among the largest in the nation, turning out high-end sportswear and linen for some of America’s best known designers and brands.
Mr. Latif and other industrialists of the day never realized that Pakistan’s energy supply would literally run dry. He recalls that, in late 2007, natural gas was choked off. Today, power outages in the city run as high as 12 hours a day, crippling industry and opportunity.
“We could not even think that we’d run out of gas,” says Mr. Latif. “Without energy, our wheels don’t go round, so how can we produce?” Now much of the equipment in his factory sits idle. What was once a thriving workforce of 14,000 has dwindled to about one third of peak levels. Sales are down nearly 75%.10
About one third of the population in Pakistan has no electric-ity at all. The new government pledges reforms, and late last year the Asian Development Bank (ADB) approved a $900 mil-lion loan to build a 600-MW coal-fired plant as a step toward alleviating acute power shortages. The Director General of the ADB explained the loan as part of an “urgent need for more affordable and dependable sources of power”.11
Coal remains the sustainable energy choice with the scale to meet enormous long-term needs, and its use continues rising around the world. Coal is easily transported and always acces-sible. Supplies are stable and avoid the risk of political whims. Globally coal is increasingly essential to the world’s energy mix as the fastest-growing major fuel, set to surpass oil as the world’s largest fuel in coming years.
Growth in coal use globally occurs as Europe’s renewable strategy is being questioned, the continent is threatened by Russia’s energy security challenge, and nations like Germany and Japan are using significantly more coal. Coal is abundant, reliable, low cost, and clean, thanks to today’s advanced tech-nologies. It is also essential for human development.
Household air pollution from indoor fires results in a stunning 100 million years of life prematurely lost each year, based on Disability Adjusted Life Years (DALY), a metric established by the World Health Organization. Each DALY represents one year of healthy life lost to disease.
VOICES

www.cornerstonemag.net 13
MODERN ENERGY IS TRANSFORMATIVE FOR LIFESTYLES, LIVELIHOODS
The UN Secretary General has called energy “the golden thread that connects economic growth, increased social equity and an environment that allows the world to thrive”.12
Around the world, tens of millions of people are leaving grind-ing poverty behind and entering an emerging global middle class through the elevating hand of electricity. In South Africa, for example, rapid electrification in the past two decades, led largely by coal, has increased energy access from just 30% of the population in 1990 to more than 75% today.2
China offers another remarkable success story, where the nation has used coal to lift 650 million people from poverty, reduce female illiteracy by nearly 80%, and decrease infant mortality by 70%. China’s urbanization program offers another example of a plan that will enable people to enjoy modern electricity in efficient urban areas.13
Underpinning this transition is a call for a massive infrastruc-ture development program to build expressways, railways, hospitals, schools, airports, and housing…all of which require enormous amounts of steel to make and energy to use, which points to greater use of coal.
Consider another example in a remote community on the Navajo Reservation in the U.S. West where Peabody operates. Today, an electricity line is being brought to the small town of LeChee, in a project that ultimately will connect more than 60 Navajo families to the grid for the first time. Their power comes from baseload coal from the largest coal plant in the state. The project was advanced jointly with the local utility, the Navajo Nation, and the tribal utility provider.14
Among the beneficiaries is Margie Tso, an 80-year-old matri-arch, whose home was connected in April after she raised eight children without electricity. She says she is looking for-ward to reading more and using modern conveniences like a microwave, coffee maker, and toaster. For Mrs. Tso, dozens of Navajo families, and hundreds of millions around the world, access to energy is transformative for lifestyles and livelihoods.
CREATING ENERGY ACCESS WITH AN “ALL OF THE ABOVE” STRATEGY LED BY COAL
The need for affordable energy access is dramatic, and the call to action urgent. Peabody’s Advanced Energy for Life Campaign seeks to advance solutions by building awareness and support to eliminate energy poverty, increase access to reliable, low-cost electricity, and improve emissions using today’s advanced clean coal technologies.
In the U.S. and in other developed nations, access to low-cost electricity remains essential, especially at a time when 48 mil-lion Americans live in poverty. A record ~115 million qualify for energy assistance15 and more than half of Americans have said that as little as a $20 increase in utility bills would cause hardship.16 In Australia, families suffer from a 110% increase in electricity the past five years.17 Many Australian families assisted by the Salvation Army have reported that they can’t afford to heat or cool just one room.18
Through Advanced Energy for Life, our goal is to improve understanding and ultimately drive actions and policies that will extend lives, build economies, and improve the environ-ment both indoors and out. We get there through an “all of the above” energy approach. The world needs more solar and wind power, more nuclear and hydro, more natural gas and oil, and, above all, far greater use of coal.
Peabody supports a plan that calls for half of new generation to come from today’s high-efficiency supercritical coal plants that can achieve a key emissions rate that is two thirds that of the existing U.S. fleet. Even the carbon dioxide emissions rate is 25% lower than the oldest U.S. plants.19
Each large supercritical plant delivers the equivalent carbon benefit of removing one million cars from the road versus older conventional plants; an unprecedented 550 GW of these advanced coal plants are in use or development around the world, with the vast majority being funded and built in emerg-ing Asia (see Figure 2).20
Too many of the world’s children have no modern energy in their lives…no lights to read by, no laptops for school work, no digital devices to bring their communities into the 21st century.

14
Next on the plan to advance energy solutions, we favor deploy-ment of coal conversion technologies that use coal to produce liquid fuels and synthetic gas.
Finally, longer term, continued investment is needed to ad-vance technology toward next-generation applications that ultimately will generate coal power with virtually no emissions, and this includes carbon capture and storage technologies for various uses.
This combination of advanced coal and coal conversion tech-nologies achieves an environmental improvement that is well beyond what the carbon policy experiments of recent years have failed to deliver.
As we look to the future, we must work together to create energy solutions that drive progress toward a rise in global living standards, improved health and longevity, and a clean environment. The solution is using all forms of energy and especially 21st century coal.
Together, we can end the most challenging human and environ-mental crisis we face if we are willing to work with allies across all sectors, with multinationals, non-governmental organiza-tions, and governments all over the world. Let’s work together to extend the golden thread of modern energy that connects people, economies, and progress, creating a new beginning that transforms lifestyles and livelihoods for billions globally.
REFERENCES
1. International Energy Agency. (2012, November). World energy outlook 2012, www.worldenergyoutlook.org/publications/weo-2012/
2. The World Bank. (2012). World development indicators 2012,
data.worldbank.org/data-catalog/world-development-indica-tors/wdi-2012
3. Central Intelligence Agency. (2012). World factbook 2012, www.cia.gov/library/publications/download/download-2012/index.html
4. Practical Action. (2013, April). Poor people’s energy outlook 2013. Chapter 1: Energy for community services. Rugby, UK: Practical Action Publishing. cdn1.practicalaction.org/docs/ppeo-2013-practical-action.pdf#page=19
5. UN Inter-agency Group for Child Mortality Estimation. (2013). Child mortality report 2013. New York: United Nations Children’s Fund. www.childmortality.org/files_v16/download/UNICEF%202013%20IGME%20child%20mortality%20Report_Final.pdf
6. Fraser, B. (2012, 11 July). Killer cookstoves: Indoor smoke deadly in poor countries; cleaner stoves elusive. Environmental Health News, www.environmentalhealthnews.org/ehs/news/2012/not-so-improved-cookstoves
7. Clemente, F. (2014, February). Coal lifts billions from energy poverty and increases access to low-cost electricity at scale. White paper, www.advancedenergyforlife.com/sites/default/files/Clemente%20Energy%20Poverty%20White%20Paper.pdf
8. Sackitey, F.L. (2013, 2 May). Bamboo energy can save African for-ests. African Business Magazine, africanbusinessmagazine.com/features/agriculture/bamboo-energy-can-save-african-forests
9. Yadama, G.N. (2013). Fires, fuel and the fate of 3 billion: The state of the energy impoverished. Oxford University Press.
10. Shah, S. (2013, 29 November). Power outages hobble Pakistan’s biggest exporters. Wall Street Journal.
11. Watanabe, C. (2013, 9 December). ADB to lend $900 million for coal plant unit in Pakistan. Bloomberg, www.bloomberg.com/news/2013-12-09/adb-to-lend-900-million-for-coal-plant-unit-in-pakistan.html
12. The World Bank. (2011). Access to electricity [data], data.world-bank.org/indicator/EG.ELC.ACCS.ZS
13. Johnson, I. (2014, 17 March). China releases plan to incor-porate farmers into cities. New York Times, www.nytimes.com/2014/03/18/world/asia/china-releases-plan-to-integrate-farmers-in-cities.html
14. Fonseca, F. (2014, 13 April). Navajo families receive electricity for first time. Associated Press, bigstory.ap.org/article/navajo-families-receive-electricity-first-time
15. U.S. Department of Health and Human Services, Low Income Home Energy Assistance Program. (2011). LIHEAP Home energy notebook for fiscal year 2009, www.acf.hhs.gov/sites/default/files/ocs/fy2009_liheap_notebook.pdf
16. The Heartland Institute. (2009, April). Research findings on climate change, electricity usage and cost, and cap and trade auction legislation. Memorandum submitted by Lauer Johnson Research to National Rural Electric Cooperative Association.
17. Australian Bureau of Statistics. (2013). Consumer Price Index Australia 2013.
18. The Salvation Army. (2013, May). National Economic and So-cial Impact Survey, www.salvationarmy.org.au/en/Who-We-Are/Publications-reports-submissions/Reports--Submissions/Latest-Reports/National-Economic-and-Social-Impact-Survey-May-2013/
19. U.S. Energy Information Administration. (2013). Annual energy outlook 2014, www.eia.gov/forecasts/aeo/er/pdf/0383er(2014).pdf
20. Platts. (2013). World electric power plants database 2013.
More information is available at AdvancedEnergyForLife.com
FIGURE 2. An unprecedented build out of supercritical capacity is underway globally, with more than 550 GW in use or development. These plants are highly efficient and deliver major environmental benefits, including the reduction of CO2.1
China325GW
Germany16GW
India25GW
Japan 31GW
Other EU13GW
ROW30GW
Russia15GW
S. Korea20GW
U.S.92GW
ASEAN2GW“A single, large coal
plant, if built withthe best-available
technology, canreduce emissions
by the annualequivalent of taking
a million cars offthe road…”
Maria van der HoevenExecutive Director
International Energy AgencyDecember 2012
VOICES

www.cornerstonemag.net 15
By Zhang KehuiChief Financial Officer, China Shenhua Energy Co., Ltd
China is facing serious environmental problems. Unlike most developed countries that had experienced such problems in their post-industrial eras, China is still in
the process of industrialization. How to maintain a balance between economic development and environmental pro-tection is quite a challenge for the country; the selection of sources of primary energy has a direct impact on the total costs of a society and, therefore, must be comprehensively evalu-ated based on four key factors: cost-effectiveness, security/ safety, environmental impact, and availability. Although the current mainstream discussion around the future of coal may be negative, after careful consideration it can be con-cluded that coal will continue to maintain its position as the dominant primary energy source for the foreseeable future. However, ensuring that it is produced and utilized as cleanly and responsibly as possible must be driven through economic and regulatory approaches.
UNCERTAINTIES REGARDING THE DOMINANCE OF COAL
For more than 60 years, since the foundation of the People’s Republic of China, coal, also given the nickname “food for
industries”, has been consistently the dominant source of primary energy in China. In 1952 coal reached its highest per-centage of primary energy, 95%. Even during the last decade, this figure has never fallen below 65%. However, with increas-ingly serious environmental concerns in recent years, a growing number of people have been questioning coal’s dominant role.
Environmental Pressure
In January 2014, China witnessed the highest monthly num-ber of average hazy days since 1961, and continuous and high-intensity haze pollution was reported in 10 provinces nationwide. Many research institutions have cast mining and coal consumption as the main causes for China’s environmental problems.
Although China’s environmental performance on coal mining
Studying the Dominance of Coal in China’s Energy Mix
“Coal will continue to maintain
its position as [China’s] dominant
primary energy source for the
foreseeable future.”
Modern coal mines can employ technologies to achieve zero discharge of dust or gangue to the nearby environment; the mine is a closed loop process to mitigate affecting the environment.

16
has improved, there are still some major concerns that must be addressed. For instance, the accumulation of coal gangue, discharge of mine water, and uncontrolled release of coal bed methane.
Regarding coal consumption, according to 2009 national statis-tics, high coal-consuming industries, such as coal-fired power, coking, steel, and building materials, emitted approximately 7.29 million tonnes of particulate matter, 16.05 million tonnes of SO2, and 3.254 billion tonnes of CO2, each accounting for more than 50% of the nation’s total respective emissions. To cope with the increasingly serious problems of air pollution, in September 2013 China’s State Council issued the “Action Plan for Air Pollution Prevention and Control”. The Plan noted that, by 2017, the concentration of particulate matter in regions like the Beijing-Tianjin-Hebei area, the Yangtze River Delta, and the Pearl River Delta needs to be decreased by about 25%, 20%, and 15%, respectively. The 10 concrete measures outlined in the Plan also require that coal, as a percentage of primary energy, be decreased to less than 65% by 2017.
Additionally, the coal-fired power and the coal conversion industries are characterized by significant water consump-tion; moreover, most such plants are located in western China where coal is rich, but water resources are scarce. The impact of industrial development on the local water resources cannot be ignored.
Therefore, pressure based on environmental concerns and the adjustment of national energy policies has led many people to believe that the dominant position of coal in China has become vulnerable.
The Rise of Alternative Energy Sources
With the growing global demand for alternative sources of energy, such options are thriving in China and are juxtaposed to the dominance of coal in China’s energy mix.
According to the national energy development plan, by 2020, 30 nuclear power plants will be built with an annual power generation capacity of 40 GW producing 260 billion kWh each year. The cumulative grid-connected wind power capacity is projected to reach 62.66 GW, producing a projected 100.8 billion kWh annually. China’s installed solar power capacity is planned to reach 50 GW annually, producing 150 billion kWh. In addition, shale gas production is projected to increase to 100 billion m3. An earlier goal was set for geothermal power capacity, which is planned to provide 100 MW, and for the pro-duction of coal-bed methane, which will reach 30 billion m3.
The development and utilization of these alternative energy sources could directly replace an annual coal production
capacity of around 200 million tonnes. Based on these figures, some believe that the dominance of coal in China’s energy mix can be displaced by alternative energy sources.
Market Downturn
Since the start of the 21st century, China has seen a rapid growth of more than 10% in coal sales. However, beginning in 2012, growth in sales has been slowing and the coal mar-ket has been weak. The growth rate at the beginning of 2014 was less than 2%, highlighting the issue of oversupply. By 2013, China’s coal production capacity had reached 4.63 bil-lion tonnes plus an extra 300 million tonnes of imported coal, but coal consumption in the same year was only 3.61 billion tonnes. This oversupply has caused a decrease in coal prices. By the end of February 2014, the price of Qinhuangdao 5500K steam coal had fallen to RBM537 (US$86). In addition, the total coal inventory of the seven northern ports had reached 27 million tonnes, a historical high. Industry insiders are deeply concerned and some have become increasingly pessimistic—to the point they have commented about the imminent end of China’s era of coal.
COMPREHENSIVE EVALUATION OF CHINA’S DOMINANT ENERGY SOURCE OPTIONS
The selection of a principal primary energy source is closely related to the ability to sustain the national economy; there-fore, the selection cannot be based on mainstream consensus, but must consider how to best balance economic develop-ment and environmental protection. Taking the long-term well-being of the Chinese people into consideration, a sys-tem with set scientific and comprehensive evaluation criteria was established so as to make economy-wide comparisons between sources of energy in terms of cost-effectiveness, security/safety, environmental impact, and availability.
Structure of the Comprehensive Evaluation System
When considering a dominant energy source, it is important not to overgeneralize the criteria, define energy sources via only one characteristic, or even to veto an energy source because of one area of concern. At the very least, I believe the following four factors should be reviewed:
Cost-effectiveness: In this case, the term refers to a ratio between the input costs for the utilization of energy and its output efficiency. China is a developing country and develop-ment remains the top priority for social progress; therefore, at this stage, cost-effectiveness should be given priority during the evaluation process.
VOICES

www.cornerstonemag.net 17
Security/Safety: This term covers two levels of security/safety. On the macro level, it involves national energy self-sufficiency and the associated geopolitical security; on the micro level, it refers to actual energy production safety—namely, the extent of injury and damage to human life and property during the process of energy production, transportation, and utilization.
Environmental impact: This refers to the extent of environ- mental impact that could occur during energy production, transportation, and utilization.
Availability: This term is related to the cost-effectiveness fac-tor, but specifically refers to the convenience of energy access (both mining feasibility and transport requirements) and utili-zation based on technological and economic feasibility.
Using the Factors to Analyze Alternative Energy Sources
The above energy evaluation criteria can be used to analyze and compare other alternative energies, enabling us to make the right choice. With respect to fossil energies, oil and gas could not compete with coal for the dominant position since China has little oil and gas, with reserves accounting for only 2.82% and 3.07%, respectively, of China’s total fossil reserves, compared to 94.11% for coal.
The exploration of shale gas in the U.S. has led to the shale gas revolution in the region, and is helping the U.S. to make rapid progress toward achieving energy independence. According to estimates, China’s shale gas reserves total 30.7 × 10¹² m3 (mid-value), which ranks first in the world. However, due to factors such as immature production tech- nology, high production cost (due to geological conditions very different from those in North America), and excessive water consumption, it is still too early to talk about large-scale
development of shale gas in China.
By the end of 2013, nuclear power installed capacity nation-wide was 14.61 GW and the power generation volume was 112.1 billion kWh, with an average plant availability time of 7893 hr/yr (>90% capacity factor). With respect to the four evaluation factors, nuclear power does well in terms of cost-effectiveness and availability, but due to immature nuclear waste treatment technology, its safety and environmental friendliness are of concern. Recently, the Fukushima accident further heightened concerns around nuclear power, and pro-tests against the construction of nuclear power plants have been occurring globally. Currently, on a percentage basis in China’s energy mix, the contribution of nuclear is less than 1%; there is still great uncertainty about the large-scale develop-ment of nuclear power in the future.
When considering solar photovoltaic (PV) energy, there are certainly advantages in respect to the safety and environmen-tal friendliness factors, but given the low energy density, large footprint, and geographical restrictions associated with solar energy, its underperformance in the cost-effectiveness aspect has been causing concern for China’s government, similar to issues faced in some developed countries. For example, in 2012 the Parliament of Germany reduced direct subsidy to the PV power industry by 29% from the original €0.50/kWh as a result of the excessive financial burden. For a developing country like China, taking the current power generation cost into consideration, large-scale development of the PV power industry would inevitably result in huge financial subsidies that would be difficult for the government, and the growing economy, to justify.
Wind power is another option as a primary energy source. The safety and eco-friendliness aspects of China’s wind energy are generally positive, but because the grid technology for wind power generation is not yet mature and the power pro-duced is unreliable, it results in high operating costs. Even so, China is the world’s number one wind power producer; as of the end of 2013, the installed wind power capacity was 91.4 GW, accounting for 6% of the total national installed capacity. However, the average time of availability was only 2080 hr/yr, much less than the 5012 hr/yr average for coal-fired power plants. Wind power generation in 2013 was 140 billion kWh, providing only 2.7% of total national power generation. The large-scale deployment of wind farms to replace coal-fired power generation is uncertain and remains subject to break-throughs in energy storage and smart grid technology.
Hydropower is an important source of clean energy. China’s hydropower installed generation capacity in 2013 was 280 million kW and the planned generation capacity by 2020 will be at least 420 million kW—84% of China’s total economically
Coal is shipped from the Shenhua Tianjin port to the various destinations where it is needed.

18
exploitable hydropower (estimated at 500 million kW). There is some concern regarding the local environmental impact of the large-scale construction of hydropower stations, which should not be ignored. Therefore, mainly from the perspective of development potential, hydropower also cannot replace the dominant role of coal-fired power generation.
To sum up the evaluation of all energy sources, although nuclear energy, solar energy, wind energy, hydropower, and shale gas could be developed to replace coal energy to a cer-tain extent, coal will still maintain the dominant position in China’s energy mix into the long-term future.
Coal-Related Intrinsic Advantages and Technological Development
Among China’s proven fossil energy reserves, coal makes up the overwhelming majority (94%); this vast reserve is the third largest in the world. Over the past 14 years, RMB3.1818 trillion (US$511 billion) has been invested in the mining, bene-ficiation, production, and supply chain of coal, which accounts for 20% of the total investment in China’s energy sector. The mining technologies used by China’s largest coal enterprises are competitive with the best in the world. All these factors offer an enormous advantage for coal when considering fac-tors such as cost-effectiveness and availability.
In terms of security/safety, China’s abundant coal reserves provide a reliable basis for energy security. In 2013, 58% of oil in China was imported, but due to the large amount of coal resources, 90% of China’s energy is domestically sourced. When considering the safety of production, coal production in China still has significant risks, but these risks are being reduced through the expansion of modern mining practices. For instance, the fatality rate per million tonnes of coal in China’s coal industry has dropped by nearly 90% in only a few years, from 2.81 in 2005 to 0.293 in 2013. China’s largest coal producers have already achieved safety standards comparable with those of the mining industry in developed countries such as the U.S. With further development and deployment of sci-ence and technology, safety in mining can be further improved.
In China, big coal-related energy enterprises, such as Shenhua Group, are also committed to decreasing the environmental impact of coal production and utilization. For coal mining, technologies involving environmental mining practices, water conservation, and integrated utilization of resources have been developed. In some mining areas, the vegetation cov-erage during mining has been increased by nearly 50% and zero discharge of mine water has been accomplished; in some cases water is processed and used to fulfill over 95% of the local need. For coal utilization, several high-efficiency, low-emissions, coal-based electricity generation technologies,
including GW-sized ultra-supercritical (USC) technology, have been mastered. Similarly, technologies for SOx, NOx, and partic-ulate matter emissions have been developed to the same level as developed countries, but have not yet been fully deployed. For coal conversion, several chemical technologies, such as direct coal liquefaction, indirect coal liquefaction, and coal-to-olefins, has been developed. By 2020, the planned capacity of coal-to-liquids (CTL) is 30 million t/yr; coal-based to synthetic natural gas production is planned to be 50 billion m3/yr.
The environmental impact of coal utilization remains the major concern, both domestically and abroad, associated with coal as an energy source. It is not only a problem constraining the further utilization and development of coal resources, it is generally a major issue that China must face on as it continues its path of development.
In China, the selection of coal as a dominant energy source is not only a reflection of its energy mix, but also its current stage of development. As environmental problems are often byproducts of industrial development, it is necessary to reduce such impacts by means of policy, law, science, and technology so as to achieve greater societal benefits with relatively low associated costs.
WAYS TO REDUCE CHINA’S COAL- RELATED ENVIRONMENTAL IMPACT
To some extent, the coal-related environmental impact occur-ring in China is inevitable and the root cause can be attributed to the extensive growth model of the coal industry which has limited the attention paid to environmental protection. Correspondingly, effective ways to address these ecological problems should invoke law, policy, and technology.
Improve Legal Regulation
Among China’s existing laws and regulations governing coal production and utilization, those that focus on the environ-mental impact are fragmented and sometimes even absent.
VOICES
“In 2013, 58% of oil in China was
imported, but due to the large amount
of coal resources, 90% of China’s
energy is domestically sourced.”

www.cornerstonemag.net 19
Therefore, I believe China should learn from the experiences of developed countries and accordingly make clear the functions and duties of the legislature and government. The old notion and practice of “policy playing the role of law” (i.e., when policy is taken as the law and no set laws exist) must be abandoned.
The legal system for clean coal utilization should be reviewed at the national legislative level with top-down implementa-tion. Under such a framework, the central government should fulfill its duty of administrative legislation and policy-making, while the local people’s congresses and governments should play a supplementary role within their respective legal author-ities (i.e., local decrees and special decrees).
I believe all of the laws and regulations should make operability an important consideration. Clauses focused on penalties for noncompliance should be spelled out in detail so as to avoid misinterpretation. Similarly, while intensifying the penalties, protection should be extended to those implementing tech-nological and economic responsibility around clean coal production and utilization. I believe that not only the principal responsibilities of coal producing and consuming enterprises, but also the supervisory responsibilities of the various levels of government should be clearly defined so as to ensure that all the entities can carry out responsible production and utili-zation of coal within the legal framework.
Finally, the supervisory and management functions of vari-ous levels of government during law enforcement should be clearly defined. While the watchdog role of different levels of government is encouraged, it must not be expanded beyond certain limitations—specifically, government entities should not intervene in the markets. Instead legal means should be adopted to guide enterprises to make responsible choices.
Strengthen Policy Guiding Clean Coal Production and Utilization
Enforcing environmentally friendly production and utilization of coal will undoubtedly increase the costs associated with such activities. Therefore, it is important that governments’ policy is perfected so it can serve as a guide.
The first measure to improve policy is to change the way per-formance appraisals for businesses are completed. Indexes reflecting the scale of economic growth should be reduced, while the focus on coal-related environmental impact should be increased. In addition, the environmental performance appraisal structure should be improved by taking environ-mentally related investment as an adjustment factor for the economic value added (EVA); this would guide enterprises to change how their businesses are run to more carefully con-sider the goal of environmental protection.
Another approach to better regulating/legislating coal pro-ducers and consumers to reduce environmental impact is to promote the development of an economy based on recycling, low-carbon, and environmentally friendly businesses through the creation of financial incentives and taxation policies. I propose that the central government implement additional pre-tax deductions focused on environmental investment by the coal enterprises under the premise that coal consumers have reached certain standards for energy savings and also emissions reductions. For coal-producing enterprises, the tax incentives associated with land reclamation should be fur-ther strengthened; pricing mechanisms should also be used to promote water recycling. For coal-consuming enterprises, a compensation mechanism for saving energy and reducing emissions should be created. Since coal-fired power plants are the main consumers of coal in China, accounting for around
With the addition of de-SOx and de-NOx environmental technologies, emissions from coal-fired power plants can be dramatically reduced.

20
60% of total coal consumption, such incentives should be given to enterprises that adopt large, clean, and efficient power units. The incentives could include dispatch priority, price subsidies, tax abatement, etc., which would encourage coal-fired power plants to make progress toward the goal of near-zero emissions.
Last, but not least, based on the current number of environ-mentally related debts that should be compensated for in China, it is also important to exert certain taxation incentives encouraging enterprises to set up special environmental funds for coal production and utilization.
Promote New Clean Coal Technologies
Production and utilization are at the two ends of the coal resource chain; with the application of clean technologies, the eco-friendliness factor could be improved at both ends, which would be conducive to fostering a cleaner, recycling-based, low-carbon modern industrial system.
To promote environmentally friendly mining technologies by strengthening the life-cycle management of coal production, the following areas should be given priority:
• Improve coal-bed methane detection capabilities so as to facilitate its collection and utilization.
• Increase research on the usage options for coal gangue, especially in the power sector (e.g., mixture of coal gangue and slime and the use of coal gangue in construction).
• Promote mine water purification technologies so as to increase the utilization of mine water.
• Promote the use of low-carbon gangue in mine reclama-tion and land filling so as to reduce ground subsidence and surface damage.
• Plan comprehensively for coal transportation and power transmission adhering to the idea of “placing equivalent priority on both forms of energy transfer” so as to optimize the delivery and distribution system and reduce the envi-ronmental impact of coal transportation.
• Exert greater effort on the extraction and utilization of coal byproducts so as to reduce the discharge of waste and
improve the comprehensive utilization of coal resources as well as increase the value of coal.
Promoting cleaner power generation technologies will require strengthening the management of coal-fired power plants. Revamping equipment and technology and upgrading efforts in power enterprises should be reinforced. For instance, encouraging the adoption of high-efficiency, low-emissions, large units and also promoting closed-loop operation, auto-controlled, high-efficiency combustion, and low excess air technologies would increase the efficiency of utilization of the coal feedstock. Similarly, new technologies should be studied and promoted, such as high-efficiency and boiler gas removal technology, upgrading removal systems for SOx, NOx, mercury, and particulate matter as well as coal residue extraction and utilization technologies.
The methodical development of China’s coal conversion industry can be founded on new technologies. For this newly emerged industry, overall planning for the proper nationwide design with the integration of different coal-to-chemicals technology routes is necessary. At the same time, new tech-nologies such as coal-based polygeneration and integrated gasification combined cycle (IGCC) power generation, as well as the combination of chemical production with wind power, should be developed and promoted so as to improve compre-hensive energy efficiency. Specifically in the coal conversion industry, not only can high-carbon coal can be converted to relatively low-carbon liquid fuels or chemical products, but also the high-concentration CO2 generated during the process could be captured and stored (CCS) so as to truly accomplish the clean and low-carbon conversion of coal.
CONCLUSIONS
China’s dependence on coal will continue into the foreseeable future. In fact, today there are no other viable energy sources that could replace coal’s principal role as a primary energy source. For this reason, it is worthwhile to take carefully implemented steps to improve the efficiency and environ- mental impact of coal production and utilization.
VOICES

www.cornerstonemag.net 21
By Jim SpiersFormer Senior Vice President Business Strategy,
Chief Technology OfficerTri-State Generation and Transmission Association, Inc.
The business of an electric utility is to manage the risk of producing and delivering a reliable and affordable power supply. Utilities do this on behalf of tens of thousands,
if not millions, of customers across large areas through an economy of scale only known in the last century.
For decades, utilities have well managed operational, market, financial, and regulatory risks to provide the electricity that has allowed economies to thrive and quality of life to improve. The responsible use of fossil fuels has been the foundation of this prosperity, and fossil fuels will continue in this role.
Fossil fuel-based power generation has not been stagnant; over decades, incremental technological innovation has driven constant improvement in power plant efficiency and emission controls. As a result, coal and natural gas offer not only energy security and the low cost that drives economic growth, but also increased sustainability.
For Tri-State Generation and Transmission Association, Inc., a not-for-profit wholesale power supplier in the rural western U.S., its mission to produce and deliver affordable and reliable electricity to its 44-member electric cooperatives is founded
upon stewarding membership resources and insulating its members from market volatility, managing risk, and maintain-ing options. Throughout the association’s 62-year history, it has focused on cooperative planning and, where appropriate, the joint development of resources to mitigate risk.
CO2 IS A UNIQUE RISK ACROSS MANY INDUSTRIES
The U.S. Environmental Protection Agency has proposed CO2 limits for new and existing fuel power plants. In fact, all fossil fuel-consuming industries face the same issue and may face a similar challenge. The discussion and imposition of these lim-its conveys a clear fact: In the U.S., power providers must be ready for a carbon-constrained regulatory environment.
The emergence of this challenge poses tremendous risk to the industry, including the nearly 900 GW of installed fossil-based capacity in the U.S.,1 the installed fleet globally, and any new fossil-based capacity or industrial facility affected by other CO2 emission regulations.
Although the aggregate industry impacts of CO2 regulation are daunting, the risk profile for individual utilities is highly driven by its existing generation and transmission fleet, operational characteristics, and access to resources.
The regulatory exposure of managing CO2 emissions from power plants presents a unique risk to Tri-State, its member electric systems, and their consumers. A plentiful and afford-able fossil fuel supply and a modern, efficient baseload coal fleet complemented with natural gas, hydropower, and other renewable resources ensures that the association is in a posi-tion to effectively manage many of the risks of its industry.
To manage risks associated with CO2 regulations, there has been a push for utilities to fuel switch, moving from coal to natural gas and renewable resources. In the U.S., fuel switch-ing to natural gas has been catalyzed in recent years by the discovery of major new unconventional sources of methane, brought on by advances in hydraulic fracturing. However, for many utilities, including Tri-State, switching resources, and reducing fuel options, introduces new risks, such as exposure
Hedging Carbon
“Breakthroughs can lead to
options to meet energy and
environment challenges.”
Conversion of CO2 into other materials could contribute to global CO2 mitigation efforts, but more R&D is needed.
22
to market volatility. With Tri-State’s significant capital invest-ment in its modern production fleet with advanced emissions controls, fuel switching for the purpose of CO2 management would be a high-cost CO2 management option and is not a viable strategy for our association.
It is clear that CO2 management strategies must offer ways to reduce regulatory risk without introducing new operational, market, and financial risks.
TECHNOLOGY OPTIONS MANAGE RISK
The challenge of managing CO2 emissions presents a wholly different proposition, compared to other emissions control. Aggressive CO2 regulation adds risk to the use of fossil fuels in power production until technology to manage emissions is commercialized.
In response, publicly and privately funded research, develop-ment, and demonstration efforts are incrementally improving existing CO2 capture and storage (CCS) technologies. Pre- and post-combustion capture technologies aim to increase effi-ciency and reduce costs. Geologic storage and variations of this approach, such as enhanced oil recovery (EOR), remain the focus of CO2 disposal options. We believe that, in a carbon-constrained world, this narrow range of technology options, in light of the enormous challenge to manage CO2 and its associ-ated liability, presents significant risk.
A technology hedge is needed. At Tri-State, we believe that another technology path exists. This new direction is based on the belief that CO2 can be an asset that can be used to cre-ate value. With radical thinking and revolutionary technology development, spurred by innovation models currently unde-rutilized in the energy industry, breakthroughs can lead to options to meet energy and environment challenges.
CCS OFFERS INCREMENTAL ADVANCEMENT
To ensure the ongoing viability of existing fossil capacity, the energy industry has placed its “bet” on the capture and storage of CO2, including EOR. Yet, for an industry in which managers place a premium on technical and strategic options to ensure predictability and reliability, I believe it is ironic that this sole bet seems to have been placed on an approach to manage CO2 risk when viability is not yet certain.
CO2 storage faces challenges. One is cost: According to Dr. S. Julio Friedmann, Deputy Assistant Secretary for Clean Coal at the U.S. Department of Energy (DOE), the first generation of CCS technologies capture CO2 at a cost between $70 and $90/ton for wholesale electricity production.2 Current technologies
for trapping and storing CO2 can increase the fuel needs of a coal-based plant by 25–40% and subsequently drive up the cost of energy from that plant by 21–91%.3 Another is com-munal activism (i.e., lack of public approval).
Having technological options at the industry’s disposal when the price of CO2 regulation becomes untenable will increase the odds that the industry can preserve its ability to provide affordable, reliable electricity to its customers. As prudent managers, hedging the CO2 bet by pursuing options in addition to storage is essential.
CO2 IS AN ASSET
The good news is that potentially viable CO2 management alter-natives exist. However, the conventional thinking in research and academic circles has been that other approaches to CO2 utiliza-tion are too difficult, if not impossible. Yet, for innovators involved in the CO2 utilization space, a significant body of work is being developed in both novel CO2 capture and utilization sciences.
As part of our effort to assess its risks and potential mitigation strategies, Tri-State commissioned research that identified more than 90 emerging CO2 capture approaches.4 New sol-vents, enzyme-based systems, physical sorbents, precipitated calcium carbonates, ionic liquids, gas separation membranes, and metallic organic frameworks have the potential to leap-frog over current approaches to industrial CO2 capture and dramatically decrease capital and operating costs.
If the potential of these new capture approaches can be real-ized, the challenge turns to utilizing CO2 when and where geological storage is not feasible. EOR is appealing precisely because it affords economic value to displace some of the costs associated with CO2 capture and transportation. There are other options that can afford economic value to CO2, thereby changing what is currently deemed a liability into an asset. This asset leads to a reduction in net CO2 emissions by displacing carbon-based fuels or effectively storing CO2 in useful products.
CO2 utilization technologies, in theory, can produce virtually any carbon-based material. The key then is ensuring that new innovations can utilize a portion the 2158 Mt of CO2 per year produced from the U.S. fossil-based electric capacity5 or the 948.5 Mt of CO2 per year produced from the U.S. coal-based electric capacity that is appropriate for CO2 capture retrofits6 to be a meaningful CO2 management tool. CO2 utilization is an invaluable option that can complement a portfolio including CO2-EOR, CCS, or other technologies to be developed.
Further syndicated research sponsored by Tri-State identified 136 emerging companies and institutions that are working to convert CO2 into valuable products, such as transportation
VOICES

www.cornerstonemag.net 23
fuels, chemicals, synthetic plastics, and concrete and other building materials.7 A recent Advanced Research Projects Agency-Energy (ARPA-E) conference showcased promising CO2
utilization technologies, including fuels production technology from Dioxide Materials, which is receiving ARPA-E funding, and chemical production from Liquid Light.8
These technologies are nascent and are not yet demonstrated at scale. Even the basic logistics and physics of CO2 conversion are daunting, because the CO2 reduction process is thermody-namically uphill. The carbon and oxygen molecules in CO2 are linked with double bonds and splitting them apart requires a fair amount of energy, which is a challenge to overcome.
With new breeds of biological organisms that can better synthesize CO2 and excrete valuable oils, advances in propri-etary catalysts using lower-cost materials and more efficient methods of application, or better applications of renewable energies to heat catalysts and power the CO2 conversion pro-cesses, breakthroughs can occur.
If we can facilitate these breakthroughs, our research has shown that these technologies could have the potential to produce between approximately 237 and 1079 Mt of product from the 948.5–2158 Mt of supplied CO2 per year, depend-ing on various preliminary conversion assumptions, which are explored in our syndicated research. Given that the U.S. consumed approximately 1.07 billion tons equivalent of crude oil in 2010,A we immediately see that this one market alone of-fers a virtually unsaturable outlet for CO2-produced product.
The challenge is technical, and history has shown us that it is unwise to bet against technical innovation. For instance, we all remember rather widespread predictions that we would cur-rently be living in a world impaired by “peak oil,” a prediction that was upended by hydraulic fracturing and horizontal drill-ing innovations. Realizing these breakthroughs is a matter of creating an innovation model that maximizes the chances that a breakthrough can emerge and doing so in a thoughtful, cost-efficient way that accelerates results faster than envisioned through traditional research and development approaches.
INNOVATION MODEL TO DRIVE SOLUTIONS
Over the past several years, Tri-State has pursued a unique collaborative effort to bring awareness to the opportunity for CO2 utilization. This includes Tri-State’s initial development work for a CO2 utilization inducement prize in collaboration with Canadian energy companies. With Prize Capital, a firm focused on catalyzing advanced energy technologies, the asso-ciation has developed a comprehensive model that affords a practical, cost-effective approach to fostering breakthrough innovation in the field of CO2 capture and conversion. This is a
Connec�ng Innovators, Operators, and Supporte
rs
Focusing & Igni�ng the Talent•A Large Pool of Talent
Technology Scale-up
•Inves�ng In & Suppor�ng
Emerging Innova�on
• A Pathway t o Commercializa�on
•Nurturing
•Educa�ng the Masses
FullyCommercialized, Self-Sustaining
CO2 -AssetIndustry
FIGURE 1. The “commercialization pyramid”
logical extension of the association’s view of risk management through collaboration that is prevalent across its operations.
Rather than taking a traditional research and development approach to innovation—which, to a large extent, requires the judgment and validation of technologies before they have exhibited any ability to meet utilities’ need—Tri-State’s innovation model crafts a platform that attracts and supports emerging innovation focused on clearly defined performance requirements. The platform subsequently nurtures and sup-ports those technologies that are able to not just claim, but also actually prove their abilities to meet these requirements.
It is a seven-component, decentralized process designed, in part, by referring to and mimicking common characteristics present at the beginning of successfully emerged industries. Its intent is to foster the arrival of a fully commercialized, self-sustaining CO2 asset industry. This commercialization pyramid process is captured in Figure 1.
TEST CENTER DRIVES MARKET’S ACCEPTANCE
One component integral to the commercialization pyramid is the establishment of a real-world CO2 solutions “test center” adja-cent to an operating power plant. One of the greatest challenges

24
that utilities face in validating new technologies is the transposi-tion of laboratory data to the real world at utility scale.
Laboratories are inherently small scale and their environments are meticulously controlled. Thus, understanding how an emerging laboratory technology will perform in larger scale, uncontrolled environments—especially ones that place a premium on predict-ability and reliability—is an exercise in estimates.
A test center fills a critical need in the transition between laboratory and scaled operation by affording easier access to real-world testing conditions. A test center establishes a plat-form by which technologies can move in or out of real-world testing, thus bypassing much of the hurdle that innovators face in convincing utilities to pilot test their technologies. It also bypasses much of the risk that utilities take in choosing to test one technology over another.
The current vision of the test center, to be located at a coal-fired power plant and matched with a natural gas-fired facility, is to establish five testing “plots.” A slipstream of flue gas as well as water, electricity, land, and shared resources will be provided and will remain in place as innovators create units to “plug into” this preexisting format.
Although the notion of energy test centers is established—approximately a dozen are in current operation around the world—research reveals that the test center we envision will be the first to focus on a full CO2 “solution”, including break-through early-stage CO2 capture, as well as diverse conversion, technologies. The state of Wyoming, through the vision of Governor Matt Mead and legislative leadership, has set aside funding for such a test center at a coal-fired power plant in Wyoming. Figure 2 plots the value propositions afforded by known existing energy test centers and reveals the opportu-nity to capitalize on a new type of test center.
CONCLUSION
The establishment of new types of test centers is one com-ponent of seven needed to develop a commercial CO2 asset industry. Other efforts underway include the development of a global, multimillion-dollar inducement prize competition, the seeding of a global CO2 asset network, and deployment of “advanced market commitments” from industry to pur-chase yet-to-be-developed technologies. These components are designed to work together and leverage one another to maximize outcomes, but they will not yield results overnight.
The challenge of managing CO2 emissions by spurring the creation and commercialization of multiple “solution” paths
is not going to be fast or easy, but research indicates that through the diligent, calculated application of this compre-hensive approach, we have the best chance of affording the industry with a portfolio of CO2 management options that can manage risk and ensure the continued provision of reliable, affordable energy in a carbon-constrained world.
REFERENCES
1. U.S. Energy Information Administration. (2013). Electric power annual 2012. Table 4.3. Existing capacity by energy source, 2012. www.eia.gov/electricity/annual/html/epa_04_03.html
2. Friedmann, S.J. (11 February 2014). Testimony before the Com-mittee on Energy and Commerce Sumcomittee on Oversight and Investigations, U.S. House of Representatives, Washington, DC.
3. Metz, B., Davidson, O., de Coninck, H.C., Loos, M., & Meyer, L.A. (Eds.). (2005). Carbon dioxide capture and storage. IPCC special report prepared by working group III, Intergovernmental Panel on Climate Change. New York/Cambridge: Cambridge University Press.
4. Peak, M. (2012). Emerging carbon capture technologies over-view. Prize Capital, LLC.
5. U.S. Environmental Protection Agency. (2011, February). Draft in-ventory of U.S. greenhouse gas emissions and sinks: 1990–2011. www.epa.gov/climatechange/ghgemissions/usinventoryreport.html
6. Specker, S., Phillips, J., & Dillon, D. (2009). The potential grow-ing role of post-combustion CO2 capture retrofits in early com-mercial applications of CCS to coal-fired power plants. Palo Alto, CA: Electric Power Research Institute. www.epri.com/abstracts/Pages/ProductAbstract.aspx?ProductId=000000000001019552&Mode=download
7. Peak, M. (2011). Carbon capture & recycling industry overview. Prize Capital, LLC.
8. Ling, K. (2 April 2014). Entrepreneurs vie to turn heat-trapping gas into a red-hot commodity. Greenwire. www.eenews.net/greenwire/stories/1059997195
VOICES
FIGURE 2. Energy test centers proposition
TCM
MountaineerShidongkou
SolarTAC Avista Test Site
EMEC
NSTTF
NWTCOcean Energy Test Site
Marine Energy Test Center
OHMSETT
NCCC
RMOTC
SinglePla�orm
Single Technologies Mul�ple Technologies
Mul�ple“Integrated”
Pla�orms
OPPORTUNITY

www.cornerstonemag.net 25
ENERGY POLICY
Nicholas NewmanContributing Author, Cornerstone
Living without any or limited access to energy has been termed “energy poverty”—a simple name for a complex problem. Energy poverty has proven chall-
enging to alleviate; it’s also been difficult to define. The World Bank’s Global Tracking Framework (GTF) is the world’s premier approach to tracking energy poverty. According to the GTF, about 1.2 billion people are living without household elec- tricity and 2.8 billion without clean cooking and heating fuels.1 Those living in energy poverty are overwhelmingly rural, about 80%, and live primarily in two areas: Sub-Saharan Africa and developing regions in Asia. Efforts to reduce energy poverty have not demonstrated widespread success, although there has been some notable progress, namely in China.
In general, from 1990–2010, eradication of energy poverty barely advanced faster than population growth: 1.7 billion people gained access to electricity, 70% of whom were in urban areas, while global population increased by 1.6 billion. Figure 1 shows recent estimates of where and how many peo-ple are living without household access to electricity and clean cooking fuels in the 10 highest-impact countries.1
This article looks at energy poverty from the perspective of the dangers it poses, what can be done to address it, coal as part of the solution, the role of development banks, and how to balance these efforts with other international challenges.
“Few opportunities for advancement
will be available in an area where
there is no electricity…”
THE EFFECTS OF ENERGY POVERTY
The implications associated with energy poverty are vast. For example, a lack of reliable electricity presents a critical hurdle for growth of businesses and job creation. Few opportunities for advancement will be available in an area where there is no electricity to power business and industry, leading to a vicious cycle of poverty.
The adverse health effects of energy poverty are particularly distressing. Using traditional cooking fuels indoors leads to dangerous indoor air quality. The particulate matter and other compounds released from indoor cooking directly resulted in an estimated 4.3 million premature deaths in 2012—making indoor air pollution the most dangerous environmental prob-lem facing the world today.2 No other environmental problem causes more deaths—especially for the women and children who are disproportionally affected.
Other important health effects include a lack of fully func-tional clinics and hospitals. Without refrigeration, vaccines and other medicines cannot be provided to those who need them. A lack of reliable power means that life-saving machines cannot be used and many other services are limited.
Advancing the Alleviation of Energy Poverty
FIGURE 1. Number of people without modern energy access in high-impact countries1
24.628.530.931.2
38.255.9
63.966.6
82.4
MyanmarUganda
SudanKenya
TanzaniaCongo, DR
EthiopiaBangladesh
Nigeria306.2India
Electricity Access Deficit (Millions of People)
612.8134.9131.2
117.8110.8
81.161.3
49.446.2
705.0India
ChinaBangladesh
IndonesiaNigeria
PakistanEthiopia
Congo, DRVietnam
Philippines
Non-Solid Fuel Access Deficit (Millions of People)
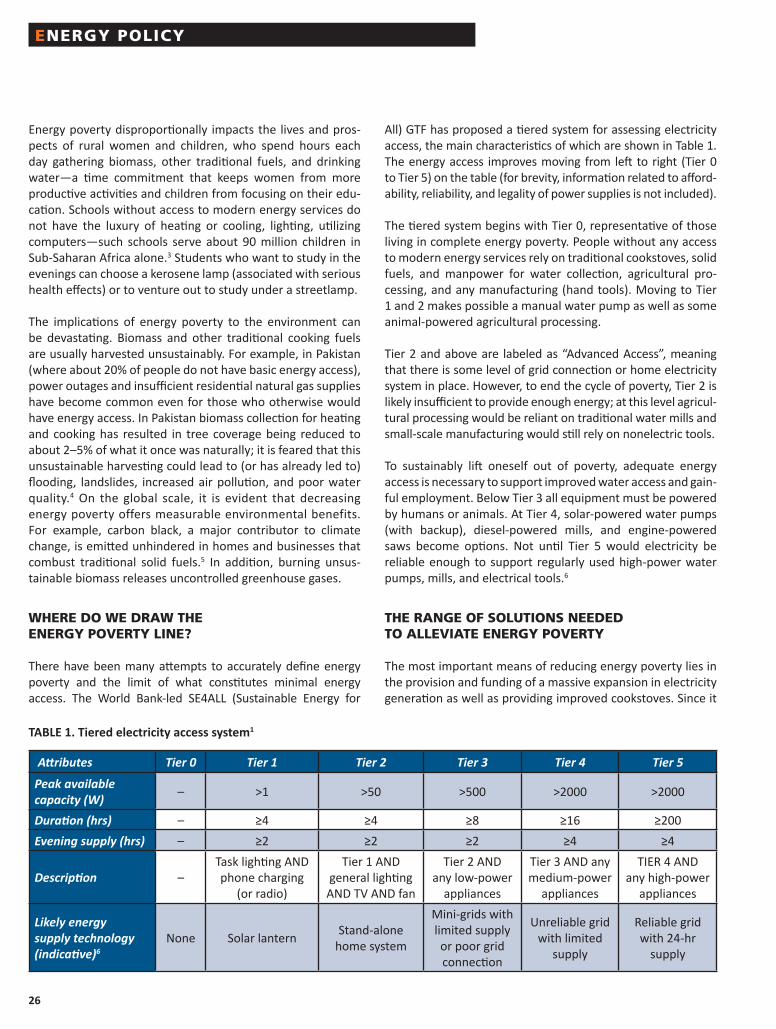
26
Energy poverty disproportionally impacts the lives and pros-pects of rural women and children, who spend hours each day gathering biomass, other traditional fuels, and drinking water—a time commitment that keeps women from more productive activities and children from focusing on their edu-cation. Schools without access to modern energy services do not have the luxury of heating or cooling, lighting, utilizing computers—such schools serve about 90 million children in Sub-Saharan Africa alone.3 Students who want to study in the evenings can choose a kerosene lamp (associated with serious health effects) or to venture out to study under a streetlamp.
The implications of energy poverty to the environment can be devastating. Biomass and other traditional cooking fuels are usually harvested unsustainably. For example, in Pakistan (where about 20% of people do not have basic energy access), power outages and insufficient residential natural gas supplies have become common even for those who otherwise would have energy access. In Pakistan biomass collection for heating and cooking has resulted in tree coverage being reduced to about 2–5% of what it once was naturally; it is feared that this unsustainable harvesting could lead to (or has already led to) flooding, landslides, increased air pollution, and poor water quality.4 On the global scale, it is evident that decreasing energy poverty offers measurable environmental benefits. For example, carbon black, a major contributor to climate change, is emitted unhindered in homes and businesses that combust traditional solid fuels.5 In addition, burning unsus-tainable biomass releases uncontrolled greenhouse gases.
WHERE DO WE DRAW THE ENERGY POVERTY LINE?
There have been many attempts to accurately define energy poverty and the limit of what constitutes minimal energy access. The World Bank-led SE4ALL (Sustainable Energy for
All) GTF has proposed a tiered system for assessing electricity access, the main characteristics of which are shown in Table 1. The energy access improves moving from left to right (Tier 0 to Tier 5) on the table (for brevity, information related to afford-ability, reliability, and legality of power supplies is not included).
The tiered system begins with Tier 0, representative of those living in complete energy poverty. People without any access to modern energy services rely on traditional cookstoves, solid fuels, and manpower for water collection, agricultural pro-cessing, and any manufacturing (hand tools). Moving to Tier 1 and 2 makes possible a manual water pump as well as some animal-powered agricultural processing.
Tier 2 and above are labeled as “Advanced Access”, meaning that there is some level of grid connection or home electricity system in place. However, to end the cycle of poverty, Tier 2 is likely insufficient to provide enough energy; at this level agricul-tural processing would be reliant on traditional water mills and small-scale manufacturing would still rely on nonelectric tools.
To sustainably lift oneself out of poverty, adequate energy access is necessary to support improved water access and gain-ful employment. Below Tier 3 all equipment must be powered by humans or animals. At Tier 4, solar-powered water pumps (with backup), diesel-powered mills, and engine-powered saws become options. Not until Tier 5 would electricity be reliable enough to support regularly used high-power water pumps, mills, and electrical tools.6
THE RANGE OF SOLUTIONS NEEDED TO ALLEVIATE ENERGY POVERTY
The most important means of reducing energy poverty lies in the provision and funding of a massive expansion in electricity generation as well as providing improved cookstoves. Since it
ENERGY POLICY
TABLE 1. Tiered electricity access system1
Attributes Tier 0 Tier 1 Tier 2 Tier 3 Tier 4 Tier 5
Peak available capacity (W) – >1 >50 >500 >2000 >2000
Duration (hrs) – ≥4 ≥4 ≥8 ≥16 ≥200Evening supply (hrs) – ≥2 ≥2 ≥2 ≥4 ≥4
Description –Task lighting AND phone charging
(or radio)
Tier 1 AND general lighting
AND TV AND fan
Tier 2 AND any low-power
appliances
Tier 3 AND any medium-power
appliances
TIER 4 AND any high-power
appliances
Likely energy supply technology (indicative)6
None Solar lantern Stand-alone home system
Mini-grids with limited supply or poor grid connection
Unreliable grid with limited
supply
Reliable grid with 24-hr
supply
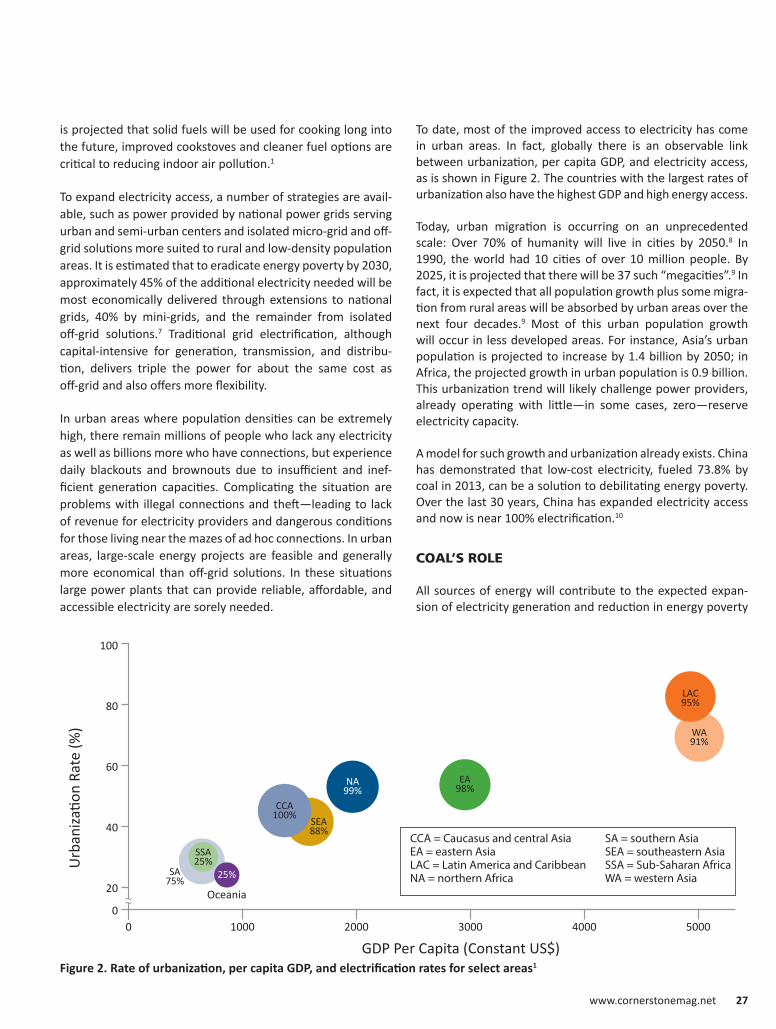
www.cornerstonemag.net 27
is projected that solid fuels will be used for cooking long into the future, improved cookstoves and cleaner fuel options are critical to reducing indoor air pollution.1
To expand electricity access, a number of strategies are avail-able, such as power provided by national power grids serving urban and semi-urban centers and isolated micro-grid and off-grid solutions more suited to rural and low-density population areas. It is estimated that to eradicate energy poverty by 2030, approximately 45% of the additional electricity needed will be most economically delivered through extensions to national grids, 40% by mini-grids, and the remainder from isolated off-grid solutions.7 Traditional grid electrification, although capital-intensive for generation, transmission, and distribu-tion, delivers triple the power for about the same cost as off-grid and also offers more flexibility.
In urban areas where population densities can be extremely high, there remain millions of people who lack any electricity as well as billions more who have connections, but experience daily blackouts and brownouts due to insufficient and inef-ficient generation capacities. Complicating the situation are problems with illegal connections and theft—leading to lack of revenue for electricity providers and dangerous conditions for those living near the mazes of ad hoc connections. In urban areas, large-scale energy projects are feasible and generally more economical than off-grid solutions. In these situations large power plants that can provide reliable, affordable, and accessible electricity are sorely needed.
To date, most of the improved access to electricity has come in urban areas. In fact, globally there is an observable link between urbanization, per capita GDP, and electricity access, as is shown in Figure 2. The countries with the largest rates of urbanization also have the highest GDP and high energy access.
Today, urban migration is occurring on an unprecedented scale: Over 70% of humanity will live in cities by 2050.8 In 1990, the world had 10 cities of over 10 million people. By 2025, it is projected that there will be 37 such “megacities”.9 In fact, it is expected that all population growth plus some migra-tion from rural areas will be absorbed by urban areas over the next four decades.9 Most of this urban population growth will occur in less developed areas. For instance, Asia’s urban population is projected to increase by 1.4 billion by 2050; in Africa, the projected growth in urban population is 0.9 billion. This urbanization trend will likely challenge power providers, already operating with little—in some cases, zero—reserve electricity capacity.
A model for such growth and urbanization already exists. China has demonstrated that low-cost electricity, fueled 73.8% by coal in 2013, can be a solution to debilitating energy poverty. Over the last 30 years, China has expanded electricity access and now is near 100% electrification.10
COAL’S ROLE
All sources of energy will contribute to the expected expan-sion of electricity generation and reduction in energy poverty
Figure 2. Rate of urbanization, per capita GDP, and electrification rates for select areas1
GDP Per Capita (Constant US$)
Urb
aniza
tion
Rate
(%)
00
20
40
60
80
100
1000
Oceania
25%
SSA25%
CCA100%
NA99%
EA98%
LAC95%
WA91%
SEA88%
SA75%
2000 3000 4000 5000
CCA = Caucasus and central AsiaEA = eastern AsiaLAC = Latin America and CaribbeanNA = northern Africa
SA = southern AsiaSEA = southeastern AsiaSSA = Sub-Saharan AfricaWA = western Asia
~~

28
over the coming decades. In many places, such as China, his-tory has shown that coal can be fundamental to expanding on-grid generating capacity and providing the low-cost energy necessary to promote economic growth. Compared to oil and gas in most places, coal is relatively inexpensive, simple to extract, ship, and burn. For this reason, there are currently 1199 proposed coal-fired plants with a total installed capac-ity of 1401 GW planned or in development, of which 70% will be built in India and China.11 These plants (especially those in China) are not only being built to provide low-tier level energy access. These large-scale, on-grid projects are needed to sup-port industry. In addition, coal is an important fuel and raw material used for cement and steel production, which will also be in high demand to support urbanization.
Recognition and acceptance of the importance of coal in the global energy sector was made explicit by Maria van der Hoeven (Executive Director, International Energy Agency) in a speech in Paris to launch the IEA’s Medium Term Coal Market Report in which she noted that “coal is abundant and geo-politically secure, and coal-fired plants are easily integrated into existing power systems…” and “coal powered economic growth has pulled billions out of poverty in the past decades”.12
To achieve the goal of universal access to modern energy supplies by 2030 will require an increase in global electricity generation of 2.5%. The World Energy Outlook 2011 report projected that “coal alone accounts for more than 50% of total on-grid additions”.8
THE ROLE OF DEVELOPMENT BANKS
Nearly half of funding for new power projects in poverty-stricken regions comes from development banks, and energy projects are a significant proportion of their lending portfolios. For this reason, development banks are well poised to lead energy poverty alleviation efforts. For instance, the African Development Bank allocated 24.7% of its total lending bud-get of US$4.25 billion in 2012 to energy projects.13 The Japan Bank for International Cooperation is currently supporting 18 coal plants with a combined capacity of 15.6 GW in developing Asia (including Indonesia, Vietnam, India, and the Philippines) worth an estimated ¥600 million, out of a total financing com-mitment of ¥4240.9 billion in 2012.14,15
Historically the World Bank has, through its International Financial Corporation (IFC), financed a significant portion of the energy generation infrastructure of developing countries. In the fiscal year 2009–2010 the World Bank lent US$3.4 billion to coal power projects including $500 million for the Medupi 4800-MW power plant in South Africa. It also supported the 4000-MW Tata Mundra coal plant in Gujarat, India, with a $450 million loan.16 In addition, the IFC created and gave
financial backing to the Indonesia Infrastructure Guarantee Fund, which then provided $33.9 million in guarantees for the $4-billion 2000-MW Central Java ultra-supercritical coal plant.
Although the World Bank previously funded coal-based power, in 2013 it announced that it would limit financing of coal-fired power plants to “rare circumstances” and, in effect, only to the 48 poorest countries in the world where no feasible alter-native fuel is available to meet basic energy needs and other sources of finance are absent. The World Bank’s stance will be tested in Kosovo where a new plant complying with EU envi-ronmental standards would enable the closure of the Kosovo A Plant, considered to be one of Europe’s largest point sources of emissions. Today, this is the only project in the World Bank Group pipeline that involves a coal-fired power plant. The decision to provide the $58 million Partial Risk Guarantee for private-sector investment awaits the outcome of an environ-mental and social impact assessment.
The European Bank for Reconstruction and Development (EBRD) has followed the World Bank’s lead, as explained by Anthony Williams, Head of Media Relations:17
The Bank will not finance any greenfield coal-fired power plant except in rare circumstances where there is no economically feasible alternative energy source. … The EBRD’s support for the transition to a low-car-bon economy takes priority. A first step to meet the challenge of providing sustainable, secure, and afford-able energy is to invest in energy efficiency and the second is to replace fossil fuels with renewables. The bank is actively engaged in helping countries to switch from coal to gas. This entails promoting alternatives to carbon-intensive coal-fired generation. One exception has been its financing of the new 600-MW Kosova e Re lignite power plant. This new power plant has been funded because Kosovo has no alternative domestic source of fossil fuel and the new plant will solve its energy supply reliability problems.
The Asian Development Bank plays a crucial role owing to its significant size and its lending practices, which are gener-ally focused on lifting people out of poverty through energy expansion. In an interview, Anthony Jude,18 Energy Committee Senior Advisor and Practice Leader (Energy), Regional and Sustainable Development Department, described the energy problems of Pakistan: “Economic and social prog-ress in the country is handicapped by the 18 to 19 hours a day of brown-outs that hit every day.” Following the Bank’s least-cost analysis and energy sector assessment, Jude notes that “Pakistan had little choice but to opt for coal” and the Bank financed the construction of the Jamshoro supercritical
ENERGY POLICY

www.cornerstonemag.net 29
coal plant. The Bank spends at least US$3.5 billion a year on energy of which $1.8 billion is spent on renewables and reducing emissions. In policy terms the bank will finance coal-fired power plants with cleaner emission technologies, foster energy efficiency, and prepare plants for carbon cap-ture and storage when it becomes commercially available. However, Jude observes, “Not every Asian country is coming to us for finance.” This perhaps explains why a high number of subcritical coal-fired power plants, not equipped with low- emission technologies, are being constructed and planned in India and Southeast Asia. As pointed out by Maria van der Hoeven: “If these sub-critical plants under development in India and in ASEAN states were completed with the latest technology, it would save as much CO2 as will be saved by all the wind turbines in Europe.”12
BALANCING GLOBAL ENERGY CHALLENGES
Numerous challenges face the global energy sector. While energy’s climate impact dominates headlines, the voices of those living in energy poverty can be difficult to hear.
Undoubtedly, coal is part of the solution to expanding energy access. Developing countries continue to demonstrate that they will rely on coal. Rapid urbanization could put even more pressure on grids and further support this trend. Without international support, many of these plants will not employ high-efficiency, low-emissions technologies. Today, devel-oped countries and some development banks have reduced support for coal because of the associated greenhouse gas emissions with the argument that those living in poverty will be the most impacted by climate change. Actions to address climate change are important, but a balance must be struck with energy poverty alleviation efforts.
The 2009 Copenhagen Accord,19 an agreement focused on limiting climate change to 2°C, explained it well: “[E]conomic development and poverty eradication are the first and overriding priorities of developing countries….” Therefore, it is worthwhile to recognize the role that coal has played in the past and will continue to play in energy poverty alleviation. In this way, the coal-fired power plants being built with high-efficiency, low- emissions, and, where appropriate, CCS-ready technologies can play a major role in alleviating energy poverty while build-ing a sustainable future for all.
REFERENCES
1. World Bank. (2013). Global tracking framework, www.world-bank.org/en/topic/energy/publication/Global-Tracking-Frame-work-Report
2. World Health Organization. (2014). Household (indoor) air pol-lution, www.who.int/indoorair/en/
3. International Energy Agency (IEA). (2014). Energy poverty, www.iea.org/topics/energypoverty/ (accessed April 2014).
4. Craig, T. (2014, 2 February). Energy shortages force Pakistanis to scavenge for wood, threatening tree canopy, Washington Post, www.washingtonpost.com/world/asia_pacific/energy-shortages-force-pakistanis-to-scavenge-for-wood-threatening-tree-canopy/2014/02/01/18c2107e-86a3-11e3-833c-33098f9e5267_story .html (accessed April 2014).
5. World Health Organization. (2014, March). Household air pollu-tion and health, www.who.int/mediacentre/factsheets/fs292/en/
6. Practical Action. (2013). Poor peoples energy outlook 2013, practicalaction.org/ppeo2013
7. IEA. (2011, November). World energy outlook 2011, www.worldenergyoutlook.org/publications/weo-2011/
8. Vidal, J. (2010, 22 March). UN report: World’s biggest cities merging into “mega-regions”. The Guardian, www.theguardian.com/world/2010/mar/22/un-cities-mega-regions
9. United Nations. (2012, March). World urbanization prospects: The 2011 revision. Highlights, esa.un.org/unup/pdf/WUP2011_Highlights.pdf
10. United Nations Development Programme. (2014). Poverty re-duction, www.cn.undp.org/content/china/en/home/ourwork/povertyreduction/overview.html
11. World Resources Institute. (2012, 20 November). New global assessment reveals nearly 1,200 proposed coal-fired power plants, www.wri.org/blog/new-global-assessment-reveals-nearly-1200-proposed-coal-fired-power-plants
12. IEA. (2013, 16 December). Launch of the Medium-Term Coal Market Report 2013 [speech given by Maria van der Hoeven], www.iea.org/newsroomandevents/speeches/131206MCMR2013LaunchRemarks.pdf
13. African Development Bank Group. (2014). Projects & opera-tions, www.afdb.org/en/projects-and-operations/
14. Yuki, T. (2014, 18 March). Current status of JBIC’s support of coal-fired power plants, sekitan.jp/jbic/wp-content/uploads/2014/03/20140310-JBIC-coal-financing.pdf
15. Japan Bank for International Cooperation (JBIC). (2013). JBIC annual report, www.jbic.go.jp/wp-content/uploads/page/2013/09/15044/2013E_06.pdf
16. The World Bank. (2014). Energy: Data, web.worldbank.org/WBSITE/EXTERNAL/TOPICS/EXTENERGY2/0,,contentMDK:21651596~menuPK:4140787~pagePK:210058~piPK:210062~theSitePK:4114200,00.html (accessed April 2014).
17. Williams, A. (2014, April 24). Email correspondence with author.18. Jude, A. (2014, 17 April). Interview with author. 19. UNFCC. (2010, 30 March). Report of the Conference of the Par-
ties on its 15th session, held in Copenhagen from 7 to 19 Decem-ber 2009, unfccc.int/resource/docs/2009/cop15/eng/11a01.pdf
The author can be reached at www.nicenewmanoxford.com

30
ENERGY POLICY
By Anil RazdanEnergy Consultant and Chairman,
Energy and Environment FoundationFormer Secretary, Ministry of Power, Government of India
POVERTY AND INCLUSIVE GROWTH
For a developing country such as India, the eradication of poverty is the foundation of the planning process for the economy. Accelerated growth is often the vehicle to elimi-
nate poverty, and adequate energy is central to India’s growth strategies.
Poverty is reflected not only in the disposable income of a household, but also in the level of energy available to a household to meet its need for cooking, lighting, and gainful
employment. There is an increasing recognition of the impor-tance of access to clean and reliable energy for poverty alleviation. Improving the poor’s access to modern energy sources can make an important difference to their welfare and can be a catalyst for human development. The UN’s Millennium Development Goals clearly acknowledge that access to energy services is a prerequisite to halve the number of people living below the poverty line by 2015. However, there is also a con-sensus that ensuring sustainable progress requires solutions to be affordable, limit environmental impact, efficiently use energy resources, and offer energy security.
Recent acceleration in India’s growth may act as the catalyst needed to reduce poverty rates. During the 11th Five-Year Plan period (2007–2012) India’s GDP growth was 8%, compared with 7.6% in the 10th Five-Year Plan (2002–2007) and 5.7% in the 9th Five-Year Plan (1997–2002). The population below the poverty line declined at the rate of 1.5 percentage points per year from 2004–2010 and has been decreasing faster in recent years. In 2009–2010, an estimated 29.8% of India’s popula-tion—350 million people—lived below the poverty line.1
Even so, India is well poised to meet the Millennium Devel-opment Goal target of 50% reduction of poverty between 1990 and 2015. Notably, India has a younger population not only in comparison to advanced economies, but also in rela-tion to other large developing countries. The labor force in India is expected to increase by 32% between 2012 and 2032, whereas it will decline by 4.0% in industrialized countries and 5.0% in China.2 These additional workers can add to growth potential, provided that improved health services, education, and skill development are made available to ensure meaning-ful employment for India’s young men and women.
India’s aspirations and awareness of inequalities can be pow-erful instruments of change. In the words of Jim Yong Kim, the President of the World Bank Group, “For a very long time, the rich have known to some extent how the poor around the
Energy Poverty in India and What’s Needed to Address It
“Mere growth is not enough.
It has to be faster, more inclusive,
and sustainable growth.”
The concepts of faster growth and good governance were recurring themes during India’s 2014 general elections, which saw a sweeping victory by the Bhartiya Janata Party led by Narendra Modi.

www.cornerstonemag.net 31
world live. What’s new in today’s world is that the best-kept secret from the poor, namely, how the rich live, is now out.”4
For India, the 21st century can be a period when aspirations to help the poor and the underdeveloped are met. Mere growth is not enough. It has to be faster, more inclusive, and sustainable growth.3 This is the theme of India’s current 12th Five-Year Plan.
India’s 1.25 billion citizens have higher expectations about their future today than they have ever had before. They have seen the economy grow quickly over the last 10 years; a large number of people have benefitted as a result of this growth. This has understandably raised the expectations and impatience of all Indians, especially those who have bene- fitted less. Meeting these expectations was a central theme during the momentous 2014 general election, which resulted in a sweeping victory for the BJP party led by Narendra Modi.
ASSESSING ENERGY POVERTY IN INDIAA
Poverty largely cohabits with energy poverty. While there are many definitions for energy poverty, a pragmatic view is that energy poverty is the lack of access to modern energy services. At the time of independence in 1947, India’s entire electricity generation capacity was merely 1362 MW, leaving most of the country without adequate access.
In 2007 the International Energy Agency’s World Energy Outlook (WEO) focused on China and India. To accurately con-vey energy poverty and to allow for progress to be measured, the WEO used the Energy Development Index (EDI). Three indicators were used to calculate the EDI:
1. Share of households using cleaner, more efficient cooking and heating fuels such as LPG, kerosene, electricity, and biogas
2. Share of households with access to electricity3. Electricity consumption per capita
Based on data from 2005, the average EDI for India was 0.295; for reference, this was lower than countries such as South Africa (0.808) and China (0.636), but higher than others such as Indonesia (0.263) and Bangladesh (0.123). Within the Indian states there was wide disparity: The Union Territories had an EDI above 0.707, while 12 states had an EDI well below the national average, between 0.292 and 0.058. Importantly, five highly populated states were among those with low EDIs: West Bengal (0.246), Jharkhand (0.171), Orissa (0.154), Uttar Pradesh (0.142), and Bihar (0.058).4
The 2007 WEO estimated that 412 million Indian people were without access to electricity in 2005. In the Reference Scenario for the future, 60 million people in rural India would still lack access to electricity in 2030. The reference case also projected that the number of people relying on wood and dung for cook-ing and heating fuels would decline from 668 million in 2005 to 472 million in 2030.
The IEA also estimated that an investment cost of $41/person, translating to a total cost of US$17 billion, would be required to connect all Indian people to electricity. A sum of over US$6 billion has already been spent, as of March 2014, on the Rajiv Gandhi Grameen Vidyutikaran Yojana (RGGVY), a scheme aimed at building accelerated rural electricity infrastructure and household electrification. An equal amount is committed to be spent over the next three years.6
One might expect that the energy access situation should have changed significantly from 2005 as the installed on-grid capacity, which was 146 GW in 2005, has increased to 243 GW as of March 2014. In the same period nearly 125,000 previ-ously unelectrified villages have been electrified, 305,093 villages have received intensified electrification, and 21.7 mil-lion households below the poverty line have been electrified under the massive RGGVY effort. However, according to the IEA’s 2011 EDI calculation, which was based on 2009 data and included an additional indicator related to per capita com-mercial energy consumption, India’s EDI has remained nearly unchanged.7 I believe this means that the IEA’s EDI calculations are not yet fully able to capture all progress toward reducing energy poverty in India and it is worthwhile to consider some different approaches.
In addition to the IEA’s work, other efforts have been made to assess energy poverty levels in India. Researchers from the Swiss Federal Institutes of Technology utilized National Sample Survey (NSSO) data and assumed that energy con-sumption can be measured at various levels of the energy supply chain: primary energy, end-use energy, useful energy,
Illegal connections and electricity theft are common in India, resulting in loss of revenue and dangerous conditions.

32
and energy services.8 An energy access/consumption matrix was created and used to make the following broad conclu-sions for 1983–2000:
1. During this period, India’s energy poverty decreased from more than 75% to less than 40%.
2. The number of people having access to only enough bio-mass and kerosene to cook only one meal a day decreased from 38% to 14%, while the number of people having access to electricity, and possibly LPG, and cooking two meals a day increased from 3.5% to 15%.
3. Improvements in access to higher quality energy sources took place at a slightly faster pace than changes in other socio-infrastructural characteristics of households.
4. Improvements in the bottommost segments of the rural energy poor were sluggish, highlighting the need for large infrastructure investments.
The World Bank sponsored another significant research effort,9 which aimed to measure energy poverty based on energy demand. This work defined the energy poverty line as the threshold at which energy consumption begins to rise with increases in household income. This approach was applied using data from the comprehensive 2005 India Human Development Survey, a household survey that included those living in both urban and rural areas. The findings suggested that, in 2005, 57% of households in rural areas were energy poor while 22% were income poor. In urban areas, the energy poverty rate was 28% compared to 20% income poor. The researchers sug-gested measures to reduce energy poverty, including support for rural electrification, promotion of modern cooking fuels, and greater adoption of improved cookstoves.
The World Bank-funded work used lighting as an example to illustrate the joint relationship between income and energy use because high-quality lighting services can extend productive activities beyond daylight hours. In addition, electricity contrib-utes to increased income and better educational achievements for school children, information, and entertainment.
Based on data collected in India’s 2011 census, Table 1 pro-vides the number of households using different sources of
lighting. Today, electricity supplies nearly 67% of lighting, leaving ample room for improvement. In some cases, houses may be connected to the grid, but may not receive reliable or adequate electricity, due to insufficient generation or transmission capacity or theft. Illegal connections and aging infrastructure are major challenges facing India’s energy sup-pliers. Loss of revenue and dangerous conditions reveal the need for significant improvements.
INDIA’S PATH TO ALLEVIATE ENERGY POVERTY
Based on an exhaustive analysis of energy poverty and its ramifications—taking into consideration sustainability, afford-ability, energy security, as well as the tremendous amount of energy needed to fill the existing gap—I believe the following steps warrant urgent attention.
1. Increase energy availability for commercial use 2. Promote all forms of power generation, preferably with
cleaner fuels 3. Concentrate immediately on affordable power4. Improve availability of power through healthy distribution
utilities5. Intensify rural electrification6. Undertake household electrification in rural areas that are
economically weaker7. Promote improved cook stoves for biomass fuel in rural
areas8. Improve energy efficiency to reduce power consumption
and requirement9. Promote clean coal technologies10. Enhance energy security through the greater extraction of
domestic fuel11. Appropriately price liquid fuels and electricity to curb
wasteful consumption
According to the World Bank, India is the third-largest econ-omy after adjustment for purchasing power parity.10 India is also the fourth-largest consumer of primary energy in the world after the U.S., China, and Russia,11 but it is not endowed with abundant energy resources. It was assessed in early 2014 that India imports 80% of its oil, 18% of its gas, and 23% of its
Area Total Number of Households
Main Source of Lighting
Electricity Kerosene Solar energy Oil Other No lighting
Total 246,740,228 165,935,192 77,552,588 1,087,175 505,723 494,526 1,165,054
Rural 167,874,291 92,845,936 72,442,827 916,485 408,071 362,742 898,230
Urban 78,865,937 73,089,256 5,109,731 170,690 97,652 131,784 266,824
TABLE 1. Household lighting source
ENERGY POLICY

www.cornerstonemag.net 33
coal.12 Volatile energy prices, particularly of oil, have added to India’s foreign exchange burden. The percentage of imports is expected to increase, as no significant oil discovery has been made in recent years. In addition, India’s offshore gas produc-tion has fallen substantially over the last decade, leaving a large number of gas-based power stations stranded.
India is facing an energy dilemma. It desperately needs to maintain the rapid growth experienced over the last decade to alleviate economic and energy poverty. Being heavily dependent on expensive oil imports, which could fill up to 85–90% of oil demand in the coming decades, India’s choices are limited. The under-recoveries of state-run oil marketing companies due to the sale of subsidized diesel, kerosene, and LPG were Rs.161,000 crore (1 crore = 10 million) in 2012–2013 and Rs.140,000 crore in 2013–2014.13 This is on the order of US$24 billion annually. There is also a subsidy of Rs.450 on each cylinder of LPG and a subsidy of nearly Rs.34 on each liter of kerosene. Besides the foreign exchange issue, there is also the burden incurred for heavily subsidizing these fuels. This leads to no viable option other than pushing for electricity, essentially coal-fired, to meet the need for affordable energy.
Table 2 includes the actual and projected sources of elec-tricity. In 2012, coal accounted for 56% of the installed power capacity and 70% of generation. In the 12th Five-Year Plan the Planning Commission projected future sources of electricity. In 2017 the share of coal was projected to be 57% of capac-ity and 69% of generation. Due to a major emphasis on new renewables, hydro and natural gas’s combined share in gen-eration was expected to be only 14% by 2030.
The Reality of India’s Electricity Options
Reviewing the actual electricity capacity reveals that even the recent projections underestimated coal’s role. As of 31 March 2014, the capacity of coal was nearly 60% (see Figure 1), nearly three percentage points higher than projections for 2017.
It is clear that the workhorse of the power sector in India is coal-based power—a fact that is not expected to change, espe-cially in the face of the need to expand electricity access from affordable sources. The price for renewable power is decreas-ing, but the average price of most solar power is still twice that for coal-based power. The price of natural gas is becom-ing unaffordable for baseload power generation. Few power distribution utilities have peaking power tariffs. The price of domestic gas at the well head is expected to double soon to $8.4/MMBTU, while regasified liquefied natural gas (RLNG) is in the range of $10–$12/MMBTU. This would correspond to a variable cost alone of Rs.6–7/kWh, when grid power, mostly coal thermal, is available at about Rs.4/kWh.B
Hydropower capacity additions have fallen substantially in the last decade because new potential projects have been located in areas that are environmentally sensitive, remote, and/or geologically complex. Some hydro projects have been hindered by environmental or forest reviews, as well as by inter-state issues. Considerable opposition from domestic and international environmental NGOs has also developed.
India has developed a strong domestic nuclear power capacity and has a good record regarding safety and reliable operation. An international agreement is also in place for the supply of uranium, as domestic availability is low. However, since the Fukushima disaster local opposition to new nuclear power sta-tions has grown substantially. For instance, the commissioning of a Russian-built 1000-MW light water nuclear reactor at Kudankulam was delayed by local protests in Tamil Nadu.
Even in rural areas, electricity is an essential requirement for enhancing agriculture production and providing drinking water in villages that do not have surface irrigation or water sources. Renewable energy from micro-hydro, solar PV, bio-mass gasifiers, or wind can provide off-grid solutions for
TABLE 2. India’s projected electricity sources through 203014
Capacity (%) Generation (%)2012 2017 2030 2012 2017 2030
Coal 56 57 42 70 69 58Oil 1 1 0 0 0 0
Natural Gas 9 6 3 7 5 3Hydro 20 15 13 14 12 11
Renewables 12 17 33 6 9 16Nuclear 2 4 9 3 5 12
Coal59.8%
Gas 9%
Diesel 0.5%Nuclear 2%
RES 12.1%
Hydro 16.7%
FIGURE 1. Installed electricity capacity as of 31 March 2014

34
remote or otherwise resource-rich areas. This approach saves investment on high-voltage transmission systems in such loca-tions. However, in the absence of sophisticated microgrid controls, the preference in rural areas is for grid power even though supplies may not exceed eight hours in most cases.
Electricity is provided in rural and urban areas in India through distribution companies that are almost entirely owned by the respective state governments. Unfortunately, many of these entities are experiencing financial difficulty owing to inad-equate tariffs set by the regulators and very high aggregate technical and commercial losses. Given their acute financial condition and the mandate to cover diverse customers, they are compelled to buy baseload power not exceeding about Rs.4/kWh. Most distribution utilities do not have peaking power tariffs. Affordability and availability issues make coal-based thermal power the most viable option.
For all these reasons, India is investing in coal. The proposed capacity addition target during the 12th Five-Year Plan (2012–2017) is 88.537 GW (see Figure 2), out of which coal will be responsible for 78% (69.280 GW).
Rural Electrification
Realizing the gravity of rural energy poverty and the role of electricity in driving inclusive growth in rural areas, India’s government has launched successive rural electrification programs. The flagship RGGVY was launched in April 2005 with a 90% subsidy and 10% loan to make up the total project cost in an attempt to electrify all the reported unelectrified villages. The Rural Electrification Corporation has assessed that out of the target 124,139 villages, 108,280 villages had been electrified by 31 March 2014. The others are essentially too remote for grid connection. Similarly, out of the target 602,506 villages for intensive electrification, work has been completed in 305,093 villages. Under this program, which covers 578 districts in the country, 21.68 million below-pov-erty-line households have been provided free electrification. An independent evaluation of the program in 2012 showed that free connections had provided the targeted poor families with around six to eight hours of daily power supply, and made a positive impact on children’s education, empowerment of women, security, and commercial activity.
Improved Biomass Cookstoves
The 2009–2010 Natural Sample Survey indicated that 76% of rural households still used wood for cooking, as did 17.5% in urban areas.15 It is well known that such low-efficiency, high-emissions energy causes health and environmental problems. From 1984–2003, 34 million cookstoves in rural areas were
improved. In December 2009 a National Biomass Cookstoves Initiative was launched to enhance the availability of cleaner and efficient cookstoves. State-of-the-art testing, certification, and monitoring facilities were set up. Field testing and evalua-tion of community-size stoves for midday meals in eight states was taken up in 2010–2011. The revised standard in August 2013 for thermal efficiency in natural-draft stoves is not less than 25% and, for forced draft stoves, is not less than 35%, with a fairly strong control on emissions.
Clean Coal Technology and Efficiency
Subcritical coal thermal power plants offer an efficiency of 33% (global average). Supercritical plants and ultra-super-critical plants can offer efficiencies of about 40% and 46%, respectively. Shifting to more efficient technologies can result in substantial savings of coal and reduce emissions of CO2 and other criteria emissions by up to 40% compared to plants operating at the global average efficiency. India’s first supercritical unit was commissioned in December 2010. At present, 25 supercritical units with a total capacity of 17,000 MW have been commissioned. It is proposed that 50% of the coal-based capacity additions between 2012 and 2017 will be supercritical. From 2017–2022 it has been proposed that all new coal-based thermal capacity will be supercritical. The country’s first advanced ultra-supercritical plant, under development, is a joint effort of Bharat Heavy Electricals Ltd. (BHEL), NTPC (National Thermal Power Corporation), and Indira Gandhi Centre for Atomic Research. It is expected to be operational in 2017. If coal is to be India’s energy mainstay in the coming decades it would be appropriate to focus on high-efficiency, low-emissions plants.
FIGURE 2. On-grid electricity capacity addition target from conventional sources in the 12th Five-Year Plan
Coal78%
Lignite 1%Gas 3%
Nuclear 6%
Hydro 12%
ENERGY POLICY

www.cornerstonemag.net 35
Demand-Side Efficiency
India has identified 12 focus areas for low-carbon strategies for inclusive growth. They cover energy efficiency programs for designated energy-intensive industries, an energy-efficient lighting labeling program, and a super-efficient equipment program for a large range of consumer goods. The star rating of the Bureau of Energy Efficiency Certification on consumer products helps inform consumers about the energy usage of their purchases. Incandescent bulbs are being replaced by CFLs and LEDs, while fans and cooling devices are labeled for consumer guidance. Green building codes have also been pre-scribed for public and commercial buildings.
Energy Security
While the country is pursuing an energy-dependent growth path, it is obvious that India’s import dependence will increase substantially; thus, energy security concerns will intensify. To address these issues, some Indian experts are coming together to find solutions by 2030. McKinsey & Company have reported several steps to increase energy independence and limit energy dependence on imports.12 In 2010, India imported 30% of its primary energy requirements and 38% of its pri-mary commercial energy. In a business-as-usual scenario, fuel imports would increase to 51% by 2030. Among initiatives to reduce import dependence to about 20% in 2030 is one to increase domestic coal production to 1220 MTPA in 2030 from 484 MTPA in 2010. This will mean a massive opportu-nity for coal exploration, mine development, and operation. The measures also include lighting 50,000 villages with solar power, and reducing industry and building power demand by 30% through efficiency. The bright side is that these steps are eminently possible.
CONCLUSIONS
India is a vibrant democracy determined to root out poverty and energy poverty. The process may be slow, but it is steady. Success will lie in optimizing domestic strengths, indigenous resources, and the best technologies worldwide. Today, prog-ress can be highlighted by the fact that per capita power consumption nearly doubled between 2002 and 2013, from 567 to 912 kWh.C Power shortages have decreased by more than half within the last two years across India. The silent revolution should culminate in extending benefits of useful, affordable, efficient, and adequate energy to all.
NOTES
A. This section was compiled as a literature review of three sepa-rate energy poverty studies in India and is limited to the results of the studies.
B. A scan of the notified tariff of Central Power Stations as pub-lished by the Central Electricity Regulatory Commission in its Annual Report 2012-13 Annex-IV and Annex-VI indicates coal thermal tariffs not exceeding Rs.4/kWh and hydro tariffs not exceeding Rs.5.83/kWh. Tariffs of LNG-based stations ranged from about Rs.7/kWh to Rs.11.6/kWh.
C. Based on information from the Central Electricity Authority, India. (2014). Data from the Statewise Per Capita Consumption table. Per Capita Consumption = (Gross Energy Generation + Net Import)/Mid-Year Population. Figure for 2012–2013 is provisional.
REFERENCES
1. Planning Commission of India. (2013). Twelfth Five Year Plan (2012–2017), Vol. I, Para 1.24.
2. Planning Commission of India. (2011). Approach to the Twelfth Five Year Plan, Para 1.18.
3. Planning Commission of India. (2013). Twelfth Five Year Plan (2012–2017), Vol. I, Para 1.8.
4. World Bank Group. (1 April 2014). Count on us [speech by World Bank Group President Jim Yong Kim at Council on Foreign Relations], www.worldbank.org/en/news/speech/2014/04/01/speech-world-bank-group-president-jim-yong-kim-council-on-foreign-relations
5. International Energy Agency (IEA). (2007). World energy outlook.6. Rural Electrification Corporation. (31 March 2014). Sanctions
and achievements for RGGVY.7. IEA. (2014). The energy development index, www.iea.
org/publications/worldenergyoutlook/resources/energy development/theenergydevelopmentindex/.
8. Pachuri, S., Mueller, A., Keramier, A., & Spreng, D. (2004). On measuring poverty in Indian households. World Development, 32, 12.
9. Khandeker, S., Barnes, D., & Samad, H. (2010). Energy poverty in rural and urban India: Are the energy poor also income poor?, documents.worldbank.org/curated/en/2010/11/12952406 (accessed March 2014).
10. World Bank. (2014). GDP, PPP (current international $), data.worldbank.org/indicator/NY.GDP.MKTP.PP.CD/countries/order%3Dwbapi_data_va lue_2012%20wbapi_data_value%20wbapi_data_value-last?order=wbapi_data_value_2012%20wbapi_data_value%20wbapi_data_value-last&sort=desc&display=default (accessed March 2014).
11. BP. (2013). BP statistical review of world energy 2013, www.bp.com/en/global/corporate/about-bp/energy-economics/statistical-review-of-world-energy-2013.html
12. McKinsey & Company. (2014, January). India: Towards energy independence 2030.
13. Data accessed from Policy Planning and Analysis Cell (PPAC), Ministry of Petroleum and Natural Gas India.
14. Planning Commission of India. (2013). Twelfth Five Year Plan (2012–2017), Vol. 2, Table 14.17 and Para 14.50.
15. Ministry of New and Renewable Energy, India. (2014). Presentation, National Biomass Cookstoves Programme (NBCP), www.mnre.gov.in/schemes/decentralized-systems/national-biomass-cookstoves-initiative/

36
ENERGY POLICY
By Nikki Fisher Coal Stewardship Manager, Anglo American
A life lived without access to modern energy is a life lived in poverty. Nearly half of the people living in energy poverty globally reside in Sub-Saharan Africa.1 In fact,
seven out of 10 people in Sub-Saharan Africa, nearly 600 mil-lion, do not have access to electricity.2 Although South Africa may have lower rates of energy poverty than most of its neigh-bors, it remains a prominent example of a country struggling to develop its economy and provide opportunities for its peo-ple to extract themselves from energy poverty.
Mr. Godfrey Gomwe, the former CEO of Anglo American’s Thermal Coal unit, shared at the 2013 International Coal and Climate Summit that the first electric light he studied under was when he went to university. Until then he had had to study under the glow of a paraffin lamp. Even so, he considers himself lucky. Today, across Africa and in many developing countries, it is not uncommon to see children outdoors late at night studying under street lamps because they have no electricity at home.
While the world’s developing countries need access to low-cost energy, they are also the most vulnerable to the impacts of climate change as well as policies aimed at reducing anthro-pogenic greenhouse gas emissions, which generally result in an increased cost of energy. South Africa’s leaders are working
to find the right balance between development and climate commitments.
SOUTH AFRICAN POLICIES TO REDUCE ENERGY POVERTY RELY ON AFFORDABILITY
In 1994, the majority of South Africans did not have access to electricity. Since then an ambitious electrification program has increased the proportion of electricity users in the total population from 36% to 84%.3 As electrification was dramati-cally expanded, the South African government also built more than three million houses providing shelter for over 13 million people. Approximately 85% of the population uses electricity for lighting while about 75% use it for cooking, according to the census conducted in 2011.4
This electrification program would not have been as wide-spread without low-cost electricity, which, in turn, could not have been achieved without coal as a fuel source. It is because coal is abundant, accessible, secure, reliable, and affordable that it is the cornerstone of energy in South Africa—today coal is used to produce 93% of electricity and 30% of liquid fuels.
Through providing a modest amount of free electricity to the poor, South Africa’s government aims to continue to combat energy poverty. Low-cost electricity was fundamental for the universal access and provision of Free Basic Electricity Policy (2003) (50 kWh per month) for poor households connected to the national grid. The importance of a reliable, affordable electricity supply is amplified in countries like South Africa.
SOUTH AFRICA’S ENERGY CHALLENGES WILL REQUIRE CONTINUED COAL USE
As energy poverty is reduced, demand for electricity increases. The adequacy of both electricity supply and coal supply to
Balancing South Africa’s Energy Poverty and Climate Change Commitments
“South Africa’s leaders are
working to find the right balance
between development and
climate commitments.”
Growing up without electricity, which is the case for many children in South Africa, provides very little opportunity to extract oneself from poverty.

www.cornerstonemag.net 37
meet the increasing demand is critical. During 2013, Eskom, the largest South African electricity provider, operated at times with as low as a 1% reserve margin due to declining perfor-mance of an aging fleet of coal-fired power stations as well as delays in construction of two new 4800-MW coal-fired power stations. After rolling blackouts in 2007/2008, three previ-ously moth-balled power stations were recommissioned and a strong demand-side energy efficiency drive was initiated. These, coupled with the economic downturn that resulted in decreased electricity demand, brought about temporary relief of pressure on the grid. Even so, electricity constraints have resulted in slower economic development, therefore delaying the much-needed jobs associated with development.
Many of the existing coal-fired power stations are slated to be closed between 2030 and 2040. New power stations will be required to replace this capacity and to meet demand growth. According to the South African Coal Roadmap (SACRM) which was finalized in 2013, the country will need between 85 and 125 GW of installed capacity by 2040, up from 42 GW in 2010.5 The large variance in the projections of needed installed capacity in this forecast is due to the level of renewable and nuclear energy in the fuel mix and their relative load factors.
The large build program that was primarily funded through tariffs resulted in the electricity price in South Africa increas-ing 78% between 2008 and 2011, and it will continue to rise in real terms for several more years as the National Energy Regulator of South Africa approved an 8% per annum increase in the electricity price for Eskom for the next five years. This has significant impacts on affordability and continued access to electricity for many households. It also places significant pressure on businesses, particularly those that are energy intensive, as is often the case in developing countries.
Apart from contributing to affordable electricity, the nation benefits from the coal industry in several ways. It is the min-ing industry’s top revenue earner, ahead of platinum and gold, and in 2012 Anglo American alone paid approximately $1.1 billion in direct and indirect taxes and royalties. The South African coal industry as a whole employs 83,000 people in a country with a 25% unemployment rate, with employees earning a combined $1.6 billion in salaries and wages.
SOUTH AFRICA’S CLIMATE CHANGE COMMITMENTS
Juxtaposed to efforts to develop its economy and address energy poverty are South Africa’s international commitments to take action on climate change. For instance, South Africa made a commitment at COP15 in Copenhagen to reduce emissions by 34% and 42% by 2020 and 2025, respectively, from business as usual. These commitments were, in part, in response to the country’s ranking as the 12th largest CO2 emit-ter globally at that time. This commitment was conditional, however, on fair, ambitious, and effective agreement in inter-national climate change negotiations and provision of financial and technical support from the international community.
ENERGY STRATEGY TO MEET THE DUAL GOALS
The Copenhagen Accord, agreed to in 2009, highlighted the need to address poverty and climate concerns simultane-ously; it called for drastic cuts in greenhouse gas emissions and also recognized that social and economic development and poverty eradication are the first and overriding priorities of developing countries and that a low-emission development strategy is indispensable to sustainable development.
Increased electricity demand (Durban at night shown above) is pushing South Africa’s grid to its limit.

38
South Africa’s Changing Energy Mix
To meet the COP15 commitments as well as the urgent and crit-ical demand for more electricity, an integrated resources plan was developed in 2010 that determined the sources of addi- tional electricity capacity between 2010 and 2035 under a policy-adjusted scenario that is a compromise between low-carbon and low-cost strategies. Of the 42.6 GW of new capacity to be built in South Africa in this timeframe, 42% will be renew-able energy, 23% nuclear, 21% gas and hydro-electric (import), and only 6.3% will be coal; even so, coal will still account for 65% of energy share in 2035. Delays to the scheduled nuclear and renewable build programs will mean coal will con-tinue to fill the gap until these alternatives come online.
Can Coal Fit Into South Africa’s Climate Objectives?
Clearly the affordability and reliability of coal make it easy to see why it can help address energy poverty, but must this be at the expense of South Africa’s climate goals? Appropriate technologies, such as high-efficiency coal-fired power plants (e.g., supercritical and ultra-supercritical) and carbon capture and storage, when it is commercially available, offer clear steps toward coal utilization in a carbon-constrained world. Such options can help meet the twin goals of cutting CO2 emissions while enabling economic growth and reducing both poverty as well as energy deprivation.
Modern, high-efficiency, low-emissions coal-fired power plants emit significantly less CO2 than older, less efficient plants. If we raised the global average efficiency of coal plants from its current average of 33% up to 40% we could reduce global carbon emissions by more than two gigatonnes, equivalent to running the Kyoto Protocol three times over. Even though 21st century coal technologies with fewer emissions come at a cost, they present a cheaper means of mitigating CO2 emis-sions. Advanced coal generation technology with CCS is more affordable than offshore wind, solar photovoltaic, and solar thermal technologies. However, like many of these low-carbon options, it will be difficult for most emerging economies to support (and justify) the incremental cost.
The prospect of multilateral development banks and others in the international community backing away from funding for coal, as has been observed recently, could have unintended consequences in areas such as South Africa. Many countries are relying on coal to fuel their growing economies and as such, coal’s role is likely to continue to grow. There is, therefore, a risk that without support from these institutions, cheaper, less efficient technologies that pollute more will be used because they are all that can be afforded in the absence of concessional finance.
The African Development Bank, in their recently published “Guidelines for Coal-Fired Power Plants”, took a constructive approach in highlighting the significance of coal in the context of energy poverty alleviation and on limiting the environ-mental footprint of coal via the use of the most appropriate, available, and affordable advanced coal technologies.6
DUAL GOALS
Anglo American is committed to South Africa and its people, as the host country for most of our thermal coal operations, which is why 70% of our coal—or around 34 million tonnes of the coal mined every year—remains on South African soil. Anglo American is one of the state utility, Eskom’s, largest suppliers. Three of the 10 Anglo American mines in South Africa are dedi-cated solely to supplying Eskom, with the other seven supplying a portion of their coal to Eskom. The company’s New Largo proj-ect is set to feed Khusile, Eskom’s new mega power plant, while several existing mines are working with the utility to extend their operational lives to meet continued demand. We are involved in the South African economy and want to be a part of growing the economy in a responsible, sustainable manner. It is clear that South Africa, as with many other countries, will remain depen-dent on coal for energy. The energy sector as a whole, and coal in particular, is a major contributor to global greenhouse gas emis-sions, but that is exactly why we must be part of the solution.
Government support and enabling regulation for cost-effective clean coal technology is the best approach to improving global access to affordable energy, stimulating economic growth, and job creation. The coal industry should take bold steps toward developing and proving clean coal technologies to demonstrate our commitment to improving sustainability and reducing the potential impacts of climate change. At Anglo American, we believe energy poverty and climate objectives can be more than balanced: We believe that they can, and must, be treated as integrated priorities.
REFERENCES
1. International Energy Agency (IEA). Energy poverty, www.iea.org/topics/energypoverty/ (accessed April 2014).
2. OECD/IEA. Energy poverty: how to make energy access universal, www.se4all.org/wp-content/uploads/2013/09/Special_Excerpt _of_WEO_2010.pdf (accessed April 2014).
3. IEA. (2013). World energy outlook 2013, www.worldenergyout look.org
4. South Africa Census. (2011). www.statssa.gov.za/Census2011/default.asp
5. South African Coal Roadmap. (2013). www.sanedi.org.za/ archived/wp-content/uploads/2013/08/sacrm%20roadmap.pdf
6. Global CCS Institute. (2011, 4 October). The global status of CCS: 2011.
ENERGY POLICY

www.cornerstonemag.net 39
By Aleksandra TomczakPolicy Manager, World Coal Association
Although attention surrounding energy poverty is often focused on developing countries, the impacts associ-ated with fuel poverty and high electricity costs have
proven to be deadly in Europe. As is shown in Figure 1, many Europeans cannot adequately heat their homes and have difficulty paying their utility bills. In fact, between 50 and 125 million people are affected by fuel poverty in Europe.1
FUEL POVERTY MEANS FACING WINTERS WITHOUT SUFFICIENT HEAT
There are many definitions for fuel poverty, and some developed countries have developed their own metrics. For instance, the UK has specifically defined fuel poverty as the situation where households spend more than 10% of their income on fuel to maintain an adequate level of warmth;3 as defined by the World Health Organization, safe indoor temperatures are between 18
and 21°C. As shown in Figure 1, in Bulgaria, Portugal, Lithuania, Romania, Cyprus, Latvia, and Malta, over 30% of people are unable to keep their homes warm because they face dispropor-tionately high energy bills. Over 20% of people living in Greece, Poland, Italy, Hungary, and Spain face similar challenges. For these people, living in cold and damp homes increases the risk of asthma, high blood pressure, sickness, and migraines.
The problems from fuel poverty in developed countries extend far beyond a lack of comfort. For instance, in England and Wales alone, 27,000 people die each year as a result of cold temperatures; 10% of these fatalities are directly attributed to fuel poverty.3 If this ratio were extrapolated to the EU level,
“The impacts associated with fuel
poverty and high electricity costs
have proven to be deadly in Europe.”
Europe Struggles to Pay Its Energy Bill
FIGURE 1. A composite fuel poverty indicator based on the percentage of populations in different EU countries2
70
60
50
40
30
20
10
0
Bulg
aria
Port
ugal
Lith
uani
a
Rom
ania
Cypr
us
Latv
ia
Gree
ce
Pola
nd
Mal
ta
Italy
Hung
ary
Switz
erla
nd
Spai
n
Uni
ted
King
dom
Fran
ce
Belg
ium
Czec
h Re
publ
ic
Germ
any
Slov
enia
Slov
akia
Irela
nd
Aust
ria
Esto
nia
Net
herla
nds
Bulg
aria
Swed
en
Icel
and
Finl
and
Nor
way
Luxe
mbo
urg
Arrears on utility bills/3
Inadequately insulated house/3
Disproportionately high housing expenditure/3
Unable to keep home adequately warm

40
it would predict that well over 20,000 people could be dying because of unaffordable fuel every year in Europe. Based on some studies, this projection is a conservative estimate. For instance, Bjørn Lomborg, Director of the Copenhagen Consensus Center and Adjunct Professor at Copenhagen Business School, has estimated that around 1.5 million Europeans could be dying prematurely each year because of the cold.4
SOARING COST OF ELECTRICITY IN EUROPE
The cost of energy is central to the problem of energy and fuel poverty both in developing and developed countries.
Over the past few years, EU countries have seen energy costs escalating, putting more households at risk of energy poverty. In fact, across the EU from 2005 to 2012, household electricity prices have increased by around 55%, from 12.67 to 19.66 € cents/kWh.5
In the UK, energy prices have more than doubled, from 8.8 to 17.85 € cents/kWh. This explains why 4.5 million households, or around 11 million people, in the UK were affected by fuel poverty in 2011, up from two million households in 2004.3
Not all developed countries face sky-high energy prices. In the U.S. consumers pay on average 11.8 $ cents/kWh, which is less than half of the price paid by households in the EU.6
EU CLIMATE POLICIES PRODUCE HIGHER ENERGY PRICES
Governments are aware that current climate policy initiatives increase energy prices for households in Europe. For instance,
the UK Department of Energy & Climate Change (DECC) said in its impact assessment report6 that the EU ETS and renewables target “will have impacts on the number of people defined as being in fuel poverty … because the changes and targets will increase the cost of energy as the costs of EU allowances increases and as the costs of renewable technologies are fac-tored into energy prices.” The same DECC report estimated that the increase in electricity prices will push an additional 1.4 million UK households into fuel poverty by 2020.
Impacts on less affluent central and eastern European coun-tries can be expected to be more severe. In Bulgaria, 50% of citizens are already unable to keep their homes warm and face disproportionately high energy costs. Last year, Bulgaria’s Prime Minister had to resign following nationwide protests against rising energy bills that required many households to spend more than 50% of their monthly revenue to cover those bills.
In Poland, growing energy prices and the cost of purchas-ing emission allowances under the EU ETS are projected to increase the number of people affected by energy poverty by a factor of five by 2020, according to the Polish Central Bank.7
Millions of households in the EU quietly suffer from growing energy prices without the issue of energy poverty receiving much media or government attention. More alarmingly, independent government studies show that fuel poverty will become more acute in coming years. Fuel poverty is not monitored on the EU level, however, and even though energy affordability is defined as one of the pillars of EU energy policy, little attention has been given in recent years to growing energy prices. Generally, the EU energy debate has been dominated by the decarbonization agenda, without much consideration for the socio-economic implications of the deployment of more expensive energy technologies.
AFFORDABLE AND ECONOMIC ENERGY FROM COAL
In the EU, coal-fired power plants generate electricity at half the price of offshore wind turbines and a quarter of the price of solar PV. Electricity generation from coal is also 10 to 30% less expensive than from natural gas and at least 30% less expensive than from onshore wind turbines—not to mention the additional comparative advantage of coal in terms of being a reliable energy supply that does not require back-up genera-tion capacity.8 Local availability of coal and the contribution of coal mining to the EU economy add to its relative benefits when compared to other energy options. Almost 600,000 jobs in the EU depend on the coal mining industry and the use of indigenously mined coal allows many countries to maintain a healthy balance of payments. The value of EU-wide coal and
ENERGY POLICY
In Veliko Tarnovo, Bulgaria, 50% of people are not able to keep their homes warm in the winter due to disproportionately high fuel costs.

www.cornerstonemag.net 41
lignite production totals more than €27 billion each year.9 If coal used in the EU was replaced by natural gas, the annual cost would exceed €50 billion, with the entire sum leaving the EU to finance imported natural gas, much of it coming from Russia, which raises particularly strong energy security con-cerns given recent events in eastern Europe.
Coal provides not only a low-cost source for electricity, but can also contribute to alleviating fuel poverty. One of the most effective ways of using coal for heat generation is in combined heat and power plants (CHP). In Europe, CHP plants supply a large share of heating services in Denmark, Finland, Latvia, and the Netherlands. The principle behind CHP is the simul- taneous utilization of heat and power from a fuel or energy source such as coal. CHP technology can achieve energy con-version efficiency rates of up to 80% or higher—nearly double that of the current state-of-the-art coal-fired power plants.
Keeping coal as part of the EU energy supply does not mean accepting the status quo on climate change. There is huge scope for achieving significant efficiency improvements as the existing fleet of power plants are replaced over the next 10–20 years with new, higher efficiency supercritical and ultra-supercritical plants. By replacing old plants with high-efficiency, low-emis-sions coal technologies, the EU’s emissions from coal-based power generation can be reduced by around 15%. Once CCUS technologies are commercialized, the greenhouse gas footprint of coal-based electricity could be reduced by 90% or more.
TOWARD BALANCED EU ENERGY POLICY
In theory, the aim of the EU’s energy policy is to support sustainable, secure, and competitive energy supply in all EU
member states. Today there is growing evidence that, for a great number of EU households, energy services are no longer affordable. High energy prices have an increasingly noticeable impact on the EU economy and the welfare of its citizens. Governments in the UK, Germany, and Bulgaria are already facing strong criticism from businesses and civil society for allowing energy costs to explode over the last decade.
As the EU is debating its energy policy framework for 2030 it is clear that a growing group of decision makers, including heads of governments, members of the European Parliament, and European Commission officials, are determined to achieve an outcome that puts a stronger emphasis on the affordability of energy supply in the EU. Given that coal is the most affordable energy source for power generation and the most abundant fuel in the EU, any plan to reduce the costs of energy in Europe must hinge on a strategy that includes coal.
REFERENCES
1. Chérel, D. (2009, April). Editorial. EPEE Newsletter, Issue 1, www.fuel-poverty.org/files/WP7_D26-1_en.pdf
2. Bouzarovski, S. (2011, November). Energy poverty in the EU: A review of the evidence, ec.europa.eu/regional_policy/archive/conferences/energy2011nov/doc/papers/bouzarovski_eu_ energy_poverty_background%20paper.pdf
3. UK Department of Energy & Climate Change. (2013). Annual re-port on fuel poverty statistics 2013, www.gov.uk/government/uploads/system/uploads/attachment_data/file/199833/Fuel_Poverty_Report_2013_FINALv2.pdf
4. Lomborg, B. (2007, 31 August). Global warming, the great life-saver [extract from book]. Discover Magazine, lomborg.com/dyn/files/basic_items/27-file/Discover%20-%20Cool%20It%20extract.pdf
5. European Commission. (2013). ec.europa.eu/energy/publications/doc/2013_pocketbook.pdf
6. UK Government, Department of Energy & Climate Change. (22 April 2009). Impact of EU Climate and Energy package, the revised EU Emissions Trading System Directive and meeting the UK non-traded target through UK carbon budgets. www.decc.gov.uk/en/content/cms/what_we_do/lc_uk/carbon_budgets/carbon_budgets.aspx
7. Bawół, M., et al. (2012, September). Towards a new climate consensus for European economic competitiveness—Oppor- tunities and challenges of the EU climate and energy package. Report prepared by Ernst & Young for The Kosciuszko Institute, www.ey.com/Publication/vwLUAssets/ Polityka_klimatyczna_UE/$FILE/2012.09_Raport_instytut%20kosciuszki_Ernst&Young_ENG.pdf
8. International Energy Agency. (2010). Projected costs of generating electricity, 2010 ed., www.iea.org/publications/freepublications/publication/projected_costs.pdf
9. Euracoal. (2013). Coal industry across Europe, www.euracoal.be/pages/medien.php?idpage=917
Combined heat and power plants (the one above is in Lodz, Poland) can operate at efficiencies nearly double that of the world’s most efficient coal-fired power plants.

42
STRATEGIC ANALYSIS
By Hao GuiVice President, Shenhua Group
Senior Vice President, China Shenhua Energy Co., Ltd
The Shenhua Group Corporation, Ltd (Shenhua) is a large, fully integrated coal-based energy enterprise; its princi-pal businesses include mining, electric power, railway,
ports, shipping, coal-to-liquids (CTL), and coal-to-chemicals. All these sectors can be high risk when it comes to safety and, therefore, achieving safe operation has been a challenge.
The majority of Shenhua’s operations are mine-based; Shenhua’s 58 underground coal mines, in particular, are vul-nerable to mine water issues, fires, methane releases, caving roofs, and coal dust. Prior to 2005, Shenhua’s approach to safety management was based on top-down administration, frequent meetings producing formal safety reports to be fol-lowed, and generally centralized regulation. This traditional approach to safety was intermittent, inconsistent, and pas-sive, which was not functional for a company like Shenhua working in continuous, dynamic, and ever-changing safety situations. The traditional approaches to safety could not provide an all-in-one solution that would cover the entire pro-duction process; therefore, such approaches were ill adapted to meet Shenhua’s safety needs. Shenhua urgently needed an advanced, effective, and systematic approach to ensure safe coal production and other operations.
At the same time, the Chinese coal industry as a whole was facing a grim situation in production safety. For this reason, the government and the public had been increasingly atten-tive to the topic of coal mine safety. Shenhua’s recent safety efforts had resulted in it being considered an industry leader in safe coal production. Therefore, safety inspection authorities turned to Shenhua to lead a nation-wide safety improvement initiative, which included research on coal mine safety man-agement options, innovation of a safety management system and institution for implementation, and setting up effective, useful, and modern safety methods suitable for coal mines in China.
Against this backdrop, Shenhua launched a two-year research project with six domestic research institutions, including sev-eral universities, to conduct systematic research on modern safety management concepts, basic theories, preemptive risk control methods, and other essential elements of safety systems. The research team developed a comprehensive pre-emptive risk control system (PRCS) designed specifically for mining. After years of being practiced by coal companies in China, the PRCS has now been shown to effectively improve coal mine safety and can facilitate the safe and stable develop-ment of mining companies throughout China.
COAL MINE PREEMPTIVE RISK CONTROL SYSTEM
The coal mine PRCS was designed according to systematic principles. The system is made up of five distinguishable, but related, parts:
Shenhua Group’s Preemptive Risk Control System: An Effective Approach for Coal Mine Safety Management
“The traditional approaches to safety
could not provide an all-in-one
solution that would cover the entire
production process; therefore, such
approaches were ill adapted to meet
Shenhua’s safety needs.”
The author communicates with miners regarding potential safety hazards.

www.cornerstonemag.net 43
• Core: Risk identification and management• Focus: Limiting unsafe behavior, production system control,
and comprehensive factor management• Support: Preemptive safeguards
Risk Identification and Management
The PRCS aims at preventing minor accidents and eliminating hidden hazards by creating a bottom-up approach that starts with the elimination of minor incidents instead of passively waiting until accidents have occurred. The core of the overall system is risk identification and management. The process has five major steps (see Figure 1), outlined briefly below.
Identification of hazards: Mobilize all employees to find and register hazards in their workplaces and areas of responsibility one-by-one, so as to identify the various types of risks faced by coal mines.
Risk assessment: Assess and classify the thousands or even tens of thousands of hazards identified for coal mines, so as to determine which risks are major risks, which are moderate risks, and which are minor risks, and then identify the priori-ties for safety management and control.
Set hazard management standards and measures: Develop hazard management standards according to the law and regulations, and determine to what extent hazards should be managed and what standards must be met in order to prevent accidents. Answer questions about “what to manage” and “how to effectively manage” to avoid accidents.
Hazard monitoring: Monitor whether hazards are under control, test management and control standards for their effectiveness, and take a dynamic approach to identifying potential accidents.
Early warning: If, during monitoring, it is found that a hazard is not effectively controlled, an early warning corresponding to the grade of the hazard should be issued to prompt the rapid implementation of corrective actions and control measures at the site to prevent accidents.
Limiting Unsafe Behavior
According to China’s industry-wide statistics, 90% of accidents in coal mines are caused by unsafe actions. As a result, limiting unsafe behavior was included as a separate component of the PRCS. Starting with ensuring personnel access is restricted to only areas deemed necessary, limiting unsafe behavior is focused on identifying and investigating such behaviors, increasing safety training, and correcting and reducing unsafe
behaviors. Seven elements make up the methods and require-ments for limiting unsafe behavior in the PRCS.
Production System Control
This aspect of the safety system deals primarily with the con-trol of process-related hazards, such as hazardous materials, tunneling, mechanical and electrical equipment, ventilation, geological surveys, water damage, etc., and other techniques and equipment used in production. The production system controls also specify the requirements for management according to the Coal Mine Safety Regulations, the Coal Mine Safety Quality Standards and Assessment Grading Method, and other applicable laws and regulations. The production system control portion of the PRCS can be divided into 15 sub-systems with 112 total elements.
Comprehensive Management
As part of the comprehensive management of the PRCS, there are six subsystems with 23 elements, which closely regulate auxiliary ground operation, emergency rescue, occupational health services, environmental management, contractor over-sight, and other aspects outside of the production system controls. Comprehensive management is indispensable to successfully managing coal mine safety.
Preemptive Safeguards
To ensure the effective operation of the overall PRCS and pro-vide participation incentives to staff of all levels, five subsystems
FIGURE 1. Risk identification and management process
End
Start
Identification of hazards
Safeguardmechanism
Implementationof management
and control measures
Set hazard managementstandards and measures
Risk assessment
Was the hazardmanagement control
effective?
Hazard monitoringand early warning
Rectification
44
and 14 elements were used to create the preemptive safeguard mechanisms. These systems and elements specify the organi-zational structure for coal mines, the safety investment, regular assessments, rewards, and penalties, as well as the overall cul-ture of safety, fulfilling all the requirements of the PRCS.
Operating the PRCS
In total, Shenhua’s coal mine PRCS contains 28 subsystems and 161 elements, covering nearly every aspect of coal mine safety management. An information-technology-based opera-tional platform system was also developed to improve the efficiency of coal mine safety efforts.
THE IMPORTANT ROLE OF THE COAL MINE PRCS
Shenhua hosted training courses and workshops for experi-ence-sharing by users at different levels during implementation of the PRCS. Assessments, rewards, and penalties were estab-lished. The assessments are dynamic, and include monthly and quarterly assessments of branches and subsidiaries as well as a yearly assessment for all of Shenhua. At the end of each year, a ranking of coal mines is published and is used to decide where the most rewards and penalties should be instated. A training team of nearly 1000 instructors and an assessment team of 600 auditors have effectively advanced the implementation of the PRCS, which has been put into place in all Shenhua’s coal mines.
Based on years of practice, the key aspects of the system can be summarized as follows.
Promote Participation of All Employees and Assert Safety Responsibilities
Prior to the PRCS, Shenhua had already set up a safety responsibility system, but this system had been only partially implemented due to ambiguous responsibilities and limited operability. The PRCS offers clear-cut assignments of respon-sibilities and assessment indicators for the mine leadership, various business units, and individual employees. Clear defini-tions delineate who is in charge, who will do what, and who is responsible for what. With safety elements assigned to the leadership and specific work assigned to employees, the responsibilities are clear to everyone involved. Today, safety inspections are seamless and exhaustive enough to hold specific crews, regional teams, and leaders accountable so that there are no blurry lines around responsibilities.
Provide Solutions for Comprehensive Control of Hazards
The PRCS includes classification of hazards. It allows leader-ship and business departments to carry out inspections and assessments of key sources of hazards. It also allows crews, regional teams, and on-the-ground workers to carry out inspections and assessments of sources of hazards from their respective positions. First, safety management targets are specified based on hazard inspections. The key aspects of hazards that must be managed are determined based on risk assessments. Then, the measurements to be taken to address the hazards are determined based on the set management criteria, which is set by formal regulations or company rules. Lastly, the methods necessary to meet the safety criteria are approved and finalized by management. By following these steps, the head of each unit can more easily remember all the safety management targets, key aspects of hazards, manage-ment measurements, and methods. Through a comprehensive understanding, self-motivation and buy-in of safety manage-ment practices have been dramatically improved.
Realize Closed-Loop Management With Continuous Improvements
The PRCS is based on being proactive toward risks. It is oper-ated using the plan-do-check-act (PDCA) method and is constantly improved through repeating the PDCA cycle. By identifying, assessing, and controlling sources of hazards, the system is designed to eliminate the link between hazards and accidents by implementing proactive safety management. Meanwhile, through hazard monitoring, timely hazard iden-tification, and assignment of responsibilities for correction, Shenhua has developed a long-term, closed-loop manage-ment mechanism for identifying, correcting, and eliminating hazards to institutionalize and normalize hazard identification and control. The PRCS system itself also is regularly evaluated and improved based on the PDCA cycle of system planning, running the system, system assessments, and system review.
“A training team of nearly 1000
instructors and an assessment team
of 600 auditors have effectively
advanced the implementation of the
PRCS, which has been put into place
in all Shenhua’s coal mines.”
STRATEGIC ANALYSIS

www.cornerstonemag.net 45
Emphasize the Importance of Safety-Focused Process Controls
Prior to implementation of the PRCS, Shenhua’s safety man-agement was response oriented; namely, a problem was solved only when we found it, which often occurred after an accident. When the PRCS system was implemented, the focus of safety management shifted to process control; Shenhua now inspects potential hazards, carries out risk assessments, projects what safety issues could occur, and controls the pro-cess. Through these steps, Shenhua has shifted its focus to forward thinking around safe production and has achieved a proactive stance toward safety management. The PRCS is implemented with the initial design of a coal mine and contin-ues through construction, production, and closure. Of all the 746 factors in the PRCS, 482 items (64.6%) are related to pro-cess control. Clearly, Shenhua relies on strict process control to improve mine safety performance.
The System Is Simple and Easily Implemented
Currently in China, there are too many safety-related regula-tions from different agencies at different levels of government; production companies are unable to fully follow, or even understand, all the regulations. Although each coal mine has thousands or even tens of thousands of potential hazards, for each particular job function only tens or dozens of potential hazards exist, of which the few most serious are prioritized for close monitoring and controlled through hazard inspections. Correspondingly, the PRCS converts state coal mine safety laws and regulations into system requirements and breaks them down by job. For example, each position is assigned a Position Risk Card and an Operation Card, which break down regulations into principles that are easy for each worker to understand, greatly improving the relevancy of job safety management
and safety training. If each employee is aware of the potential hazards specific to his job, it is easier for him to closely adhere to safety principles, thus ensuring his own safety. The system is built on each worker having received focused training, clear operational principles, and each person in management also having clear responsibilities.
The System Is Widely Adaptable
The PRCS is a set of safety management principles created specifically for the mining industry. This system was made to be adaptable to coal mines with varied coal types, operating conditions, and scales. For some mines with complex mining conditions, more potential hazards exist and, therefore, the management and control of these hazards is more difficult—but the principles and methods of the overall safety system remain the same. Practice has shown that for such higher-risk coal mines, it is even more important to carefully employ the PRCS.
Shenhua’s PRCS is in line with the safety management guide-line of “establishing a hazard identification and management system and a safety prevention and control system”, a con-cept which was proposed at the Chinese government’s 3rd Plenary Session of the 18th Communist Party of China Central Committee. The PRCS meets two systematic objectives (i.e., hazard identification and management and a safety production and control system), reflects the objective of safe produc-tion, and is consistent with safety management approaches of developed countries around the world. In particular, hav-ing systematic risk management and an institution for safety system implementation means that the safety responsibilities for each position are clear, so that each person, machine, environment, management, and every other element is safely controlled. In this way, everything affecting safety during coal production is normalized, institutionalized, and systemized. In the end, the hazards are identified, accidents are prevented, and safety is profoundly improved.
RESULTS FROM THE PRCS
Since the implementation of the PRCS in all of its coal mines, Shenhua has achieved excellent safety management perfor-mance; since 2007, when the system was first implemented, the fatality rate per million tonnes coal produced has been decreasing (see Figure 2). In 2013, Shenhua was responsible for the production of 500 million tonnes of coal, with only 0.004 fatalities per million tonnes of raw coal, which is far lower than 0.293, China’s 2013 national average. This achieve-ment was a historical low in China and ranks among the best safety records globally. In addition, as utilization of the PRCS spreads, Shenhua’s overall coal mine safety record is con-stantly improving. For example, Shenhua Wuhai Coal Group
A worker above inspects for potential hazards. A key aspect of Shenhua’s approach to safe coal production relies on each worker knowing the risks associated with his position.

46
Corporation and Shenhua Ningxia Coal Industry Group, which previously were characterized by poor infrastructure and weak safety management practices, have now achieved zero fatali-ties for three consecutive years of coal production. Finally, the overall safety awareness of employees throughout Shenhua’s coal mining industry has been dramatically improved. The inci-dence of unsafe actions among employees has been noticeably reduced. For instance, the frequency of unsafe practices in the Shenhua Shendong Coal Group Corporation has been reduced by 30% annually for the past three years.
In 2009, based on the successful implementation of the PRCS in its coal production business, Shenhua moved to implement the system in its power, railway, ports, CTL, and coal-to-chemicals businesses and formed a comprehensive PRCS that follows the entire energy supply chain.
Shenhua’s project entitled “Coal Mine Safe Production PRCS and Control Technologies” was given the top prize in the 2009 Scientific and Technological Progress Award of China’s Coal Industry. In addition, based on the PRCS, the “Coal Mine Safety PRCS Regulation” has become the industry standard for safety in China’s coal production sector. This regulation has been put into practice across the country under the policy jointly enacted by the State Administration of Work Safety and the State Administration of Coal Mine Safety.
Shenhua’s practice of implementing the PRCS has been closely observed by others in China’s coal industry; safety mon-
itoring agencies in the Chinese government have summa-rized Shenhua’s safety practices as the “Five Ones”: establish one guideline, set up one system, explore one method, build one team, and nurture one culture. On 19 July 2012, the State Council held the National Coal Mine Safe Production Experience Sharing Meeting in Yinchuan City, where the “five ones” were specified as the core of the PRCS; the Council called for its additional implementation across the country. Today more than 500 coal mines in Henan, Shanxi, Shaanxi, Inner Mongolia, and Xinjiang have adopted the system. Even some large corporations outside coal mine industry, such as Baosteel Group, have drawn upon the experience of the coal industry’s implementation of this system, and commenced research and development regarding their own approaches to risk control systems that take into account the features of their own industries.
After years of practice, Shenhua has demonstrated that the coal mine PRCS is a set of modern management methods adaptable to various conditions. It has also been shown to be a comprehensive, integrated, and evolutionary mechanism for long-term coal mine safety management. We believe this system will continue to lead to positive trends for coal mine safety management in China.FIGURE 2. Shenhua’s fatality rate, 2007–2013
0.029
0.0177
0.0270.025
0.0175
0.0043
0.0040
0.005
0.01
0.015
0.02
0.025
0.03
0.035
2007 2008 2009 2010 2011 2012 2013
Fata
lities
Per
Mill
ion
Tonn
esCo
al P
rodu
ced
Shenhua holds regular safety training workshops to keep stakeholders updated and engaged about safety practices for dynamic working conditions.
STRATEGIC ANALYSIS

www.cornerstonemag.net 47
By Melanie StutselDirector of Health, Safety, Environment, and Community,
Minerals Council of Australia
Australia’s mining sector seeks to be a global leader in safety and health, but a recent spike in accidents has underlined the need to continue improving. The indus-
try is now exploring new ways of thinking about safety to reach its ultimate goal: zero harm.
By definition, a danger is an immediate threat to people, prop-erty, or the environment, where an appropriate response is necessary to avoid the threat. A danger exists when no pro-tective measures are in place. A hazard can be defined as something that could pose a threat if appropriate action is not taken. To ensure safety, a hazard must be assessed for risk and for ways of eliminating or minimizing that risk. Although the minerals industry accepts that inherent hazards exist, there is no reason for working in the industry to be dangerous. Recognizing this distinction is important. It helps in the identi-fication of effective strategies and actions needed to deal with the risks associated with mining.
Mining, and particularly underground mining, can be a haz-ardous venture. Coal miners face many risks on the job, including cave-ins or fall of ground, gas explosions, vehicle or mobile equipment collisions or crushing, chemical exposure,
electrocution, and fires. To our great sorrow, serious accidents have occurred and some have led to loss of life. Whatever its other priorities, the mining industry’s primary goal must always be safety.
Mine site experience suggests the risks associated with min-ing can be managed by adopting a hierarchy of controls. The most effective starting point is to remove the hazard. If this cannot be done, management and workers must methodi-cally progress through alternative controls, such as improved engineering solutions, better administration and management of the workforce and work, and the deployment of personal protective equipment.
More broadly, there is a need to constantly re-examine the presumptions that underpin safety efforts. For example, new research underway, but not yet published, has indicated that the traditional management of near misses and injury may not necessarily remove risks that could lead to fatalities. This research represents a challenge to almost a century of under-standing in occupational health and safety (OHS). The industry might not be best served by continuing to work in accordance with long-standing risk management models because they are proving to be inaccurate in predicting if a fatality will occur.
The Australian industry agrees there is a need to refocus our energy and resources. The industry’s strong conviction is that all work-related fatalities, injuries, and diseases are preventable.
No task is so important that it cannot be done safely.
All hazards can be identified and their risk managed. Ultimately, everyone has a responsibility for the safety and health of themselves and their coworkers.
Evaluating Safety and Health in Australia’s Mining Sector
“Although the minerals industry
accepts that inherent hazards exist,
there is no reason for working in the
industry to be dangerous.”
The traditional ways of thinking about safety may not be the best approach for Australia’s mining sector.

48
THE SAFETY PHILOSOPHY OF THE AUSTRALIA MINING INDUSTRY
The starting point for the Australian minerals industry, in Australia or wherever Australian companies operate, is a com-mitment to health and safety values and to world-leading performance. For the minerals industry, the health and safety of its workforce is at the forefront of all decisions, so that every-one who goes to work in the industry returns home safely. The ultimate goal is zero harm for employees and local communities.
To achieve this goal, increased effort is needed, based on lead-ership, systems, people, culture, and behavior. These efforts must be aided by robust and clear regulation. The Minerals Council of Australia (MCA), as the peak representative body for the minerals industry in Australia, supports the promotion of
• A world-leading health and safety culture• A regulatory policy framework that encourages and fosters
a relationship of transparent, open, and honest communi-cation among all stakeholders
• Adequate resources across the industry, including human resources, for establishing and maintaining world-leading performance and outcomes
• Stakeholders working together in a cooperative environ-ment to make the workplace safe and healthy
• Clear accountabilities and responsibilities assigned for everything under a worker’s control
• Systems and processes that build continuous improvement in OHS performance and regulation, with reliable informa-tion, data, auditing, and benchmarking
This dedication to health and safety has resulted in an improve-ment in the number of fatalities in the Australian minerals industry over recent decades—from a high of 33 in 1996-97 to a low of two in 2012-13. Despite this generally improving trend, there has been a recent sharp spike in fatalities: 17 reported since June 2013.
Such tragedy demands close examination. Fatalities in the industry typically appear to follow a chaotic, nonlinear trajec-tory. There is no correlation across the range of factors that anecdotally are considered causation factors—the age or experience of the worker, time of day of the incident, or the industry sector or jurisdiction in which the incident occurred.
Of the 89 fatalities in the Australian minerals industry between 2003-04 and 2012-13, the MCA has observed that
• The majority of fatalities occurred in the major mining states (Western Australia: 36%, Queensland: 26%, New South Wales: 13.5%) with a disproportional number, based on the workforce size, occurring in South Australia: 13.5 %.
• The majority of fatalities occurred in the underground met-alliferous sector (26% of fatalities from 13.5% of the total industry workforce) and open-cut metalliferous sector (22% of fatalities from 39.5% of the total industry workforce).
• Underground coal mining was responsible for 9% of fatali-ties (7.5% workforce) and open-cut coal was responsible for 7% fatalities (17.5% workforce).
• 55% of fatalities were associated with contractors; 45% were direct employees.
• The mechanism of fatality was common across different mining sectors—most frequently mobile equipment (37%),
FIGURE 1. Fatalities in the Australian minerals industry
STRATEGIC ANALYSIS
01998-99 1999-00 2000-01 2001-02 2002-03 2003-04 2004-05 2005-06 2006-07 2007-08 2008-09 2009-10 2010-11 2011-12 2012-13 2013-14
2
4
6
8
10
12
14
16
18
20

www.cornerstonemag.net 49
followed by struck/crush (29%), falls (17%), geotechnical (9%), explosion/fire (7%), and electrocution (1%).
• Mechanisms specific to mining and other earth-moving or construction-based industries typically presented a small proportion of fatalities.
A Western Australian Department of Mines and Petroleum analysis of fatalities in Western Australia over the same period found that in 62% of cases onsite procedures were not com-plied with, and in another 27% no procedures were in place. Further, 44% of the fatal accidents involved supervisors in their first 12 months on the job.1
LESSONS LEARNED
In its endeavor to achieve the zero-harm goal, the Australian minerals industry continually reviews incidents and practices. Lessons learned are shared between companies on a regu-lar basis. From such reviews and exchanges there is a broad consensus among companies that the following factors are critically important:
• The commitment of the organization, particularly senior management, to the achievement of a high standard of safety
• The demonstration of this commitment through commu-nication, consistent decision-making, reward and approval systems, allocation of resources to training, and an atten-tive management attitude
• Effective communication between all parts of the organi-zation, based on trust, openness, mutual respect, and an acknowledgment that safety is a shared responsibility
• Communication and maintenance of a shared view of risks and standards of acceptable behavior
• Open-minded learning from experience• Ownership and acceptance of the need for health and
safety controls. This typically requires a participative approach to the development of control and a coopera-tive, nonconfrontational approach to securing adherence to agreed procedures and practices.
It is also broadly agreed that it is necessary to continuously reinforce a culture of safety by ensuring consistent manage-ment response to incidents, feedback on unsafe/unacceptable behaviors, and consistent decisions on resourcing. Persistence and consistency are vital.
Despite these efforts, there is a perception among some stakeholders that the industry has reached a plateau on its journey toward achieving zero harm, that there is a disconnect between the industry’s vision of zero harm and its perfor-mance today.
The Australian minerals industry maintains that bridging this gap requires a focus on tangible outcomes and strategies for delivering those outcomes as well as a strategy for delivering change across:
• Safety leadership• Integration of safety and operations• Competence• Risk management• Safety culture • Safety technology
Industry-wide sharing of lessons learned through reports and meetings can be an important part of continuously reinforcing a culture of safety.
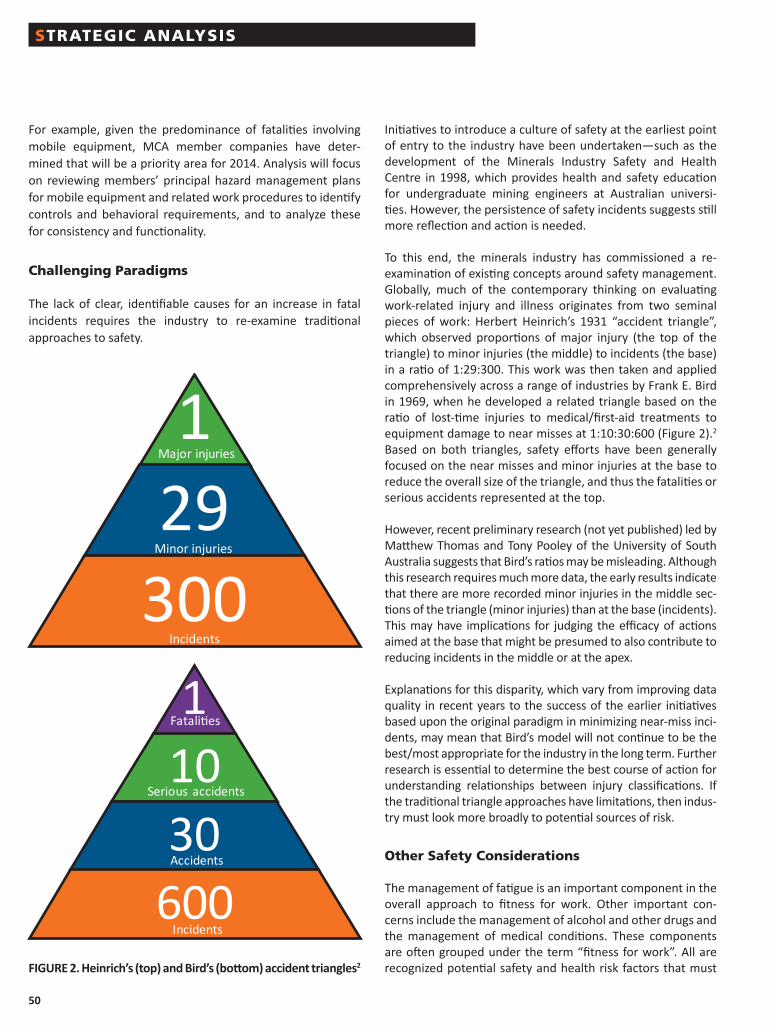
50
For example, given the predominance of fatalities involving mobile equipment, MCA member companies have deter-mined that will be a priority area for 2014. Analysis will focus on reviewing members’ principal hazard management plans for mobile equipment and related work procedures to identify controls and behavioral requirements, and to analyze these for consistency and functionality.
Challenging Paradigms
The lack of clear, identifiable causes for an increase in fatal incidents requires the industry to re-examine traditional approaches to safety.
Initiatives to introduce a culture of safety at the earliest point of entry to the industry have been undertaken—such as the development of the Minerals Industry Safety and Health Centre in 1998, which provides health and safety education for undergraduate mining engineers at Australian universi-ties. However, the persistence of safety incidents suggests still more reflection and action is needed.
To this end, the minerals industry has commissioned a re-examination of existing concepts around safety management. Globally, much of the contemporary thinking on evaluating work-related injury and illness originates from two seminal pieces of work: Herbert Heinrich’s 1931 “accident triangle”, which observed proportions of major injury (the top of the triangle) to minor injuries (the middle) to incidents (the base) in a ratio of 1:29:300. This work was then taken and applied comprehensively across a range of industries by Frank E. Bird in 1969, when he developed a related triangle based on the ratio of lost-time injuries to medical/first-aid treatments to equipment damage to near misses at 1:10:30:600 (Figure 2).2 Based on both triangles, safety efforts have been generally focused on the near misses and minor injuries at the base to reduce the overall size of the triangle, and thus the fatalities or serious accidents represented at the top.
However, recent preliminary research (not yet published) led by Matthew Thomas and Tony Pooley of the University of South Australia suggests that Bird’s ratios may be misleading. Although this research requires much more data, the early results indicate that there are more recorded minor injuries in the middle sec-tions of the triangle (minor injuries) than at the base (incidents). This may have implications for judging the efficacy of actions aimed at the base that might be presumed to also contribute to reducing incidents in the middle or at the apex.
Explanations for this disparity, which vary from improving data quality in recent years to the success of the earlier initiatives based upon the original paradigm in minimizing near-miss inci-dents, may mean that Bird’s model will not continue to be the best/most appropriate for the industry in the long term. Further research is essential to determine the best course of action for understanding relationships between injury classifications. If the traditional triangle approaches have limitations, then indus-try must look more broadly to potential sources of risk.
Other Safety Considerations
The management of fatigue is an important component in the overall approach to fitness for work. Other important con-cerns include the management of alcohol and other drugs and the management of medical conditions. These components are often grouped under the term “fitness for work”. All are recognized potential safety and health risk factors that must
STRATEGIC ANALYSIS
129
300
Major injuries
Minor injuries
Incidents
11030
600
Fatalities
Serious accidents
Accidents
Incidents
FIGURE 2. Heinrich’s (top) and Bird’s (bottom) accident triangles2

www.cornerstonemag.net 51
be managed and controlled as part of the duty-of-care respon-sibilities of the employer and the employees.
Industry guidance on fatigue management has shown that operations should have four fundamental processes in place to support fatigue management strategies:
1. Policy: A document formally outlining the approach, com-mitment, and accountability in which individual stake-holders are named, including a requirement for internal and external auditing processes
2. Training: A training and education program to facilitate the identification of the externally observable signs as well as physical symptoms of fatigue and to adopt coping strategies and mechanisms within and outside the workplace
3. Tracking Incidents: A program to track all incidents, acci-dents, and near misses including the time, day of roster, hours of wakefulness, and sleep length to determine the role of the roster and sleep
4. Support: Medical and well-being support that includes diagnosis of sleep disorders, treatment of sleep problems, and, where necessary, referrals to general practitioners, sleep psychologists, counsellors, or sleep clinics
Although many industries have tried for some time to manage the specific issue of fatigue in a workplace context, it is clear that multiple factors drive fatigue-related outcomes (see Figure 3).
Importantly, recent research has challenged previous assump-tions that fatigue was simply the product of work and sleep patterns. It is now well understood that there is a critical link between mental health issues, fatigue, and drug and alcohol use, all of which are contributing factors to injury in the work-place. For this reason, mental health issues and their impact on workplace safety and productivity is an issue of growing prominence for the Australian mining industry. Prevention is the key and workplaces are ideally suited to address mental health issues because they provide an environment where employees are accustomed to conversations relating to fitness for work, formalized processes for training and engage-ment are in place, and there is a general culture of teammate support.
Based on Australian community data it is estimated:3
• One in five people in Australia experience a mental health issue in a 12-month period.
FIGURE 3. The schematic illustrates the many factors that can impact an individual’s sleep, leading to fatigue.
SLEEP
Travel Time Environment
Family & SocialObligations &
Responsibilities
Time of Day
Personal Time
e.g. Distance km,distance time,
air and/or road,car pool, conditions,
company, self
e.g. Hobbies,sports, hygiene,
meals, relaxation,health, quiet time,
own stuff
e.g. School,banking, shopping,gatherings, outings,
homework, study, meals,infants/children/parenting
Individual Factors
e.g. Age, gender,marital status, health,
alcohol, medication, knowledge,coping strategies, skill base,support, children/parenting
Communal Time
e.g. Meals,parties, drinks,
outings, amusements,gatherings, sports,
activities
Stressors
e.g. Finance,family & friends,
work, world issues,alcohol, relationships,
uncertainty, health
Work Design
e.g. Shift length,breaks, rotation,
sequence, overtime,on-call work, workload, task,
workplace culture
e.g. Weather,temperature, noise,
light, accommodation,home
e.g. Night work,early morning work,circadian rhythms,
forbidden zones, day time sleep,night time sleep, clock watching

52
• Productivity losses linked to mental health issues in the coal mining industry in New South Wales alone range from AUD288 million to AUD429 million per year.
As noted by the New South Wales Minerals Council Chief Executive Officer, Stephen Galilee: “While research suggests mental health issues in our industry are no more prevalent than in the community more broadly, we recognize that the nature and composition of our workforce means implementing pro-active measures at industry level can make a real impact.”4
To increase knowledge about the extent and impacts of mental health issues in the coal industry, the Australian Coal Industry Research Program (ACARP) is funding a series of research works by the University of Newcastle and the Hunter Institute of Mental Health. The research project is designed in two stages. First, it aims to identify the patterns of mental health issues among coal industry employees, the factors associated with these issues, and the impact on an employee’s health, workplace safety, and productivity. There is some evidence of a relationship between mental illness and reduced productiv-ity and injury at work. However, to date no methodologically sound studies have been conducted on these issues in the Australian coal mining industry.
The second part is to develop a roadmap for industry’s response. This requires identifying gaps in understanding as well as management strategies. The goal is to mirror the advances in workplace health and safety and in productivity adopted by the Australian coal industry over the past two decades. This proposal has the potential for international recognition and would be well positioned in the suite of coal-mining-related services and policies exemplified as best practice at the international level.
INTERNATIONAL ENGAGEMENT
Sharing knowledge and insights on safety is vital for creating a safe industry. An incident at one company is a matter for all. Regulators conduct required investigations, but, beyond that, industry itself actively shares details and lessons from incidents to help improve performance. Such sharing should be a goal for the mining industry globally as well.
Through internationally focused organizations such as the
World Coal Association and the International Council of Mines and Metals (ICMM), Australian companies engage on global developments and work to develop the capacity to minimize risk and eliminate fatalities.
Australia has also lent its safety knowledge to other nations, such as a five-year pilot program applying Australian technol-ogy and expertise to a Chinese underground coal mine. It is anticipated that the Chinese mine will be a safety and health model for China’s mining industry.
The challenge across the industry is to be willing to shift para-digms, to develop capacity for a new type of leadership based on personal values and care for others, and to collaborate extensively within and beyond the sector.
As identified by the ICMM at their landmark Health and Safety Conference held in Santiago in 2012, the challenge to ensur-ing the well-being of employees, contractors, their families, and their communities is to “put people first”.5 The Australian mining industry strives to operate to this standard, to continu-ously improve, and to serve as a model globally.
REFERENCES
1. Western Australia Department of Mines and Petroleum. (2013, October). DMP study to help combat mining fatalities and inju-ries. DMP Industry Updates Newsletter. Perth, Australia. www.dmp.wa.gov.au/enews/oct13/
2. O’Neill, S., et al. (2013). Issues in the measurement and report-ing of work health and safety performance: A review. Macquarie University and the International Governance and Performance Research Centre report for Safe Work Australia, the Safety Insti-tute of Australian the Certified Practicing Accountants of Austra-lian, November.
3. University of Newcastle and the Hunter Institute for Mental Health. (2012, May). Mental health and the NSW minerals industry. Sydney, Australia. www.himh.org.au/__data/assets/pdf_file/0004/4945/Mental-Health-in-Mining.pdf
4. NSW mining supporting mental health in the resources industry. (2014, 17 March). Mining Australia, www.miningaustralia.com.au/news/nsw-mining-supporting-mental-health-in-the-resourc
5. International Chamber of Mines and Metals. (2012, November). 2012 Health and Safety Conference. London, United Kingdom. www.icmm.com/publications/health-and-safety-conference-report
The author can be reached at [email protected]
STRATEGIC ANALYSIS

www.cornerstonemag.net 53
By Bruce WatzmanSenior Vice President, National Mining Association
The National Mining Association (NMA) is an advocate at the federal level for mining companies in the U.S. The NMA not only advocates for mining companies, but also
acts as a leader in key areas that are critical for the sustain-ability of the industry. Few issues are more important to the mining industry than safety. Therefore, the NMA is spear- heading a movement to improve safety and health manage-ment in the U.S. mining industry.
As the largest constituent of the U.S. mining industry, coal producers must be an integral part of any overall effort to further improve mining safety. The NMA is collaborating with coal producers and other mining companies to make progress toward an end goal of zero mining accidents.
The U.S. coal mining industry takes safety seriously, and major improvements in safety have been achieved. Since 1970, fatalities in coal mines have decreased by about 92%, while coal production in the U.S. has increased by 62% (see Figure 1). In the last 18 years alone, injuries at coal mines have fallen by half. Despite this clear improvement in safety, Figure 1 also reveals that there has been a plateau in the number of fatalities at coal mines—a phenomenon that is also true of the overall U.S. mining industry.
With the goal of improving mining safety in the U.S., the NMA has asked the following questions: What is necessary to further
improve safety and health performance? Will new laws and regulations be required, as proposed by some, or should the U.S. mining industry consider a new model to manage safety and health after more than 40 years under the Federal Mine Safety and Health Act of 1969?
Focusing on these questions, the NMA set up a task force to examine the potential obstacles resulting from current min-ing safety regulations. The result of the NMA’s efforts was a potential solution: CORESafety®, Committed to Excellence in Mining Safety. CORESafety® is a common safety and health framework that relies on a management system approach to improve safety and health performance. The ultimate goal of the CORESafety® approach is to work with the U.S. min-ing industry to achieve zero fatalities and a 50% reduction in the rate of injuries within five years—goals that are often expressed as 0:50:5.
NMA’s board of directors endorsed CORESafety® in May 2011, and the deployment of CORESafety® has been moving forward since then. We believe that CORESafety® embodies the com-mitment of NMA members to the safety and health of their employees and have made it available, free of charge, to any organization, domestic or international. Although CORESafety® was developed to drive continuous safety improvement in U.S. mining, the risk-based management approach at the system’s core can be applied to mining operations across the globe. Today, more than 125,000 U.S. mining industry employees are participating in CORESafety®.
CORESafety® is built on the Plan-Do-Check-Act model (see Figure 2), which has been successfully deployed in other industries to achieve improvement in safety and health perfor- mance. This model includes 20 modules (listed in Figure 2) designed specifically for mining by mine safety and health professionals. The modules can be adapted to the operations of all mining companies. They are not a replacement for, but
CORESafety®: A System to Overcome the Plateau in U.S. Mine Safety and Health Management
FIGURE 1. Fatalities and production rates in the U.S. coal industry
“Few issues are more important
to the mining industry than
the issue of safety.”
0
200
400
600
800
1000
1200
1400
0
50
100
150
200
250
300
1970 1980 1990 2000 2010
Prod
uctio
n (1
06 stan
dard
tons
)
Fata
lities
Production: 62% increase
Fatalities: 92% decrease

54
rather are intended to complement, existing safety programs and practices. The NMA and leading U.S. mining companies believe that the successful deployment of the CORESafety® system will lead to ongoing improvements, making the U.S. a model of safety for the world.
SYSTEMS FOR MINING SAFETY
It has been said that safety practices in the mining industry are common sense, but the reality is that there are numerous complexities to mine safety. In any potentially hazardous envi-ronment, there are dozens, if not hundreds, of factors that could contribute to an injury or illness. Successfully ensuring a safe work environment means that mine operators must gain a degree of control across this multitude of variables (see Figure 3).
Without question, controlling such a large number of factors and variables is difficult. As a result, the approach of many mines and mining companies is to do what is considered most logical and effective based on their understanding of what can cause incidents. In many cases, safety procedures and plans are based on the regulations set forth by the Mine Safety and Health Administration (MSHA). Another approach often employed is to focus on the key issues that the mine operator sees as major controlling factors. This can result in mine operators addressing one key issue at a time, relatively independent of each other. We believe that there is a better approach: Ensuring a safe workplace requires controlling the interrelationship of the host of variables inherent to operating a mine.
FIGURE 2. Plan-Do-Check-Act model implemented by CORESafety®
FIGURE 3. CORESafety® is based on structured systematic improvements, rather than one-by-one improvements.
1. Leadership 2. Culture Enhancement3. Responsibility & Accountability4. Resources & Planning5. Mgt Sys Coordination
6. Risk & Fatal Mgt7. Change Mgt8. Communication9. Reinforcement
10. Engineering & Construction11. Procedures & Permits12. Training & Competence13. Occupational Health14. Behavior Optimization15. Contract mgt & Procure.16. Emergency Mgt17. Reporting & Incident Investigation18. Safety & Health Mgt Assurance
19. Audit & Review20. Info Mgt & Documentation
LOTO
PPE
Alcohol& Drugs Policy
Audits
Haulage
GroundControl
S&HPolicy
Training
Hazard Assess.
Policy
Process
Task
Systematic Improvement
No Structure Structure
Random Improvement
Plan
Mine
STRATEGIC ANALYSIS

www.cornerstonemag.net 55
While it is extremely difficult to consistently and completely control all the variables and factors, experience has demon-strated that applying systematic, rather than programmatic, control to as many variables as possible is the most success-ful approach for improving mining safety. Such an approach requires the use of a safety and health management system, which can be defined as a structured, systematic means for managing the multitude of variables that introduce risk.
As an example, in 2005 the Chevron Mining Company, a sub-sidiary of Chevron Corporation (no longer a part of the coal business), developed and began implementing a safety and health management system at its North River Mine (Alabama). At the time the system was introduced the mine’s injury rate was in excess of six reportable injuries per 200,000 hours worked. When fully implemented in 2009, the injury rate had dropped below two and the number of citations issued by the Mine Safety and Health Administration had dropped by 48%.
UNDERSTANDING THE DIFFERENCE BETWEEN SAFETY PROGRAMS AND SYSTEMS
Safety programs can be characterized by certain key aspects. They are linear (operating in a series of steps) and they tend to be reactive (emphasizing hazards that have already injured workers and often focused on responding to injuries and acci-dents). In addition, safety programs generally lack integration; aspects within the program are not connected and multiple programs are not integrated. If such programs are not effec-tive, they are unlikely to be fixed until after there has been an accident. When the different parts of a program are not being considered comprehensively, it is difficult to make them work together a priori. Today, the majority of U.S. occupational safety and health programs are premised on federal and state regulatory requirements.
Systems, in contrast, can be described as being cyclical, mean-ing that systems are made up of standard processes that are repetitive and/or continuous. Systems are also proactive. They require mine operators to be always on the lookout for poten-tial hazards, including those that have not caused a problem. An effective safety system will identify and address hazards before an incident has occurred. To accomplish this, safety systems must be characterized by feedback. A system can-not be considered a system unless there are specific metrics indicating whether it is working. Finally, a system must include comprehensive integration with other systems; for example, a safety system can be integrated with a company’s Human Resources system.
A safety and health management system can be most simply defined as a conglomeration of mostly existing processes, programs, procedures, tasks, etc., that function together to
achieve a central goal. A highly effective management system purposefully links and sequences elements within the overall system to produce a clear, consistent way to manage safety. Of course, a successful safety and health management system must also integrate, and is additive to, regulatory compliance.
The simplest way to describe the difference between safety and health programs and systems is that programs are focused on compliance, whereas systems are focused on performance. See Figure 4 for a visual comparison of programs and systems.
Thought about somewhat differently, a program is defined by its output—which, in the safety context, can be the issuance of a citation for noncompliance with a regulatory require-ment, a worker being hurt, or, more tragically, the loss of life. Programs provide no mechanism to ensure that they are functioning as intended. Systems, when fully implemented, provide a mechanism for employers and employees to evalu-ate and prevent an accident before it happens.
COMMON ELEMENTS OF SAFETY SYSTEMS
The major common elements of safety and health manage-ment systems have been highlighted, but no two safety and health management systems are exactly the same, with good reason: No two organizations are the same and their man-agement systems must reflect institutional distinctions. The elements of a system, the modules in CORESafety®, are a way to break down a management system into a structure with workable groupings. For example, risk management—the process of identifying hazards, assessing their risks, and apply-ing appropriate controls—is an element that contains many sub-elements; these sub-elements must work together to effectively manage mining risks.
A safety and health management system must be effective in the context of the company culture, which is demonstrated through attitudes, accepted norms, and behaviors. There is little hope for success of the management system if it is
(Programs)
(Systems)
Input Process Output
Input Process Output
Performance Evaluation
Focus on compliance
Focus on performance
FIGURE 4. Workflow for safety and health programs (top) and systems (bottom)

56
not embraced and recognized within the company culture. Therefore, every system is dependent upon senior manage-ment commitment and effective workforce involvement.
CRITICAL COMPETENCIES
The CORESafety® system is based on critical organizational competencies, including leadership and culture; the system must be implemented through a mining-specific management system with three broad action directives: lead, manage, and assure.
Lead: Relying on and recognizing the central importance of organizational leaders to influence safety and health perfor-mance by positively and intentionally influencing the safety culture.
Manage: Assessing and managing risk to eliminate hazards that could have catastrophic, including fatal, consequences and identifying and eliminating at-risk behaviors.
Assure: Unlike the programmatic regulatory model that has driven safety in the U.S. mining industry to date, CORESafety® participating companies measure performance against identi-fied metrics to determine if the system is operating optimally or if modifications are required to meet stated goals.
LESSONS LEARNED
NMA and the member companies participating in CORESafety® are in the early stages of implementing the system. In devel-oping CORESafety® it was recognized that each company was at a different point in its safety journey. As such, CORESafety® envisions a five-year timeframe for complete implementation. Although some participants are further along than others, as they advance along the continuous improvement timeline, all recognize the potential that CORESafety® provides to achieve the industry’s longstanding zero-accident goal. Some of the lessons we have learned to date include:
• Leadership is needed throughout the formative stages of developing a safety and health management system; specific individuals must be made responsible to set firm, but realistic, deadlines and make accountability clear. The
task force responsible for NMA’s CORESafety® was made up of CEO-level executives from all U.S. mining sectors. It was critical that they were committed to an objective analysis of the shortcomings of the existing program- matic approach to mine safety and health and to finding an approach that would achieve measurable results.
• Companies and individual operations within companies will adopt and implement CORESafety® at a self-deter-mined pace. Some companies with extensive safety and health management systems in effect have already imple-mented major aspects of CORESafety®. Other operations have demonstrated a gap in the culture needed to effec-tively embrace a comprehensive safety management system. Despite those differences, all participating compa-nies believe they have more to learn; they also agree that they all can do more to achieve the 0:50:5 goal.
• Different people learn differently, and such learning dif-ferences must be taken into account when implementing CORESafety®. The 20 modules and other resources that form the fundamental framework of CORESafety® are web-based. Today, we are working to further enhance the resource materials to ensure they are responsive to the needs of participants.
• CORESafety® would not be where it is today without the enthusiasm and professional commitment of the safety professionals who helped develop it. The passion and commitment of these safety professionals is fueled by the belief that their actions can make a real and lasting contri-bution to mining safety—an opportunity they did not want to pass them by.
REALIZING SAFETY SUCCESS
While still early in the process, preliminary data indicate there is a relationship between CORESafety® and performance outcomes and we expect this to strengthen as companies further integrate CORESafety® to supplement the work they already have underway. There are many good programs across the industry driving continuous safety improvement and CORESafety® can complement them.
Additional information about CORESafety®, including the CORESafety® framework and resources, is available at www.coresafety.org
STRATEGIC ANALYSIS

www.cornerstonemag.net 57
By Aaron LeopoldGlobal Energy Advocate, Practical Action
ONE THIRD OF HUMANITY LIVES IN SOME FORM OF ENERGY POVERTY
Energy poverty fuels the poverty trap. Long hours of hard manual labor, subsistence work, and wood gathering leave people exhausted after a day’s work. Teachers and
doctors cannot adequately perform their jobs without energy, and often will not move to areas lacking such infrastructure services. Without energy to pump water, crops whither and people are forced to drink water they know is making them sick. The list goes on, but there is more than just a litany of moral arguments or basic needs surrounding the case to erad-icate energy poverty.
In 2012, it was estimated that the 1.2 billion people at the base of the economic pyramid lacking access to electricity represented a largely untapped energy market of more than US$500 billion per year.1 The IEA has shown that, of these, 84% (or one billion people) live in rural areas, and due to their distance from existing energy infrastructure, only 30% of these can be served economically through grid expansion by 2030.2 Put simply, of that $500-billion untapped market, traditional utilities using traditional grid expansion as their main method to connect new customers will be missing the vast majority of opportunities for expanding their customer bases, brands, and bottom lines. New and innovative business and service
delivery models will be required for traditional utilities to reap benefits from this hitherto untapped and unserved market.
Most of the market for rural, off-grid connections will need to be served by diesel or diesel-renewable hybrid minigrids.2 However, one of the most energy-intensive household and community activities will likely remain underserved by decen-tralized electricity options—cooking and heating.
An enormous part of the world’s population, 2.8 billion people (the majority of whom have electricity connections), rely on traditional biomass such as wood and charcoal to cook, to heat their homes, and to warm water.3 The indoor air pollu-tion caused by these practices is the cause of one of the most under-appreciated crises facing our world today: Such pollu-tion is directly linked to an estimated 4.3 million deaths per year, according to the World Health Organization4—more than HIV/AIDS, tuberculosis, and malaria combined. Furthermore, over half the deaths of children under five are directly attrib-utable to household air pollution associated with cooking with solid fuels.4
Household air pollution causes a wide range of health prob-lems, including pneumonia, stroke, coronary heart disease, chronic obstructive pulmonary disease (COPD), respiratory failure, and cataracts. Health, however, is not the only cause for concern. Millions of women and children in rural areas spend two to eight hours a day collecting firewood from woodlands, exposing them to physical danger from wild animals, as well as violence and accidents while carrying heavy loads of wood. On the environmental side, the Food and Agriculture Organization (FAO) estimated that, between 2000 and 2012, around 13 mil-lion hectares of forests were lost each year, approximately half
Sustainable Charcoal: A Key Component of Total Energy Access?
“The cooking crisis represents a
global tragedy, but there are clear
and inexpensive avenues to address
it that would not only save the lives
of millions, but provide jobs for and
improve the lives of millions more.”
Household air pollution created during cooking and heating, often with unsustainable biomass, is responsible for about 4.3 million fatalities per year.

58
of which is attributed to biomass for cooking.5 As the global population continues to grow, especially in Africa where wood fuel use is most common, this deadly and destructive trend is only set to continue. Clearly, urgent action is required to save lives through policies and strategies that support more sus-tainable production and use of biomass-derived energy.
YOU CANNOT MEASURE WHAT YOU HAVE NOT (ADEQUATELY) DEFINED
Cooking fuels represent one variable in the energy poverty equation, which is much more complex than the binary have/have not definitions still being used by many governments and other organizations. Indeed, many developing-country governments count people simply living in proximity to a sub-station (up to 6 km away in the case of Ethiopia), to which they may or may not be connected, as “having access” to electricity.
Disparate and unrealistic definitions of access give a murky and false understanding of both the scale of the problem and the solutions required to address it. Because of this, Practical Action developed its multidimensional Total Energy Access (TEA) approach as a means to define access that offers a more realistic way of understanding who is unserved and underserved by energy service providers, and what types of energy services they most urgently need to improve their lives and livelihoods. Practical Action’s TEA approach defines having “access” as only when the full range of energy sup-plies and services required to support human social and economic development are available to households, enter-prises, and community service providers. This approach is built on an understanding that poor people are most focused on energy services that they need in their everyday lives, irre-spective of the source of supply. We have suggested a set of minimum standards for household access to services such as lighting, cooking, water heating, space heating and cooling, and use of energy for information and communications technologies. The approach also recognizes that three cat-egories of energy supplies are important in delivering these services—electricity, cooking fuels and stoves, and mech- anical power—and that energy services are needed beyond the household, in productive activities and community ser-vices on which poor people rely.6
The TEA approach to defining and measuring access illustrates the depth and complexity of achieving substantive and trans-formational access to energy. It also served as the foundation for the World Bank’s SE4ALL Global Tracking Framework (GTF), which aims to better measure energy poverty and progress to eradicate it. The GTF considers important attributes of energy supply and access to energy services, grading levels of access on a multi-tier scale. TEA and the GTF are important tools that enable us to begin to more fully understand not only the mul-tifaceted nature of energy poverty as an issue, but how we can better combat it. For instance, in the case of cooking, due to sociocultural and economic, or supply reliability reasons, even if a poor community is electrified, it may take years for resi-dents to view electric cooking as an attractive, viable option for them, if they decide to switch at all. From a TEA perspec-tive, it is imperative to ensure a supply of cooking energy that is appropriate to the location, the culture, the socioeconomic context, and, in the best case, to the environment as well.
MAKING CHARCOAL SUSTAINABLE
Although in most cases, charcoal is not the end solution for clean cooking, it is significantly cleaner than burning raw wood, and is forecast to remain an important component of the energy mix, especially for African households, in the fore-seeable future. At the root of sustainability regarding energy access and development is the need to ensure a balance
STRATEGIC ANALYSIS
Although electrification rates have been increasing in some places, challenges exist, such as the need to remove dangerous illegal connections (as is being done by the Eskom worker above). Sustainable charcoal can act as a near-term clean cooking option until cleaner cooking fuels and/or electricity are available and widely used.Credit: AP Photo/Tawanda Mudimu

www.cornerstonemag.net 59
between the efficient use of an energy resource and the pres-ervation of the ecosystem from where it is harnessed so that it can be continue to be harnessed in the same quantity for the foreseeable future.
Sustainable charcoal refers to a balanced system where the fuel is produced as efficiently as possible and where the resource from which it is harvested is managed in a way that allows it to continue producing similar amounts of harvestable biomass for future use. Charcoal is a high-energy, carbon-rich fuel produced from a range of biomass resources, including fuel wood from forests, scrub land, small-holder farmland, and agricultural waste.
Regarding its sustainability, questions still remain over whether it would be better to use fuel wood in its unprocessed form or to convert it to charcoal; currently, what little scientific evi-dence exists is in favor of charcoal.7 Although the conversion ratio can be as little as 17%, the calorific value of charcoal can
be twice that of wood. Charcoal is lighter, hence easier and safer to transport. Since the volatile matter and tar is removed during carbonization, smaller quantities of harmful gases are released while burning compared to unprocessed wood. Considering that one factor of inefficiency is the technology used to convert the fuel to a useful form (for example, an open fire will only convey around 6% of the power dissipated to the cooking function), it is key that all phases of the production and usage chain be considered when promoting the use of cleaner and more efficient fuels (in this case charcoal). On the usage end, improved cookstoves and smoke hoods will be crucial to reduce the hazards associated with indoor air pollution as well.
Many biomass-using communities compete for what wood can be found in relatively close proximity to their homes. Regulating this generally informal sector would play an impor-tant role in eliminating the unsustainable practices that fuel deforestation and associated issues such as soil erosion and exacerbate the negative health consequences associated with poor-quality charcoal.
The largely informal charcoal market in Africa alone was val-ued at US$8 billion in 2007, with more than seven million people earning their livelihoods from it. These numbers are expected to jump to US$12 billion, and 12 million employed, by 2030.8 The use of sustainable charcoal has the potential to create jobs during wood production, charcoal processing, and distribution and retailing.
Charcoal markets are dynamic and their structure often is unique to the culture of the community. For any charcoal development program to succeed, understanding and incor-porating the sociocultural behavior of the marketplace, communities, and end users directly affected by the resource production is vital. It may be more effective to try to improve an already existing system than to introduce a new system that may not be accepted. In many parts of the world, even those connected to grid electricity still choose to cook with charcoal, due to the high price of electricity and cooking appli-ances compared to their incomes. For such cases it makes more sense to produce charcoal more efficiently and sustain-ably rather than to attempt shifting households to new fuel sources, such as LPG or electricity, which might not be read-ily available in the market, be too expensive, or be culturally unattractive.
In Kenya, firewood and unsustainable charcoal burning are the main drivers of deforestation; forest stands are at less than 3% of what they once were. Nearly 70% of Kenya’s overall population depends on firewood and charcoal for cooking and heating; this number rockets to over 95% in rural areas—with the devastating health effects noted above being felt in every household. The Kenyan example typifies that of dozens of
Women and children often spend many hours each day collecting biomass.

60
countries around the world and illustrates the clear and urgent need for the development of woodlots and market systems for sustainable charcoal production, which will be central to reducing environmental degradation and improving lives and livelihoods of millions of people.9
In the Bondo, Western Kenya, the National Environment Management Authority (NEMA) observed communities that produced and used charcoal because of its availability and lower price compared to other fuels, such as kerosene or LPG. The charcoal, however, was of poor quality and was inefficiently produced. Supported by the PISCES research con-sortium, Practical Action worked with NEMA to support more efficient and sustainable charcoal production by carrying out participatory market mapping in the area to better understand what was being produced and how best to leverage positive change. The market mapping identified local-market, regional, and national actors, the factors influencing their production methods, highlighted good local practices in charcoal pro-duction, and identified issues restricting the sustainability, formalization, and growth of the charcoal sector.
The project highlighted that sustainable charcoal begins with sustainable wood production and more efficient con-version technologies, and also highlighted practical steps to overcome both of these issues. In particular, for charcoal to become sustainable, standardization of its production and retail is required at both national and local levels, and clear understanding of these standards or rules must be ensured at every level of the value chain. To ensure transformation of this currently unregulated and informal sector into a sustainable, efficient, and formalized one, coordinated and concrete action will be required of all actors in the market chain.
TREATING THE DISEASE RATHER THAN ITS SYMPTOMS
Improving the sustainability of supply chains, and the qual-ity of charcoal used, will be essential to curtailing the severe environmental and health impacts of cooking with dirty bio-mass fuels. It must be made clear that sustainable charcoal, albeit currently necessary, is not the solution to these prob-lems, but rather is treating a symptom, and not the disease of energy poverty. Only by bringing fuel-efficient biomass stoves and/or smoke hoods that provide adequate ventilation can real progress be made on indoor air pollution from cooking. Organizations such as the Global Alliance for Clean Cookstoves and Practical Action work extensively on clean cookstoves, which can radically reduce exposure to harmful indoor air pollution, deforestation rates, and greenhouse gas emissions. For instance, the Women’s Development Association Network (WDAN), Practical Action, and the company Carbon Clear are running the Darfur Low Smoke Project, a cookstoves project that helped avoid 36,000 tons of greenhouse gas emissions and which earned Sudan the country’s first carbon credits.10
Global attention to cooking is increasing, but it is still seen as a poor relation to electricity in national energy debates. This must change; the global energy and development community must increase efforts to give this deadly issue sufficient policy and budgetary prominence. As climate change and develop-ment agendas become increasingly focused on changing how energy is produced and consumed in the 21st century, it has been clearly recognized that there must be a step-change away from business-as-usual approaches to energy—and we emphasize that greater focus on cooking must be part of it. Indeed, the Global Tracking Framework indicates that, without changes, by 2030 there will be more people cooking on open fires than there are today.
STRATEGIC ANALYSIS
Sustainably produced charcoal can offer an immediately available option for a solid cooking fuel that avoids some of the major drawbacks of traditional fuels.
“Improving the sustainability of
supply chains, and the quality of
charcoal used, will be essential to
curtailing the severe environmental
and health impacts of cooking with
dirty biomass fuels.”

www.cornerstonemag.net 61
PULLING IT TOGETHER
The World Health Organization’s recent proclamation that air pollution represents “the world’s largest single environmental health risk”11 should serve as a call to governments and the private sector to take immediate action on fostering access to clean, reliable, and safe modern energy services. But, as energy poverty and energy access are not a black-and-white issues, neither are the solutions to alleviating them. They take many forms and are manifested in diverse locations and socio-political contexts around the world. Lack of access to modern cooking energy is even more complex, as it is embedded in deeply rooted sociocultural traditions. These complexities necessitate both a definition of energy access that is broad and holistic enough to encompass this complexity, such as Practical Action’s Total Energy Access approach, and a diverse array of solutions to alleviating energy poverty.
With the vast majority of those living in energy poverty in dis-persed, rural contexts where traditional grids can be slow to deploy, are expensive, and, in poor countries, are often highly unreliable, cooking with biomass will remain a necessity for years to come. This is due both to the local unavailability of alternatives and, once electricity does arrive, to its economic costs compared to traditional biomass (the price of which is artificially low given the socialized costs of illness and death associated with its use). With the number of people lacking access to safe, efficient forms of cooking at more than double those who lack access to electricity, the cooking crisis repre-sents an even more urgent form of energy poverty than does electricity poverty.
Hence, urgent action to foster access to clean, reliable, and safe modern energy services is needed. Within this context, and despite its potential dangers, charcoal will continue to play a key role in the foreseeable future, particularly in Sub-Saharan Africa where charcoal use continues to expand. It is therefore particularly urgent that global action be taken to ensure charcoal is more sustainably produced and consumed. Of equal importance is the need for increased investment in and deployment of improved cookstoves that burn cleaner and more efficiently than traditional cooking methods.
The cooking crisis represents a global tragedy, but there are clear and inexpensive avenues to address it that, if embraced,
will not only save the lives of millions, but will provide jobs to millions more, improving their and their families’ lives and livelihoods.
REFERENCES
1. World Business Council for Sustainable Development (WBCSD). (2012). Access to Energy Initiative: Business solutions to en-able energy access for all. www.wbcsd.org/pages/edocument/ edocumentdetails.aspx?id=14165&nosearchcontextkey=true
2. International Energy Agency (IEA). (2011). World energy outlook 2011. Paris: IEA.
3. Banerjee, S.G., Bhatia, M., et al. (2013). Global tracking framework. Vol. 3. Sustainable energy for all. Washington DC: The World Bank. documents.worldbank.org/curated/en/2013/05/17765643/global-tracking-framework-vol-3-3-main-report
4. World Health Organization (WHO). (2014). March update: Household air pollution and health, www.who.int/mediacentre/factsheets/fs292/en/
5. U.N. Food and Agricultural Organization (FAO). (2010). Global Forest Resources Assessment: Key findings, foris.fao.org/static/data/fra2010/KeyFindings-en.pdf
6. For more information on the TEA approach and its applicability to the household level, see: Practical Action. (2010). Poor peoples energy outlook 2010, practicalaction.org/poor-peoples-energy-outlook-2010. For more information on the applicability of TEA to productive uses of energy, see: Practical Action. (2012). Poor peoples energy outlook 2012, practicalaction.org/ppeo2012. For more information on the applicability of TEA to energy for community services, see: Practical Action. (2013). Poor peoples energy outlook 2013, practicalaction.org/ppeo2013
7. Keita, J.D. (n.d.). Wood or charcoal—Which is better?, www.fao.org/docrep/s4550e/s4550e09.htm#TopOfPage
8. IEA. (2010). World energy outlook 2010. Paris: IEA.9. Practical Action Consulting (PAC). (2012, September). Sustain-
able feedstock management for charcoal production in Kenya. Working brief prepared for PAC by PISCES, pisces.or.ke/sites/default/files/04541%20PAC%20Sustainable%20Feedstock%20Management%20LR4.pdf
10. Gallagher, M. (2014). Meet the women trading Sudan’s first carbon credits. The Guardian Global Development Professionals Network Blog, www.theguardian.com/global-development-professionals-network/2014/apr/17/women-darfur-sudan-carbon-credits
11. WHO. (2014). 7 million premature deaths annually linked to air pollution, www.who.int/mediacentre/news/releases/2014/air-pollution/en/
The author can be reached at [email protected]

62
STRATEGIC ANALYSIS
By Xie Heping Academician, Chinese Academy of Engineering
President, Sichuan University
Liu HongAssociate Research Professor, Energy Research Institute,
National Development and Reform Commission
Wu Gang Research Assistant, Sichuan University
China’s energy policies and development strategies have always emphasized domestic energy development. As China’s most abundant, most economical, and most
reliable fossil fuel, coal has long been the principal energy source supporting economic development; this has led to a unique, complementary interdependence between China’s coal industry and its economy. In other words, economic growth could not have occurred without sufficient coal sup-plies; this is particularly true of the many national economy infrastructures and pillar industries that are coal-intensive and are therefore highly dependent on coal as a raw material. Similarly, economic growth has supported the development of coal resources, provided greater opportunity for market development and technological advancements, and promoted the overall growth and development of China’s coal indus-try. Today, coal is an irreplaceable energy source that helps ensure energy security, maintain social stability, and promote the development of the national and regional economies. In China, the vitality and performance of the coal market are
often considered barometers for the overall state of economic development. However, today there is some desire for China to reduce its dependence on coal; such sentiment is primarily related to the desire to conserve energy resources and limit the energy sector’s environmental impact.
In order to analyze and clearly understand the interdepen-dence of China’s economy and its coal industry, we designed and employed a series of quantitative indicators and we have also identified overall trends with regard to the correlation between China’s economy and its coal industry. The purpose of this effort was to make a relatively accurate quantitative assessment of this interdependence and how it has evolved over time, so as to provide useful information to the govern-ment for its decision-making process.
CORRELATION BETWEEN ECONOMIC GROWTH AND DEVELOPING COAL RESOURCES
The growth rate of China’s GDP, coal consumption, and coal production over the past 60 years are shown in Figure 1. From the figure, it can be determined that the growth rate and trends are similar, with generally the same fluctuation cycles, which indicates a significant positive correlation. Since China produced all of the coal it consumed until about 2009, the rates of growth of coal production and consumption have been quite similar.
Based on historical data from the National Bureau of Statistics of China,1,2 we calculated the average correlation coefficient between growth in China’s GDP and coal consumption. The correlation coefficient is defined as the interdepen-dence of two variables—a value of one indicates complete positive interdependence and a value of zero indicates no
“Today, coal is an irreplaceable
energy source that helps ensure
energy security, maintain social
stability, and promote the
development of the national and
regional economies.”
An Analysis of the Interdependence Between China’s Economy and Coal
-30
-20
-10
0
10
20
30
40
1950 1960 1970 1980 1990 2000 2010
Gro
wth
Rat
e (%
)
GDPCoal ProductionCoal Consumption
FIGURE 1. Historical growth rates for GDP, coal production, and coal consumption

www.cornerstonemag.net 63
interdependence. We found that, from 1953 to 2013, the aver-age correlation coefficient between the GDP growth and coal consumption was about 0.6. In the 30 years before China’s reform and opening up, the correlation coefficient averaged 0.7. In the 30 years after the reform and opening up, the cor-relation coefficient averaged 0.4. Examining the overall trend could lead to the conclusion that the strength of the correla-tion has been decreasing. However, when broken down into shorter time periods, the correlation has fluctuated and been considerably higher and lower than the average. For example, since the beginning of the 21st century, China’s economy has experienced unprecedented rapid development; the auto-mobile, real estate, heavy industry, and power industry have gained momentum as development accelerated. In addition, there has been increased construction of urban infrastructure, which has further supported the growth of energy-intensive industries. As a result, economic growth that is highly resource dependent has been ramping up again.
During the 10th Five-Year Plan period (2001–2005), the cor-relation coefficient between coal consumption and GDP growth increased gradually reaching a maximum of more than 0.8, which reflects the high degree of dependence of China’s economy on coal consumption. During the 11th Five-Year Plan period (2006–2010), China increased efforts related to transforming the structure of all industry sectors, conserv-ing energy, and reducing emissions. China also set a goal to reduce GDP energy intensity by 20%. During this period, the coal industry reorganized itself through mergers and acquisi-tions, and efforts were made to adhere to an energy efficiency approach that supports large power plants and eliminates small power plants. Also, the role of natural gas, nuclear
power, and renewables in the energy sector was increased; major advancements were made in the optimization of energy efficiency and the energy mix nationally. All these factors con-tributed to a decrease in the dependence of China’s GDP on coal consumption.
Looking at a longer time frame as the country progressed from the early stages to the mid-to-late stages of industrialization, the economy transitioned toward service-sector and light-industry-oriented development. During this progression, the carbon intensity of the energy mix was reduced and the corre-lation between the economy and coal consumption gradually weakened. However, in special periods when economic growth picked up rapidly, the positive correlation between coal and China’s economy once again became strongly evident.
INTERDEPENDENCY OF CHINA’S ECONOMY AND COAL
Definition of the GDP-Coal Dependence Index
In order to analyze the dependence of China’s economic development on the coal industry, coal’s contribution to GDP growth, and the dependence the GDP has on the coal indus-try, we have proposed a concept index called the “GDP-coal dependence index”.
This comprehensive index characterizes the dependence of China’s economic growth on coal. This index employs a base year to conduct comparative analyses of changes in certain elements of the dependence of target years. Calculations
In addition to power generation, coal is also used as a raw material and energy source to support rapid growth of the steel and construction materials industries.

64
using a weighted normalization process and the index were completed to indicate the changes in the dependence index for a target year relative to the base year.
Using 2000 as the base year, four indices were considered: GDP coal intensity, the elasticity coefficient of coal produc-tion and consumption, the contribution of coal to total and incremental energy consumption, and the contribution of coal-related industries (i.e., including those that are producing and heavily consuming) to total and incremental GDP. These four indices were used to determine the overall interdepen-dence of China’s economy and coal.
GDP Coal-Intensity
China’s GDP coal-intensity is a key quantitative indicator that comprehensively reflects the level of dependence of the nat-ional economic growth on coal and is most often expressed as coal consumption in tonnes of standard coal equivalent (tsce) per RMB10,000 GDP. Figure 2 shows this trend over the past 10 years using the fair value in 2000 (orange) and the market value in each respective year (blue). It can be seen that China’s overall coal consumption per RMB10,000 GDP has generally declined, with the exception of a minor rebound during the 10th Five-Year Plan period. During the 11th Five-Year Plan period, the Chinese government implemented energy consumption restrictions with quantitative quotas for energy conservation, which led to decreases in the GDP coal-intensity as well as the GDP energy-intensity. If calculated based on the market value each respective year, the GDP coal-intensity decreased from 1.42 tsce/RMB10,000 in 2000 to 0.68 tsce/RMB10,000 in 2012. If calculated based on the fair value in 2000, coal consumption per RMB10,000 GDP in 2012 was about 1.12 toe.
GDP Coal Elasticity Coefficient
The GDP coal elasticity coefficient reflects the sensitivity of the GDP to coal production and consumption (i.e., GDP growth rate to the changes in coal consumption and production). The greater the value of the elasticity coefficient of the GDP to coal production and consumption, the more dependent economic growth is on coal; the smaller the index, the less dependent economic growth is on coal. Figure 3 shows the elasticity coef-ficients of GDP to coal production and consumption in China from 2000–2012. During this time period the average elastic-ity coefficients of GDP were 0.79 and 0.80 for coal production and consumption, respectively. In other words, on average for every percentage point increase in GDP, coal production and coal consumption increased by 0.79 and 0.80 percentage points, respectively.
This indicates that China’s economy had a strong reliance on coal during the time period examined. In addition, it can also be observed that during much of the 10th Five-Year Plan period, the elasticity coefficient was generally higher than in previous or later years, peaked at a value of 2.0, and came close to that maximum a second time, indicating that coal production and consumption were growing at a faster rate than the GDP. The huge demand for coal across the nation was mainly due to the sharp increase in energy-intensive industries during this period. In 2001, 2006, and 2012, the elasticity coefficient was relatively low (even negative in 2001); in each of these years China saw a sharp reduction in coal consumption.
Coal’s Contribution to Energy Consumption
Coal’s contribution to total and incremental energy consump-tion can be reflected in its contribution to China’s overall energy mix. Historically, the percentage of coal in the energy mix has been relatively high. Despite the government’s tre-mendous efforts to optimize the energy mix and also advance
1
-0.52
0.54
1.95
1.43
1.75
0.25
0.55 0.93
0.57 0.72
1.01
0.14 0.17
0.77 0.58
1.83 1.56
0.95 0.60
0.45 0.42
0.66 0.86
0.93 0.48
-1.0
-0.5
0.0
0.5
1.0
1.5
2.0
2.5
2000 2002 2004 2006 2008 2010 2012
Elastic
ity C
oeffi
cien
t(t
sce/
RMB1
0,00
0)
ConsumptionProduction
FIGURE 3. Annual elasticity coefficients for coal production and coal consumption in China
STRATEGIC ANALYSIS
FIGURE 2. GDP coal-intensity in China
1.421.26
1.21
1.31 1.361.47
1.341.27 1.26 1.22 1.19 1.19
1.121.421.23 1.18
1.25 1.21 1.251.11
0.97 0.90.87
0.79 0.74 0.68
0.0
0.2
0.4
0.6
0.8
1.0
1.2
1.4
1.6
2000 2002 2004 2006 2008 2010 2012
GDP
Coa
l-Int
ensit
y(t
sce/
RMB1
0,00
0)
2000-RMB
Repective Year-RMB

www.cornerstonemag.net 65
FIGURE 4. Coal’s contribution to total and incremental energy consumption in China
100
0
53
83
60
100
24
63
100
71
89 95
21
0102030405060708090
100
2000 2002 2004 2006 2008 2010 2012
Coal
's Co
ntrib
ution
to E
nerg
y Co
nsum
ption
(%)
TotalIncremental
low-carbon energy development, coal’s share in China’s pri-mary energy mix has not changed significantly over the past 13 years; the average has been 69% since 2000 and in seven out of the last 13 years coal contributed over 70%. The lowest contribution was in 2012, when coal accounted for about 67% of China’s primary energy mix.
Coal’s contribution to incremental energy increases is defined as the ratio of annual increase in coal consumption to the increase in total energy consumption—this ratio, shown in Figure 4, averaged 66% over the past 13 years. Similar to the elasticity coefficient of coal consumption, this ratio saw dips in 2001, 2006, and 2012.
The Contribution of Coal-Related Industries to Total and Incremental GDP
The term “coal-related industries” includes the coal industry itself and industries that use coal as a principal fuel or raw material (e.g., power production, iron and steel, chemicals industry, and the building materials industry). The contribution of coal-related industries to China’s economy can be evaluated through two metrics: the contribution to the total GDP and that to incremental GDP. Coal-related industries’ contribution to the total GDP is defined as the ratio of the total value added in such industries each year to the total GDP. Coal-related industries’ contribution to incremental GDP is defined as the incremental value added in coal-related industries each year to incremental GDP. Based on the growth of coal-related indus-tries in China in recent years, we assessed the contribution of these industries to total and incremental GDP in China; the results are shown in Figure 5. From 2005–2012, coal-related industries contributed to China’s total GDP and incremental GDP an average of 15% and 18%, respectively.3
GDP COAL-DEPENDENCE INDEX
Based on the quantitative analyses conducted by using the various indicators, and setting 2000 as the base year (i.e., GDP coal-dependence index is 1 in 2000), the GDP coal-dependence index was calculated for each year from 2000 to 2012. The cal-culation results are shown in Figure 6. Over the past 12 years, the dependence of China’s economic development on coal has
The rapid development of China’s modern coal mining industry has also given new opportunities to the equipment manufacturing industry.
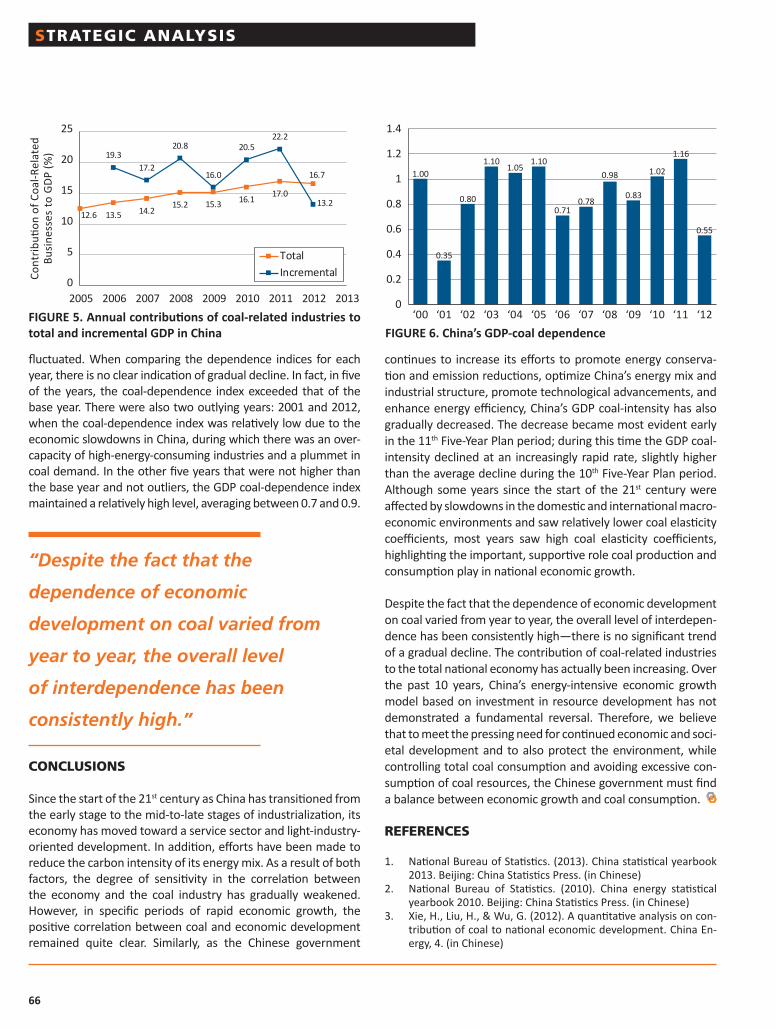
66
fluctuated. When comparing the dependence indices for each year, there is no clear indication of gradual decline. In fact, in five of the years, the coal-dependence index exceeded that of the base year. There were also two outlying years: 2001 and 2012, when the coal-dependence index was relatively low due to the economic slowdowns in China, during which there was an over-capacity of high-energy-consuming industries and a plummet in coal demand. In the other five years that were not higher than the base year and not outliers, the GDP coal-dependence index maintained a relatively high level, averaging between 0.7 and 0.9.
CONCLUSIONS
Since the start of the 21st century as China has transitioned from the early stage to the mid-to-late stages of industrialization, its economy has moved toward a service sector and light-industry-oriented development. In addition, efforts have been made to reduce the carbon intensity of its energy mix. As a result of both factors, the degree of sensitivity in the correlation between the economy and the coal industry has gradually weakened. However, in specific periods of rapid economic growth, the positive correlation between coal and economic development remained quite clear. Similarly, as the Chinese government
continues to increase its efforts to promote energy conserva-tion and emission reductions, optimize China’s energy mix and industrial structure, promote technological advancements, and enhance energy efficiency, China’s GDP coal-intensity has also gradually decreased. The decrease became most evident early in the 11th Five-Year Plan period; during this time the GDP coal-intensity declined at an increasingly rapid rate, slightly higher than the average decline during the 10th Five-Year Plan period. Although some years since the start of the 21st century were affected by slowdowns in the domestic and international macro-economic environments and saw relatively lower coal elasticity coefficients, most years saw high coal elasticity coefficients, highlighting the important, supportive role coal production and consumption play in national economic growth.
Despite the fact that the dependence of economic development on coal varied from year to year, the overall level of interdepen-dence has been consistently high—there is no significant trend of a gradual decline. The contribution of coal-related industries to the total national economy has actually been increasing. Over the past 10 years, China’s energy-intensive economic growth model based on investment in resource development has not demonstrated a fundamental reversal. Therefore, we believe that to meet the pressing need for continued economic and soci-etal development and to also protect the environment, while controlling total coal consumption and avoiding excessive con-sumption of coal resources, the Chinese government must find a balance between economic growth and coal consumption.
REFERENCES
1. National Bureau of Statistics. (2013). China statistical yearbook 2013. Beijing: China Statistics Press. (in Chinese)
2. National Bureau of Statistics. (2010). China energy statistical yearbook 2010. Beijing: China Statistics Press. (in Chinese)
3. Xie, H., Liu, H., & Wu, G. (2012). A quantitative analysis on con-tribution of coal to national economic development. China En-ergy, 4. (in Chinese)
FIGURE 5. Annual contributions of coal-related industries to total and incremental GDP in China FIGURE 6. China’s GDP-coal dependence
12.6 13.5 14.215.2 15.3 16.1 17.0
16.7
19.317.2
20.8
16.0
20.522.2
13.2
0
5
10
15
20
25
2005 2006 2007 2008 2009 2010 2011 2012 2013
Cont
ributi
on o
f Coa
l-Rel
ated
Busi
ness
es to
GDP
(%)
TotalIncremental
1.00
0.35
0.80
1.101.05
1.10
0.710.78
0.98
0.83
1.02
1.16
0.55
0
0.2
0.4
0.6
0.8
1
1.2
1.4
‘00 ‘01 ‘02 ‘03 ‘04 ‘05 ‘06 ‘07 ‘08 ‘09 ‘10 ‘11 ‘12
“Despite the fact that the
dependence of economic
development on coal varied from
year to year, the overall level
of interdependence has been
consistently high.”
STRATEGIC ANALYSIS

www.cornerstonemag.net 67
TECHNOLOGY FRONTIERS
By Yuan LiangAcademician, Chinese Academy of Engineering
President, National Coal Mining Engineering Technology Research Institute
Deputy General Manager, Huainan Mining Group
China is rich in coal-bed methane (CBM) resources. The cumulative proven geologic CBM reserves are 102.3 bil-lion m3 and the recoverable reserves are about 47 billion
m3. The projected amount of CBM at depths shallower than 2000 m is 36.8 trillion m3, which ranks third in the world.1
CBM offers several important functions that are discussed in this article. CBM can exit a coal seam through two main path-ways: 1) drilling directly into the coal seam or gas-rich areas, connecting the drilled areas to a pipeline, extracting the CBM to grade level, and then utilizing the CBM as a clean fuel; or 2) venting CBM to the atmosphere. Active extraction can reduce the concentration of CBM that is present during coal mining, which is an important measure to prevent accidental explo-sions and outbursts of coal and gas. When extracted, CBM is a value-added byproduct of coal mining. There are two main methods of active extraction: underground extraction and surface extraction. The selection of which method is most appropriate is based on the coal seam and regional conditions.
China’s extraction and utilization volumes of CBM in 2013 were 15.6 billion m³ and 6.6 billion m³, which were 10.6% and 13.8%
higher, respectively, than the volumes in 2012. The extraction and utilization volumes of underground CBM were 12.6 bil-lion m³ and 4.3 billion m³, an increase of 10.5% and 13.2%, respectively, compared to 2012. The production and utilization volumes of surface CBM were 3.0 billion m³ and 2.3 billion m³, up by 11.1% and 15%, respectively, compared to 2012. With increased support as of 2014 (i.e., policy, funding, subsidies, etc.) for CBM extraction and utilization, as well as the expan-sion of budget investment by the central government, the utilization volume of coal-bed gas is expected to double.
There are several reasons China is developing its CBM resources. For instance, CBM is a source of clean energy and can be used as a fuel or raw material in many industries. Even more importantly, because CBM is combustible, its extrac-tion is necessary to prevent mining accidents and ensure safe mining conditions. In addition, this technology has recently become even more practical due to breakthroughs in extrac-tion technologies, leading to increases in production.
Most coal mines in China are naturally rich in CBM. More than 70% of the key state-owned coal mines are rich in coal and CBM. Most of the seams supplying China’s state-owned coal mines are also characterized by low gas permeability (<1 mD). For reference, the permeability of coal mines globally generally falls between 0.002 and 16.17 mD. Mines with permeability of less than 0.10 mD account for 35% of China’s relevant state-owned, CBM-rich coal mines; those between 0.1 and 1.0 mD account for 37%; those more than 1.0 mD account for 28%; very few are greater than 10 mD.2,3 Gas extraction under low-permeability conditions is a challenge that several countries with such coal seams are facing.
Today, China’s CBM extraction technology for surface wells is not yet mature, and this has restricted the majority of
Synergetic Technologies for Coal and Gas Extraction in China
“Simultaneous extraction of
coal and CBM is set to become
the principal focus of development
in underground gas extraction
in the future.”
Although CBM poses a potential hazard during the process of coal mining, once extracted it is a useful energy resource that can be used in many industries.

68
“Based on China’s current coal
mining situation … further
development and deployment of
simultaneous extraction of coal
and CBM is inevitable.”
TECHNOLOGY FRONTIERS
domestic surface CBM extraction for years.2,3 The consumption of China’s coal resources is expected to increase significantly over the next 20 years, and will account for 53% of total global coal consumption by 2030. Simultaneous extraction of coal and CBM is set to become the principal focus of development in underground gas extraction in the future.2,3
KEY EXTRACTION TECHNICAL SYSTEMS
The recent rapid technological advancement throughout China’s coal industry has included some major technical innovations related to underground CBM extraction. The mining approach used in the past, where coal was mined from the top to the bottom of the coal seam, is no longer the dominant approach. Instead, a coal bed with the optimal conditions is selected for ini-tial mining; by strategically choosing the initial mining location, the upper and lower coal and rock strata will swell and deform, which increases gas permeability throughout the coal bed. This change in permeability allows the CBM to move more freely and pressure in the seam is reduced as the CBM is extracted.
Similarly, the traditional practice of allowing the protective layer of the CBM to vent to the atmosphere is being replaced with a proactive, high-intensity (i.e., driven by large pumps), controlled CBM extraction. This approach realizes the scientifi-cally based concepts of initial pressure relief and extraction of underground CBM as well as simultaneous extraction of coal and CBM. For coal beds that are not endowed with the protec-tive layer of CBM a different approach is taken. At such sites, mining occurs via special extraction roadways (i.e., large tun-nels in the mine) where pressure reliefs are constructed on the coal-bed roofs and floors. Then, boreholes are crossed over large areas, allowing gas extraction to occur. With this level of extraction, the coal mining activities undertaken at CBM-rich gas coal beds can be safely carried out under low CBM condi-tions (because the CBM is constantly being removed).
In the engineering practice of underground simultaneous extraction of coal and gas, four key technologies have recently been developed: gob-side entry retaining and comprehen-sive CBM control (including technology for construction of a gob-side entry retaining wall); improved filling materials prepa-ration and pumping processes; stability control technologies for surrounding rocks for the gob-side entry retaining wall; and com-prehensive control of CBM for gob-side entry retaining walls.
Based on China’s current coal mining situation, where there is a constant deepening of well fields in some mine areas with complex geological conditions, further development and deployment of simultaneous extraction of coal and CBM is inevitable. Research and development focused on the four key technologies listed above can advance the state-of-the-art of underground simultaneous extraction of coal and CBM.
CURRENT STATUS AND CHALLENGES FOR KEY TECHNOLOGIES
Underground Gas Extraction
Since 1938, when the Longfeng Mine of the Fushun Mining Bureau used pumps for gob CBM extraction for the first time, many other approaches to CBM extraction (e.g., gob, adjacent seam, coal mine bed) have been researched and tested successfully based on the respective mining condi-tions throughout China. Examples include parallel boreholes, cross-hole arrangements, crossing grid boreholes, crossing boreholes, etc. Meanwhile, a complete set of pressure-relief antireflective technologies including deep-hole presplitting blasting, hydraulic cutting, hydraulic fracturing, and hydraulic drilling (expanding) hole, have been researched and devel-oped successfully. These methods are widely used in coal beds with a buried depth of 1000 m or more.
Coal in the Jincheng area in Shanxi is primarily found in sin-gle seams that are CBM rich and where the conditions for coal-seam CBM occurrence are characterized by developed
Surface CBM extraction is gaining traction in China.
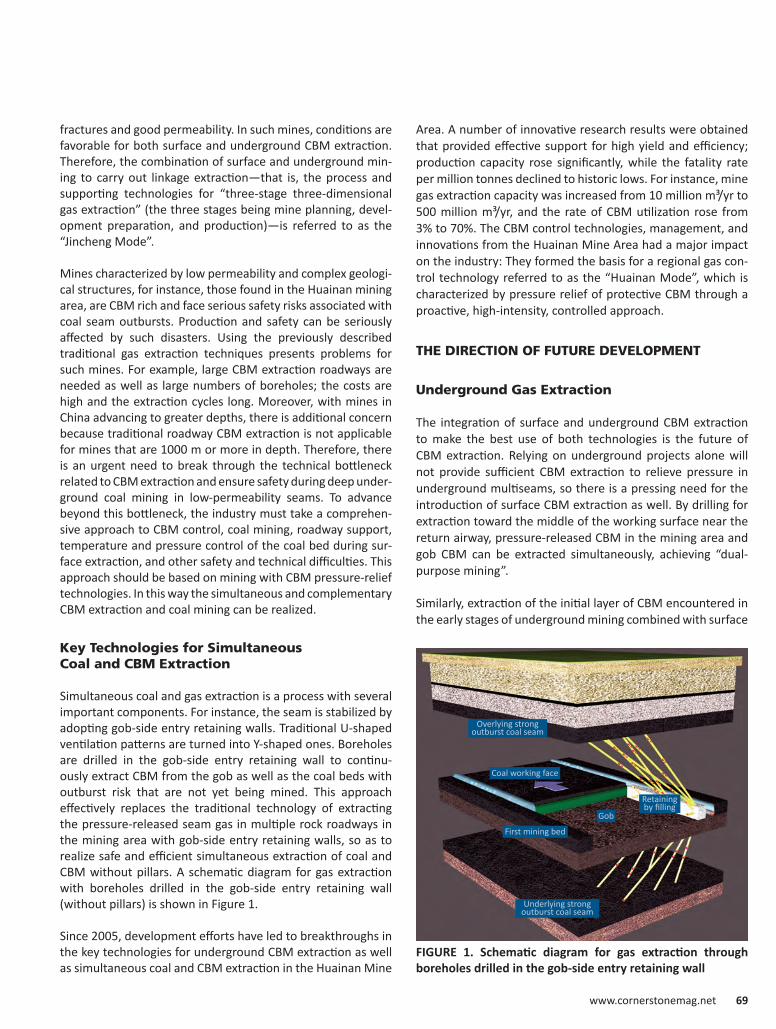
www.cornerstonemag.net 69
fractures and good permeability. In such mines, conditions are favorable for both surface and underground CBM extraction. Therefore, the combination of surface and underground min-ing to carry out linkage extraction—that is, the process and supporting technologies for “three-stage three-dimensional gas extraction” (the three stages being mine planning, devel-opment preparation, and production)—is referred to as the “Jincheng Mode”.
Mines characterized by low permeability and complex geologi-cal structures, for instance, those found in the Huainan mining area, are CBM rich and face serious safety risks associated with coal seam outbursts. Production and safety can be seriously affected by such disasters. Using the previously described traditional gas extraction techniques presents problems for such mines. For example, large CBM extraction roadways are needed as well as large numbers of boreholes; the costs are high and the extraction cycles long. Moreover, with mines in China advancing to greater depths, there is additional concern because traditional roadway CBM extraction is not applicable for mines that are 1000 m or more in depth. Therefore, there is an urgent need to break through the technical bottleneck related to CBM extraction and ensure safety during deep under-ground coal mining in low-permeability seams. To advance beyond this bottleneck, the industry must take a comprehen-sive approach to CBM control, coal mining, roadway support, temperature and pressure control of the coal bed during sur-face extraction, and other safety and technical difficulties. This approach should be based on mining with CBM pressure-relief technologies. In this way the simultaneous and complementary CBM extraction and coal mining can be realized.
Key Technologies for Simultaneous Coal and CBM Extraction
Simultaneous coal and gas extraction is a process with several important components. For instance, the seam is stabilized by adopting gob-side entry retaining walls. Traditional U-shaped ventilation patterns are turned into Y-shaped ones. Boreholes are drilled in the gob-side entry retaining wall to continu-ously extract CBM from the gob as well as the coal beds with outburst risk that are not yet being mined. This approach effectively replaces the traditional technology of extracting the pressure-released seam gas in multiple rock roadways in the mining area with gob-side entry retaining walls, so as to realize safe and efficient simultaneous extraction of coal and CBM without pillars. A schematic diagram for gas extraction with boreholes drilled in the gob-side entry retaining wall (without pillars) is shown in Figure 1.
Since 2005, development efforts have led to breakthroughs in the key technologies for underground CBM extraction as well as simultaneous coal and CBM extraction in the Huainan Mine
Area. A number of innovative research results were obtained that provided effective support for high yield and efficiency; production capacity rose significantly, while the fatality rate per million tonnes declined to historic lows. For instance, mine gas extraction capacity was increased from 10 million m³/yr to 500 million m³/yr, and the rate of CBM utilization rose from 3% to 70%. The CBM control technologies, management, and innovations from the Huainan Mine Area had a major impact on the industry: They formed the basis for a regional gas con-trol technology referred to as the “Huainan Mode”, which is characterized by pressure relief of protective CBM through a proactive, high-intensity, controlled approach.
THE DIRECTION OF FUTURE DEVELOPMENT
Underground Gas Extraction
The integration of surface and underground CBM extraction to make the best use of both technologies is the future of CBM extraction. Relying on underground projects alone will not provide sufficient CBM extraction to relieve pressure in underground multiseams, so there is a pressing need for the introduction of surface CBM extraction as well. By drilling for extraction toward the middle of the working surface near the return airway, pressure-released CBM in the mining area and gob CBM can be extracted simultaneously, achieving “dual-purpose mining”.
Similarly, extraction of the initial layer of CBM encountered in the early stages of underground mining combined with surface
Overlying strongoutburst coal seam
Underlying strongoutburst coal seam
Coal working face
First mining bed
Gob
Retainingby filling
FIGURE 1. Schematic diagram for gas extraction through boreholes drilled in the gob-side entry retaining wall
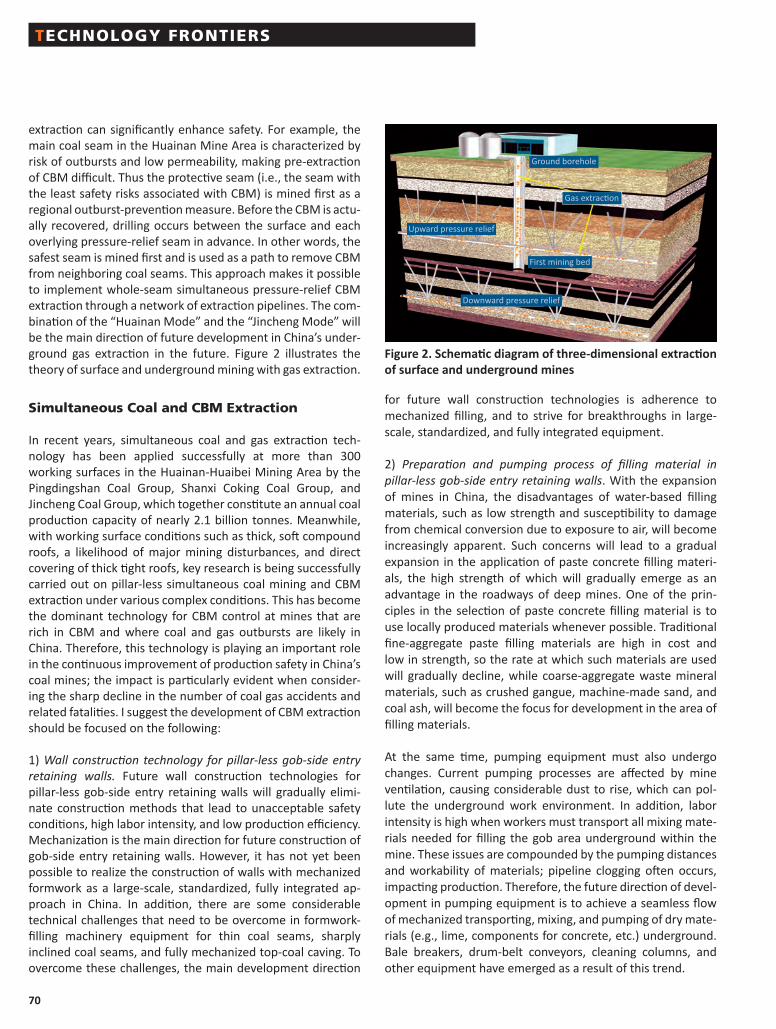
70
Figure 2. Schematic diagram of three-dimensional extraction of surface and underground mines
Ground borehole
Gas extraction
Upward pressure relief
Downward pressure relief
First mining bed
TECHNOLOGY FRONTIERS
extraction can significantly enhance safety. For example, the main coal seam in the Huainan Mine Area is characterized by risk of outbursts and low permeability, making pre-extraction of CBM difficult. Thus the protective seam (i.e., the seam with the least safety risks associated with CBM) is mined first as a regional outburst-prevention measure. Before the CBM is actu-ally recovered, drilling occurs between the surface and each overlying pressure-relief seam in advance. In other words, the safest seam is mined first and is used as a path to remove CBM from neighboring coal seams. This approach makes it possible to implement whole-seam simultaneous pressure-relief CBM extraction through a network of extraction pipelines. The com-bination of the “Huainan Mode” and the “Jincheng Mode” will be the main direction of future development in China’s under-ground gas extraction in the future. Figure 2 illustrates the theory of surface and underground mining with gas extraction.
Simultaneous Coal and CBM Extraction
In recent years, simultaneous coal and gas extraction tech-nology has been applied successfully at more than 300 working surfaces in the Huainan-Huaibei Mining Area by the Pingdingshan Coal Group, Shanxi Coking Coal Group, and Jincheng Coal Group, which together constitute an annual coal production capacity of nearly 2.1 billion tonnes. Meanwhile, with working surface conditions such as thick, soft compound roofs, a likelihood of major mining disturbances, and direct covering of thick tight roofs, key research is being successfully carried out on pillar-less simultaneous coal mining and CBM extraction under various complex conditions. This has become the dominant technology for CBM control at mines that are rich in CBM and where coal and gas outbursts are likely in China. Therefore, this technology is playing an important role in the continuous improvement of production safety in China’s coal mines; the impact is particularly evident when consider-ing the sharp decline in the number of coal gas accidents and related fatalities. I suggest the development of CBM extraction should be focused on the following:
1) Wall construction technology for pillar-less gob-side entry retaining walls. Future wall construction technologies for pillar-less gob-side entry retaining walls will gradually elimi-nate construction methods that lead to unacceptable safety conditions, high labor intensity, and low production efficiency. Mechanization is the main direction for future construction of gob-side entry retaining walls. However, it has not yet been possible to realize the construction of walls with mechanized formwork as a large-scale, standardized, fully integrated ap-proach in China. In addition, there are some considerable technical challenges that need to be overcome in formwork-filling machinery equipment for thin coal seams, sharply inclined coal seams, and fully mechanized top-coal caving. To overcome these challenges, the main development direction
for future wall construction technologies is adherence to mechanized filling, and to strive for breakthroughs in large-scale, standardized, and fully integrated equipment.
2) Preparation and pumping process of filling material in pillar-less gob-side entry retaining walls. With the expansion of mines in China, the disadvantages of water-based filling materials, such as low strength and susceptibility to damage from chemical conversion due to exposure to air, will become increasingly apparent. Such concerns will lead to a gradual expansion in the application of paste concrete filling materi-als, the high strength of which will gradually emerge as an advantage in the roadways of deep mines. One of the prin-ciples in the selection of paste concrete filling material is to use locally produced materials whenever possible. Traditional fine-aggregate paste filling materials are high in cost and low in strength, so the rate at which such materials are used will gradually decline, while coarse-aggregate waste mineral materials, such as crushed gangue, machine-made sand, and coal ash, will become the focus for development in the area of filling materials.
At the same time, pumping equipment must also undergo changes. Current pumping processes are affected by mine ventilation, causing considerable dust to rise, which can pol-lute the underground work environment. In addition, labor intensity is high when workers must transport all mixing mate-rials needed for filling the gob area underground within the mine. These issues are compounded by the pumping distances and workability of materials; pipeline clogging often occurs, impacting production. Therefore, the future direction of devel-opment in pumping equipment is to achieve a seamless flow of mechanized transporting, mixing, and pumping of dry mate-rials (e.g., lime, components for concrete, etc.) underground. Bale breakers, drum-belt conveyors, cleaning columns, and other equipment have emerged as a result of this trend.

www.cornerstonemag.net 71
3) Controlling the stability of the rock surrounding the gob-side entry retaining wall. The stability control technology for the rock surrounding the gob-side entry retaining wall should be based on science and quantitative design. Rock surrounding the roadway should be scientifically and dynamically clas-sified during the initial mine design stage. During the mine design stage, introducing the support of expert systems and design programs into the design process and with specific adherence in the adoption of timbering materials (support-ing the floor and roof of the coal mine) such as high-strength, high-resistance, highly supportive (i.e., high pre-tension), and high-stiffness anchor bolts (cables) will enhance the quality and strength of the timbering. During the construction stage, dynamic monitoring systems should be introduced to check for any deformation in the rock surrounding the roadway. Implementation of a dynamic roadway design process with constantly improving parameter designs should follow scien-tifically accepted methods. Supplementation and adjustment of timbering strength should be carried out in a timely manner depending on the dynamic changes in the surrounding rock conditions, so as to improve timbering efficiency.
4) Comprehensive control of CBM in gob-side entry retaining walls. Currently, restricted by the technical level of equipment manufacturing in China, large-diameter, long borehole CBM extraction has yet to be applied on a large scale. By using large-diameter, long boreholes, the number of boreholes can be greatly reduced, minimizing costs and maximizing extraction efficiency. The promotion and application of this technology is the trend for comprehensive control of CBM in gob-side entry retaining walls. Furthermore, making full use of the unique advantages of gob-side entry retaining walls with regard to extraction time and space, increasing gas extraction intensity in gob-side entry retaining, mutually integrating surface mine extraction with underground mine extraction, and leveraging the pressure-relieving effects of protective seam mining to penetrate the protective seams through surface drilling can greatly enhance the extraction efficiency of a single mine.
CONCLUSION
Technologies for underground CBM extraction and simul-taneous coal and gas extraction, as part of a set of complex
theoretical and technical systems, are the key and dominant technologies for CBM control in China. They are also an impor-tant part of China’s unconventional natural gas development. Even after more than 10 years of development and improve-ment, such technologies still face a situation where theory and fundamental understanding lags behind the applied work. The economic and social benefits gained from the breakthroughs in technologies of underground CBM extraction in China have been evident even in the early stages of research and appli-cation. However, faced with a future of constant expansion of mines, CBM extraction will become even more important. Therefore, increasing the amount of theoretical research work on technologies for underground gas extraction and simultaneous coal and gas extraction, particularly for related theoretical issues of pressure relief and enhancing permeabil-ity, will be the major areas of work going forward. Physical and numerical simulations of similar materials in the laboratory should be vigorously developed. Large scientific experimental facilities should be established to enhance overall theoretical research levels for simultaneous coal and gas extraction, to lay a solid foundation for scientific mining.
REFERENCES
1. China Chemical Network. (2009, 28 September). Current status of the development of coal bed gas in China, www.sxcoal.com/gas/725750/articlenew.html (in Chinese)
2. Yuan, L. (2008). Simultaneous coal and gas extraction theory and practice in pillar-less multi-seams of low permeability. Beijing: China Coal Industry Publishing House. (in Chinese)
3. Yuan, L. (2004). Gas extraction theory and technology in soft multiple coal seams of low permeability. Beijing: China Coal Industry Publishing House. (in Chinese)
4. Zhou, S., & Lin, B. (1999). Coal seam gas occurrence and flow theory. Beijing: China Coal Industry Publishing House. (in Chinese)
5. Yuan, L. (2008). Technology of simultaneous coal and gas extraction with boreholes drilled in retained roadway. Journal of Coal Science & Engineering, 33(8), 898–902. (in Chinese)
6. Yuan, L. (2008). Key technology for simultaneous coal and gas extraction in low permeability, high gas content coal seam cluster under pillar-less gob-side entry retained with Y type ventilation. Journal of China Coal Society, 34(6), 9–13. (in Chinese)

72
TECHNOLOGY FRONTIERS
By Uichiro YoshimuraFormer Director, Japan Coal Energy Center
Toshiro MatsudaDirector, Japan Coal Energy Center
Global coal use has rapidly expanded in recent decades—from 2.2 billion tonnes of oil equivalent (toe) in 1990 to 3.7 billion toe in 2011.1 Much of the increase in coal
utilization was from the construction of new coal-fired power plants; global coal-based electricity generation increased from just over 4400 TWh in 1990 to approximately 9100 TWh in 2011. Under the International Energy Agency’s (IEA’s) New Policies Scenario, in 2035 there will be more than 12,300 TWh of global coal-based electricity, an increase by a factor of approximately 1.4.1 Coal’s role in globally supplying pri-mary energy can be largely attributed to the fact that there are long-term, widely distributed coal reserves and the cost of coal-based energy is affordable. As a result of these factors, coal’s role in the global energy mix is not expected to change for the foreseeable future.
Coal’s energy-security-related advantages, such as the stability associated with long-term supplies, lack of price fluctuations, and reliability as a base electricity source, are especially important in Japan, where nearly all energy is imported; coal has historically
provided approximately 20% of Japan’s primary energy. Taking into account the very low capacity factor of Japan’s nuclear power plants since the Great East Japan Earthquake in 2011 and also concerns about the desire to reduce CO2 emissions the Japanese government had been reviewing its national Basic Energy Plan, which was approved by the cabinet recently. Because coal use is projected to continue, reducing the associ-ated environmental impacts is an important aspect of the plan.
Driven by our own energy challenges and the strong need to rely on all available energy options to ensure energy security, Japan must continue to aggressively support research, devel-opment, and deployment of clean coal technologies (CCTs), which are critical to addressing the environmental impacts associated with coal utilization. In addition, because coal will continue to be increasingly deployed around the world, there is a major opportunity for the CCTs developed in Japan to be deployed globally. The Japan Coal Energy Center (J-COAL) has examined the CCT needs for Japan and the world and has recently updated our CCT roadmap to facilitate the research, development, and deployment of such technologies.
UNDERSTANDING THE NEED FOR CLEAN COAL TECHNOLOGIES
The need for CCTs is global and is largely driven by various regulations and the desire to reduce environmental impacts associated with coal-based power production and coal utiliza-tion. The needs are not universal; in emerging economies there may be an opportunity to employ CCTs to newly built plants. However, in developed countries, where electricity growth is slow, and for the existing fleet of plants in emerging econo-mies, technologies that can be retrofit will be necessary to meet various national and international goals and regulations.
The Global Need for Clean Coal Technologies and J-COAL’s Roadmap to Get There
“Coal’s energy-security-related
advantages … are especially
important in Japan, where nearly all
energy is imported.”
Japan’s coal-fired power plants are some of the most efficient in the world. The steam turbine at J-Power’s ultra-supercritical Isogo plant is shown above.

www.cornerstonemag.net 73
Reducing Criteria Emissions
Globally, regulations are being proposed and deployed to reduce criteria emissions, such as SOx, NOx, particulate matter, and mercury. Advanced technologies for the capture of such criteria emissions are widely employed at Japanese coal-fired power plants, and emissions in Japan are some of the lowest in the world.
Taking mercury as an example, in Japan the emissions stan-dards for mercury are 0.00004 mg/m3 in gases and 0.0005 mg/L in liquids. Many other countries have their own mercury emission regulations as well, such as the Mercury Air Toxics Standards in the U.S. At the international level, the Minamata Convention had been signed by 97 countries as of March 2014. Under the Convention, the emissions, use, and trans-portation of mercury will be restricted comprehensively and internationally. The parties that ratify the convention will be required to control, and reduce where feasible, mercury emis-sions from coal-fired power plants or other sources. There are many commercial CCTs for mercury control, several of which were developed in Japan. At many power plants, the vast majority of mercury can be captured by existing particulate control and desulfurization facilities. Mercury control through dry desulfurization technologies, combined with mercury sorbent injection, can also contribute to further reductions in mercury emissions.
Reducing CO2 Emissions
There has been an increase in the number of national-level CO2 regulations in recent years, with limits in place in the U.S., the EU, Canada, China, and other countries. For example, in the U.S., it has been proposed that new power plants have a CO2 intensity no greater than 454 g-CO2/kWh (1000 lb-CO2/MWh), a level only obtainable with carbon capture and storage (CCS) for coal-fired power plants. In addition, regulations for existing power plants were recently proposed.
The EU has also committed to cutting its 2020 emissions to 20% below 1990 levels. Some EU member countries and regions are considering their own goals as well. In the UK, for example, setting a new standard, 450 g-CO2/kWh, again, achievable only with CCS, was legislated in December 2013. As a result, it is projected that from the period from 2015 to 2020, consumption of coal in the EU could decrease.
At the international level, an IEA roadmap has proposed emission targets for coal-fired power plants from the current worldwide average of 1400 to 743 g-CO2/kWh by applying the most advanced available technologies, such as ultra-supercrit-ical (USC) and integrated gasification combined cycle (IGCC).2 Note that some such high-efficiency, low-emissions (HELE)
plants, with at least 45% efficiency, can offer a 40% decrease in CO2 intensity compared to plants operating at the current global average efficiency of 33%. The IEA roadmap also recom-mends further decreasing CO2 intensities to 669 g-CO2 g/kWh by 2030 through further HELE technology development and deployment.3 Through 2030, high-efficiency technology devel-opment and deployment can play a major role in reducing CO2 emissions; for deeper cuts, CCS will be necessary. Those plants that are built or upgraded with higher efficiencies will be the best options for implementation of CCS.
Since Japan imports nearly all the coal it uses, it is focused on using high-efficiency coal-fired power plants. For this reason, some of the most efficient plants in the world are operating in Japan, such as the 600-MW USC Isogo plant, which can oper-ate at an efficiency as high as 45%.
Utilizing Low-Rank Coal
Although there are no regulations to encourage the use of low-rank coal, it is a field where technology development and deployment could be critical, especially for Japan. Globally, approximately half of mineable coal reserves, ~400 billion tonnes, are sub-bituminous or lignite, which are usually uti-lized near the mine; such coal is not yet commonly imported and used in Japan because of unfavorable economics and some environmental concerns.4 In the interest of being able to import such fuels, Japan has been investing in the devel-opment and optimization of technologies, such as drying, conversion, gasification, and liquefaction of low-rank coal.
JAPAN’S RACE TO DEVELOP CLEAN COAL TECHNOLOGIES
The Japanese government had been revising its national basic plan for energy; the plan was approved by Japan’s cabinet in April 2014 and has been published. The main priorities in the plan are 1) energy security, 2) economic feasibility, 3) the envi-ronment, and 4) safety. In addition, it has been recommended that any changes in energy policy take into consideration projections around Japan’s economic growth and other geo-political conditions.
The plan has outlined that based on its lower geopolitical risk and low-cost per unit energy, coal will continue to play a major role in providing energy in Japan, but because of greenhouse gas emissions there must be changes to Japan’s coal-based energy. Coal-fired power plants will continue to be used to supply base electricity, although such plants must improve their environmental impact through further application of CCTs; in addition, there will be a continued focus on high-efficiency coal-fired power generation.

74
Introduction of state-of-art technologies available today to new power plants and replacement of older coal-fired power plants was another focus. According to Japan’s Energy Plan, HELE technologies should be introduced both domestically and internationally so that coal can be used to improve global energy security with the least possible environmental impact.
Japan’s policies related to CCT development can be catego-rized into two main aspects: 1) environmental policy and 2) industrial policy. See Figure 1 for an overview.
J-COAL’S CLEAN COAL TECHNOLOGY ROADMAP
J-COAL supports Japan’s government in its policy development and implementation and also supports Japan’s energy indus-try to find the most efficient ways to use coal. Recognizing the need for CCTs to achieve HELE coal-based energy, J-COAL has recently revised its CCT roadmap, which was originally pre-pared in 2010 based on the following objectives:
1. Provide a CCT roadmap for research and development (R&D) through 2050 that takes into account the future outlook around coal utilization, including where secure coal supplies exist and environmental stewardship that will be required; this roadmap should be easily understandable to the public.
2. Support the sustainable development of the coal utiliza-
tion industry, which contributes to Japan’s energy security, through joint government and industry R&D.
3. Propose the future direction for CCT-related R&D by rec-ognizing the progress achieved to date and challenges that remain.
4. Identify promising CCT projects and propose them as can-didates for government support.
5. Propose and organize government-led and -sponsored R&D projects.
6. Identify emerging CCTs, which can help the government implement its policies and meet its goals related to energy, environment, industry, and international trade.
Formulation of Targets for Research, Development, and Demonstrations
Since global coal-based energy faces challenges, such as reducing the cost of CO2 emissions controls, increasing fuel diversity by utilizing low-rank coals, and reducing the overall environmental impact, research, development, and demon-stration (RD&D) of CCTs must be encouraged (see Figure 2).
In December 2013, J-COAL completed revisions to its CCT roadmap; the outline was released to the public in January 2014. The technologies being pursued under the roadmap are shown in Figures 3–5; 28 individual technologies were
Japan: ~20–25% electricity is coal-firedGlobal: ~40% electricity is coal-fired and expanding
Background
Challenge: ReduceCO2 emissions from
coal-fired power plants
Challenge: Increasecoal utilization efficiency
Global coal reserves:~860.9 billion tonnes
Bituminous + anthracite: 47%Low-rank (sub-bitum. + brown) 53%
Focuses for environmental policy
Environmental Policy Industrial Policy
• Decarbonize coal-fired power• Identify pathways for utilization of low-rank coal• Provide environmental protection• Facilitate international collaboration through overseas business development
Background: Coal-firedpower is increasing
Low-rank coal isunderutilized: Potential
new markets?
Challenge: Global competition intensifyingSubcritical: Chinese-dominated
SC, USC: Japan and EU makers lead, followedby Chinese and Korean manufacturers
Focuses for industrial policy• Pioneer the world’s coal-fired power generation market through continuous developments and high-efficiency technology innovations• Pioneer a new global market of energy industries and chemical industries (fertilizer, etc.) through high-efficiency coal utilization as well as technologies to use low-rank coals• Advance CCTs through international collaboration, and evaluating CCTs through life cycle cost analysis, employ public funds schemes to advance cost-effective technologies
FIGURE 1. Criteria for formulation of Japan’s CCT-related policies
TECHNOLOGY FRONTIERS

www.cornerstonemag.net 75
selected from our previously published roadmap and other reports, such as “Technological Roadmap in the Area of Coal Usage” (March 2012) developed by the New Energy and Industrial Technology Development Organization (NEDO). The latest information on CCT technologies, including their tar-gets, size, and RD&D stage, are provided in the roadmap to make clear the current progress of CCT RD&D in Japan.
After compiling information on individual technologies, they were categorized into three groups based on their respective objectives and level of development (from basic research to commercialization). The three groups are as follows:
1. Mid- and long-term R&D: technologies with technical issues to be solved (see Figure 3)
2. Economic improvements: technologies with no major technical challenges, but that require further develop-ment to improve overall economics (see Figure 4)
3. Formulation of supply chain: technologies necessary to build a comprehensive clean energy supply chain, which includes production, processing, transportation, and dis-tribution (see Figure 5)
For the first two categories (Figures 3 and 4), three subcat-egories were included to further categorize the technologies: 1) high-efficiency, low-carbon generation; 2) utilization of low-rank coal; and 3) reducing environmental impact. Details about these three subcategories are described in the next three sections.
High-Efficiency, Low-Carbon Coal-Fired Power Plants
The efficiency of coal-fired power plants in Japan has been demonstrated as high as 43% HHV (once it reaches the grid) based on USC technology with a steam temperature of 600°C. Technologies are currently under development that will lead to advanced USC (A-USC) plants with steam temperatures of 700°C and efficiencies of approximately 46%, which will reduce coal consumption and CO2 emissions by an additional 10%. The main technical hurdles to the widespread deploy-ment of such plants are materials and equipment that can withstand the higher temperatures, which are a major focus of development efforts.
IGCC (integrated gasification and combined cycle) and IGFC (integrated coal gasification fuel cell combined cycle) are power plants based on gasification that are under develop-ment; these plants could dramatically reduce CO2 emissions and achieve higher efficiencies than conventional coal-fired power plants. The IGCC demonstration plant in Nakoso, Fukushima, has operated at an efficiency of 40.5% based on the utilization of a Japanese air-blown entrained flow gasifier and 1200°C GT (gas turbine). An IGCC plant with 1500°C GT could offer an efficiency of 46%.
IGFC power plants incorporate both IGCC and fuel cell tech-nology and are expected to exceed 55% efficiency and therefore dramatically reduce CO2 emissions. The Osaki
FIGURE 2. Criteria for the formulation of J-COAL’s CCT R&D roadmap
Forecasting basis• Trend of coal supply & demand• Reduction of environmental burden
Coal-related challenges/objectives:Reduction in CO2 emissions, increase supply
stability, decrease environmental impact
Policy-based targets• CO2 reduction targets• Japan’s Basic Energy Plan• Japan Revitalization strategy
Expanding coal usage isvital due to stability ofsupply and economics
Major R&D targetsHELE coal-fired power plants Utilization of low-rank coal Technologies for environmental protection
Formulate how targetsfor individual technologies
can contribute to therealization of overall goals

76
CoolGen demonstration project is currently underway in Osaki, Hiroshima; this project is based on a Japanese oxygen-blown entrained-type gasifier. The first phase of this project includes only the IGCC plant, the second phase will include CCS, and the third phase will incorporate fuel cells so that the full IGFC technology is implemented with CCS.
As has been highlighted by the IEA, though high-efficiency technologies can greatly reduce CO2 emissions if deployed globally, CCS will eventually be needed to drastically cut emissions. To achieve the ultimate target of near-zero CO2 emissions by 2050,5 J-COAL proposes that an integrated dem-onstration plant of a commercial coal-fired power plant with CCS should commence operation by 2025.
Utilization of Low-Rank Coal
Due to the general characteristics of higher moisture, lower calorific value, and spontaneous combustion, lignite and sub-bituminous coal have not been widely used in Japan. However, to broaden fuel options in Japan, R&D is underway to develop cost-effective conversion processes to produce upgraded brown coal and JGC Coal Fuel, for example, and liquefaction.
Lignite consists of a greater fraction of volatile components, which facilitates its gasification more than bituminous coal, but is still of limited usage because of limitations around costs for transportation. R&D about gasification, conversion to liq-uid fuels, and chemicals is underway. We also believe there may be a possibility for coal-derived products and fuels to dis-place some oil and gas in the Japanese market.
Technologies
2014 2020 2030 2040 2050
① A-USC Commercialization(800�C)
Commercialization(700�C)
Utilization ofLow-rank Coal
High-efficiencyLow-carbon
EnvironmentalProtection
② IGFC *1 Demonstration(Osaki) CommercializationIGFC demo.
(Osaki)
⑧ Chemical Looping CommercializationStudy reactor 30 MW pilot 100 MW demo.
⑪ CO2 conversionto chemicals
Pilot scale CO2Research Small-scale CO2conversion
⑦ CO2 recycle IGCC CommercializationCO2 RecycleClosed test 300 MW demo.O2-CO2
Gasifier test
⑤ Ferro coke *4 Demonstration Commercialization
⑯ TIGAR *7 CommercializationDemo.
⑬ High-efficiencyfluidized bed coal drying Bench test Pilot test Commercialization
⑥ COURSE50 *5 CommercializationBench furnace test Pilot furnace test
⑰ ECOPRO *8 CommercializationDemo. test
Mid- and Long-Term R&D
Steel Industry
PowerGeneration
CO2
Capture
Upgrading
LowEnvironmental
Impact⑱ Low environmentalimpact
R&D emissionreduction technologies,
Element usage technologiesJIS/ISO
Standardization
⑫ Brown coalcarbonization CommercializationDemo.
⑮ IGCC assisted byrenewable energy CommercializationDemo.
⑭ Hyper Coal *6 CommercializationDemo.
Domestic CCTsInternational CCTs
③ A-IGCC *2 Commercial(GT1700�C, 700�C post-A-USC)
⑨ Oxy-fuel combustion Demo. Commercialization
⑩ Post-combustionCO2 capture Demo. Commercialization
④ ABC *3 Commercialization(>10%)
Commercialization(<10%)
Industrial Use
FIGURE 3. CCTs with technical issues under mid- and long-term R&DNotes: *1 IGFC = integrated gasification fuel cell combined cycle; *2 A-IGCC = advanced IGCC; *3 ABC = advanced biomass and coal utilization technologies; *4 Ferro Coke = coke made from low-rank coal and iron ore; *5 COURSE50 = CO2 reductions in the steelmaking process through innovative technology for Cool Earth 50; *6 Hyper Coal = nonash coal produced using solvent extraction; *7 TIGAR = twin circulating fluidized bed gasification technology; *8 ECOPRO = Coal flash partial hydropyrolysis technology
TECHNOLOGY FRONTIERS

www.cornerstonemag.net 77
In addition, based on the important goal of securing resources for Japan’s iron industry, conversion technologies that could create coking coal from low-rank coal, including pyrolysis and hydrogenation, are also being developed.
Reducing Environmental Impact
On the topic of reducing the environmental impact of coal, J-COAL’s roadmap is focused on three main areas:
• Technologies for coal-based electricity: complete RD&D to reduce CO2
• Technologies for coal usage in general industry: develop and deploy air pollution reduction technologies for criteria emissions (e.g., SOx, NOx, particulate matter, etc.)
• Technologies to reduce environmental impact: RD&D to reduce toxic materials in flue gas and ash.
J-COAL is compiling individual tables for the 28 technolo-gies listed in Figures 3–5; the tables will include 1) outlines for R&D, 2) current status of R&D activity, and 3) challenges for acceleration of R&D and technology advancement. These tables will be released to the public in the near future.
CONCLUSIONS
As a result of Japan’s unique energy situation, especially in the supply side, maintaining energy security hinges on an appropriate diversity in energy supply, including coal, which is regarded as a principal source of energy. For this reason, Japan has been researching and developing technologies to facilitate the deployment of CCTs in order to meet energy needs, such as high efficiency, low environmental impact, and cost feasi-bility. J-COAL’s roadmap provides a timeline to move these technologies to the Japanese and global markets.
REFERENCES
1. International Energy Agency (IEA). (2013). World energy outlook 2013, www.worldenergyoutlook.org
2. IEA. (2012). Technology roadmap: high-efficiency, low-emis-sions coal-fired power generation, www.iea.org/publications/freepublications/publication/name,32869,en.html
3. IEA Clean Coal Center. (2012). Global coal developments and climate change policy in 2012. London: IEA Clean Coal Center.
4. J-COAL. (2008). Coal note 2008. Tokyo: Japan Coal Energy Center.5. Japan’s Government. (2007). Cool Earth 50 Plan.
The second author can be reached at [email protected]
FIGURE 4. CCTs focused on economic improvementsNotes: *9 UBC = upgraded brown coal; *10 JCF·HWT (high-temperature water treatment) coal water slurry made from brown coal
FIGURE 5. CCTs focused on supply chain development
EnvironmentalProtection
Utilization oflow-rank coal
2014 2015 2020
Upgrading andIndustrial Use
⑲ USC Secure the bridgehead cooperate with a local maker
⑳ IGCC 250 MW 40.5% (HHV)
Biomass/CoalHybrid (co-firing)
20–50% (Btu-basis)co-firing, separate milling
5% (Btu-basis)co-firing, co-milling
UBC *9 Spread of technologies through construction & operationof commercial plants at coal producing countries
Low price, low ash, low sulfur fuelimported by Japan
Establishing technical reliability internationally
500–600 MW46–48% (HHV)
Marketing technologies to control mercury emissions (U.S., EU)
JCF-HWT *10 CommercializationDemo.
Effective usage ofcoal gasification slag
Mercury controltechnology by dry fluegas desulfurization
Mercury capturesorbent technologies
CommercializationJIS standardization
High-efficiency,Low-carbon
PowerGeneration
LowEnvironmental
Impact
TechnologiesEconomic Improvements
Domestic CCTsInternational CCTs
2014 2020 2030 2040 2050
SNG supply chain Small scale demo. Large scale demo. Low-cost SNGproduction research Commercial
Hydrogen supply chain Small scale demo. Large scale demo. Hydrogencarriers testing Commercial
Hydrogenproduction
from brown coal
International CCTs
Utilization ofLow-rank Coal
IndustrialUse
Supply Chain Development

78
GLOBAL NEWS
Movers & Shakers
Anglo American has announced the appointment of Themba Mkhwanazi as the CEO of its coal business in South Africa, following Godfrey Gomwe’s retirement.
Shenhua Group recently announced that Dr. Zhang Yuzhuo, formerly the President and CEO, has been appointed to the position of Chairman; Dr. Ling Wen has been appointed as the new President and CEO.
International Outlook
China
The government of China announced that an absolute cap on carbon emissions will be included in China’s 13th Five-Year Plan, which will begin in 2016. This would be in addition to the CO2-intensity approach already being utilized under commitments agreed to in 2009 at the Copenhagen Accord negotiations.
Indonesia
Indonesia, who leads the world in coal exports with about 70% of produced coal being sold mostly to India and China, is consid-ering a regulation to more closely control exports as domestic demand rises.
India
Newly elected Indian Prime Minister Naredra Modi has included energy and infrastructure improvements among his top priorities. Modi may rely on coal to fix the electric sector and provide more reliable supplies; reforms may begin with the breakup of Coal India, which supplies 80% of India’s total coal.
United States
On 2 June, the U.S. Environmental Protection Agency pro-posed a state-specific rate-based reduction in CO2 emissions from existing power plants. If implemented, the proposed rule would require states to achieve a 30% reduction in 2005 CO2 emission levels by 2030. There is a 120-day comment period.
Recent Select Publications
Emissions Reduction through Upgrade of Coal-Fired Power Plants: Learning from Chinese Experience – International Energy Agency – Two power units in China were selected to showcase measures that would improve their net efficiency and reduce CO2 emis-sions; experiences learned in China can be applied to improving coal-fired power plant efficiency worldwide. Available at www.iea.org/publications/freepublications/publication/name-56149-en.html
Poor People’s Energy Outlook 2014 – Practical Action – This latest installment of the PPEO revisits the multidimensional Total Energy Access (TEA) approach to defining energy access and also outlines an Energy Access Ecosystem Index that discusses contributors to improving energy access, such as policy, capacity, and finance. Avail-able at practicalaction.org/ppeo2014
Reliable & Resilient: The Value of Our Existing Coal Fleet – U.S. National Coal Council – Per a request from the U.S. Secretary of Energy, Ernest Moniz, the National Coal Council has published a study on how to improve the reliability and efficiency of existing U.S. coal-fired power plants, while reducing emissions. Full study available at www.nationalcoalcouncil.org/NEWS/NCCValue ExistingCoalFleet.pdf

www.cornerstonemag.net 79
Harry Kenyon-Slaney© 2014 Rio Tinto
Key Meetings & Conferences
Globally there are numerous conferences and meetings geared toward the coal and energy industries. The table below highlights a few such events. If you would like your event listed in Cornerstone, please contact the Executive Editor at [email protected]
There are several Coaltrans conferences globally each year. To learn more, visit www.coaltrans.com/calendar.aspx
Meeting Spotlight
21st Century Coal ForumThe World Coal Association (WCA) hosted an international forum in Canberra, Australia, on 25 May for multi-level stake-holders with an interest in the future of coal. The meeting included a special address delivered by The Honorable Ian Macfarlane MP, Minister for Industry. “Australia has a diverse energy mix which includes traditional coal-fired electricity, as well as gas and a range of renewables,” Mr. Macfarlane said. “The Government recognizes the significance of all these energy sources, both now and in the medium and long term for Australia.”
Conference Name Dates Location Website
Coal-Gen Aug. 20–22 Nashville, TN, U.S. www.coal-gen.com/index.htmlInternational Pittsburgh Coal Conference Oct. 6–9 Pittsburgh, PA, U.S. www.engineering.pitt.edu/pcc
International Conference on Greenhouse Gas Technologies
Oct. 6–9 Austin, TX www.ghgt.info/index.php/Content-GHGT12/ghgt-12-overview.html
China International Coal Industry Expo Oct. 16–18 Taiyuan, China www.cicne.com.cn/zhanhui/zhanhui_
xxx.asp?ZhanHuiID=22Gasification Technologies Oct. 26–29 Washington, DC, U.S. www.gasification.orgWorld Clean Coal Conference, China Oct. 29–30 Beijing, China www.worldcleancoal.org/
IHS Asia Pacific Coal Outlook Conference Nov. 2014 Bali, Indonesia www.ihs.com/products/coal/events.
aspx
From the WCA
The World Coal Association has appointed a new Chairman: Harry Kenyon-Slaney, the Chief Executive of the Energy division of Rio Tinto, a leading international mining and metals group headquartered in the UK. When appointed, Mr. Kenyon-Slaney commented, “Undoubtedly the role of coal, as a cheap and plentiful source of fuel, will be
critical in meeting the world’s future energy demands. We as an industry have an interest in ensuring that coal can be extracted and consumed in a way that minimizes any environmental impact. … I see a key role for the WCA in encouraging innovative solutions, and raising the efficiency of power stations and advancing carbon capture and storage are two fronts on which we expect to see real progress.”
The WCA welcomed several new members. Bowie Resources Partners is the largest western bituminous coal producer in the U.S. Karakan Invest is the holding company specializing in shaping and developing the Karakan coal-power cluster in central Russia. Xcoal Energy & Resources is one of the larg-est U.S. exporters of metallurgical coal, thermal coal, and anthracite. The Minerals Council of Australia also joined as an associate member
The World Coal Association has presented Gregory H. Boyce, Chairman and Chief Executive Officer of Peabody Energy, with the 2014 Chairman’s Special Award in recognition of his global leadership on mining safety. As Chairman of the U.S. National Mining Association (NMA), Mr. Boyce has been instrumental in the establishment of CORESafety®, a state-of-the-art safety and health management system designed for the U.S. mining industry.

80
VOLUME 1, ISSUE 3
CLEAN COAL CONVERSION: ROAD TO CLEAN AND EFFICIENT UTILIZATION OF COAL RESOURCES IN CHINA
The author championed that clean coal conversion is one of the most important directions for the clean and effi-cient utilization of coal in China. He presented his view
from the angles of China’s national energy security and world-wide energy demand and supply. Coal’s clean conversion can lead to many important raw materials and chemical products, such as fuels, olefins, methane, glycol, and aromatics, as well as hydrogen. It is a clean and highly efficient approach con-trasted to the conventional use of coal. This approach not only improves the coal economy, but also reduces the environmen-tal impact from coal use.
Among the clean conversion technologies, indirect coal liq-uefaction (ICL) deserves more attention, in my opinion, due to its broad range of useful products and the flexibility in the involved processes. However, for Shenhua Group I believe that both direct coal liquefaction (DCL) and ICL are important and, thus, the emphasis on development should be the same for both technologies. ICL technology started in Germany, but Sasol (in South Africa) has become a bellwether in this field ever since, both in catalyst technology, process/reactor tech-nology, and products.
Sasol’s story demonstrates that lofty goals can be attained with perseverance and dedication. The technical barriers will be broken sooner or later. The R&D on ICL in Shenhua is relatively conservative and its R&D scope is limited. For example, only iron-based catalysts are being studied while other new cata-lysts, such as cobalt-based, are not. Meanwhile, the processes considered are limited mostly to the low-temperature slurry bed with iron-based catalysts. In order to gain a foothold in ICL and become a leader, Shenhua should emphasize the R&D of new FT catalysts, develop new polymerization processes, and develop dedicated technologies to produce the new catalysts based on their unique requirements. In doing so, Shenhua will not only establish its own intellectual property in ICL, but also become a leading player in this technology arena.
Men Zhuowu Project Manager
National Institute of Clean and Low-Carbon Energy (NICE)
VOLUME 2, ISSUE 1
REDUCING ENERGY’S WATER FOOTPRINT
This article makes some very good points. However, while it is sensible to point to the threats implied by projected climate changes, it would be equally sensible to consider
how those same projected changes may impact positively, or at least how we might be able to utilize those changes to over-come some of the problems which have been identified.
The expectation is that climate change through the 21st cen-tury will see a changing pattern of rainfall leading to water crises for many populations. The article highlights water short-ages arising from more extensive droughts in some regions. But overall, precipitation could be expected to rise, and cer-tainly rates of change will be quite different across different regions. In addition to the measures suggested in the article, it would seem that planning of population movements and the location of power generation facilities may need to adapt to the predicted changing climate and rainfall pattern.
As an example, the article suggests that water deficits affected power production in France in three years since 2005, with the implication that this is likely to be an increasing problem in the future. Climate projections for the 21st century sug-gest rainfall will diminish in the south of France, but rainfall in northern Europe, including northern France, may remain at current rates or rise. France may need to consider new water infrastructure or progressively giving up some population, agriculture, or energy production in the south; and they could also consider securing water rights or water options from their northern neighbors who will likely be experiencing some excess.
Peter Sallans Director
Zetta New Energy
Response: The climate impacts on water availability will not be uniform across the globe and, as accurately noted by the commenter, will be regional. What the current climate mod-els are suggesting is that the mid-latitude regions of the globe will likely be the most impacted by reduced water availability in the 21st century. This include the southern and midwestern regions of the U.S. and Canada, northern Mexico, southern Europe and northern Africa, the Middle East, northern India and parts of China in the northern hemisphere, and parts of Brazil, Argentina, southern Africa, Australia, and parts of Southeast Asia in the southern hemisphere. Therefore, reduced water availability is likely in what are often the fastest growing and developing regions of the globe, where energy demands will also be growing. Therefore, impacts of climate
LETTERS

www.cornerstonemag.net 81
on water resources in these areas are likely to exacerbate the competing demands for water in these regions. While other regions are expected to see some increases in water avail-ability, they are often regions with less economic and energy demand growth.
Michael Hightower Distinguished Technical Staff Sandia National Laboratories
Table 1 in Michael Hightower’s article (borrowed from his Sandia paper) is unclear because it mixes units of energy (MWh and liters of liquid fuel), and also mixes energy ser-
vices delivered (electricity versus transportation). It also deals only in consumptive water use rather than true water footprint. The most authoritative source for water footprint that is popu-lated with data and research by the most prominent names in the field and whose numbers are accepted by UNESCO is www.waterfootprint.org. When you use their numbers and normal-ize the water input and energy output to equivalent units of liter of EtOH energy out per liter of water input, and consider the specific energy service of electric power production, this is the result [in terms of energy source: energy service delivered (for electricity L EtOH equivalent/L H2O)]:
Wind: Small, Solar PV: Small, Uranium: 1.9, Natural Gas: 2.3, Coal: 3.4, Solar Thermal: 5.7, Petroleum: 22, Hydro: 470, Biomass: 1500 (ranges from 800 for sugar beet ethanol to 20,000 for jatropha biodiesel, with various algae approaches in the multiple thousands)
Fossil fuels are actually relatively low impact in terms of water use. Also, there is the little-appreciated fact that fossil fuel hydrocarbons bring to the surface long-sequestered hydrogen as well as carbon and release huge amounts of fossil water as steam during combustion. This steam can be condensed to water in the heat-recovery portion of the highest-efficiency power plants. Water production can easily exceed water con-sumption depending on design, and the design will depend upon the relative values of water versus power. When water is even more valuable, water becomes the product and electric-ity the coproduct, and the power plant essentially becomes a water plant.
Simple economics are already forcing fracking operations to shift paradigms from trucking in water to the well site to instead producing water from on-site deep salt aquifers for use in hydro-fracturing. In addition, after the fracking portion is completed, some of the enormous energy coming from the gas field can be used to recover the fracking fluid ingredients from the water, and then to further desalinate and purify the water to local discharge standards and release it, rather than paying to truck it to be impounded in wastewater wells. Thus, fossil fuels can become sources rather than sinks of freshwater
if the water is valued high enough compared to the energy. No renewables offer this option. Hydrocarbons as source of both energy and water is simple scientific fact, but not some-thing that is currently in the public or media consciousness or that fits with the conventional wisdom that demonizes fossil fuels. We need to take a more sophisticated look at all our energy options and accurately assess costs and benefits and possibilities.
Todd “Ike” Kiefer Contracts Administrator
East Mississippi Electric Power Association
Response: As noted by the commenter, there are some com-monly accepted ways to calculate the water footprint. While this approach is a valid process, its utility is somewhat limited because water use for producing or manufacturing materi-als for an energy technology might not come from the same region where the product is used, therefore having differ-ent impacts on different watersheds. Overall though, the water footprint approach provides similar relative rankings of water consumption for energy technologies. Therefore, using water consumption, which is often used to identify the water impacts to a local water shed, is not inconsistent with the UNESCO water footprint approach. While the water withdrawal and consumption per unit of energy was originally used in the 2006 Report to Congress on Energy and Water Interdependencies to compare the water use and consump-tion intensity of various energy technologies, the general public interested in water consumption needs data in terms they can easily understand. Therefore, in all of my subsequent articles, I have used values of water consumption for that energy service in units the general public is accustomed to using. For electric power generation, that is gallons of water per kWh or MWh of electricity generated or, for transportation fuels, the gallons of water consumed per gallon of fuel cre-ated. While all liquid fuels, both biofuels and refined fossil fuel products, have slightly different energy content depending on the fuel produced, the use of gallons per gallon of fuel pro-vides a reasonable comparison of the relative water demands of different fuel production approaches. The comparison gets even a little more complicated when brackish or wastewater is used in fuel production approaches like algal biofuels or for electric power production, since brackish water, seawater, and wastewater often to do not compete directly for freshwater resources in many regions. Therefore, in my opinion, using water demand per unit of energy that the public is comfort-able with provides lawmakers, regulators, and the public with values that they can easily relate to and can compare their relative benefits.
Michael Hightower Distinguished Technical Staff Sandia National Laboratories

82
ASSESSING WATER ISSUES IN CHINA’S COAL INDUSTRY
I plan to share this article with my graduate and law energy students next fall. This is a succinct discussion of the interre-lationship between water use and coal production. The facts
taken from China’s situation present some compelling issues for any country to consider.
J. Diana Hall Professor
College of Law, University of Tulsa
MOVING COAL UP THE VALUE CHAIN
The recent Cornerstone article on ARCTECH’s coal-based biotechnology approaches mentioned the potential to develop in situ coal bioreactors for gas production using
their unique MicGAS™ system, which uses specific microor-ganisms derived from the hindgut of termites. We started collaborating with ARCTECH in 2011 to develop an in situ deployment method for MicGAS™ and quickly realized the potential of this technology.
Bioconversion of coal resources creates new potential gas resources, which under normal geological conditions are substantially less common than coal occurrences. This repre-sents an interesting prospect for many countries that want to improve their energy security while remaining conscious of reducing emissions from ongoing coal-fired power.
The concept of stimulating biogenic gas production from coal seams is not new, and significant testing has been under-taken in the U.S. These ventures have struggled for a number of reasons. First, they are attempting to develop a new gas technology in the U.S. where competition from abundant and cheap shale gas makes market entry unfavorable. Companies have tried to counter this economic reality by using exhausted CBM fields to reduce infrastructure and production costs, but in doing so have overlooked the natural incompatibility of using CBM wells for a process where more tailored designs are needed.
Arguably the biggest hurdle in stimulating biogenic gas pro-duction from coal is the natural biology. Natural microbes are slow, sparsely distributed, and part of exceedingly complex systems with high variability. A statistical approach to try and feed only the beneficial microbes is inherently problematic at scale. This is where the MicGAS™ approach of large-scale batching of highly efficient and proven microbes, tailored to the specific coal, is more viable.
In situ deployment of MicGAS™ has great potential, but the first developments are restricted to those niche locations
where the specific market drivers are present—namely, high gas prices, existing infrastructure, supply risk, and policies that support cleaner coal developments.
Gary Love, PhD Chief Executive Officer
Verso Energy
Microbial conversion of coal (MCC) in situ to low-carbon fuel (biogenic methane) is an emerging multidis-ciplinary technology. Generally, the bioconversion
takes place under prevailing mild subsurface conditions, therefore it is safe. The in situ residual coal is supposed to be free from most of the inherent problems of bio-char, heavy metals, and radio nuclides that are associated with uncon-trolled operational conditions. I fully agree also that microbes can be controlled (up to an extent, not fully) by monitoring the nutrients supplied.
Nevertheless, I understand that recently one U.S.-based com-pany could not obtain the federal permits needed to operate their plan of revitalizing thousands of CBM wells using microbes to generate gas in deep coal seams on plea that deployment of technology would contaminate the underground aquifers. I fully believe in the viability of this still nascent technology in any and all types of coal/lignite applications, including CBM wells, but only with custom-designed pathways and custom-built bioreactors that incorporate mechanisms to monitor and fully control the microbes and address all the envisaged environmental concerns. This would likely restore faith of the regulatory agencies, bankers, and all stakeholders.
Custom designing and in situ construction of techno-econom-ically feasible bioreactors for any and all types of coal/lignite have been envisaged; however, it would be prudent to revali-date project economics for specific target coal(s).
Umesh Singh Former Chief Manager
Coal India Ltd
Response: Considerable evidence is being put forth by researchers of microbial activity in coal seams. This onset of microbial activity over now geological times, most likely started by termites, etc., in buried plant matter, as we see today with woody biomass in the soils. Researchers are report-ing that CBM is of biogenic origin from carbon dating studies. However, biological activity, even though still underway, is at a very low level and is most likely due to a lack of suffi-cient, appropriate groups of microbes and nutrients (needed for converting complex carbon molecules to gas). We believe that commercial rates of production of competitively priced gas requires injecting into the coal seam specifically adapted microbes with appropriate nutrients (as the reader has
LETTERS

www.cornerstonemag.net 83
pointed out, this both maximizes gas production and protects the environment).
The denial of the federal government permit in Wyoming to a U.S. company resulted from some issues regarding pay-ment for the application and was not due to concerns about the potential contamination of aquifers. In fact, the Bureau of Land Management has published guidance (IM WY-85-14) for royalty payments from underground coal gasification on fed-eral coal leases. Also, Wyoming has passed a Biogenic Gas Law in February 2011 that allows permitting use of deep unmine-able coal seams for bioconversion and Wyoming had granted a permit to the referenced company as well others.
Notably, the U.S. EPA and governments in other countries
allow the use of microbes for remediation of contaminants in soils and groundwater. Injection of microbes as biopes-ticides and biofertilizers in crops is widely practiced in the agriculture industry. The authors have deeply investigated the environmental concerns. For instance, we conducted an in depth quantification of impacts of the application of this bio-technology in Wyoming; we looked at the effects after seven generations. Our conclusion was that this approach to coal use would give future generations a safer way to harness the most abundant, low-cost coal for our 7th generation; thus, passing on a legacy of facing challenges with creative economic value generating sustainable solutions.
Daman Walia President and CEO
ARCTECH Inc.
TO SUBMIT A LETTER TO THE EDITOR, EMAIL [email protected] OR [email protected] (CHINESE).
We’re in the process of planning the editorial schedule for 2015.
We’d appreciate hearing from you regarding what topics you would like us to cover.
We’re looking for any and all feedback from our readers.
Cornerstone aims to be inclusive to all things related to coal and energy, especially those pieces that are focused on scientifically-derived solutions for the challenges associated with ever increasing energy demand. Our goal is to include diverse material, such as interviews, letters, op-ed editorial, technical articles, global news, conference listings, etc. If you are interested in contributing or have suggestions about what we should cover, please don’t hesitate to contact the editorial team.
If you have a suggestion, email the editorial team at [email protected] (English) or [email protected]

GET CONNECTEDThere are many ways to be connected with Cornerstone. Did you know you can opt-in to have the table of contents for each new issue emailed to you; use the emailed links to access the full issue or specific articles online, free of charge. Opt-in on our website: www.cornerstonemag.net. Also, join our group on LinkedIn where we will feature different articles and host discussions.
STAY CONNECTEDDon’t let your name be removed from our
distribution list! If you are receiving Cornerstone, but haven’t opted in yet, please visit our website and opt-in. If you would prefer to receive a hard copy in Mandarin, please email your address to the editors at [email protected].
CONNECT WITH USLike what you’re reading? Disagree with an author? Have a correction? Email the editors at [email protected] (English) or [email protected] (Chinese).
www.cornerstonemag.net
CONNECT withTHE OFFICIAL JOURNAL OF THE WORLD COAL INDUSTRY

www.worldcoal.org twitter.com/worldcoal www.worldcoal.org/extract
www.facebook.com/worldcoalassociation www.youtube.com/worldcoal
Coal Classification Industry Approach to Hazard Classification under the Revised MARPOL Convention and the IMSBC CodeThe International Maritime Organization (IMO) has introduced new environmental and health classification criteria for internationally shipped solid bulk cargoes under the International Convention for the Prevention of Pollution from Ships (MARPOL) and the International Maritime Solid Bulk Cargoes (IMSBC) Code.
The World Coal Association (WCA), together with
ARCHE - a specialist environmental toxicology
consultancy - has prepared a package of reports to
assist coal companies with complying with the new
environmental and health classification requirements.
The package consists of three reports and a summary
document:
Report 1: New Compliance Requirements of the
MARPOL Convention and the IMSBC Code
Report 2: Analysis of Coal Composition, Ecotoxicity
and Human Health Hazards
Report 3: Coal Classification Guidance
The reports are available free of charge to WCA
Members.
The reports are also available to non-WCA Members to
purchase. If you would like information on purchasing
this package of reports, please email the WCA Team at:
You can also get the reports for free if you join the
WCA. Join today and you can get instant access to
this package of reports, along with all the other
benefits of membership. If you would like to discuss
WCA membership options, please get in touch:
World Coal Association
5th Floor, Heddon House 149-151 Regent Street London W1B 4JD, UK
+44 (0) 207 851 0052
www.worldcoal.org [email protected]
WCA Coal Classification Ad 206w x 273h.indd 3 01/07/2014 14:45

Improving the poor’s access to modern energy sources can make an important difference to their welfare and can be a catalyst for human development.