Embed Size (px)
Citation preview

The role of water for food production and trade in the Americas
Claudia Ringlera, Insa Flachsbarthb, Tingju Zhua and Mark W. Rosegranta
Environment and Production Technology DivisionBotin Foundation, Spain &CEIGRAM, Universidad Politécnica de
Madrid, Spain
“Water: Food for the Land”, Buenos Aires, ArgentinaSeptember 25th, 2013,
Ministerial Meeting of the Ministers of Agriculture of the American Hemisphere
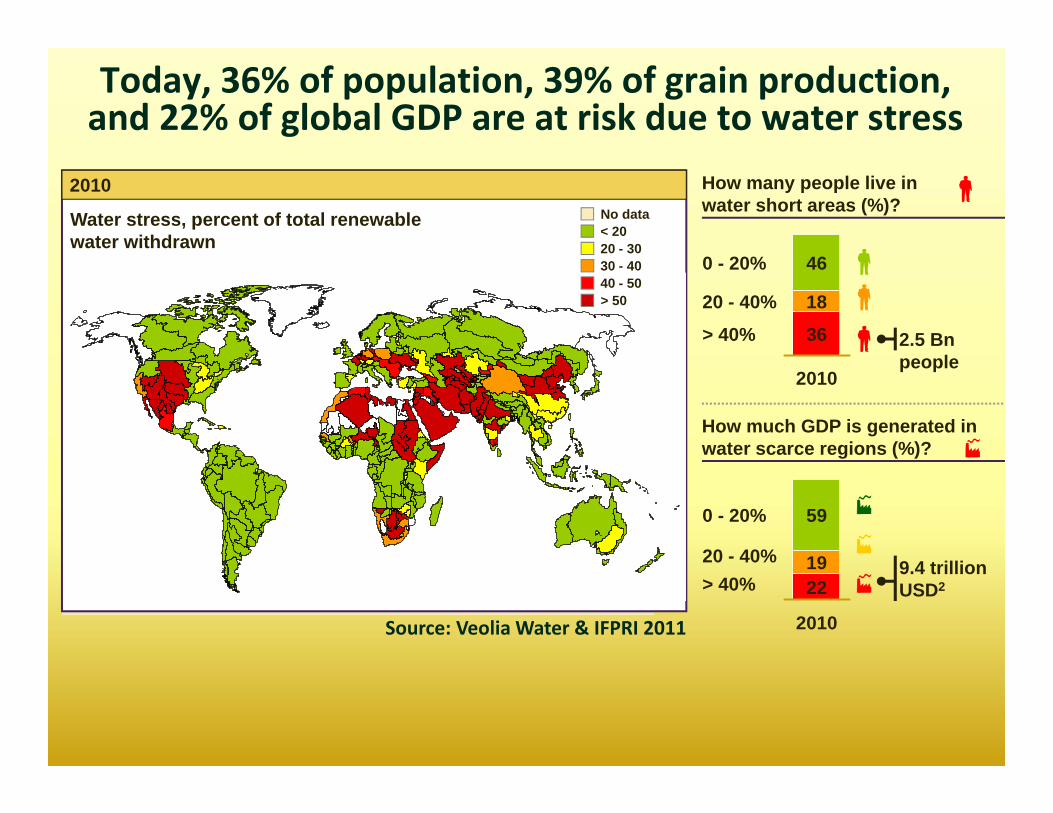
Today, 36% of population, 39% of grain production, and 22% of global GDP are at risk due to water stress
How many people live in water short areas (%)?
How much GDP is generated in water scarce regions (%)?
> 50
< 2020 - 3030 - 4040 - 50
No data
> 40%
20 - 40%
0 - 20%
2010
36
18
46
> 40%
0 - 20%
1922
2010
20 - 40%
59
2010
2.5 Bnpeople
9.4 trillion USD2
Water stress, percent of total renewable water withdrawn
Source: Veolia Water & IFPRI 2011

Under BAU, 52% of the population, 49% of cereal production, and 45% of GDP will be at risk due to water stress by 2050
> 40%
20 - 40%
0 - 20%
2050
52
1632
2010
36
18
46
> 40%20 - 40%
0 - 20%
2050
45
25
30
2010
2219
59
Business as usual, 2050 How many people live in water short areas?
How much GDP is generated in water scarce regions?
▪ 4.7 Bnpeople ▪ Increase
by 90% compared to 2010
▪ 63 trillion USD▪ Increase
by 570% compared to 2010
Water stress, percent of total renewable water withdrawn
> 50
30 - 4040 - 50< 20
20 - 30
No data
Source: Veolia Water & IFPRI 2011

Outline
Drivers of Change Affecting Water and Food
Impacts on Water Resources
Impacts on Food
Technology and Policy Options
Summary

www.ifpri.org
DRIVERS OF CHANGE AFFECTING WATER & FOOD

www.ifpri.org
Water & Food Availability are (Adversely) Affected by a Series of Global Drivers
1. Population growth & urbanization2. Economic growth and changing diets3. Higher energy prices (increased HP demand)4. Growing demand for non‐food crops (biofuels)5. Growing water demand for domestic/ industrial/
environmental uses6. Declining water quality and degradation of resources7. Climate variability and climate change8. Slowing investments in agriculture & water (some change
in Sub‐Saharan Africa)9. Unsustainable use & poor management
www.ifpri.org
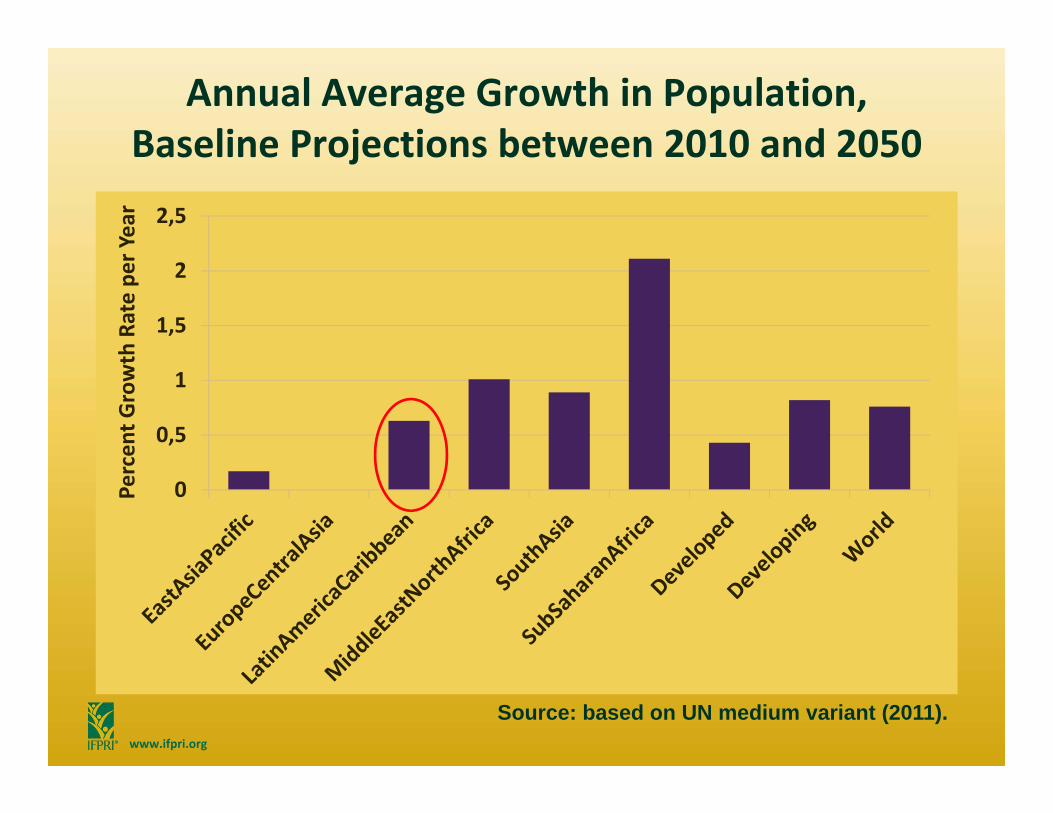
Annual Average Growth in Population, Baseline Projections between 2010 and 2050
0
0,5
1
1,5
2
2,5
Percen
t Growth Rate pe
r Year
Source: based on UN medium variant (2011).

www.ifpri.org
(Nominal) GDP growth most rapid elsewhere, but significant growth in South America as well
(current US$ billion)
Source: PwC forecasts of GDP (PPP), January, 2011.
2015 2050 growth
Venezuela 342 959 3.0 Chile 330 1297 4.0
Peru 273 1567 5.1
Argentina 524 2276 4.3 Canada 1967 5045 2.7
Mexico 1406 7117 4.7 Brazil 2700 10273 3.9
India 2308 22221 6.7
USA 18012 52562 3.1 China 11020 79234 5.8

www.ifpri.org
Per capita water availability, 2010 and projected 2050 (m3/cap)
Source: IFPRI IMPACT Model, September 2011 simulations
0
10000
20000
30000
40000
50000
2010 2050

www.ifpri.org
Share Urban Population, 1990, 2010 andprojected 2050 (%)
Source: UN World Urbanization Prospects, 2011 revision
0102030405060708090100
Caribbean CentralAmerica
SouthAmerica
Canada USA World
1990 2010 2050

www.ifpri.org
Change in dietary patterns, 1990 to 2007(calories/cap/day)
Source: FAOSTAT Food Balance Sheets. Accessed September 2013.
0
500
1000
1500
2000
2500
3000
3500
4000
GUA_1990 GUA_2007 BRA_1990 BRA_2007 USA_1990 USA_2007
Cereals Animal products Starches Veg Oils Sugars Fruits/Veggies Other calories

www.ifpri.org
Irrigation investments are not increasing much (bn 1995 USD)
02468
101214
1961-1965
1966-1970
1971-1975
1976-1980
1981-1985
1986-1990
1991-1995
1996-2000
Year
Inve
stm
ent (
billi
on 1
995
US$
)
SSA EAP excluding China LACMENA SA excluding India IndiaChina Total
Sources: African Development Bank, Asian Development Bank, Inter American Development Bank, World Bank; Rosegrant, Valmonte-Santos and Basani 2005 and Upali Amarasinghe

www.ifpri.org
Nitrogen loadings‐cropland43 million ton/yr
Source: IFPRI 2013

www.ifpri.org
Nitrogen loadings‐pasture9 million ton/yr
Source: IFPRI 2013

www.ifpri.org
Food and oil prices are increasingly linked (biofuels and energy intensity of agriculture)

www.ifpri.org
IMPACTS ON WATER RESOURCES
DECLINING SUPPLY &GROWING DEMAND

www.ifpri.org
Mean Annual Runoff Changes under CSIRO‐A1b Scenario in 2050Relatively drier and lower temp increase
Source: IFPRI IGHM simulation (2013)

www.ifpri.org
Mean Annual Runoff Changes under MIROC‐a1b Scenario in 2050relatively hotter and wetter
Source: IFPRI IGHM simulation (2013)
www.ifpri.org
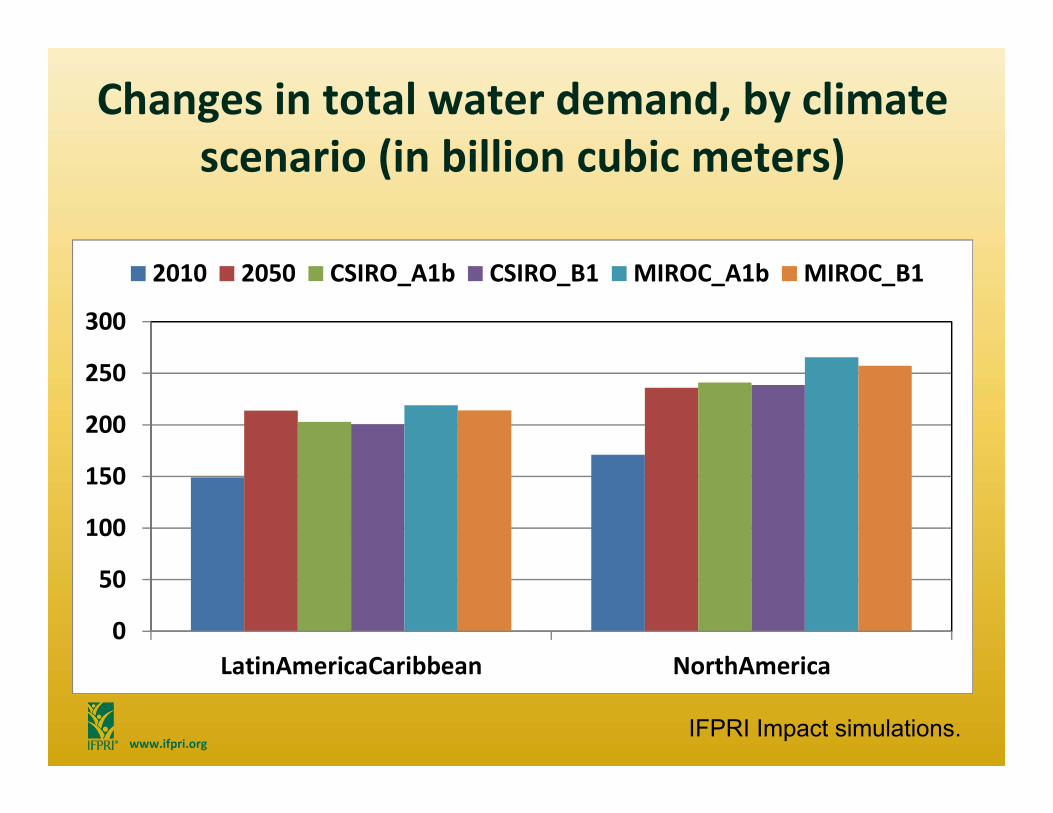
Changes in total water demand, by climate scenario (in billion cubic meters)
0
50
100
150
200
250
300
LatinAmericaCaribbean NorthAmerica
2010 2050 CSIRO_A1b CSIRO_B1 MIROC_A1b MIROC_B1
IFPRI Impact simulations.
www.ifpri.org
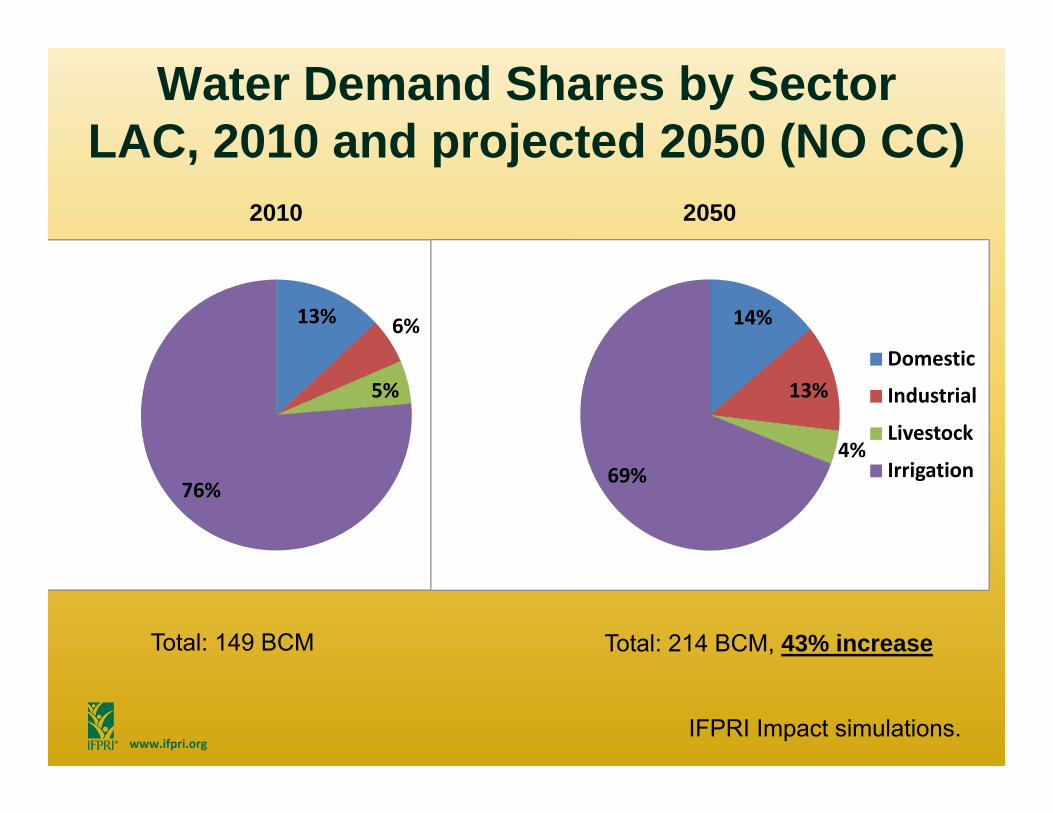
13% 6%
5%
76%
Water Demand Shares by SectorLAC, 2010 and projected 2050 (NO CC)
14%
13%
4%69%
Domestic
Industrial
Livestock
Irrigation
Total: 149 BCM Total: 214 BCM, 43% increase
2010 2050
IFPRI Impact simulations.
www.ifpri.org
0.5
0.6
0.7
0.8
0.9
1
2000 2030 2050
NAE
0.5
0.6
0.7
0.8
0.9
1
2000 2030 2050
ESAP
0.5
0.6
0.7
0.8
0.9
1
2000 2030 2050
LAC
0.5
0.6
0.7
0.8
0.9
1
2000 2030 2050
SSA
0.5
0.6
0.7
0.8
0.9
1
2000 2030 2050
CWANA
0.5
0.6
0.7
0.8
0.9
1
2000 2030 2050
Developing countries
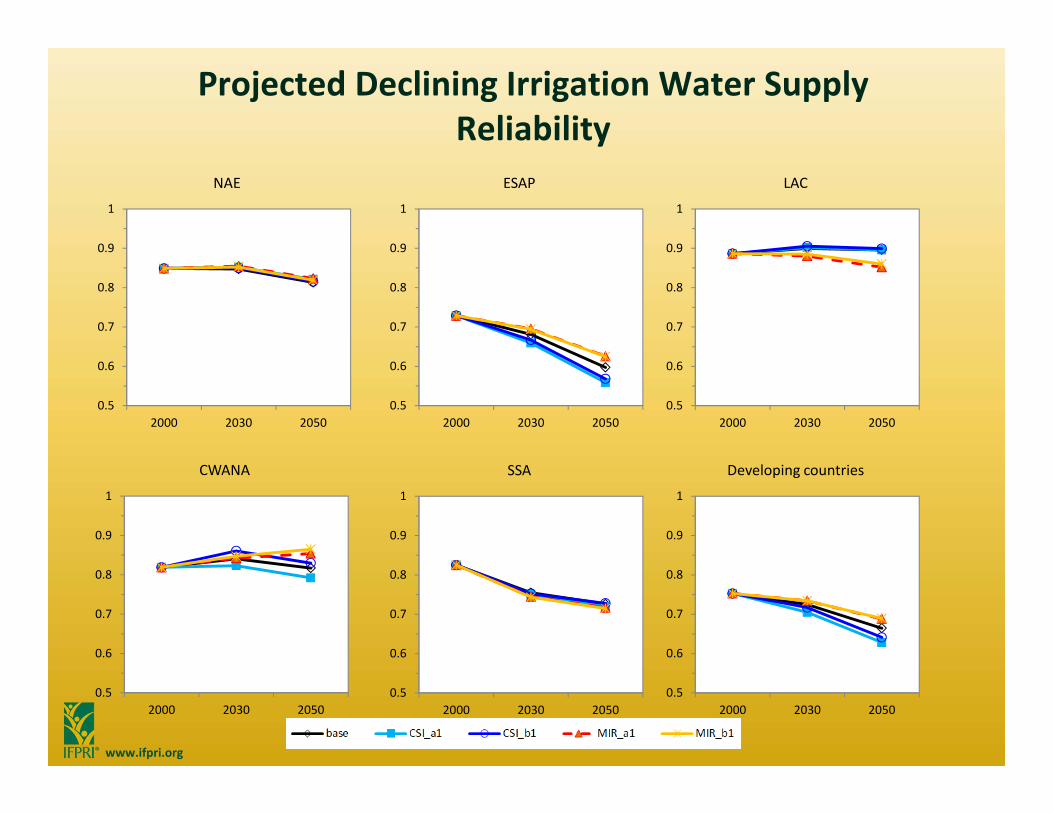
Projected Declining Irrigation Water Supply Reliability

www.ifpri.org
IMPACTS ON FOOD
INCREASING PRICES &GROWING FOOD INSECURITY

www.ifpri.org
Changes in Global Food Prices, 2010 and 2050, various CC scenarios (in US$/mt)
Source: IFPRI IMPACT Model, 2012 simulations
0
100
200
300
400
500
Rice Wheat Maize Soybean
2010 2050 NoCC 2050 CSIROA1b
2050 CSIRO B1 2050 MIROC A1b 2050 MIROCB1

www.ifpri.org
Source of Cereal Production Growth, 2010 ‐ 2050 (%/year)
‐20020406080100120
Percen
t Cha
nge
Area Expansion Yield Improvement
Source: IFPRI IMPACT Model, September 2011 simulations

www.ifpri.org
Net Trade in Cereals‐Projections, 2010 and 2050, various CC scenarios
Source: IFPRI IMPACT Model, 2012 simulations
‐20
‐10
0
10
20
30
40
50
60
ARG BRA MEX UNS
2010 2050NOCC 2050CSIRO_A1b
2050CSIRO_B1 2050MIROC_A1b 2050MIROC_B1

www.ifpri.org
Net Trade Soybean‐Projections, 2010 and 2050, various CC scenarios
Source: IFPRI IMPACT Model, 2012 simulations
‐
10
20
30
40
50
60
ARG BRA UNS
2010 2050NOCC 2050CSIRO_A1b
2050CSIRO_B1 2050MIROC_A1b 2050MIROC_B1

www.ifpri.org
TECHNOLOGY AND POLICY OPTIONS
ARE HIGHLY LOCALIZED
www.ifpri.org
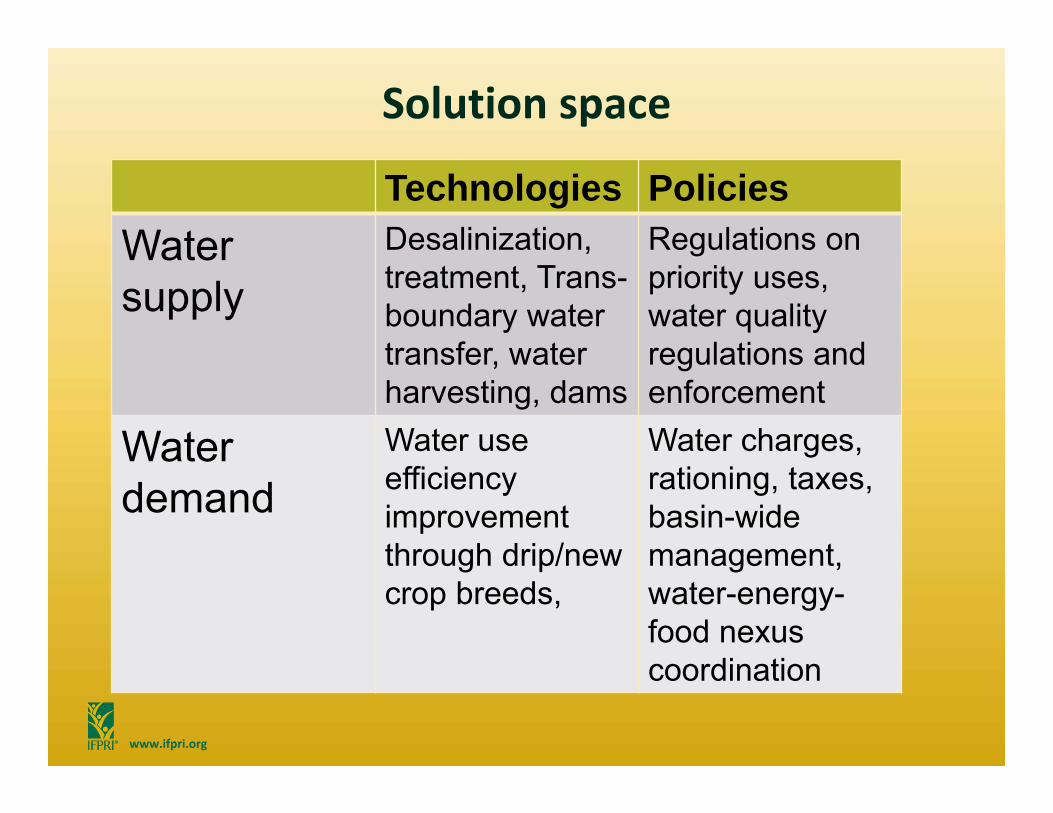
Technologies PoliciesWater supply
Desalinization, treatment, Trans-boundary water transfer, water harvesting, dams
Regulations on priority uses,water quality regulations and enforcement
Water demand
Water use efficiency improvement through drip/new crop breeds,
Water charges, rationing, taxes, basin-wide management, water-energy-food nexus coordination
Solution space

www.ifpri.org Source: Background paper for the Bonn 2011 Nexus Conference: The Water, Energy and Food Security Nexus
People &Nature
Policies along the Water‐Energy‐Food Nexus

Improving Crop Productivity and Water Use Efficiency
Breeding can influence biomass/unit of water through transpiration rates and efficiency of biomass per unit of transpiration• Use of biotechnology and marker‐assisted selection is a
necessity for significant progress in the longer term• Many interlinked processes and factors underlie plant water
needs; additional progress depends on combination of disciplines
• Incorporating physiological and agronomic expertise into the design of transgenic experiments is crucial in realizing improvements in water productivity

www.ifpri.org
IMPROVED IRRIGATION TECHNOLOGIES Irrigation was triggered whenever
crop needed water (automatic). Improved irrigation technologies
effectively saved water.
Change in irrigation water use by region
Source: IFPRI crop model results 2012

Management Practices for More Efficient Water Use
Enhanced water infiltration: mulching; deep tillage; contour farming; special terraces (e.g., flat‐channel)
Decrease soil water evaporation: conservation tillage (e.g., no‐till or minimum till)
Deficit irrigation: apply predetermined percentage of calculated potential plant water
• Mild soil drying results in restricted shoot and leaf growth, reducing competition within the plant for reproductive development, increasing the harvest index and crop yield
Advanced irrigation technology (drip, micro‐sprinkler, real‐time management)

Water Rights and Markets: Advantages• Empowerment of water user by requiring consent and compensation for water transfers
• Markets in tradable water rights induce users to consider the full opportunity cost of water, providing incentives to conserve and gain additional income through the sale of saved water
• Incentives for water users to internalize the external costs imposed by their water use, reducing the pressure to degrade resources
• Particularly useful with climate variability/climate change
Water Rights, Water Pricing and Water Markets

Global Water Savings (>5.0 Gm3/yr) Associated with International Trade of Agricultural
Products, period 1997‐2001
Source: A.K. Chapagain, Hoekstra A.Y. and H.H.G. Savenije, UNESCO-IHE Institute for Water Education.

www.ifpri.org
Invest more in agricultural R&D ‐ targeted increasingly to water productivity, not just land productivity
Modernize crop water productivity breeding programs in the Americas through provision of genomics, high throughput gene‐sequencing, bio‐informatics and computer tools
Reduce subsidies that distort production decisions and encourage water use beyond economically appropriate levels• Fertilizer, energy, water subsidies• Savings invested in activities that boost farm output and
income
Key Policies
www.ifpri.org
Rise in real prices of natural resources increases importance of market‐based approaches for managing environmental services and demands solutions that support water, energy and food security
Increased investment in household water supply & sanitation, but also irrigation, emphasizing technology (drip, micro‐sprinkler, real‐time management), and selected surface and groundwater storage systems
Given the scarcity of public resources, these investments need to increasingly involve Public‐Private Partnerships (PPP).
Focus on addressing growing water quality challenges
Key Policies

www.ifpri.org
NA significantly water‐scarcer than LAC, but both regions do well compared to Asia and SSA
The important food trade role of LAC and NA will put growing pressure on water resources in the region
This pressures will be compounded by climate change, either nationally or through increased demand for regional products
This needs increased focus on “water‐smart” breeding, machinery, other inputs and storage investments across the water‐energy‐food nexus, with attention to both water quantity and quality
Summary


![WELCOME! [legacy.iica.int]legacy.iica.int/Eng/regiones/caribe/trinidadytobago/Lists/Events... · This is the topic to be covered by the Feature Presentation or First “Ponencia Magistral”/“Palestra](https://img.pdfslide.us/doc/110x75/5ab1fa957f8b9a6b468d298c/welcome-is-the-topic-to-be-covered-by-the-feature-presentation-or-first-ponencia.jpg)