Embed Size (px)
Citation preview
The observation and simulation of ionospheric response to CIR-induced geomagnetic activity on
April 4, 2005
Yanhong Chen1, Wenbin Wang2, Siqing Liu1, Jiancun Gong1, Na Qiu1
1National Space Science Center, Chinese Academy of Sciences, China 2High Altitude Observatory, National Center for Atmospheric Research
Corotating Interaction Regions (CIRs)
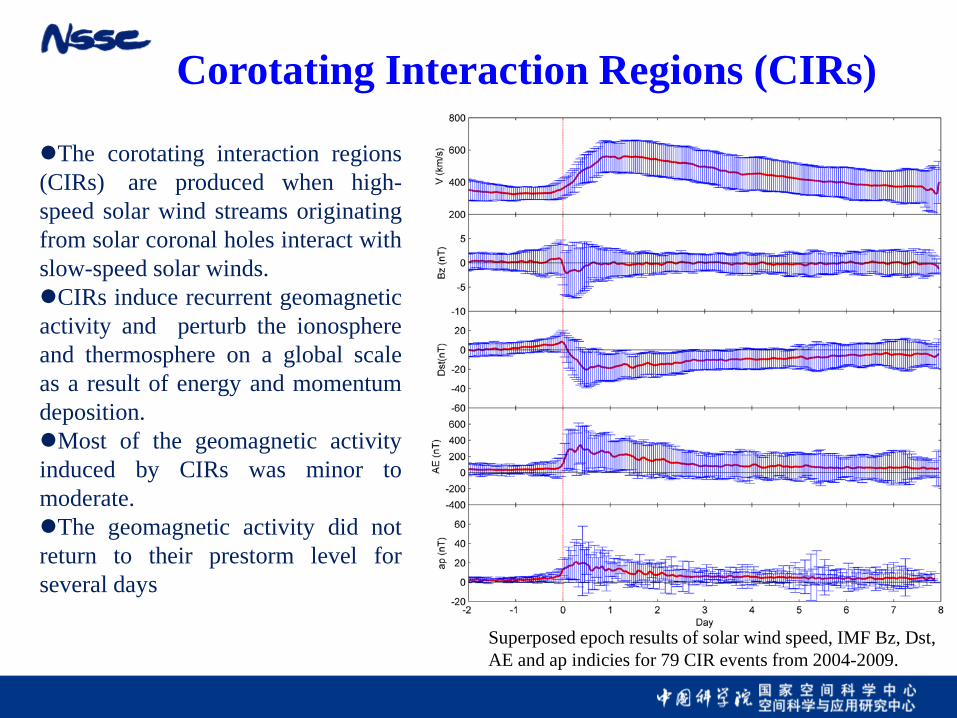
The corotating interaction regions (CIRs) are produced when high-speed solar wind streams originating from solar coronal holes interact with slow-speed solar winds. CIRs induce recurrent geomagnetic activity and perturb the ionosphere and thermosphere on a global scale as a result of energy and momentum deposition. Most of the geomagnetic activity induced by CIRs was minor to moderate. The geomagnetic activity did not return to their prestorm level for several days
Superposed epoch results of solar wind speed, IMF Bz, Dst, AE and ap indicies for 79 CIR events from 2004-2009.
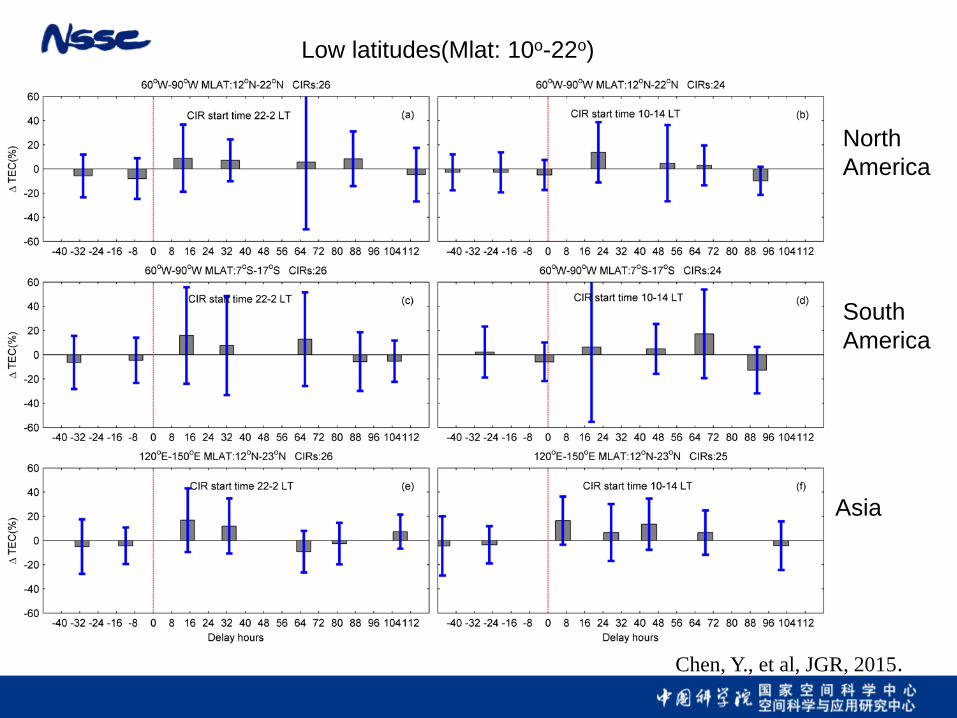
Low latitudes(Mlat: 10o-22o)
Chen, Y., et al, JGR, 2015.
North America
Asia
South America
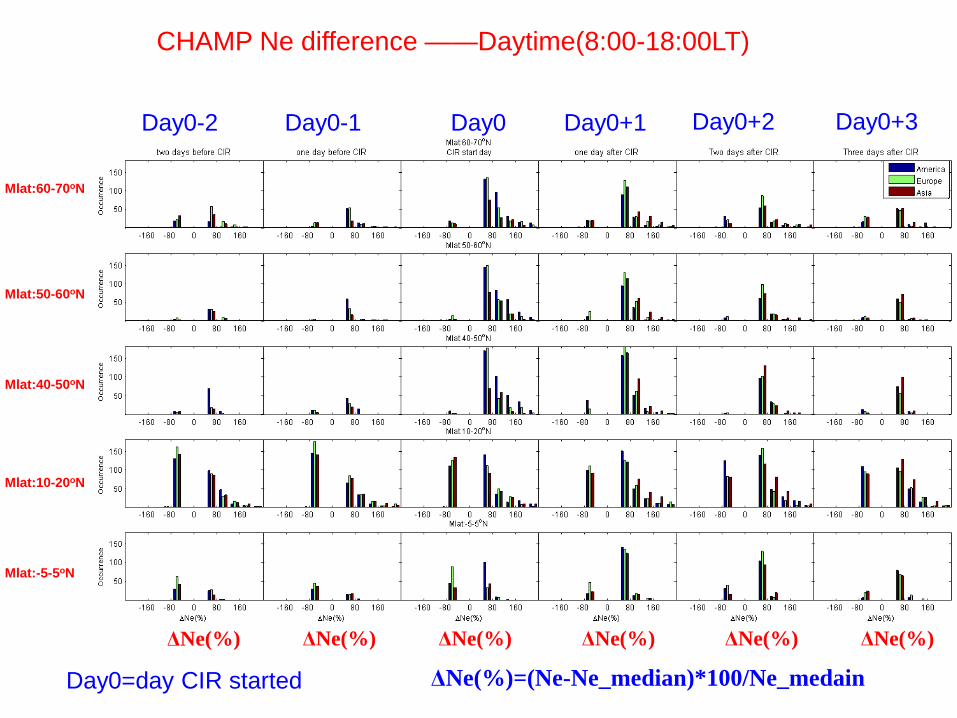
CHAMP Ne difference ——Daytime(8:00-18:00LT)
Day0-2 Day0-1 Day0 Day0+1 Day0+2 Day0+3
Day0=day CIR started
Mlat:60-70oN
Mlat:50-60oN
Mlat:40-50oN
Mlat:10-20oN
Mlat:-5-5oN
ΔNe(%)=(Ne-Ne_median)*100/Ne_medain ΔNe(%) ΔNe(%) ΔNe(%) ΔNe(%) ΔNe(%) ΔNe(%)
Motivation • What is the ionospheric temporal and spatial changes over
the course of a CIR event? • Can ionospheric physical model reproduce the variations
during a CIR event? • Ionospheric structure are controlled by several externally
mechanism, such as penetration of electron field, neutral wind and composition. It is difficult to distinguish the effects of one forcing from another.
• The comparison of the model and observation can help to interpret the ionopsheric change during a CIR event.
Data
Global ground GPS TEC, obtained from the Madrigal database at the MIT Haystack Observatory
JPL TEC map Electron density, from the Challenging Minisatellite
Payload (CHAMP) Planar Langmuir Probe (PLP) observations
Model TIEGCM: Solves momentum, energy, and mass
continuity for neutrals and ions, as well as neutral wind dynamo.
Input Fields: Solar flux, auroral precipitation, high latitude convection electric field
Output Fields: Electron density,Neutrals,Electric Field
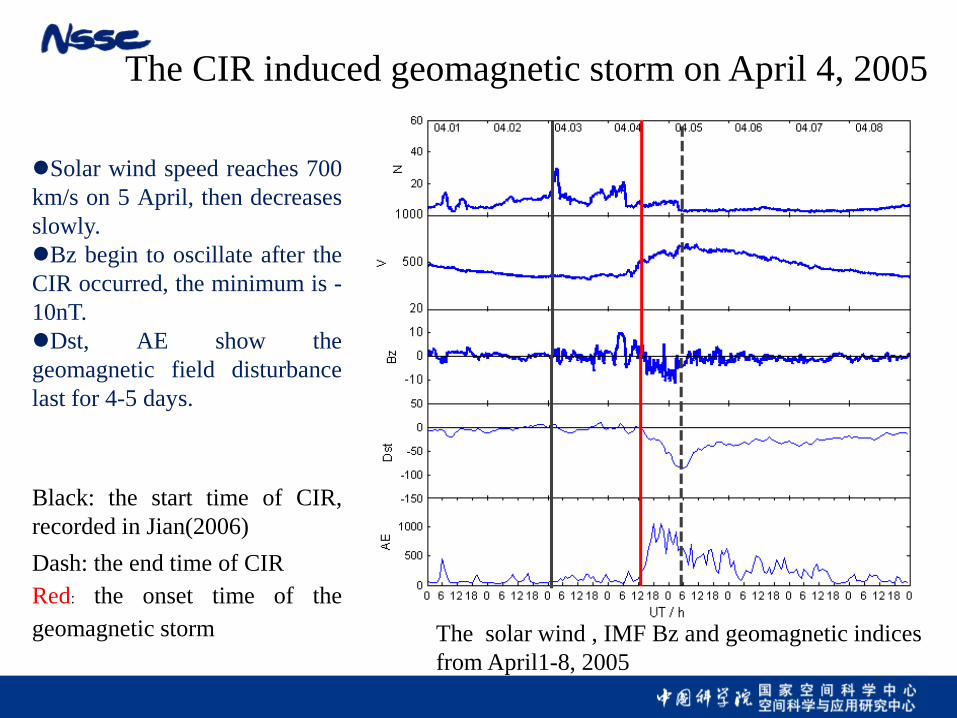
The solar wind , IMF Bz and geomagnetic indices from April1-8, 2005
Solar wind speed reaches 700 km/s on 5 April, then decreases slowly. Bz begin to oscillate after the CIR occurred, the minimum is -10nT. Dst, AE show the geomagnetic field disturbance last for 4-5 days.
Black: the start time of CIR, recorded in Jian(2006) Dash: the end time of CIR Red: the onset time of the geomagnetic storm
The CIR induced geomagnetic storm on April 4, 2005
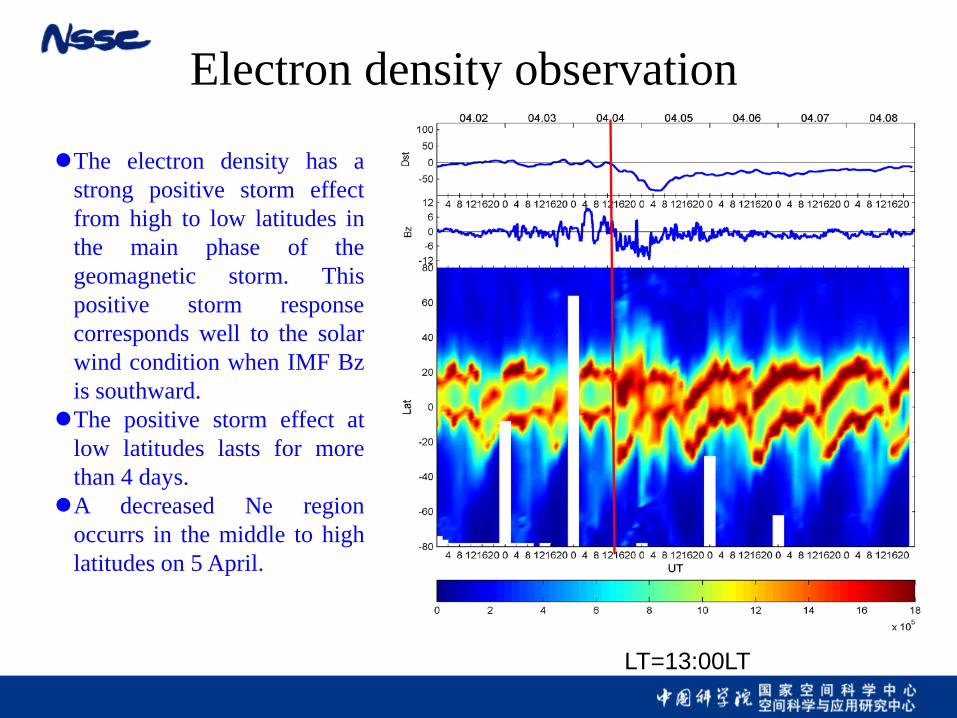
Electron density observation The electron density has a
strong positive storm effect from high to low latitudes in the main phase of the geomagnetic storm. This positive storm response corresponds well to the solar wind condition when IMF Bz is southward. The positive storm effect at
low latitudes lasts for more than 4 days. A decreased Ne region
occurrs in the middle to high latitudes on 5 April.
LT=13:00LT
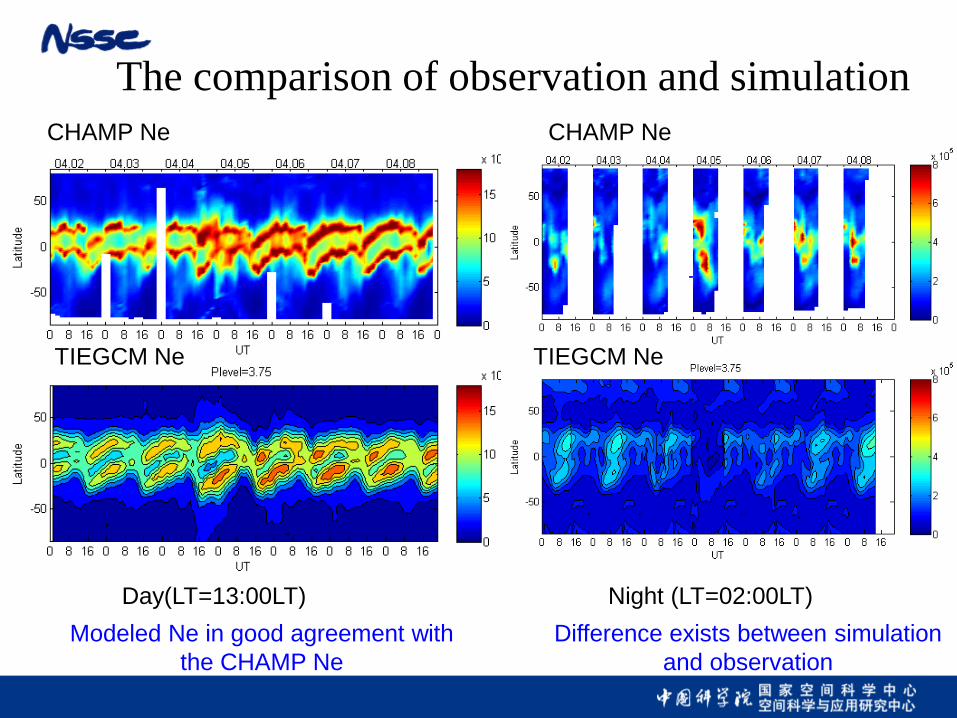
Day(LT=13:00LT) Night (LT=02:00LT)
CHAMP Ne CHAMP Ne
TIEGCM Ne TIEGCM Ne
The comparison of observation and simulation
Modeled Ne in good agreement with the CHAMP Ne
Difference exists between simulation and observation
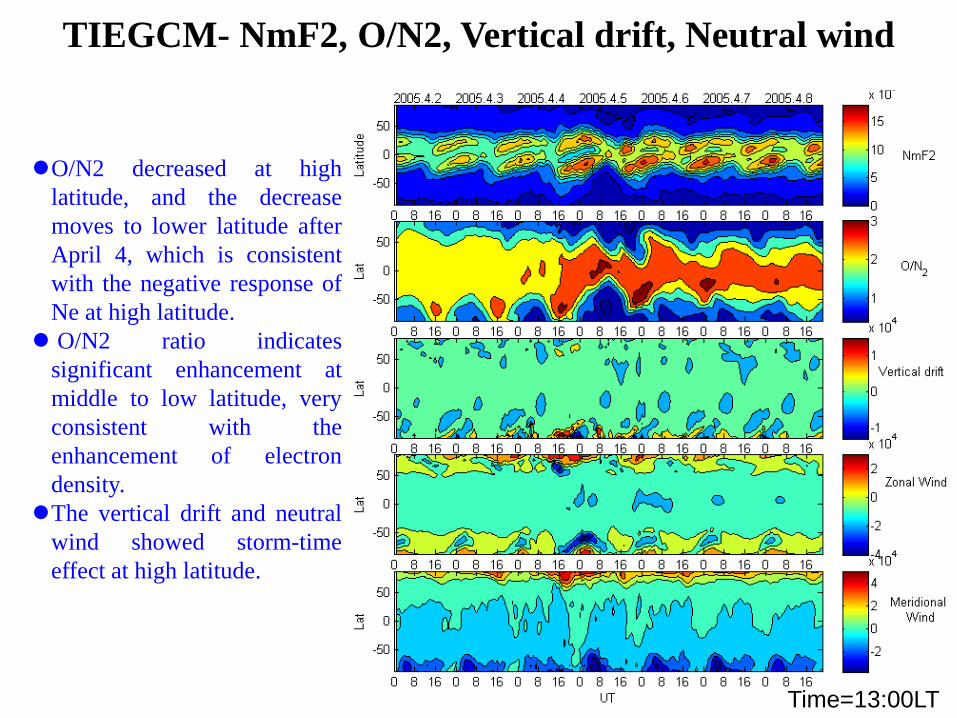
TIEGCM- NmF2, O/N2, Vertical drift, Neutral wind
O/N2 decreased at high
latitude, and the decrease moves to lower latitude after April 4, which is consistent with the negative response of Ne at high latitude. O/N2 ratio indicates
significant enhancement at middle to low latitude, very consistent with the enhancement of electron density. The vertical drift and neutral
wind showed storm-time effect at high latitude.
Time=13:00LT
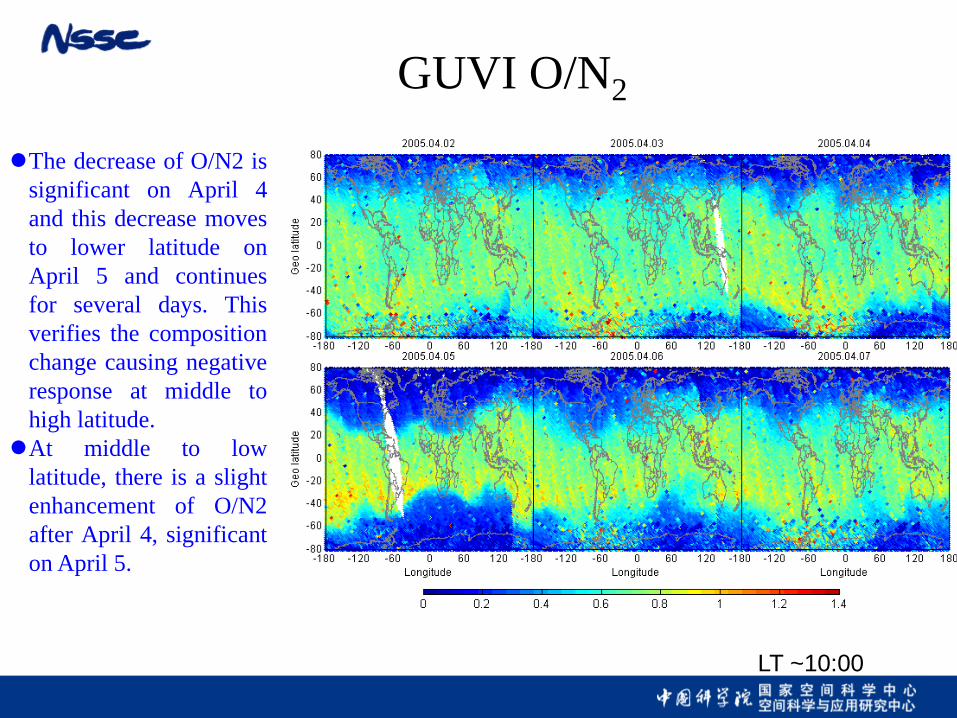
GUVI O/N2 The decrease of O/N2 is
significant on April 4 and this decrease moves to lower latitude on April 5 and continues for several days. This verifies the composition change causing negative response at middle to high latitude. At middle to low
latitude, there is a slight enhancement of O/N2 after April 4, significant on April 5.
LT ~10:00
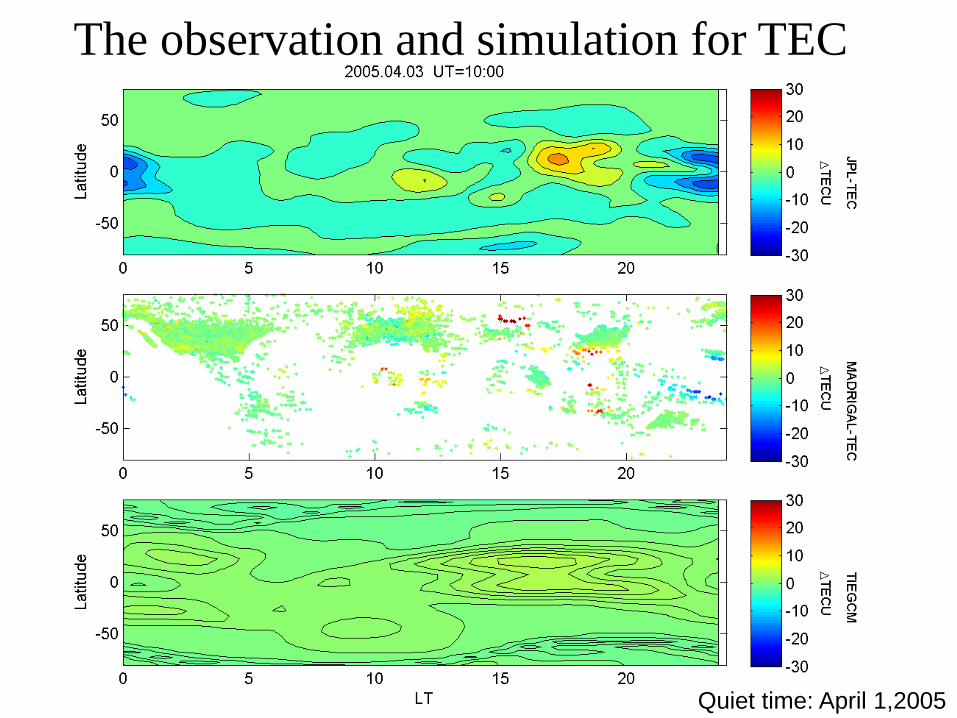
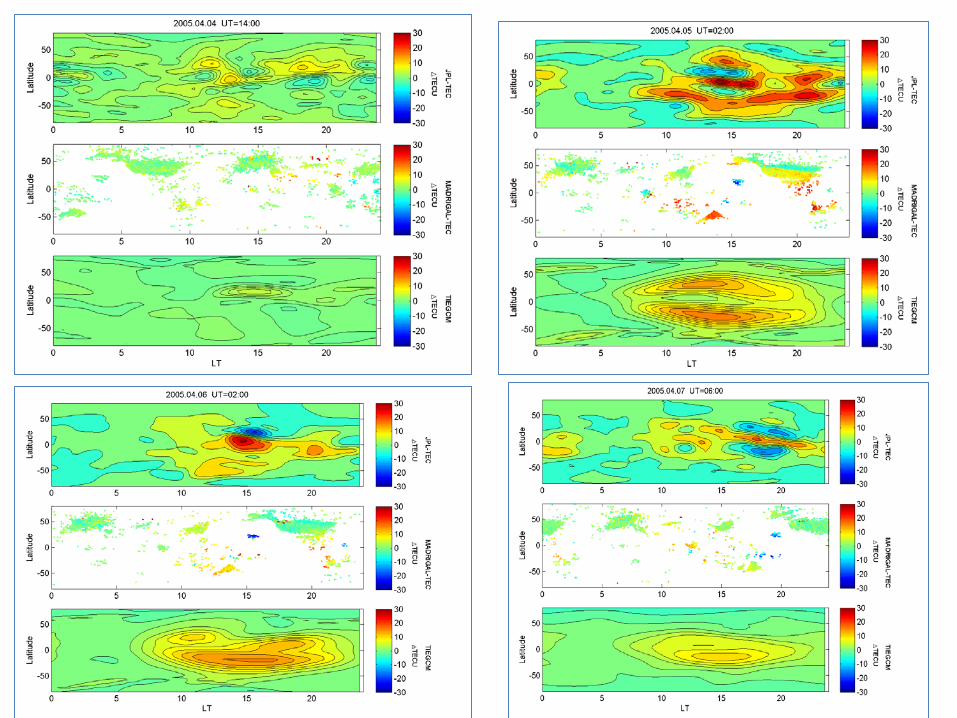
The observation and simulation for TEC
Quiet time: April 1,2005
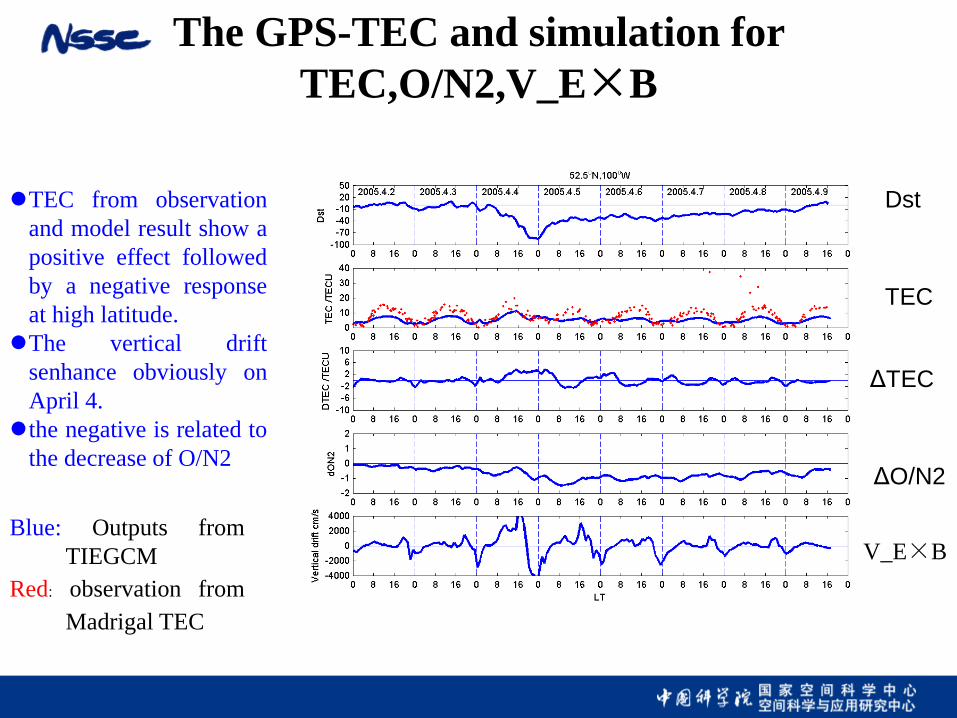
The GPS-TEC and simulation for TEC,O/N2,V_E×B
Dst
TEC
ΔTEC
ΔO/N2
V_E×B
TEC from observation and model result show a positive effect followed by a negative response at high latitude. The vertical drift
senhance obviously on April 4. the negative is related to
the decrease of O/N2
Blue: Outputs from
TIEGCM Red: observation from
Madrigal TEC
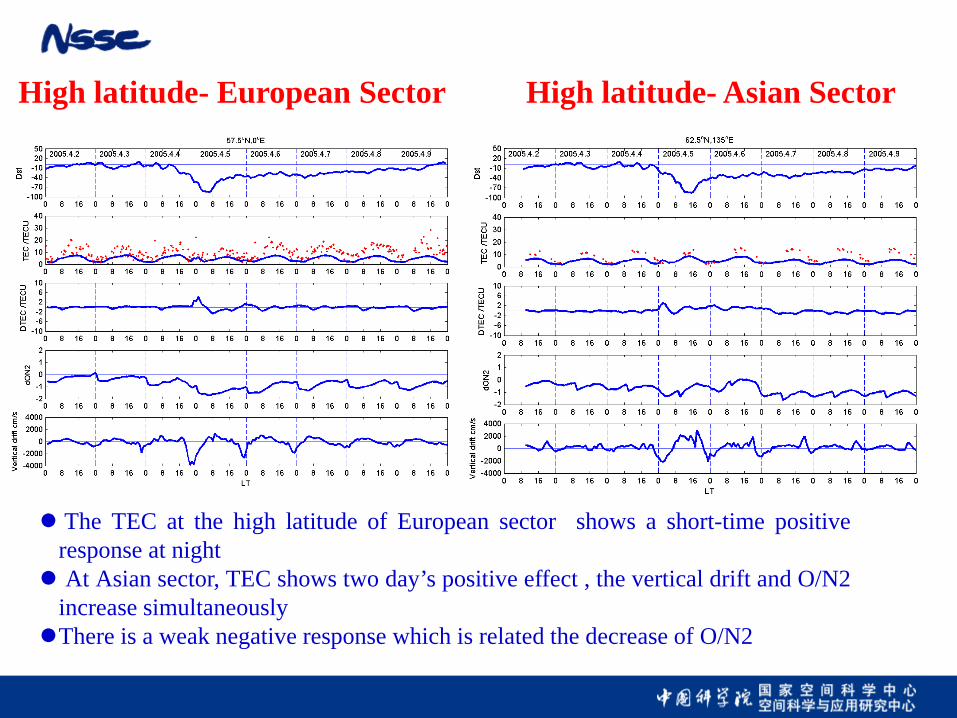
High latitude- European Sector High latitude- Asian Sector
The TEC at the high latitude of European sector shows a short-time positive response at night At Asian sector, TEC shows two day’s positive effect , the vertical drift and O/N2
increase simultaneously There is a weak negative response which is related the decrease of O/N2
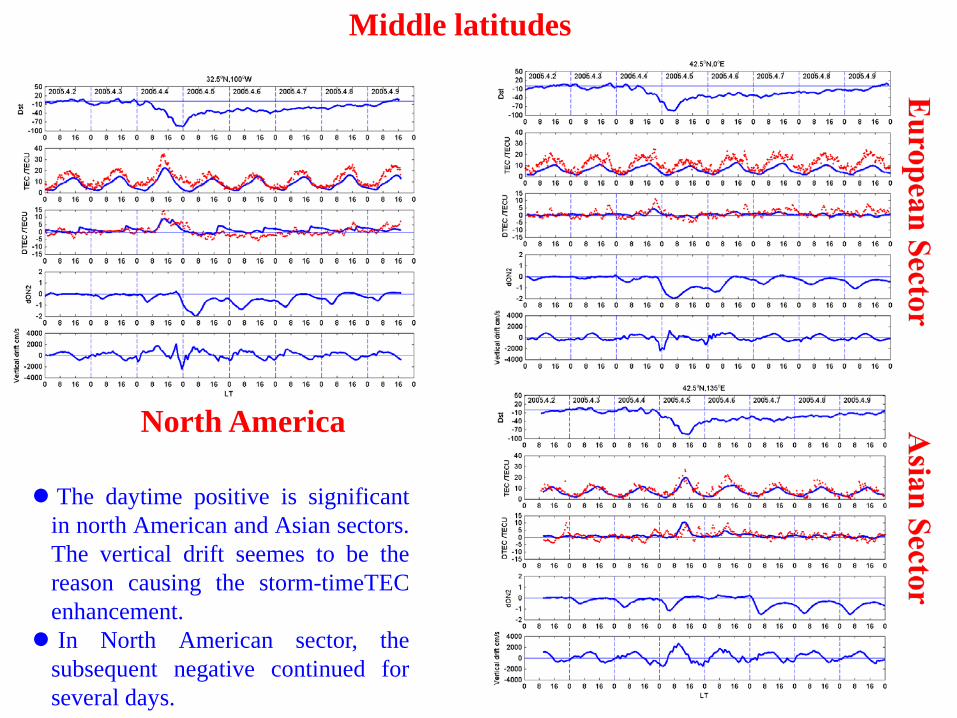
Middle latitudes
The daytime positive is significant in north American and Asian sectors. The vertical drift seemes to be the reason causing the storm-timeTEC enhancement. In North American sector, the
subsequent negative continued for several days.
North America
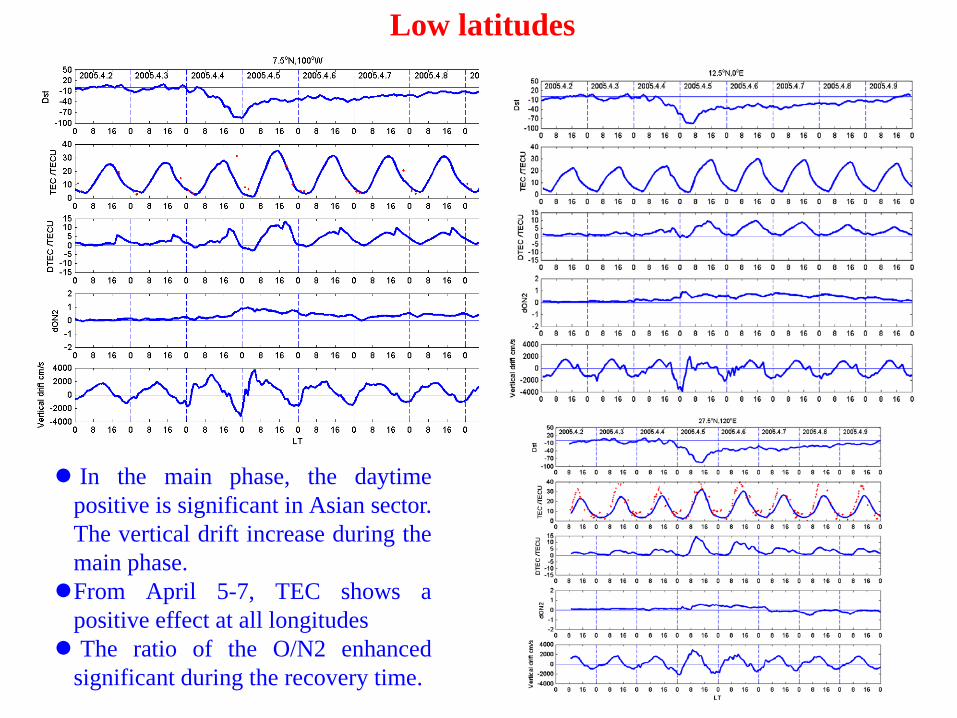
Low latitudes
In the main phase, the daytime positive is significant in Asian sector. The vertical drift increase during the main phase. From April 5-7, TEC shows a
positive effect at all longitudes The ratio of the O/N2 enhanced
significant during the recovery time.
• The ionosphere has a positive response from high to low latitude during the CIR event occurred on April 4, 2005. At high latitude, after the positive response, there is a negative effect lasted for about 2 days. At low latitude, the positive effect can last for 2-4 days.
• The TIEGCM can well reproduce the storm-time positive and negative effect in daytime, while it underestimates the magnitude of TEC enhancement.
• The model and observation verify O/N2 decrease causing the negative response at middle and high latitude. The model output indicates the electric field is one of the reason for the positive response at middle to high latitude.
• At low latitude region, the electric field and composition (O/N2) changes jointly responsible for the positive response during 1-2 days after the geomagnetic storm started. The long-duration (>2 day) positive effect during the recovery time at low latitude is related to the O/N2 enhancement.
Summary
ACKNOWLEDGEMENTS
• The GPS TEC data used were obtained from the Web site http://madrigal.haystack.mit.edu.
• GIM data were provided by JPL • The CHAMP data were provided by GFZ-Potsdam. • The GUVI O/N2 data were from the Website:
http://guvi.jhuapl.edu/sit/gallery
Thanks for your attention!


![Status and Plan of Ionospheric Observation and Research in …aoswa.nict.go.jp/wsreport2012/pdf/[I-04]presentation.pdf · · 2016-09-01prediction is difficult by using existing](https://img.pdfslide.us/doc/110x75/5b06adf37f8b9a79538cc99c/status-and-plan-of-ionospheric-observation-and-research-in-aoswanictgojpwsreport2012pdfi-04.jpg)