Embed Size (px)
Citation preview
POWER SHIFT:
THE DEPLOYMENT OF A 21ST CENTURY ELECTRICITY SECTOR
AND THE NUCLEAR WAR TO STOP IT
MARK COOPER
SENIOR FELLOW FOR ECONOMIC ANALYSIS
INSTITUTE FOR ENERGY AND THE ENVIRONMENT
VERMONT LAW SCHOOL
JUNE 2015
ii
TABLE OF CONTENTS
EXECUTIVE SUMMARY vi
I. INTRODUCTION 1
A. PURPOSE
B. OUTLINE
C. FINDINGS
1. Part I: Resource Economics
2. Part II: Building the 21st Century Electricity System
3. Part III: The Nuclear War against the Future
4. Recommendations
PART I. RESOURCE ECONOMICS
II. COMPREHENSIVE EVALUATION OF LOW-CARBON RESOURCES 7
A. THE FLASHPOINT OF TRANSFORMATION: OPERATING COSTS AND
MERIT ORDER DISPATCH
B. FULL (LEVELIZED) COST
C. KEY COST TRENDS
D. EFFICIENCY AS A RESOURCE
1. Market Imperfections and Barriers as the Cause of
the Efficiency Gap
2. The Cost of Saved Energy
3. Cost Trends with Standards
4. Conclusion
III. ECONOMIC RISK 23
A. NEW BUILDS: INVESTMENT RISK
B. MULTI-CRITERIA ANALYSIS OF COST AND RISK
C. OPERATING RISK OF AGING REACTORS
D. ENVIRONMENTAL AND PUBLIC HEALTH IMPACTS
PART II. BUILDING THE 21ST CENTURY ELECTRICITY SYSTEM
IV. ENERGY RESOURCE POTENTIAL 38
A. RENEWABLES
1. Long Term Potential
2. Mid-Term Potential
B. ENERGY SAVINGS
C. “NEW” RESOURCES: DEMAND RESPONSE, STORAGE AND
INTELLIGENT INTEGRATION
D. THE IMMENSE RESOURCE BASE FOR A 21ST CENTURY ELECTRICITY
SYSTEM
V. INSTITUTIONAL RESOURCE NEEDS 52
A. MEETING THE NEED FOR ELECTRICITY WITH 21ST CENTURY
iii
RELIABILITY
B. THE DETAILED ANALYSIS OF CALIFORNIA
1. LBL STUDIES
2. CALIFORNIA UTILITY STUDIES
3. OTHER STUDIES
C. INCUMBENT OPPOSITION TO TRANSFORMATION:
NERC’S RESPONSE TO THE CLEAN POWER PLAN
D. CONCLUSION
1. A Global Perspective
A. Local Perspective
PART III. THE NUCLEAR WAR AGAINST THE FUTURE
VI. THE ATTACK ON RENWEABLES & THE PRIMARY DIVERSIONARY 70
TACTIC, RELIABILITY
A. CREATIVE CONSTRUCTION AND DESTRUCTION
B. THE NUCLEAR ATTACK ON RENEWABLES
C. THE FALSE RELIABILITY CRISIS: EXELON’S NUCLEAR BLACKMAIL:
1. Responses to the Threat to Precipitate a Crisis
2. Economic Cost
D. BASELOAD BIAS, UTILITY SCALE FETISH AND SHORT-RUN MYOPIA
IN NUCLEAR LICENSE RENEWAL: PGE’S DIABLO CANYON
1. The NRC Guidelines
2. The PG&E Diablo Canyon Application
VII. DIVERSIONARY TACTICS IN THE NUCLEAR WAR AGAINST 86
THE FUTURE
A. SUBSIDIES AND BAILOUTS: PAST, PRESENT AND FUTURE
1. Forward-Looking Subsidies: Inertia, Subsidies and System
Transformation
2. Backward-Looking Subsidies: Keeping Aging Reactors Online
B. NON-ENERGY ECONOMIC IMPACTS
1. Employment and the Local Economy
2. Carbon Reduction
C. CONCLUSION: GROUND ZERO IN THE WAR AGAINST THE FUTURE
ENDNOTES 103
BIBLIOGRAPHY 111
LIST OF FIGURES
FIGURE II-1: THE MERIT ORDER EFFECT OF ADDING NEW WIND CAPACITY 8
ON PEAK PRICES
FIGURE II-2: AVERAGE O&M COASTS ($/MWH) 9
FIGURE II-3: LEVELIZED COST (LCOE) OF LOW CARBON OPTIONS WITH TRENDS 10
FIGURE II-4: OVERNIGHT COST TRENDS: NUCLEAR, WIND, AND SOLAR 12
iv
FIGURE II-5: CROSS-NATIONAL COMPARISON OF RENEWABLE COST TRENDS 14
FIGURE II-6: WIND AND SOLAR PURCHASE POWER AGREEMENT PRICES ACROSS TIME 15
FIGURE II-7: THE COST OF SAVED ELECTRICITY 17
FIGURE II-8: UTILITY COST OF SAVED ENERGY (2006$/MWH) VS. INCREMENTAL 18
ANNUAL SAVINGS AS A PERCENT OF SALES
FIGURE II-9: THE PROJECTED COSTS OF REGULATION EXCEED THE ACTUAL 20
ACTUAL COSTS: RATIO OF ESTIMATED COST TO ACTUAL COST BY SOURCE
FIGURE III-1: ELECTRICITY SYSTEM PERFORMANCE, CHARACTERISTICS, 23
AND STRATEGIES
FIGURE III-2: COST, CAPACITY, AND CONSTRUCTION PERIODS OF LOW 25
CARBON RESOURCES
FIGURE III-3: A MULTIVARIATE MODEL OF CONSTRUCTION DELAYS AND 27
COST OVERRUNS FOR NUCLEAR AND NON-HYDRO RENEWABLES
FIGURE III-4: U.S. RISK/COST REWARD 27
FIGURE III-5: RISK/COST ARRAY BASED ON LAZARD 28
FIGURE III-6: U.S. NUCLEAR REACTORS: FINANCIAL AND ONLINE STATUS 30
(AS OF 2012)
FIGURE III-7: RECENT SUSTAINABILITY RANKINGS 35
FIGURE III-8: OLDER RANKINGS OF THE ENVIRONMENTAL COST OF 36
ELECTRICITY RESOURCES5
FIGURE IV-1: THE SIZE OF THE EFFICIENCY GAP ACROSS ENERGY MARKETS: 43
TECHNICALLY FEASIBLE, ECONOMICALLY PRACTICABLE POTENTIAL
ENERGY SAVINGS
FIGURE IV-2: TECHNICAL AND ECONOMIC POTENTIAL OF EFFICIENCY GAINS 45
FIGURE IV-3: RATIO OF U.S. RENEWABLE ENERGY TECHNICAL POTENTIALS TO 49
2010 ELECTRICITY SALES
FIGURE IV-4: PROJECTIONS OF RENEWABLE GENERATION CAPACITY AND ENERGY 50
FIGURE V-1: THE TRANSFORMATION OF THE ELECTRICITY SYSTEM 52
FIGURE V-2: SOLAR’S EFFECT ON ON-GRID POWER DEMAND: THE CAISO PEAKING 53
DUCK TRIGGERS A GROWING NEED FOR FLEXIBILITY STARTING IN 2015
FIGURE V-3: THE BENEFITS OF ACTIVELY MANAGING RENEWABLE SUPPLY 55
AND DEMAND
FIGURE V-4: VALUE OF WIND AND PV AT VARIOUS LEVELS OF PENETRATION AND 57
UNDER DIFFERENT ASSUMPTION ABOUT POLICY: CALIFORNIA CASE STUDY
FIGURE V-5: THE IMPACT OF DOWNWARD FLEXIBILITY 59
FIGURE V-6: GLOBAL WIND AND SOLAR RESOURCES 65
FIGURE V-7: COST AND RESOURCE MIX FOR A 100% RENEWABLE SCENARIO 67
FIGURE VI-1: NET GRID PURCHASES WITH AND WITHOUT NET METERING: 72
RESIDENTIAL
FIGURE VI-2: THE EFFECT OF LOW-COST, LOW-CARBON RESOURCES ON PRICES 78
FIGURE VI-3: ALTERNATIVE POTENTIAL IS FOUR TIMES DIABLO CANYON CAPACITY 82
FIGURE VI-4: DECLINING DEMAND REDUCES THE NEED FOR DIABLO CANYON 83
CAPACITY
FIGURE VI-5: CALIFORNIA GENERATION 84
FIGURE VI-6: BATTERY STORAGE IS EXPANDING RAPIDLY, OTHER STORAGE 85
v
TECHNOLOGIES ARE STATIC
FIGURE VI-7: NATIONAL PROJECTIONS OF LOW CARBON RESOURCE POTENTIAL 85
FIGURE VII-1: FEDERAL SUBSIDIES FOR INFANT ENERGY INDUSTRIES AND BEYOND 87
FIGURE VII-2: RATIO OF TOTAL SUBSIDIES: NUCLEAR COMPARED TO OTHERS 88
FIGURE VII-3: INNOVATION AND PUBLIC SUPPORT FOR R&D 89
FIGURE VII-4: MARKET FUNDAMENTALS PRESSURING MARKET CLEARING PRICES 91
FIGURE VII-5: MISREPRESENTATION OF THE LOCATION OF AGING REACTORS 92
IN THE MERIT ORDER
FIGURE VII-6: THE ECONOMIC COST AND UNECONOMIC CONSEQUENCES OF 94
BAILING OUT AGING NUCLEAR REACTORS IN THE TYPICAL LOADING STACK
FIGURE VII-7: JOBS IMPACT OF EARLY RETIREMENT AND REPLACEMENT, 95
INCLUDING DECOMMISSIONING
FIGURE VII-8: JOB CREATION BY ALTERNATIVE APPROACHES TO MEETING 96
ELECTRICITY NEEDS
FIGURE VII-9: CREDIT SUISSE PROJECTION OF RENEWABLE GROWTH COMPARED TO 98
EPA OPTION 1, ILLINOIS REPLACEMENT
FIGURE VII-10: EFFICIENCY POTENTIAL FROM MAJOR NATIONAL STUDIES 99
COMPARED TO EPA OPTION 1
FIGURE VII-11: THE UNTAPPED CARBON REDUCTION POTENTIAL FROM EFFICIENCY 99
AND RENEWABLES COMPARED TO “AT-RISK” NUCLEAR CAPACITY
LIST OF TABLES
TABLE II-1: POTENTIAL SOURCES OF LOWER COST/MORE EFFECTIVE EFFICIENCY 22
IN THE 21ST CENTURY ELECTRICITY SECTOR
TABLE III-1: NUCLEAR COMPARED TO NON-HYDRO RENEWABLES: 26
CONSTRUCTION PERIOD STATISTICS
TABLE III-2: SIGNIFICANT EARLY RETIREMENTS AND REACTORS WITH OUTAGES 31
EXCEEDING 5 YEARS
TABLE III-3: RECENT EARLY RETIREMENTS AND CHARACTERISTICS OF 33
“AT-RISK” REACTORS
TABLE III-4: TWO VIEWS OF BENEFITS OF EFFICIENCY AS EXTERNALITIES 34
TABLE IV-1: TRENDS AND STATE OF PLAY IN THE SYSTEM TRANSFORMATION 38
TABLE V-1: MEASURES TO MANAGE AN INTELLIGENT, DECENTRALIZED 54
ELECTRICITY SECTOR AND REDUCE PEAK LOAD
TABLE V-2: RELIABILITY IMPACT OF THE CLEAN POWER PLAN 63
TABLE VI-1: THE NUCLEAR INDUSTRY’S BROAD ATTACK ON RENEWABLES 74
vi
EXECUTIVE SUMMARY
This paper presents a comprehensive analysis of the ongoing battle between two very
different visions for the future of the electricity sector:
the 20th century model of central station, baseload/peak-load generation that
passively follows demand,
the emerging 21st century, decentralized model based on coordinating and
actively integrating distributed supply with managed demand using advanced
information, communications, and control technologies.
The paper demonstrates that the current conflict between the dominant incumbents, led
by nuclear power on the one side, and the new entrants, on the other, has reached a crucial
turning point that will deeply affect the speed of the transformation and the ultimate structure of
the 21st century electricity system.
RESOURCE ECONOMICS
Part I of the analysis reviews the cost estimates for almost two dozen resources, estimates
that continually change significantly because of rapid technological developments. The analysis
includes demand-side efficiency as a resource of equal importance with supply-side resources.
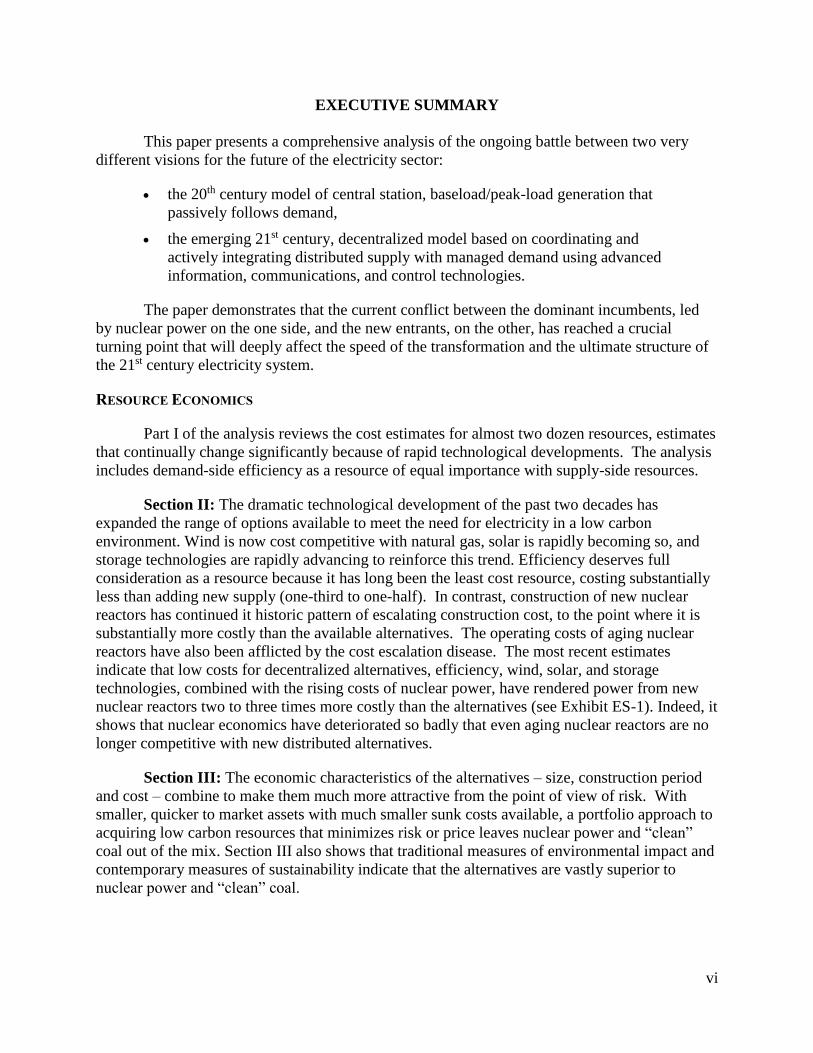
Section II: The dramatic technological development of the past two decades has
expanded the range of options available to meet the need for electricity in a low carbon
environment. Wind is now cost competitive with natural gas, solar is rapidly becoming so, and
storage technologies are rapidly advancing to reinforce this trend. Efficiency deserves full
consideration as a resource because it has long been the least cost resource, costing substantially
less than adding new supply (one-third to one-half). In contrast, construction of new nuclear
reactors has continued it historic pattern of escalating construction cost, to the point where it is
substantially more costly than the available alternatives. The operating costs of aging nuclear
reactors have also been afflicted by the cost escalation disease. The most recent estimates
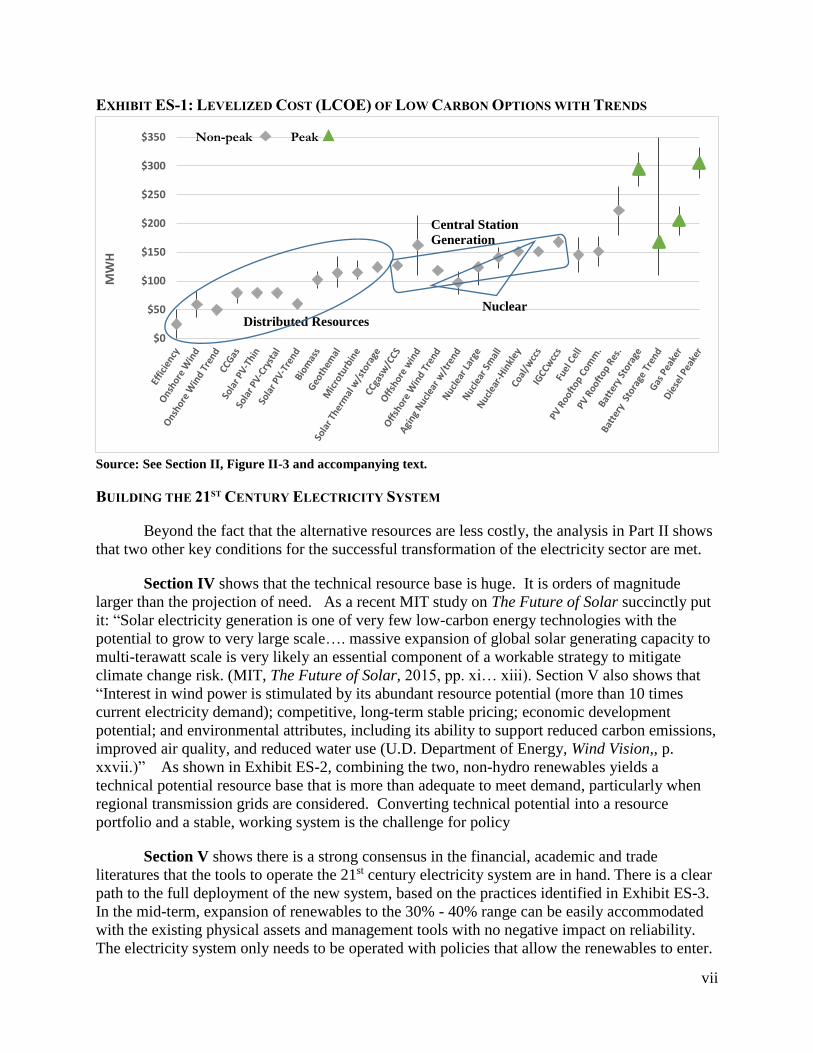
indicate that low costs for decentralized alternatives, efficiency, wind, solar, and storage
technologies, combined with the rising costs of nuclear power, have rendered power from new
nuclear reactors two to three times more costly than the alternatives (see Exhibit ES-1). Indeed, it
shows that nuclear economics have deteriorated so badly that even aging nuclear reactors are no
longer competitive with new distributed alternatives.
Section III: The economic characteristics of the alternatives – size, construction period
and cost – combine to make them much more attractive from the point of view of risk. With
smaller, quicker to market assets with much smaller sunk costs available, a portfolio approach to
acquiring low carbon resources that minimizes risk or price leaves nuclear power and “clean”
coal out of the mix. Section III also shows that traditional measures of environmental impact and
contemporary measures of sustainability indicate that the alternatives are vastly superior to
nuclear power and “clean” coal.
vii
$0
$50
$100
$150
$200
$250
$300
$350
MW
HEXHIBIT ES-1: LEVELIZED COST (LCOE) OF LOW CARBON OPTIONS WITH TRENDS
Non-peak Peak Central Station
Generation
Nuclear Distributed Resources
Source: See Section II, Figure II-3 and accompanying text.
BUILDING THE 21ST CENTURY ELECTRICITY SYSTEM
Beyond the fact that the alternative resources are less costly, the analysis in Part II shows
that two other key conditions for the successful transformation of the electricity sector are met.
Section IV shows that the technical resource base is huge. It is orders of magnitude
larger than the projection of need. As a recent MIT study on The Future of Solar succinctly put
it: “Solar electricity generation is one of very few low-carbon energy technologies with the
potential to grow to very large scale…. massive expansion of global solar generating capacity to
multi-terawatt scale is very likely an essential component of a workable strategy to mitigate
climate change risk. (MIT, The Future of Solar, 2015, pp. xi… xiii). Section V also shows that
“Interest in wind power is stimulated by its abundant resource potential (more than 10 times
current electricity demand); competitive, long-term stable pricing; economic development
potential; and environmental attributes, including its ability to support reduced carbon emissions,
improved air quality, and reduced water use (U.D. Department of Energy, Wind Vision,, p.
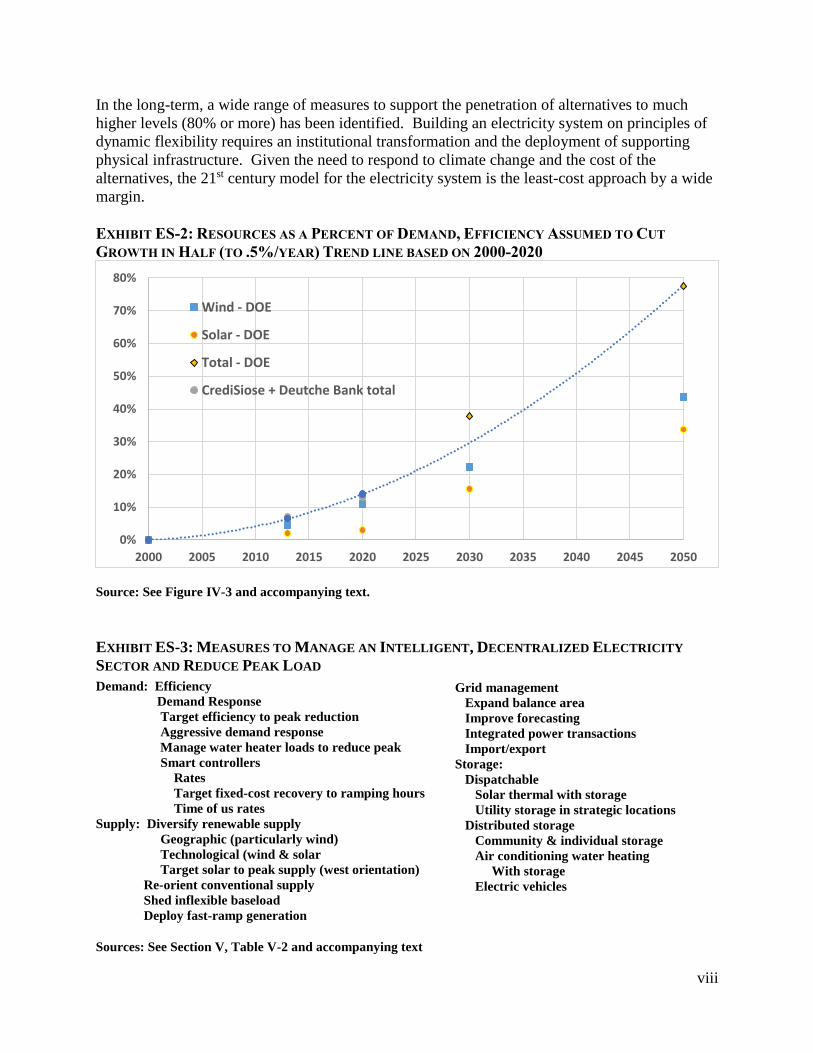
xxvii.)” As shown in Exhibit ES-2, combining the two, non-hydro renewables yields a
technical potential resource base that is more than adequate to meet demand, particularly when
regional transmission grids are considered. Converting technical potential into a resource
portfolio and a stable, working system is the challenge for policy
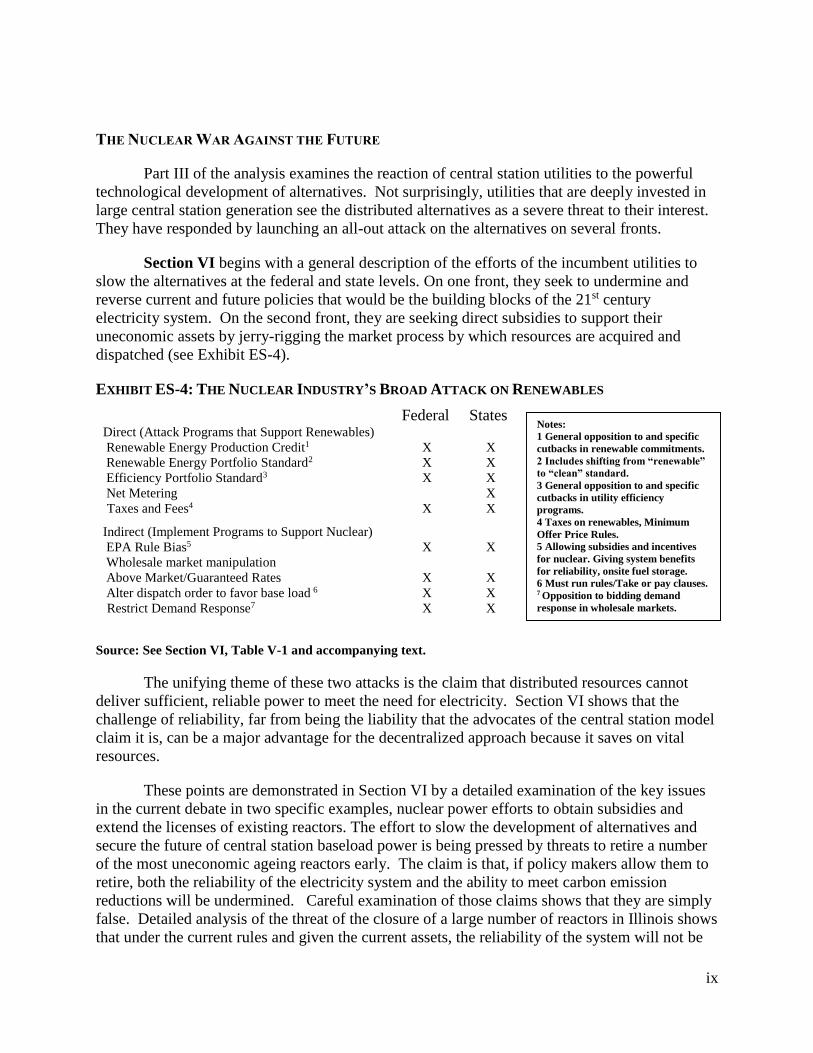
Section V shows there is a strong consensus in the financial, academic and trade
literatures that the tools to operate the 21st century electricity system are in hand. There is a clear
path to the full deployment of the new system, based on the practices identified in Exhibit ES-3.
In the mid-term, expansion of renewables to the 30% - 40% range can be easily accommodated
with the existing physical assets and management tools with no negative impact on reliability.
The electricity system only needs to be operated with policies that allow the renewables to enter.
viii
Grid management
Expand balance area
Improve forecasting
Integrated power transactions
Import/export
Storage:
Dispatchable
Solar thermal with storage
Utility storage in strategic locations
Distributed storage
Community & individual storage
Air conditioning water heating
With storage
Electric vehicles
In the long-term, a wide range of measures to support the penetration of alternatives to much
higher levels (80% or more) has been identified. Building an electricity system on principles of
dynamic flexibility requires an institutional transformation and the deployment of supporting
physical infrastructure. Given the need to respond to climate change and the cost of the
alternatives, the 21st century model for the electricity system is the least-cost approach by a wide
margin.
EXHIBIT ES-2: RESOURCES AS A PERCENT OF DEMAND, EFFICIENCY ASSUMED TO CUT
GROWTH IN HALF (TO .5%/YEAR) TREND LINE BASED ON 2000-2020
Source: See Figure IV-3 and accompanying text.
EXHIBIT ES-3: MEASURES TO MANAGE AN INTELLIGENT, DECENTRALIZED ELECTRICITY
SECTOR AND REDUCE PEAK LOAD
Demand: Efficiency
Demand Response
Target efficiency to peak reduction
Aggressive demand response
Manage water heater loads to reduce peak
Smart controllers
Rates
Target fixed-cost recovery to ramping hours
Time of us rates
Supply: Diversify renewable supply
Geographic (particularly wind)
Technological (wind & solar Target solar to peak supply (west orientation)
Re-orient conventional supply
Shed inflexible baseload
Deploy fast-ramp generation
Sources: See Section V, Table V-2 and accompanying text
0%
10%
20%
30%
40%
50%
60%
70%
80%
2000 2005 2010 2015 2020 2025 2030 2035 2040 2045 2050
Wind - DOE
Solar - DOE
Total - DOE
CrediSiose + Deutche Bank total
ix
Notes:
1 General opposition to and specific
cutbacks in renewable commitments.
2 Includes shifting from “renewable”
to “clean” standard.
3 General opposition to and specific
cutbacks in utility efficiency
programs.
4 Taxes on renewables, Minimum
Offer Price Rules.
5 Allowing subsidies and incentives
for nuclear. Giving system benefits
for reliability, onsite fuel storage.
6 Must run rules/Take or pay clauses. 7 Opposition to bidding demand
response in wholesale markets.
THE NUCLEAR WAR AGAINST THE FUTURE
Part III of the analysis examines the reaction of central station utilities to the powerful
technological development of alternatives. Not surprisingly, utilities that are deeply invested in
large central station generation see the distributed alternatives as a severe threat to their interest.
They have responded by launching an all-out attack on the alternatives on several fronts.
Section VI begins with a general description of the efforts of the incumbent utilities to
slow the alternatives at the federal and state levels. On one front, they seek to undermine and
reverse current and future policies that would be the building blocks of the 21st century
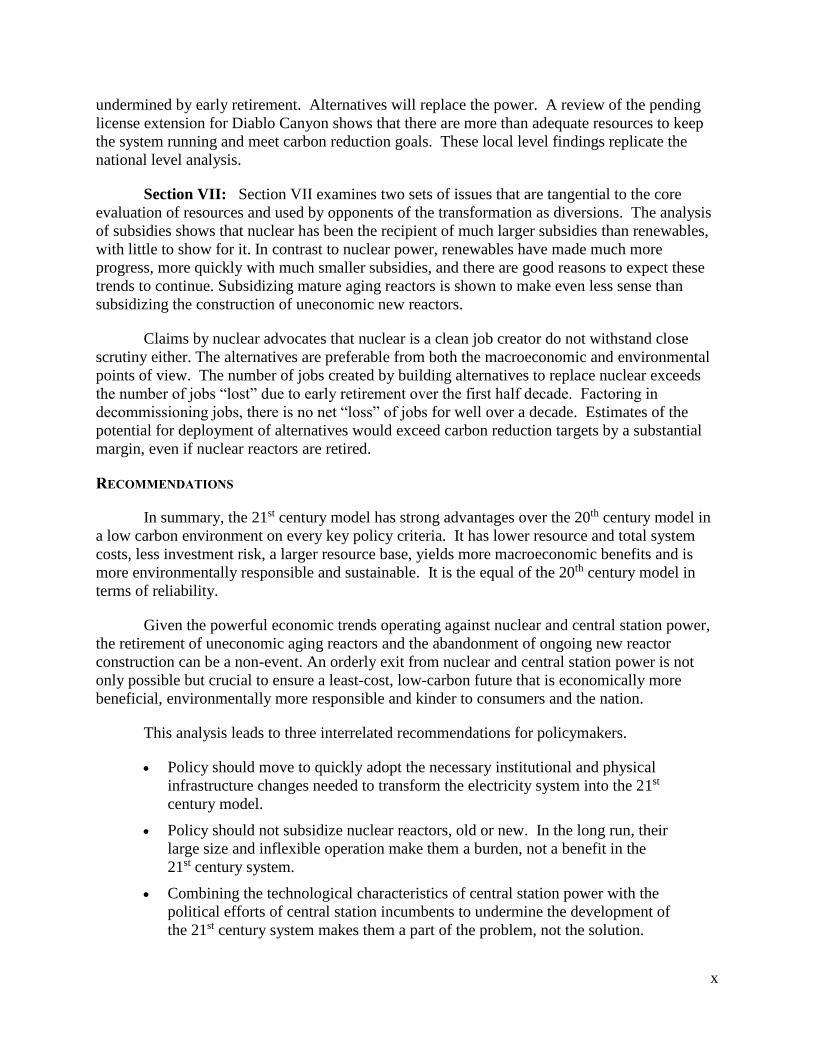
electricity system. On the second front, they are seeking direct subsidies to support their
uneconomic assets by jerry-rigging the market process by which resources are acquired and
dispatched (see Exhibit ES-4).
EXHIBIT ES-4: THE NUCLEAR INDUSTRY’S BROAD ATTACK ON RENEWABLES
Federal States Direct (Attack Programs that Support Renewables) Renewable Energy Production Credit1 X X Renewable Energy Portfolio Standard2 X X Efficiency Portfolio Standard3 X X Net Metering X Taxes and Fees4 X X
Indirect (Implement Programs to Support Nuclear) EPA Rule Bias5 X X Wholesale market manipulation Above Market/Guaranteed Rates X X Alter dispatch order to favor base load 6 X X Restrict Demand Response7 X X
Source: See Section VI, Table V-1 and accompanying text.
The unifying theme of these two attacks is the claim that distributed resources cannot
deliver sufficient, reliable power to meet the need for electricity. Section VI shows that the
challenge of reliability, far from being the liability that the advocates of the central station model
claim it is, can be a major advantage for the decentralized approach because it saves on vital
resources.
These points are demonstrated in Section VI by a detailed examination of the key issues
in the current debate in two specific examples, nuclear power efforts to obtain subsidies and
extend the licenses of existing reactors. The effort to slow the development of alternatives and
secure the future of central station baseload power is being pressed by threats to retire a number
of the most uneconomic ageing reactors early. The claim is that, if policy makers allow them to
retire, both the reliability of the electricity system and the ability to meet carbon emission
reductions will be undermined. Careful examination of those claims shows that they are simply
false. Detailed analysis of the threat of the closure of a large number of reactors in Illinois shows
that under the current rules and given the current assets, the reliability of the system will not be
x
undermined by early retirement. Alternatives will replace the power. A review of the pending
license extension for Diablo Canyon shows that there are more than adequate resources to keep
the system running and meet carbon reduction goals. These local level findings replicate the
national level analysis.
Section VII: Section VII examines two sets of issues that are tangential to the core
evaluation of resources and used by opponents of the transformation as diversions. The analysis
of subsidies shows that nuclear has been the recipient of much larger subsidies than renewables,
with little to show for it. In contrast to nuclear power, renewables have made much more
progress, more quickly with much smaller subsidies, and there are good reasons to expect these
trends to continue. Subsidizing mature aging reactors is shown to make even less sense than
subsidizing the construction of uneconomic new reactors.
Claims by nuclear advocates that nuclear is a clean job creator do not withstand close
scrutiny either. The alternatives are preferable from both the macroeconomic and environmental
points of view. The number of jobs created by building alternatives to replace nuclear exceeds
the number of jobs “lost” due to early retirement over the first half decade. Factoring in
decommissioning jobs, there is no net “loss” of jobs for well over a decade. Estimates of the
potential for deployment of alternatives would exceed carbon reduction targets by a substantial
margin, even if nuclear reactors are retired.
RECOMMENDATIONS
In summary, the 21st century model has strong advantages over the 20th century model in
a low carbon environment on every key policy criteria. It has lower resource and total system
costs, less investment risk, a larger resource base, yields more macroeconomic benefits and is
more environmentally responsible and sustainable. It is the equal of the 20th century model in
terms of reliability.
Given the powerful economic trends operating against nuclear and central station power,
the retirement of uneconomic aging reactors and the abandonment of ongoing new reactor
construction can be a non-event. An orderly exit from nuclear and central station power is not
only possible but crucial to ensure a least-cost, low-carbon future that is economically more
beneficial, environmentally more responsible and kinder to consumers and the nation.
This analysis leads to three interrelated recommendations for policymakers.
Policy should move to quickly adopt the necessary institutional and physical
infrastructure changes needed to transform the electricity system into the 21st
century model.
Policy should not subsidize nuclear reactors, old or new. In the long run, their
large size and inflexible operation make them a burden, not a benefit in the
21st century system.
Combining the technological characteristics of central station power with the
political efforts of central station incumbents to undermine the development of
the 21st century system makes them a part of the problem, not the solution.
1
I. INTRODUCTION
A. PURPOSE
This paper examines the political economy of the ongoing transformation of the
electricity sector.1 It argues that the struggle over the future of the electric utility sector has
reached a critical, political phase because the technologies are in hand to replace the 20th century
model – powered by large, centralized baseload and peak-load generation that passively follows
demand – with a decentralized model that uses advanced intelligence, communications, and
control technologies to integrate distributed generation with actively managed demand.
Although distributed technologies have already put a great deal of economic pressure on
the 20th century model, centering the electricity system on new technologies with new
organizational principles requires a thorough transformation of the physical and institutional
infrastructure of the sector. Dominant incumbent interests naturally resist such a transformation
since their assets and skill sets do not fit well within the new model and would be significantly
devalued if the alternative model were to become dominant. As UBS succinctly put it in a recent
report, if the alternatives are allowed to expand and the electricity system is transformed to
support their leading role, “Large-scale power generation, however, will be the dinosaur of the
future energy system: Too big, too inflexible, not even relevant for backup power in the long
run.”2
In response to the threat of the alternatives, the incumbent interests have launched a “war
against the future” on two primary fronts. The two most severely threatened incumbents are
grounded in the largest and most inflexible sources of power generation in the 20th century
electricity sector: coal and nuclear power. Each has taken a different tack in its resistance to the
transformation of the sector.
As the single largest emitter of greenhouse gases both globally and in the United States,
coal is saddled with an increasingly desperate fight against climate change policy. Therefore, the
burden of resisting the broader transformation of the electricity sector has fallen on nuclear
power, which can claim to be a low-carbon resource. However, the campaign to preserve the
existing nuclear baseload model is hampered by two factors. Nuclear power is the largest and
most inflexible of the central station resources, which makes it incompatible with the alternative
technologies and it suffers a severe economic disadvantages that make it unable to compete with
low-carbon alternatives.
The conflict between nuclear and the alternatives is not only the most important of the
fronts in the war against the future, it also has a long history. An inability to compete has been at
the center of the 50-year battle between nuclear power and the alternatives (first coal and gas,
now efficiency, renewables, and gas). Today, the fight is over the fundamental structure and
organizing principles of the electricity system and the selection of the technologies that will be
the core resource on which the sector relies. Thus, today the stakes are much higher than ever.
The current battlefield between nuclear power and distributed alternative energy is
focused on the EPA’s proposed Clean Power Rule (CPP),3 although nuclear advocates launched
2
a vigorous assault on alternatives at the federal and state levels several years ahead of the CPP.
The EPA CPP has intensified the struggle for three reasons:
● It can be used to obscure the economic fundamentals of resource acquisition.
● It could provide a boost to the transformation process supporting the alternatives.
● It has singled out “at-risk” aging reactors for potential subsidies.
The last point highlights a remarkable turn of events in the history of commercial nuclear
power in the United States: the rapidly deteriorating economics of aging reactors. After decades
of claiming to be a low-cost source of power because of low operating costs, aging reactors are
no longer cost competitive even in that narrow view of operating cost. Not even the full
implementation of the EPA Clean Power Rule would save aging reactors from early retirement,
so the owners of those reactors have launched a major campaign to increase revenues with direct
subsidies from state and federal policymakers and secure Jerry-rigged market pricing rules that
undermine alternatives.
This paper shows that the fundamental critiques of new nuclear reactor construction that
have been made throughout the history of the commercial nuclear power sector in the United
States now apply to aging reactors as well.4 Nuclear reactors old and new, particularly when they
are used as a wedge for fighting the transformation of the electricity sector, are far from a
necessary part of a low-carbon solution. On the contrary, nuclear power, with its war against the
transformation of the electricity system, is part of the problem, not the solution.
Although the speed and extent of the transformation of the electricity sector will be
decided by the political struggle between advocates of central station technologies and the
alternatives, the driving force for change is economic. This paper examines the economic
fundamentals underlying the transformation and conflict between the 20th and 21st century
models of the electricity sector.
B. OUTLINE
The paper is divided into three parts.
Part I examines the “basic” economics of developing electricity resources. It shows that
the economics strongly favor distributed resources and the transformation of the system.
● Section II examines generation resources. Resource acquisition begins with
estimates of how much it will cost to produce electricity over the life of a
facility. The section examines energy efficiency as a resource on equal
footing with generation. The calculation is never simple, however. To ensure
the cost estimates are comparable, the analysis uses levelized cost.
● Section III examines the economic risks associated with the various low-
carbon resources. It shows that nuclear reactors old and new have higher risks
than the alternatives. It also shows that the alternative are far more attractive
from the point of view of environmental impacts.
3
A resources is not a system and resource costs are not the only consideration in building a
resources portfolio or a system. Part II addresses two other key questions in building the 21st
century electricity system.
● Section IV, addresses the question of whether the resource base is adequate to
provide a long-term stable basis for the alternative model.
● Section V discusses the key challenges of deploying a 21st century electricity
system, focusing on the issue of reliable power, which is the main focal point
of the nuclear war against the future.
Part III analyzes the current battle between central station and alternative generation by
examining key issues through the lens of ongoing efforts by nuclear advocates to increase their
subsidies and reverse policies that support alternatives.
● Section VI examines the attack on alternatives through two case studies – the
threat to precipitously retire ageing reactors and the extension of licenses for
existing reactors – with respect to the reliability and carbon emission
reductions.
● Section VII examines two diversionary tactics in the battle being waged by
nuclear advocates in the “war against the future,” the skirmish over subsidies,
the potential impact on jobs and the ability to meet the goals of carbon
reduction.
C. FINDINGS
1. Part I: Resource Economics
Section II: The dramatic technological development of the past two decades has
expanded the range of options available to meet the need for electricity in a low carbon
environment. Wind is now cost competitive with natural gas, solar is rapidly becoming so, and
storage technologies are rapidly advancing to reinforce this trend. Efficiency has long been the
least cost resource. Efficiency improvements that cost less than adding new supply can cut
demand by 20-30% in the mid-term. In contrast, construction of new nuclear reactors has
continued it historic pattern of escalating construction cost, to the point where it is substantially
more costly than the available alternatives. The operating costs of aging nuclear reactors have
also been afflicted by the cost escalation disease.
Section III: The economic characteristics of the alternatives – size, construction period
and cost – combine to make them much more attractive from the point of view of risk. A
portfolio approach to acquiring low carbon resources that minimizes risk or price leaves nuclear
power out of the mix. Reliance on efficiency and renewables is also far more environmentally
benign.
2. Part II: Building the 21st Century Electricity System
Section IV shows that the technical resource base on which the 21st century electricity
system would rely is huge. Converting technical potential into resource portfolio and a working
4
system is the challenge for policy. The short term projection of several financial analyses and
the long term “vision” scenarios of U.S. Department of Energy studies reflect strong consensus
in the financial, academic and trade literatures that the conversion of the technical potential and
the building of the system is economically feasible.
Section V: The trade and financial literature and real world experience indicate that the
tools are in hand to integrate the alternative new resources using advance information,
communications and control technologies that actively manage supply and demand. The existing
system can handle penetration of alternatives to 30% - 40% with no negative impact on
reliability. A wide range of measures to support the penetration of alternatives to much higher
levels of penetration (in the range of 80% or more) has been identified. Adopting policies to
build an electricity system on principles of dynamic flexibility represents an institutional
transformation that requires new physical infrastructure.
3. Part III: The Nuclear War against the Future
Part III of the analysis examines the reaction of central station utilities to the powerful
technological development of alternatives. Not surprisingly, utilities that are deeply invested in
large central station generation see this potential development as a severe threat to their interest
and they have responded by launching an all-out attack on the alternatives with two fronts.
Section VI describes the efforts of the incumbent utilities to slow the alternatives at the
federal and state levels, while they seek subsidies for their preferred resources. Following from
the earlier analysis, it shows that the challenge of reliability, far from being the liability that the
advocates of the central station model claim it is, can be a major advantage for the decentralized
approach because it saves on vital resources.
Section VII examines the issue of subsidies, showing that nuclear has been the recipient
of much larger subsidies, with little to show for it. In contrast, renewables have made much more
progress, more quickly with much smaller subsidies, and there are good reasons to expect these
trends to continue. Subsidizing mature aging reactors is shown to make even less sense than
subsidizing new reactors. Section VII also shows that claims by nuclear advocates that nuclear is
a job creator that is indispensable to meeting the carbon reduction goal do not withstand close
scrutiny. The number of jobs created by building alternatives to replace nuclear exceeds the
number of jobs “lost” due to early retirement over the first half decade. Factoring in
decommissioning jobs, there is no net “loss” of jobs for well over a decade. Estimates of the
potential for deployment of alternatives would exceed carbon reduction targets by a substantial
margin, even if nuclear reactors are retired.
4. Recommendations
Given the powerful economic trends operating against nuclear power, the retirement of
uneconomic aging reactors and the abandonment of ongoing construction of new reactors can be
a non-event. An orderly exit from nuclear power is not only possible but crucial to ensure a least-
cost, low-carbon future that is economically more beneficial and environmentally kinder to
consumers and the nation.
5
This analysis leads to three interrelated recommendations for policymakers.
Policy should move to quickly adopt the necessary institutional and physical
infrastructure changes needed to transform the electricity system into the 21st
century model.
Policy should not subsidize nuclear reactors, old or new. In the long run, their
large size and inflexible operation makes them a burden, not a benefit in the
21st century system.
Combining the technoeconomic characteristics of central station technologies
with the political efforts of the incumbents to undermine the development of
the 21st century system makes them a part of the problem, not the solution.

6
PART I. RESOURCE ECONOMICS
7
II. ECONOMICS OF LOW-CARBON RESOURCES
A. THE FLASHPOINT OF TRANSFORMATION: OPERATING COSTS AND MERIT ORDER DISPATCH
The flashpoint of the conflict over the transformation of the electricity sector has been
widely recognized in the industry and among analysts. It centers on the market clearing price of
electricity in those areas where markets, as opposed to regulators, set that price.
The 20th century electricity industry relied on baseload facilities that had to run constantly
to meet off-peak demand. Rather than store electricity itself, which was costly, utilities chose to
meet higher demand (shoulder and peak) by storing raw energy that could be used to quickly
generate electricity (primarily fossil fuels like natural gas and diesel, but also a small amount of
water pumped above a generator). For fossil-fuel peak power, operating costs were high, but
capital costs were low, so it made sense to run these facilities for a small number of peak hours.
By allowing peak prices to skyrocket (known as hockey-stick price increases) and paying those
prices to all generators, scarcity rents were created that could be used to pay the high capital cost
of baseload facilities.5 Where prices were set by regulators, they were put far above marginal
costs for the same reason.
Over the past two decades it has become much more costly to meet demand in the old
way. First, diesel became expensive and volatile. Second, the social costs of fossil fuels have
been recognized. Third, carbon emissions have become a major concern. The search for low-
carbon alternatives to replace coal baseload generation has unleashed a wave of innovation.
Innovation has led not only to a dramatic lowering of the cost of renewable alternatives, but also
to the use of resources that are likely to be dispatched on-peak because they have very low
operating costs. As these resources come online, they shift the supply curve, putting downward
pressure on the market clearing price and the scarcity rents available for capital recovery.
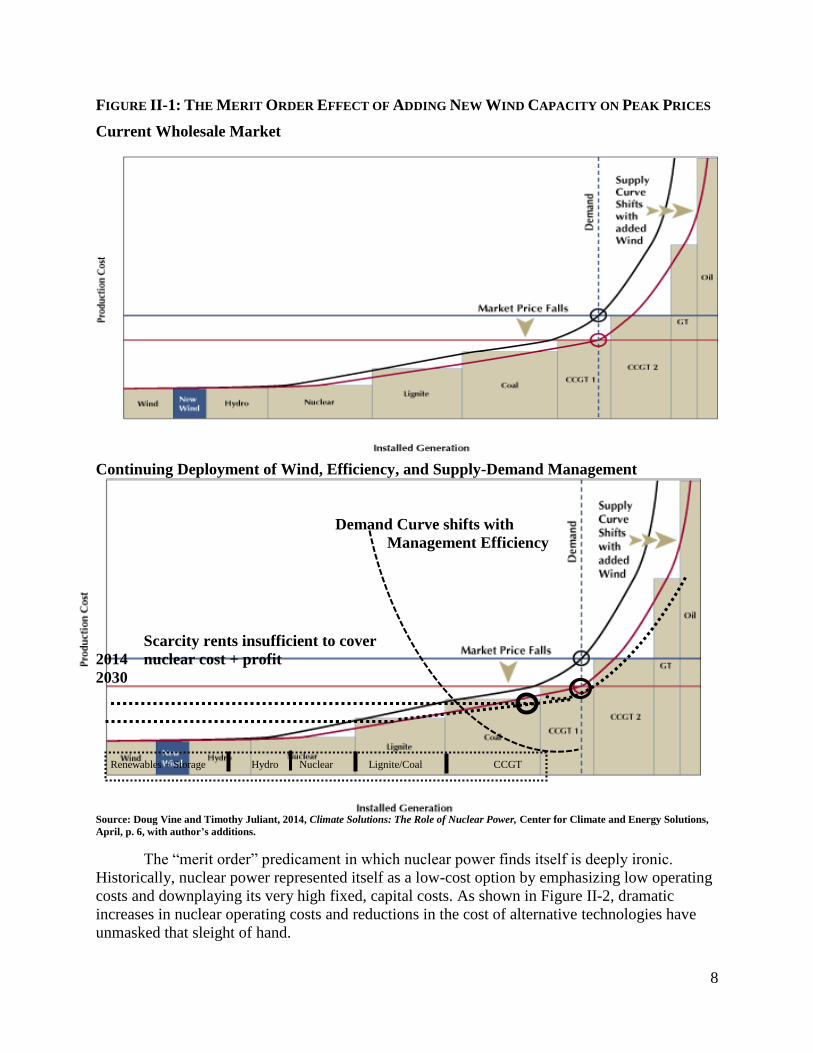
Figure II-1 is taken from a recent analysis by a group advocating for nuclear power. It
shows how the addition of wind lowers the market clearing price, which is undermining the
economics of aging nuclear reactors. In the “merit order effect,” an effect that has been
documented in every nation in which the use of wind has increased significantly,6 wind backs
inefficient natural gas (and some coal) plants out of the supply needed to clear the market at the
peak. This lowers the market clearing price. The upper graph shows the current situation as
lamented by the nuclear industry. The downward pressure on market clearing prices has led to a
number of years of losses for the aging, high-cost nuclear reactors. They cost more to run than
the alternatives, so they cannot cover their operating costs or make any contribution to their
capital costs
The lower graph shows the potential impact of continuing deployment of low-cost
renewables and the development of a 21st century low-carbon electricity system. Renewables
squeeze out more fossil fuels. Efficiency lowers demand, and demand management makes
demand more responsive at the peak. The market clears at a lower price. A utility sector that
moves toward a more diversified, distributed resource base and directly addresses the storage
issue will put further pressure on high capital cost resources. The process of innovation for
distributed alternatives such as wind and efficiency is advanced while for solar it is midstream.
For others, like storage, it is just beginning. The pressure will continue to mount.
8
FIGURE II-1: THE MERIT ORDER EFFECT OF ADDING NEW WIND CAPACITY ON PEAK PRICES
Current Wholesale Market
Continuing Deployment of Wind, Efficiency, and Supply-Demand Management
Demand Curve shifts with
Management Efficiency
Scarcity rents insufficient to cover
2014 nuclear cost + profit
2030
Source: Doug Vine and Timothy Juliant, 2014, Climate Solutions: The Role of Nuclear Power, Center for Climate and Energy Solutions,
April, p. 6, with author’s additions.
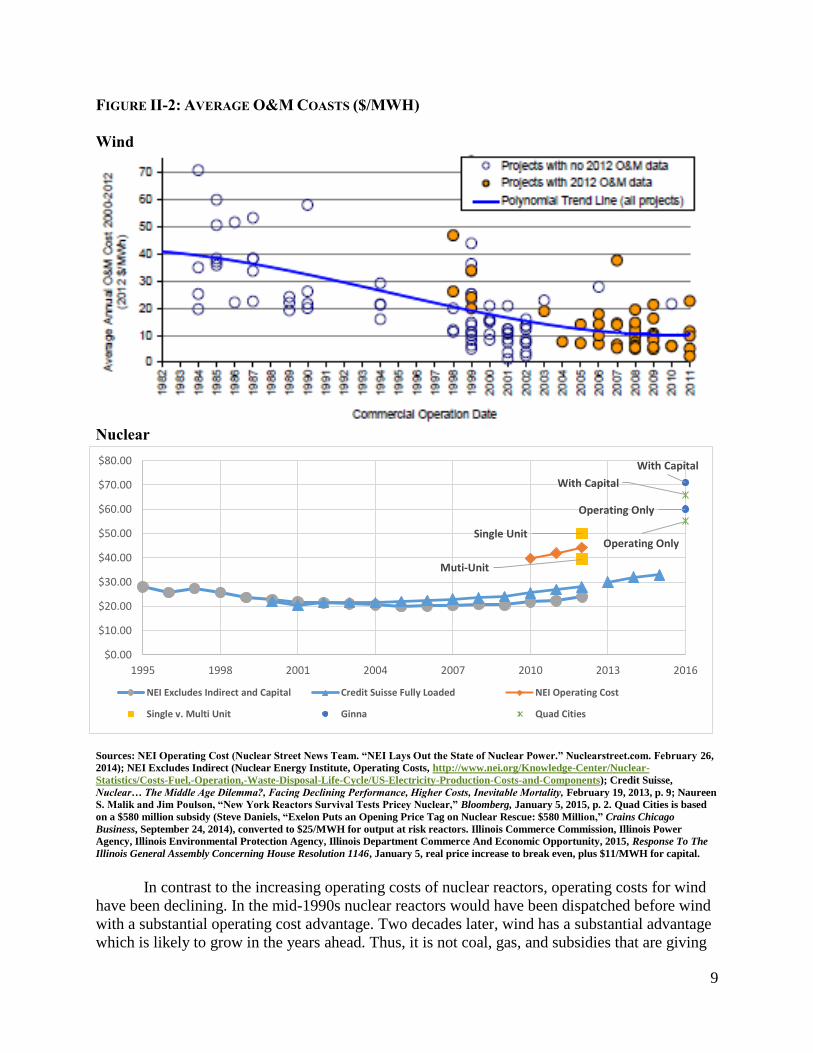
The “merit order” predicament in which nuclear power finds itself is deeply ironic.
Historically, nuclear power represented itself as a low-cost option by emphasizing low operating
costs and downplaying its very high fixed, capital costs. As shown in Figure II-2, dramatic
increases in nuclear operating costs and reductions in the cost of alternative technologies have
unmasked that sleight of hand.
Renewables + Storage Hydro Nuclear Lignite/Coal CCGT
9
FIGURE II-2: AVERAGE O&M COASTS ($/MWH)
Wind
Nuclear
Sources: NEI Operating Cost (Nuclear Street News Team. “NEI Lays Out the State of Nuclear Power.” Nuclearstreet.com. February 26,
2014); NEI Excludes Indirect (Nuclear Energy Institute, Operating Costs, http://www.nei.org/Knowledge-Center/Nuclear-
Statistics/Costs-Fuel,-Operation,-Waste-Disposal-Life-Cycle/US-Electricity-Production-Costs-and-Components); Credit Suisse,
Nuclear… The Middle Age Dilemma?, Facing Declining Performance, Higher Costs, Inevitable Mortality, February 19, 2013, p. 9; Naureen
S. Malik and Jim Poulson, “New York Reactors Survival Tests Pricey Nuclear,” Bloomberg, January 5, 2015, p. 2. Quad Cities is based
on a $580 million subsidy (Steve Daniels, “Exelon Puts an Opening Price Tag on Nuclear Rescue: $580 Million,” Crains Chicago
Business, September 24, 2014), converted to $25/MWH for output at risk reactors. Illinois Commerce Commission, Illinois Power
Agency, Illinois Environmental Protection Agency, Illinois Department Commerce And Economic Opportunity, 2015, Response To The
Illinois General Assembly Concerning House Resolution 1146, January 5, real price increase to break even, plus $11/MWH for capital.
In contrast to the increasing operating costs of nuclear reactors, operating costs for wind
have been declining. In the mid-1990s nuclear reactors would have been dispatched before wind
with a substantial operating cost advantage. Two decades later, wind has a substantial advantage
which is likely to grow in the years ahead. Thus, it is not coal, gas, and subsidies that are giving
Muti-Unit
Single Unit
Operating Only
With Capital
Operating Only
With Capital
$0.00
$10.00
$20.00
$30.00
$40.00
$50.00
$60.00
$70.00
$80.00
1995 1998 2001 2004 2007 2010 2013 2016
NEI Excludes Indirect and Capital Credit Suisse Fully Loaded NEI Operating Cost
Single v. Multi Unit Ginna Quad Cities
10
$0
$50
$100
$150
$200
$250
$300
$350
MW
Haging nuclear reactors heartburn, it is the superior economics of wind and efficiency combined
with the increasing operating costs of aging nuclear reactors that has made the aging reactors
uneconomic.
The lower graph in Figure II-2 includes estimates for the cost of keeping aging reactors
online. Ginna is a New York reactor and Quad Cities is a two-reactor site in Illinois for which
Exelon has stated specific revenue increases are needed, although these estimates are shrouded in
uncertainty.7 The operating costs are quite high and total costs are higher still, well above recent
market clearing prices. In the near term, the subsidy necessary to keep these aging reactors
online is substantial but will vary from market-to -market. Operating costs alone are almost twice
the current market clearing price of electricity and, as the discussion below shows, things are
likely to get worse rather than better over time.
B. FULL (LEVELIZED) COST
While the merit order effect has an important impact once renewables are deployed, it is
not the primary cause of the underlying deployment. If renewable resources were at a severe cost
disadvantage, it is unlikely they would have gained sufficient market share to so dramatically
affect market clearing prices. Declining total (levelized) costs are the ultimate driver of change.
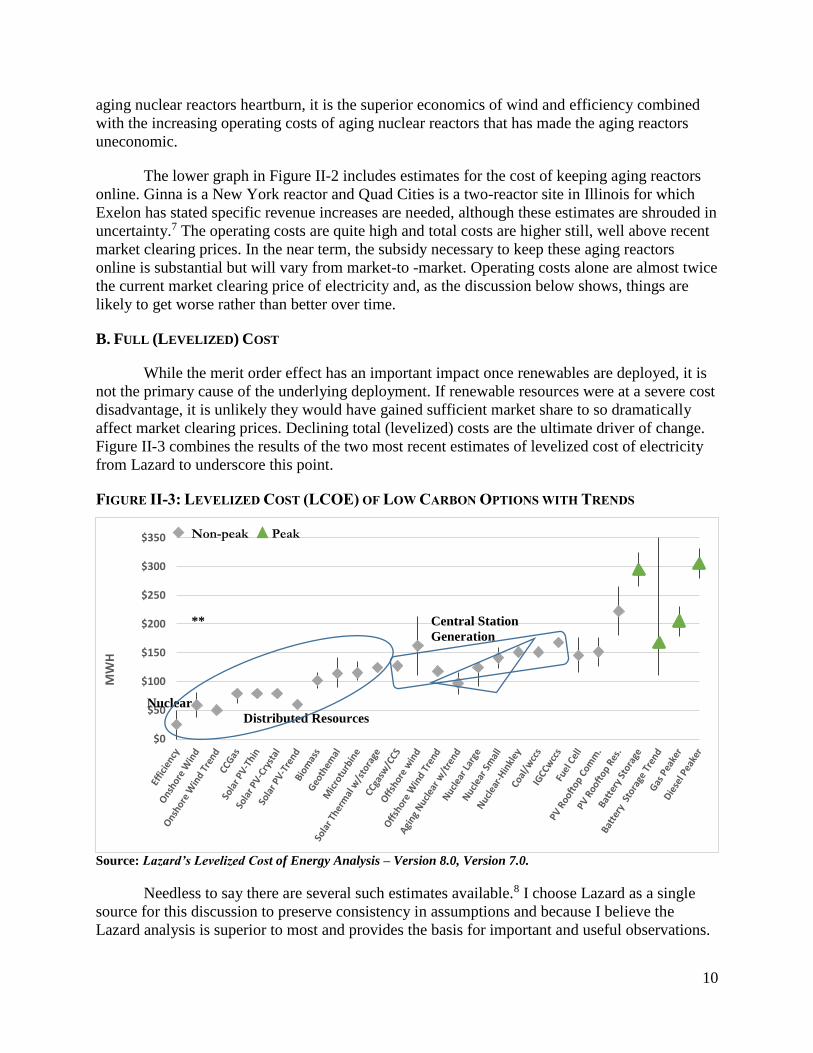
Figure II-3 combines the results of the two most recent estimates of levelized cost of electricity
from Lazard to underscore this point.
FIGURE II-3: LEVELIZED COST (LCOE) OF LOW CARBON OPTIONS WITH TRENDS
Non-peak Peak ** Central Station
Generation
Nuclear Distributed Resources
Source: Lazard’s Levelized Cost of Energy Analysis – Version 8.0, Version 7.0.
Needless to say there are several such estimates available.8 I choose Lazard as a single
source for this discussion to preserve consistency in assumptions and because I believe the
Lazard analysis is superior to most and provides the basis for important and useful observations.
11
● From the outset, the Lazard analysis included efficiency, which is the least
cost resource by far. None of the other major studies of electricity resources
do this.
● Lazard’s was among the first of the comprehensive analyses to note the strong
downward trend in the cost of solar and to begin arguing that solar was cost
competitive in some major markets and for peak power. As discussed below,
many have joined Lazard in projecting that solar will be broadly cost
competitive with natural gas by the middle of the second decade of the 21st
century, if not sooner.
● The Lazard analysis always included estimates for coal with carbon capture
and storage and has recently added an estimate for the cost of natural gas with
carbon capture and storage.
● The most recent analysis adds important storage technologies, utility scale
solar with storage, and utility scale battery storage. It also presents a cost trend
for storage that is similar to the trends from other sources.
● The current analysis presents “unsubsidized” costs strictly for generation (no
transmission, system integration, or waste disposal and decommissioning).
● The analysis always included natural gas peaking capacity costs and, in a
recent analysis, added a cross-national comparison of technologies that might
displace gas as the peaker resource.
To ensure an apples-to-apples comparison, I highlight Lazard’s mid-point, unsubsidized
cost projection and compare it to the other mid-points, unsubsidized. I also present the range. I
have included trend projections for solar, wind, and storage (from Lazard). For storage I use
Lazard as the point estimate, an upper bound from the Brattle Group, and a lower bound from
Navigant.9
I have included three additional estimates of nuclear costs. Because Lazard continues to
use a construction period of just under six years — the U.S. average was 10 and the reactors
currently under construction are well past six — I include two other estimates of the cost of
power from new nuclear reactors. The official cost of the U.K. Hinkley reactor provides an
estimate that reflects the higher cost projections of current technologies.10 I then include my
estimate of the long-run cost of Small Modular Reactors, which have recently received a lot of
attention.11 Finally, I include an estimate of the cost of power from aging reactors for the mid-
term based on the most costly (Ginna) and least costly (Byron) estimates for the at-risk reactors.
The estimate incorporates the underlying cost escalation assumed by Credit Suisse in its study of
aging reactors.12
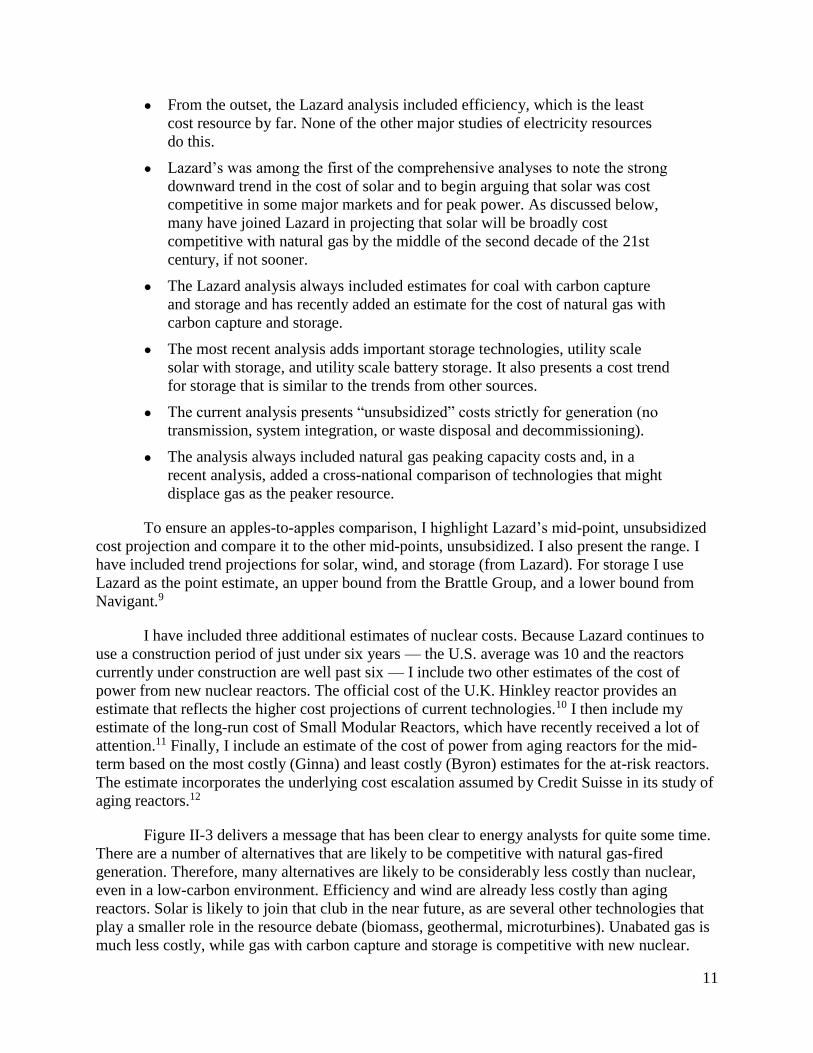
Figure II-3 delivers a message that has been clear to energy analysts for quite some time.
There are a number of alternatives that are likely to be competitive with natural gas-fired
generation. Therefore, many alternatives are likely to be considerably less costly than nuclear,
even in a low-carbon environment. Efficiency and wind are already less costly than aging
reactors. Solar is likely to join that club in the near future, as are several other technologies that
play a smaller role in the resource debate (biomass, geothermal, microturbines). Unabated gas is
much less costly, while gas with carbon capture and storage is competitive with new nuclear.
12
$0
$2,500
$5,000
$7,500
$10,000
$12,500
1970 1980 1990 2000 2010 2020 2030
$2
01
0/k
w
Nuclear Onshore Wind Solar PV SMR Optimist SMR Realist
The EPA’s Clean Power Rule focuses its attention on unabated gas, efficiency, and non-hydro
renewables, which are clearly lower in cost than nuclear.
Figure II-3 also reminds us that reducing peaks is a very valuable undertaking since
peaking power is so costly and tends to be fossil fuel-fired. This is the reason that storage, which
had not been a focal point of investment and innovation, is now such a hotbed of activity.
C. KEY COST TRENDS
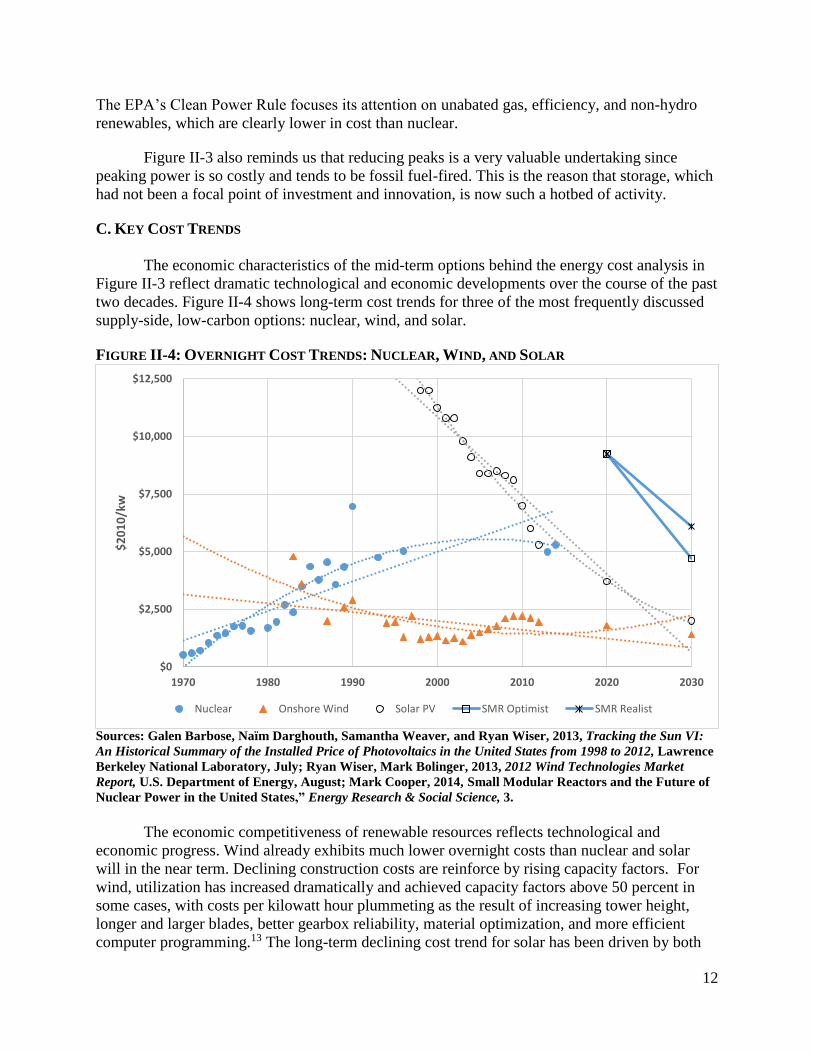
The economic characteristics of the mid-term options behind the energy cost analysis in
Figure II-3 reflect dramatic technological and economic developments over the course of the past
two decades. Figure II-4 shows long-term cost trends for three of the most frequently discussed
supply-side, low-carbon options: nuclear, wind, and solar.
FIGURE II-4: OVERNIGHT COST TRENDS: NUCLEAR, WIND, AND SOLAR
Sources: Galen Barbose, Naïm Darghouth, Samantha Weaver, and Ryan Wiser, 2013, Tracking the Sun VI:
An Historical Summary of the Installed Price of Photovoltaics in the United States from 1998 to 2012, Lawrence
Berkeley National Laboratory, July; Ryan Wiser, Mark Bolinger, 2013, 2012 Wind Technologies Market
Report, U.S. Department of Energy, August; Mark Cooper, 2014, Small Modular Reactors and the Future of
Nuclear Power in the United States,” Energy Research & Social Science, 3.
The economic competitiveness of renewable resources reflects technological and
economic progress. Wind already exhibits much lower overnight costs than nuclear and solar
will in the near term. Declining construction costs are reinforce by rising capacity factors. For
wind, utilization has increased dramatically and achieved capacity factors above 50 percent in
some cases, with costs per kilowatt hour plummeting as the result of increasing tower height,
longer and larger blades, better gearbox reliability, material optimization, and more efficient
computer programming.13 The long-term declining cost trend for solar has been driven by both
13
economies of scale and innovation. Each of these factors has made a substantial contribution to
declining cost and both are likely to continue to do so.14 Solar costs have been falling because of
economies of scale in production, reduced utilization of key component materials, increasing cell
efficiency, and other system cost savings and streamlining of siting, all of which have lowered
the cost of capital. 15
Storage is projected to be the least cost-peaking power source, just 10 percent more
costly than the higher nuclear projections.16 Rapid declines in storage costs reinforce the
importance of rapid declines in renewable costs as low-cost storage can dramatically boost the
effective load factor of renewables. Lazard’s estimate of a rapid decline in storage costs is
consistent with other estimates.17
Although important local conditions can affect the cost estimates of power from
alternatives — such as the richness of wind and solar resources — the broad technology cost
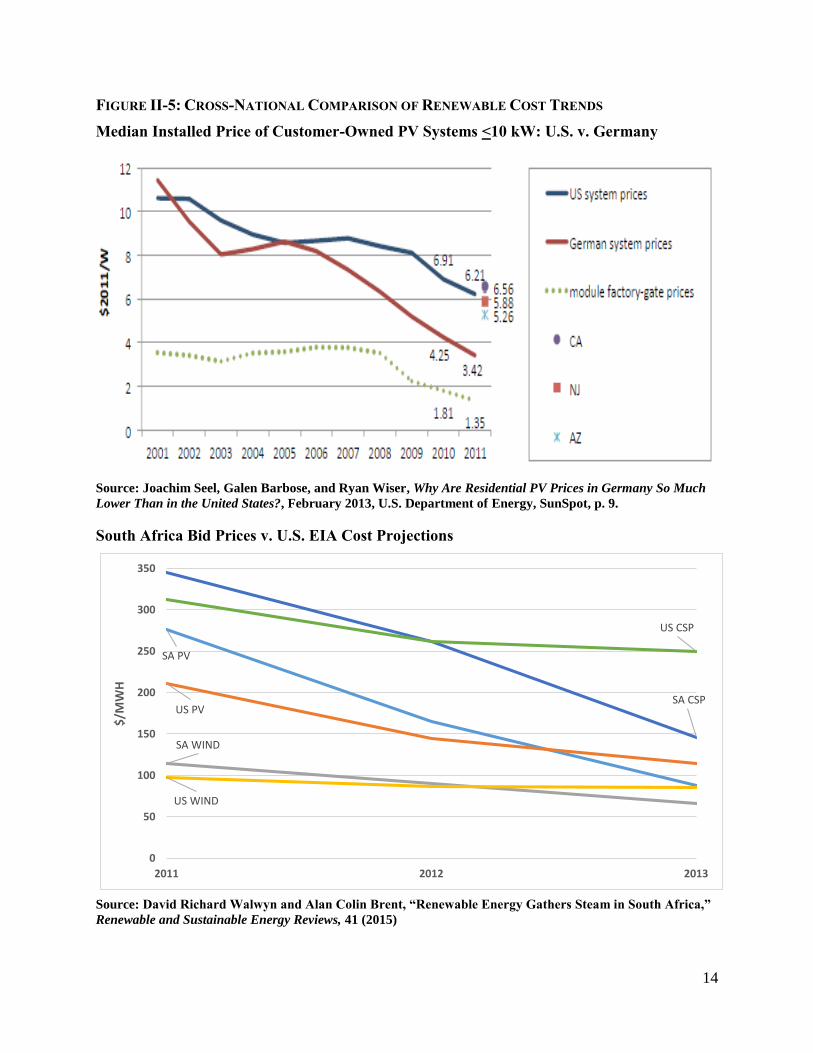
trends tend to be global because technology is exportable. In fact, as shown in the upper graph of
Figure II-5, declining costs abroad have been greater than those in the United States despite the
fact that the United States has richer resources. For example, solar costs declined almost twice as
fast in Germany as in the United States after Germany made a strong commitment to increase
reliance on renewables and decrease reliance on nuclear. As shown in the lower graph of Figure
I-5, cost trends for wind and solar in South Africa exhibit a similar pattern.18
In contrast to the non-hydro renewables, over the course of 50 years of commercial
nuclear power in the United States, construction costs have risen persistently without any
indication of abatement. Small modular reactors (SMRs), which have been touted as the next big
thing to save nuclear power, are likely to be much more costly than the renewables. Investment
in SMRs has collapsed, with both Westinghouse and B&W, the two largest firms pursuing the
technology in the United States, throttling investment.19
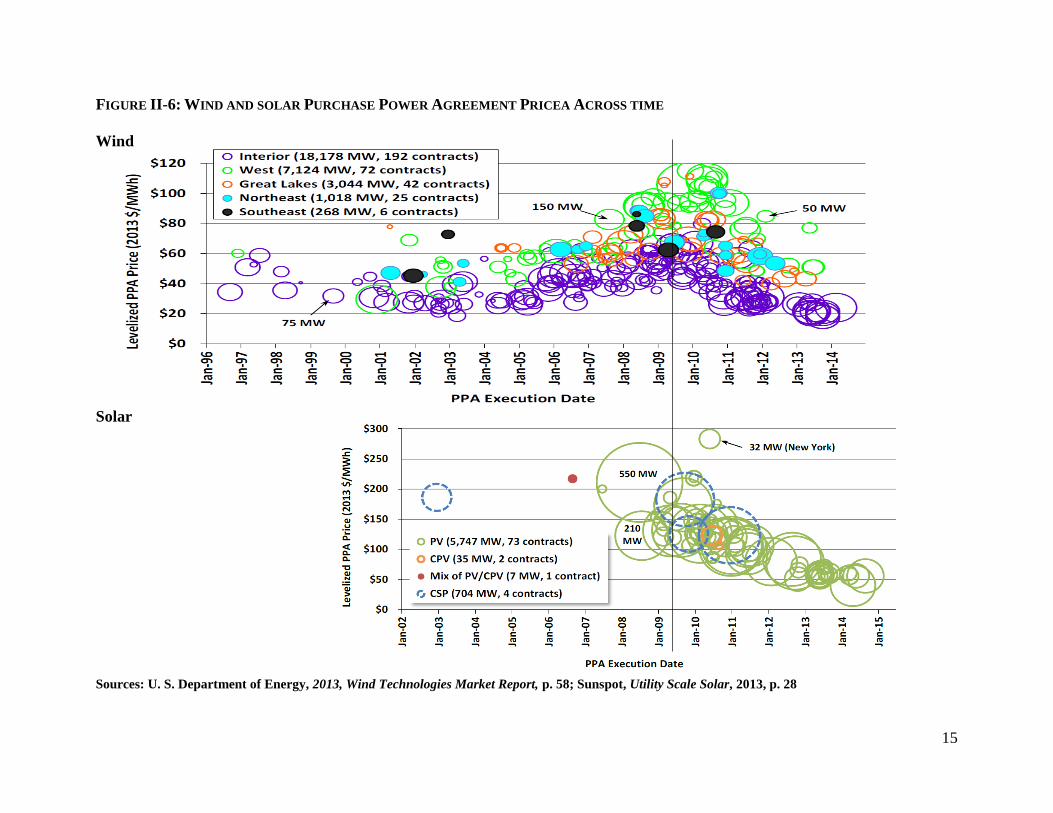
The combined effect and pay-off of the rapid improvement in technologies resulting in
declining operating, construction and life cycles costs is to deliver much lower cost, low carbon
energy to the market. As Figure II-6 shows, there has been a strong downward trend in
purchased power agreement prices. The Figure is constructed to align the dates, which shows
that the break point came in 2009. We observe wind and solar price declines of 50% in half a
decade. Recent wind prices are in the range of $20-$40/kwh; solar prices are in the range of
$50-$80/kwh.
In an analysis that projects renewables will account for the overwhelming majority of
U.S. capacity addition in the next decade, Credit Suisse notes that the prices being paid in
Purchased Power Contracts (PPAs) are already lower than the numbers used in Figure II-3
above, making them cost competitive with conventional generation options.
Renewables are cost competitive to even cheap against conventional generation. The clearing
price for new wind and solar continues to fall with improvements in utilization and falling
capital costs. For wind we are seeing utilization rates 15–20 percentage points higher than 2007
vintage turbines, regularly supporting PPA pricing at or below $30/MWH that effectively
'creates' long-term equivalent natural gas at <$3/MMBtu. Lower capital costs for solar have
dropped PPA pricing to $65–80/MWH from well over $100/MWH, making solar competitive
with new build gas peaking generation.20
14
SA PV
US PV
SA WIND
US WIND
SA CSP
US CSP
0
50
100
150
200
250
300
350
2011 2012 2013
$/M
WH
FIGURE II-5: CROSS-NATIONAL COMPARISON OF RENEWABLE COST TRENDS
Median Installed Price of Customer-Owned PV Systems <10 kW: U.S. v. Germany
Source: Joachim Seel, Galen Barbose, and Ryan Wiser, Why Are Residential PV Prices in Germany So Much
Lower Than in the United States?, February 2013, U.S. Department of Energy, SunSpot, p. 9.
South Africa Bid Prices v. U.S. EIA Cost Projections
Source: David Richard Walwyn and Alan Colin Brent, “Renewable Energy Gathers Steam in South Africa,”
Renewable and Sustainable Energy Reviews, 41 (2015)
15
FIGURE II-6: WIND AND SOLAR PURCHASE POWER AGREEMENT PRICEA ACROSS TIME
Wind
Solar
Sources: U. S. Department of Energy, 2013, Wind Technologies Market Report, p. 58; Sunspot, Utility Scale Solar, 2013, p. 28
16
Wind and solar not only costs substantially less than power from new nuclear reactors,
they are less costly than power from aging reactors. The market fundamentals on the supply-
side are running strongly against nuclear power.
D. EFFICIENCY AS A RESOURCE
In the above analysis of cost, efficiency is the least costly resource that anchors the
supply-curve of low-carbon resources. Yet, as noted, most analyses of levelized cost of resources
focus on generation alternatives and do not include efficiency. The cost of efficiency deserves
much more attention. This section explains the availability of efficiency as a resource to meet the
need for electricity in a low-carbon environment by examining why untapped opportunities to
invest in efficiency are available and how much efficiency costs. The next section examines how
much of the resource is available.
1. Market Imperfections and Barriers as the Cause of the Efficiency Gap
To recognize efficiency as a low-carbon resource I turn to a phenomenon that
economists, engineers, and policy analysts have for 30 years described as the “energy paradox”
or “efficiency gap.”21 Engineering/economic analyses showed that technologies exist to
potentially reduce the energy use of consumer durables (from lightbulbs to air conditioners,
water heaters, furnaces, building shells, and automobiles) and producer goods (motors, HVAC,
and heavy duty trucks). Because the reduction in operating costs more than offsets the initial cost
of the technology, resulting in substantial potential net economic benefits, we confront the
paradox: “Why don’t consumers purchase more economically efficient durable goods that result
in net economic savings?”
The answer to the question is well documented in hundreds (if not thousands) of
empirical studies. Energy markets are imperfect and riddled with barriers and obstacles to
efficiency, especially in the electricity sector. Market imperfections lead to underinvestment in
energy-saving technologies. McKinsey & Company offered the following framing in a series of
analyses addressing various aspects of the ongoing transformation of the electricity sector.
The highly compelling nature of energy efficiency raises the question of why the economy has
not already captured this potential, since it is so large and attractive. In fact, much progress has
been made over the past few decades throughout the U.S., with even greater results in select
regions and applications. Since 1980, energy consumption per unit of floor space has decreased
11 percent in residential and 21 percent in commercial sectors, while industrial energy
consumption per real dollar of GDP output has decreased 41 percent. As impressive as the gains
have been, however, an even greater potential remains due to multiple and persistent barriers
present at both the individual opportunity level and overall system level. By their nature, energy
efficiency measures typically require a substantial upfront investment in exchange for savings
that accrue over the lifetime of the deployed measures. Additionally, efficiency potential is
highly fragmented, spread across more than 100 million locations and billions of devices used
in residential, commercial, and industrial settings. This dispersion ensures that efficiency is the
highest priority for virtually no one. Finally, measuring and verifying energy not consumed is
by its nature difficult. Fundamentally, these attributes of energy efficiency give rise to specific
barriers that require opportunity-specific solution strategies and suggest components of an
overarching strategy.22
17
Even in the industrial sector, where firms are considered to be motivated primarily by
economic profitability incentives, the efficiency gap is evident. A recent United Nations
Industrial Development Organization (UNIDO) review of 160 studies of industrial energy
efficiency investments framed the analytic issues by posing and answering key questions in
exactly the same way as McKinsey and Company.23 I have discussed at length the specific
factors and processes that create the efficiency gap.24 Treating the efficiency gap as real, I focus
on the question of how much it costs to save energy and how much can be saved.
2. The Cost of Saved Energy
The engineering economic analyses that provided the initial evidence for the efficiency
gap showed that saving energy was significantly less costly than consuming it. Ex ante analyses
indicated that there would be substantial net benefits from including technologies to reduce
energy consumption in durable goods. As policies to spur investment in and deployment of
energy-saving technologies were implemented, ex post analyses were conducted to ascertain
whether the ex ante expectations were borne out. Those analyses strongly support the ex ante
engineering analyses, as shown in Figure II-1.
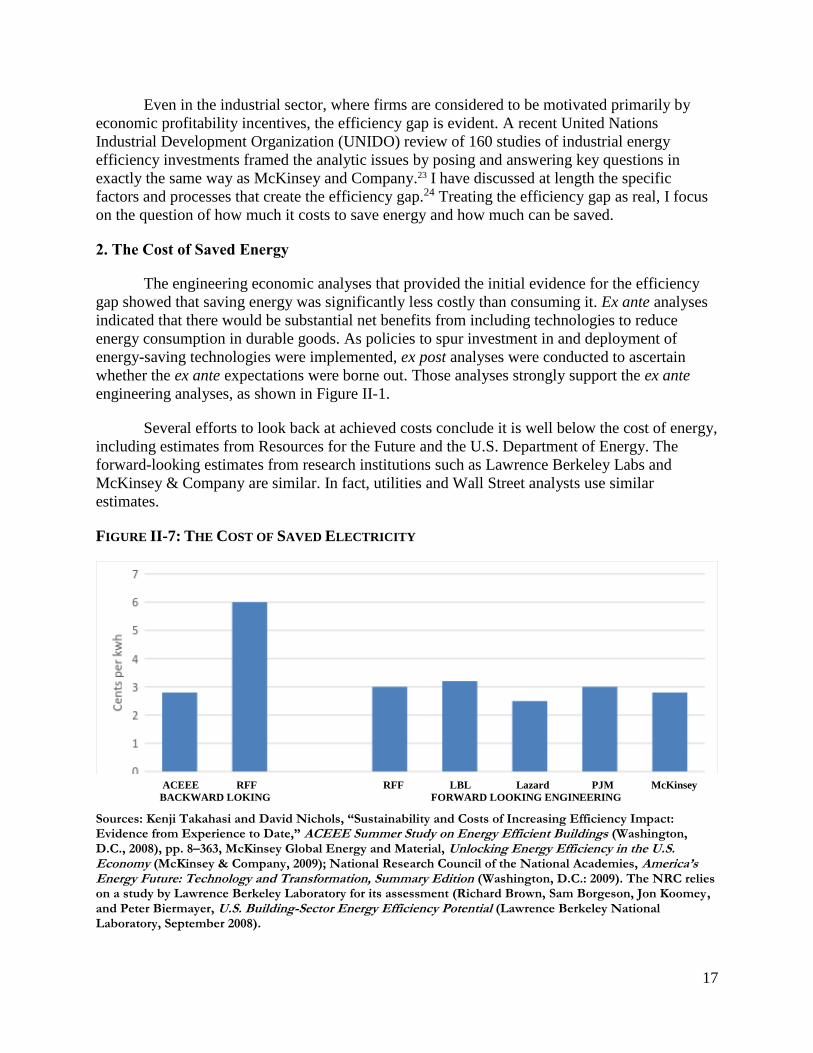
Several efforts to look back at achieved costs conclude it is well below the cost of energy,
including estimates from Resources for the Future and the U.S. Department of Energy. The
forward-looking estimates from research institutions such as Lawrence Berkeley Labs and
McKinsey & Company are similar. In fact, utilities and Wall Street analysts use similar
estimates.
FIGURE II-7: THE COST OF SAVED ELECTRICITY
ACEEE RFF RFF LBL Lazard PJM McKinsey
BACKWARD LOKING FORWARD LOOKING ENGINEERING
Sources: Kenji Takahasi and David Nichols, “Sustainability and Costs of Increasing Efficiency Impact: Evidence from Experience to Date,” ACEEE Summer Study on Energy Efficient Buildings (Washington, D.C., 2008), pp. 8–363, McKinsey Global Energy and Material, Unlocking Energy Efficiency in the U.S. Economy (McKinsey & Company, 2009); National Research Council of the National Academies, America’s Energy Future: Technology and Transformation, Summary Edition (Washington, D.C.: 2009). The NRC relies on a study by Lawrence Berkeley Laboratory for its assessment (Richard Brown, Sam Borgeson, Jon Koomey, and Peter Biermayer, U.S. Building-Sector Energy Efficiency Potential (Lawrence Berkeley National Laboratory, September 2008).
18
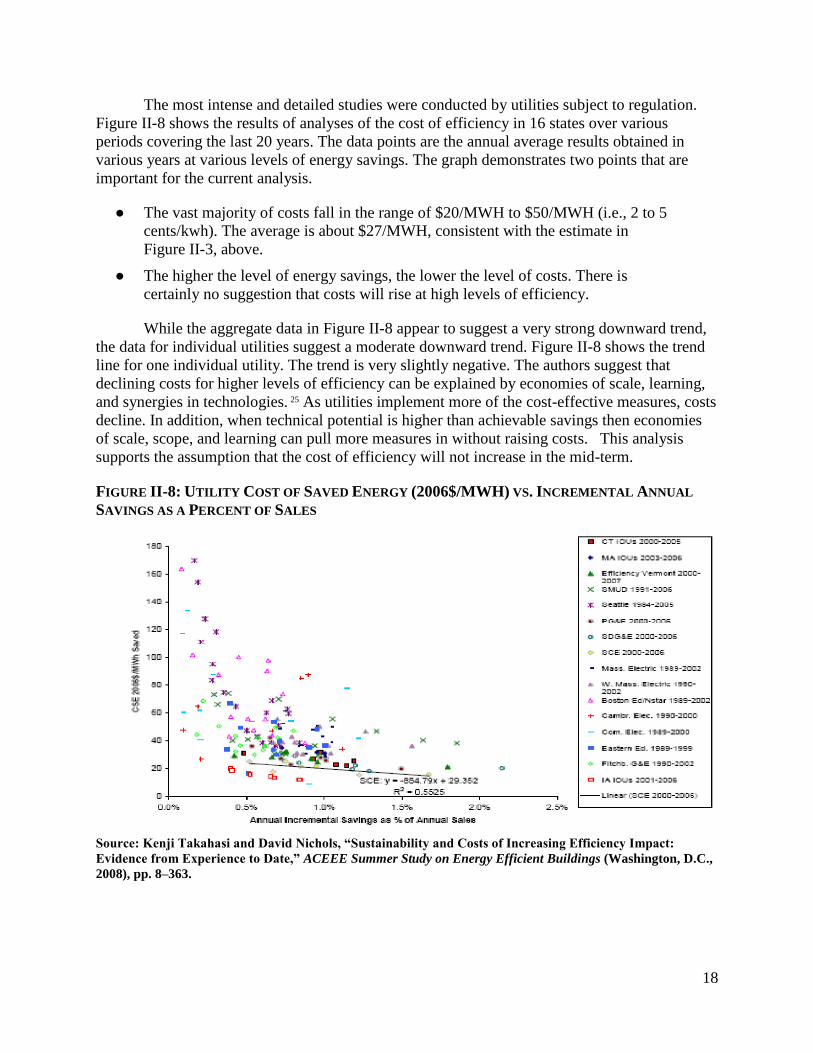
The most intense and detailed studies were conducted by utilities subject to regulation.
Figure II-8 shows the results of analyses of the cost of efficiency in 16 states over various
periods covering the last 20 years. The data points are the annual average results obtained in
various years at various levels of energy savings. The graph demonstrates two points that are
important for the current analysis.
● The vast majority of costs fall in the range of $20/MWH to $50/MWH (i.e., 2 to 5
cents/kwh). The average is about $27/MWH, consistent with the estimate in
Figure II-3, above.
● The higher the level of energy savings, the lower the level of costs. There is
certainly no suggestion that costs will rise at high levels of efficiency.
While the aggregate data in Figure II-8 appear to suggest a very strong downward trend,
the data for individual utilities suggest a moderate downward trend. Figure II-8 shows the trend
line for one individual utility. The trend is very slightly negative. The authors suggest that
declining costs for higher levels of efficiency can be explained by economies of scale, learning,
and synergies in technologies. 25 As utilities implement more of the cost-effective measures, costs
decline. In addition, when technical potential is higher than achievable savings then economies
of scale, scope, and learning can pull more measures in without raising costs. This analysis
supports the assumption that the cost of efficiency will not increase in the mid-term.
FIGURE II-8: UTILITY COST OF SAVED ENERGY (2006$/MWH) VS. INCREMENTAL ANNUAL
SAVINGS AS A PERCENT OF SALES
Source: Kenji Takahasi and David Nichols, “Sustainability and Costs of Increasing Efficiency Impact:
Evidence from Experience to Date,” ACEEE Summer Study on Energy Efficient Buildings (Washington, D.C.,
2008), pp. 8–363.
19
3. Cost Trends with Standards
This explanation introduces an important area of analysis in the “energy gap” debate:
learning curves and regulatory programs to achieve increased efficiency. Policies to reduce the
efficiency gap, like performance standards, are intended to overcome market barriers and
imperfections that have inhibited investment in efficiency. They have the effect of improving
market performance. By overcoming barriers and imperfections, well-designed performance
standards will stimulate investment and innovation in new energy efficient technologies. A
natural outcome of this process will be to lower the level of energy consumption as well as the
cost of energy savings.
One of the strongest findings of the empirical literature is its support of the theoretical
expectation that technological innovation will drive down the cost of improving energy
efficiency and reducing greenhouse gas emissions. A comprehensive review of Technology
Learning in the Energy Sector found that energy efficiency technologies are particularly
sensitive to learning effects and policy.
For demand-side technologies the experience curve approach also seems applicable to measure
autonomous energy efficiency improvements. Interestingly, we do find strong indications that in
this case, policy can bend down (at least temporarily) the experience curve and increase the
speed with which energy efficiency improvements are implemented.26
Analyses that fail to take into account the powerful process of technological innovation
that lowers costs will overestimate costs, undervalue innovation, and perpetuate market failure.
Detailed analyses of major consumer durables — including vehicles, air conditioners, and
refrigerators — find that technological change and pricing strategies of producers lower the cost
of increasing efficiency in response to standards.
1. For the past several decades, the retail price of appliances has been steadily falling while
efficiency has been increasing.
2. Past retail price predictions made by the DOE [U.S. Department of Energy] analysis of
efficiency standards, assuming constant price over time, have tended to overestimate retail
prices.
3. The average incremental price to increase appliance efficiency has declined over time. DOE
technical support documents have typically overestimated the incremental price and retail
prices.
4. Changes in retail markups and economies of scale in production of more efficient appliances
may have contributed to declines in prices of efficiency appliances.27
The more specific point here is that, while regulatory compliance costs have been substantial
and influential, they have not played a significant role in the pricing of vehicles. …
As with any new products or technologies, with time and experience, engineers learn to design
the products to use less space, operate more efficiently, use less material, and facilitate
manufacturing. They also learn to build factories in ways that reduce manufacturing cost. This
has been the experience with semiconductors, computers, cellphones, DVD players, microwave
ovens – and also catalytic converters.
Experience curves, sometimes referred to as “learning curves,” are a useful analytical construct
20
0123456789
10111213
Smal
l '8
2
Med
ium
'82
Larg
e '8
2
Smal
l '9
0
Med
ium
'90
Larg
e '9
0
Smal
l '8
2
Larg
e '8
2
19
82
19
95
19
90
19
75
LEV
I
TLEV
ULE
V I
19
96 T
I
Ph
ase
2 R
VP
RFG
- 1
RFG
-1
Die
sel
Die
sel
Room AC Central AC Refrig Washer Café Fuel Controls
Regulators
Industry
for understanding the magnitude of these improvements. Analysts have long observed that
products show a consistent pattern of cost reduction with increases in cumulative production
volume. …
In the case of emissions, learning improvements have been so substantial, as indicated earlier,
that emission control costs per vehicle (for gasoline internal combustion engine vehicles) are no
greater, and possibly less, than they were in the early 1980s, when emission reductions were far
less.28
A comparative study of European, Japanese, and American automakers, prepared in 2006
before the recent reform and reinvigoration of the U.S. fuel economy program, found that
standards had an effect on technological innovation. The United States had lagged because of a
dormant U.S. standards program and the fact that U.S. automakers did not compete in the world
market for sales (i.e., it did not export vehicles to Europe or Japan, where efficiency was
improving). 29
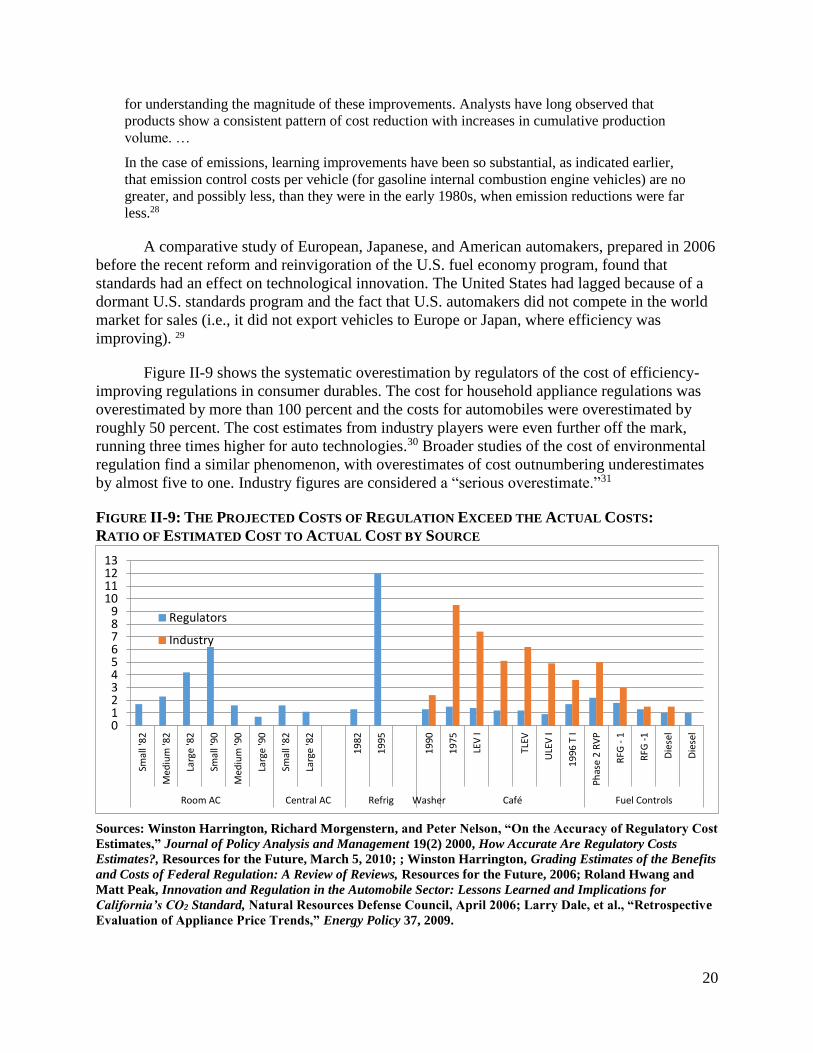
Figure II-9 shows the systematic overestimation by regulators of the cost of efficiency-
improving regulations in consumer durables. The cost for household appliance regulations was
overestimated by more than 100 percent and the costs for automobiles were overestimated by
roughly 50 percent. The cost estimates from industry players were even further off the mark,
running three times higher for auto technologies.30 Broader studies of the cost of environmental
regulation find a similar phenomenon, with overestimates of cost outnumbering underestimates
by almost five to one. Industry figures are considered a “serious overestimate.”31
FIGURE II-9: THE PROJECTED COSTS OF REGULATION EXCEED THE ACTUAL COSTS:
RATIO OF ESTIMATED COST TO ACTUAL COST BY SOURCE
Sources: Winston Harrington, Richard Morgenstern, and Peter Nelson, “On the Accuracy of Regulatory Cost
Estimates,” Journal of Policy Analysis and Management 19(2) 2000, How Accurate Are Regulatory Costs
Estimates?, Resources for the Future, March 5, 2010; ; Winston Harrington, Grading Estimates of the Benefits
and Costs of Federal Regulation: A Review of Reviews, Resources for the Future, 2006; Roland Hwang and
Matt Peak, Innovation and Regulation in the Automobile Sector: Lessons Learned and Implications for
California’s CO2 Standard, Natural Resources Defense Council, April 2006; Larry Dale, et al., “Retrospective
Evaluation of Appliance Price Trends,” Energy Policy 37, 2009.
21
While the very high estimates of compliance costs offered by industry can be readily
dismissed as self-interested political efforts to avoid regulation, they can also be seen as a worst-
case scenario in which the manufacturers take the most irrational approach to compliance under
an assumption that there is no possibility of technological progress or strategic response.
Consistent with the empirical record on cost, a simulation of the cost of the 2008 increase in fuel
economy standards found that a technologically static response was three times more costly than
a technologically astute response. 32
A recent analysis of major appliance standards adopted since 2000 shows a similar, even
stronger pattern. Estimated cost increases are far too high. There may be a number of factors,
beyond an upward bias in the original estimate and learning in the implementation, that produce
this result, including pricing and marketing strategies.33 Thus, the empirical evidence suggests
that efficiency is the least costly low-carbon resource and is likely to remain so at least through
the mid-term. Given the 30-year track record of increasing efficiency and declining cost driven
by technological innovation, there is no reason to believe this will change, even in the long-term.
4. Conclusion
While these traditional studies of the cost of saved energy reach a strong consensus there
are other strands in the literature and factors that should be considered. On the one hand, the
studies of utility-centered efficiency programs show somewhat higher costs. For example, a
review by LBL34 that adds in the administrative costs of these programs yield some results in
range of $0.05/kwh for the residential sector. Since these estimate include administrative costs
of programs that involve significant interventions to stimulate uptake, they may not be
comparable to the resource cost estimates discussed early. In fact, simple rebate programs are
very low in cost. Assumptions about discount rates may also contribute to the higher estimates.
The finding about rebate programs points to another importance consideration. The utility-based
analysis does not include other lower cost approaches, like appliance efficiency standards,
building codes and combined heat and power projects. These can significantly reduce energy
consumption without the heavy implementation costs of utility programs.
On the other hand, over the course of more than a decade the analyses by ACEEE,35
which has repeatedly examined utility-based program show no trend of increase. It continues to
find the range of costs from $0.02 to $0.05 per kWh, with the average around $.025.
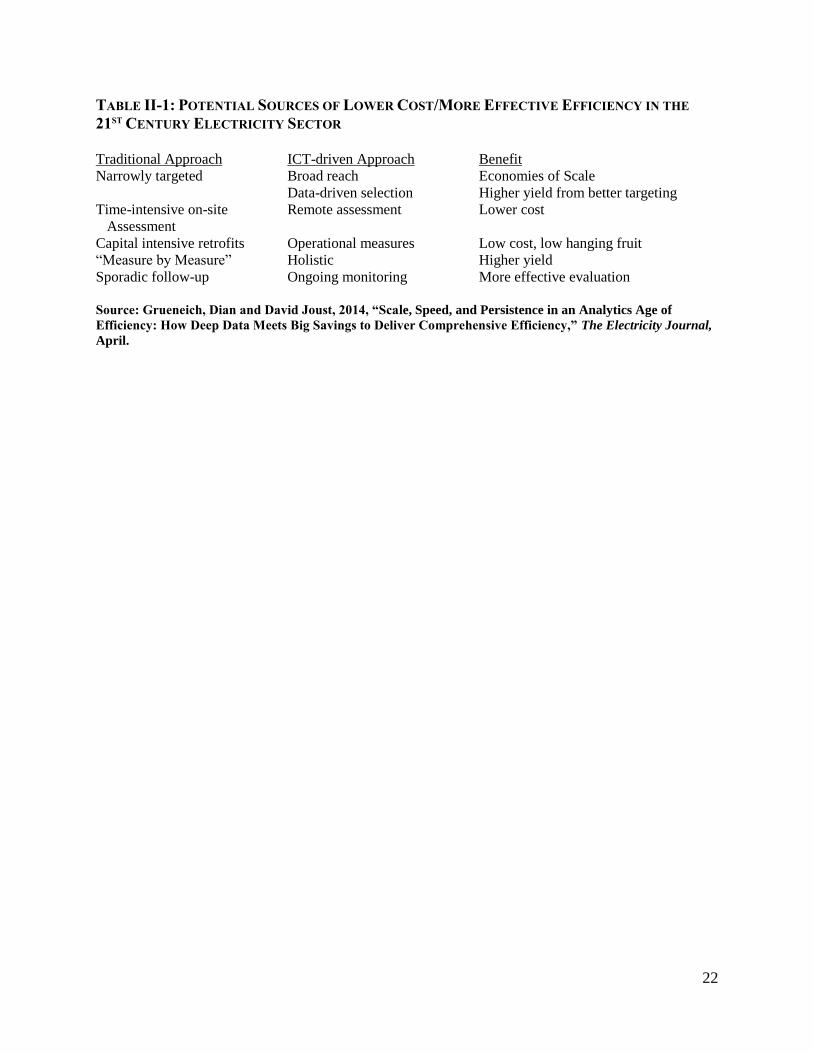
An extension of this argument points out that, while the historic data supports the
hypothesis that there might be mild learning effects and economies of scale working, the
transformation of the electricity sector may have a much larger effect on the cost of efficiency
(see Table III-1). Some have argued that changes in the relationship between the utility and the
customer and the broader range of approaches to efficiency that is made possible by the new ICT
technology could significantly lower costs. A reduction in transaction costs, improved targeting
and better monitoring of results can dramatically lower costs and improve the effectiveness of
efficiency efforts. These effects are similar to the impact of the application of ICT technologies
in other sectors.36
22
TABLE II-1: POTENTIAL SOURCES OF LOWER COST/MORE EFFECTIVE EFFICIENCY IN THE
21ST CENTURY ELECTRICITY SECTOR
Traditional Approach ICT-driven Approach Benefit
Narrowly targeted Broad reach Economies of Scale
Data-driven selection Higher yield from better targeting
Time-intensive on-site Remote assessment Lower cost
Assessment
Capital intensive retrofits Operational measures Low cost, low hanging fruit
“Measure by Measure” Holistic Higher yield
Sporadic follow-up Ongoing monitoring More effective evaluation
Source: Grueneich, Dian and David Joust, 2014, “Scale, Speed, and Persistence in an Analytics Age of
Efficiency: How Deep Data Meets Big Savings to Deliver Comprehensive Efficiency,” The Electricity Journal,
April.
23
III. ECONOMIC RISK
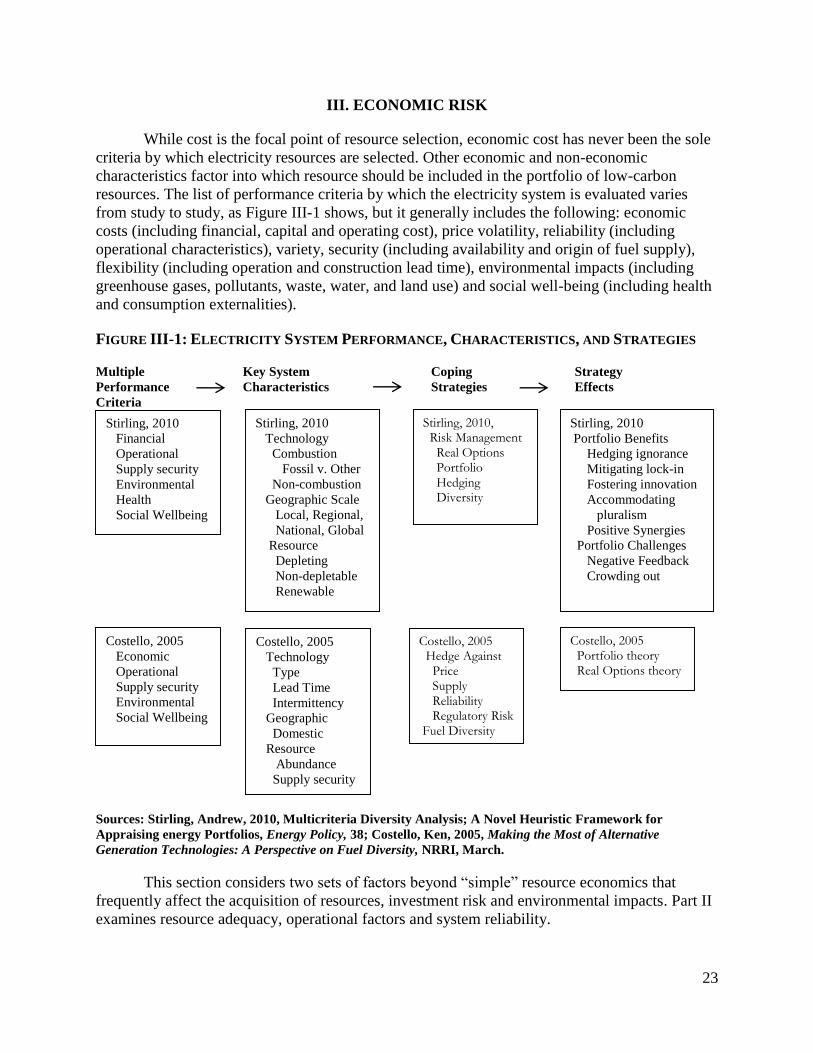
While cost is the focal point of resource selection, economic cost has never been the sole
criteria by which electricity resources are selected. Other economic and non-economic
characteristics factor into which resource should be included in the portfolio of low-carbon
resources. The list of performance criteria by which the electricity system is evaluated varies
from study to study, as Figure III-1 shows, but it generally includes the following: economic
costs (including financial, capital and operating cost), price volatility, reliability (including
operational characteristics), variety, security (including availability and origin of fuel supply),
flexibility (including operation and construction lead time), environmental impacts (including
greenhouse gases, pollutants, waste, water, and land use) and social well-being (including health
and consumption externalities).
FIGURE III-1: ELECTRICITY SYSTEM PERFORMANCE, CHARACTERISTICS, AND STRATEGIES
Multiple Key System Coping Strategy
Performance Characteristics Strategies Effects
Criteria
Sources: Stirling, Andrew, 2010, Multicriteria Diversity Analysis; A Novel Heuristic Framework for
Appraising energy Portfolios, Energy Policy, 38; Costello, Ken, 2005, Making the Most of Alternative
Generation Technologies: A Perspective on Fuel Diversity, NRRI, March.
This section considers two sets of factors beyond “simple” resource economics that
frequently affect the acquisition of resources, investment risk and environmental impacts. Part II
examines resource adequacy, operational factors and system reliability.
Stirling, 2010
Financial
Operational
Supply security
Environmental
Health
Social Wellbeing
Stirling, 2010
Technology
Combustion
Fossil v. Other
Non-combustion
Geographic Scale
Local, Regional,
National, Global
Resource
Depleting
Non-depletable
Renewable
Stirling, 2010
Portfolio Benefits
Hedging ignorance
Mitigating lock-in
Fostering innovation
Accommodating
pluralism
Positive Synergies
Portfolio Challenges
Negative Feedback
Crowding out
Stirling, 2010, Risk Management Real Options Portfolio Hedging Diversity
Costello, 2005
Economic
Operational
Supply security
Environmental
Social Wellbeing
Costello, 2005
Technology
Type
Lead Time
Intermittency
Geographic
Domestic
Resource
Abundance
Supply security
Costello, 2005 Hedge Against Price Supply Reliability Regulatory Risk Fuel Diversity
Costello, 2005 Portfolio theory Real Options theory
24
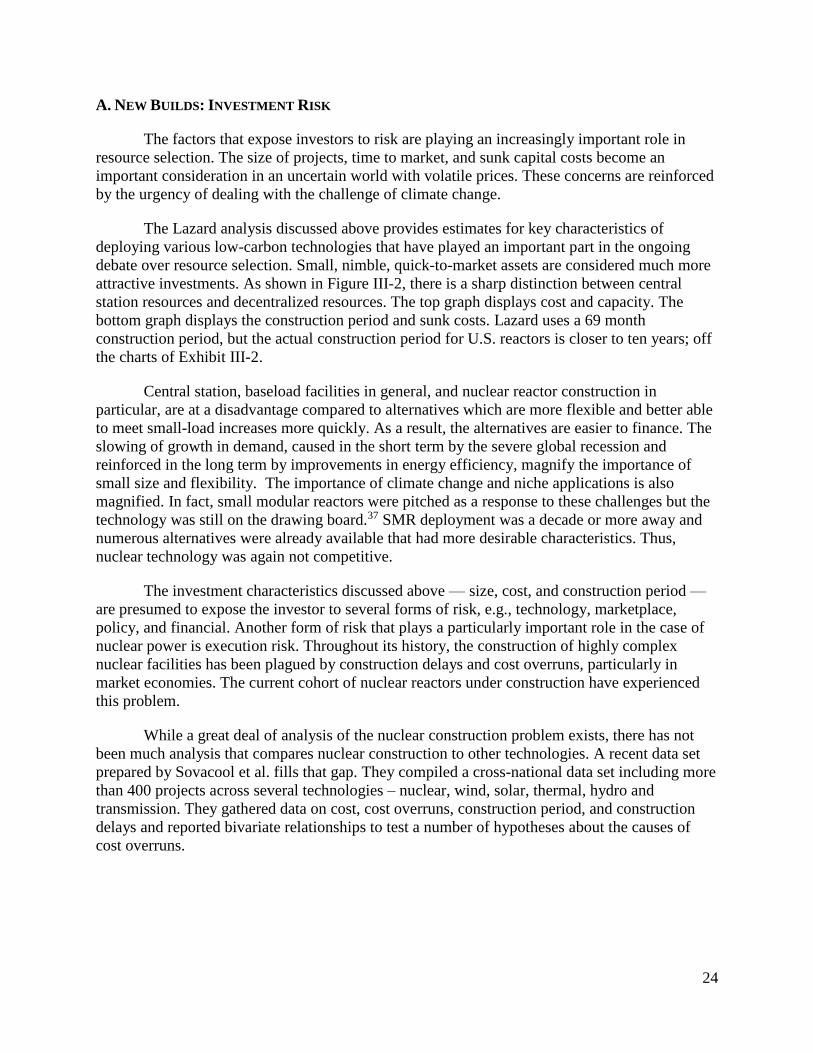
A. NEW BUILDS: INVESTMENT RISK
The factors that expose investors to risk are playing an increasingly important role in
resource selection. The size of projects, time to market, and sunk capital costs become an
important consideration in an uncertain world with volatile prices. These concerns are reinforced
by the urgency of dealing with the challenge of climate change.
The Lazard analysis discussed above provides estimates for key characteristics of
deploying various low-carbon technologies that have played an important part in the ongoing
debate over resource selection. Small, nimble, quick-to-market assets are considered much more
attractive investments. As shown in Figure III-2, there is a sharp distinction between central
station resources and decentralized resources. The top graph displays cost and capacity. The
bottom graph displays the construction period and sunk costs. Lazard uses a 69 month
construction period, but the actual construction period for U.S. reactors is closer to ten years; off
the charts of Exhibit III-2.
Central station, baseload facilities in general, and nuclear reactor construction in
particular, are at a disadvantage compared to alternatives which are more flexible and better able
to meet small-load increases more quickly. As a result, the alternatives are easier to finance. The
slowing of growth in demand, caused in the short term by the severe global recession and
reinforced in the long term by improvements in energy efficiency, magnify the importance of
small size and flexibility. The importance of climate change and niche applications is also
magnified. In fact, small modular reactors were pitched as a response to these challenges but the
technology was still on the drawing board.37 SMR deployment was a decade or more away and
numerous alternatives were already available that had more desirable characteristics. Thus,
nuclear technology was again not competitive.
The investment characteristics discussed above — size, cost, and construction period —
are presumed to expose the investor to several forms of risk, e.g., technology, marketplace,
policy, and financial. Another form of risk that plays a particularly important role in the case of
nuclear power is execution risk. Throughout its history, the construction of highly complex
nuclear facilities has been plagued by construction delays and cost overruns, particularly in
market economies. The current cohort of nuclear reactors under construction have experienced
this problem.
While a great deal of analysis of the nuclear construction problem exists, there has not
been much analysis that compares nuclear construction to other technologies. A recent data set
prepared by Sovacool et al. fills that gap. They compiled a cross-national data set including more
than 400 projects across several technologies – nuclear, wind, solar, thermal, hydro and
transmission. They gathered data on cost, cost overruns, construction period, and construction
delays and reported bivariate relationships to test a number of hypotheses about the causes of
cost overruns.
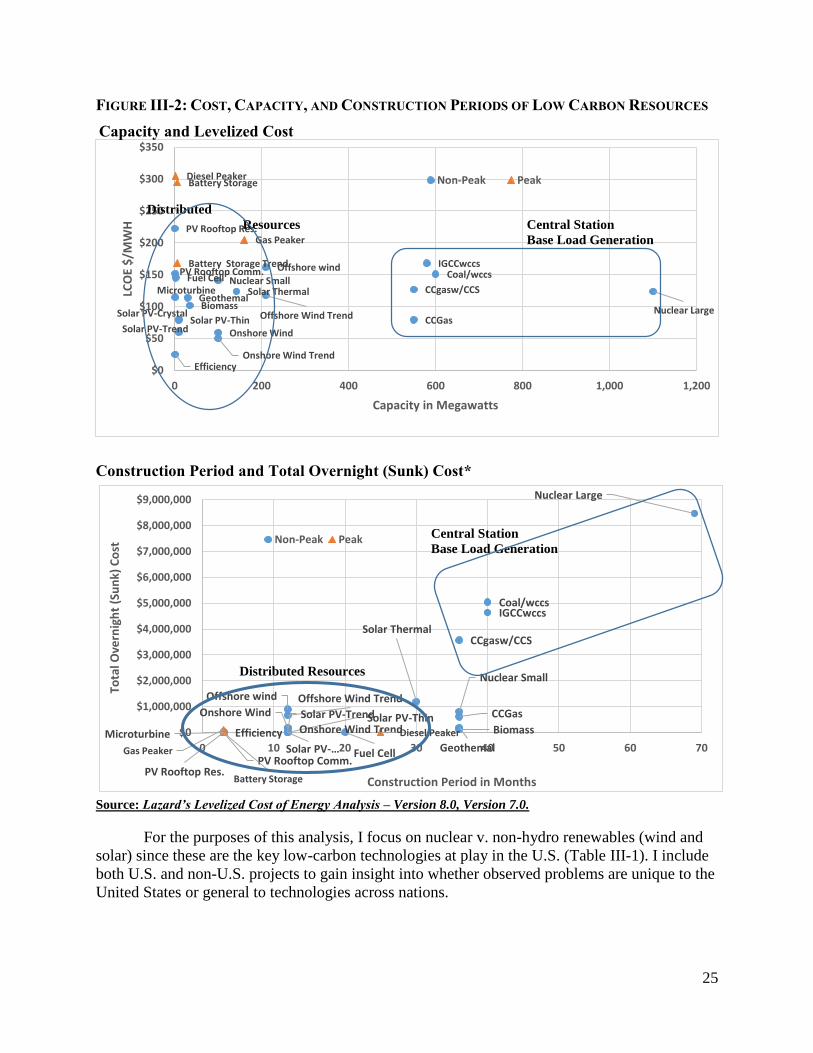
25
Efficiency
Onshore Wind
Onshore Wind Trend
CCGasSolar PV-ThinSolar PV-Crystal
Solar PV-Trend
BiomassGeothemal
Microturbine Solar Thermal CCgasw/CCS
Offshore wind
Offshore Wind Trend Nuclear Large
Nuclear SmallCoal/wccs
IGCCwccs
Fuel CellPV Rooftop Comm.
PV Rooftop Res.
Battery Storage
Battery Storage Trend
Gas Peaker
Diesel Peaker
$0
$50
$100
$150
$200
$250
$300
$350
0 200 400 600 800 1,000 1,200
LCO
E $
/MW
H
Capacity in Megawatts
Non-Peak Peak
Efficiency
Onshore Wind
Onshore Wind Trend
CCGasSolar PV-Thin
Solar PV-…
Solar PV-Trend
Biomass
GeothemalMicroturbine
Solar ThermalCCgasw/CCS
Offshore wind Offshore Wind Trend
Nuclear Large
Nuclear Small
Coal/wccsIGCCwccs
Fuel CellPV Rooftop Comm.
PV Rooftop Res.Battery Storage
Gas Peaker
Diesel Peaker$0
$1,000,000
$2,000,000
$3,000,000
$4,000,000
$5,000,000
$6,000,000
$7,000,000
$8,000,000
$9,000,000
0 10 20 30 40 50 60 70
Tota
l Ove
rnig
ht
(Su
nk)
Co
st
Construction Period in Months
Non-Peak Peak
FIGURE III-2: COST, CAPACITY, AND CONSTRUCTION PERIODS OF LOW CARBON RESOURCES
Capacity and Levelized Cost
Distributed
Resources Central Station
Base Load Generation
Construction Period and Total Overnight (Sunk) Cost*
Central Station
Base Load Generation
Distributed Resources
Source: Lazard’s Levelized Cost of Energy Analysis – Version 8.0, Version 7.0.
For the purposes of this analysis, I focus on nuclear v. non-hydro renewables (wind and
solar) since these are the key low-carbon technologies at play in the U.S. (Table III-1). I include
both U.S. and non-U.S. projects to gain insight into whether observed problems are unique to the
United States or general to technologies across nations.
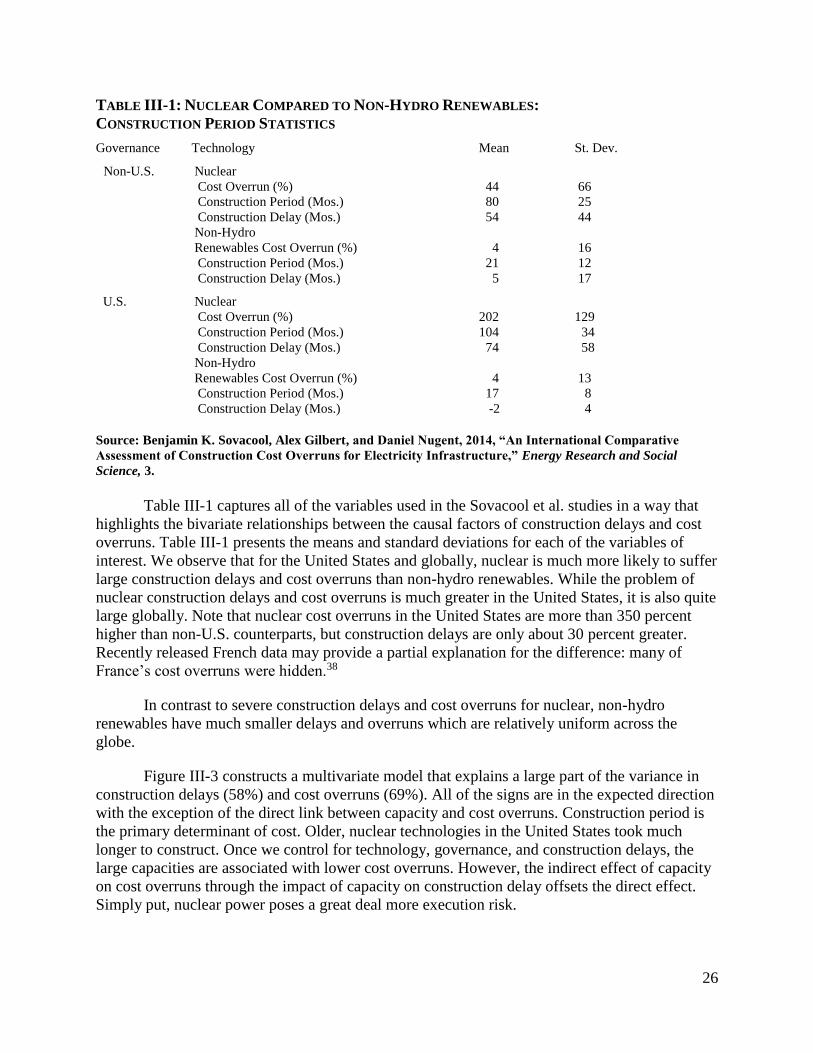
26
TABLE III-1: NUCLEAR COMPARED TO NON-HYDRO RENEWABLES:
CONSTRUCTION PERIOD STATISTICS
Governance Technology Mean St. Dev.
Non-U.S. Nuclear Cost Overrun (%) 44 66 Construction Period (Mos.) 80 25 Construction Delay (Mos.) 54 44 Non-Hydro Renewables Cost Overrun (%) 4 16 Construction Period (Mos.) 21 12 Construction Delay (Mos.) 5 17
U.S. Nuclear Cost Overrun (%) 202 129 Construction Period (Mos.) 104 34 Construction Delay (Mos.) 74 58 Non-Hydro Renewables Cost Overrun (%) 4 13 Construction Period (Mos.) 17 8 Construction Delay (Mos.) -2 4
Source: Benjamin K. Sovacool, Alex Gilbert, and Daniel Nugent, 2014, “An International Comparative
Assessment of Construction Cost Overruns for Electricity Infrastructure,” Energy Research and Social
Science, 3.
Table III-1 captures all of the variables used in the Sovacool et al. studies in a way that
highlights the bivariate relationships between the causal factors of construction delays and cost
overruns. Table III-1 presents the means and standard deviations for each of the variables of
interest. We observe that for the United States and globally, nuclear is much more likely to suffer
large construction delays and cost overruns than non-hydro renewables. While the problem of
nuclear construction delays and cost overruns is much greater in the United States, it is also quite
large globally. Note that nuclear cost overruns in the United States are more than 350 percent
higher than non-U.S. counterparts, but construction delays are only about 30 percent greater.
Recently released French data may provide a partial explanation for the difference: many of
France’s cost overruns were hidden.38
In contrast to severe construction delays and cost overruns for nuclear, non-hydro
renewables have much smaller delays and overruns which are relatively uniform across the
globe.
Figure III-3 constructs a multivariate model that explains a large part of the variance in
construction delays (58%) and cost overruns (69%). All of the signs are in the expected direction
with the exception of the direct link between capacity and cost overruns. Construction period is
the primary determinant of cost. Older, nuclear technologies in the United States took much
longer to construct. Once we control for technology, governance, and construction delays, the
large capacities are associated with lower cost overruns. However, the indirect effect of capacity
on cost overruns through the impact of capacity on construction delay offsets the direct effect.
Simply put, nuclear power poses a great deal more execution risk.
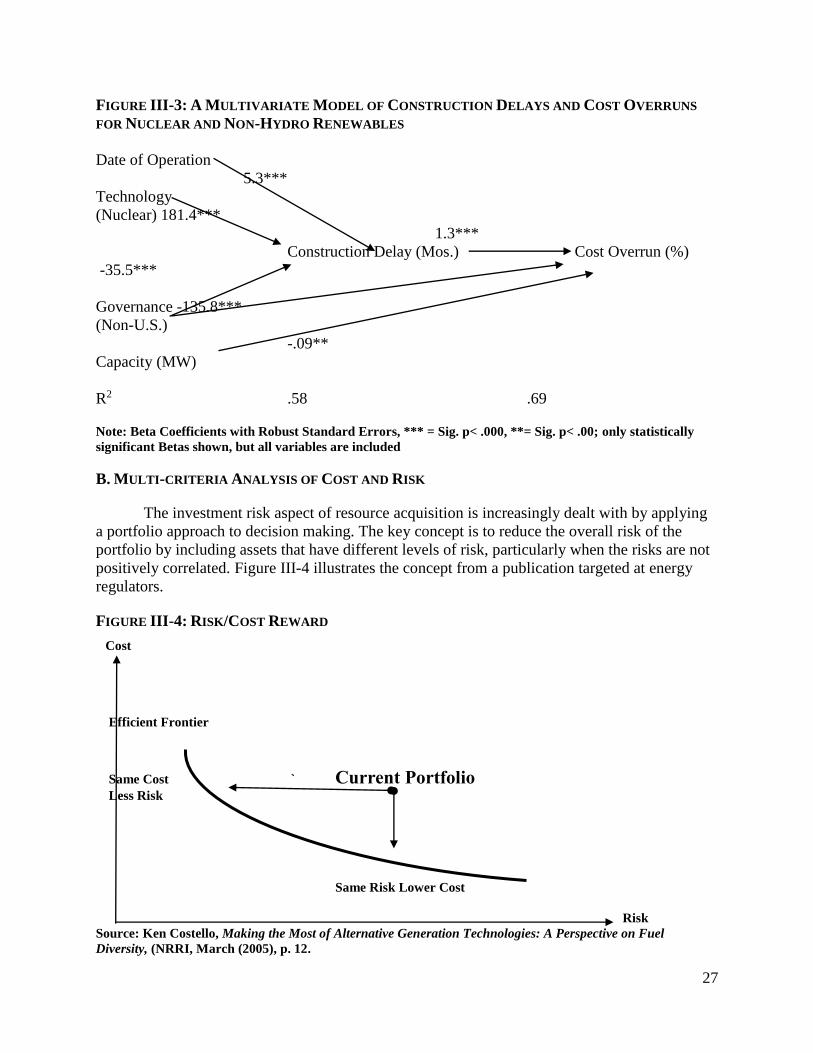
27
FIGURE III-3: A MULTIVARIATE MODEL OF CONSTRUCTION DELAYS AND COST OVERRUNS
FOR NUCLEAR AND NON-HYDRO RENEWABLES
Date of Operation
5.3***
Technology
(Nuclear) 181.4***
1.3***
Construction Delay (Mos.) Cost Overrun (%)
-35.5***
Governance -135.8***
(Non-U.S.)
-.09**
Capacity (MW)
R2 .58 .69
Note: Beta Coefficients with Robust Standard Errors, *** = Sig. p< .000, **= Sig. p< .00; only statistically
significant Betas shown, but all variables are included
B. MULTI-CRITERIA ANALYSIS OF COST AND RISK
The investment risk aspect of resource acquisition is increasingly dealt with by applying
a portfolio approach to decision making. The key concept is to reduce the overall risk of the
portfolio by including assets that have different levels of risk, particularly when the risks are not
positively correlated. Figure III-4 illustrates the concept from a publication targeted at energy
regulators.
FIGURE III-4: RISK/COST REWARD
Cost
Efficient Frontier
Same Cost ` Current Portfolio
Less Risk
Same Risk Lower Cost
Risk
Source: Ken Costello, Making the Most of Alternative Generation Technologies: A Perspective on Fuel
Diversity, (NRRI, March (2005), p. 12.
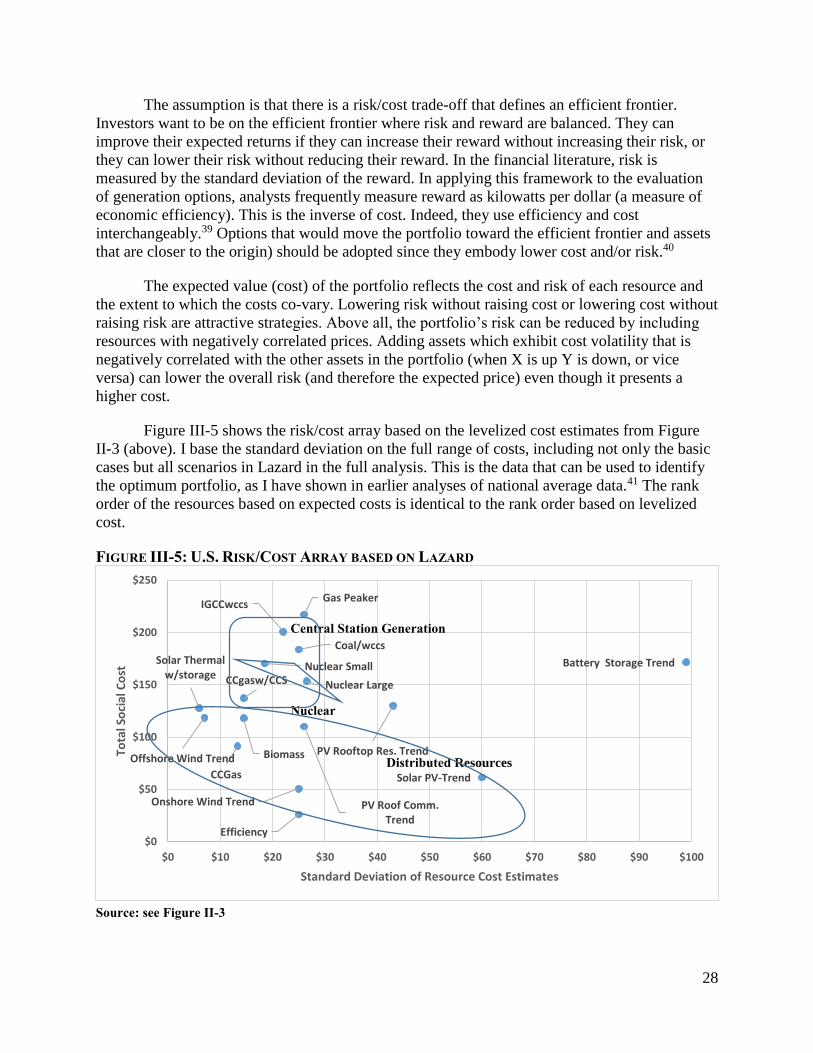
28
Solar Thermal w/storage
Offshore Wind Trend
CCGas
Biomass
CCgasw/CCSNuclear Small
IGCCwccs
Efficiency
Onshore Wind Trend
Coal/wccs
PV Roof Comm. Trend
Gas Peaker
Nuclear Large
PV Rooftop Res. Trend
Solar PV-Trend
Battery Storage Trend
$0
$50
$100
$150
$200
$250
$0 $10 $20 $30 $40 $50 $60 $70 $80 $90 $100
Tota
l So
cial
Co
st
Standard Deviation of Resource Cost Estimates
The assumption is that there is a risk/cost trade-off that defines an efficient frontier.
Investors want to be on the efficient frontier where risk and reward are balanced. They can
improve their expected returns if they can increase their reward without increasing their risk, or
they can lower their risk without reducing their reward. In the financial literature, risk is
measured by the standard deviation of the reward. In applying this framework to the evaluation
of generation options, analysts frequently measure reward as kilowatts per dollar (a measure of
economic efficiency). This is the inverse of cost. Indeed, they use efficiency and cost
interchangeably.39 Options that would move the portfolio toward the efficient frontier and assets
that are closer to the origin) should be adopted since they embody lower cost and/or risk.40
The expected value (cost) of the portfolio reflects the cost and risk of each resource and
the extent to which the costs co-vary. Lowering risk without raising cost or lowering cost without
raising risk are attractive strategies. Above all, the portfolio’s risk can be reduced by including
resources with negatively correlated prices. Adding assets which exhibit cost volatility that is
negatively correlated with the other assets in the portfolio (when X is up Y is down, or vice
versa) can lower the overall risk (and therefore the expected price) even though it presents a
higher cost.
Figure III-5 shows the risk/cost array based on the levelized cost estimates from Figure
II-3 (above). I base the standard deviation on the full range of costs, including not only the basic
cases but all scenarios in Lazard in the full analysis. This is the data that can be used to identify
the optimum portfolio, as I have shown in earlier analyses of national average data.41 The rank
order of the resources based on expected costs is identical to the rank order based on levelized
cost.
FIGURE III-5: U.S. RISK/COST ARRAY BASED ON LAZARD
Central Station Generation
Nuclear
Distributed Resources
Source: see Figure II-3
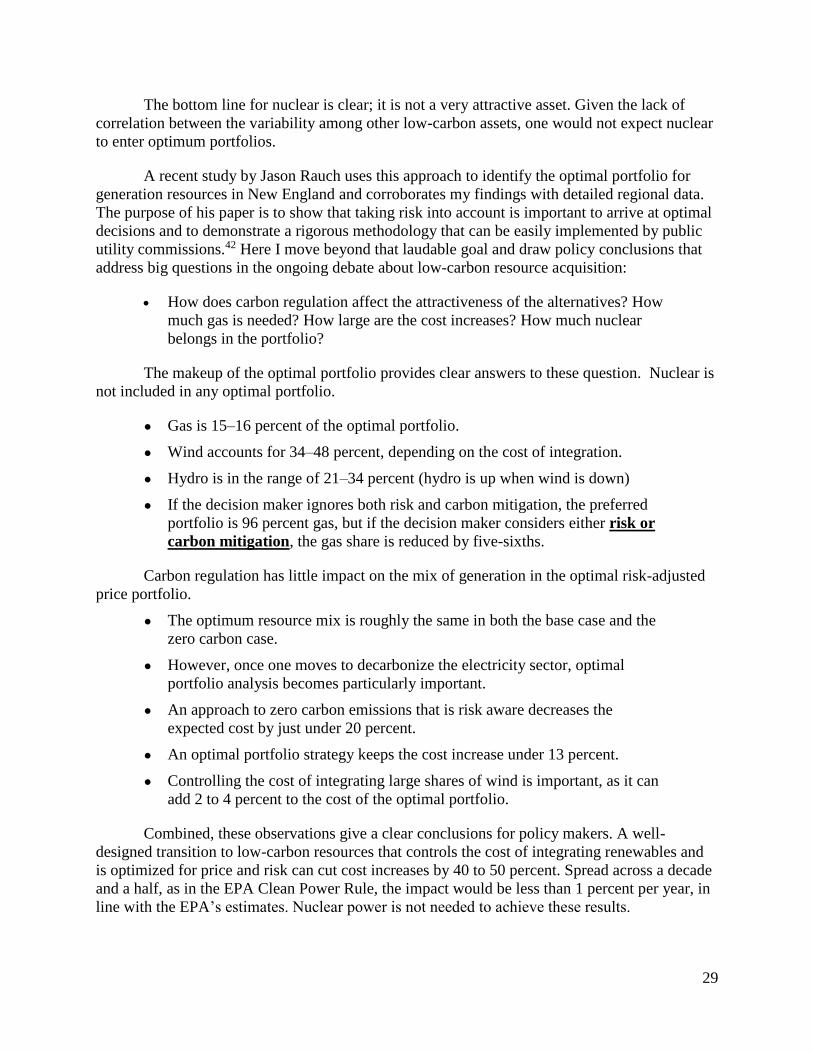
29
The bottom line for nuclear is clear; it is not a very attractive asset. Given the lack of
correlation between the variability among other low-carbon assets, one would not expect nuclear
to enter optimum portfolios.
A recent study by Jason Rauch uses this approach to identify the optimal portfolio for
generation resources in New England and corroborates my findings with detailed regional data.
The purpose of his paper is to show that taking risk into account is important to arrive at optimal
decisions and to demonstrate a rigorous methodology that can be easily implemented by public
utility commissions.42 Here I move beyond that laudable goal and draw policy conclusions that
address big questions in the ongoing debate about low-carbon resource acquisition:
How does carbon regulation affect the attractiveness of the alternatives? How
much gas is needed? How large are the cost increases? How much nuclear
belongs in the portfolio?
The makeup of the optimal portfolio provides clear answers to these question. Nuclear is
not included in any optimal portfolio.
● Gas is 15–16 percent of the optimal portfolio.
● Wind accounts for 34–48 percent, depending on the cost of integration.
● Hydro is in the range of 21–34 percent (hydro is up when wind is down)
● If the decision maker ignores both risk and carbon mitigation, the preferred
portfolio is 96 percent gas, but if the decision maker considers either risk or
carbon mitigation, the gas share is reduced by five-sixths.
Carbon regulation has little impact on the mix of generation in the optimal risk-adjusted
price portfolio.
● The optimum resource mix is roughly the same in both the base case and the
zero carbon case.
● However, once one moves to decarbonize the electricity sector, optimal
portfolio analysis becomes particularly important.
● An approach to zero carbon emissions that is risk aware decreases the
expected cost by just under 20 percent.
● An optimal portfolio strategy keeps the cost increase under 13 percent.
● Controlling the cost of integrating large shares of wind is important, as it can
add 2 to 4 percent to the cost of the optimal portfolio.
Combined, these observations give a clear conclusions for policy makers. A well-
designed transition to low-carbon resources that controls the cost of integrating renewables and
is optimized for price and risk can cut cost increases by 40 to 50 percent. Spread across a decade
and a half, as in the EPA Clean Power Rule, the impact would be less than 1 percent per year, in
line with the EPA’s estimates. Nuclear power is not needed to achieve these results.
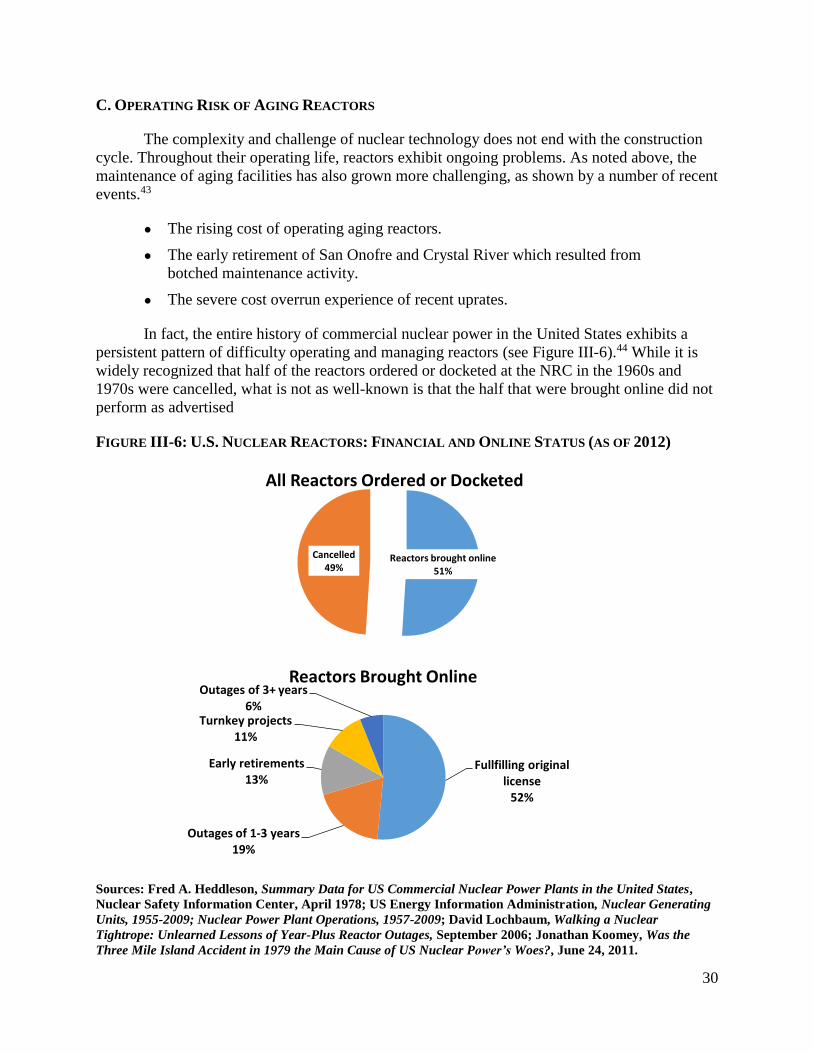
30
Reactors brought online 51%
Cancelled49%
All Reactors Ordered or Docketed
Fullfilling original license
52%
Outages of 1-3 years19%
Early retirements13%
Turnkey projects 11%
Outages of 3+ years6%
Reactors Brought Online
C. OPERATING RISK OF AGING REACTORS
The complexity and challenge of nuclear technology does not end with the construction
cycle. Throughout their operating life, reactors exhibit ongoing problems. As noted above, the
maintenance of aging facilities has also grown more challenging, as shown by a number of recent
events.43
● The rising cost of operating aging reactors.
● The early retirement of San Onofre and Crystal River which resulted from
botched maintenance activity.
● The severe cost overrun experience of recent uprates.
In fact, the entire history of commercial nuclear power in the United States exhibits a
persistent pattern of difficulty operating and managing reactors (see Figure III-6).44 While it is
widely recognized that half of the reactors ordered or docketed at the NRC in the 1960s and
1970s were cancelled, what is not as well-known is that the half that were brought online did not
perform as advertised
FIGURE III-6: U.S. NUCLEAR REACTORS: FINANCIAL AND ONLINE STATUS (AS OF 2012)
Sources: Fred A. Heddleson, Summary Data for US Commercial Nuclear Power Plants in the United States,
Nuclear Safety Information Center, April 1978; US Energy Information Administration, Nuclear Generating
Units, 1955-2009; Nuclear Power Plant Operations, 1957-2009; David Lochbaum, Walking a Nuclear
Tightrope: Unlearned Lessons of Year-Plus Reactor Outages, September 2006; Jonathan Koomey, Was the
Three Mile Island Accident in 1979 the Main Cause of US Nuclear Power’s Woes?, June 24, 2011.
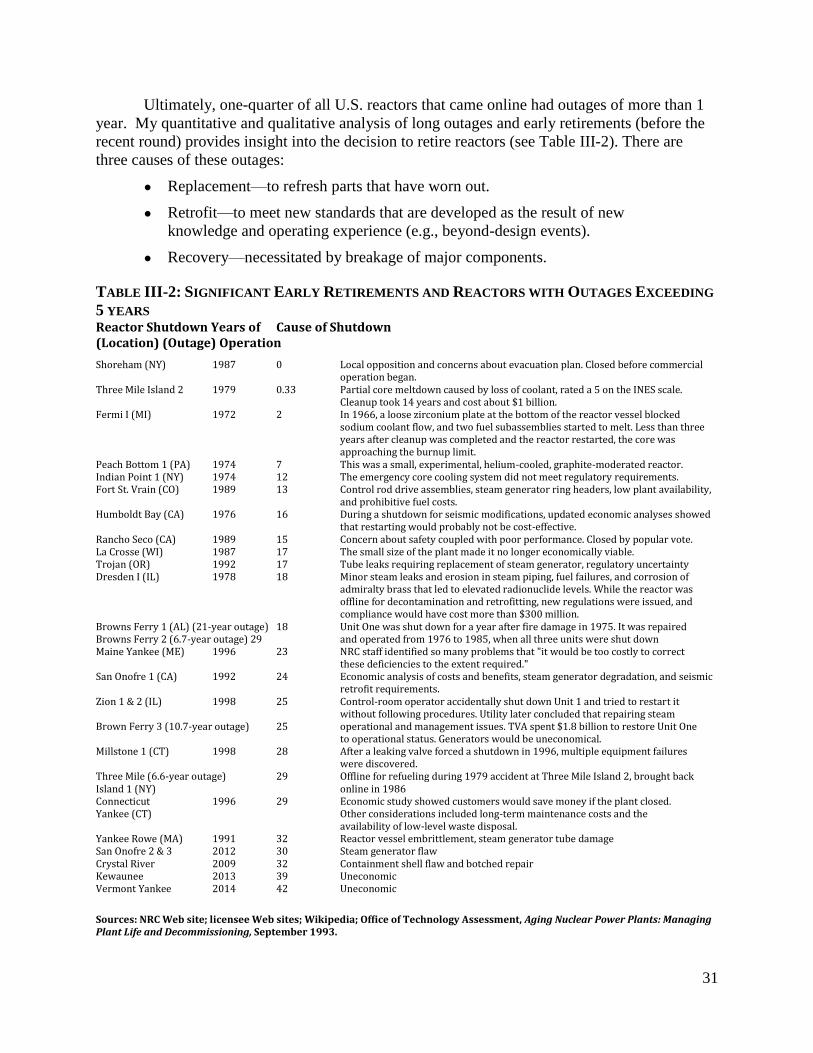
31
Ultimately, one-quarter of all U.S. reactors that came online had outages of more than 1
year. My quantitative and qualitative analysis of long outages and early retirements (before the
recent round) provides insight into the decision to retire reactors (see Table III-2). There are
three causes of these outages:
● Replacement—to refresh parts that have worn out.
● Retrofit—to meet new standards that are developed as the result of new
knowledge and operating experience (e.g., beyond-design events).
● Recovery—necessitated by breakage of major components.
TABLE III-2: SIGNIFICANT EARLY RETIREMENTS AND REACTORS WITH OUTAGES EXCEEDING
5 YEARS Reactor Shutdown Years of Cause of Shutdown (Location) (Outage) Operation
Shoreham (NY) 1987 0 Local opposition and concerns about evacuation plan. Closed before commercial operation began. Three Mile Island 2 1979 0.33 Partial core meltdown caused by loss of coolant, rated a 5 on the INES scale. Cleanup took 14 years and cost about $1 billion. Fermi I (MI) 1972 2 In 1966, a loose zirconium plate at the bottom of the reactor vessel blocked sodium coolant flow, and two fuel subassemblies started to melt. Less than three years after cleanup was completed and the reactor restarted, the core was approaching the burnup limit. Peach Bottom 1 (PA) 1974 7 This was a small, experimental, helium-cooled, graphite-moderated reactor. Indian Point 1 (NY) 1974 12 The emergency core cooling system did not meet regulatory requirements. Fort St. Vrain (CO) 1989 13 Control rod drive assemblies, steam generator ring headers, low plant availability,
and prohibitive fuel costs. Humboldt Bay (CA) 1976 16 During a shutdown for seismic modifications, updated economic analyses showed
that restarting would probably not be cost-effective. Rancho Seco (CA) 1989 15 Concern about safety coupled with poor performance. Closed by popular vote. La Crosse (WI) 1987 17 The small size of the plant made it no longer economically viable. Trojan (OR) 1992 17 Tube leaks requiring replacement of steam generator, regulatory uncertainty Dresden I (IL) 1978 18 Minor steam leaks and erosion in steam piping, fuel failures, and corrosion of admiralty brass that led to elevated radionuclide levels. While the reactor was offline for decontamination and retrofitting, new regulations were issued, and compliance would have cost more than $300 million. Browns Ferry 1 (AL) (21-year outage) 18 Unit One was shut down for a year after fire damage in 1975. It was repaired Browns Ferry 2 (6.7-year outage) 29 and operated from 1976 to 1985, when all three units were shut down Maine Yankee (ME) 1996 23 NRC staff identified so many problems that "it would be too costly to correct these deficiencies to the extent required." San Onofre 1 (CA) 1992 24 Economic analysis of costs and benefits, steam generator degradation, and seismic
retrofit requirements. Zion 1 & 2 (IL) 1998 25 Control-room operator accidentally shut down Unit 1 and tried to restart it
without following procedures. Utility later concluded that repairing steam Brown Ferry 3 (10.7-year outage) 25 operational and management issues. TVA spent $1.8 billion to restore Unit One
to operational status. Generators would be uneconomical. Millstone 1 (CT) 1998 28 After a leaking valve forced a shutdown in 1996, multiple equipment failures were discovered. Three Mile (6.6-year outage) 29 Offline for refueling during 1979 accident at Three Mile Island 2, brought back Island 1 (NY) online in 1986 Connecticut 1996 29 Economic study showed customers would save money if the plant closed. Yankee (CT) Other considerations included long-term maintenance costs and the availability of low-level waste disposal. Yankee Rowe (MA) 1991 32 Reactor vessel embrittlement, steam generator tube damage San Onofre 2 & 3 2012 30 Steam generator flaw Crystal River 2009 32 Containment shell flaw and botched repair Kewaunee 2013 39 Uneconomic Vermont Yankee 2014 42 Uneconomic Sources: NRC Web site; licensee Web sites; Wikipedia; Office of Technology Assessment, Aging Nuclear Power Plants: Managing Plant Life and Decommissioning, September 1993.
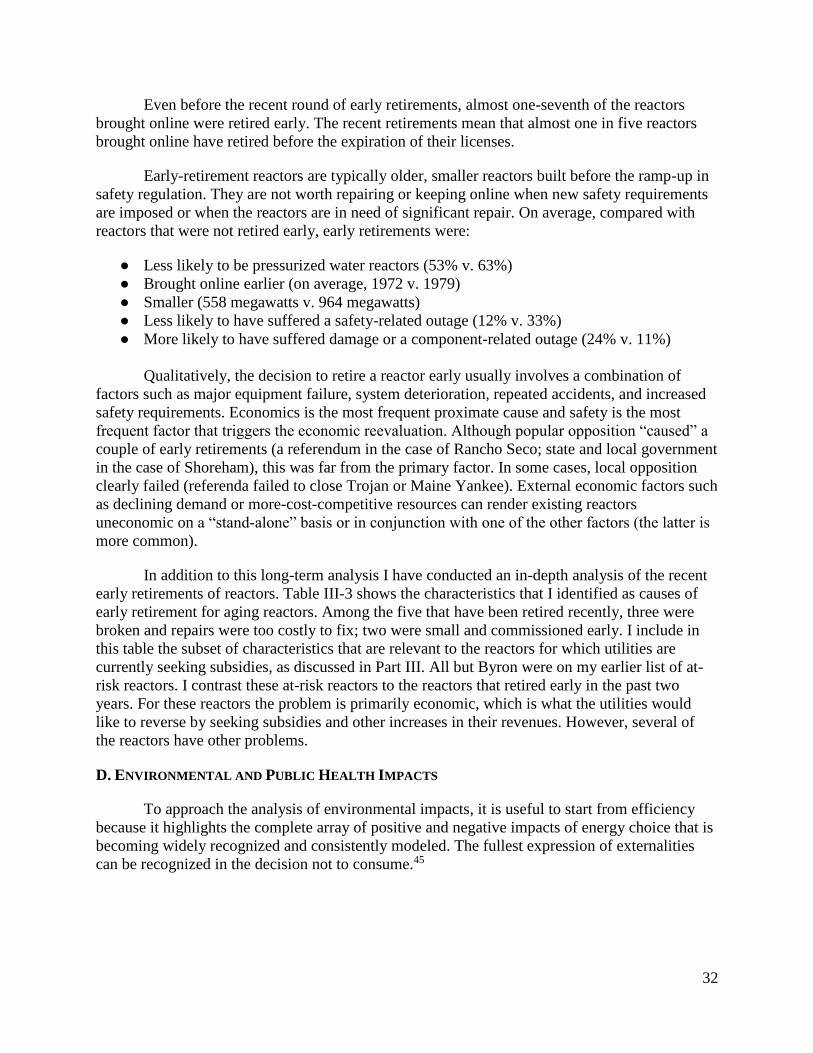
32
Even before the recent round of early retirements, almost one-seventh of the reactors
brought online were retired early. The recent retirements mean that almost one in five reactors
brought online have retired before the expiration of their licenses.
Early-retirement reactors are typically older, smaller reactors built before the ramp-up in
safety regulation. They are not worth repairing or keeping online when new safety requirements
are imposed or when the reactors are in need of significant repair. On average, compared with
reactors that were not retired early, early retirements were:
● Less likely to be pressurized water reactors (53% v. 63%)
● Brought online earlier (on average, 1972 v. 1979)
● Smaller (558 megawatts v. 964 megawatts)
● Less likely to have suffered a safety-related outage (12% v. 33%)
● More likely to have suffered damage or a component-related outage (24% v. 11%)
Qualitatively, the decision to retire a reactor early usually involves a combination of
factors such as major equipment failure, system deterioration, repeated accidents, and increased
safety requirements. Economics is the most frequent proximate cause and safety is the most
frequent factor that triggers the economic reevaluation. Although popular opposition “caused” a
couple of early retirements (a referendum in the case of Rancho Seco; state and local government
in the case of Shoreham), this was far from the primary factor. In some cases, local opposition
clearly failed (referenda failed to close Trojan or Maine Yankee). External economic factors such
as declining demand or more-cost-competitive resources can render existing reactors
uneconomic on a “stand-alone” basis or in conjunction with one of the other factors (the latter is
more common).
In addition to this long-term analysis I have conducted an in-depth analysis of the recent
early retirements of reactors. Table III-3 shows the characteristics that I identified as causes of
early retirement for aging reactors. Among the five that have been retired recently, three were
broken and repairs were too costly to fix; two were small and commissioned early. I include in
this table the subset of characteristics that are relevant to the reactors for which utilities are
currently seeking subsidies, as discussed in Part III. All but Byron were on my earlier list of at-
risk reactors. I contrast these at-risk reactors to the reactors that retired early in the past two
years. For these reactors the problem is primarily economic, which is what the utilities would
like to reverse by seeking subsidies and other increases in their revenues. However, several of
the reactors have other problems.
D. ENVIRONMENTAL AND PUBLIC HEALTH IMPACTS
To approach the analysis of environmental impacts, it is useful to start from efficiency
because it highlights the complete array of positive and negative impacts of energy choice that is
becoming widely recognized and consistently modeled. The fullest expression of externalities
can be recognized in the decision not to consume.45
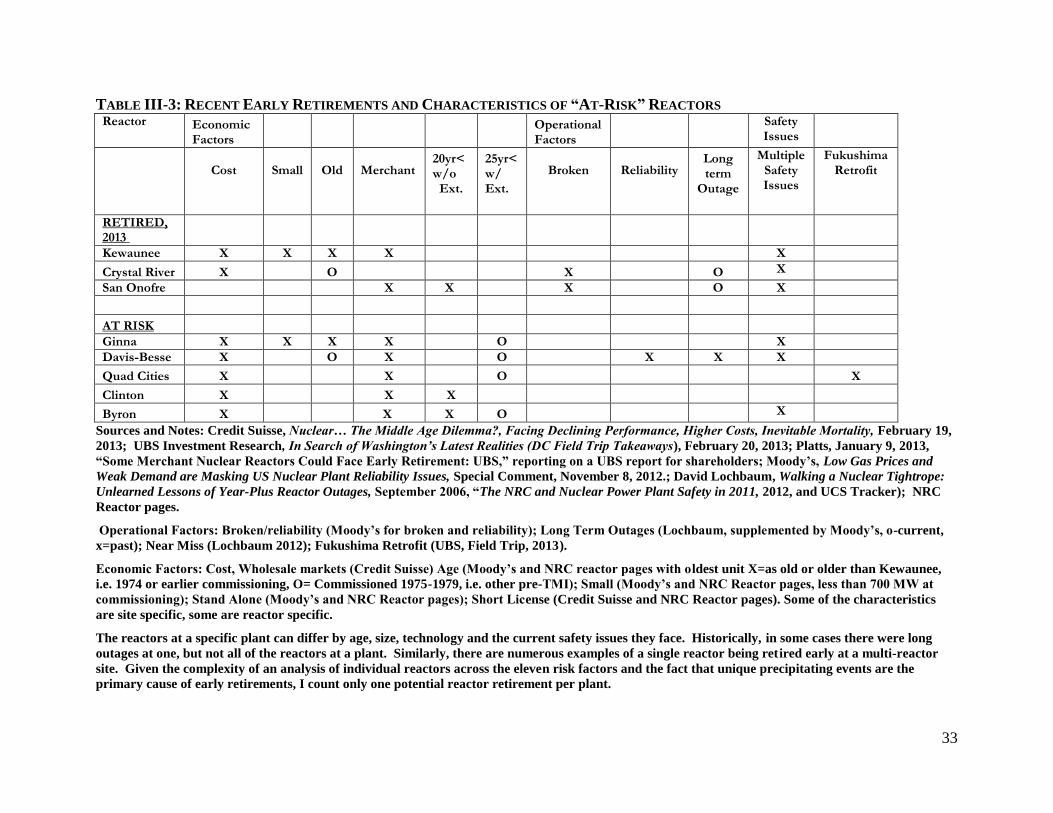
33
TABLE III-3: RECENT EARLY RETIREMENTS AND CHARACTERISTICS OF “AT-RISK” REACTORS Reactor
Economic Factors
Operational Factors
Safety Issues
Cost
Small
Old
Merchant
20yr<w/o
Ext.
25yr< w/ Ext.
Broken
Reliability
Long term
Outage
Multiple Safety Issues
Fukushima Retrofit
RETIRED, 2013
Kewaunee X X X X X
Crystal River X O X O X San Onofre X X X O X
AT RISK Ginna X X X X O X Davis-Besse X O X O X X X
Quad Cities X X O X
Clinton X X X
Byron X X X O X Sources and Notes: Credit Suisse, Nuclear… The Middle Age Dilemma?, Facing Declining Performance, Higher Costs, Inevitable Mortality, February 19,
2013; UBS Investment Research, In Search of Washington’s Latest Realities (DC Field Trip Takeaways), February 20, 2013; Platts, January 9, 2013,
“Some Merchant Nuclear Reactors Could Face Early Retirement: UBS,” reporting on a UBS report for shareholders; Moody’s, Low Gas Prices and
Weak Demand are Masking US Nuclear Plant Reliability Issues, Special Comment, November 8, 2012.; David Lochbaum, Walking a Nuclear Tightrope:
Unlearned Lessons of Year-Plus Reactor Outages, September 2006, “The NRC and Nuclear Power Plant Safety in 2011, 2012, and UCS Tracker); NRC
Reactor pages.
Operational Factors: Broken/reliability (Moody’s for broken and reliability); Long Term Outages (Lochbaum, supplemented by Moody’s, o-current,
x=past); Near Miss (Lochbaum 2012); Fukushima Retrofit (UBS, Field Trip, 2013).
Economic Factors: Cost, Wholesale markets (Credit Suisse) Age (Moody’s and NRC reactor pages with oldest unit X=as old or older than Kewaunee,
i.e. 1974 or earlier commissioning, O= Commissioned 1975-1979, i.e. other pre-TMI); Small (Moody’s and NRC Reactor pages, less than 700 MW at
commissioning); Stand Alone (Moody’s and NRC Reactor pages); Short License (Credit Suisse and NRC Reactor pages). Some of the characteristics
are site specific, some are reactor specific.
The reactors at a specific plant can differ by age, size, technology and the current safety issues they face. Historically, in some cases there were long
outages at one, but not all of the reactors at a plant. Similarly, there are numerous examples of a single reactor being retired early at a multi-reactor
site. Given the complexity of an analysis of individual reactors across the eleven risk factors and the fact that unique precipitating events are the
primary cause of early retirements, I count only one potential reactor retirement per plant.
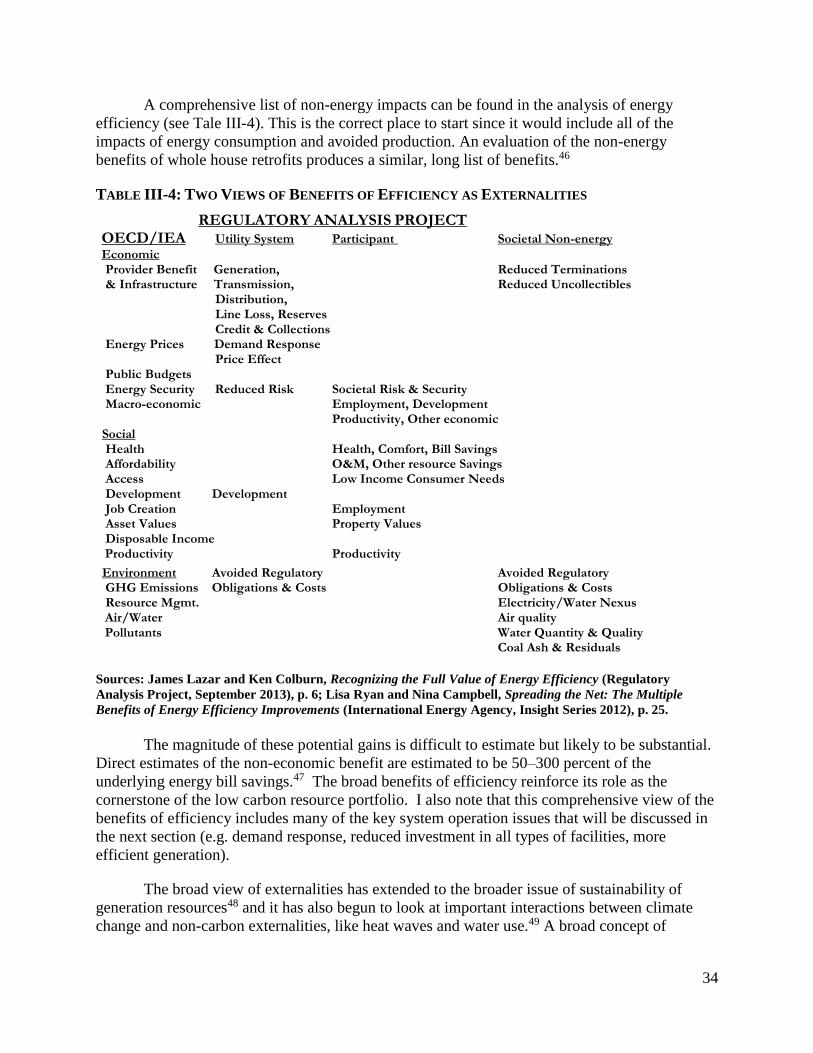
34
A comprehensive list of non-energy impacts can be found in the analysis of energy
efficiency (see Tale III-4). This is the correct place to start since it would include all of the
impacts of energy consumption and avoided production. An evaluation of the non-energy
benefits of whole house retrofits produces a similar, long list of benefits.46
TABLE III-4: TWO VIEWS OF BENEFITS OF EFFICIENCY AS EXTERNALITIES
REGULATORY ANALYSIS PROJECT OECD/IEA Utility System Participant Societal Non-energy Economic Provider Benefit Generation, Reduced Terminations & Infrastructure Transmission, Reduced Uncollectibles Distribution, Line Loss, Reserves Credit & Collections Energy Prices Demand Response Price Effect Public Budgets Energy Security Reduced Risk Societal Risk & Security Macro-economic Employment, Development Productivity, Other economic Social Health Health, Comfort, Bill Savings Affordability O&M, Other resource Savings Access Low Income Consumer Needs Development Development Job Creation Employment Asset Values Property Values Disposable Income Productivity Productivity
Environment Avoided Regulatory Avoided Regulatory GHG Emissions Obligations & Costs Obligations & Costs Resource Mgmt. Electricity/Water Nexus Air/Water Air quality Pollutants Water Quantity & Quality Coal Ash & Residuals
Sources: James Lazar and Ken Colburn, Recognizing the Full Value of Energy Efficiency (Regulatory
Analysis Project, September 2013), p. 6; Lisa Ryan and Nina Campbell, Spreading the Net: The Multiple
Benefits of Energy Efficiency Improvements (International Energy Agency, Insight Series 2012), p. 25.
The magnitude of these potential gains is difficult to estimate but likely to be substantial.
Direct estimates of the non-economic benefit are estimated to be 50–300 percent of the
underlying energy bill savings.47 The broad benefits of efficiency reinforce its role as the
cornerstone of the low carbon resource portfolio. I also note that this comprehensive view of the
benefits of efficiency includes many of the key system operation issues that will be discussed in
the next section (e.g. demand response, reduced investment in all types of facilities, more
efficient generation).
The broad view of externalities has extended to the broader issue of sustainability of
generation resources48 and it has also begun to look at important interactions between climate
change and non-carbon externalities, like heat waves and water use.49 A broad concept of
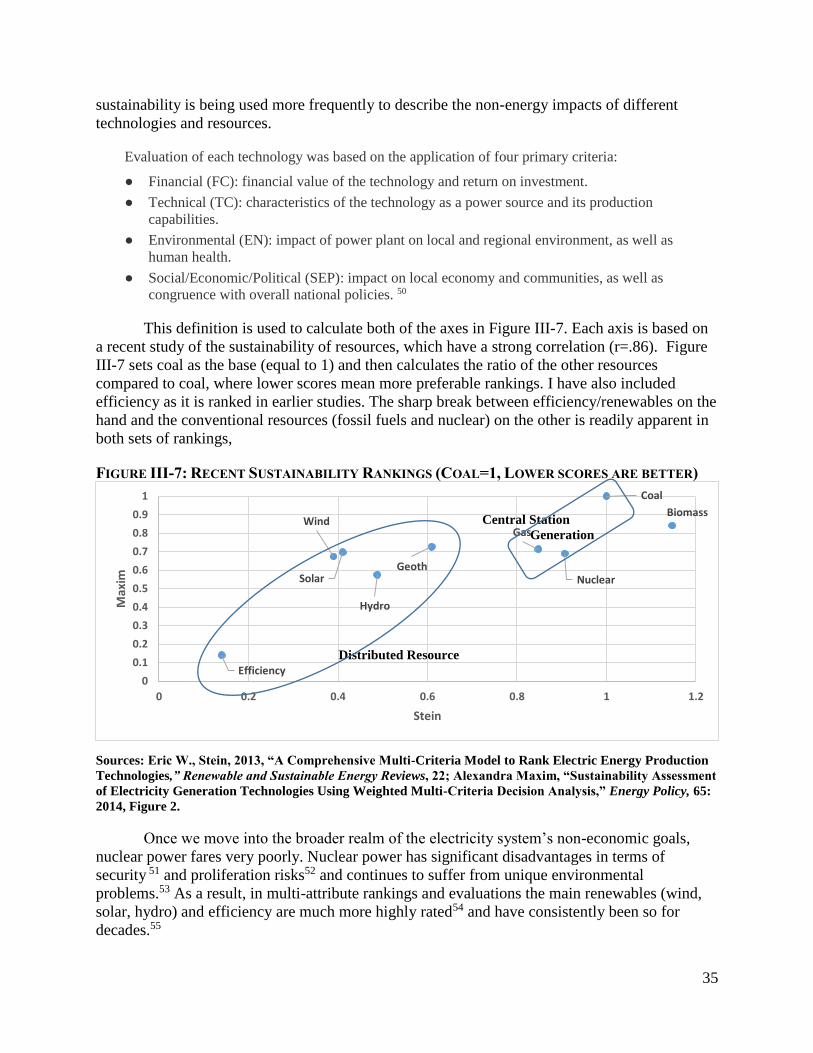
35
Wind
Solar
Hydro
Geoth
Gas
Nuclear
Coal
Biomass
Efficiency0
0.1
0.2
0.3
0.4
0.5
0.6
0.7
0.8
0.9
1
0 0.2 0.4 0.6 0.8 1 1.2
Max
im
Stein
sustainability is being used more frequently to describe the non-energy impacts of different
technologies and resources.
Evaluation of each technology was based on the application of four primary criteria:
● Financial (FC): financial value of the technology and return on investment.
● Technical (TC): characteristics of the technology as a power source and its production
capabilities.
● Environmental (EN): impact of power plant on local and regional environment, as well as
human health.
● Social/Economic/Political (SEP): impact on local economy and communities, as well as
congruence with overall national policies. 50
This definition is used to calculate both of the axes in Figure III-7. Each axis is based on
a recent study of the sustainability of resources, which have a strong correlation (r=.86). Figure
III-7 sets coal as the base (equal to 1) and then calculates the ratio of the other resources
compared to coal, where lower scores mean more preferable rankings. I have also included
efficiency as it is ranked in earlier studies. The sharp break between efficiency/renewables on the
hand and the conventional resources (fossil fuels and nuclear) on the other is readily apparent in
both sets of rankings,
FIGURE III-7: RECENT SUSTAINABILITY RANKINGS (COAL=1, LOWER SCORES ARE BETTER)
Central Station
Generation
Distributed Resource
Sources: Eric W., Stein, 2013, “A Comprehensive Multi-Criteria Model to Rank Electric Energy Production
Technologies,” Renewable and Sustainable Energy Reviews, 22; Alexandra Maxim, “Sustainability Assessment
of Electricity Generation Technologies Using Weighted Multi-Criteria Decision Analysis,” Energy Policy, 65:
2014, Figure 2.
Once we move into the broader realm of the electricity system’s non-economic goals,
nuclear power fares very poorly. Nuclear power has significant disadvantages in terms of
security 51 and proliferation risks52 and continues to suffer from unique environmental
problems.53 As a result, in multi-attribute rankings and evaluations the main renewables (wind,
solar, hydro) and efficiency are much more highly rated54 and have consistently been so for
decades.55
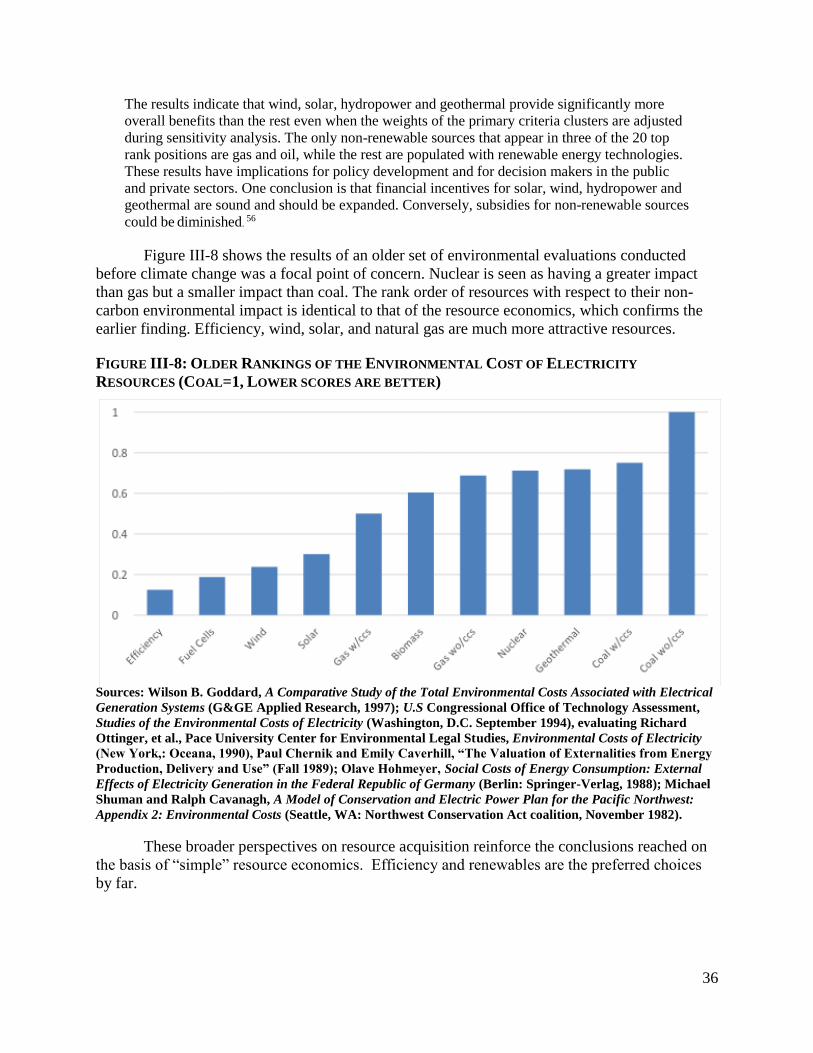
36
The results indicate that wind, solar, hydropower and geothermal provide significantly more
overall benefits than the rest even when the weights of the primary criteria clusters are adjusted
during sensitivity analysis. The only non-renewable sources that appear in three of the 20 top
rank positions are gas and oil, while the rest are populated with renewable energy technologies.
These results have implications for policy development and for decision makers in the public
and private sectors. One conclusion is that financial incentives for solar, wind, hydropower and
geothermal are sound and should be expanded. Conversely, subsidies for non-renewable sources
could be diminished. 56
Figure III-8 shows the results of an older set of environmental evaluations conducted
before climate change was a focal point of concern. Nuclear is seen as having a greater impact
than gas but a smaller impact than coal. The rank order of resources with respect to their non-
carbon environmental impact is identical to that of the resource economics, which confirms the
earlier finding. Efficiency, wind, solar, and natural gas are much more attractive resources.
FIGURE III-8: OLDER RANKINGS OF THE ENVIRONMENTAL COST OF ELECTRICITY
RESOURCES (COAL=1, LOWER SCORES ARE BETTER)
Sources: Wilson B. Goddard, A Comparative Study of the Total Environmental Costs Associated with Electrical
Generation Systems (G&GE Applied Research, 1997); U.S Congressional Office of Technology Assessment,
Studies of the Environmental Costs of Electricity (Washington, D.C. September 1994), evaluating Richard
Ottinger, et al., Pace University Center for Environmental Legal Studies, Environmental Costs of Electricity
(New York,: Oceana, 1990), Paul Chernik and Emily Caverhill, “The Valuation of Externalities from Energy
Production, Delivery and Use” (Fall 1989); Olave Hohmeyer, Social Costs of Energy Consumption: External
Effects of Electricity Generation in the Federal Republic of Germany (Berlin: Springer-Verlag, 1988); Michael
Shuman and Ralph Cavanagh, A Model of Conservation and Electric Power Plan for the Pacific Northwest:
Appendix 2: Environmental Costs (Seattle, WA: Northwest Conservation Act coalition, November 1982).
These broader perspectives on resource acquisition reinforce the conclusions reached on
the basis of “simple” resource economics. Efficiency and renewables are the preferred choices
by far.

37
PART II. BUILDING THE 21ST CENTURY ELECTRICITY SYSTEM
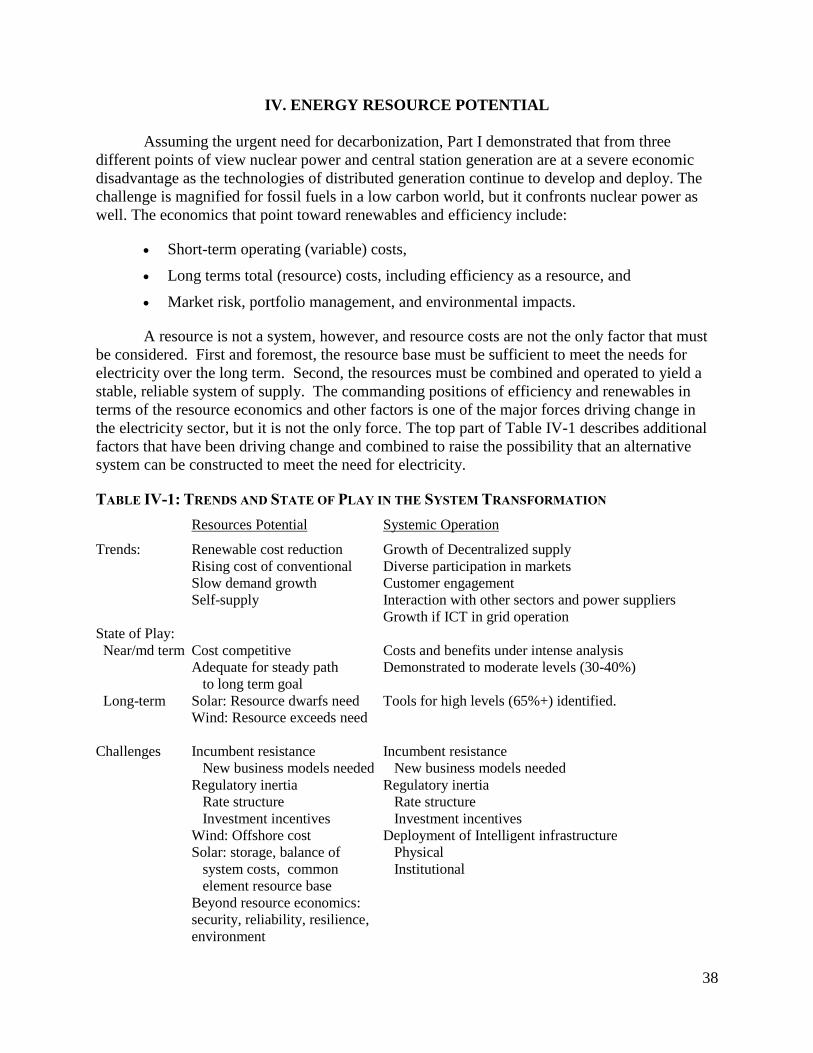
38
IV. ENERGY RESOURCE POTENTIAL
Assuming the urgent need for decarbonization, Part I demonstrated that from three
different points of view nuclear power and central station generation are at a severe economic
disadvantage as the technologies of distributed generation continue to develop and deploy. The
challenge is magnified for fossil fuels in a low carbon world, but it confronts nuclear power as
well. The economics that point toward renewables and efficiency include:
Short-term operating (variable) costs,
Long terms total (resource) costs, including efficiency as a resource, and
Market risk, portfolio management, and environmental impacts.
A resource is not a system, however, and resource costs are not the only factor that must
be considered. First and foremost, the resource base must be sufficient to meet the needs for
electricity over the long term. Second, the resources must be combined and operated to yield a
stable, reliable system of supply. The commanding positions of efficiency and renewables in
terms of the resource economics and other factors is one of the major forces driving change in
the electricity sector, but it is not the only force. The top part of Table IV-1 describes additional
factors that have been driving change and combined to raise the possibility that an alternative
system can be constructed to meet the need for electricity.
TABLE IV-1: TRENDS AND STATE OF PLAY IN THE SYSTEM TRANSFORMATION
Resources Potential Systemic Operation
Trends: Renewable cost reduction Growth of Decentralized supply
Rising cost of conventional Diverse participation in markets
Slow demand growth Customer engagement
Self-supply Interaction with other sectors and power suppliers
Growth if ICT in grid operation
State of Play:
Near/md term Cost competitive Costs and benefits under intense analysis
Adequate for steady path Demonstrated to moderate levels (30-40%)
to long term goal
Long-term Solar: Resource dwarfs need Tools for high levels (65%+) identified.
Wind: Resource exceeds need
Challenges Incumbent resistance Incumbent resistance
New business models needed New business models needed
Regulatory inertia Regulatory inertia
Rate structure Rate structure
Investment incentives Investment incentives
Wind: Offshore cost Deployment of Intelligent infrastructure
Solar: storage, balance of Physical
system costs, common Institutional
element resource base
Beyond resource economics:
security, reliability, resilience,
environment
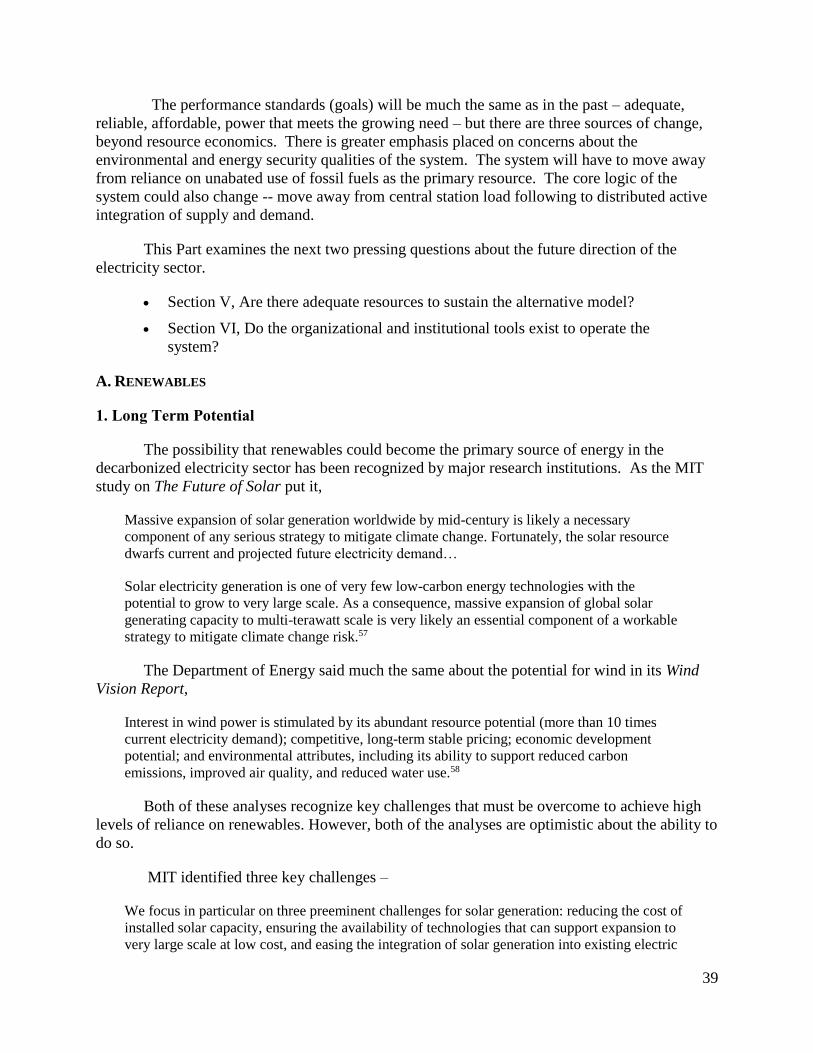
39
The performance standards (goals) will be much the same as in the past – adequate,
reliable, affordable, power that meets the growing need – but there are three sources of change,
beyond resource economics. There is greater emphasis placed on concerns about the
environmental and energy security qualities of the system. The system will have to move away
from reliance on unabated use of fossil fuels as the primary resource. The core logic of the
system could also change -- move away from central station load following to distributed active
integration of supply and demand.
This Part examines the next two pressing questions about the future direction of the
electricity sector.
Section V, Are there adequate resources to sustain the alternative model?
Section VI, Do the organizational and institutional tools exist to operate the
system?
A. RENEWABLES
1. Long Term Potential
The possibility that renewables could become the primary source of energy in the
decarbonized electricity sector has been recognized by major research institutions. As the MIT
study on The Future of Solar put it,
Massive expansion of solar generation worldwide by mid-century is likely a necessary
component of any serious strategy to mitigate climate change. Fortunately, the solar resource
dwarfs current and projected future electricity demand…
Solar electricity generation is one of very few low-carbon energy technologies with the
potential to grow to very large scale. As a consequence, massive expansion of global solar
generating capacity to multi-terawatt scale is very likely an essential component of a workable
strategy to mitigate climate change risk.57
The Department of Energy said much the same about the potential for wind in its Wind
Vision Report,
Interest in wind power is stimulated by its abundant resource potential (more than 10 times
current electricity demand); competitive, long-term stable pricing; economic development
potential; and environmental attributes, including its ability to support reduced carbon
emissions, improved air quality, and reduced water use.58
Both of these analyses recognize key challenges that must be overcome to achieve high
levels of reliance on renewables. However, both of the analyses are optimistic about the ability to
do so.
MIT identified three key challenges –
We focus in particular on three preeminent challenges for solar generation: reducing the cost of
installed solar capacity, ensuring the availability of technologies that can support expansion to
very large scale at low cost, and easing the integration of solar generation into existing electric
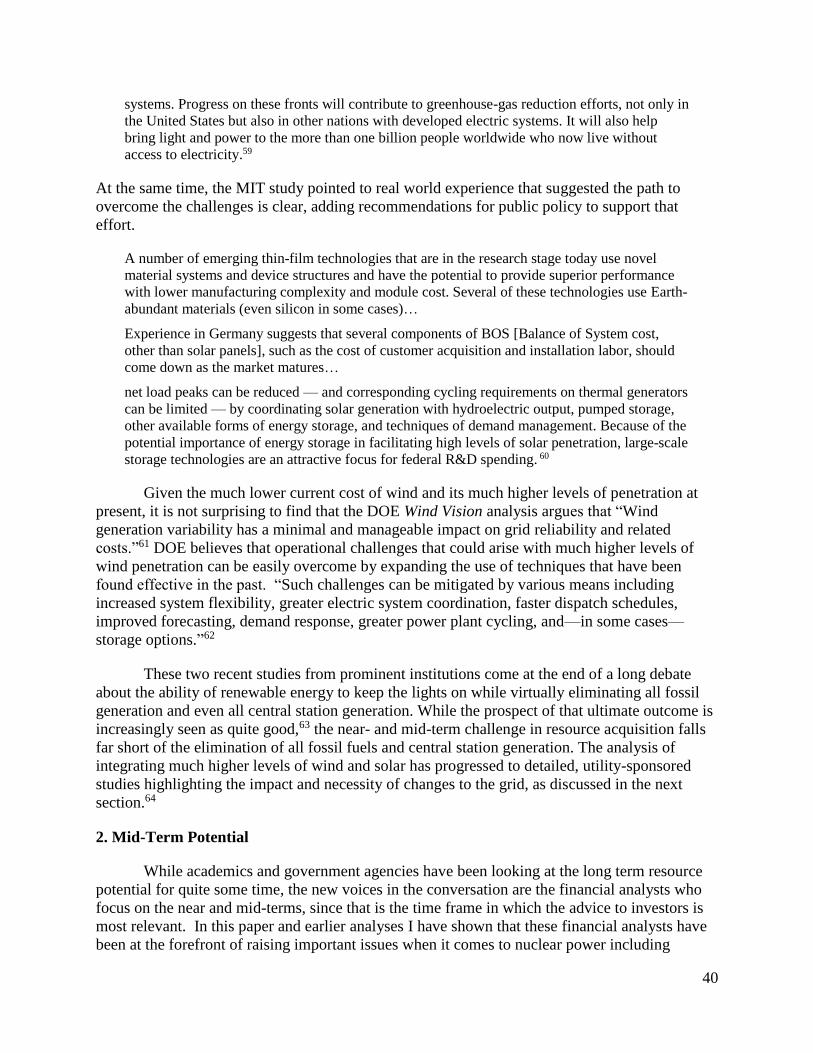
40
systems. Progress on these fronts will contribute to greenhouse-gas reduction efforts, not only in
the United States but also in other nations with developed electric systems. It will also help
bring light and power to the more than one billion people worldwide who now live without
access to electricity.59
At the same time, the MIT study pointed to real world experience that suggested the path to
overcome the challenges is clear, adding recommendations for public policy to support that
effort.
A number of emerging thin-film technologies that are in the research stage today use novel
material systems and device structures and have the potential to provide superior performance
with lower manufacturing complexity and module cost. Several of these technologies use Earth-
abundant materials (even silicon in some cases)…
Experience in Germany suggests that several components of BOS [Balance of System cost,
other than solar panels], such as the cost of customer acquisition and installation labor, should
come down as the market matures…
net load peaks can be reduced — and corresponding cycling requirements on thermal generators
can be limited — by coordinating solar generation with hydroelectric output, pumped storage,
other available forms of energy storage, and techniques of demand management. Because of the
potential importance of energy storage in facilitating high levels of solar penetration, large-scale
storage technologies are an attractive focus for federal R&D spending. 60
Given the much lower current cost of wind and its much higher levels of penetration at
present, it is not surprising to find that the DOE Wind Vision analysis argues that “Wind
generation variability has a minimal and manageable impact on grid reliability and related
costs.”61 DOE believes that operational challenges that could arise with much higher levels of
wind penetration can be easily overcome by expanding the use of techniques that have been
found effective in the past. “Such challenges can be mitigated by various means including
increased system flexibility, greater electric system coordination, faster dispatch schedules,
improved forecasting, demand response, greater power plant cycling, and—in some cases—
storage options.”62
These two recent studies from prominent institutions come at the end of a long debate
about the ability of renewable energy to keep the lights on while virtually eliminating all fossil
generation and even all central station generation. While the prospect of that ultimate outcome is
increasingly seen as quite good,63 the near- and mid-term challenge in resource acquisition falls
far short of the elimination of all fossil fuels and central station generation. The analysis of
integrating much higher levels of wind and solar has progressed to detailed, utility-sponsored
studies highlighting the impact and necessity of changes to the grid, as discussed in the next
section.64
2. Mid-Term Potential
While academics and government agencies have been looking at the long term resource
potential for quite some time, the new voices in the conversation are the financial analysts who
focus on the near and mid-terms, since that is the time frame in which the advice to investors is
most relevant. In this paper and earlier analyses I have shown that these financial analysts have
been at the forefront of raising important issues when it comes to nuclear power including
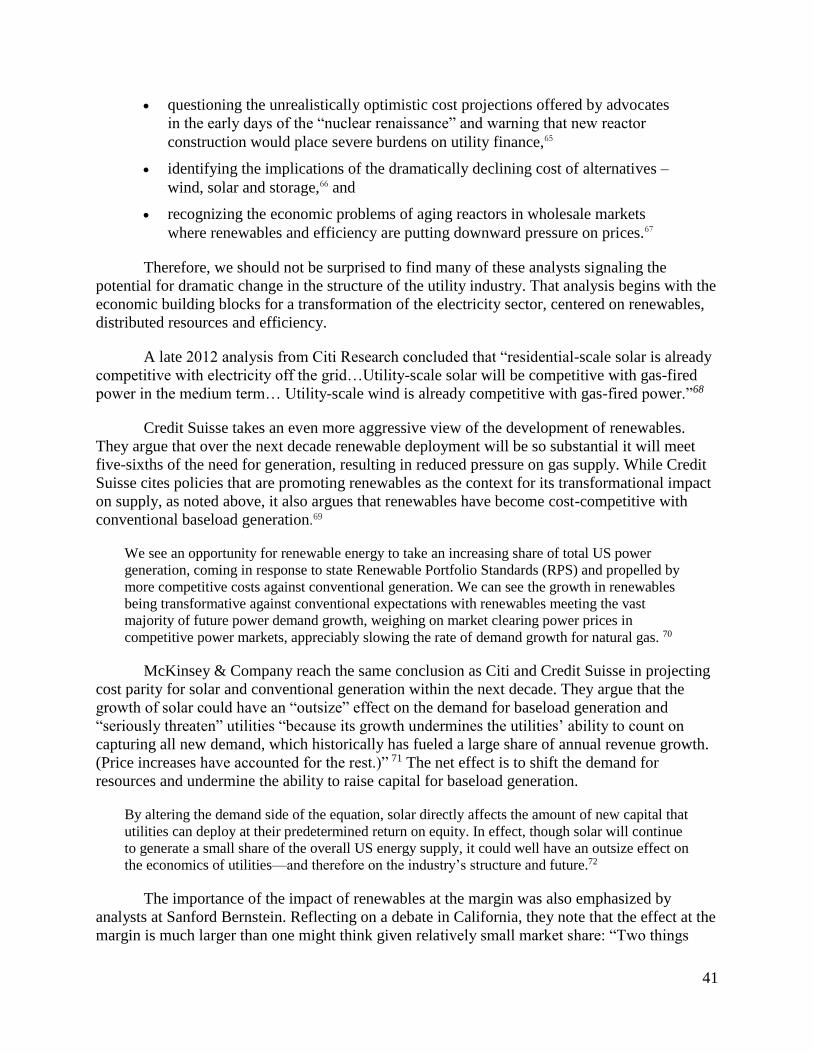
41
questioning the unrealistically optimistic cost projections offered by advocates
in the early days of the “nuclear renaissance” and warning that new reactor
construction would place severe burdens on utility finance,65
identifying the implications of the dramatically declining cost of alternatives –
wind, solar and storage,66 and
recognizing the economic problems of aging reactors in wholesale markets
where renewables and efficiency are putting downward pressure on prices.67
Therefore, we should not be surprised to find many of these analysts signaling the
potential for dramatic change in the structure of the utility industry. That analysis begins with the
economic building blocks for a transformation of the electricity sector, centered on renewables,
distributed resources and efficiency.
A late 2012 analysis from Citi Research concluded that “residential-scale solar is already
competitive with electricity off the grid…Utility-scale solar will be competitive with gas-fired
power in the medium term… Utility-scale wind is already competitive with gas-fired power.”68
Credit Suisse takes an even more aggressive view of the development of renewables.
They argue that over the next decade renewable deployment will be so substantial it will meet
five-sixths of the need for generation, resulting in reduced pressure on gas supply. While Credit
Suisse cites policies that are promoting renewables as the context for its transformational impact
on supply, as noted above, it also argues that renewables have become cost-competitive with
conventional baseload generation.69
We see an opportunity for renewable energy to take an increasing share of total US power
generation, coming in response to state Renewable Portfolio Standards (RPS) and propelled by
more competitive costs against conventional generation. We can see the growth in renewables
being transformative against conventional expectations with renewables meeting the vast
majority of future power demand growth, weighing on market clearing power prices in
competitive power markets, appreciably slowing the rate of demand growth for natural gas. 70
McKinsey & Company reach the same conclusion as Citi and Credit Suisse in projecting
cost parity for solar and conventional generation within the next decade. They argue that the
growth of solar could have an “outsize” effect on the demand for baseload generation and
“seriously threaten” utilities “because its growth undermines the utilities’ ability to count on
capturing all new demand, which historically has fueled a large share of annual revenue growth.
(Price increases have accounted for the rest.)” 71 The net effect is to shift the demand for
resources and undermine the ability to raise capital for baseload generation.
By altering the demand side of the equation, solar directly affects the amount of new capital that
utilities can deploy at their predetermined return on equity. In effect, though solar will continue
to generate a small share of the overall US energy supply, it could well have an outsize effect on
the economics of utilities—and therefore on the industry’s structure and future.72
The importance of the impact of renewables at the margin was also emphasized by
analysts at Sanford Bernstein. Reflecting on a debate in California, they note that the effect at the
margin is much larger than one might think given relatively small market share: “Two things
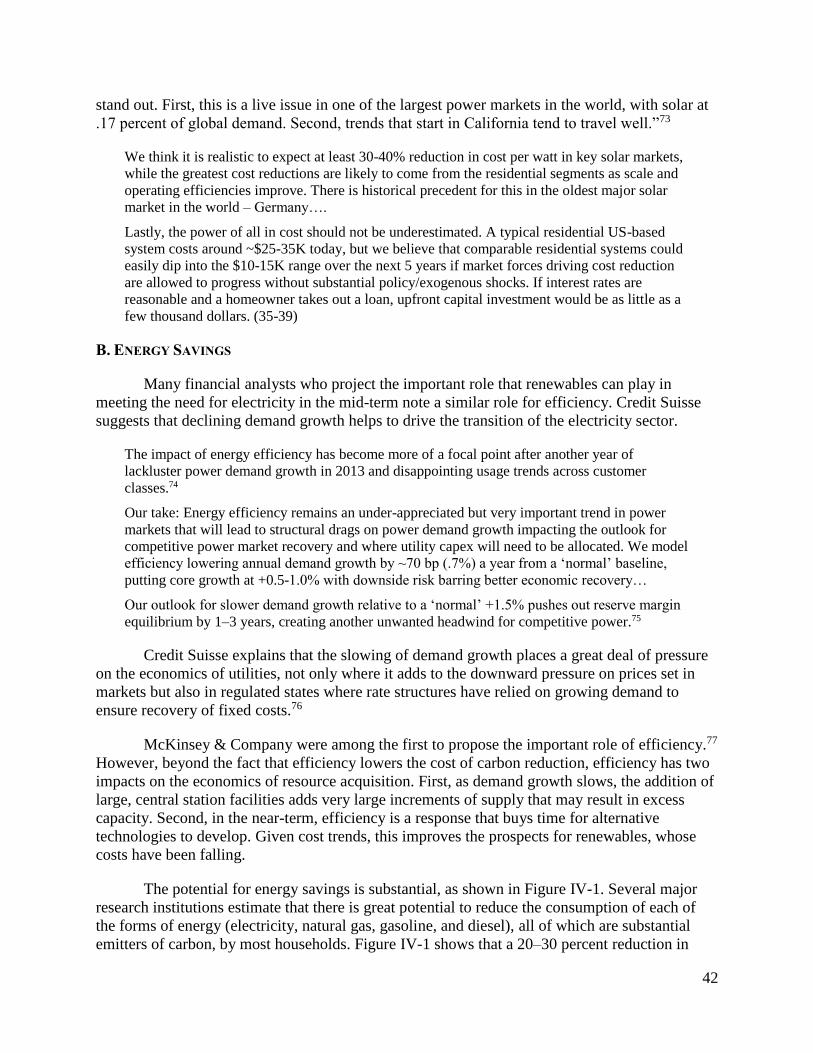
42
stand out. First, this is a live issue in one of the largest power markets in the world, with solar at
.17 percent of global demand. Second, trends that start in California tend to travel well.”73
We think it is realistic to expect at least 30-40% reduction in cost per watt in key solar markets,
while the greatest cost reductions are likely to come from the residential segments as scale and
operating efficiencies improve. There is historical precedent for this in the oldest major solar
market in the world – Germany….
Lastly, the power of all in cost should not be underestimated. A typical residential US-based
system costs around ~$25-35K today, but we believe that comparable residential systems could
easily dip into the $10-15K range over the next 5 years if market forces driving cost reduction
are allowed to progress without substantial policy/exogenous shocks. If interest rates are
reasonable and a homeowner takes out a loan, upfront capital investment would be as little as a
few thousand dollars. (35-39)
B. ENERGY SAVINGS
Many financial analysts who project the important role that renewables can play in
meeting the need for electricity in the mid-term note a similar role for efficiency. Credit Suisse
suggests that declining demand growth helps to drive the transition of the electricity sector.
The impact of energy efficiency has become more of a focal point after another year of
lackluster power demand growth in 2013 and disappointing usage trends across customer
classes.74
Our take: Energy efficiency remains an under-appreciated but very important trend in power
markets that will lead to structural drags on power demand growth impacting the outlook for
competitive power market recovery and where utility capex will need to be allocated. We model
efficiency lowering annual demand growth by ~70 bp (.7%) a year from a ‘normal’ baseline,
putting core growth at +0.5-1.0% with downside risk barring better economic recovery…
Our outlook for slower demand growth relative to a ‘normal’ +1.5% pushes out reserve margin
equilibrium by 1–3 years, creating another unwanted headwind for competitive power.75
Credit Suisse explains that the slowing of demand growth places a great deal of pressure
on the economics of utilities, not only where it adds to the downward pressure on prices set in
markets but also in regulated states where rate structures have relied on growing demand to
ensure recovery of fixed costs.76
McKinsey & Company were among the first to propose the important role of efficiency.77
However, beyond the fact that efficiency lowers the cost of carbon reduction, efficiency has two
impacts on the economics of resource acquisition. First, as demand growth slows, the addition of
large, central station facilities adds very large increments of supply that may result in excess
capacity. Second, in the near-term, efficiency is a response that buys time for alternative
technologies to develop. Given cost trends, this improves the prospects for renewables, whose
costs have been falling.
The potential for energy savings is substantial, as shown in Figure IV-1. Several major
research institutions estimate that there is great potential to reduce the consumption of each of
the forms of energy (electricity, natural gas, gasoline, and diesel), all of which are substantial
emitters of carbon, by most households. Figure IV-1 shows that a 20–30 percent reduction in
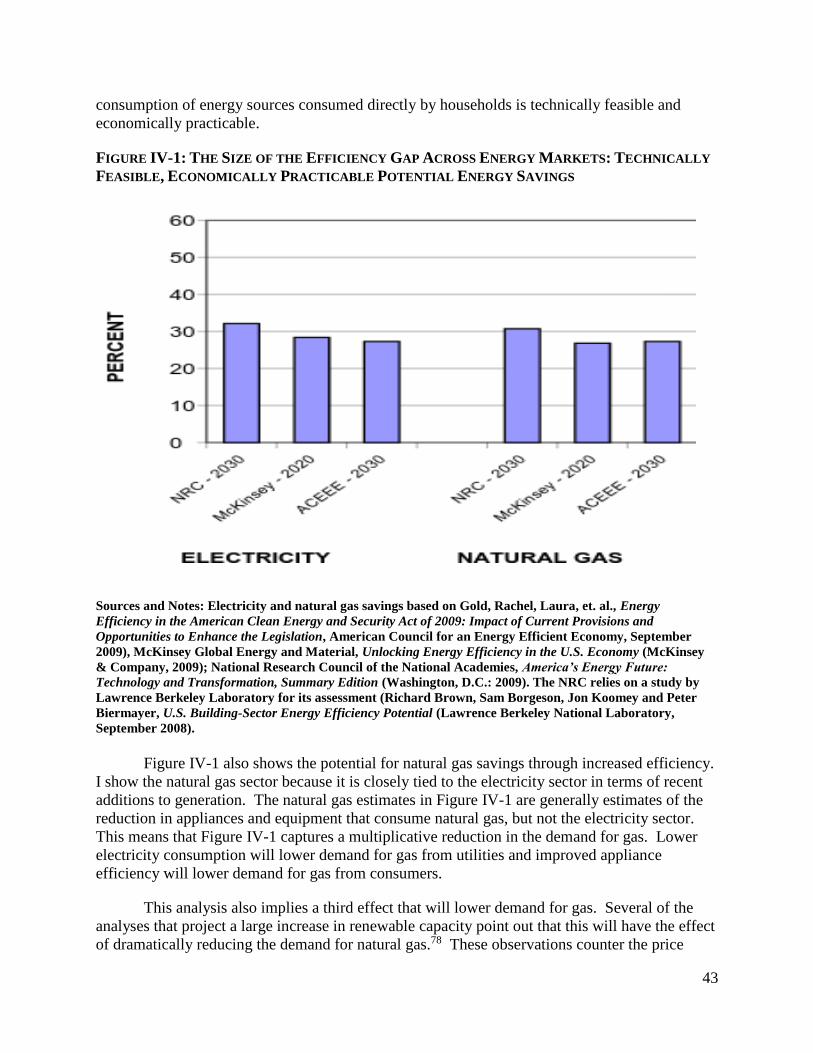
43
consumption of energy sources consumed directly by households is technically feasible and
economically practicable.
FIGURE IV-1: THE SIZE OF THE EFFICIENCY GAP ACROSS ENERGY MARKETS: TECHNICALLY
FEASIBLE, ECONOMICALLY PRACTICABLE POTENTIAL ENERGY SAVINGS
Sources and Notes: Electricity and natural gas savings based on Gold, Rachel, Laura, et. al., Energy
Efficiency in the American Clean Energy and Security Act of 2009: Impact of Current Provisions and
Opportunities to Enhance the Legislation, American Council for an Energy Efficient Economy, September
2009), McKinsey Global Energy and Material, Unlocking Energy Efficiency in the U.S. Economy (McKinsey
& Company, 2009); National Research Council of the National Academies, America’s Energy Future:
Technology and Transformation, Summary Edition (Washington, D.C.: 2009). The NRC relies on a study by
Lawrence Berkeley Laboratory for its assessment (Richard Brown, Sam Borgeson, Jon Koomey and Peter
Biermayer, U.S. Building-Sector Energy Efficiency Potential (Lawrence Berkeley National Laboratory,
September 2008).
Figure IV-1 also shows the potential for natural gas savings through increased efficiency.
I show the natural gas sector because it is closely tied to the electricity sector in terms of recent
additions to generation. The natural gas estimates in Figure IV-1 are generally estimates of the
reduction in appliances and equipment that consume natural gas, but not the electricity sector.
This means that Figure IV-1 captures a multiplicative reduction in the demand for gas. Lower
electricity consumption will lower demand for gas from utilities and improved appliance
efficiency will lower demand for gas from consumers.
This analysis also implies a third effect that will lower demand for gas. Several of the
analyses that project a large increase in renewable capacity point out that this will have the effect
of dramatically reducing the demand for natural gas.78 These observations counter the price
44
volatility fear campaign that incumbent utilities and nuclear advocates rely on to discredit natural
gas. Reducing supply pressures with direct efficiency, indirect reduction in electricity
consumptions and deployment of renewables would dampen any identifiable volatility,79 which
has always been overstated in any case.80
These estimates of electricity savings involve the near-term energy savings resources that
can be tapped at current projected costs. There is technical potential well beyond these resources,
which will become economic as the cost of electricity rises and the cost of efficiency drops.
Figure IV-2 presents two perspectives on this proposition. The top graph shows the results of a
number of state studies that fall in the mid-term time range. The technical potential is
considerably higher than the near-term economic potential. The bottom graph presents the
estimates of a mid-1990s review of efficiency potential. The technical potential could be
substantially larger than 30 percent.
C. “NEW” RESOURCES: DEMAND RESPONSE, STORAGE AND INTELLIGENT INTEGRATION
I placed quotation marks around “new” in the title of this section to underscore the fact
that, while demand response and storage have been around for quite some time, they were a
small part of the 20th century model and played a minor role. In the introduction I argued that
the potential transformation of the electricity system involves the movement of resources that
were marginal, at best, into leading roles. The same is true of demand response, storage and
intelligent integration. They move from being bit players to being important supporting actors.
Their impact and importance would not only come from a much larger role, but also from
providing much more important functions.
I believe that the discussion of these elements of the 21st century electricity system
belong in a discussion of resources because they are closely intertwined and they produce an
effective resource, sometimes referred to as a virtual power plant.81 As a UBS analysis put
We note some discussion in the industry around tapping multiple revenue streams for
interconnected batteries. We suspect improving tariffs from power markets will continue to
make such compensation possible for both the DR-like attributes in reducing peak during
emergency events alongside compensation for energy and ancillary benefits provided. We
suspect much of this focus will eventually mesh into the wider question of Demand Response
Compensation….
An alternative way to think of storage market penetration is effectively bidding into existing
Demand response regimes…82
Demand response and storage have been around for decades, growing out of a need to
manage peaks that became more intense as air conditioning spread. However, their 20th century
manifestation was small, slow, inconsistent, uncertain and an afterthought. Their contemporary
manifestation is quite different and widely recognized as one of the key building blocks of the
21st century electricity model. It embodies the essential active feature of the system,83 relying on
information about the state of the network delivered on a real time basis to technologies that can
instantaneously control and match load with resources. As demand response and storage are
built into the heart of the electricity system, they provides a range of functions, i.e. have a
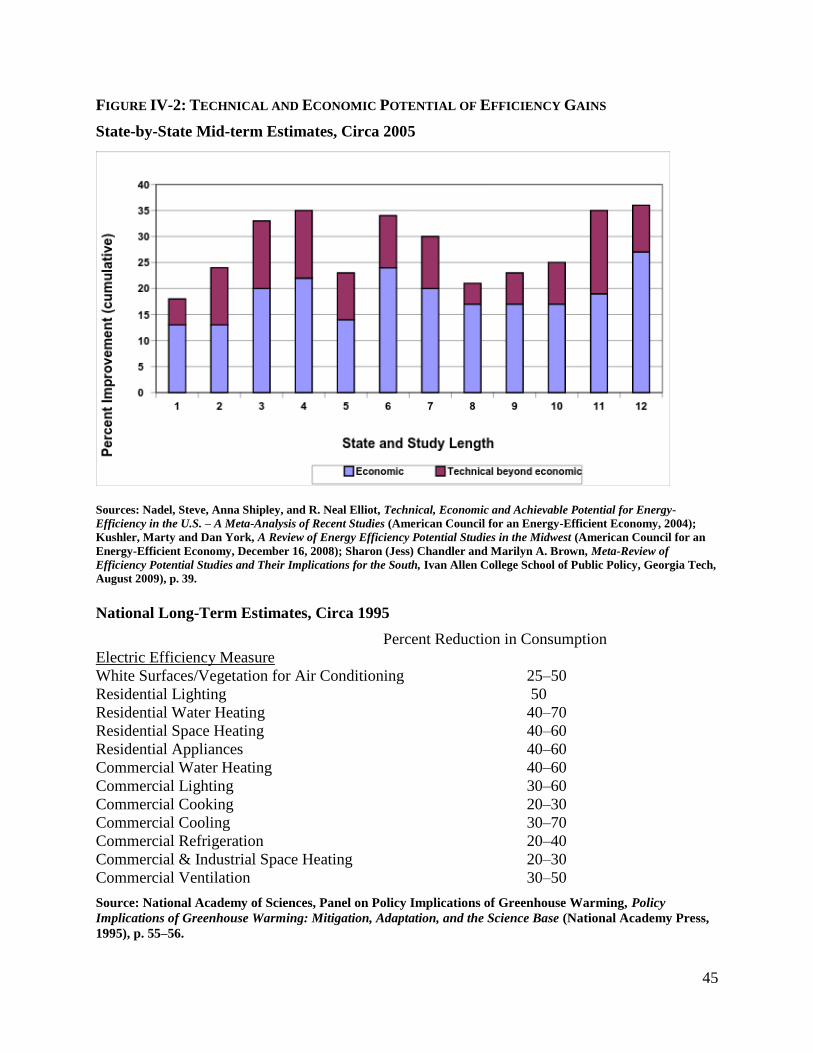
45
FIGURE IV-2: TECHNICAL AND ECONOMIC POTENTIAL OF EFFICIENCY GAINS
State-by-State Mid-term Estimates, Circa 2005
Sources: Nadel, Steve, Anna Shipley, and R. Neal Elliot, Technical, Economic and Achievable Potential for Energy-
Efficiency in the U.S. – A Meta-Analysis of Recent Studies (American Council for an Energy-Efficient Economy, 2004);
Kushler, Marty and Dan York, A Review of Energy Efficiency Potential Studies in the Midwest (American Council for an
Energy-Efficient Economy, December 16, 2008); Sharon (Jess) Chandler and Marilyn A. Brown, Meta-Review of
Efficiency Potential Studies and Their Implications for the South, Ivan Allen College School of Public Policy, Georgia Tech,
August 2009), p. 39.
National Long-Term Estimates, Circa 1995
Percent Reduction in Consumption
Electric Efficiency Measure
White Surfaces/Vegetation for Air Conditioning 25–50
Residential Lighting 50
Residential Water Heating 40–70
Residential Space Heating 40–60
Residential Appliances 40–60
Commercial Water Heating 40–60
Commercial Lighting 30–60
Commercial Cooking 20–30
Commercial Cooling 30–70
Commercial Refrigeration 20–40
Commercial & Industrial Space Heating 20–30
Commercial Ventilation 30–50
Source: National Academy of Sciences, Panel on Policy Implications of Greenhouse Warming, Policy
Implications of Greenhouse Warming: Mitigation, Adaptation, and the Science Base (National Academy Press,
1995), p. 55–56.
46
number of sources of value that are recognized in the trade84 and academic literatures.85
Demand reduction overall and at the peak through both reduction and load
shifting.
Avoided capital cost in generation, transmission and distribution.
Efficiency through reduction of line loses, reduced congestions and
transmission reinforcement.
Ancillary services by providing reserve support for energy, standby and
balancing
Market structure, through support for renewables, reduced concentration of
suppliers
The circumstances of demand response are similar to those that apply to the deployment
of renewable resources described above. There is readily achievable progress in the short term
and much greater potential in the long term.
Importantly the level of DR does not have to be huge in order to realise many of the estimated
benefits of this paper (e.g. 2.8% reduction in overall electricity use and a 1.3% shift in peak
demand). The evidence from the literature suggests that such reductions are achievable and that
there is actually potential for electricity reductions and shifts to be much greater given the right
environment.86
The intense interest in and debate over storage highlights two critical characteristics of
the current development of storage technology. Because it is important, it is attracting an
immense amount of resources and entrepreneurial activity. As a result, an extremely rich
technology palate of options is being created from which all the key stakeholders (consumers
utilities, grid operators and policy makers) in the electricity space can choose.
Tesla’s announcement of the opening of its book of orders for its “giga” battery factory
stimulated a flood of articles about the imminent demise of the utility sector 87and nuclear, in
particular.88 Talk of the threat of a death spiral of utilities had been in the air for several years.89
While much of the press focused on the residential sector, UBS sees the near term impact of
storage in the commercial and industrial sectors.90 As UBS put it, residential deployment is
more dependent on continued cost reduction and supportive policy.
Batteries delivered at an economically competitive price are the holy grail of solar penetration,
and we believe the industry will begin deploying on a large scale within the next ~5 years or
less. We expect battery deployment to occur primarily where there is a clear economic rationale.
One of the clearest examples is commercial scale battery deployment, which is already
occurring today in several countries. Commercial customers are often subject to demand based
charges, which can account for as much as half of the electric bill in some months. We think
companies with differentiated battery solutions coupled with intelligent software and predictive
analytics that work with the grid to avoid these charges and smooth electric demand will pave
the way for mass adoption. Additionally, we expect utilities worldwide to pursue batteries on a
large scale as costs drop over the next several years and renewable/intermittent generation
deployments increase. Residential customers without proper pricing mechanisms in place (for
example, peak demand charges) are unlikely to pursue energy storage in the short term,

47
although we believe solar leasing companies and other energy service companies could shift
towards offering batteries as part of energy packages designed to integrate more intelligently
with the grid and address utility concerns around distributed generation.91
RMI looked at the economics in all sectors as building the potential for grid defection. 92
While others like RMI also see commercial PV with storage as leading, they do not see
residential all that far behind. Deutsche Bank takes a similar view. It sees grid parity in two-
thirds of the states with over three quarters of demand in 5 to 10 years. Both of these analyses
that are optimistic about residential solar underscore the importance of policy.
The debate over which storage technologies tied to which renewable resources will be the
leading edge is instructive not because of the uncertainty between different types of storage
technologies. Its import lies in the existence of multiple applications and services that storage
provides, driven by dramatically declining costs, and the resulting confidence that storage can
play a much larger roles in in the 21st century electricity system. Regardless of which
technologies, among a dozen, takes hold and which sector leads, there is in no doubt that storage
will play an important role in the 21st century electricity system.93
Moreover, while much of the analysis of storage (certainly when it is tied to residential
PV systems) focuses on the private costs and benefits, some have argued that there are public
benefits that need to be considered.94 These benefits include reduction in production, investment
and outage costs and improved reliability. The analysis conducted by the Brattle group for a
Texas distribution utility found that the system-wide benefits constituted a significant part of the
total benefit (30%-40%), enough to tip the scale in favor of much larger investment than would
be driven by private incentives alone. Policy to capture those benefits in an effective manner and
share them “fairly” is the focal point of attention in a vigorous debate over rate structure,
incentives and stranded costs.
Demand response and storage are two of the key elements in the active 21st century
electricity system. In the next section I will discuss the full array of elements. Here it suffices to
say that the reduction of use of generation through intelligent management is estimated to be in
the range of 10–20 of aggregate demand and a higher percentage of peak demand. This should be
considered a transformation dividend with respect to carbon reduction. The downward pressure
on peak and average prices, which has been observed in systems that are partially designed (at
best) to exploit this aspect of the emerging electricity system, are an economic dividend that
would be reinforced by a successful transformation of the system. Thus, virtual power plants can
have a substantial impact and value.
The emerging consensus is that the current physical and institutional infrastructure can
handle the growth of renewables to 30–40% quite well. For example, a study conducted for PJM
members that included only one of the many grid management strategies – i.e. geographic
diversity of renewables, which is a natural occurrence if high levels of renewables are pursued
since the resource is generally dispersed – found that 30 percent penetration of renewables is
easily manageable.95 Half-a-dozen advanced industrial countries (Denmark, Germany, Ireland,
Spain, Sweden and Portugal) have achieved three times the current penetration of renewables in
the United States.96 A recent study for the European Commission found a 60% penetration of
renewables to be manageable.97 Thus, the sense of short-term crisis that utilities have sought to
48
create by threatening to retire several reactors is contradicted by these findings and
developments, but feeds into and off of the larger debate about reliability without central station
generation.
The analysis of this potential transformation has progressed greatly and includes
modeling a sector that captures the synergies of geographically diverse and widespread
renewables combined with key infrastructure components of transmission, the tradeoff98 with
storage, 99and demand response,100 which can lower costs and meet demand. Moreover, the
magnitude of these benefits projected in these analyses are early in the process of transformation.
A wide range of opportunities is opening up that can eliminate the wall between supply and
demand behind which the 20th century baseload model was built. Doing so relies on the
interrelationship of battery powered vehicles101 and the smart grid,102 the Internet of things,103
and having multiple roles for solar power.104
D. THE IMMENSE TECHNICAL AND ECONOMIC RESOURCE BASE FOR A 21ST CENTURY
ELECTRICITY SYSTEM
As noted above, individually the technical potential of each of the resources is huge
compared to the current and projected need for electricity. While the geographic distribution of
resources is not uniform, combining the two major resources (solar and wind) shows that there is
a wide availability of resources. Figure IV-3 presents the result of a 2012 study done by the
National Renewable Energy Laboratory which is consistent with the observations of the
Department of Energy and the academic literature. It shows the ratio of potential resources
compared to electricity sales in 2010. The calculation of the potential was based purely on
technical considerations. The load factors that underlie the study are about 20% for solar and
30%-40% for wind, which are consistent with real world experience and likely to improve over
time.
For half the states the resource is more than 50 time consumption. For two thirds of the
states the available resources is more than 25 times the level of consumption. There are only
four states where the ratio is less than ten. However, the states that are on the lower end of the
range are located in service areas (RTOs/reliability regions) with states that have much higher
levels of potential resource.
Technical potential is only the starting point for the sufficiency analysis. The economics
of exploiting the resources is a vital consideration. The above discussion indicates that the role
of renewables is set to expand rapidly. Figure IV-4 quantifies this conclusion. The upper graph
of Figure IV-4 presents the projections of the financial analysts and the two Department of
Energy “Vision” analyses in terms of capacity additions, while the lower graph presents the
penetration of resources compared to demand. There is agreement in the mid-term about the
deployment of capacity. In calculating the percentage of demand met by wind and solar in the
lower graph of Figure IV-4, I have adjusted the projected deployment of renewable generating
capacity to a projected demand that assumes efficiency cuts the rate of demand growth in half
(from about 1% per year to about .5% per year). The combination of efficiency, the intelligent
integration dividend and storage make this a very cautious estimate of the long term potential
reduction in demand. The projected level of wind and solar for 2030 is just under 40%, which is
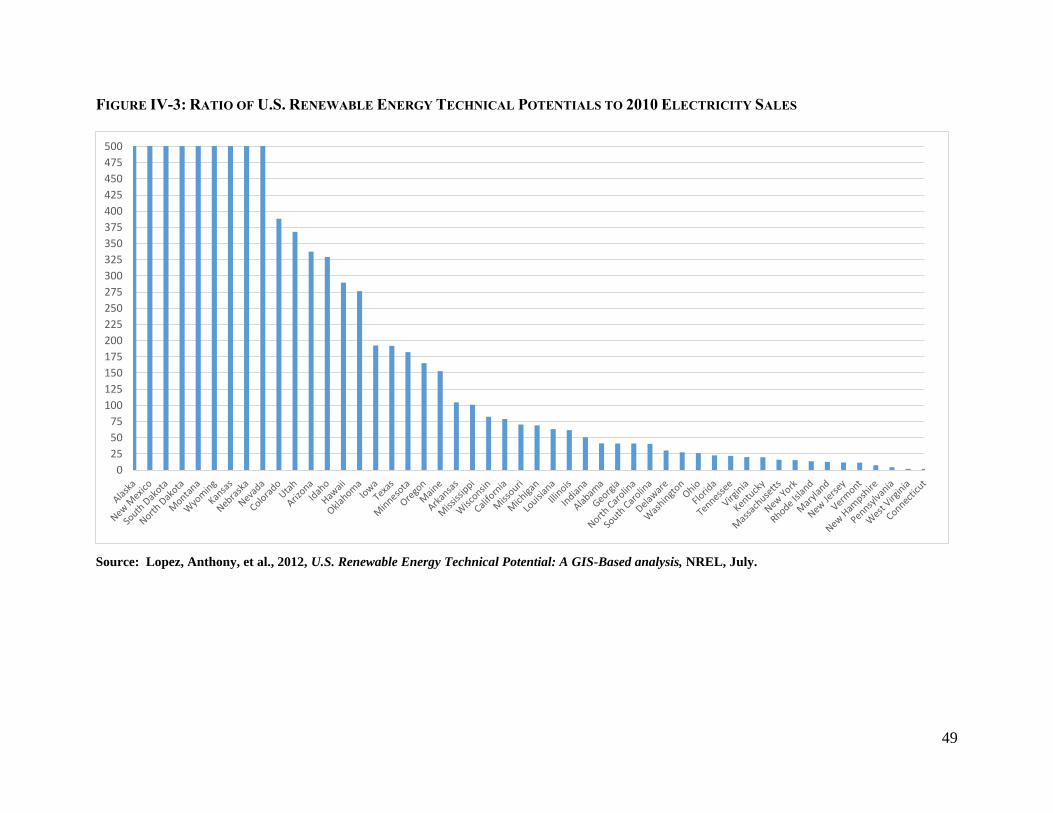
49
0
25
50
75
100
125
150
175
200
225
250
275
300
325
350
375
400
425
450
475
500
FIGURE IV-3: RATIO OF U.S. RENEWABLE ENERGY TECHNICAL POTENTIALS TO 2010 ELECTRICITY SALES
Source: Lopez, Anthony, et al., 2012, U.S. Renewable Energy Technical Potential: A GIS-Based analysis, NREL, July.
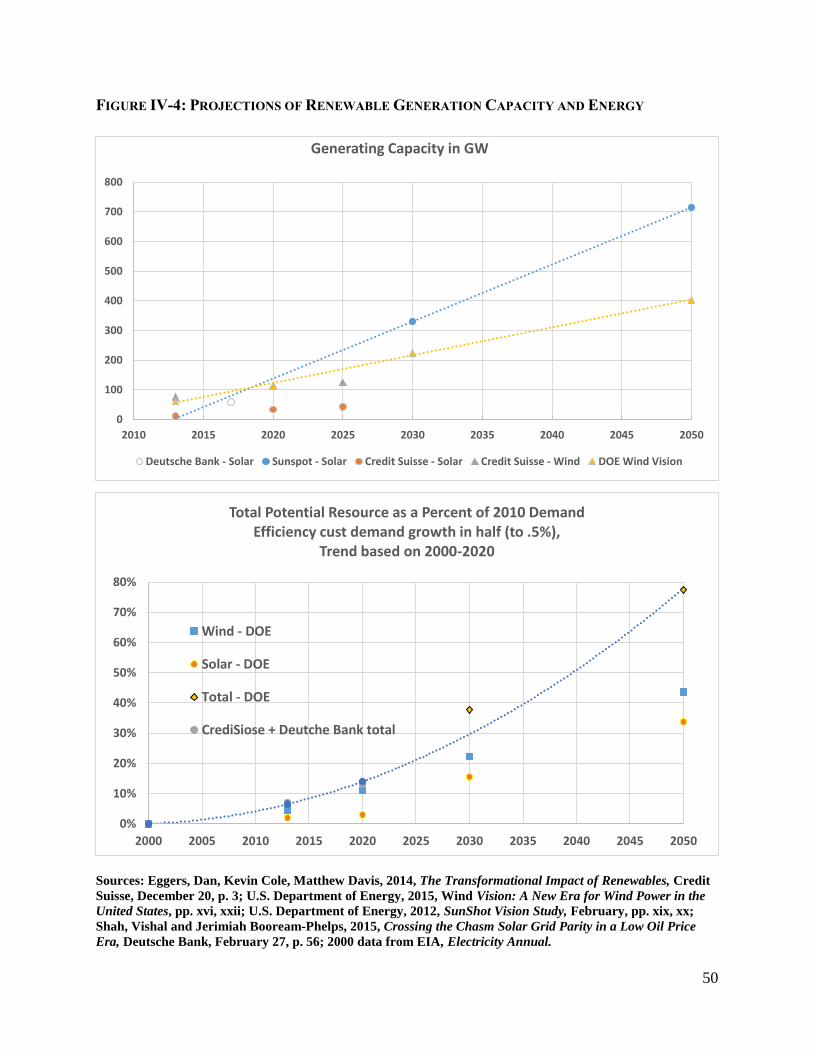
50
0
100
200
300
400
500
600
700
800
2010 2015 2020 2025 2030 2035 2040 2045 2050
Generating Capacity in GW
Deutsche Bank - Solar Sunspot - Solar Credit Suisse - Solar Credit Suisse - Wind DOE Wind Vision
0%
10%
20%
30%
40%
50%
60%
70%
80%
2000 2005 2010 2015 2020 2025 2030 2035 2040 2045 2050
Total Potential Resource as a Percent of 2010 Demand Efficiency cust demand growth in half (to .5%),
Trend based on 2000-2020
Wind - DOE
Solar - DOE
Total - DOE
CrediSiose + Deutche Bank total
FIGURE IV-4: PROJECTIONS OF RENEWABLE GENERATION CAPACITY AND ENERGY
Sources: Eggers, Dan, Kevin Cole, Matthew Davis, 2014, The Transformational Impact of Renewables, Credit
Suisse, December 20, p. 3; U.S. Department of Energy, 2015, Wind Vision: A New Era for Wind Power in the
United States, pp. xvi, xxii; U.S. Department of Energy, 2012, SunShot Vision Study, February, pp. xix, xx;
Shah, Vishal and Jerimiah Booream-Phelps, 2015, Crossing the Chasm Solar Grid Parity in a Low Oil Price
Era, Deutsche Bank, February 27, p. 56; 2000 data from EIA, Electricity Annual.
51
in the range in which the analysis finds is easily accomplished. The 2050 figure is just under
80%, which requires a significant degree of transformation of the system, but is deemed to be
achievable.
There is no doubt that the technical potential vastly exceeds the long-term need and the
economic potential is adequate to meet mid-term needs. The uncertainty comes in the continued
development and declining cost of the alternative technologies and the implementation of
policies to integrate the resources into a stable, reliable electricity system. These observations
support the conclusion that the electricity sector is on the cusp of a major transformation.
Independent financial analysts are also signaling the dramatic impact that the emergence of the
21st century electricity market could have on the 20th century utility business model.
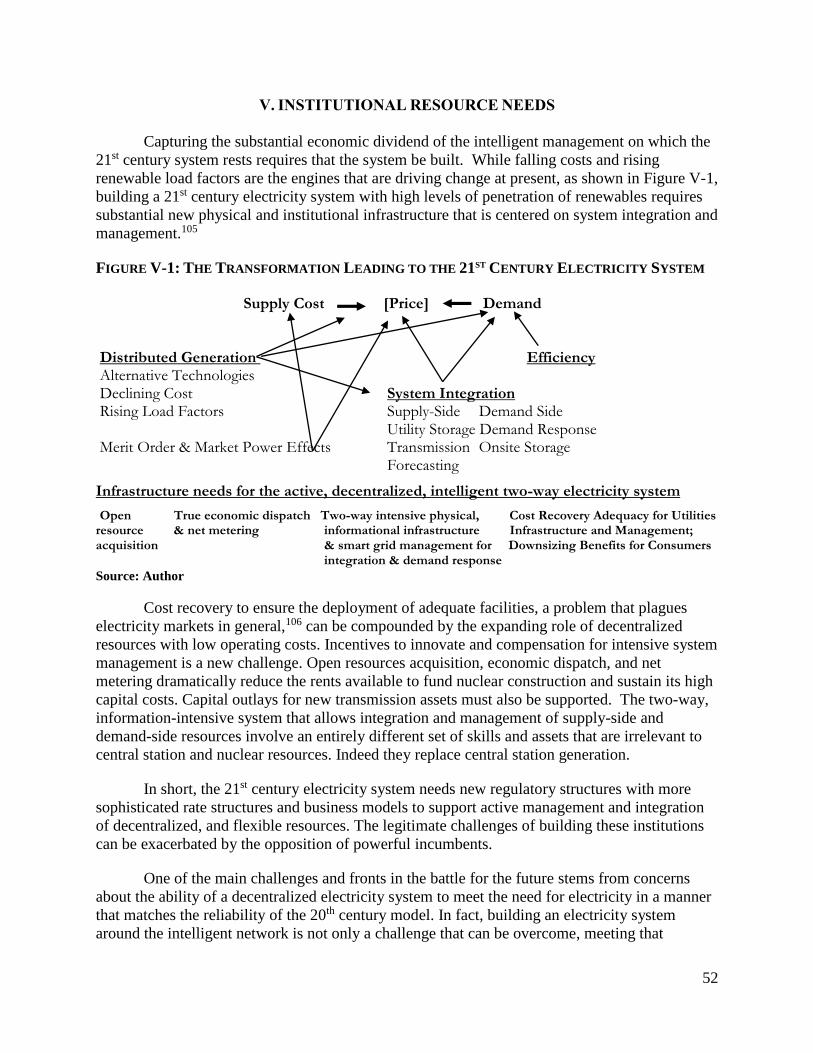
52
V. INSTITUTIONAL RESOURCE NEEDS
Capturing the substantial economic dividend of the intelligent management on which the
21st century system rests requires that the system be built. While falling costs and rising
renewable load factors are the engines that are driving change at present, as shown in Figure V-1,
building a 21st century electricity system with high levels of penetration of renewables requires
substantial new physical and institutional infrastructure that is centered on system integration and
management.105
FIGURE V-1: THE TRANSFORMATION LEADING TO THE 21ST CENTURY ELECTRICITY SYSTEM Supply Cost [Price] Demand Distributed Generation Efficiency Alternative Technologies Declining Cost System Integration Rising Load Factors Supply-Side Demand Side
Utility Storage Demand Response Merit Order & Market Power Effects Transmission Onsite Storage Forecasting
Infrastructure needs for the active, decentralized, intelligent two-way electricity system
Open True economic dispatch Two-way intensive physical, Cost Recovery Adequacy for Utilities resource & net metering informational infrastructure Infrastructure and Management; acquisition & smart grid management for Downsizing Benefits for Consumers integration & demand response
Source: Author
Cost recovery to ensure the deployment of adequate facilities, a problem that plagues
electricity markets in general,106 can be compounded by the expanding role of decentralized
resources with low operating costs. Incentives to innovate and compensation for intensive system
management is a new challenge. Open resources acquisition, economic dispatch, and net
metering dramatically reduce the rents available to fund nuclear construction and sustain its high
capital costs. Capital outlays for new transmission assets must also be supported. The two-way,
information-intensive system that allows integration and management of supply-side and
demand-side resources involve an entirely different set of skills and assets that are irrelevant to
central station and nuclear resources. Indeed they replace central station generation.
In short, the 21st century electricity system needs new regulatory structures with more
sophisticated rate structures and business models to support active management and integration
of decentralized, and flexible resources. The legitimate challenges of building these institutions
can be exacerbated by the opposition of powerful incumbents.
One of the main challenges and fronts in the battle for the future stems from concerns
about the ability of a decentralized electricity system to meet the need for electricity in a manner
that matches the reliability of the 20th century model. In fact, building an electricity system
around the intelligent network is not only a challenge that can be overcome, meeting that
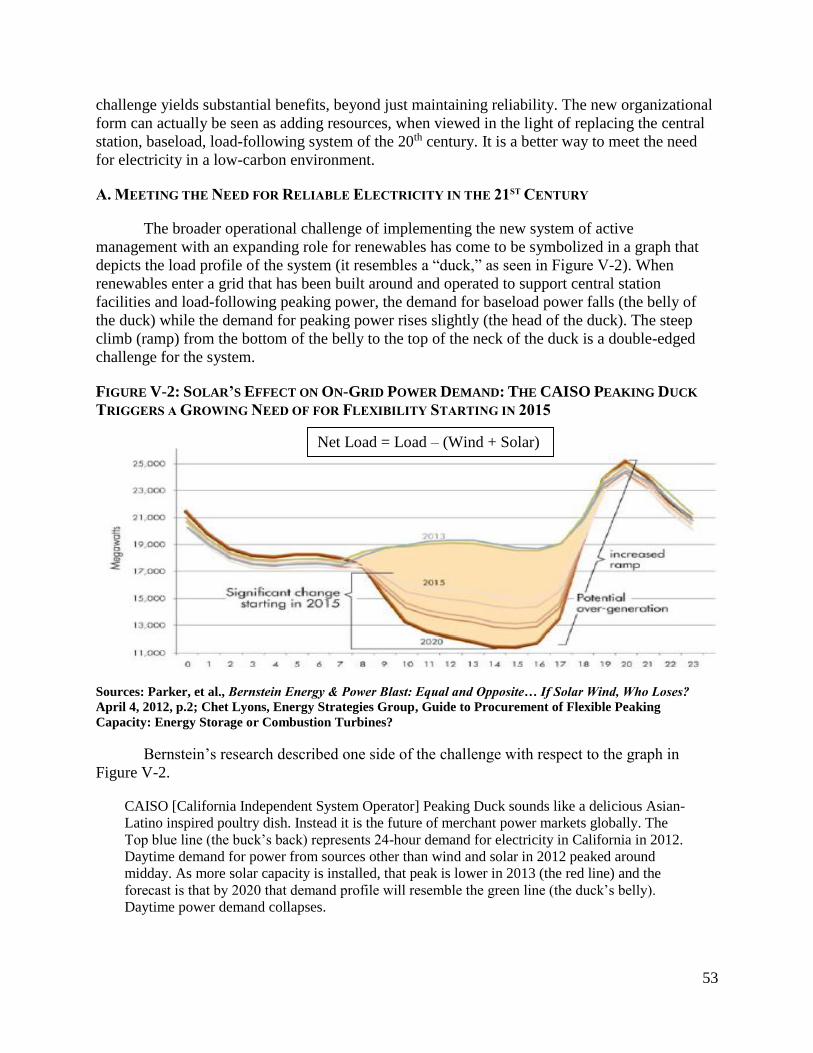
53
Net Load = Load – (Wind + Solar)
challenge yields substantial benefits, beyond just maintaining reliability. The new organizational
form can actually be seen as adding resources, when viewed in the light of replacing the central
station, baseload, load-following system of the 20th century. It is a better way to meet the need
for electricity in a low-carbon environment.
A. MEETING THE NEED FOR RELIABLE ELECTRICITY IN THE 21ST CENTURY
The broader operational challenge of implementing the new system of active
management with an expanding role for renewables has come to be symbolized in a graph that
depicts the load profile of the system (it resembles a “duck,” as seen in Figure V-2). When
renewables enter a grid that has been built around and operated to support central station
facilities and load-following peaking power, the demand for baseload power falls (the belly of
the duck) while the demand for peaking power rises slightly (the head of the duck). The steep
climb (ramp) from the bottom of the belly to the top of the neck of the duck is a double-edged
challenge for the system.
FIGURE V-2: SOLAR’S EFFECT ON ON-GRID POWER DEMAND: THE CAISO PEAKING DUCK
TRIGGERS A GROWING NEED OF FOR FLEXIBILITY STARTING IN 2015
Sources: Parker, et al., Bernstein Energy & Power Blast: Equal and Opposite… If Solar Wind, Who Loses?
April 4, 2012, p.2; Chet Lyons, Energy Strategies Group, Guide to Procurement of Flexible Peaking
Capacity: Energy Storage or Combustion Turbines?
Bernstein’s research described one side of the challenge with respect to the graph in
Figure V-2.
CAISO [California Independent System Operator] Peaking Duck sounds like a delicious Asian-
Latino inspired poultry dish. Instead it is the future of merchant power markets globally. The
Top blue line (the buck’s back) represents 24-hour demand for electricity in California in 2012.
Daytime demand for power from sources other than wind and solar in 2012 peaked around
midday. As more solar capacity is installed, that peak is lower in 2013 (the red line) and the
forecast is that by 2020 that demand profile will resemble the green line (the duck’s belly).
Daytime power demand collapses.
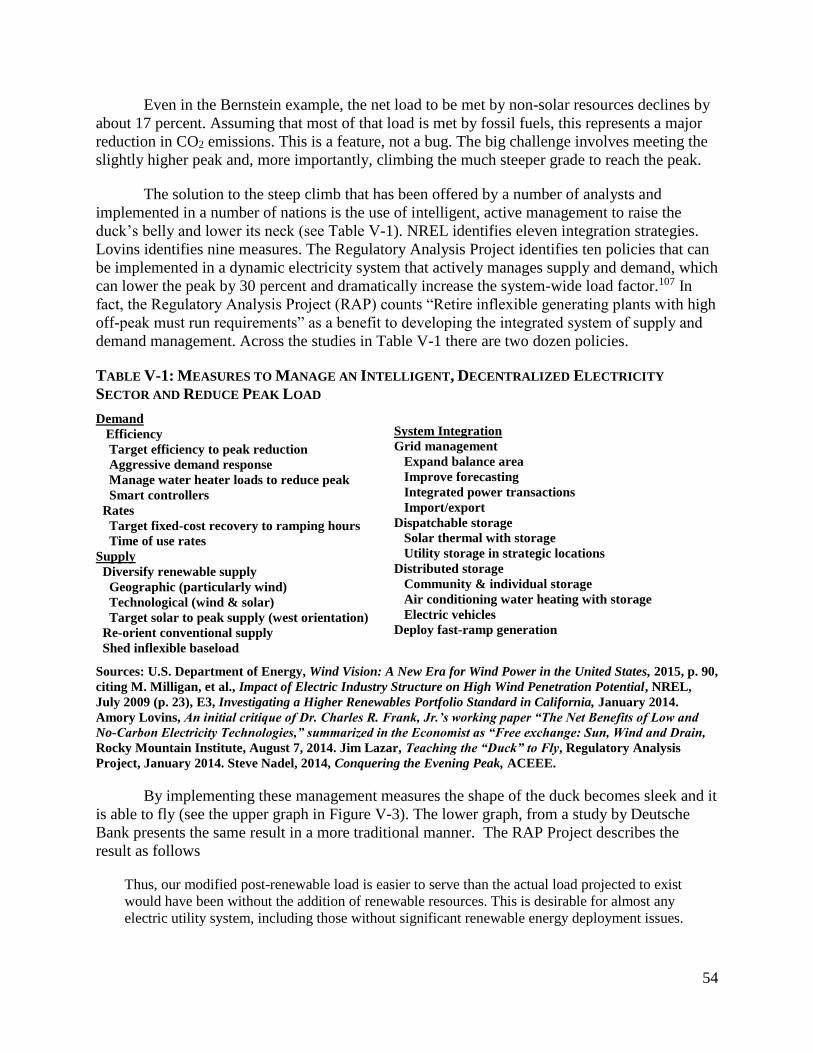
54
System Integration
Grid management
Expand balance area
Improve forecasting
Integrated power transactions
Import/export
Dispatchable storage
Solar thermal with storage
Utility storage in strategic locations
Distributed storage
Community & individual storage
Air conditioning water heating with storage
Electric vehicles
Deploy fast-ramp generation
Even in the Bernstein example, the net load to be met by non-solar resources declines by
about 17 percent. Assuming that most of that load is met by fossil fuels, this represents a major
reduction in CO2 emissions. This is a feature, not a bug. The big challenge involves meeting the
slightly higher peak and, more importantly, climbing the much steeper grade to reach the peak.
The solution to the steep climb that has been offered by a number of analysts and
implemented in a number of nations is the use of intelligent, active management to raise the
duck’s belly and lower its neck (see Table V-1). NREL identifies eleven integration strategies.
Lovins identifies nine measures. The Regulatory Analysis Project identifies ten policies that can
be implemented in a dynamic electricity system that actively manages supply and demand, which
can lower the peak by 30 percent and dramatically increase the system-wide load factor.107 In
fact, the Regulatory Analysis Project (RAP) counts “Retire inflexible generating plants with high
off-peak must run requirements” as a benefit to developing the integrated system of supply and
demand management. Across the studies in Table V-1 there are two dozen policies.
TABLE V-1: MEASURES TO MANAGE AN INTELLIGENT, DECENTRALIZED ELECTRICITY
SECTOR AND REDUCE PEAK LOAD
Demand
Efficiency
Target efficiency to peak reduction
Aggressive demand response
Manage water heater loads to reduce peak
Smart controllers
Rates
Target fixed-cost recovery to ramping hours
Time of use rates
Supply
Diversify renewable supply
Geographic (particularly wind)
Technological (wind & solar)
Target solar to peak supply (west orientation)
Re-orient conventional supply
Shed inflexible baseload
Sources: U.S. Department of Energy, Wind Vision: A New Era for Wind Power in the United States, 2015, p. 90,
citing M. Milligan, et al., Impact of Electric Industry Structure on High Wind Penetration Potential, NREL,
July 2009 (p. 23), E3, Investigating a Higher Renewables Portfolio Standard in California, January 2014.
Amory Lovins, An initial critique of Dr. Charles R. Frank, Jr.’s working paper “The Net Benefits of Low and
No-Carbon Electricity Technologies,” summarized in the Economist as “Free exchange: Sun, Wind and Drain,
Rocky Mountain Institute, August 7, 2014. Jim Lazar, Teaching the “Duck” to Fly, Regulatory Analysis
Project, January 2014. Steve Nadel, 2014, Conquering the Evening Peak, ACEEE.
By implementing these management measures the shape of the duck becomes sleek and it
is able to fly (see the upper graph in Figure V-3). The lower graph, from a study by Deutsche
Bank presents the same result in a more traditional manner. The RAP Project describes the
result as follows
Thus, our modified post-renewable load is easier to serve than the actual load projected to exist
would have been without the addition of renewable resources. This is desirable for almost any
electric utility system, including those without significant renewable energy deployment issues.
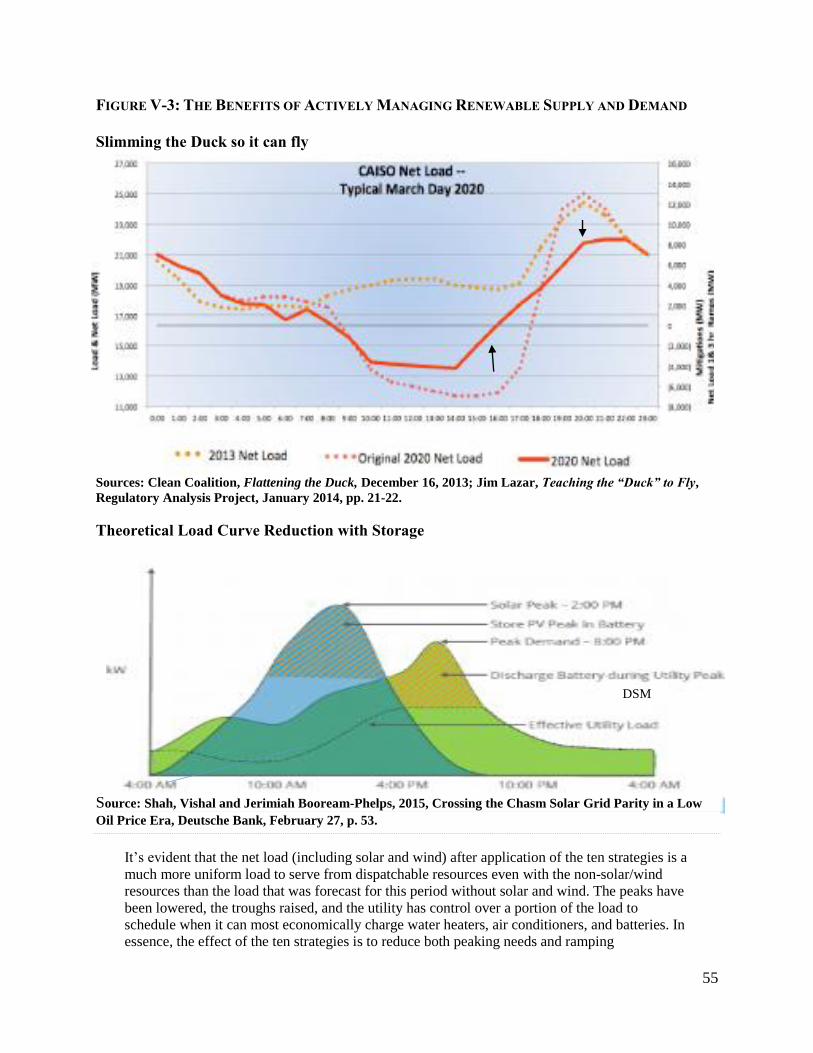
55
FIGURE V-3: THE BENEFITS OF ACTIVELY MANAGING RENEWABLE SUPPLY AND DEMAND
Slimming the Duck so it can fly
Sources: Clean Coalition, Flattening the Duck, December 16, 2013; Jim Lazar, Teaching the “Duck” to Fly,
Regulatory Analysis Project, January 2014, pp. 21-22.
Theoretical Load Curve Reduction with Storage
DSM
Source: Shah, Vishal and Jerimiah Booream-Phelps, 2015, Crossing the Chasm Solar Grid Parity in a Low
Oil Price Era, Deutsche Bank, February 27, p. 53.
It’s evident that the net load (including solar and wind) after application of the ten strategies is a
much more uniform load to serve from dispatchable resources even with the non-solar/wind
resources than the load that was forecast for this period without solar and wind. The peaks have
been lowered, the troughs raised, and the utility has control over a portion of the load to
schedule when it can most economically charge water heaters, air conditioners, and batteries. In
essence, the effect of the ten strategies is to reduce both peaking needs and ramping
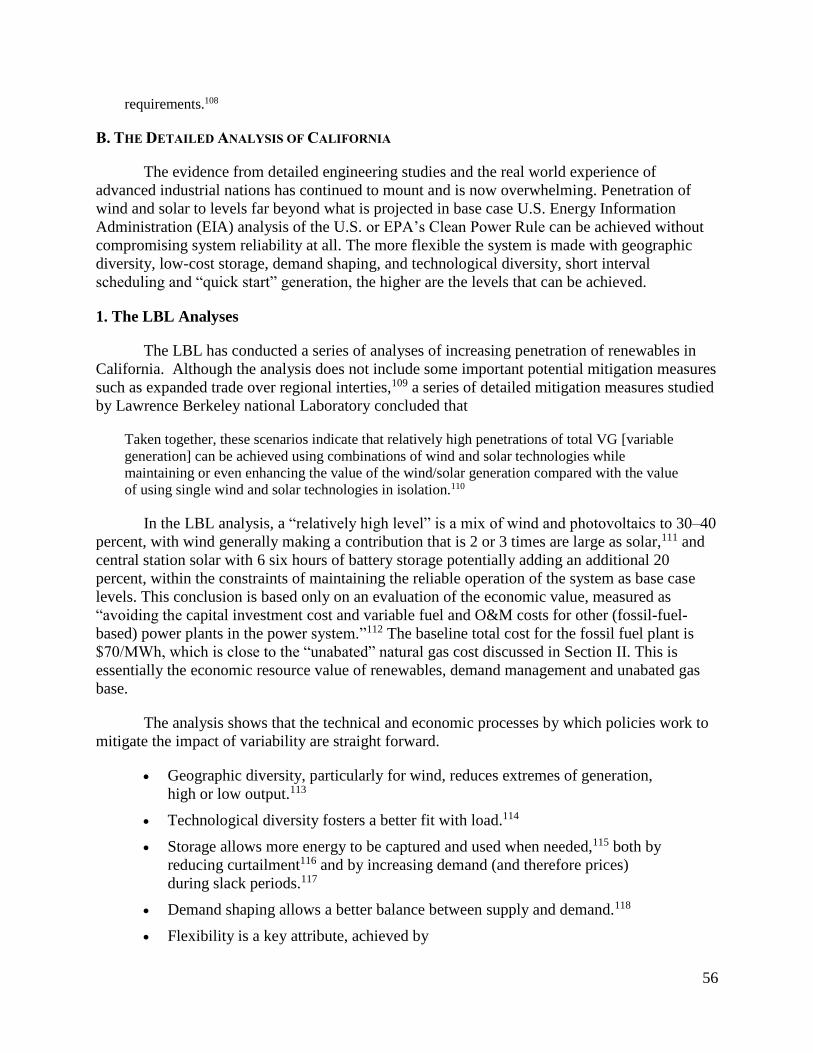
56
requirements.108
B. THE DETAILED ANALYSIS OF CALIFORNIA
The evidence from detailed engineering studies and the real world experience of
advanced industrial nations has continued to mount and is now overwhelming. Penetration of
wind and solar to levels far beyond what is projected in base case U.S. Energy Information
Administration (EIA) analysis of the U.S. or EPA’s Clean Power Rule can be achieved without
compromising system reliability at all. The more flexible the system is made with geographic
diversity, low-cost storage, demand shaping, and technological diversity, short interval
scheduling and “quick start” generation, the higher are the levels that can be achieved.
1. The LBL Analyses
The LBL has conducted a series of analyses of increasing penetration of renewables in
California. Although the analysis does not include some important potential mitigation measures
such as expanded trade over regional interties,109 a series of detailed mitigation measures studied
by Lawrence Berkeley national Laboratory concluded that
Taken together, these scenarios indicate that relatively high penetrations of total VG [variable
generation] can be achieved using combinations of wind and solar technologies while
maintaining or even enhancing the value of the wind/solar generation compared with the value
of using single wind and solar technologies in isolation.110
In the LBL analysis, a “relatively high level” is a mix of wind and photovoltaics to 30–40
percent, with wind generally making a contribution that is 2 or 3 times are large as solar,111 and
central station solar with 6 six hours of battery storage potentially adding an additional 20
percent, within the constraints of maintaining the reliable operation of the system as base case
levels. This conclusion is based only on an evaluation of the economic value, measured as
“avoiding the capital investment cost and variable fuel and O&M costs for other (fossil-fuel-
based) power plants in the power system.”112 The baseline total cost for the fossil fuel plant is
$70/MWh, which is close to the “unabated” natural gas cost discussed in Section II. This is
essentially the economic resource value of renewables, demand management and unabated gas
base.
The analysis shows that the technical and economic processes by which policies work to
mitigate the impact of variability are straight forward.
Geographic diversity, particularly for wind, reduces extremes of generation,
high or low output.113
Technological diversity fosters a better fit with load.114
Storage allows more energy to be captured and used when needed,115 both by
reducing curtailment116 and by increasing demand (and therefore prices)
during slack periods.117
Demand shaping allows a better balance between supply and demand.118
Flexibility is a key attribute, achieved by
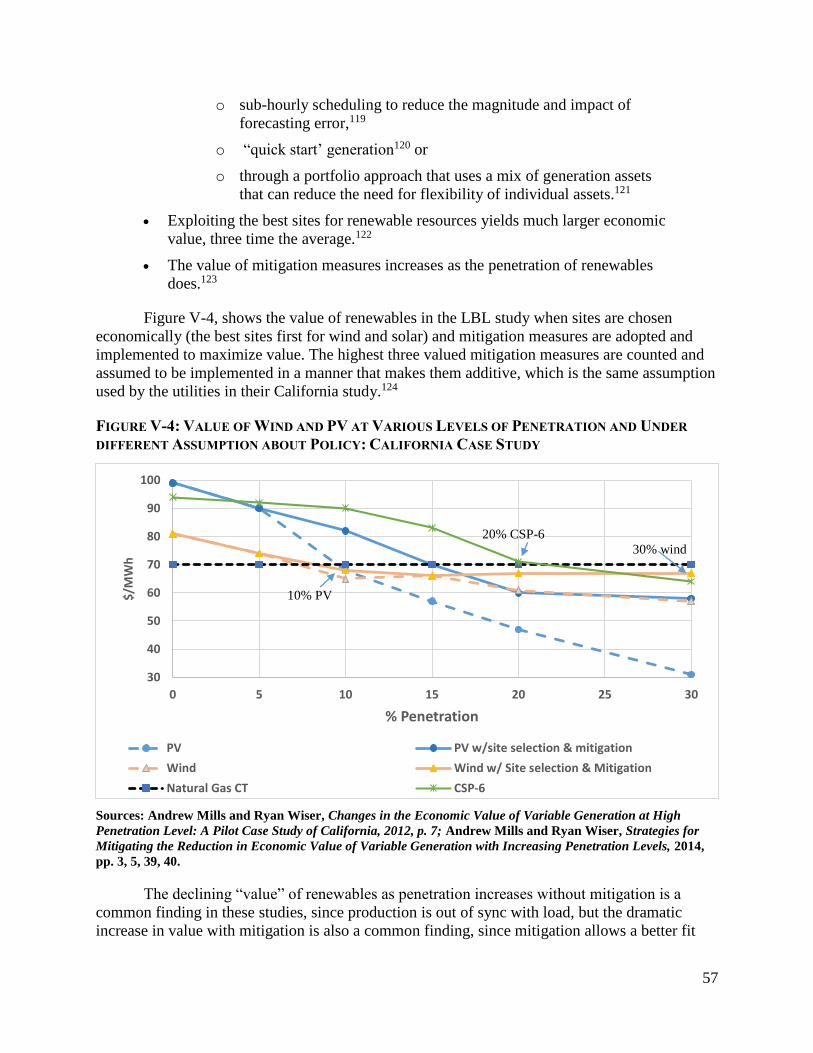
57
30
40
50
60
70
80
90
100
0 5 10 15 20 25 30
$/M
Wh
% Penetration
PV PV w/site selection & mitigation
Wind Wind w/ Site selection & Mitigation
Natural Gas CT CSP-6
o sub-hourly scheduling to reduce the magnitude and impact of
forecasting error,119
o “quick start’ generation120 or
o through a portfolio approach that uses a mix of generation assets
that can reduce the need for flexibility of individual assets.121
Exploiting the best sites for renewable resources yields much larger economic
value, three time the average.122
The value of mitigation measures increases as the penetration of renewables
does.123
Figure V-4, shows the value of renewables in the LBL study when sites are chosen
economically (the best sites first for wind and solar) and mitigation measures are adopted and
implemented to maximize value. The highest three valued mitigation measures are counted and
assumed to be implemented in a manner that makes them additive, which is the same assumption
used by the utilities in their California study.124
FIGURE V-4: VALUE OF WIND AND PV AT VARIOUS LEVELS OF PENETRATION AND UNDER
DIFFERENT ASSUMPTION ABOUT POLICY: CALIFORNIA CASE STUDY
20% CSP-6
30% wind
10% PV
Sources: Andrew Mills and Ryan Wiser, Changes in the Economic Value of Variable Generation at High
Penetration Level: A Pilot Case Study of California, 2012, p. 7; Andrew Mills and Ryan Wiser, Strategies for
Mitigating the Reduction in Economic Value of Variable Generation with Increasing Penetration Levels, 2014,
pp. 3, 5, 39, 40.
The declining “value” of renewables as penetration increases without mitigation is a
common finding in these studies, since production is out of sync with load, but the dramatic
increase in value with mitigation is also a common finding, since mitigation allows a better fit
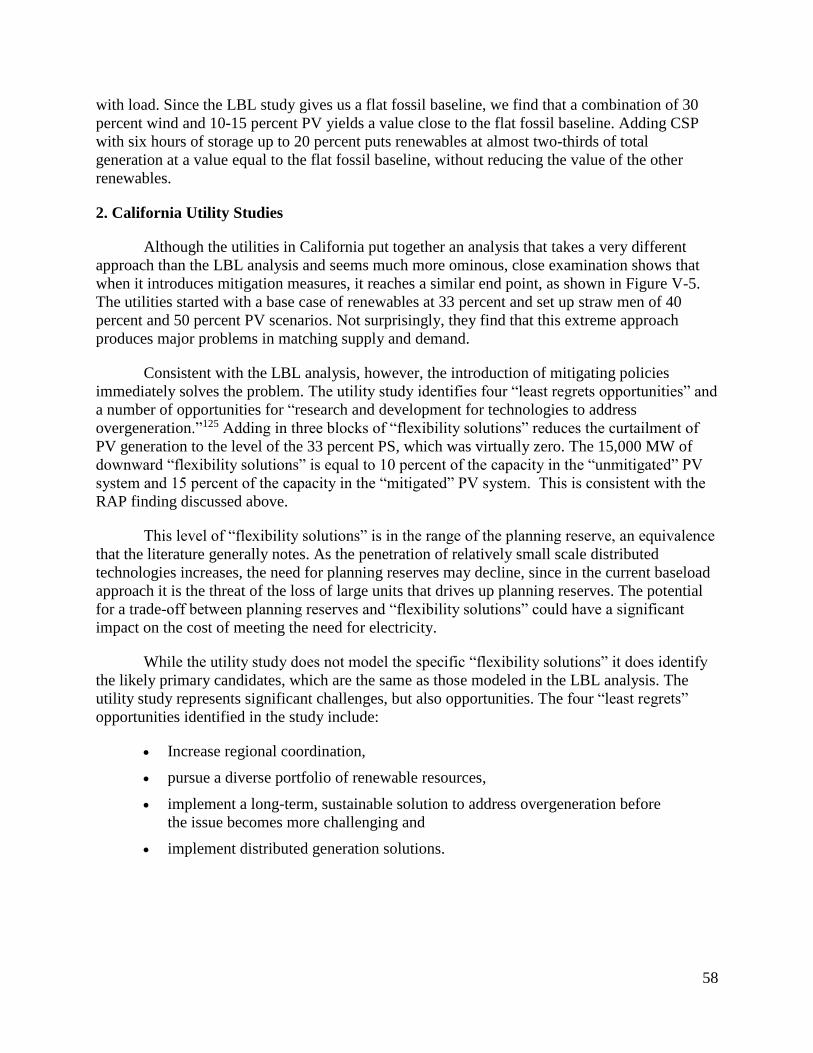
58
with load. Since the LBL study gives us a flat fossil baseline, we find that a combination of 30
percent wind and 10-15 percent PV yields a value close to the flat fossil baseline. Adding CSP
with six hours of storage up to 20 percent puts renewables at almost two-thirds of total
generation at a value equal to the flat fossil baseline, without reducing the value of the other
renewables.
2. California Utility Studies
Although the utilities in California put together an analysis that takes a very different
approach than the LBL analysis and seems much more ominous, close examination shows that
when it introduces mitigation measures, it reaches a similar end point, as shown in Figure V-5.
The utilities started with a base case of renewables at 33 percent and set up straw men of 40
percent and 50 percent PV scenarios. Not surprisingly, they find that this extreme approach
produces major problems in matching supply and demand.
Consistent with the LBL analysis, however, the introduction of mitigating policies
immediately solves the problem. The utility study identifies four “least regrets opportunities” and
a number of opportunities for “research and development for technologies to address
overgeneration.”125 Adding in three blocks of “flexibility solutions” reduces the curtailment of
PV generation to the level of the 33 percent PS, which was virtually zero. The 15,000 MW of
downward “flexibility solutions” is equal to 10 percent of the capacity in the “unmitigated” PV
system and 15 percent of the capacity in the “mitigated” PV system. This is consistent with the
RAP finding discussed above.
This level of “flexibility solutions” is in the range of the planning reserve, an equivalence
that the literature generally notes. As the penetration of relatively small scale distributed
technologies increases, the need for planning reserves may decline, since in the current baseload
approach it is the threat of the loss of large units that drives up planning reserves. The potential
for a trade-off between planning reserves and “flexibility solutions” could have a significant
impact on the cost of meeting the need for electricity.
While the utility study does not model the specific “flexibility solutions” it does identify
the likely primary candidates, which are the same as those modeled in the LBL analysis. The
utility study represents significant challenges, but also opportunities. The four “least regrets”
opportunities identified in the study include:
Increase regional coordination,
pursue a diverse portfolio of renewable resources,
implement a long-term, sustainable solution to address overgeneration before
the issue becomes more challenging and
implement distributed generation solutions.
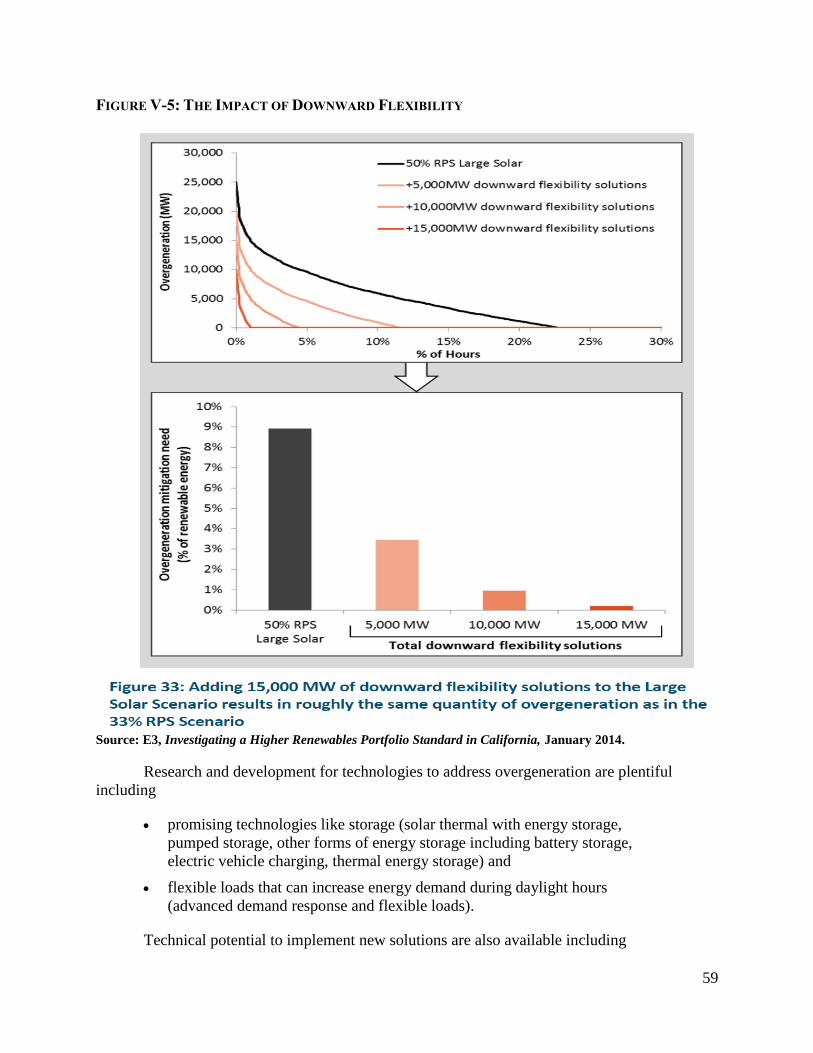
59
FIGURE V-5: THE IMPACT OF DOWNWARD FLEXIBILITY
Source: E3, Investigating a Higher Renewables Portfolio Standard in California, January 2014.
Research and development for technologies to address overgeneration are plentiful
including
promising technologies like storage (solar thermal with energy storage,
pumped storage, other forms of energy storage including battery storage,
electric vehicle charging, thermal energy storage) and
flexible loads that can increase energy demand during daylight hours
(advanced demand response and flexible loads).
Technical potential to implement new solutions are also available including

60
sub-five minute operations,
creating a large potential export markets for excess energy,
changing the profile of daily energy demand and
optimizing the thermal generation fleet under high RPS.126
The potential for extremely rapid balancing, innovative battery technologies and
microgrids, which address the core problem of reliability in the digital age have only begun to be
appreciated.127
The LBL study cautions that the choice of the level of renewable resources will depend
on the relative cost of the resources, “determining whether to pursue technological diversity as a
mitigation measure would require comparing the anticipated increase in value against the
potential higher cost of building combinations of technologies to achieve the target penetration
level.”128 Sections II and III showed that the current and projected costs of resources strongly
favor efficiency and renewables, with the cost of storage plummeting.
The LBL analysis does “not consider many other costs and impacts that may be
important, including environmental impacts, transmission and distribution costs or benefits,
effects related to the “lumpiness” and irreversibility of investment decisions, and uncertainty in
future fuel and investment capital costs.”129 I have shown in Section IV that the consideration of
“lumpiness, irreversibility, and uncertainty” strongly favor investment in efficiency and
renewables. Section VIII shows that environmental considerations do so as well. Increases in
transmission costs, which might cut against renewables, are small and offset by potential
distribution cost savings. The empirical evidence indicates that the cost of integration are not
very large.130
The LBL study cautions that policy needs to be tailored to achieve some of the mitigation
effects, particularly demand shaping,131 and technology limitations need to be taken into account
in system design (particularly storage).132 The attention to specific needs, goals and limitations
stems from the fact that there are so many options that can be used to ensure reliable supply. It is
not a question of whether reliability can be maintained, but choosing the least cost way to do so
and the costs can be quite small, far less than the resource cost difference between nuclear and
the other low carbon alternatives.133 In the face of this evidence, claims that renewables will
harm the reliability of an electricity system that is designed to accommodate high levels of
renewables are simply wrong. They ignore the real world and are driven entirely by politics, not
scientific evidence.
I show in the next Section that efforts to create a crisis of reliability in the short term are
also misguided. The electricity system is already designed to handle much larger shifts in the
resource mix or demands placed on it than the orderly development of high penetration of
renewables would impose on the system. Simply put, with sensible and efficient policy, the
current electricity system can easily get to much higher levels of penetration of renewables and
efficiency, while the physical and institutional foundation for much higher levels is built. In fact,
the Department of Energy put it quite simply in concluding that wind could reach very high
levels of penetration, “Wind generation variability has a minimal and manageable impact on grid
reliability and related costs.”134 In sum, careful analysis shows that reliability is a non-issue; the
61
conflict is about the future of the techno-economic structure of the electricity sector in the 21st
century.
3. Other Studies
California attracts a great deal of attention because it is a large U.S. electricity market
with a strong commitment to shifting to renewables. It is also of interest since it experienced the
largest early retirement of nuclear reactors in almost two decades. In fact, it is the largest early
retirement of nuclear reactors in U.S. history. The fact that it was handled with relative ease is a
good indication that early retirements are manageable. In fact, the dozens of early retirements
that have occurred throughout the history of the commercial nuclear sector in the U.S. suggest
that, as a general proposition, the electricity system can manage them well.
The conclusion that high levels of penetration of renewables can be achieved without
undermining reliability is supported in the literature in a variety of ways.
First, there are other studies of California135 that reach the same conclusions,
while simultaneously analyzing other U.S. areas.136
Second, I have already noted that there are numerous studies of other states
that support the basic findings of these California studies including very
diverse areas – Texas, Mid-America137 and the Mid-Atlantic.138
Third, there are numerous studies of other nations, particularly in Europe.139
Fourth, there is a great deal of conceptual work on how integration can be
accomplished.140
There are two important points made in these studies, in addition to the fact that they
support the general proposition that high levels of penetration of renewables can be achieved
without undermining reliability.
First, the finding spans different types of renewables. A study that focuses on California
and the independent system operator in the Midwest, MISO, finds that policies to handle high
level of penetration of renewables work in both cases. The only difference is that the leading
renewable resources will differ between regions depending on the richness of the resource. In
the upper Midwest, wind is the economically preferred option. Nevertheless, a mix of renewable
resource is preferable as penetrations rise.
Second, the findings directly and indirectly support the proposition that the cost of
building and operating a system that includes high levels of penetration of renewables is quite
reasonable, when policies to manage the integration of renewable resources are implemented.
The literature puts the cost well below $0.01 per kwh.141 Recalling the cost advantage that
renewables enjoy today and the even larger cost advantage that they are expected to enjoy in the
mid-term, this makes the 21st century electricity system the least cost approach in a low carbon
environment by a wide margin.
The finding that the cost of the integration of distributed supply and actively managed
demand are quite small enjoys a strong consensus in the literature, which is reflected in the DOE
62
Wind Vision. The DOE analysis provides a simple explanation. In the early years of the
transition, costs rise slightly because new generation resources are being deployed. The
increasing cost of electricity is primarily the result of the need to decarbonize the sector because
aging and polluting generation must be replaced. The new generation is more costly than
depreciated plant that has been deployed without concern about the external costs of climate
change. This is consistent with the analysis offered by the EPA in its Clean Power Plan, which
shows a slight increase in real costs in the mid-term.142
However, in the mid and long terms, costs fall. The aging, polluting generation would
have had to be replaced without decarbonization and the cost of the alternatives has been
declining due to technological progress. In the long term the cost of electricity is lower.
The DOE explicitly laid out the process in the case of transmission.143 The Wind Vision
analysis argues that transmission costs are constantly being incurred by the electricity system. In
the early years, those costs are reallocated from supporting the central station generation (which
is shrinking) to supporting the new distributed resources. There is only a slight net increase in
transmission investment. As time goes on and the share of renewables grows, the transmission
costs increase. However, they are complementary to the deployment of renewables, whose
capital and operating costs have been declining and are much lower than the non-renewable low
carbon alternatives.
This is consistent with the analysis of cost in Part I. The capital cost of nuclear reactors
was always high and gets higher, relative to the renewables over time. The capital cost of fossil
fuel consumption increases dramatically, as carbon capture is required for decarbonization.
Given the strong trends of declining cost, the savings on the capital cost of distributed resources
more than offsets the increase in capital expenditures on transmission, distribution and operation,
as suggested by the Wind Vision scenario.
C. INCUMBENT OPPOSITION TO THE TRANSFORMATION OF THE ELECTRICITY SECTOR:
NERC’S RESPONSE TO THE CLEAN POWER PLAN
This analysis has shown that the trade and academic literature, as well as real world
experience indicates that following a path toward a 21st century electricity system poses no
serious threat to reliability up to a 30% - 40% penetration. The same analyses have identified the
specific actions that can carry the system to much higher levels of reliance on renewables.
Combining these measures which allow the system to operate at high levels of penetration with
the implementation of aggressive efficiency measures meets 80% of business as usual or base
case demand. Adding in the transformation dividend of reduced demand would put the total
above 90%. Pursued aggressively, the magnitude and timing of the transformation meets the
need for an effective response to climate change.
Given this conclusion, the analysis of the EPA’s Clean Power Plan from the North
American Electric Reliability Corporation (NERC) provides a useful link to the discussion of the
battle the incumbent utilities, led by nuclear, are fighting against this transformation. The NERC
analysis is a classic example of the static, backward looking industry analysis discussed in
Section II that is routinely produced in the efficiency space in an effort to derail efforts to adopt
beneficial regulations. By making a series of unrealistic assumptions and assuming the worst
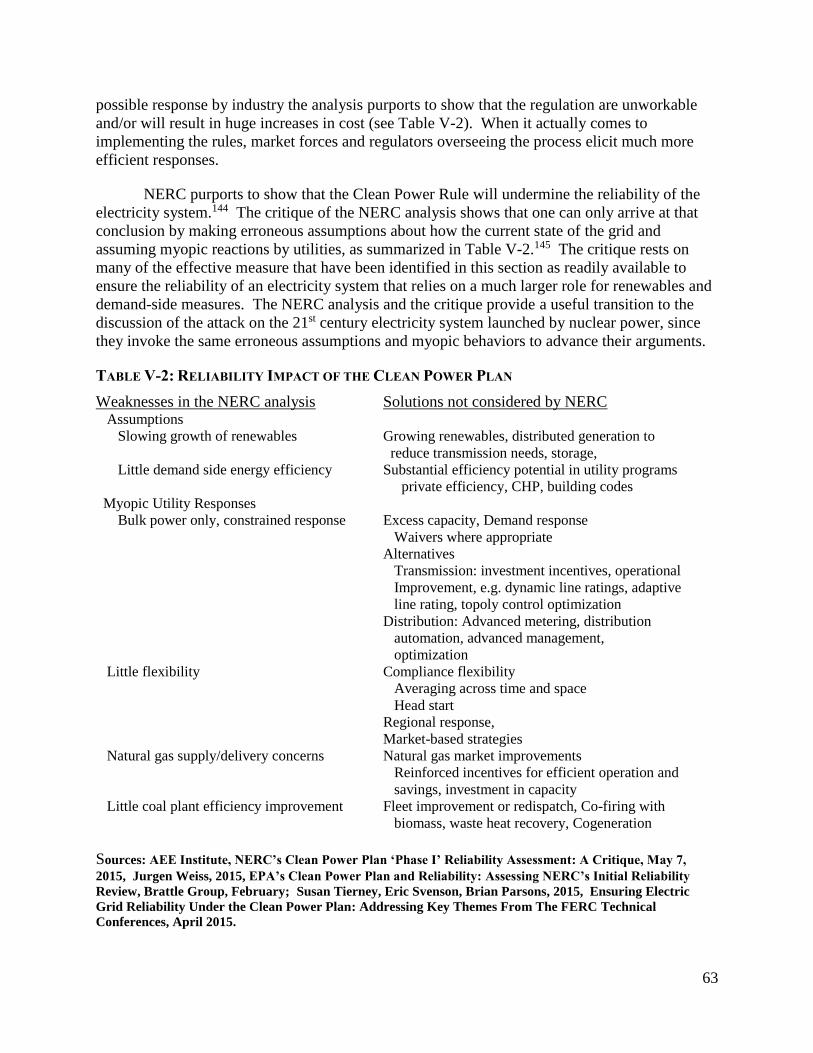
63
possible response by industry the analysis purports to show that the regulation are unworkable
and/or will result in huge increases in cost (see Table V-2). When it actually comes to
implementing the rules, market forces and regulators overseeing the process elicit much more
efficient responses.
NERC purports to show that the Clean Power Rule will undermine the reliability of the
electricity system.144 The critique of the NERC analysis shows that one can only arrive at that
conclusion by making erroneous assumptions about how the current state of the grid and
assuming myopic reactions by utilities, as summarized in Table V-2.145 The critique rests on
many of the effective measure that have been identified in this section as readily available to
ensure the reliability of an electricity system that relies on a much larger role for renewables and
demand-side measures. The NERC analysis and the critique provide a useful transition to the
discussion of the attack on the 21st century electricity system launched by nuclear power, since
they invoke the same erroneous assumptions and myopic behaviors to advance their arguments.
TABLE V-2: RELIABILITY IMPACT OF THE CLEAN POWER PLAN
Weaknesses in the NERC analysis Solutions not considered by NERC Assumptions
Slowing growth of renewables Growing renewables, distributed generation to
reduce transmission needs, storage,
Little demand side energy efficiency Substantial efficiency potential in utility programs
private efficiency, CHP, building codes
Myopic Utility Responses
Bulk power only, constrained response Excess capacity, Demand response
Waivers where appropriate
Alternatives
Transmission: investment incentives, operational
Improvement, e.g. dynamic line ratings, adaptive
line rating, topoly control optimization
Distribution: Advanced metering, distribution
automation, advanced management,
optimization
Little flexibility Compliance flexibility
Averaging across time and space
Head start
Regional response,
Market-based strategies
Natural gas supply/delivery concerns Natural gas market improvements
Reinforced incentives for efficient operation and
savings, investment in capacity
Little coal plant efficiency improvement Fleet improvement or redispatch, Co-firing with
biomass, waste heat recovery, Cogeneration
Sources: AEE Institute, NERC’s Clean Power Plan ‘Phase I’ Reliability Assessment: A Critique, May 7,
2015, Jurgen Weiss, 2015, EPA’s Clean Power Plan and Reliability: Assessing NERC’s Initial Reliability
Review, Brattle Group, February; Susan Tierney, Eric Svenson, Brian Parsons, 2015, Ensuring Electric
Grid Reliability Under the Clean Power Plan: Addressing Key Themes From The FERC Technical
Conferences, April 2015.
64
D. CONCLUSION
1. A Global Perspective
In this part I have looked intensively at the positive prospects for high levels of
penetration of renewables in the U.S. I have noted that similar findings have been made for
other nations. Throughout Part II I have shown that the intensive analyses of two areas – the U.S.
and Western Europe – and the real world experience of states or nations within those regions –
lead to the strong conclusion that high levels of penetration of the 21st century model are not only
feasible, but also the least cost approach to meeting the need for electricity in a decarbonized
sector. Another particularly interesting case of a continental ecosystem is Australia. The
analysis of the potential for renewables in Australia produces similar results as the U.S.146 It put
the technical potential of wind at 30 times 2011 consumption and solar at 200-350 times 2001
consumption.147 The estimated cost of integration is similar to the other U.S, and European
estimates – in the range of $0.005 to $0.01/kWh including transmission costs.148
The high level operational review found that operational issues appear manageable, but it
is noted that several key considerations would require more detailed investigation. Overall, the
transmission network would require significant expansion to transport renewable generation to
customers and significant management of the transition to 100 per cent renewables.
Considerable PV generation in all four cases drives demand and load pattern changes.
Based on the modelled PV generation levels the NEM is likely to become winter peaking (in
contrast to most regions’ current summer peak), which means managing heating loads would be
more critical than the current air-conditioning loads. The PV contribution levels also (typically)
cause generation availability to peak around midday, so DSP would move demand into this
period rather than the traditional late night off-peak periods.149
The parallel is also strongly evident in looking at the least cost penetration of renewables
and their cost impact. High levels (~75%) yield lower cost and lower risk, low carbon portfolios.
In 2030, the lowest expected cost generation portfolio includes 60% renewable energy.
Increasing the renewable proportion to75% slightly increased expected cost (by$0.2/MWh), but
significantly decreased the standard deviation of cost (representing the cost risk). Increasing the
renewable proportion from the present 15% to 75% by 2030 is found to decrease expected
wholesale electricity costs by $17/MWh. Fossil-fuel intensive portfolios have substantial cost
risk associated with high uncertainty in future gas and carbon prices. Renewables can
effectively mitigate cost risk associated with gas and carbon price uncertainty. This is found to
be robust to a wide range of carbon pricing assumptions. This modelling suggests that policy
mechanisms to promote an increase in renewable generation towards a level of 75% by 2030
would minimize costs to consumers, and mitigate the risk of extreme electricity prices due to
uncertain gas and carbon prices.150
Using a commercially available modelling package, PLEXOS, we model what a transition to
gas fired generation in the year 2035 would deliver and compare that to a transition to power
from renewable technologies. The results indicate that a transition to gas fired generation
reduces emissions only marginally and that wholesale prices will be higher than the renewable
energy option.151
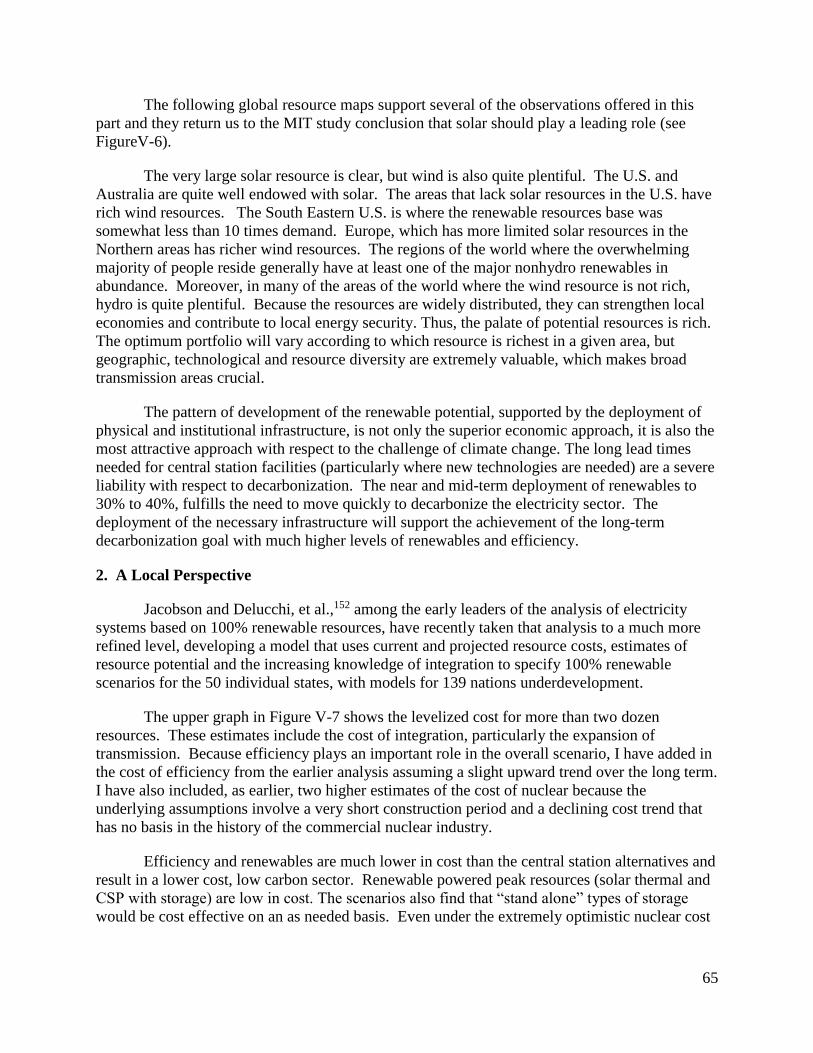
65
The following global resource maps support several of the observations offered in this
part and they return us to the MIT study conclusion that solar should play a leading role (see
FigureV-6).
The very large solar resource is clear, but wind is also quite plentiful. The U.S. and
Australia are quite well endowed with solar. The areas that lack solar resources in the U.S. have
rich wind resources. The South Eastern U.S. is where the renewable resources base was
somewhat less than 10 times demand. Europe, which has more limited solar resources in the
Northern areas has richer wind resources. The regions of the world where the overwhelming
majority of people reside generally have at least one of the major nonhydro renewables in
abundance. Moreover, in many of the areas of the world where the wind resource is not rich,
hydro is quite plentiful. Because the resources are widely distributed, they can strengthen local
economies and contribute to local energy security. Thus, the palate of potential resources is rich.
The optimum portfolio will vary according to which resource is richest in a given area, but
geographic, technological and resource diversity are extremely valuable, which makes broad
transmission areas crucial.
The pattern of development of the renewable potential, supported by the deployment of
physical and institutional infrastructure, is not only the superior economic approach, it is also the
most attractive approach with respect to the challenge of climate change. The long lead times
needed for central station facilities (particularly where new technologies are needed) are a severe
liability with respect to decarbonization. The near and mid-term deployment of renewables to
30% to 40%, fulfills the need to move quickly to decarbonize the electricity sector. The
deployment of the necessary infrastructure will support the achievement of the long-term
decarbonization goal with much higher levels of renewables and efficiency.
2. A Local Perspective
Jacobson and Delucchi, et al.,152 among the early leaders of the analysis of electricity
systems based on 100% renewable resources, have recently taken that analysis to a much more
refined level, developing a model that uses current and projected resource costs, estimates of
resource potential and the increasing knowledge of integration to specify 100% renewable
scenarios for the 50 individual states, with models for 139 nations underdevelopment.
The upper graph in Figure V-7 shows the levelized cost for more than two dozen
resources. These estimates include the cost of integration, particularly the expansion of
transmission. Because efficiency plays an important role in the overall scenario, I have added in
the cost of efficiency from the earlier analysis assuming a slight upward trend over the long term.
I have also included, as earlier, two higher estimates of the cost of nuclear because the
underlying assumptions involve a very short construction period and a declining cost trend that
has no basis in the history of the commercial nuclear industry.
Efficiency and renewables are much lower in cost than the central station alternatives and
result in a lower cost, low carbon sector. Renewable powered peak resources (solar thermal and
CSP with storage) are low in cost. The scenarios also find that “stand alone” types of storage
would be cost effective on an as needed basis. Even under the extremely optimistic nuclear cost
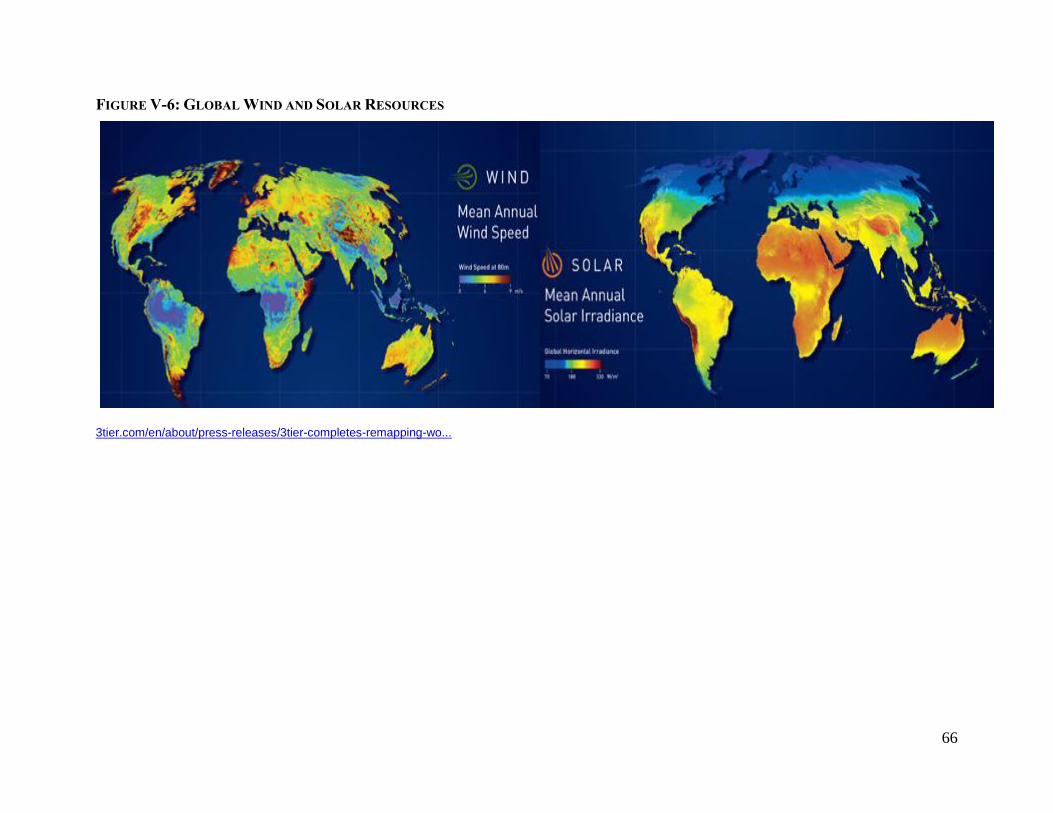
66
FIGURE V-6: GLOBAL WIND AND SOLAR RESOURCES
3tier.com/en/about/press-releases/3tier-completes-remapping-wo...
67
$0.00
$0.05
$0.10
$0.15
$0.20
$0.25
$0.30
$0.35
$0.40
$0.45
LCO
E $
/KW
hFIGURE V-7: COST AND RESOURCE MIX FOR 100% RENEWABLE SCENARIO
LCOE, 2050
Central Station Traditional
Peak
Decentralized Nuclear
Renewable Powered Peak
Resource Mix, in %
Mark Z. Jacobson, et al., 2015, “100% clean and renewable wind, water, and sunlight (WWS) all-sector
energy roadmaps for the 50 United States,” Energy & Environmental Science, Table 5,Table 3.
0
10
20
30
40
50
60
70
80
90
100
AL
AK
AZ
AR
CA
CO C
DE FL GA HI
ID IL IN IA KS
KY
LA ME
MD
MA
MI
MN
MS
MO
MT
NE
NV
NH NJ
NM NY
NC
ND
OH
OK
OR
PA RI
SC SD TN TX UT
VT
VA
WA
WV
WI
WY
US
Wind Utility & CSP Solar Hydro

68
assumptions, the analysis builds 100% renewable portfolios that are 7% lower in cost than the
conventional generation low carbon scenario.
The lower graph in Figure V-7 shows the mix of resources on a state-by-state basis.
Wind, large solar (utility scale PV and CSP with storage), and hydro combine to meet the vast
majority of the need in all but three states. The graph captures the important role that the
richness of the local resource plays in defining the least-cost mix. The ratio of wind-to-solar
varyies widely, which is what has been observed in studies of individual nations as noted above.
The three states where those resources play a relatively small role occur where the geothermal
resource is rich (Hawaii, Nevada and Idaho).
The opportunity to build the 21st century electricity system centered on distributed,
renewable resources and actively managed demand is very real and very attractive. As discussed
in the next section, it is also very threatening to and adamantly opposed by incumbent interests
grounded in the central station model.
69
PART III. THE NUCLEAR WAR AGAINST THE FUTURE
70
VI. THE ATTACK ON RENEWABLES:
THE PRIMARY DIVERSIONARY TACTIC, RELIABILITY
A. CREATIVE DESTRUCTION AND CONSTRUCTION
The analysis in Part II leads to the conclusion that the electricity sector is on the cusp of a
major transformation, which will have major implications for the structure of the sector. It is
part of the rapid and continuous process of creative destruction and construction that typifies
advanced market economies, particularly as technological revolutions unfold.153 The process of
creating a new technology paradigm destroys the old one, although it can unfold over decades.
Independent financial analysts are signaling the dramatic impact that the emergence of the 21st
century electricity market could have on the 20th century utility business model.
Investors beware: Distributed generation (DG) could kill utilities as we know them today. It
could take a decade or more in the United States, but some European utilities already are facing
change-or-die challenges due to DG. Technologies such as rooftop solar reduce the value of
utilities’ century-old centralized networks, and erode their efficient-scale competitive
advantage. As more customers adopt DG, utilities’ costs to maintain and operate the grid must
be spread across a smaller customer base, raising customer rates and increasing the economic
incentive to cut the cord. The death spiral ends when investors—equity and credit—are left
holding an empty purse of dormant power plants and copper wires.
We think the sector’s imminent demise is premature, but DG is already starting to shrink some
utilities’ economic moats. The electric utilities industry group Edison Electric Institute (EEI)
recently identified DG as the largest disruptive threat to utilities’ business models and financial
health. We agree. Utilities’ efficient-scale competitive advantages rely on their centralized
network monopolies, but that breaks down when customers become self-sufficient competitors.
The cost-of-service regulatory model that allows utilities to earn at least their cost of capital in
the long run also breaks down when fewer and fewer customers are bearing the costs of
maintaining the centralized network. Ultimately, utilities’ earnings will shrink, cash flows will
suffer, ROIC will fall, and utilities’ interest and dividend payments will become less certain.154
Change is sweeping across the plains of our energy landscape. The combination of solar leasing,
advances in renewable energy storage, and the brave new world of the "Internet of Things" spell
doom for utilities as we know them. Utility shares could be worth a lot less, and sooner than
investors would care to recognize.
The electric utility business model has remained stubbornly unchanged for much of the last 50
years. While telecoms, health care, and other industry structures have hurtled ahead -- for better
or worse -- in response to our modern technological and regulatory framework, the system that
powers our homes and businesses seems almost anachronistic at this point. Utilities invest in
building large-scale generation plants and a transmission and distribution architecture to move
power from source to end user, and then recoup costs through the rates they charge
customers.155
It is not only high-capital cost generation that is feeling the profit pressures. “Disruptive”
has become the watchword for this analysis. The Edison Electric Institute document referred to
in the first quote above recognized the potential disruption.
Recent technological and economic changes are expected to challenge and transform the electric
71
utility industry. These changes (or “disruptive challenges”) arise due to a convergence of
factors, including: falling costs of distributed generation and other distributed energy resources
(DER); an enhanced focus on development of new DER technologies; increasing customer,
regulatory, and political interest in demand side management technologies (DSM); government
programs to incentivize selected technologies; the declining price of natural gas; slowing
economic growth trends; and rising electricity prices in certain areas of the country… the
industry and its stakeholders must proactively assess the impacts and alternatives available to
address disruptive challenges in a timely manner.156
A year later, The Edison Electric Institute formed an alliance with a leading
environmental group (NRDC–National Resources Defense Council) to call for changes in tariff
and rates structures that recognize the emerging reality. Their joint statement recognizes the
inability/inappropriateness of recovering capital costs in variable charges and the need to
transform the grid and its operation into a two-way network that supports decentralized
behaviors at the edge of the network to improve the efficiency of the sector, but requires a
physical and institutional transformation.
The public effort to form alliances to come to grips with the transformation of the
electricity system came a year after the launch of a private effort to control and slow its harmful
effect. At the highest level meeting of the industry’s trade association an “action plan” 157 was
launched to deal with
“Facing the challenge of a Distribution System in Transition
Transition creates new challenges for utilities:
Prospect of declining retail sales,
Financing of major investment in the T&D system; workforce issues,
Potential obsolescence of existing business and regulatory models.”
For the chief executives, “the challenge: How do you grow earnings in this environment.”
The culprits were “loss of customers” and “competition.” The target of the campaign was
identified as “hidden subsidies like net metering allow higher income customers to avoid system
costs (pay little distribution or other fixed costs, despite the fact that they impose new costs on
the system), which are then paid by middle class and lower income customers.” The strategy
was to “raise concerns about net metering” among customers, policy makers and regulators. The
ultimate goal was to secure the utilities central role in the future utility system
“gain support for utility involvement in DG, microgrid space
Promote fleet and off-road transportation applications
Incorporate multi-site DC companies
Provide members with DC market activities, best practices, competitive
intelligence
Siting utility-owned generation on DOD land
Expand Utility Energy Services Contract, privatization initiatives.”
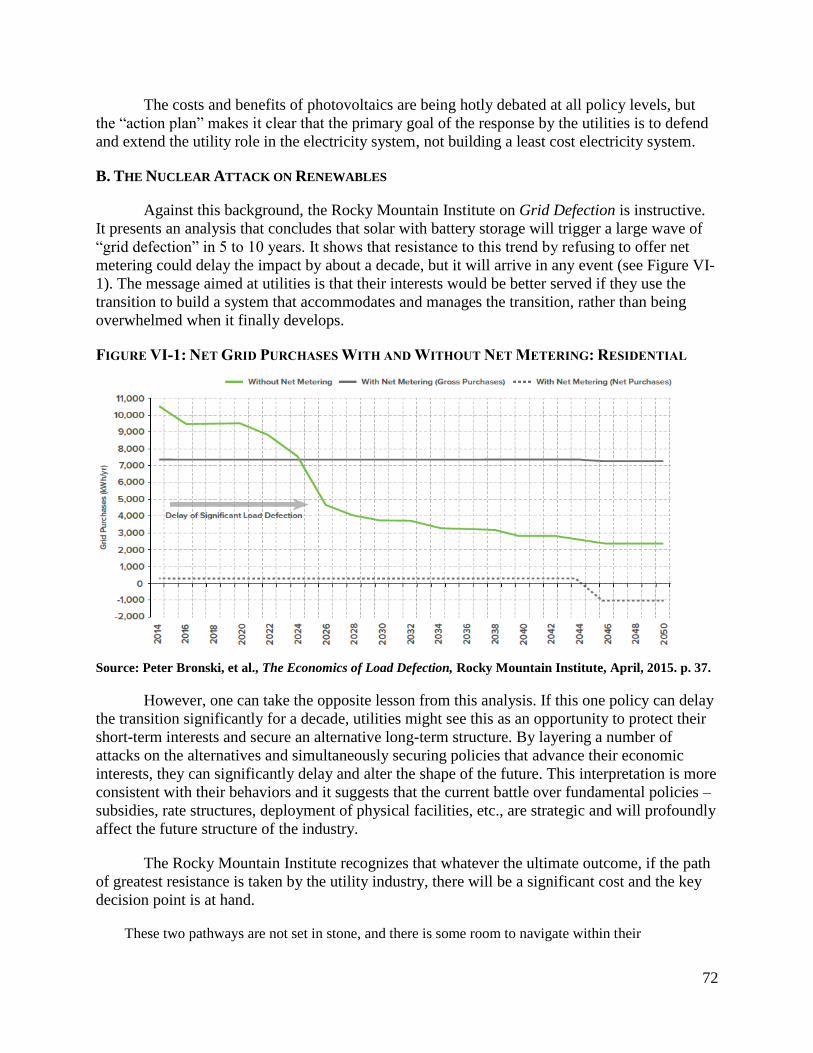
72
The costs and benefits of photovoltaics are being hotly debated at all policy levels, but
the “action plan” makes it clear that the primary goal of the response by the utilities is to defend
and extend the utility role in the electricity system, not building a least cost electricity system.
B. THE NUCLEAR ATTACK ON RENEWABLES
Against this background, the Rocky Mountain Institute on Grid Defection is instructive.
It presents an analysis that concludes that solar with battery storage will trigger a large wave of
“grid defection” in 5 to 10 years. It shows that resistance to this trend by refusing to offer net
metering could delay the impact by about a decade, but it will arrive in any event (see Figure VI-
1). The message aimed at utilities is that their interests would be better served if they use the
transition to build a system that accommodates and manages the transition, rather than being
overwhelmed when it finally develops.
FIGURE VI-1: NET GRID PURCHASES WITH AND WITHOUT NET METERING: RESIDENTIAL
Source: Peter Bronski, et al., The Economics of Load Defection, Rocky Mountain Institute, April, 2015. p. 37.
However, one can take the opposite lesson from this analysis. If this one policy can delay
the transition significantly for a decade, utilities might see this as an opportunity to protect their
short-term interests and secure an alternative long-term structure. By layering a number of
attacks on the alternatives and simultaneously securing policies that advance their economic
interests, they can significantly delay and alter the shape of the future. This interpretation is more
consistent with their behaviors and it suggests that the current battle over fundamental policies –
subsidies, rate structures, deployment of physical facilities, etc., are strategic and will profoundly
affect the future structure of the industry.
The Rocky Mountain Institute recognizes that whatever the ultimate outcome, if the path
of greatest resistance is taken by the utility industry, there will be a significant cost and the key
decision point is at hand.
These two pathways are not set in stone, and there is some room to navigate within their
73
boundaries. But decisions made today will set us on a trajectory from which it will be more
difficult to course correct in the future. The time frame for making such decisions with long-
lasting implications for the future grid is relatively short, and is shorter and more urgent for
some geographies than others.158
The Rocky Mountain Institute is certainly not the only one to suggest that there is a direct
link between policy choices and industry structure. The baseload dominated electricity system
was created by policy support and subsidies for physical and institutional infrastructure that
favored a specific type of technology. The dominant incumbents will seek to slow or stop the
spread of alternatives by deny their access to a similar process that they understand well.
Their diffusion can be slowed by effects of path dependence and lock-in of earlier technology
systems…. high carbon technologies and supporting institutional rule systems have co-evolved,
leading to the current state of ‘carbon lock-in’. For example, reductions in cost and the spread of
infra- structure supporting coal- and gas-fired electricity generation enabled the diffusion of
electricity-using devices and the creation of institutions, such as cost-plus regulation, which
encouraged further investment in high carbon generation and networks. This created systemic
barriers to investment in low carbon energy technologies….
The proposition that industries or technologies whose ascendancy is threatened by new
competition tend to respond, carries some weight. It also suggests that actors, such as large
energy companies, with substantial investments in the current system and its technologies, and
relatively strong political influence, are likely to act to frustrate the implementation of
institutional changes that would support the implementation of low carbon technologies.159
The economic conflict of interest between nuclear power and the lower-cost, low-carbon
alternatives is reinforced by fundamental differences between central station power and
distributed resources in terms of technological competence and institutional requirements. In
short, this clash is inevitable and has given rise to a frontal assault by nuclear advocates on the
alternative resources and institutions that will support them (see Table VI-1).160
Lovins had earlier elaborated on the deep-seated sources of conflict, making it clear that a
truce that tries to accommodate both sides is neither very likely, nor good policy.
“All of the above” scenarios are… undesirable for several reasons…. First, central thermal
plants are too inflexible to play well with variable renewables, and their market prices and
profits drop as renewables gain market share. Second, if resources can compete fairly at all
scales, some and perhaps much, of the transmission built for a centralized vision of the future
grid could quickly become superfluous. Third, big, slow, lumpy costly investments can erode
utilities’ and other provider’s financial stability, while small, fast granular investments can
enhance it. Competition between those two kinds of investments can turn people trying to
recover the former investments into foes of the latter – and threaten big-plant owners’ financial
stability. Fourth, renewable, and especially distributed renewable, futures require very different
regulatory structures and business models. Finally, supply costs aren’t independent of the scale
of deployment, so PV systems installed in Germany in 2010 cost about 56–67% less than
comparable U.S. systems, despite access to the same modules and other technologies at the
same global prices.161
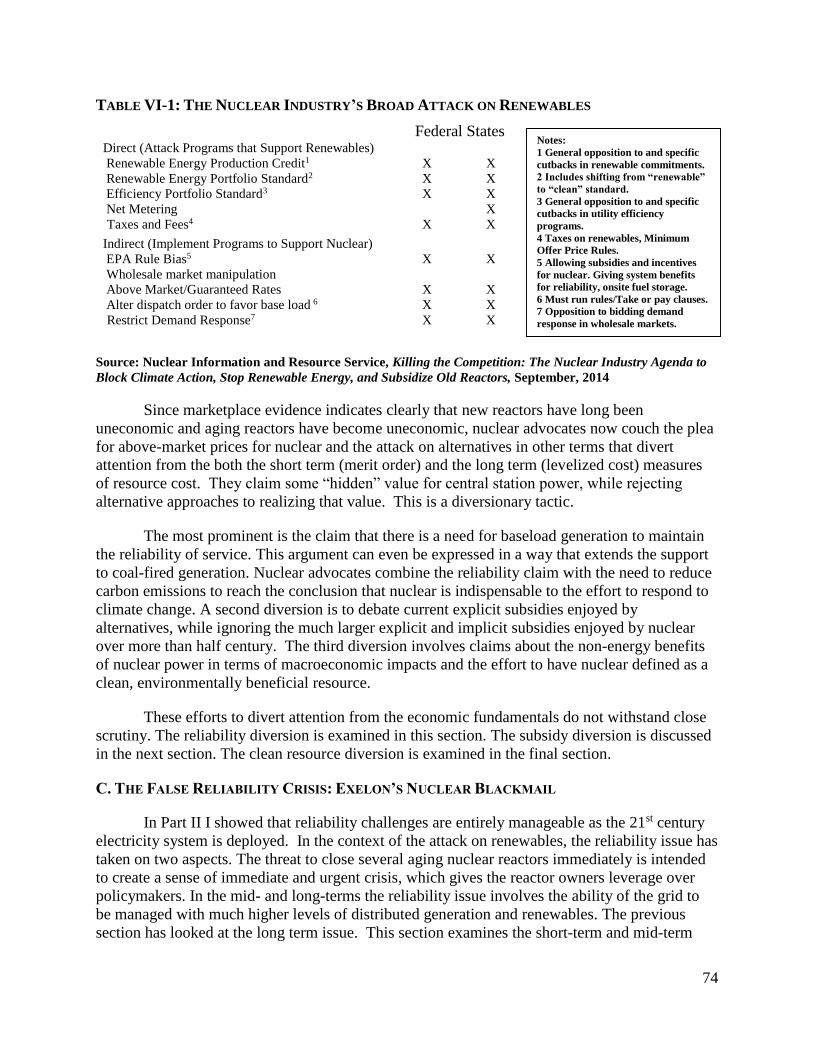
74
Notes:
1 General opposition to and specific
cutbacks in renewable commitments.
2 Includes shifting from “renewable”
to “clean” standard.
3 General opposition to and specific
cutbacks in utility efficiency
programs.
4 Taxes on renewables, Minimum
Offer Price Rules.
5 Allowing subsidies and incentives
for nuclear. Giving system benefits
for reliability, onsite fuel storage.
6 Must run rules/Take or pay clauses.
7 Opposition to bidding demand
response in wholesale markets.
TABLE VI-1: THE NUCLEAR INDUSTRY’S BROAD ATTACK ON RENEWABLES
Federal States Direct (Attack Programs that Support Renewables) Renewable Energy Production Credit1 X X Renewable Energy Portfolio Standard2 X X Efficiency Portfolio Standard3 X X Net Metering X Taxes and Fees4 X X
Indirect (Implement Programs to Support Nuclear) EPA Rule Bias5 X X Wholesale market manipulation Above Market/Guaranteed Rates X X Alter dispatch order to favor base load 6 X X Restrict Demand Response7 X X
Source: Nuclear Information and Resource Service, Killing the Competition: The Nuclear Industry Agenda to
Block Climate Action, Stop Renewable Energy, and Subsidize Old Reactors, September, 2014
Since marketplace evidence indicates clearly that new reactors have long been
uneconomic and aging reactors have become uneconomic, nuclear advocates now couch the plea
for above-market prices for nuclear and the attack on alternatives in other terms that divert
attention from the both the short term (merit order) and the long term (levelized cost) measures
of resource cost. They claim some “hidden” value for central station power, while rejecting
alternative approaches to realizing that value. This is a diversionary tactic.
The most prominent is the claim that there is a need for baseload generation to maintain
the reliability of service. This argument can even be expressed in a way that extends the support
to coal-fired generation. Nuclear advocates combine the reliability claim with the need to reduce
carbon emissions to reach the conclusion that nuclear is indispensable to the effort to respond to
climate change. A second diversion is to debate current explicit subsidies enjoyed by
alternatives, while ignoring the much larger explicit and implicit subsidies enjoyed by nuclear
over more than half century. The third diversion involves claims about the non-energy benefits
of nuclear power in terms of macroeconomic impacts and the effort to have nuclear defined as a
clean, environmentally beneficial resource.
These efforts to divert attention from the economic fundamentals do not withstand close
scrutiny. The reliability diversion is examined in this section. The subsidy diversion is discussed
in the next section. The clean resource diversion is examined in the final section.
C. THE FALSE RELIABILITY CRISIS: EXELON’S NUCLEAR BLACKMAIL
In Part II I showed that reliability challenges are entirely manageable as the 21st century
electricity system is deployed. In the context of the attack on renewables, the reliability issue has
taken on two aspects. The threat to close several aging nuclear reactors immediately is intended
to create a sense of immediate and urgent crisis, which gives the reactor owners leverage over
policymakers. In the mid- and long-terms the reliability issue involves the ability of the grid to
be managed with much higher levels of distributed generation and renewables. The previous
section has looked at the long term issue. This section examines the short-term and mid-term
75
issues. It leads to similar conclusions. In both cases the reliability crisis/challenge proves to be
more fiction than fact. The two case studies in this section are: (1) Exelon’s threat to close a
number of nuclear reactors and its pursuit of subsidies, which triggered an intensive analytic
exercise in Illinois that gives insight into the short term issues. (2) PG&E’s application for a
license renewal for Diablo Canyon, 10 years before the expiration of the current license, provides
an ideal opportunity to look at the mid-term issues.
1. Responses to the Threat to Precipitate a Crisis
The refusal of the Illinois legislature to be stampeded into providing a new subsidy for
aging reactors and the decision to get the facts before bailing out the aging nuclear reactors sheds
a great deal of light on the problem. The State of Illinois agencies’ analysis of the early
retirement of aging nuclear reactors in response to Exelon’s efforts to secure subsidies for its
aging reactors indicates that there is no crisis that merits rate increases of billions of dollars over
the next decade. The analyses commissioned by the legislature show that a prudent approach to
the orderly, early retirement of uneconomic, aging reactors is preferable.
First, from either the reliability or carbon reduction points of view, the amount of at-risk
nuclear power is not large enough to warrant immediate subsidization. At present, the level of
distributed resources in the United States is well below the threshold where reliability concerns
might arise. There are a host of approaches to managing the grid that would ensure reliability
even as the share of distributed resources rises substantially.162 Therefore, it takes a set of worst-
case assumptions devoid of alternative foresight, planning, and preparation to yield a hint of
concern about reliability in the near term.
[R]esources in both RTOs are adequate in the “base case,” and continue to be adequate when
the at-risk nuclear plants are retired in the “nuclear retirement case.” In MISO resources remain
adequate if the nuclear plants are retired even if there is a “polar vortex” event, but not in the
“high load and coal retirement” case. On the other hand, resource adequacy is substandard in
PJM in both stress cases; but demand response mitigates the problem in the “high load and coal
retirement” case. (Demand response is comprised of resources that can reduce demand during
emergencies, such as interruptible load and direct control load management, and counts as
capacity that can be used to maintain reliability.) Cases 3 and 4 are both extreme and would
almost surely show degraded reliability even if the nuclear plants had not been modeled as
retired prematurely…. The reliability index (LOLE) values for portions of MISO and PJM
within Illinois – three MISO Local Balancing Areas and one PJM transmission zone… are not
violated in Illinois in any case, except for the “high load and coal retirement” case in PJM, and
in that case the problem is mitigated by demand response. The IPA attributes the superior
resource adequacy in Illinois, even given the premature closures of the nuclear plants, to its
initial capacity surplus and to its robust transmission system that enables Illinois to call on out
of state capacity support.163
Second, to the extent that the early retirement of several reactors might put pressure on
the electricity system, the Illinois analysis found that there are responses available and it is not an
Illinois-specific problem, but a regional problem. In some senses, such an event immediately
triggers mitigating responses. “Thus, the eventual closure of a generating facility could be
accompanied by a variety of actions by the affected RTO to alleviate reliability concerns.”164
76
Third, the regional transmission systems have rules that require notice about decisions to
abandon generation, which affords the operator and market participants time to adjust, and
imposes penalties for failing to deliver on existing commitments.165 “Usually, nuclear plant
closures are not sudden unheralded events. Rather they are planned and anticipated months or
even years in advance. This would be particularly true of a closure prompted by low power
prices rather than a serious accident or the unexpected failure of plant equipment.”166
To the extent that a problem might be caused by the closure of multiple reactors, it would
elicit responses from other market participants to mitigate the impact. In the mid-term there are
even more actions that can be taken. At the same time, the analysis notes that the transmission
system has built-in mechanisms that respond to the challenge. The list of immediate potential
short-term responses is quite long.
If the retirement or suspension of the generating unit creates a reliability issue, MISO shall: (1)
begin negotiations of a potential System Support Resource (“SSR”) Agreement with the owner
or operator of the Generation Resource; and (2) use reasonable efforts to hold a stakeholder
meeting to review alternatives. The list of alternatives to consider and expeditiously approve
include (depending upon the type of reliability concern identified): (i) redispatch-
reconfiguration through operator instruction; (ii) remedial action plans; (iii) special protection
schemes initiated upon Generation Resource trips or unplanned Transmission Outages; (iv)
contracted demand response or Generator alternatives; and (v) transmission expansions. A
Generator alternative may be a new Generator, or an increase to existing Generator capacity. 167
2. Economic Cost
In fact, the Illinois analysis went beyond the focus on reliability to consider the impact of
a reactor closure on the economics of the system. Not only did it conclude that response
mechanisms would be driven by basic economics, but it noted that the overall impact could be
positive, if more economic resources are brought online.
Such actions would also have the effect of increasing the supply or availability of other
generating resources or the supply of demand response resources. Such actions would moderate
what might otherwise have been a sudden increase in energy market prices.168
Even if notification of a generation owner’s intent to close a generating facility does not trigger
any reliability concerns, the closure’s actual or anticipated impact on electric energy and
capacity prices would provide an incentive for firms to construct replacement generating
facilities. It would also lead to an increase in the cost-effectiveness of energy efficiency
measures, which would justify additional investment in such measures by retail customers (as
well as utilities and government agencies that are subject to mandates to subsidize such
measures through energy efficiency programs). Furthermore, it would increase congestion on
the transmission system, which could justify the acceleration of transmission system upgrades
by RTOs like PJM and MISO. Together, such reactions would expand supply, contract demand,
and allow for more efficient utilization of resources, all of which would ameliorate or even
overcome the increase in prices due to the closure of the plant by itself. That is, in the long run,
the closure of a particular power plant could reduce rather than increase prices, as newer more
efficient faculties are introduced to the power grid.169
77
In the case of Exelon Illinois, the threat to abandon a large amount of capacity represents
an exercise of market power170 which would raise prices for the facilities that remain online. In
fact, there is presently a surplus171 that Exelon may be trying to drive out of the market.
The finding that there is little impact on Illinois highlights the fact that the proper level of
consideration is multi-state and reliability is not the primary concern.172 Spreading the impact
across a wide area and a significant period, which gives the system time to react, results in
almost no cost or reliability damage. Simply put, nuclear reactor retirement can be a non-event.
The Illinois Department of Commerce expresses the belief that, “Eventually, market
forces and national policies will fully compensate nuclear plant operators for their reliability and
carbon-free emissions.” I have shown that the market fundamentals are pressing in the opposite
direction. Indeed, the more public policy relies on “effective market-based solutions” to solve the
problem of reducing carbon emissions, the less likely nuclear reactors are to be supported. In the
long run supply stack of low-carbon resources, nuclear is the most costly resource.
The ICC analysis provides important insight into this issue by citing an EPA analysis of
the PJM Zone, into which the majority of the at-risk reactors in Illinois sell (see Figure VI-2). As
the ICC notes: “The EPA conducted its own analysis of the costs of compliance with its
proposed CO2 regulations.” In the following chart, the “Base Case” line represents the EPA’s
projection of wholesale electricity prices without the rule. For the purpose of examining the early
retirement of nuclear reactors, the implication drawn by the ICC is that more resources are in the
offing for reactors, diminishing the need for Illinois to take state-specific action.
Even in the Base Case, it appears that EPA modelers expect PJM Zone wholesale electricity
prices to rise significantly above current price levels…. The EPA’s wholesale electricity price
forecasts reflect substantial increases, even relative to the first year of the EPA’s own
projections, as shown in the following chart: Assuming wholesale price increases of the
magnitude shown above, it seems likely that eventually the profitability of Exelon’s nuclear
plants in Illinois would be restored.173
The other four line segments, which the ICC notes “represent projections of wholesale
electricity prices under four different assumptions about how states achieve compliance,” are of
equal, if not greater importance. Keeping in mind that the EPA did not project any increase in
nuclear reactor output, the fact that the other four lines are well below the base case suggests that
the reduction of carbon emissions will lower the wholesale price of electricity. Emissions
reduction is achieved by replacing coal using the following (in order based on the magnitude of
the contribution): demand reduction, natural gas, improved coal efficiency, and hon-hydro
renewables. The overall reduction in the wholesale price can be as high as 50 percent, achieved
by more aggressive replacement of coal and a regional approach. An aggressive, least cost
regional approach to meeting the climate keeps the price increase around 1% per year,
substantially below the rate of increase in the cost of operating aging reactors. The burden of
subsidizing aging reactors grows more onerous
The opportunity to reduce carbon emissions by adding resources with costs below the
current average has long been recognized. In fact, the former head of Exelon, John Rowe,
frequently made this argument using the carbon supply curves for Exelon and PJM.174 The
current efforts of Exelon to impair the alternatives and extract subsidies may reflect the
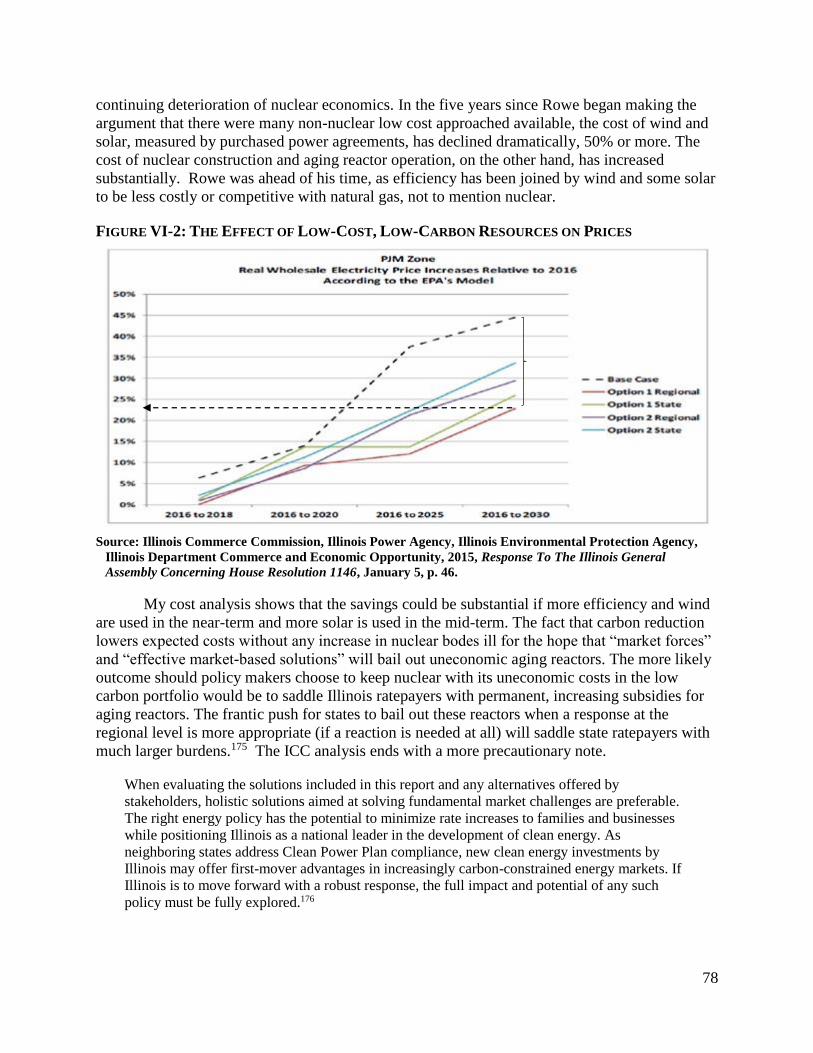
78
continuing deterioration of nuclear economics. In the five years since Rowe began making the
argument that there were many non-nuclear low cost approached available, the cost of wind and
solar, measured by purchased power agreements, has declined dramatically, 50% or more. The
cost of nuclear construction and aging reactor operation, on the other hand, has increased
substantially. Rowe was ahead of his time, as efficiency has been joined by wind and some solar
to be less costly or competitive with natural gas, not to mention nuclear.
FIGURE VI-2: THE EFFECT OF LOW-COST, LOW-CARBON RESOURCES ON PRICES
Source: Illinois Commerce Commission, Illinois Power Agency, Illinois Environmental Protection Agency,
Illinois Department Commerce and Economic Opportunity, 2015, Response To The Illinois General
Assembly Concerning House Resolution 1146, January 5, p. 46.
My cost analysis shows that the savings could be substantial if more efficiency and wind
are used in the near-term and more solar is used in the mid-term. The fact that carbon reduction
lowers expected costs without any increase in nuclear bodes ill for the hope that “market forces”
and “effective market-based solutions” will bail out uneconomic aging reactors. The more likely
outcome should policy makers choose to keep nuclear with its uneconomic costs in the low
carbon portfolio would be to saddle Illinois ratepayers with permanent, increasing subsidies for
aging reactors. The frantic push for states to bail out these reactors when a response at the
regional level is more appropriate (if a reaction is needed at all) will saddle state ratepayers with
much larger burdens.175 The ICC analysis ends with a more precautionary note.
When evaluating the solutions included in this report and any alternatives offered by
stakeholders, holistic solutions aimed at solving fundamental market challenges are preferable.
The right energy policy has the potential to minimize rate increases to families and businesses
while positioning Illinois as a national leader in the development of clean energy. As
neighboring states address Clean Power Plan compliance, new clean energy investments by
Illinois may offer first-mover advantages in increasingly carbon-constrained energy markets. If
Illinois is to move forward with a robust response, the full impact and potential of any such
policy must be fully explored.176
79
D. BASELOAD BIAS, UTILITY SCALE FETISH AND SHORT-RUN MYOPIA IN NUCLEAR LICENSE
RENEWAL: PG&E’S DIABLO CANYON
1. The NRC Guidelines
The PG&E application for a license renewal for its Diablo Canyon reactors represents a
different point in the reliability debate, a mid-term, general claim about reliability. Ten years in
advance of the expiration of its current license the application covers a period 10–30 years into
the future (2024-2044). The Nuclear Regulatory Commission’s (NRC) Generic Environmental
Impact Statement for License Renewal (GEIS, NUREG-1437, 2013) gives guidance to utilities
on the general criteria the NRC will apply in license renewal.
In updating its GEIS in 2013 the NRC has recognized the energy field is evolving very
rapidly, and therefore the NRC makes a case-by-case analysis of energy alternatives in license
renewal proceedings, using “state-of-the-science” information:
Recent advances in (replacement power alternatives). Several commenters asserted that
much of the information describing replacement power alternatives did not reflect the state-of-
the-science. In some cases, commenters noted facts and events that occurred after the
publication date of the draft GEIS.
The NRC has updated the final GEIS to incorporate the latest information on replacement
power alternatives, but it is inevitable that rapidly evolving technologies will outpace
information presented in the GEIS. Incorporation of this information is more appropriately
made in the context of plant-specific license renewal reviews, rather than in the GEIS. As with
renewable energy technologies, energy policies are evolving rapidly. While the NRC
acknowledges that legislation, technological advancements, and public policy can underlie a
fundamental paradigm shift in energy portfolios, the NRC cannot make decisions based on
anticipated or speculative changes. Instead, the NRC considers the status of alternatives and
energy policies when conducting plant-specific environmental reviews.177
In spite of this statement, a close look at the GEIS in the context of the contemporary
industry shows quite clearly that two decades of rapid and dramatic economic and technological
change have rendered even the modified standard that the NRC uses to evaluate request for
license renewal obsolete. The NRC is still captive to the baseload point of view.
The NRC framework for evaluating license renewal requests under the 1996 Guidelines
(NUREG, 1437) focused on nuclear reactors as baseload generation facilities. The first page of
the section of “Alternatives to License Renewal,” concluded by stating that “Therefore, NRC has
determined that a reasonable set of alternatives should be limited to analysis of single, discrete
electric generation sources and only electric generation sources that are technically feasible and
commercially viable.”178 In the evaluation of the sources, the NRC invoked the concept of
baseload over 30 times. The majority were references to the failure of renewables to meet the
baseload criteria.
In the 2013 revision to NUREG 1437, the standard was revised somewhat. Utility scale
replaces baseload as the central concept, while a reliable quantity of replacement capacity equal
80
to the baseload capacity is the target. The development of the technology is also more flexibly
defined to consider a longer term perspective.
A reasonable alternative must be commercially viable on a utility scale and operational prior to
the expiration of the reactor’s, operating or expected to become commercially viable on a utility
scale and operational prior to the expiration of the reactor’s license. As technologies improve,
the NRC expects that some alternatives not currently viable at some time in the future. The
NRC will make that determination during plant-specific license renewal reviews. The amount of
replacement power generated must equal the baseload capacity previously supplied by the
nuclear plant and reliably operate at or near the nuclear plant’s demonstrated capacity factor.
Should the need arise to replace the generating capacity of a nuclear reactor, power could be
provided by a suite of alternatives and combinations of alternatives, including expanding the
capacities of one or more existing power generating plants within a region, delaying the
scheduled retirement of one or more existing plants, or purchasing an equivalent amount of
power. The number of possible combinations is potentially unlimited… [C]ombinations of
alternatives may be considered during plant-specific license renewal reviews.
The NRC continues to exhibit an extremely narrow focus on utility-scale and baseload.
In the current technological and economic environment this focus is tantamount to an irrational
baseload bias and a utility-scale fetish that is out of touch with reality. Section 2 of the revised
relicensing regulation (NUREG, 1428, 2013) invokes baseload and utility-scale 25 times in the
16 pages in which the alternatives are evaluated.179 The assessment of the alternatives is defined
by these two antiquated concepts. Moreover, the identification of alternatives does not include
building new facilities, efficiency, or integrated management of supply and demand.
The failure of the NRC to adjust to the changes in the electricity sector is evident in the
response to a contention challenging the Diablo Canyon license extension:
A contention challenging PG&E’s decision to exclude a particular alternative or combination of
alternatives would be admissible only if it demonstrated that the proposed alternative(s) could
supply baseload power sufficient to replace Diablo Canyon’s generating capacity at the time the
licenses expired in 2024 and 2025.180
Ironically, and reinforcing the lack of change in its point of view, the NRC suggests that
the fact that PG&E is asking for the license renewal 10 years in advance is a matter of necessity
and routine.181 This suggests that it takes as long to implement the steps necessary to extend the
life of a nuclear reactor as it does to build a new one. Thus, aging reactors suffer from the same
drawback as was demonstrated for new reactors in the earlier discussion. They are a very bad
investment in a dynamic environment.
Instead of biasing the analysis by targeting utility-scale alternatives that yield baseload
quantities of reliable power and takes ten years to bring online, it could have referred to
sufficient capacity to reliably meet the projected need for electricity. When pressed, the NRC
says, essentially that the framework for decision making has not changed. There is a significant
cost. An erroneous decision to approve the license extension under these circumstances imposes
direct and immediate harm on consumers. It reinforces the utility’s incentive and ability to resist
the superior economic options that have become available and frustrate the transformation of the
utility sector.
81
2. The PG&E Diablo Canyon Application
The harm of failing to give proper guidance to utilities can be seen clearly in the PG&E
application for a license renewal for Diablo Canyon. PG&E has continued to apply the standard
from the 1996 GEIS. Either it has failed to recognize the modest modification in the NRC
guidelines, recognizes that there was little change in the NRC’s thinking, or has purposefully
ignored it.
In a number of respects, PG&E’s energy alternatives analysis is seriously outdated. First,
in Section 7.2.1.2, PG&E focuses its analysis on “standalone” alternatives, using that to
disqualify a number of renewable alternatives that have proven reliable and effective in
providing electricity. PGE repeatedly cites the old standard to “disqualify” alternatives: 182
This section identifies standalone alternatives that PG&E deemed unreasonable,
and the bases for these determinations. PG&E accounted for the fact that DCPP
provides baseload generation and that any feasible alternative to DCPP would
also need to be able to provide baseload power. In performing this evaluation,
PG&E relied heavily upon NRC's GElS. 7-2.7
There may be insufficient operational flexibilities to both meet those renewable
power requirements and replace DCPP baseload capacity with wind, solar, and
geothermal generation.
Because the power output can only be intermittently generated during the day or
during certain seasons, depending on the location, wind turbines are unsuitable for
baseload applications.
Wind generation – therefore, wind generation cannot be considered an adequate
replacement of DCPP generation absent sufficient energy storage to overcome
wind's intermittency. Besides pumped-storage hydroelectricity, Compressed Air
Energy Storage (CAES) is the technology most suited for storage of large
amounts of energy; however, no combination of wind and CAES has yet been
proposed at the scale necessary to replace DCPP generation. (7-2.8)
Because solar thermal power is not available 24 hours per day, it is typically not
acceptable for baseload applications absent sufficient energy storage to overcome
solar's intermittency... As noted above, besides pumped-storage hydroelectricity,
CAES is the technology most suited for storage of large amounts of energy;
however, no combination of CSP and CAES has yet been proposed at the scale
necessary to replace DCPP generation. 7-2.9
While development of battery storage options is ongoing, none are currently
available in quantities or capacities that would provide baseload amounts of
power. In light of the large contribution of solar PV to potential OG in PG&E
service area and limitations on its use as baseload capacity, DG cannot serve as a
reasonable alternative to the baseload generation of DCPP. 7-2.11
Geothermal plants offer base load capacity similar to DCPP, but it is unlikely to
be available within PG&E's service area on the scale required to replace the
capacity of DCPP. 7-2.12
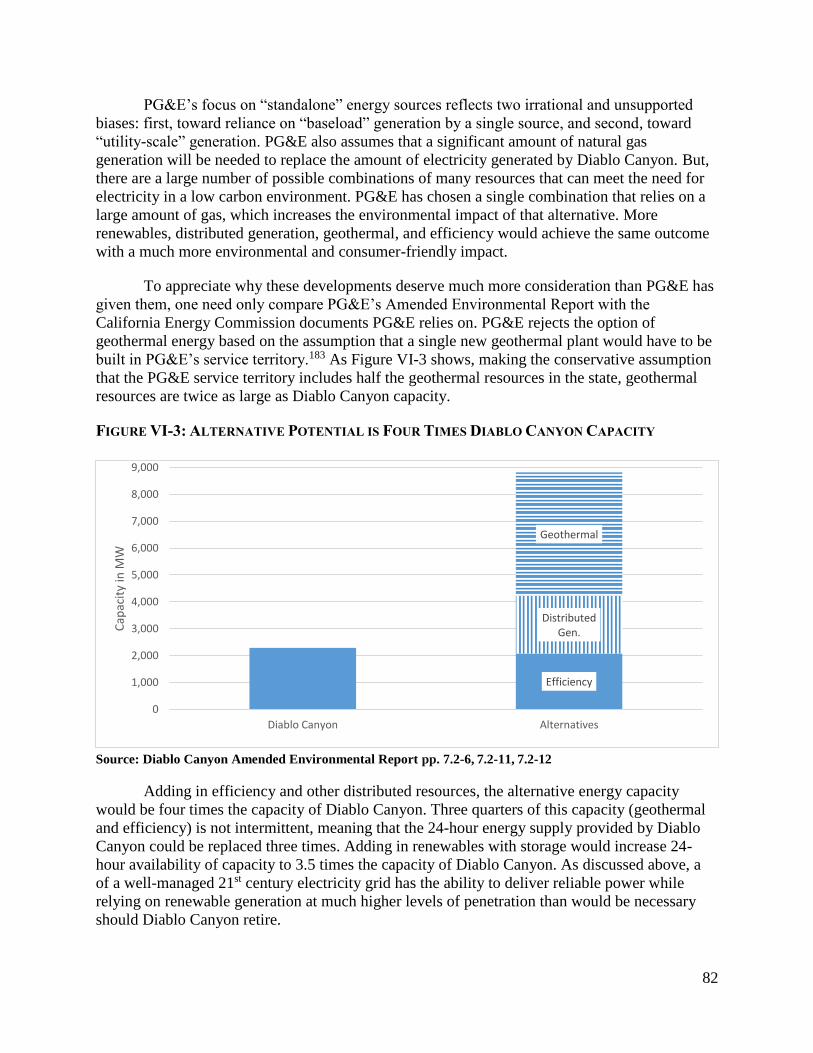
82
Efficiency
DistributedGen.
Geothermal
0
1,000
2,000
3,000
4,000
5,000
6,000
7,000
8,000
9,000
Diablo Canyon Alternatives
Cap
acit
y in
MW
PG&E’s focus on “standalone” energy sources reflects two irrational and unsupported
biases: first, toward reliance on “baseload” generation by a single source, and second, toward
“utility-scale” generation. PG&E also assumes that a significant amount of natural gas
generation will be needed to replace the amount of electricity generated by Diablo Canyon. But,
there are a large number of possible combinations of many resources that can meet the need for
electricity in a low carbon environment. PG&E has chosen a single combination that relies on a
large amount of gas, which increases the environmental impact of that alternative. More
renewables, distributed generation, geothermal, and efficiency would achieve the same outcome
with a much more environmental and consumer-friendly impact.
To appreciate why these developments deserve much more consideration than PG&E has
given them, one need only compare PG&E’s Amended Environmental Report with the
California Energy Commission documents PG&E relies on. PG&E rejects the option of
geothermal energy based on the assumption that a single new geothermal plant would have to be
built in PG&E’s service territory.183 As Figure VI-3 shows, making the conservative assumption
that the PG&E service territory includes half the geothermal resources in the state, geothermal
resources are twice as large as Diablo Canyon capacity.
FIGURE VI-3: ALTERNATIVE POTENTIAL IS FOUR TIMES DIABLO CANYON CAPACITY
Source: Diablo Canyon Amended Environmental Report pp. 7.2-6, 7.2-11, 7.2-12
Adding in efficiency and other distributed resources, the alternative energy capacity
would be four times the capacity of Diablo Canyon. Three quarters of this capacity (geothermal
and efficiency) is not intermittent, meaning that the 24-hour energy supply provided by Diablo
Canyon could be replaced three times. Adding in renewables with storage would increase 24-
hour availability of capacity to 3.5 times the capacity of Diablo Canyon. As discussed above, a
of a well-managed 21st century electricity grid has the ability to deliver reliable power while
relying on renewable generation at much higher levels of penetration than would be necessary
should Diablo Canyon retire.
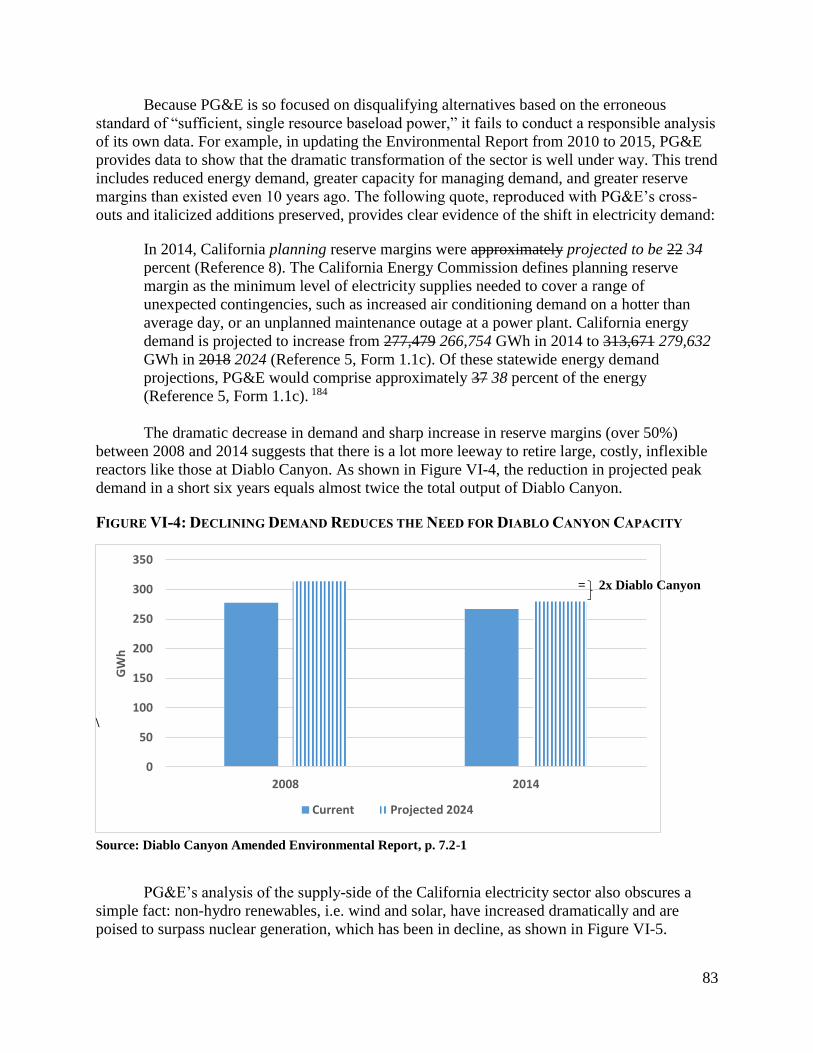
83
0
50
100
150
200
250
300
350
2008 2014
GW
h
Current Projected 2024
Because PG&E is so focused on disqualifying alternatives based on the erroneous
standard of “sufficient, single resource baseload power,” it fails to conduct a responsible analysis
of its own data. For example, in updating the Environmental Report from 2010 to 2015, PG&E
provides data to show that the dramatic transformation of the sector is well under way. This trend
includes reduced energy demand, greater capacity for managing demand, and greater reserve
margins than existed even 10 years ago. The following quote, reproduced with PG&E’s cross-
outs and italicized additions preserved, provides clear evidence of the shift in electricity demand:
In 2014, California planning reserve margins were approximately projected to be 22 34
percent (Reference 8). The California Energy Commission defines planning reserve
margin as the minimum level of electricity supplies needed to cover a range of
unexpected contingencies, such as increased air conditioning demand on a hotter than
average day, or an unplanned maintenance outage at a power plant. California energy
demand is projected to increase from 277,479 266,754 GWh in 2014 to 313,671 279,632
GWh in 2018 2024 (Reference 5, Form 1.1c). Of these statewide energy demand
projections, PG&E would comprise approximately 37 38 percent of the energy
(Reference 5, Form 1.1c). 184
The dramatic decrease in demand and sharp increase in reserve margins (over 50%)
between 2008 and 2014 suggests that there is a lot more leeway to retire large, costly, inflexible
reactors like those at Diablo Canyon. As shown in Figure VI-4, the reduction in projected peak
demand in a short six years equals almost twice the total output of Diablo Canyon.
FIGURE VI-4: DECLINING DEMAND REDUCES THE NEED FOR DIABLO CANYON CAPACITY
= 2x Diablo Canyon
\
Source: Diablo Canyon Amended Environmental Report, p. 7.2-1
PG&E’s analysis of the supply-side of the California electricity sector also obscures a
simple fact: non-hydro renewables, i.e. wind and solar, have increased dramatically and are
poised to surpass nuclear generation, which has been in decline, as shown in Figure VI-5.
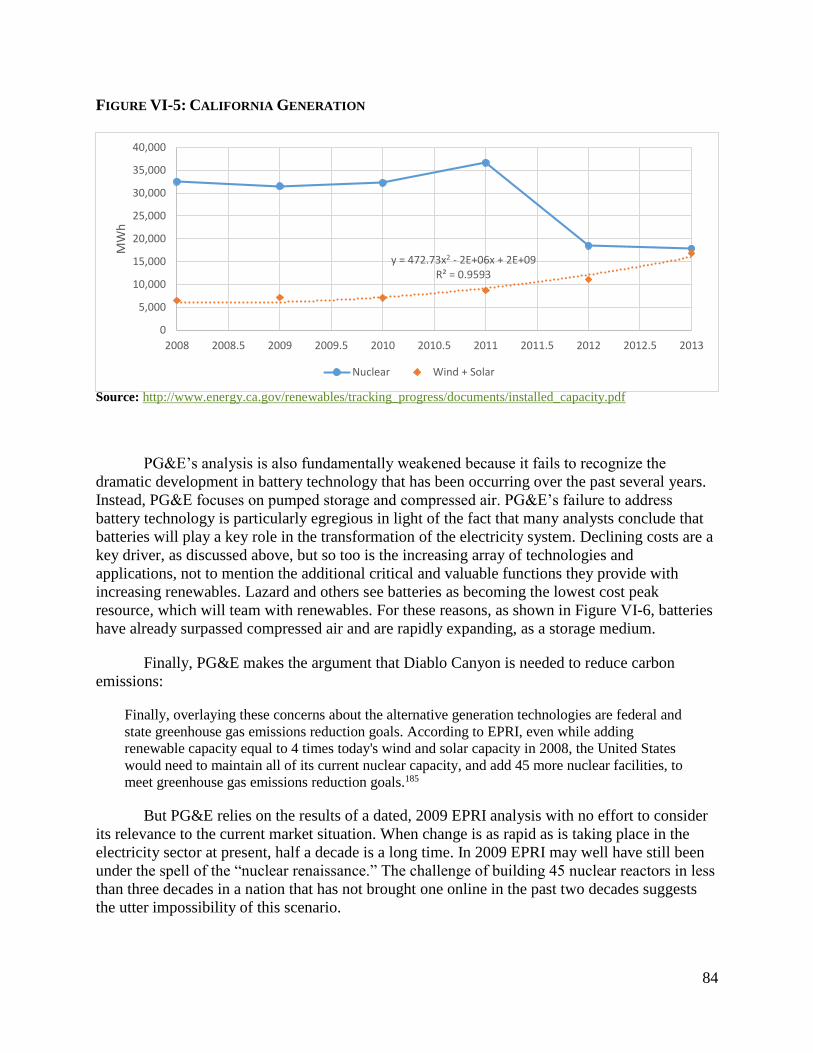
84
y = 472.73x2 - 2E+06x + 2E+09R² = 0.9593
0
5,000
10,000
15,000
20,000
25,000
30,000
35,000
40,000
2008 2008.5 2009 2009.5 2010 2010.5 2011 2011.5 2012 2012.5 2013
MW
h
Nuclear Wind + Solar
FIGURE VI-5: CALIFORNIA GENERATION
Source: http://www.energy.ca.gov/renewables/tracking_progress/documents/installed_capacity.pdf
PG&E’s analysis is also fundamentally weakened because it fails to recognize the
dramatic development in battery technology that has been occurring over the past several years.
Instead, PG&E focuses on pumped storage and compressed air. PG&E’s failure to address
battery technology is particularly egregious in light of the fact that many analysts conclude that
batteries will play a key role in the transformation of the electricity system. Declining costs are a
key driver, as discussed above, but so too is the increasing array of technologies and
applications, not to mention the additional critical and valuable functions they provide with
increasing renewables. Lazard and others see batteries as becoming the lowest cost peak
resource, which will team with renewables. For these reasons, as shown in Figure VI-6, batteries
have already surpassed compressed air and are rapidly expanding, as a storage medium.
Finally, PG&E makes the argument that Diablo Canyon is needed to reduce carbon
emissions:
Finally, overlaying these concerns about the alternative generation technologies are federal and
state greenhouse gas emissions reduction goals. According to EPRI, even while adding
renewable capacity equal to 4 times today's wind and solar capacity in 2008, the United States
would need to maintain all of its current nuclear capacity, and add 45 more nuclear facilities, to
meet greenhouse gas emissions reduction goals.185
But PG&E relies on the results of a dated, 2009 EPRI analysis with no effort to consider
its relevance to the current market situation. When change is as rapid as is taking place in the
electricity sector at present, half a decade is a long time. In 2009 EPRI may well have still been
under the spell of the “nuclear renaissance.” The challenge of building 45 nuclear reactors in less
than three decades in a nation that has not brought one online in the past two decades suggests
the utter impossibility of this scenario.
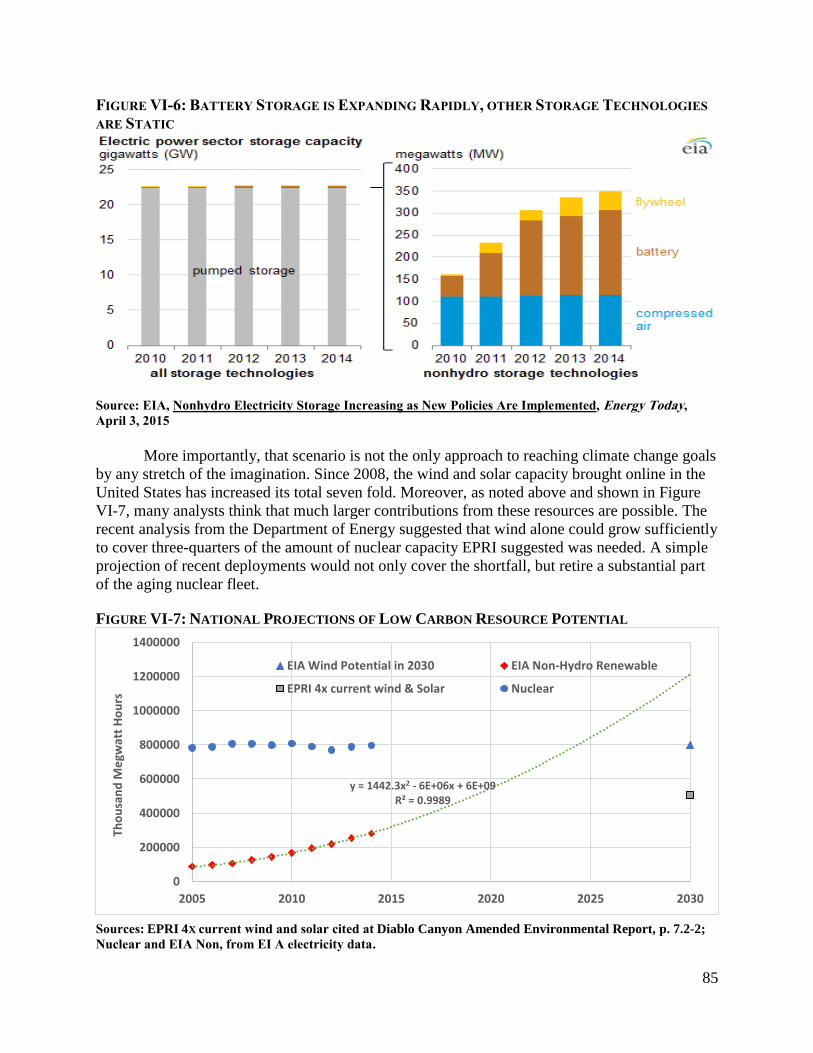
85
y = 1442.3x2 - 6E+06x + 6E+09R² = 0.9989
0
200000
400000
600000
800000
1000000
1200000
1400000
2005 2010 2015 2020 2025 2030
Tho
usa
nd
Me
gwat
t H
ou
rs
EIA Wind Potential in 2030 EIA Non-Hydro Renewable
EPRI 4x current wind & Solar Nuclear
FIGURE VI-6: BATTERY STORAGE IS EXPANDING RAPIDLY, OTHER STORAGE TECHNOLOGIES
ARE STATIC
Source: EIA, Nonhydro Electricity Storage Increasing as New Policies Are Implemented, Energy Today,
April 3, 2015
More importantly, that scenario is not the only approach to reaching climate change goals
by any stretch of the imagination. Since 2008, the wind and solar capacity brought online in the
United States has increased its total seven fold. Moreover, as noted above and shown in Figure
VI-7, many analysts think that much larger contributions from these resources are possible. The
recent analysis from the Department of Energy suggested that wind alone could grow sufficiently
to cover three-quarters of the amount of nuclear capacity EPRI suggested was needed. A simple
projection of recent deployments would not only cover the shortfall, but retire a substantial part
of the aging nuclear fleet.
FIGURE VI-7: NATIONAL PROJECTIONS OF LOW CARBON RESOURCE POTENTIAL
Sources: EPRI 4X current wind and solar cited at Diablo Canyon Amended Environmental Report, p. 7.2-2;
Nuclear and EIA Non, from EI A electricity data.
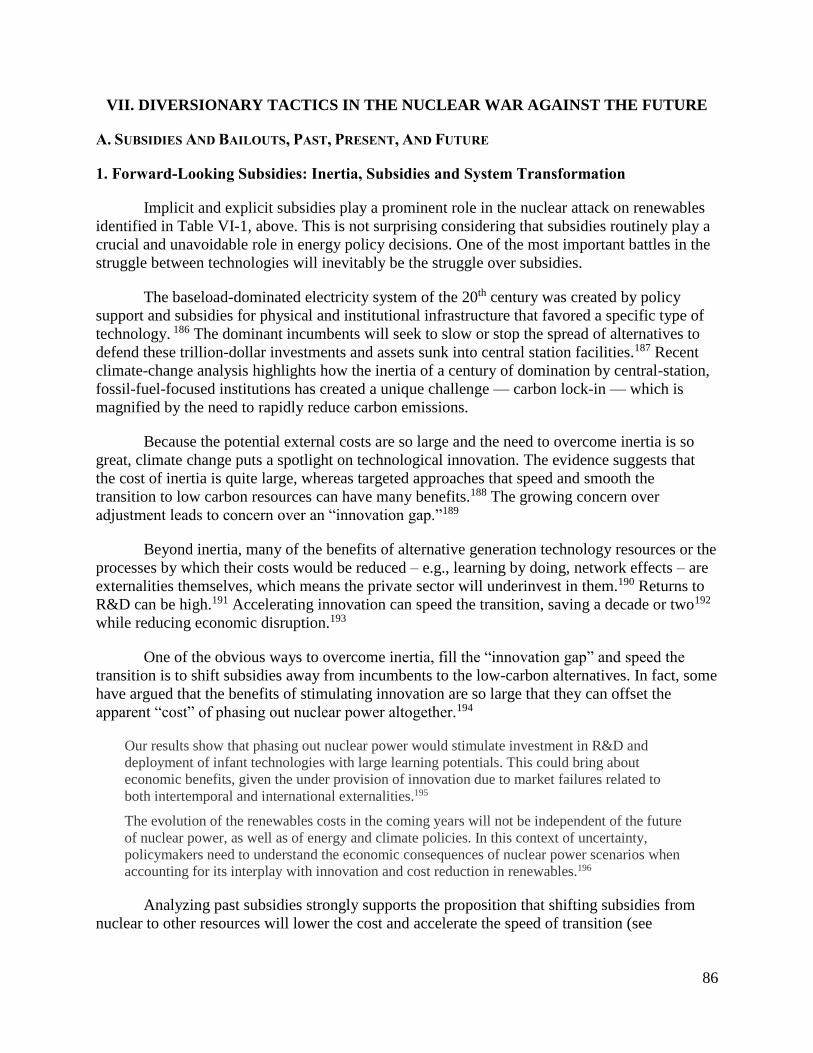
86
VII. DIVERSIONARY TACTICS IN THE NUCLEAR WAR AGAINST THE FUTURE
A. SUBSIDIES AND BAILOUTS, PAST, PRESENT, AND FUTURE
1. Forward-Looking Subsidies: Inertia, Subsidies and System Transformation
Implicit and explicit subsidies play a prominent role in the nuclear attack on renewables
identified in Table VI-1, above. This is not surprising considering that subsidies routinely play a
crucial and unavoidable role in energy policy decisions. One of the most important battles in the
struggle between technologies will inevitably be the struggle over subsidies.
The baseload-dominated electricity system of the 20th century was created by policy
support and subsidies for physical and institutional infrastructure that favored a specific type of
technology. 186 The dominant incumbents will seek to slow or stop the spread of alternatives to
defend these trillion-dollar investments and assets sunk into central station facilities.187 Recent
climate-change analysis highlights how the inertia of a century of domination by central-station,
fossil-fuel-focused institutions has created a unique challenge — carbon lock-in — which is
magnified by the need to rapidly reduce carbon emissions.
Because the potential external costs are so large and the need to overcome inertia is so
great, climate change puts a spotlight on technological innovation. The evidence suggests that
the cost of inertia is quite large, whereas targeted approaches that speed and smooth the
transition to low carbon resources can have many benefits.188 The growing concern over
adjustment leads to concern over an “innovation gap.”189
Beyond inertia, many of the benefits of alternative generation technology resources or the
processes by which their costs would be reduced – e.g., learning by doing, network effects – are
externalities themselves, which means the private sector will underinvest in them.190 Returns to
R&D can be high.191 Accelerating innovation can speed the transition, saving a decade or two192
while reducing economic disruption.193
One of the obvious ways to overcome inertia, fill the “innovation gap” and speed the
transition is to shift subsidies away from incumbents to the low-carbon alternatives. In fact, some
have argued that the benefits of stimulating innovation are so large that they can offset the
apparent “cost” of phasing out nuclear power altogether.194
Our results show that phasing out nuclear power would stimulate investment in R&D and
deployment of infant technologies with large learning potentials. This could bring about
economic benefits, given the under provision of innovation due to market failures related to
both intertemporal and international externalities.195
The evolution of the renewables costs in the coming years will not be independent of the future
of nuclear power, as well as of energy and climate policies. In this context of uncertainty,
policymakers need to understand the economic consequences of nuclear power scenarios when
accounting for its interplay with innovation and cost reduction in renewables.196
Analyzing past subsidies strongly supports the proposition that shifting subsidies from
nuclear to other resources will lower the cost and accelerate the speed of transition (see
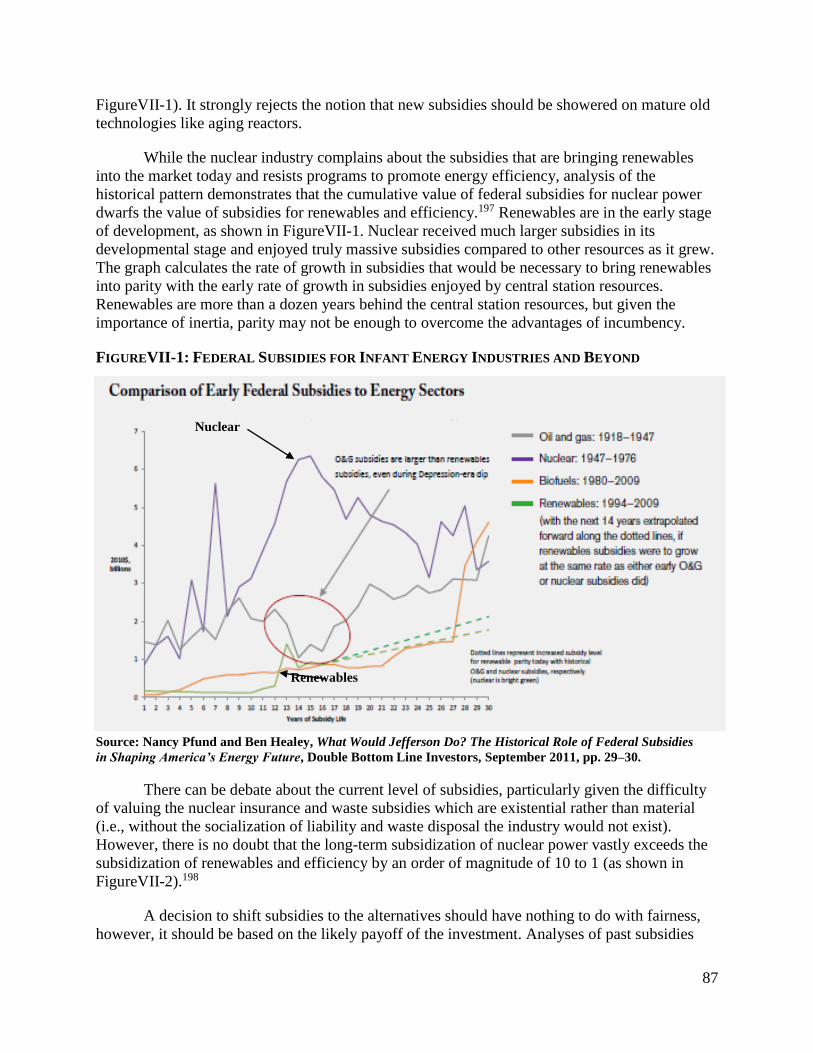
87
FigureVII-1). It strongly rejects the notion that new subsidies should be showered on mature old
technologies like aging reactors.
While the nuclear industry complains about the subsidies that are bringing renewables
into the market today and resists programs to promote energy efficiency, analysis of the
historical pattern demonstrates that the cumulative value of federal subsidies for nuclear power
dwarfs the value of subsidies for renewables and efficiency.197 Renewables are in the early stage
of development, as shown in FigureVII-1. Nuclear received much larger subsidies in its
developmental stage and enjoyed truly massive subsidies compared to other resources as it grew.
The graph calculates the rate of growth in subsidies that would be necessary to bring renewables
into parity with the early rate of growth in subsidies enjoyed by central station resources.
Renewables are more than a dozen years behind the central station resources, but given the
importance of inertia, parity may not be enough to overcome the advantages of incumbency.
FIGUREVII-1: FEDERAL SUBSIDIES FOR INFANT ENERGY INDUSTRIES AND BEYOND
Nuclear
Renewables
Source: Nancy Pfund and Ben Healey, What Would Jefferson Do? The Historical Role of Federal Subsidies
in Shaping America’s Energy Future, Double Bottom Line Investors, September 2011, pp. 29–30.
There can be debate about the current level of subsidies, particularly given the difficulty
of valuing the nuclear insurance and waste subsidies which are existential rather than material
(i.e., without the socialization of liability and waste disposal the industry would not exist).
However, there is no doubt that the long-term subsidization of nuclear power vastly exceeds the
subsidization of renewables and efficiency by an order of magnitude of 10 to 1 (as shown in
FigureVII-2).198
A decision to shift subsidies to the alternatives should have nothing to do with fairness,
however, it should be based on the likely payoff of the investment. Analyses of past subsidies
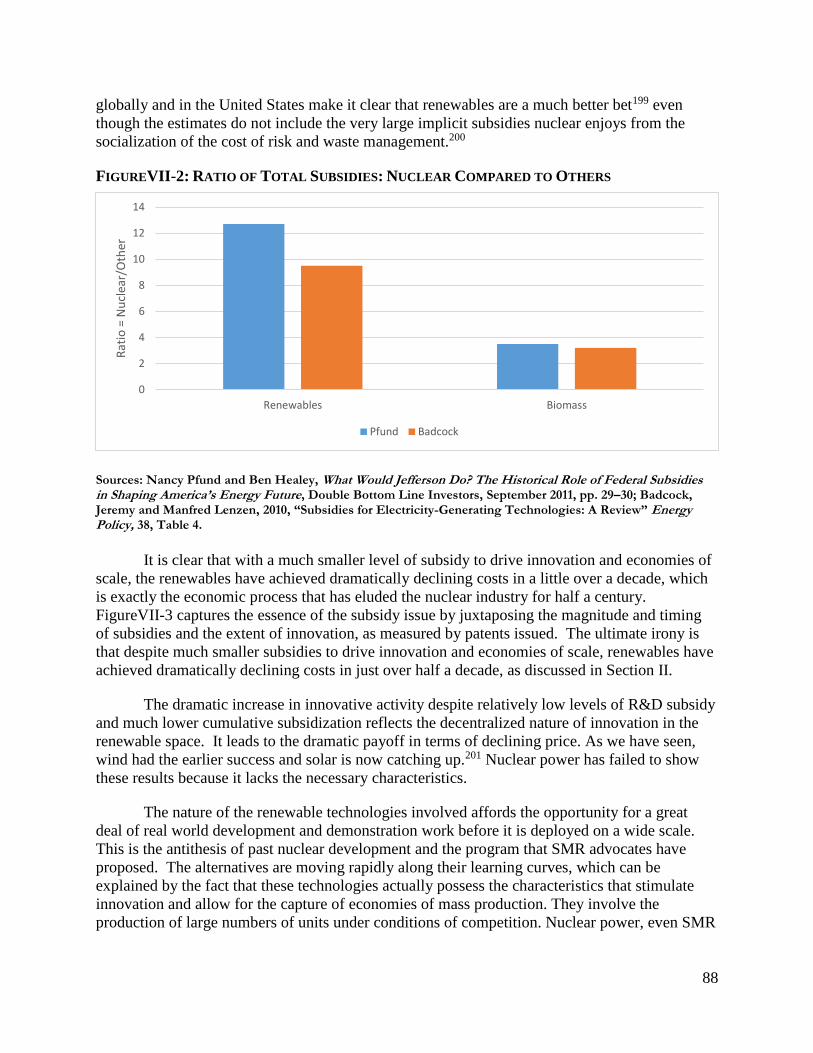
88
0
2
4
6
8
10
12
14
Renewables Biomass
Rat
io =
Nu
clea
r/O
ther
Pfund Badcock
globally and in the United States make it clear that renewables are a much better bet199 even
though the estimates do not include the very large implicit subsidies nuclear enjoys from the
socialization of the cost of risk and waste management.200
FIGUREVII-2: RATIO OF TOTAL SUBSIDIES: NUCLEAR COMPARED TO OTHERS
Sources: Nancy Pfund and Ben Healey, What Would Jefferson Do? The Historical Role of Federal Subsidies in Shaping America’s Energy Future, Double Bottom Line Investors, September 2011, pp. 29–30; Badcock, Jeremy and Manfred Lenzen, 2010, “Subsidies for Electricity-Generating Technologies: A Review” Energy Policy, 38, Table 4.
It is clear that with a much smaller level of subsidy to drive innovation and economies of
scale, the renewables have achieved dramatically declining costs in a little over a decade, which
is exactly the economic process that has eluded the nuclear industry for half a century.
FigureVII-3 captures the essence of the subsidy issue by juxtaposing the magnitude and timing
of subsidies and the extent of innovation, as measured by patents issued. The ultimate irony is
that despite much smaller subsidies to drive innovation and economies of scale, renewables have
achieved dramatically declining costs in just over half a decade, as discussed in Section II.
The dramatic increase in innovative activity despite relatively low levels of R&D subsidy
and much lower cumulative subsidization reflects the decentralized nature of innovation in the
renewable space. It leads to the dramatic payoff in terms of declining price. As we have seen,
wind had the earlier success and solar is now catching up.201 Nuclear power has failed to show
these results because it lacks the necessary characteristics.
The nature of the renewable technologies involved affords the opportunity for a great
deal of real world development and demonstration work before it is deployed on a wide scale.
This is the antithesis of past nuclear development and the program that SMR advocates have
proposed. The alternatives are moving rapidly along their learning curves, which can be
explained by the fact that these technologies actually possess the characteristics that stimulate
innovation and allow for the capture of economies of mass production. They involve the
production of large numbers of units under conditions of competition. Nuclear power, even SMR
89
technology, involves an extremely small number of units from a very small number of firms,
with the monopoly model offered as the best approach.
FIGUREVII-3: INNOVATION AND PUBLIC SUPPORT FOR R&D
Source: Bettencourt, Luı´s M.A., Jessika E. Trancik, and Jasleen Kaur, 2013, “Determinants of the pace of global innovation in energy technologies,” PLoS ONE, October 8, p. 10.
If policymakers have to bet on subsidies to accelerate innovation, limit cost, and reduce
carbon emissions, then the performance history of the nuclear and alternative industries gives
them extremely good reason to expect a single outcome: alternatives will overcome their
challenges more quickly and efficiently than nuclear technology.
2. Backward-Looking subsidies: Keeping Aging Reactors Online
Having concluded that forward-looking subsidies should focus on renewables rather than
new nuclear technology, we next address the question of whether or not it makes economic sense
to use backward-looking subsidies to keep aging reactors online. This has become a focal point
of debate in both the EPA’s Clean Power Rule and the broader conflict between nuclear and the
alternatives.
In Section II I included current and projected cost estimates for aging reactors in both the
operating and total cost analyses. I showed that aging reactors are more costly than efficiency,
wind, gas, and some solar in the near-term. In the mid-term more solar becomes competitive with
aging reactors as do several other generation sources, including biomass, geothermal, micro-
turbines, and even offshore wind. Specific proposals for subsidies of old reactors have now been
made in states where wholesale prices are set in markets. They provide strong support for the
proposition that aging reactors are uneconomic.
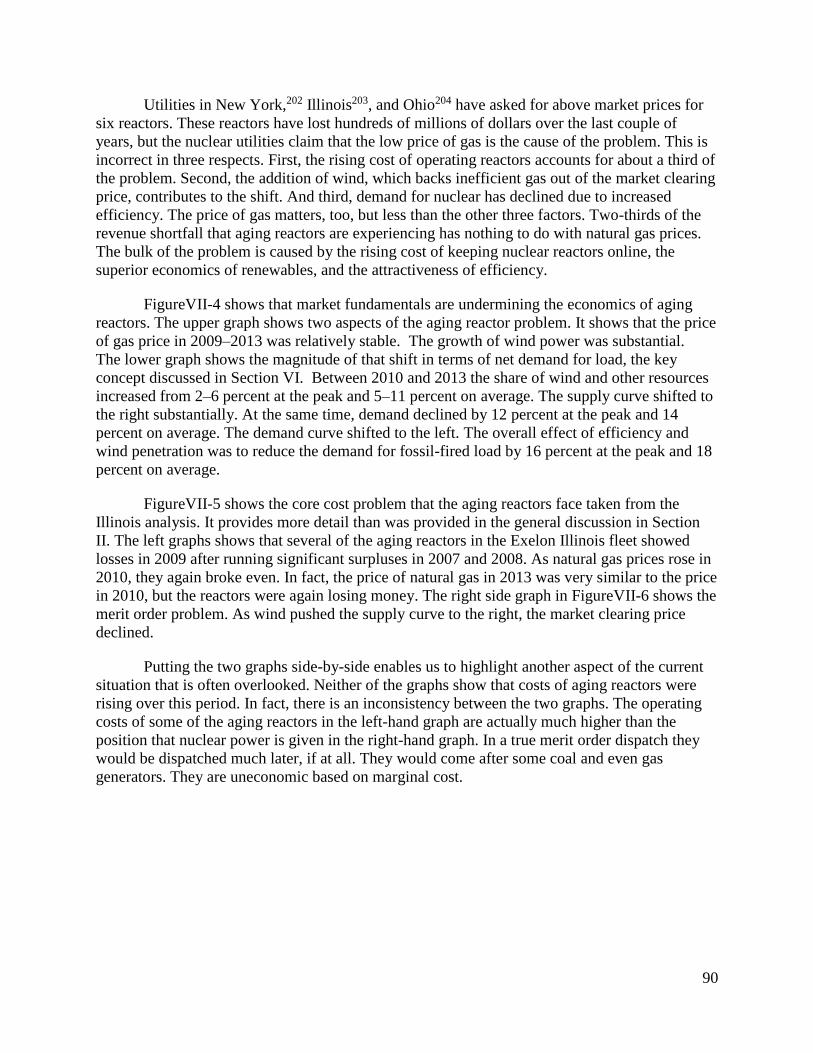
90
Utilities in New York,202 Illinois203, and Ohio204 have asked for above market prices for
six reactors. These reactors have lost hundreds of millions of dollars over the last couple of
years, but the nuclear utilities claim that the low price of gas is the cause of the problem. This is
incorrect in three respects. First, the rising cost of operating reactors accounts for about a third of
the problem. Second, the addition of wind, which backs inefficient gas out of the market clearing
price, contributes to the shift. And third, demand for nuclear has declined due to increased
efficiency. The price of gas matters, too, but less than the other three factors. Two-thirds of the
revenue shortfall that aging reactors are experiencing has nothing to do with natural gas prices.
The bulk of the problem is caused by the rising cost of keeping nuclear reactors online, the
superior economics of renewables, and the attractiveness of efficiency.
FigureVII-4 shows that market fundamentals are undermining the economics of aging
reactors. The upper graph shows two aspects of the aging reactor problem. It shows that the price
of gas price in 2009–2013 was relatively stable. The growth of wind power was substantial.
The lower graph shows the magnitude of that shift in terms of net demand for load, the key
concept discussed in Section VI. Between 2010 and 2013 the share of wind and other resources
increased from 2–6 percent at the peak and 5–11 percent on average. The supply curve shifted to
the right substantially. At the same time, demand declined by 12 percent at the peak and 14
percent on average. The demand curve shifted to the left. The overall effect of efficiency and
wind penetration was to reduce the demand for fossil-fired load by 16 percent at the peak and 18
percent on average.
FigureVII-5 shows the core cost problem that the aging reactors face taken from the
Illinois analysis. It provides more detail than was provided in the general discussion in Section
II. The left graphs shows that several of the aging reactors in the Exelon Illinois fleet showed
losses in 2009 after running significant surpluses in 2007 and 2008. As natural gas prices rose in
2010, they again broke even. In fact, the price of natural gas in 2013 was very similar to the price
in 2010, but the reactors were again losing money. The right side graph in FigureVII-6 shows the
merit order problem. As wind pushed the supply curve to the right, the market clearing price
declined.
Putting the two graphs side-by-side enables us to highlight another aspect of the current
situation that is often overlooked. Neither of the graphs show that costs of aging reactors were
rising over this period. In fact, there is an inconsistency between the two graphs. The operating
costs of some of the aging reactors in the left-hand graph are actually much higher than the
position that nuclear power is given in the right-hand graph. In a true merit order dispatch they
would be dispatched much later, if at all. They would come after some coal and even gas
generators. They are uneconomic based on marginal cost.
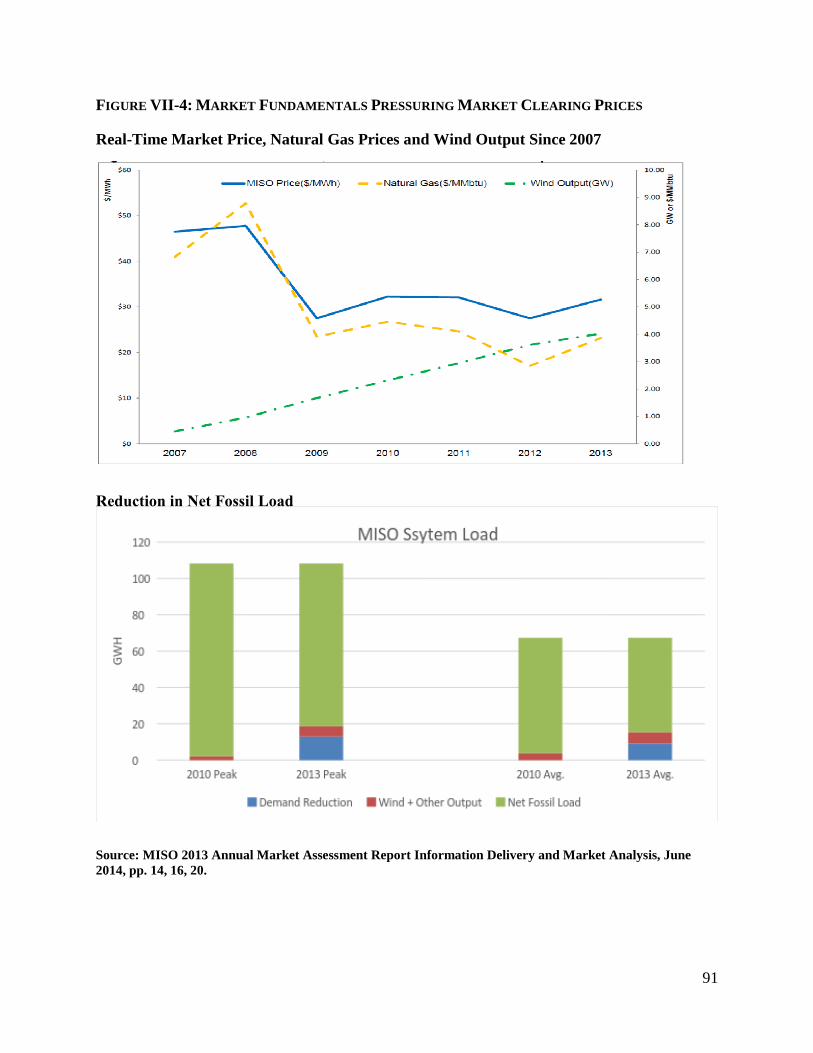
91
FIGURE VII-4: MARKET FUNDAMENTALS PRESSURING MARKET CLEARING PRICES
Real-Time Market Price, Natural Gas Prices and Wind Output Since 2007
Reduction in Net Fossil Load
Source: MISO 2013 Annual Market Assessment Report Information Delivery and Market Analysis, June
2014, pp. 14, 16, 20.
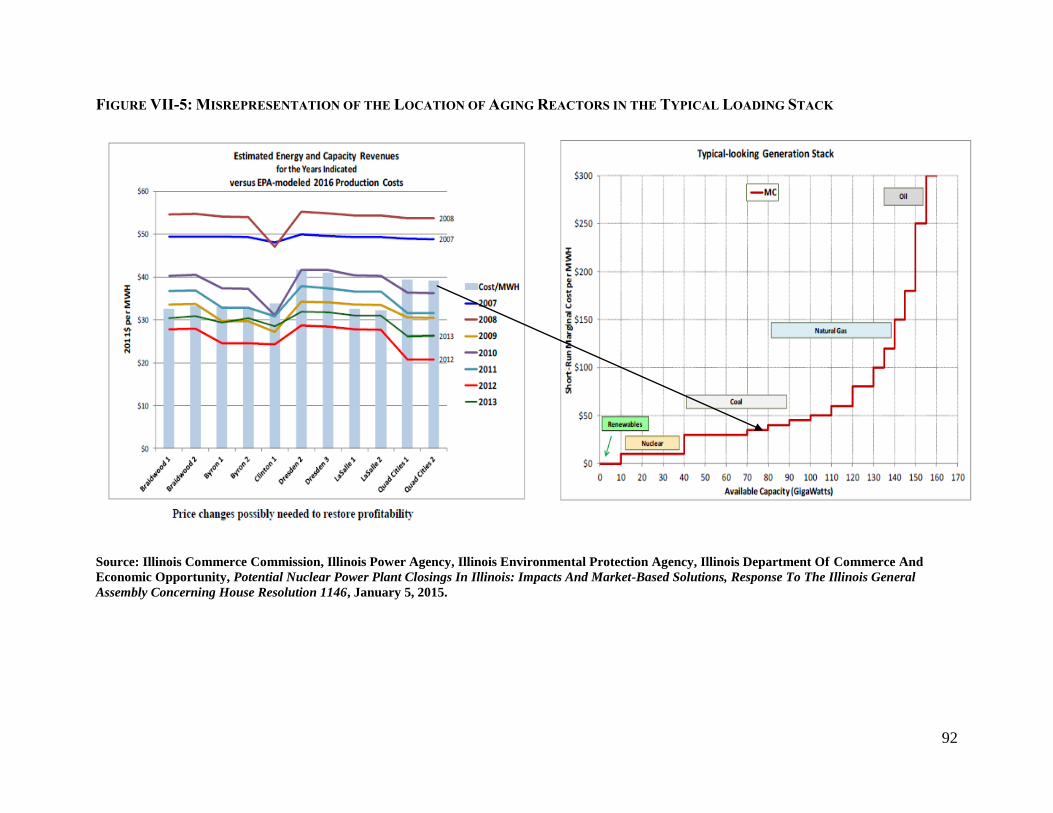
92
FIGURE VII-5: MISREPRESENTATION OF THE LOCATION OF AGING REACTORS IN THE TYPICAL LOADING STACK
Source: Illinois Commerce Commission, Illinois Power Agency, Illinois Environmental Protection Agency, Illinois Department Of Commerce And
Economic Opportunity, Potential Nuclear Power Plant Closings In Illinois: Impacts And Market-Based Solutions, Response To The Illinois General
Assembly Concerning House Resolution 1146, January 5, 2015.
93
FigureVII-6 identifies the basic economics underlying the problem of aging reactors. The
uneconomic cost of subsidizing them to stay online flows from the failure to properly analyze the
causes of the problem. Ignoring cost increases as a partial cause of the aging problem and failing
to recognize the continuing addition of low operating cost resources leads to underestimation of
the ultimate size of the subsidies.
In the upper graph in Figure VII-6, I show the market clearing price declined
dramatically due to these two fundamental economic factors. This brings us back to the core
economic forces I introduced at the outset of the analysis in Figure II-1. Here we can calculate
that at least two-thirds of the aging reactor problem can be attributed to the increasing cost of
aging reactors and the declining market clearing price due to shifting supply and demand. It is
also important to note the speed with which these changes took place. The ability of the
electricity system to adjust is substantial. In the lower graph of Figure VII-6 we plot the rising
cost of aging reactors in the Exelon fleet, which is close to the rate found in recent national
studies, against the declining revenue in the Illinois example. It also assumes that the wholesale
price increases at the rate projected for PJM under the efficient response to the EPA Clean Power
Rule. The subsidy necessary to cover the total cost of the reactors starts at $25/MWH and almost
doubles in a decade. The rising costs account for about one-third of the current subsidies.
From the point of view of economic fundamentals, resisting these economic forces is
futile in the sense that the only way to keep aging reactors online is to impose more and more
uneconomic costs on consumers. Rather than subsidize aging reactors, the sensible policy is to
accelerate a transition to renewables and retire aging reactors in an orderly fashion. Because the
primary cause of the revenue shortfall suffered by aging reactors is driven by market
fundamentals that are likely to become even more adverse over time, the case for subsidizing
their operation has not been made. It clearly costs more to keep them online than to retire them.
That burden will only grow.
B. NON-ENERGY ECONOMIC IMPACTS
The analysis of resource economics, reliability, and carbon reduction all indicate that
subsidizing nuclear power, old or new, is a mistake in the 21st century electricity system. But two
non-energy impacts are also invoked in the effort to support subsidies for nuclear power:
macroeconomic impacts and the ‘indispensable” role of nuclear in carbon reduction.
1. Employment and the Local Economy
The non-energy impact that receives the most attention in the case of aging reactors is the
impact on the local economy. A careful examination of this macro-economic impact does not
lend much support to the case for subsidies.
The Illinois Department of Commerce analysis raises the question of the impact on the
local and state economy. As shown in Figure VI-7, the loss of nuclear reactor-related jobs (direct
and indirect) is offset in the early years by construction of alternatives. When the construction
jobs expire, the loss of nuclear jobs exceeds the ongoing number of jobs added by the
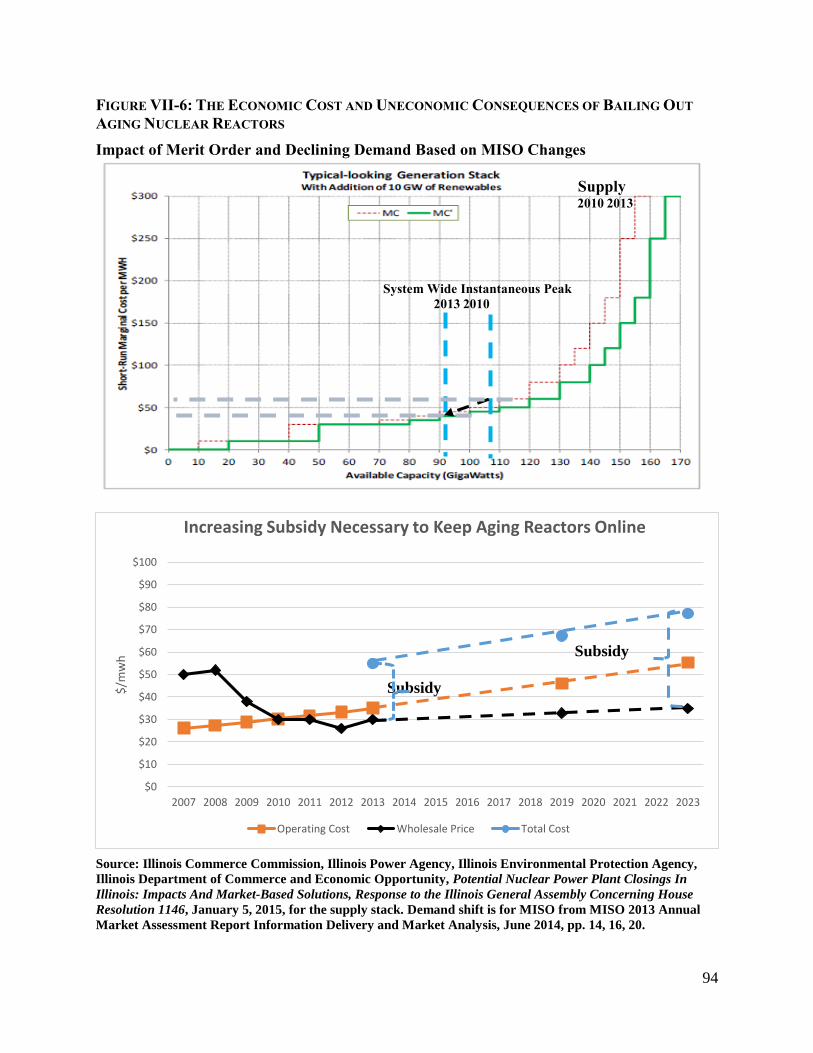
94
$0
$10
$20
$30
$40
$50
$60
$70
$80
$90
$100
2007 2008 2009 2010 2011 2012 2013 2014 2015 2016 2017 2018 2019 2020 2021 2022 2023
$/m
wh
Increasing Subsidy Necessary to Keep Aging Reactors Online
Operating Cost Wholesale Price Total Cost
FIGURE VII-6: THE ECONOMIC COST AND UNECONOMIC CONSEQUENCES OF BAILING OUT
AGING NUCLEAR REACTORS
Impact of Merit Order and Declining Demand Based on MISO Changes
Supply 2010 2013
System Wide Instantaneous Peak
2013 2010
Subsidy
Subsidy
Source: Illinois Commerce Commission, Illinois Power Agency, Illinois Environmental Protection Agency,
Illinois Department of Commerce and Economic Opportunity, Potential Nuclear Power Plant Closings In
Illinois: Impacts And Market-Based Solutions, Response to the Illinois General Assembly Concerning House
Resolution 1146, January 5, 2015, for the supply stack. Demand shift is for MISO from MISO 2013 Annual
Market Assessment Report Information Delivery and Market Analysis, June 2014, pp. 14, 16, 20.
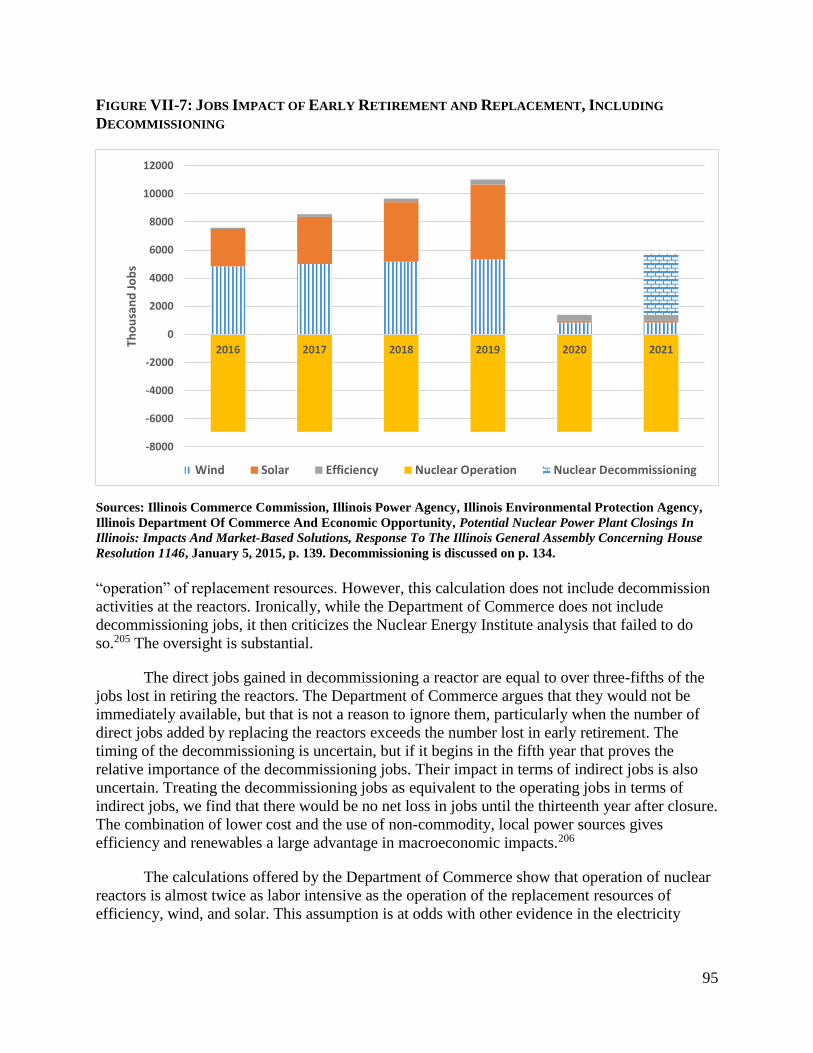
95
-8000
-6000
-4000
-2000
0
2000
4000
6000
8000
10000
12000
2016 2017 2018 2019 2020 2021
Tho
usa
nd
Jo
bs
Wind Solar Efficiency Nuclear Operation Nuclear Decommissioning
FIGURE VII-7: JOBS IMPACT OF EARLY RETIREMENT AND REPLACEMENT, INCLUDING
DECOMMISSIONING
Sources: Illinois Commerce Commission, Illinois Power Agency, Illinois Environmental Protection Agency,
Illinois Department Of Commerce And Economic Opportunity, Potential Nuclear Power Plant Closings In
Illinois: Impacts And Market-Based Solutions, Response To The Illinois General Assembly Concerning House
Resolution 1146, January 5, 2015, p. 139. Decommissioning is discussed on p. 134.
“operation” of replacement resources. However, this calculation does not include decommission
activities at the reactors. Ironically, while the Department of Commerce does not include
decommissioning jobs, it then criticizes the Nuclear Energy Institute analysis that failed to do
so.205 The oversight is substantial.
The direct jobs gained in decommissioning a reactor are equal to over three-fifths of the
jobs lost in retiring the reactors. The Department of Commerce argues that they would not be
immediately available, but that is not a reason to ignore them, particularly when the number of
direct jobs added by replacing the reactors exceeds the number lost in early retirement. The
timing of the decommissioning is uncertain, but if it begins in the fifth year that proves the
relative importance of the decommissioning jobs. Their impact in terms of indirect jobs is also
uncertain. Treating the decommissioning jobs as equivalent to the operating jobs in terms of
indirect jobs, we find that there would be no net loss in jobs until the thirteenth year after closure.
The combination of lower cost and the use of non-commodity, local power sources gives
efficiency and renewables a large advantage in macroeconomic impacts.206
The calculations offered by the Department of Commerce show that operation of nuclear
reactors is almost twice as labor intensive as the operation of the replacement resources of
efficiency, wind, and solar. This assumption is at odds with other evidence in the electricity
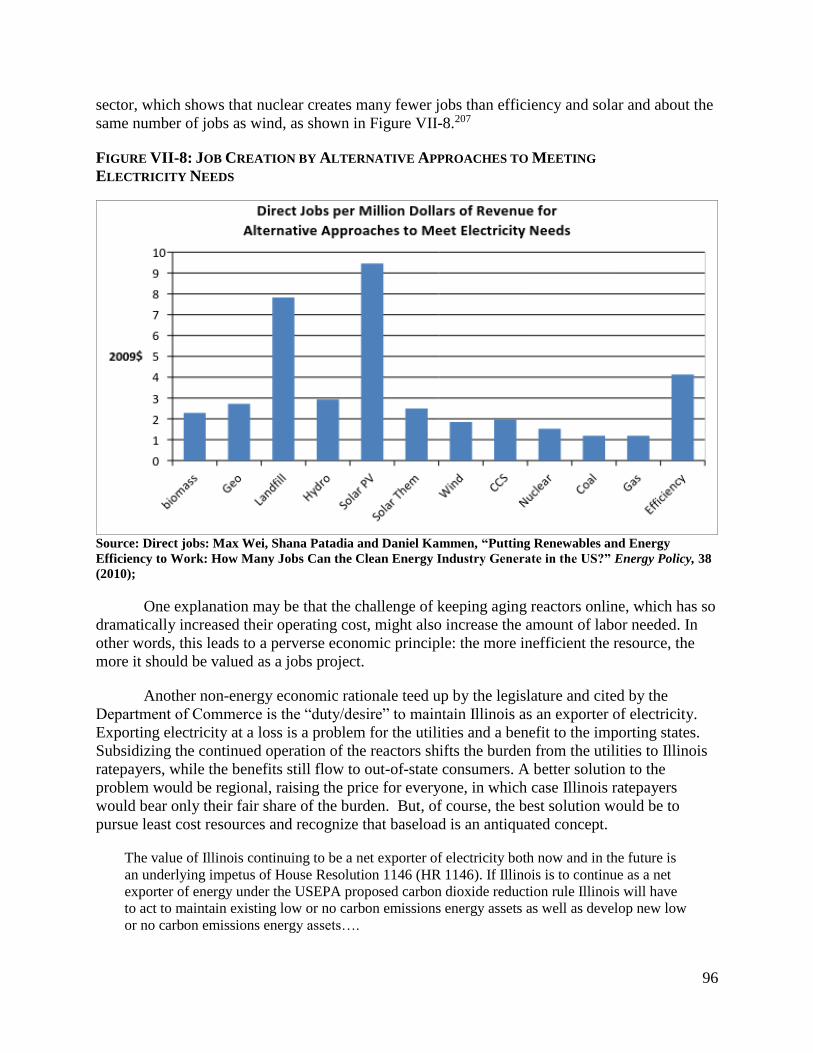
96
sector, which shows that nuclear creates many fewer jobs than efficiency and solar and about the
same number of jobs as wind, as shown in Figure VII-8.207
FIGURE VII-8: JOB CREATION BY ALTERNATIVE APPROACHES TO MEETING
ELECTRICITY NEEDS
Source: Direct jobs: Max Wei, Shana Patadia and Daniel Kammen, “Putting Renewables and Energy
Efficiency to Work: How Many Jobs Can the Clean Energy Industry Generate in the US?” Energy Policy, 38
(2010);
One explanation may be that the challenge of keeping aging reactors online, which has so
dramatically increased their operating cost, might also increase the amount of labor needed. In
other words, this leads to a perverse economic principle: the more inefficient the resource, the
more it should be valued as a jobs project.
Another non-energy economic rationale teed up by the legislature and cited by the
Department of Commerce is the “duty/desire” to maintain Illinois as an exporter of electricity.
Exporting electricity at a loss is a problem for the utilities and a benefit to the importing states.
Subsidizing the continued operation of the reactors shifts the burden from the utilities to Illinois
ratepayers, while the benefits still flow to out-of-state consumers. A better solution to the
problem would be regional, raising the price for everyone, in which case Illinois ratepayers
would bear only their fair share of the burden. But, of course, the best solution would be to
pursue least cost resources and recognize that baseload is an antiquated concept.
The value of Illinois continuing to be a net exporter of electricity both now and in the future is
an underlying impetus of House Resolution 1146 (HR 1146). If Illinois is to continue as a net
exporter of energy under the USEPA proposed carbon dioxide reduction rule Illinois will have
to act to maintain existing low or no carbon emissions energy assets as well as develop new low
or no carbon emissions energy assets….
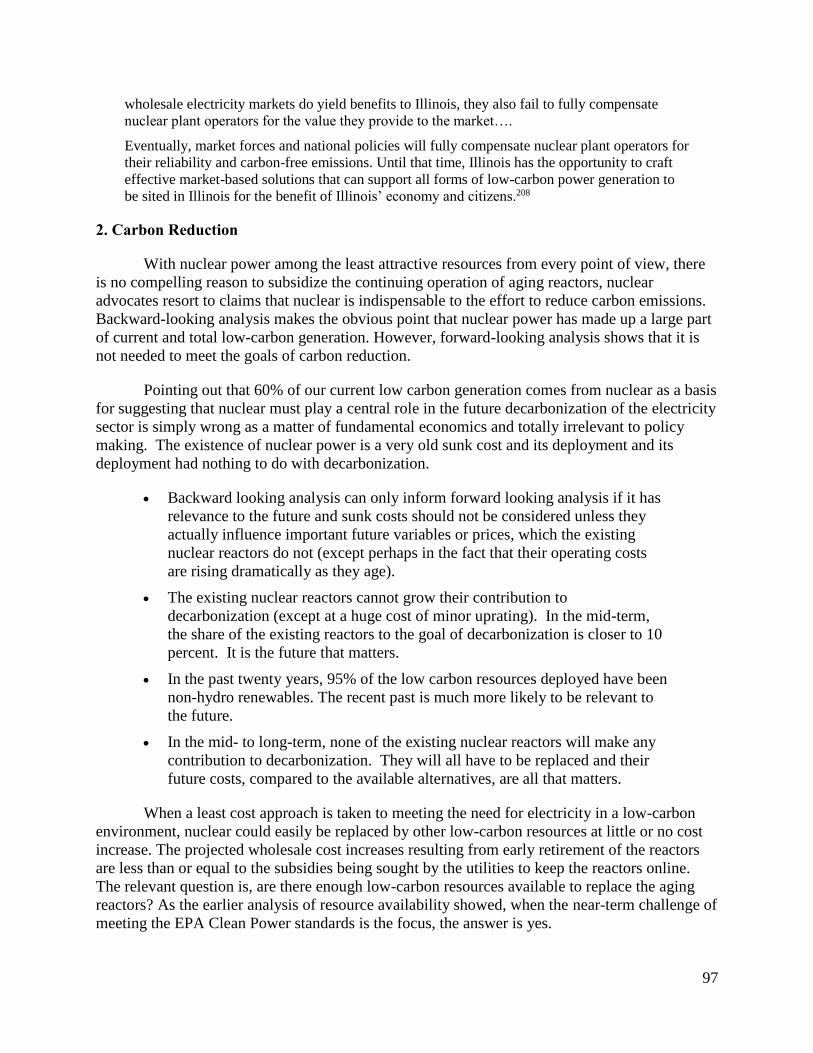
97
wholesale electricity markets do yield benefits to Illinois, they also fail to fully compensate
nuclear plant operators for the value they provide to the market….
Eventually, market forces and national policies will fully compensate nuclear plant operators for
their reliability and carbon-free emissions. Until that time, Illinois has the opportunity to craft
effective market-based solutions that can support all forms of low-carbon power generation to
be sited in Illinois for the benefit of Illinois’ economy and citizens.208
2. Carbon Reduction
With nuclear power among the least attractive resources from every point of view, there
is no compelling reason to subsidize the continuing operation of aging reactors, nuclear
advocates resort to claims that nuclear is indispensable to the effort to reduce carbon emissions.
Backward-looking analysis makes the obvious point that nuclear power has made up a large part
of current and total low-carbon generation. However, forward-looking analysis shows that it is
not needed to meet the goals of carbon reduction.
Pointing out that 60% of our current low carbon generation comes from nuclear as a basis
for suggesting that nuclear must play a central role in the future decarbonization of the electricity
sector is simply wrong as a matter of fundamental economics and totally irrelevant to policy
making. The existence of nuclear power is a very old sunk cost and its deployment and its
deployment had nothing to do with decarbonization.
Backward looking analysis can only inform forward looking analysis if it has
relevance to the future and sunk costs should not be considered unless they
actually influence important future variables or prices, which the existing
nuclear reactors do not (except perhaps in the fact that their operating costs
are rising dramatically as they age).
The existing nuclear reactors cannot grow their contribution to
decarbonization (except at a huge cost of minor uprating). In the mid-term,
the share of the existing reactors to the goal of decarbonization is closer to 10
percent. It is the future that matters.
In the past twenty years, 95% of the low carbon resources deployed have been
non-hydro renewables. The recent past is much more likely to be relevant to
the future.
In the mid- to long-term, none of the existing nuclear reactors will make any
contribution to decarbonization. They will all have to be replaced and their
future costs, compared to the available alternatives, are all that matters.
When a least cost approach is taken to meeting the need for electricity in a low-carbon
environment, nuclear could easily be replaced by other low-carbon resources at little or no cost
increase. The projected wholesale cost increases resulting from early retirement of the reactors
are less than or equal to the subsidies being sought by the utilities to keep the reactors online.
The relevant question is, are there enough low-carbon resources available to replace the aging
reactors? As the earlier analysis of resource availability showed, when the near-term challenge of
meeting the EPA Clean Power standards is the focus, the answer is yes.
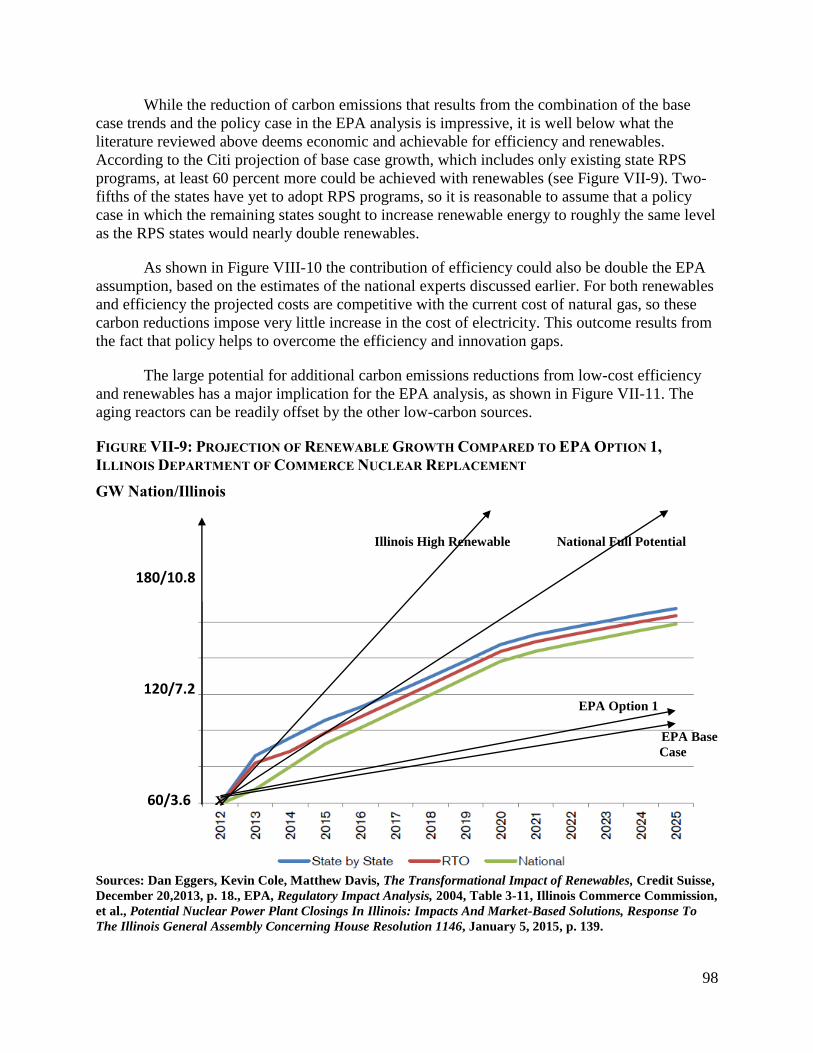
98
While the reduction of carbon emissions that results from the combination of the base
case trends and the policy case in the EPA analysis is impressive, it is well below what the
literature reviewed above deems economic and achievable for efficiency and renewables.
According to the Citi projection of base case growth, which includes only existing state RPS
programs, at least 60 percent more could be achieved with renewables (see Figure VII-9). Two-
fifths of the states have yet to adopt RPS programs, so it is reasonable to assume that a policy
case in which the remaining states sought to increase renewable energy to roughly the same level
as the RPS states would nearly double renewables.
As shown in Figure VIII-10 the contribution of efficiency could also be double the EPA
assumption, based on the estimates of the national experts discussed earlier. For both renewables
and efficiency the projected costs are competitive with the current cost of natural gas, so these
carbon reductions impose very little increase in the cost of electricity. This outcome results from
the fact that policy helps to overcome the efficiency and innovation gaps.
The large potential for additional carbon emissions reductions from low-cost efficiency
and renewables has a major implication for the EPA analysis, as shown in Figure VII-11. The
aging reactors can be readily offset by the other low-carbon sources.
FIGURE VII-9: PROJECTION OF RENEWABLE GROWTH COMPARED TO EPA OPTION 1,
ILLINOIS DEPARTMENT OF COMMERCE NUCLEAR REPLACEMENT
GW Nation/Illinois Illinois High Renewable National Full Potential
180/10.8
120/7.2 EPA Option 1
EPA Base
Case
60/3.6 X
Sources: Dan Eggers, Kevin Cole, Matthew Davis, The Transformational Impact of Renewables, Credit Suisse,
December 20,2013, p. 18., EPA, Regulatory Impact Analysis, 2004, Table 3-11, Illinois Commerce Commission,
et al., Potential Nuclear Power Plant Closings In Illinois: Impacts And Market-Based Solutions, Response To
The Illinois General Assembly Concerning House Resolution 1146, January 5, 2015, p. 139.
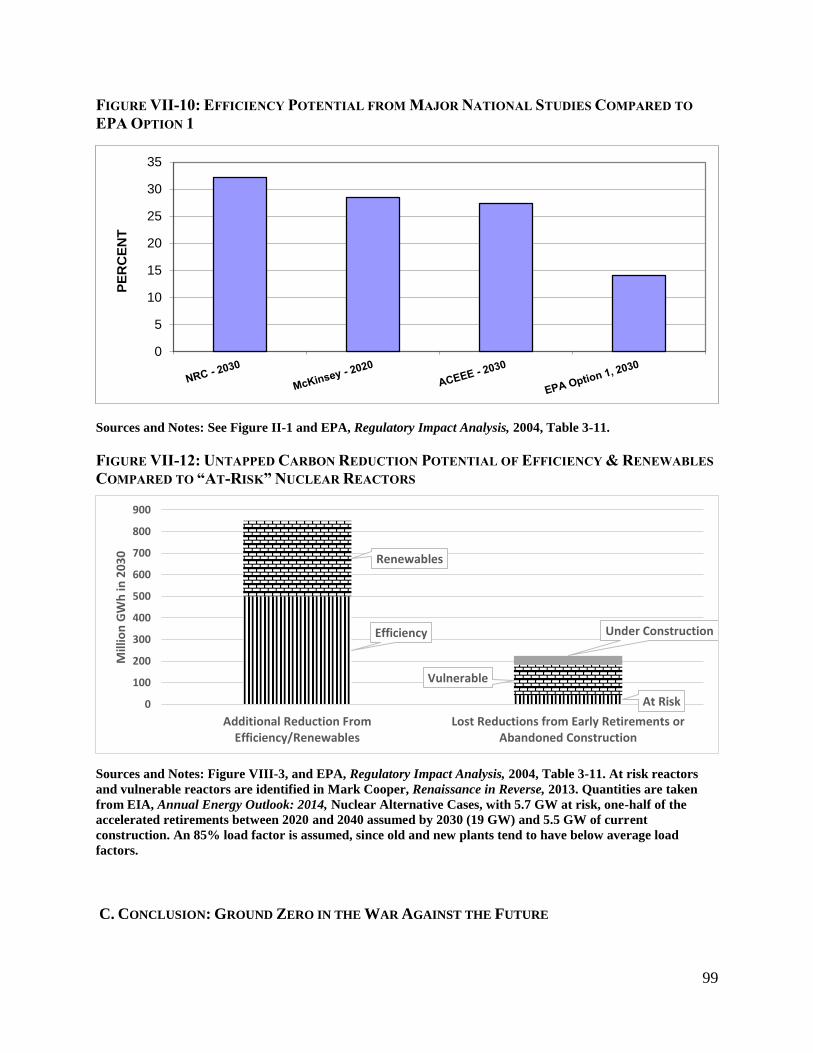
99
0
5
10
15
20
25
30
35
PE
RC
EN
T
Efficiency
At Risk
Renewables
Vulnerable
Under Construction
0
100
200
300
400
500
600
700
800
900
Additional Reduction FromEfficiency/Renewables
Lost Reductions from Early Retirements orAbandoned Construction
Mill
ion
GW
h in
20
30
FIGURE VII-10: EFFICIENCY POTENTIAL FROM MAJOR NATIONAL STUDIES COMPARED TO
EPA OPTION 1
Sources and Notes: See Figure II-1 and EPA, Regulatory Impact Analysis, 2004, Table 3-11.
FIGURE VII-12: UNTAPPED CARBON REDUCTION POTENTIAL OF EFFICIENCY & RENEWABLES
COMPARED TO “AT-RISK” NUCLEAR REACTORS
Sources and Notes: Figure VIII-3, and EPA, Regulatory Impact Analysis, 2004, Table 3-11. At risk reactors
and vulnerable reactors are identified in Mark Cooper, Renaissance in Reverse, 2013. Quantities are taken
from EIA, Annual Energy Outlook: 2014, Nuclear Alternative Cases, with 5.7 GW at risk, one-half of the
accelerated retirements between 2020 and 2040 assumed by 2030 (19 GW) and 5.5 GW of current
construction. An 85% load factor is assumed, since old and new plants tend to have below average load
factors.
C. CONCLUSION: GROUND ZERO IN THE WAR AGAINST THE FUTURE
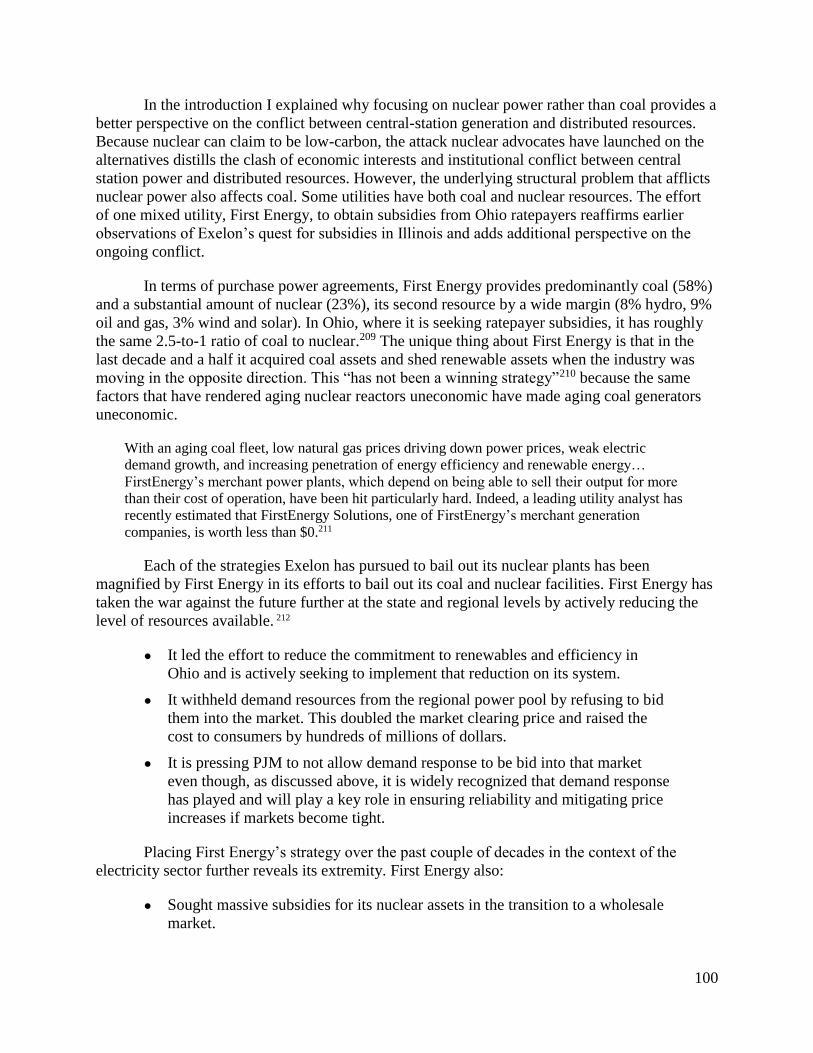
100
In the introduction I explained why focusing on nuclear power rather than coal provides a
better perspective on the conflict between central-station generation and distributed resources.
Because nuclear can claim to be low-carbon, the attack nuclear advocates have launched on the
alternatives distills the clash of economic interests and institutional conflict between central
station power and distributed resources. However, the underlying structural problem that afflicts
nuclear power also affects coal. Some utilities have both coal and nuclear resources. The effort
of one mixed utility, First Energy, to obtain subsidies from Ohio ratepayers reaffirms earlier
observations of Exelon’s quest for subsidies in Illinois and adds additional perspective on the
ongoing conflict.
In terms of purchase power agreements, First Energy provides predominantly coal (58%)
and a substantial amount of nuclear (23%), its second resource by a wide margin (8% hydro, 9%
oil and gas, 3% wind and solar). In Ohio, where it is seeking ratepayer subsidies, it has roughly
the same 2.5-to-1 ratio of coal to nuclear.209 The unique thing about First Energy is that in the
last decade and a half it acquired coal assets and shed renewable assets when the industry was
moving in the opposite direction. This “has not been a winning strategy”210 because the same
factors that have rendered aging nuclear reactors uneconomic have made aging coal generators
uneconomic.
With an aging coal fleet, low natural gas prices driving down power prices, weak electric
demand growth, and increasing penetration of energy efficiency and renewable energy…
FirstEnergy’s merchant power plants, which depend on being able to sell their output for more
than their cost of operation, have been hit particularly hard. Indeed, a leading utility analyst has
recently estimated that FirstEnergy Solutions, one of FirstEnergy’s merchant generation
companies, is worth less than $0.211
Each of the strategies Exelon has pursued to bail out its nuclear plants has been
magnified by First Energy in its efforts to bail out its coal and nuclear facilities. First Energy has
taken the war against the future further at the state and regional levels by actively reducing the
level of resources available. 212
● It led the effort to reduce the commitment to renewables and efficiency in
Ohio and is actively seeking to implement that reduction on its system.
● It withheld demand resources from the regional power pool by refusing to bid
them into the market. This doubled the market clearing price and raised the
cost to consumers by hundreds of millions of dollars.
● It is pressing PJM to not allow demand response to be bid into that market
even though, as discussed above, it is widely recognized that demand response
has played and will play a key role in ensuring reliability and mitigating price
increases if markets become tight.
Placing First Energy’s strategy over the past couple of decades in the context of the
electricity sector further reveals its extremity. First Energy also:
● Sought massive subsidies for its nuclear assets in the transition to a wholesale
market.
101
● Shifted coal generation from the wholesale market to regulated status when it
did not like the market price.
● Has requested a direct subsidy from ratepayers.
In essence, First Energy is seeking to create a crisis of reliability by driving resources out
of the market so that more centralized resources are needed. Its ability to lure policymakers down
this path reflects more than the political muscle of a major utility, which is considerable. Over
the past decade, the economics of the electricity sector have been transformed by technological
change. Policymakers still have a mindset that is stuck in the past. The economics of aging
reactors has been undermined by a
40 percent increase in the operating cost of those reactors;
a 40 percent decrease in the cost of wind;
60 percent decrease in the cost of solar;
low-cost energy efficiency technologies that have taken a bite out of load
growth;
demand response that has become an increasingly valuable and effective
resource;
huge investments in storage technologies that are on the brink of redefining
the value of intermittent resources; and
advanced information and control technologies that transform the approach to
reliability.
The strategy pursued by First Energy makes it clear that this is a fight to the finish
between the central-station approach and the distributed-resource approach. It provides strong
support for Lovins’ conclusion (cited above) that an “all of the above” approach simply will not
work. It renders null and void the aspiration expressed by the Illinois Department of Commerce
and Economic Opportunity that “Illinois has the opportunity to craft effective market-based
solutions that can support all forms of low-carbon power generation to be sited in Illinois for the
benefit of Illinois’ economy and citizens.” 213 Above all, if it succeeds, it precludes any real
possibility of significantly reducing carbon emissions and responding to the challenge of climate
change without the construction of hundreds of new nuclear reactors.
The extremes to which the central-station generation advocates are willing to go to
defend their interests in their war against the future suggests that retiring aging reactors in an
orderly fashion is an indispensable, early step on the path to building a least-cost, low-carbon
future for the electricity sector.
This analysis leads to three interrelated recommendations for policymakers.
Policy should move to quickly adopt the necessary institutional and physical
infrastructure changes needed to transform the electricity system into the 21st
century model.
Policy should not subsidize nuclear reactors, old or new. In the long run, their

102
large size and inflexible operation make them a burden, not a benefit in the
21st century system.
Combining their technological characteristics with their political efforts to
undermine the development of the 21st century system makes them a part of
the problem, not the solution.
103
ENDNOTES
1 I use the term political economy in the traditional, positive sense, as suggested by Pearce, 1984, p. 342, which
defines political economy as follows: “Until recent times the common name for the study of the economic process.
The term has connotations of the interrelationship between the practical aspects of political action and the pure
theory of economics. It is sometimes argued that classical political economy was concerned more with this aspect
of the economy and that modern economists have tended to be more restricted in the range of their studies.” 2 UBS, 2014, p. 1. 3 U.S. Environmental Protection Agency, 2014a. 4 The paper is based on two recent filings in proceedings at federal agencies that will strongly influence the future
structure of the electric utility industry in the U.S. – EPA’s Clean Power Proposal and the Nuclear Regulatory
Commission’s (NRC’s) consideration of Pacific Gas and Electric Company’s (PG&E’s) request for a license
renewal for its Diablo Canyon reactors. It includes a review of the most detailed state-level analysis to date of the
early retirement of aging reactors conducted by the Illinois Commerce Commission in response to Exelon’s efforts
to secure subsidies for its aging reactors. Exelon triggered the studies by threatening to retire these reactors early
because they are losing money in the wholesale markets run by the PJM and MISO regional transmission
organizations. Ultimately, the states take responsibility for resource acquisition in the electricity sector, under the
direction set by federal policy, which means that this level of analysis will play a vital part in determining the
extent to which the electricity system is transformed. There are ongoing regulatory proceedings and legislative
action under this threat in Ohio and New York, in addition to Illinois. 5 Ammer and Ammer, 1984, describe a situation of scarcity that applies well to the peak load problem, noting that
“when the supply is exceptionally small – its price will be exceptionally high, and it will be said to have scarcity
value“ (p. 416) and links it to the definition of quasi-rent, defined as “a return on capital or labor whose supply is
temporarily or permanently fixed, so called to distinguish it from a real rent, the return on land (whose supply is
always fixed). Pearce, 1984, p. 395, applies the concept of absolute scarcity to fossil fuels. 6 The Merit Order Effect has been documented in a number of nations in which renewables have shown strong
growth in recent years, demonstrating not only that market clearing prices are lowered, but also that they are
lowered by an amount that is larger than any subsidies the resources receive. The result is a net benefit to
consumers. See for example, United States, Fagan, et al. 2012, Caperton, 2012, Charles River Associates, 2010;
Canada, Ben Amora, et al., 2014; Australia, McConnell, et al., 2013, MacGill, 2013, Melbourne Energy Institute,
2013; Ireland, Mahoney and Denny, 2011; Denmark, Munksgaard, and Morthorst, 2008; Germany, Sensfuss,
Ragwitz, and Genoese, 2008; Italy: Clò, 2015; Spain, de Miera, et al., 2008; United Kingdom, Green, and
Vasilakos, 2011. A separate effect that lowers the market clearing price is the fact that renewables tend to lower
the level of concentration of supply, reducing the exercise of market power, Mishra, et al., 2014, Twomey, and
Neuhoff, K., 2010; Wirl, 2014, Mountain, 2012, 7 The Illinois Commerce Commission, 2015, p. 29-30, was not given cost data by Exelon, but relied on EIA
estimates. 8 Cooper 2009a, 2012, reviews the nuclear estimates associated with the “nuclear renaissance.” Cooper 2012 and
2013, reviews comprehensive cost estimates. 9 Chang, et.al. 2014; Jaffee, 2014. 10 The Hinkley cost ($150/MHWH) is equal to my estimate of costs (Cooper, 2009). 11 Cooper, 2014. 12 Eggers, Cole and Davis, 2013. I show 2023, the mid-point of the current period for the EPA Clean Power rule. 13 Eggers, Cole and Davis, 2013, p. 3. 14 Zheng, Cheng and Kammen, 2014. 15 Eggers, Cole and Davis, 2013, p. 3. 16 Lyons, 2014, “by 2018 the cost of ViZn Energy’s 4-hour storage solution in is essentially identical to that of a
conventional simple cycle peaker. Given the added benefits of installing storage in distribution, by 2018 storage is
a clear winner compared to a typical mid-range cost for a conventional simple cycle CT.” 17 Lazard, 2013, Hoffman, as reported in Fuhs, 2014, Sam, 2014, p. 8. 18 Walwyn and Brent, 2015. 19 Cooper, 2014. 20 Eggers, Cole and Davis, 2013b, p. 1. 21 Golove and Eto, 1996. 22 McKinsey, 2009, p. viii,
104
23 Schleich and Gruber, 2008, pp. 1-2, emphasis added to identify the three main schools of analysis I ultimately
adopt to organize the framework. A similar formulation is offered by Thollander, Palm, and Rohdin, p.3., Why do
organizations impose very stringent investment criteria for projects to improve energy efficiency? Why
do organizations neglect projects that appear to meet these criteria? Why do organizations neglect
energy- efficient and apparently cost-effective alternatives when making broader investment,
operational, maintenance, and purchasing decisions? Because of barriers to energy efficiency these seemingly
profitable measures are not being adopted… There is a large body of literature on the nature of barriers to energy
efficiency at the micro and the macro level, which draws on partly overlapping concepts from neo-classical
economics, institutional economics (including principal-agent theory and transaction cost economics), behavioral
economics, psychology and sociology. Barriers at the macro level involve price distortions or institutional failures.
In comparison, the literature on barriers at the micro level tries to explain why organizations fail to invest in
energy efficiency even though it appears to be profitable under current economic conditions determined at the
macro level 24 Cooper 2014b. 25 Takahasi and Nichols, 2008, p. 8-367. 26 Junginger, et al., 2008, p. 12; Kiso, 2009, find for Japanese automobiles that “fuel economy improvement
accelerated after regulations were introduced, implying induced innovation in fuel economy technology.” 27 Dale, et. al., 2009, p. 1. 28 Sperling, et al., 2004, p.p. 10-15. 29 Kok, 2006, The European car industry is highly dynamic and innovative. Its R&D expenditures are well above
average in Europe’s manufacturing sector. Among the most important drivers of innovation are consumer demand
(for comfort, safety and fuel economy), international competition, and environmental objectives and regulations…
One element of success of technology forcing is to build on one or more existing technologies that have not yet
been proven (commercially) in the area of application. For improvements in the fuel economy of cars, many
technological options are potentially available… With respect to innovation, the EU and Japanese policy
instruments perform better than the US CAFE [Corporate Average Fuel Economy] program. This is not surprising,
given the large gap between the stringency of fuel-efficiency standards in Europe and Japan on the one hand and
the US on the other…. One of the reasons for the persistence of this difference is that the US is not a
significant exporter of cars to the European and Japanese markets 30 Hwang, and Peak, 2006. 31 Harrington, 2006, p. 3; Harrington, 2010. 32 Whitefoot, et al., 2012, pp. 1…5. We perform counterfactual simulation of firms’ pricing and medium-run design
responses to the reformed CAFE regulation. Results indicate that compliant firms rely primarily on changes to
vehicle design to meet the CAFE standards, with a smaller contribution coming from pricing strategies designed to
shift demand toward more fuel-efficient vehicles... Importantly, estimated costs to producers of complying with
the regulation are three times larger when we fail to account for tradeoffs between fuel economy and other vehicle
attributes. 33 Nadel and Delaski, 2013; Institute for European Environmental Policy 2013, p. 9. 34 Hoffman, et al., 2015. 35 Molina, 2014. 36 Cooper, 2006. 37 Cooper, 2014a. 38 Boccard, 2014; Rangel and Leveque, 2012. 39 Jansen, Beurskens, and Tiburg, 2006, p. 13 argue for a risk-cost frontier. 40 Jansen, Beurskens, and Tiburg, 2006, Appendix, p. 59, “”the question of whether a tool could be develop for
gauging the impact of incremental technology deployment… the use of a (sort of) Sharpe ratio, showing the
tangent of the direction a certain portfolio at (or to the right of) the efficient frontier would move into by
incremental use of a certain technology.” 41 Cooper, 2011, 2013b. 42 Vithayasrichareon, Riesz MacGill, 2015, p. 44, identify portfolio studies of New Zealand, Denmark, Ireland,
Macedonia, Portugal, Japan, Brazil, Spain, Taiwan, 44. Cooper, 2011, 2013b, had earlier reviewed studies of the
U.S. Scotland, U.K. 43 Cooper, 2013c. 44 Cooper, 2012. 45 In addition to the recent U.S. analysis by U.S. EPA/NHTSA, 2011, see Howland, et al., 2009, and New York State
105
Energy Research & Development Authority, 2011, for individual states; Homes and Mohanty (2012) and
Cambridge Centre for Climate Mitigation Research (2006), and Ryan and Campbell, 2012 for a general global
review. 46 Amann, 2006. 47 Amann, 2006. 48 Dombi, 2014; Maxim, 2014. 49 Pechan and Eisenach, 2014. 50 Stein, 213, 646… 640. 51 Johansonn, 2014. 52 Katarzyna, et al., 2009, 187, 53 Stein, 2013; Rabl and Rabl, 2013, 54 Stein, 213, Karakosta, et al., 2013, Verbruggen, Laes and Lemmens, 2014. 55 U.S. Congressional Office of Technology Assessment, 1994, evaluating Ottinger, Richard et. al., 1990, Chernik,
Paul and Emily Caverhill, 1989, Hohmeyer, Olive, 1988 and Shuman, Michael and Ralph Cavanagh, 1982. 56 Stein, 213, 646… 640. 57 MIT, 2015, pp. xi… xiii. 58 U.S. Department of Energy 2015, p. xxvii. 59 MIT, 2015, p. xiii. 60 MIT, 2015, pp. xv…xix. 61 U.S. Department of Energy, 2015, p. xxiii. 62 U.S. Department of Energy 2015, p. xlii. 63 See for example, Hoffert, M.I.,2010; Bettencourt, L.M.A., Trancik, J.E., Kaur, J., 2013; Petkovi, Dalibor, 2014;
Sueyoshi , Toshiyuki and Mika Goto, 2014; Chmutina, Ksenia and Chris I. Goodier, 2014; Maia, Trieu, et al.,
2014; Santiago, de Souza and Bezerra, 2014; Sueyoshia, Toshiyuki, Mika Gotob, 2014; Johnson, Erik Paul, 2014;
Zheng, Chengn and Daniel M. Kammen, 201. There are a growing number of scenario analyses at the global level
(Jacobson and Delucchi, 2011; Jacobson, et al., 2013; Delucchi and Jacobson, 2011, Budischak, et al., 2013;
Delucchi and Jacobson, 2013; Cochran, Mai and Bazilian, 2014). 64 For academic studies on system integration generally see, for example, Lu, 2013; Veena, P., et al., 2014;
Phuangpornpitak, N. and S. Tia, 2013; Jamel, AbdRahman and Shamsuddin, 2013; Chaves-Avila, Hakvoort, and
Ramos, 2014. On resource diversity, see for example, Tascikaraoglu, A., and M. Uzunoglu, 2014, Grossmann,
Grosssman and Seininger, 2014. 65 Cooper, 2009b, reviews several of these analyses including, Moody’s, 2009; Moody’s, 2008; Standard & Poor’s,
2009; Standard & Poor’s, 2008; Standard & Poor’s, 2007; Maloney, Stephen, 2008; Maloney, Stephen, 2009; Kee
2009. 66 Lazard, 2011; Citi Research, 2012; Eggers, Cole and Davis, 2013. 67 Credit Suisse, 2013; UBS Investment Research, 2013a, 2013b, 2013c; Platts, 2013, Moody’s, 2012 68 Citi Research, 2012, pp. 54, 55, 56. The academic literature reflects this trend as well. See, for example, Sener,
Can and Vasilis Fthenakis, 2014; Martínez-Duart and Hernández-Moro, 2013; Reichelstein, Stefan and Michael
Yorston, 2013: Bazilian, Morgan, et al., 2013; Branker, Patha and, Pearce, 2011. 69 Eggers, Cole and Davis, 2013b, p. 1. 70 Eggers, Cole and Davis, 2013b, p. 1. 71 Frankel, Ostrowski, and Pinner, 2014. 72 Frankel, Ostrowski, and Pinner, 2014. 73 Parker, 2014, p. 3. 74 Eggers, Cole and Davis, 2013a, p. 1. 75 Eggers, Cole and Davis, 2013a, p. 1. 76 Eggers, Cole and Davis, 2013a, p. 3. 77 McKinsey, 2009, 2010. 78 The DOE Wind Vision study project almost a one-quarter reduction in base case demand for natural gas. 79 Eggers, Cole and Davis, 2013b. 80 Cooper, 2013c. 81 Navigant, 2015. 82 UBS, 2013, 2. 83 Nayyar, 2013. 84 Navigant, 2014. 85 Bradley and Leach, Shen, Martinez Aghiri, 2013.
106
86 Bradley, Leach and Torriti, 2013, p. 317. 87 Evans, Kelly , 2015, McMahon, 2015b, 88 McMahon, 2015a, Did Tesla Just Kill Nuclear Power?, Forbes Blog, May 1. 89 Costello and Hemphill, 2014. 90 Dumulin-smith, et al., 2014. 91 Deutsche Bank, 2015, p. 44. 92 RMI, 2015. 93 Peare, Atia, Zhao 94 Chang, et.al, 2014, p. 2 95 General Electric International, Inc., 2014; Oggioni, Murhpy and Smeers, 2014. 96 Sahu, Hiloidhari and Baruah, 2013, pp. 349–353. 97 Imperial College, 2014, 98 Rasmussen, et al., N.D., 2012, Schaber, Steinke Hamacher, 2013; Rodriguez, 2013; Rasmussen, Andresen, and
Greiner, 2012; Greiner, et al., 2013. 99 On storage and its integration with renewables to achieve reliability see Katarzyna, 2009; Bose, et al., N.D.;
National Renewable Energy Laboratory, N.D. Boie, et al., 2014; Pleßmann, et al., 2014; Komiyamaa, and Fujiib,
2014; Elkind, 2010; Hasan, et al., 2013; Koohi-Kamali, et al., 2013; Díaz-González, et al., 2012; Ippolito, 2014;
Lu, 2013; Steinke, 2013. Gao, et al., 2013, Kucsera, and Rammerstorfer, 2014; Cau, 2014. 100 On demand management, see for example, Falsafi and Jadid, 2014; Arif, Javed and Arshad, 2014; Biegela, et al.,
2014; Bergaentzlé, Clastres, and Khalfallah, 2014, O’Connell, et al., 2014. 101 Heymans, et al. 2014, Reber, et al., 2014, Loisel, Pasaoglu and Thiel, 2014, Parsons, et al., 2014, 102 The Smart Grid is at the classic turning point in early diffusion and in need of social support to overcome
concerns and attitudinal barriers grounded in the real world experience of consumers. Naus, 2012, p. 436, Smart
grids generate three key new information flows that affect social relations. Practice theory can reveal the ways in
which households handle/govern information. Householders show ambivalence about the workings of the different
information flows. Policies should account for the ‘bright’ as well as the ‘dark’ sides of information. Park, 2014, p.
211, We examine what factors influence electricity consumers' smart grid acceptance. We test the smart grid
technology acceptance model including the perceived risk as a main factor. The importance of consumer education
and public relations of the smart grid has been confirmed. Another short cut to ensure the acceptance of the smart
grid is to mitigate the anxiety about the risk in the use of the Smart grid. Pepermans, 2014, Guizhou Ma and Cong,
2015. 103 Both in its interaction with smart grid and directly in transforming production and distribution processes
Ravindranath, 2014, Poindexter, 2014, Stephenson, 2014. 104 Solar as both baseload resources, (e.g. Pfenninger, et al., 2014) and a distributed resource (rooftop PV). 105 On system integration see, for general policy studies see example, Mills and Wiser, 2014; E3, 2015; U.S.
Department of Energy, 2015; and Imperial College, 2014; 106 Pringles, Olsina and Garcés, 2014; Edenhofer, et al., 2013; Bushnell, J. 2010, 107 Jim Lazar, 2014. Needless to say, there are many other general analyses of the possibility and benefits to
aggressively integrating renewable supply and demand in the long term. The RAP analysis provides a clear,
concrete basis for translating these benefits into cost analysis of presently deployed systems. 108 Lazar, 2014, p. 24. 109 Mills and Wiser, 2014, p. 17 110 Id., p. 29. 111 The LBL study shows the ratio as high as 3-to-1, and cites (p. 14) a similar study for ERCOT, which put the
ration at 2.33-to- 1. Other studies have arrive at ratios that favor solar, when that resources is richer. 112 Mills and Wiser, 2014, p. 19. 113 Id., p. 24, A portfolio with high geographic diversity leads to a higher value of wind due to a reduction in
extremes: fewer hours have significant amounts of wind from all wind sites in the portfolio (reducing
overgeneration and curtailment), and more hours have at least a small amount of wind generation from some sites.
The benefit of increased geographic diversity is more pronounced with high wind penetration levels since wind is
more likely to affect wholesale prices at high penetration levels. 114 Id. p. 25, The increase in the capacity value of wind with 10% PV is due to PV shifting the timing of the peak
prices into the early evening, when wind generation is somewhat stronger. p. 27, as PV penetrations increase,
adding 10% wind increases the marginal value of PV substantially relative to the Reference scenario… The
increase in the capacity value is tied in part to wind generation occurring in early evening (as described earlier)
and thus slowing the shift of high-price hours into the early evening with increasing PV.
107
115 Id., p. 33 The increase in the value of PV with low-cost storage is almost entirely due to the increase in the
energy value of PV relative to the Reference scenario... The energy value of PV increases in part due to a
reduction in PV curtailment from 2.9% with 30% PV in the Reference scenario to less than 0.1% in the Low-cost
Storage scenario. The strong negative correlation between PV generation and generation from storage (existing
and new) at high PV penetrations indicates storage is consistently charging when PV is generating and discharging
otherwise, 116 Id., pp. 32, 33. 117 Id., p. 33. 118 Id., p. 35, since reductions in demand relative to historical levels at time of system need enable a balance between
demand and generation rather than relying on new conventional capacity 119 In the Mills and Wiser, 2014, study the issue enters implicitly through the frequent attention to forecasting error.
The other major studies give sub-hourly scheduling prominent, explicit attention. 120 Id., p. 43, 121 Id., p. 30, In addition, the impact of more-flexible generation will depend on the degree of flexibility in the
existing generation mix. California has significant amounts of CTs, PHS capacity, and hydropower. In
comparison, we found in an earlier analysis of highly concentrated wind in the Rocky Mountain Power Area
[Mills and Wiser, 2013] that assuming all new CCGTs had quick-start capability increased the value of wind by
up to $6/MWh at 30% wind penetration. The Rocky Mountain Power Area has much less flexible incumbent
generation relative to California. 122 Id., p. 39. 123 Id., pp. 41 (technology diversity), 43 (“quick start” generation, 45 (storage), 45 (demand shaping. 124 E3, 2015, p. 129. 125 The four “least regrets” opportunities identified in this study include: 1. Increase regional coordination… 2.
Pursue a diverse portfolio of renewable resources…. 3. Implement a long-term, sustainable solution to address
overgeneration before the issue becomes more challenging…. 4. Implement distributed generation solutions…. 5.
Promising technologies, storage (Solar thermal with energy storage, Pumped storage, Other forms of energy
storage including battery storage, Electric vehicle charging, Thermal energy storage)… 6. Flexible loads that can
increase energy demand during daylight hours (Advanced demand response and flexible loads)…. 7. Sub-five
minute operations…. 8. Size of potential export markets for excess energy from California… 9. Transmission
constraints… 10. Changing profile of daily energy demand… 11. Future business model for thermal generation
and market design… 12. Optimal thermal generation fleet under high RPS. (pp. 31-35) 126 E3, 2015, pp. 31-35. 127 Shrimali, Lynes and, Indvik, 2015, p. 454, “The complementary characteristic of battery (large energy density for
long term storage, but low power density, low charge and discharge efficiency) and super-capacitor (low energy
density, but high power density, fast charge and discharge rate) has… revealed that, the hybrid of the duo can
optimize the battery charge and discharge process, thereby… can extend system lifetime by 62% and reduce the
cost of energy storage system by 41%... A suitable energy storage device combined with wind turbines, can firm
and shape wind power output, transforming the wind generation into a firm and predictable energy
source…However, no single storage technology can meet up with all the criteria. Thus hybrid storage technology
is being explored as a potential solution. Bouzid, et al., 2015, p. 753, A micro grid can be defined as a part of the
grid consisting of prime energy movers, power electronics converters, distributed energy storage systems, and
local loads. This makes the electrical network more flexible and intelligent. Micro grids and virtual power plants
(VPPs) are two low voltage distribution network concepts that can participate in active network management of a
smart grid. They are becoming an important concept to integrate distributed generation (DG) and energy storage
systems. 128 Id., p. 29 129 Id., p. 19. 130 Mill and Wiser, 2014, put costs in the $5-$10/MWh range; Mills and Wiser, 2010, p. 2, We conclude that the
costs of managing the short-term variability of PV are dramatically reduced by geographic diversity and are not
substantially different from the costs for managing the short-term variability of similarly sited wind in this region.
Milligan, et a., p. 93, The incremental balancing costs caused by wind are 10% or less of the wholesale value of
the wind power… The experience of countries and regions that already have quite a high wind penetration (from
5% to 20% of gross electric energy demand) has been that there existing reserves are deployed more often after
wind power is added to the system, but no additional reserve capacity is required. 131 Id., pp. 36-37. 132 Id., p. 31
108
133 U.S. Department of Energy, 2015. 134 U.S. Department of Energy, 2015. p. xv. 135 Eichman, 2013, Becker 2014a, 2014b. 136 Becker, et al., 2015. 137 Navid, 2012, Becker, et al., 2015. 138 Duthu and Bradley, 2015; Cesna, 2015; General Electric International, Inc., 2014; Oggioni, Murhpy and Smeers,
2014; Sahu, Hiloidhari and Baruah, 2013. 139 Krozer, 2013; Renewables International, 2012; Imperial College, NERA, DNV-GL, 2014. 140 Archer, 2007; Kempton, et al., 2010; GTM, 2015; Hernández-Moro. and .Martínez-Duart, 2015. 141 Holtinent, 2009; Wu, 2015; Rauch, 2014. 142 Cooper, 2015. 143 U.S. DOE, 2015, p. xxxvi. 144 NERC, Potential Reliability Impacts of EPA’s Proposed Clean Power Plan: Initial Reliability Review,
November 2014. 145 AEE Institute, NERC’s Clean Power Plan ‘Phase I’ Reliability Assessment: A Critique, May 7, 2015, Jurgen
Weiss, 2015, EPA’s Clean Power Plan and Reliability: Assessing NERC’s Initial Reliability Review, Brattle
Group, February; Susan Tierney, Eric Svenson, Brian Parsons, 2015, Ensuring Electric Grid Reliability Under the
Clean Power Plan: Addressing Key Themes From The FERC Technical Conferences, April 2015. 146 Australian Energy Market Operator (AEMO), 2013, 100 Per Cent Renewables Study – Modelling Outcomes,
July; Elliston, B., I. MacGill and M. Diesendorf, 2013, “Least cost 100% renewable electricity scenarios in the
Australian National Electricity Market,” Energy Policy, 59. 147 AEMO, 2012, p. 14, for 2011 consumption, p. 18 for technical potential, p. 22 for projected economic potential. 148 AEMO, 2012, p. 34. 149 AEMO, 2012, p. 9. 150 Vithayasrichareon, Peerapat, Jenny Riesz and Iain F. MacGill, 2015, “Using renewables to hedge against future
electricity industry uncertainties—An Australian case study,” Energy Policy, 76, p. 43. 151 Molyneaux, Lynette, et al., 2012, Australian Power: Can renewable technologies change the dominant industry
view?, Australian Solar Energy Society Conference, Melbourne December, p. 1. 152 Jacobson, et al., 2015. 153 The original concept is from Joseph Schumpeter, 1961) and has been greatly expanded and developed in recent
widely praised analyses of system change (Perez, 2002, Technology Revolutions and Financial Capital: The
dynamics of Bubbles and Golden Age; and Acemoglu and Robinson, 2012. 154 Bischof, 2014. 155 Murphy 2014. Parker, et al., 2014, p. 3. 156 Kind, 2013, p. 1. 157 EEI, 2012. 158 Bronski, et al., 2015. p. 37. 159 Pearson and Foxon, 2012, pp. 123–124. 160 Hildmann, Ulbig and Andersson, 2014, show that if baseload facilities could stop acting like baseload facilities,
they would fit into to the emerging electricity system. “Given base load power plants that have sufficient
operational flexibility in terms of fast ramping, start/stop times and minimum operation point requirements,
energy-only markets seem to work even for high RES penetration scenarios. (p. 13). 161 Lovins, 2011, p. 216. 162 U.S. Department of Energy, 2015, pp. 86-87, Most North American power markets now integrate wind power
into their security-constrained unit commitment and security-constrained economic dispatch process, allowing the
dispatch of wind plants along with conventional power plants based on current grid conditions and economics.
This effectively gets wind into the real-time economic optimization process for running the power system, and in
turn, encourages the participation of wind plants in the day-ahead markets. Security-constrained economic
dispatch also makes wind dispatchable and economical, allowing some degree of wind-plant output control by the
system operator. This allows wind forecasts to become more useful and valuable to wind plant operators, market
participants, and system operators, because wind is better integrated into systems and markets. 163 Illinois Commerce Commission, 2015, pp. 71-72, 164 Id., p. 64, 165 Id., p. 63, it is also noteworthy that generating facility owners participating in PJM’s Reliability Pricing Model
base capacity auctions commit to provide generating capacity three years prior to each delivery year; and the
109
penalties for failing to actually make committed capacity available are steep. In PJM and MISO, generators are
required to provide advanced notice of unit deactivations. 166 Id., p. 64, 167 Id., p. 64, 168 Id., p. 64, 169 Id., p. 64, 170 Id., pp. 37-38, That is, Exelon’s closure of one or more plants can increase market prices and thereby increase the
revenues earned by Exelon’s other plants. This means Exelon has market power. Thus, even if Exelon’s least-
profitable plants are at least marginally profitable at the present time and expected to remain so in the future, such
market power may provide Exelon with a reason to close one or more of those plants. 171 Id., p. 76, The reliability modeling in this report focuses on 2018-2019, the first year for which PJM capacity
obligations have not been determined. The PJM RPM auction for the 2017-2018 delivery year has cleared at a
price lower than the target clearing price, indicating more than the amount of capacity required to meet the
reliability standard has cleared the auction. There is most likely time to take other actions prior to a retirement
effective in 2019-2020 delivery year. The 2018-2019 horizon was also used for MISO, both for convenience and
because MISO itself has not yet issued warnings about future resource adequacy. 172 Id., p. 73, This analysis contained in this report demonstrates that there is a potential for impacts on reliability and
capacity from the premature closure of the at-risk nuclear plants. However, in many of the cases analyzed,
reliability impacts remain below industry standard thresholds, and impacts appear to be more significant in other
states than in Illinois. Taken alone, there may not be sufficient concern regarding reliability and capacity to
warrant the institution of new Illinois specific market-based solutions to prevent premature closure of nuclear
plants. 173 Id., p. 46. 174 Rowe, 2010, 2011. 175 Id., p. 73, But combined with the issues raised by the Reports prepared by the ICC, IEPA, and DCEO, the totality
of the impacts suggest that the General Assembly may want to consider taking measures that would prevent the
premature closure of at-risk nuclear plants. The IPA notes that the impacts found have multi-state implications and
policy makers should consider the implications of measures taken by Illinois alone versus regional or even
national measures. 176 Id., p. 166. 177 License Renewal GEIS, 2013, p. 1-30 – 1-31. 178 NRC, 1996, p. 8-1. 179 NRC, 2013, Section 2 is entitled “The Alternatives including the Proposed Action.” The first 16 pages define the
criteria by which the alternatives will be evaluated. The final teen pages present a tabular summary of the findings
and the bibliography. The middle 17 pages evaluate all the alternatives considered. 180 NRC, 2015, p. 9. 181 NRC, 2013, p. 1-3. Most utilities are expected to begin preparation for license renewal about 10 to 20 years
before expiration of their current operating licenses. Inspection, surveillance, test, and maintenance programs to
support continued plant operations during the license renewal term would be integrated gradually over a period of
years. Any refurbishment-type activities undertaken for the purposes of license renewal have generally been
completed during normal plant refueling or maintenance outages before the original license expires. 182 PG&E, 2015, p. 7.2-7 – 7.2-14. 183 PG&E, 2015, p. 7.2-12. 184 PG&E, 2015, p. 7.2-1 185 PG&E, 2015, p. 7.2-2. 186 Gross, et al., 2012, p.18. 187 Bianconi and Yoshino, 2014, refer to this as the escalation of commitment. See also Bloomberg, 2014;
Arbuthnott and Dolter, 2014; Farrar-Rivas and Ferguson, 2014; CERES, 2013. 188 Acemoglu, et al, 2012, pp. 132. 189 Gross, et al., 2012. 190 Gross, et al., 2012, p. 18; Massetti and Nicita, 2010, p. 1 191 Qui, 2012, Massetti and Nicita, 2010. 192 Dechezlepetre, et al., 2011. 193 Grubb Chapuis and Duong, 1995, p. 428, 194 Zelenika-Zovk, Pearce, 2011
110
195 De Cian, Carrara and Tavoni, 2012b, p. 14. 196 De Cian, Carrara and Tavoni, 2014, p. 1-2. 197 Goldberg, 2000; Slavin, 2009; Branker and Pearce, J.M., 2010; Badcock and Lenzen, 2010; Pfund and Healey,
2011. 198 BWE, German Wind energy Association, 2012; Kitson, Wooders, and Moerenhout, 2011; Berwick. 2012; U.S.
Energy Information Administration, 2011a; Pfund and Healey, 2011; GAO, 2007; Goldberg, 2000. 199 Badcock, and Lenzen, 2010. 200 Zelenika-Zovk and Pearce, 2011, p. 2626, 201 Badcock and Lenzen, 2010. Branker and Pearce, 2010. 202 Malik, and Polson, 2015; AGREE New York, 2014. 203 Illinois Commerce Commission, 2015. 204 Sanzillo and Kunkel, 2014. 205 Illinois commerce Commission, 2015, p. 150. 206 Llera, 2013; Santiago, et al., 2014. Islam, Mekhilef and Saidur, 2013; Pleßmann, Guido, et al., 2014, Branker and
Pearce, 2010; Black, Geoffrey, et al., 2014, p. 141. 207 Wei, Patadia and Kammen, 2010. 208 Illinois Commerce Commission, 2015, pp. 124-125. 209 Sanzillo and Kunkel, 2014. . 210 Sanzillon and Kunkel, p. 2. 211 Sanczillo and Kunkel, p. 2. 212 Sanczillo and Kunkel. 213 Illinois Commerce Commission, 2015, p. 125.
111
BIBLIOGRAPHY
A.T.Kearney, 2015, Global Energy Transitions, World Energy Forum.
Acemoglu, Daron and James A. Robinson, 2012, Why Nations Fail.
Acemoglu, Daron, et al., 2012, “The Environment and Dedicated Technical Change,” American Economic
Review, 102 (10).
AEE Institute, 2015, NERC’s Clean Power Plan ‘Phase I’ Reliability Assessment: A Critique, May 7.
AGREE New York, 2014, Re: Case 14-E-0270, Petition Requesting Initiation of a Proceeding to Examine a
Proposal for Continued Operation of the R.E. Ginna Nuclear Power Plant, LLC, December 22.
Amann, Jennifer Thorne, 2006, Valuation of Non-Energy Benefits to Determine Cost-Effectiveness of Whole-
House Retrofit Programs: A Literature Review, American Council for an Energy Efficient Economy, May.
Ammer, Christine and Dean S. Ammer, 1984, Dictionary of Business and Economics, Free Press.
Andrew Mills and Ryan Wiser, 2010, Implications of Wide-Area Geographic Diversity for Short-Term
Variability of Solar Power, Ernest Orlando Lawrence Berkeley National Laboratory.
Andrew Mills and Ryan Wiser, 2012, Changes in the Economic Value of Variable Generation at High
Penetration Levels: A Pilot Case Study of California, Ernest Orlando Lawrence Berkeley National
Laboratory.
Andrew Mills and Ryan Wiser, 2013, Solar Valuation in Utility Planning Studies, Clean Energy States Alliance:
RPS Webinar January.
Apajalahti, Eeva-Lotta, Raimo Lovio and Eva Heiskanen, 2015, “From demand side management (DSM) to
energy services: A Finnish case study,” Energy Policy, 81.
Arbuthnott, Katherine D. and Brett Dolter, 2013, “Escalation of commitment to fossil fuels,” Ecological
Economics, 89.
Archer CL, Jacobson MZ, 2007, “Supplying baseload power and reducing transmission requirements by
interconnecting wind farms,” Journal of Applied Meteorology and Climatology, 46 (11).
Arif, Ahmer, Fahad Javed, and Naveed Arshad, 2014, “Integrating renewables economic dispatch with demand
side management in micro-grids: A genetic algorithm-based approach,” Energy Efficiency, 7.
Atia, Raji and Noboru Yamada, 2015, “More accurate sizing of renewable energy sources under high levels of
electric vehicle integration,” Renewable Energy 81.
Australian Energy Market Operator, 2013, 100 Per Cent Renewables Study – Modelling Outcomes, July.
Badcock, Jeremy and Manfred Lenzen, 2010, “Subsidies for electricity-generating technologies: A review,”
Energy Policy, 38.
Barbose, Galen, Naïm Darghouth, Samantha Weaver, and Ryan Wiser, 2013, Tracking the Sun VI: An Historical
Summary of the Installed Price of Photovoltaics in the United States from 1998 to 2012, Lawrence
Berkeley National Laboratory, July.
Bazilian, Morgan, et al., 2013, Re-considering the economics of photovoltaic power,” Renewable Energy, 53.
Becker Sara, et al., 2014b, “Transmission grid extensions during the build-up of a fully renewable pan-European
electricity supply, Energy, 72
Becker Sara, et al., 2014b, Features of a fully renewable US electricity system: optimal mixes of wind and solar
PV and transmission grid extensions, Energy, 72.
Ben Amora, Mourad, et al., 2014, “Influence of wind power on hourly electricity prices and GHG (greenhouse
gas) emissions: Evidence that congestion matters from Ontario zonal data,” Energy, March, 66.
Ben-Moshe, Ori and Ofir D. Rubin, 2015, “Does wind energy mitigate market power in deregulated electricity
112
markets?,” Energy, 85.
Bergaentzlé, Claire, Cédric Clastres, and Haikel Khalfallah, “Demand-side management and European
environmental and energy goals: An optimal complementary approach,” Energy Policy, April, 67.
Bergaentzlé, Claire, Cédric Clastres, and Haikel Khalfallah, “Demand-side management and European
environmental and energy goals: An optimal complementary approach,” Energy Policy, April, 67.
Berwick, Ann G., 2012, Comparing Federal Subsidies for Renewables and Other Sources of Electric
Generation, Massachusetts Department of Public Utilities Massachusetts Solar Summit, June 13.
Bettencourt, Luı´s M. A., Jessika E. Trancik, and Jasleen Kaur, 2013, “Determinants of the Pace of Global
Innovation in Energy Technologies,” PLOS ONE, 1 October, 8 (10),
Bhattacharya, Anindya and Satoshi Kojima, 2012, Power sector investment risk and renewable energy: A
Japanese case study using portfolio risk optimization method, Energy Policy 40
Bianconi, Marcelo and Joe A. Yoshino, 2014, “Risk factors and value at risk in publicly traded companies of the
nonrenewable energy sector,” Energy Economics, 45.
Biegela, Benjamin, et al., 2014, “Value of flexible consumption in the electricity markets,” Energy, 66.
Bischof, Andrew, 2014, Morningstar Utility Observer, February.
Black, Geoffrey, et al., 2014, “Fiscal and economic impacts of state incentives for wind energy development in
the Western United States,” Renewable and Sustainable Energy Reviews, 34.
Blackburn, Griselda and Clare Magee, 2014, “Solar Valuation and the Modern Utility’s Expansion into
Distributed Generation,” The Electricity Journal, Jan/Feb.
Blank, Larry and Doug Gegax, 2014, “Residential Winners and Losers behind the Energy versus Customer
Charge Debate,” The Electricity Journal, 27.
Bloomberg New Energy Finance, 2014, “Fossil fuel divestment: a $5 trillion challenge,” August.
Boccard, Nicolas, 2014, “The cost of nuclear electricity: France after Fukushima,” Energy Policy, 66.
Boie, Inga, et al., 2014, “Efficient strategies for the integration of renewable energy into future energy
infrastructures in Europe – An analysis based on transnational modeling and case studies for nine European
regions,” Energy Policy, 67.
Bose, Tapan K., et al., N.D., Stand-Alone Renewable Energy System Based on Hydrogen Production, Institut de
recherche sur l’hydrogène, Université du Québec à Trois-Rivières, Canada.
Bouzid, Allal M., et al., 2015, “A survey on control of electric power distributed generation systems for micro
grid applications, Renewable and Sustainable Energy Reviews 44
Bradley, Peter, Matthew Leach, and Jacopo Torriti, 2013, “A review of the costs and benefits of demand
response for electricity in the UK, Energy Policy, 52.
Branker, Kadra, Michael Pathak, and Joshua M. Pearce, 2011, “A review of solar photovoltaic levelized cost of
electricity,” Renewable and Sustainable Energy Reviews, 15.
Bronski, Peter, et al., 2015, The Economics of Load Defection, Rocky Mountain Institute, April, 2015.
Brown, Richard, et al., 2008, U.S. Building-Sector Energy Efficiency Potential, Lawrence Berkeley National
Laboratory, September.
Budischak, Cory, et al., 2013, “Cost-minimized combinations of wind power, solar power, and electrochemical
storage, powering the grid up to 99.9% of the time,” Journal of Power Sources, 225.
Bushnell, James, 2010, Building Blocks: Investment in Renewable and Non-Renewable Technologies, Energy
Institute at Haas, working paper.
BWE, German Wind Energy Association, 2012, The full costs of power generation: A comparison of subsidies
and societal cost of renewable and conventional energy sources, BWE: German Wind Energy Association,
Berlin, August.
113
Byrd, Stephen, et al., 2014, Solar Power & Energy Storage Policy Factors vs. Improving Economics, Morgan
Stanley Research, January 28.
California Energy Commission, Tracking Progress: Installed Capacity, December 12, 2014.
Cambridge Centre for Climate Mitigation Research, 2006, The Macro-economic Rebound Effect and the UK
Economy, Cambridge Econometrics and Policy Studies Institute, May 15.
Caperton, Richard W., 2012, Wind Power Helps to Lower Electricity Prices, Center for American Progress,
October 10.
Cardell, J.B. and C.L. Anderson, 2015, “Targeting existing power plants: EPA emission reduction with wind and
demand response”, Energy Policy, 80.
Cau, Giorgio, et al., 2014, Energy management strategy based on short-term generation scheduling for a
renewable microgrid using a hydrogen storage system,” Energy Conversion and Management, 87.
CERES, 2013, Investors challenge fossil fuel companies
Ceseña, Eduardo A. Martínez, Nicholas Good and Pierluigi Mancarella, 2015, Electrical network capacity
support from demand side response: Techno-economic assessment of potential business cases for small
commercial and residential end-users,” Energy Policy, 82.
Chandler, Sharon (Jess) and Marilyn A. Brown,2009, Meta-Review of Efficiency Potential Studies and Their
Implications for the South, Ivan Allen College School of Public Policy, Georgia Tech, August.
Chang, et.al, 2014, The Value of Distributed Electricity Storage in Texas, The Brattle Group, November.
Chang, Judy, et.al., 2014, The Value of Distributed Electricity Storage in Texas: Proposed Policy for Enabling
Grid-Integrated, Brattle Group, November.
Charles River Associates, 2010, Analysis of the Impact of Cape Wind on New England Energy Prices, February
8, 2010.
Chaves-Ávila, J.P., R.A. Hakvoort and A. Ramos, 2014, “The impact of European balancing rules on wind
power economics and on short-term bidding strategies,” Energy Policy, 68.
Chernik, Paul and Emily Caverhill, 1989, The Valuation of Externalities from Energy Production, Delivery and
Use, Fall 1989 Update. A Report by PLC, Inc. to the Boston Gas Co.
Chmutina, Ksenia and Chris I. Goodier, 2014, “Alternative future energy pathways: Assessment of the potential
of innovative decentralised energy systems in the UK,” Energy Policy, March, 66.
CITI Research, 2012, Shale & Renewables: A Symbiotic Relationship, September 12.
Clean Coalition, 2013, Flattening the Duck, December 16.
Clò, Stefan, Alessandra Cataldi, and Pietro Zoppoli, 2015,”The merit-order effect in the Italian power market:
The impact of solar and wind generation on national wholesale electricity prices,” Energy Policy, 77.
Cochran, Jacquelin, Trieu Mai, and Morgan Bazilian, 2014, “Meta-analysis of high penetration renewable
energy scenarios,” Renewable and Sustainable Energy Reviews, 29.
Connolly, D., et al., 2011, the first step towards a 100% renewable energy-system for Ireland, Applied Energy,
88.
Cooper, Mark, 2006, "From Wifi to Wiki's and Open source," Journal on Telecommunications and High
Technology Law, 5.
Cooper, Mark, 2009a, the Economics of Nuclear Reactors: Renaissance or Relapse, Institute for Energy and the
Environment, Vermont Law School.
Cooper, Mark, 2009b, All Risk, No Reward For Taxpayers And Ratepayers: The Economics Of Subsidizing The
‘Nuclear Renaissance’ With Loan Guarantees And Construction Work In Progress, Institute for Energy
and the Environment, Vermont Law School, November.
Cooper, Mark, 2011, Prudent Resource Acquisition in a Complex Decision Making Environment:
114
Multidimensional Analysis Highlights the Superiority of Efficiency, 2011e, American Council For An
Energy Efficient Economy, National Conference on Energy Efficiency as a Resource, September 26.
Cooper, Mark, 2011b, Capturing The Value Of Wind, October.
Cooper, Mark, 2012, “Nuclear Safety and Affordable Reactors: Can We Have Both?,” Bulletin of the Atomic
Scientists.
Cooper, Mark, 2013a, The Economic Feasibility, Impact On Public Welfare And Financial Prospects For New
Nuclear Construction, For Utah Heal, July.
Cooper, Mark, 2013b,, Multi-Criteria Portfolio Analysis of Electricity Resources: An Empirical Framework For
Valuing Resource In An Increasingly Complex Decision Making Environment, Expert Workshop: System
Approach to Assessing the Value of Wind Energy to Society, European Commission Joint Research
Centre, Institute for Energy and Transport, Petten, The Netherlands, November 13-14.
Cooper, Mark, 2013c, Renaissance In Reverse: Competition Pushes Aging U.S. Nuclear Reactors To The Brink
Of Economic Abandonment, Institute For Energy And The Environment, Vermont Law School, July.
Cooper, Mark, 2014, Small Modular Reactors and the Future of Nuclear Power in the United States,” Energy
Research & Social Science, 3.
Cooper, Mark, 2014a, “The unavoidable economics of nuclear power,” Corporate Knights, January 22, 2014.
Cooper, Mark, 2014b, Energy Efficiency Performance Standards: Driving Consumer and Energy Savings in
California, California Energy Commission's Energy Academy, February 20.
Cosi, Boris, Goran Kraja and Neven Dui, 2012, A 100% renewable energy system in the year 2050: The case of
Macedonia, Energy, 48.
Costello, Ken, 2005, Making the Most of Alternative Generation Technologies: A Perspective on Fuel Diversity,
NRRI, March.
Costello, Kenneth W., 2014,” Electric Utilities’ ‘Death Spiral’: Hyperbole or Reality?,” The Electricity Journal,
27.
Costello, Kenneth W., 2015, “Major Challenges of Distributed Generation for State Utility Regulators,” The
Electricity Journal, 28.
Credit Suisse, 2013, Nuclear… The Middle Age Dilemma?, Facing Declining Performance, Higher Costs,
Inevitable Mortality, February 19.
Dale et al, 2009, “Retrospective Evaluation of Appliance Price Trends,” Energy Policy 37.
De Cian, Enrica and Tavoni Massimo, 2012, “Mitigation Portfolio and Policy Instruments When Hedging Again
Climate Policy and Technological Uncertainty,” Environmental Model Assessment, 17.
De Cian, Enrica, Samuel Carrara and Massimo Tavoni, 2014, "Nuclear Expansion or Phase Out? Costs and
Opportunities," Review of Environment, Energy and Economics, January 9.
De Cian, Enrica, Samuel Carrata, and Massimo Tavoni, 2012, Innovation Benefits from Nuclear Phase-Out: Can
They Compensate the Cost, Fondazione Eni Enrico Mattei,
De Miera, S. G., et al., 2008, "Analysing the impact of renewable electricity support schemes on power prices:
The case of wind electricity in Spain," Energy Policy, 36.
Dechezleperte, Antoine, et al., 2011, Climate Change & Directed Innovation: Evidence from the Auto Industry,
London School of Economics and Political Science.
Delucchi MA, and MZ Jacobson, 2011, “Providing all global energy with wind, water, and solar power, Part II:
reliability, system and transmission costs and policies, Energy Policy, 39.
Delucchi, Mark A. and Mark Z. Jacobson, 2011, “Providing all global energy with wind, water and solar power,
Part I: technologies, energy resources, quantities and areas of infrastructure, and materials, Part II:
Reliability, system Transmission costs and policies,” Energy Policy, 39.
115
Delucchi, Mark A. and Mark Z. Jacobson, 2013, “Meeting the world’s energy needs entirely with wind, water
and solar power,” Bulletin of the Atomic Scientists, 69(13).
Díaz-González, et al., 2012, “A review of energy storage technologies for wind power applications,” Renewable
and Sustainable Energy Reviews, 16.
Dombi, Mihály, István Kuti and Péter Balogh, 2014, “Sustainability assessment of renewable power and heat
generation technologies,” Energy Policy, 67.
Dumoulin-Smith, Julien, et al., 2015, The Real Battery Storage Opportunity, UBS, US Solar & Alternatives,
May 11.
Duthu, Ray C. and Thomas H. Bradley, 2015, An Evaluation of Customer-Optimized Distributed Generation in
New England Utility and Real-Time Markets, The Electricity Journal.
E3, 2015, Investigating a Higher Renewables Portfolio Standard in California, January.
Edelstein, Paul and Lutz Kilian, 2009, “How Sensitive are Consumer Expenditures to Retail Energy Prices?,”
Journal of Monetary Economics, 56.
Edenhofer, Ottmar, et al., 2013, “On the economics of renewable energy sources,” Energy Economics, 40.
EEI, 2012, Distribution 2020: EEI Fall Boards and Chief Executive Meeting, September.
EEI/NRDC, Joint Statement To State Utility Regulators, February 12, 2014.
Egger, Dan, et al., 2013b, Nuclear… The Middle Age Dilemma Facing Declining Performance, Higher Costs,
Inevitable Mortality, Credit Suisse, February 19.
Eggers, Dan, 2013, A Thought... Energy Efficiency: The Reality of Slower Power Demand Growth, Credit Suisse,
February 11.
Eggers, Dan, 2013a, A Thought... Energy Efficiency: The Reality of Slower Power Demand Growth, Credit
Suisse, February 11.
Eggers, Dan, Kevin Cole, Matthew Davis, 2014, The Transformational Impact of Renewables, Credit Suisse,
December 20.
Eichman, Joshua D, et al., 2013, Exploration of the integration of renewable resources into California’s electric
system using the Holistic Grid Resource Integration and Deployment (HiGRID) tool,” Energy, 50.
Eleftheriadis, Iordanis M. Evgenia G. Anagnostopoulou, 2015, “Identifying barriers in the diffusion of
renewable energy sources,” Energy Policy, 80.
Elkind, Ethan N., 2010, The power of energy storage: how to increase deployment in California to reduce
greenhouse gas emissions, Center for Law and the Environment, Berkeley, and Environmental Law Center,
UCLA, July.
Elliston, B., I., MacGill and M. Diesendorf, 2013, “Least cost 100% renewable electricity scenarios in the
Australian National Electricity Market,” Energy Policy, 59.
Evans, Kelly, 2015, “Tesla batteries: A game changer for the grid,” CNBC, May 1.
Fagan, Bob, et al. 2012, The Potential Rate Effects of Wind Energy and Transmission in the Midwest ISO
Region, Synapse, May 22.
Falsafi, Hananeh, Alireza Zakariazadeh, and Shahram Jadid, 2014, “The role of demand response in single and
multi-objective wind-thermal generation scheduling: A stochastic programming,” Energy, 64.
Farrar-Rivas, Patricia and Anders Ferguson, 2014, Emerging Research on Climate Change Risk and Fossil-Fuel
Divestment, Veris, July.
Frankel, David, Kenneth Ostrowski, and Dickon Pinner, 2014, “The disruptive potential of solar power: As costs
fall, the importance of solar power to senior executives is rising,” McKinsey Quarterly, April.
Fratzscher, Susanne, 2015, The Future of Utilities: Extinction or Re-Invention? A Transatlantic Perspective,
Heinrich Böll Stiftung, May.
116
Fuhs, Michael, 2014, “Forecast 2030: stored electricity at $0.05/kWh,” PV World, September 29.
Gao, Dan, et al., 2014, “An integrated energy storage system based on hydrogen storage: Process configuration
and case studies with wind power,” Energy, 66.
General Electric International, Inc., 2014, PJM Renewable Integration Study Executive Summary Report, March
31.
Goddard, Wilson B. 1997, A Comparative Study of the Total Environmental Costs Associated with Electrical
Generation Systems, G&GE Applied Research.
Gold, Rachel, Laura, et. al., 2009, Energy Efficiency in the American Clean Energy and Security Act of 2009:
Impact of Current Provisions and Opportunities to Enhance the Legislation, American Council for an
Energy Efficient Economy, September.
Goldberg, Marshall, 2000, Federal Energy Subsidies: Not All Technologies are Created Equal, Renewable
Energy Policy Project July.
Golove, William H. and Joseph H. Eto, 1996, Market Barriers to Energy Efficiency: A Critical Reappraisal of
the Rationale for Public Policies to Promote Energy Efficiency, Lawrence Berkeley Laboratory.
Greiner, et al., Martin O.W., 2013, “A 100% renewable power system in Europe – let the weather decide!”
Mineralogical Magazine, 77(5).
Greiner, et al., Martin O.W., 2013, “A 100% renewable power system in Europe – let the weather decide!”
Mineralogical Magazine, 77(5).
Grimaudi, André and Gilles Laffrougue, 2008, Climate Change Mitigation Policies: Are R&D Subsidies
Preferable to a Carbon Tax, Tolouse School of Economics, November 21.
Gross, Robert, et al., 2012, On Picking Winners: The Need for Targeted Support for Renewable Energy, Imperial
College London, October.
Gross, Robert, William Blyth and Philip Heponstall, 2010, “Risks, Revenues and Investment in Electricity
Generation: why Policy Needs to Look Beyond Costs,” Energy Economics, 32.
Grossmann, Wolf D., Iris Grossmann, and Karl W. Steininger, 2014, “Solar electricity generation across large
geographic areas, Part II: A Pan-American energy system based on solar,” Renewable and Sustainable
Energy Reviews, 32.
Grubb, Michael, Thierry Chapuis and Minh Ha Duong, 1995, The Economics of Changing Course: Implications
of Adaptability and Inertia for Optimal Climate Policy.
Grueneich, Dian and David Joust, 2014, Scale, Speed, and Persistence in an Analytics Age of Efficiency: How
Deep Data Meets Big Savings to Deliver Comprehensive Efficiency,” The Electricity Journal, April.
GTM, 2015, Evolution of the Grid Edge: Pathways to Transformation.
Guizhou Ren, Guoqing Ma and Ning Cong, 2015,”Review of electrical energy storage system for vehicular
applications,” Renewable and Sustainable Energy Reviews, 41.
Hamilton, James D., 2009, “Causes and Consequences of the Oil Shock of 2007-2008,” Brookings Papers on
Economic Activity, Spring.
Hao, He ,et al., 2015, “Potentials and economics of residential thermal loads providing regulation reserve,”
Energy Policy, 79.
Hao, He and Wei Chen, 2014, Characterizing Flexibility of an Aggregation of Deferrable Loads, 53rd IEEE
Conference on Decision and Control, December 15-17.
Harrington, Winston, 2006, Grading Estimates of the Benefits and Costs of Federal Regulation: A Review of
Reviews, Resources for the Future, September.
Harrington, Winston, Richard Morganstern and Peter Nelson, 2010, How Accurate are Regulatory Cost
Estimates (Resources for the Future).
117
Hasan, Nor Shahida, et al., 2013, “Review of storage schemes for wind energy systems,” Renewable and
Sustainable Energy Reviews, 21.
Heddleson, Fred A. 1978, Summary Data for US Commercial Nuclear Power Plants in the United States,
Nuclear Safety Information Center, April 1978.
Hernández-Moro, J. and J.M. Martínez-Duart, 2015, “Economic analysis of the contribution of photovoltaics to
the decarbonization of the power sector,” Renewable and Sustainable Energy Reviews, 41.
Heymans, Catherine, et al. 2014, “Economic analysis of second use electric vehicle batteries for residential
energy storage and load-levelling,” Energy Policy, 71.
Heymans, Catherine, et al. 2014, “Economic analysis of second use electric vehicle batteries for residential
energy storage and load-levelling,” Energy Policy, 71.
Hildmann, Marcus Andreas Ulbig and Goran Andersson, 2014, Revisiting the Merit-Order Effect of Renewable
Energy Sources, February 11.
Hoffert, M.I., 2010, “Farewell to fossil fuels?,” Science, 29.
Hoffman, Ian M. et al., 2015, The Total Cost of Saving Electricity through Utility Customer-Funded Energy
Efficiency Programs: Estimates at the National, State, Sector and Program Level, LBL April.
Hohmeyer, Olive, 1988, Social Costs of Energy Consumption: External Effects of Electricity Generation in the
Federal Republic of Germany, Springer-Verlag, Berlin.
Holtinent, Hannele, 2009, et al, Design and Operation or Power Systems with Large amounts of Wind Power,
Final Report, IEA Wind Task 25, 2009.
Holttinen H., 2005, “Impact of hourly wind power variations on the system operation in the Nordic countries,”
Wind Energy, 8
Homes, Ingrid and Rohan Mohanty, 2012, The Macroeconomic Benefits of Energy Efficiency, E3G.
Hoppmann, Joern, et al., 2014, The economic viability of battery storage for residential solar photovoltaic
systems – A review and a simulation model, Renewable and Sustainable Energy Reviews, 39,
Howland, Jamie, Derek Murrow, Lisa Petraglie and Tyler Comings, 2009, Energy Efficiency: Engine of
Economic Growth, ENE, October.
Hwang, Roland and Matt Peak, 2006, Innovation and Regulation in the Automobiles Sector: Lessons Learned
and Implicit on for California CO2 Standards, April.
Illinois Commerce Commission, Illinois Power Agency, Illinois Environmental Protection Agency, Illinois
Department Commerce And Economic Opportunity, 2015, Response To The Illinois General Assembly
Concerning House Resolution 1146, January 5.
Imperial College, NERA, DNV-GL, 2014, Integration of Renewable Energy in Europe, June 12.
Intergovernmental Panel on Climate Change (IPCC), 2014, Summary for Policymakers, Fifth Assessment
Report: Working Group III.
Ippolito, M.G., et al., 2014, “Multi-objective optimized management of electrical energy storage systems in an
islanded network with renewable energy sources under different design scenarios,” Energy, 64
Islam, M.R., S. Mekhilef, and R. Saidur, 2013, “Progress and recent trends of wind energy technology,”
Renewable and Sustainable Energy Reviews, 21.
Jacobson Mark Z. and Mark A. Delucchi, 2011, “Providing all global energy with wind, water and solar power,
Part I: technologies, energy resources, quantities and areas of infrastructure, and materials,” Energy Policy,
39.
Jacobson, Mark Z., et al., 2013,“Examining the feasibility of converting New York State’s all-purpose energy
infrastructure to on using wind, water and sunlight,” Energy Policy.
Jacobson, Mark Z. et al., 2015, “100% clean and renewable wind, water, and sunlight (WWS) all-sector energy
118
roadmaps for the 50 United States,” Energy & Environmental Science, Table 5,Table 3.
Jaffe, Sam, 2014, The Lithium Ion Battery Market Supply and Demand, ARPA E RANGE Conference, January
28.
Jamasb, Tooraj, and Jonathan Kohler, 2007, Learning Curves for Energy Technology: A Critical Assessment,
University of Cambridge, October.
Jamel, M.S., A. AbdRahman and A.H. Shamsuddin, 2013, “Advances in the integration of solar thermal energy
with conventional and non-conventional power plants,” Renewable and Sustainable Energy Reviews, 20.
Jansen, J.C., L.W. M. Beurskens, and X, van Tilburg, 2006, Application of Portfolio analysis to the Dutch
Generating Mix, ECN, February, 2006
Johansson, Bengt, 2013, “Security aspects of future renewable energy systems: A short overview,” Energy, 61.
Johnson, Erik Paul, 2014, “The cost of carbon dioxide abatement from state renewable portfolio standards,”
Resource and Energy Economics, 36.
Junginger, Martin, et al., 2008, Technological Learning in the Energy Sector, Universities Utrach and Energy
Research Centre of the Netherlands, April.
Kahouli Brahmi, Sondes, 2008, “Technological Learning in Energy-Environment-Economy Modeling: A
Survey,” Energy Policy, 36.
Kalkuhl, Matthias, Ottmar Edenhofer and Kai Lessmann, 2012, “Learning or Lock-in: Optimal Technology
Policies to Support Mitigation, Resource and Energy Economics, 34.
Karakosta, Charikleia, et al., 2013, “Renewable energy and nuclear power towards sustainable development:
Characteristics and prospects,” Renewable and Sustainable Energy Reviews, 22.
Katarzyna, Sobotka, 2009, A wind-power fuel cell hybrid system study Model of energy conversion for wind
energy system with hydrogen storage, The School for Renewable Energy Science, Akureyri, Iceland.
Kempton W, et al., 2010, “Electric power from offshore wind via synoptic-scale interconnection,” Proceedings
of the National Academy of Sciences, 107(16).
Khalilpour, Rajab and Anthony Vassallo, 2015, “Leaving the grid: An ambition or a real choice?,” Energy
Policy 82.
Kind, Peter, 2013, Disruptive Challenges: Financial Implications and Strategic Responses to a Changing Retail
Electric Business, Edison Electric Institute, January.
Kiso, Takashiko, 2009, Environmental Policy and Induced Innovation: Evidence from Automobile Fuel
Economy Regulation.
Kitson, Lucy, Wooders, and Tom Moerenhout, 2011, Subsides and External Costs in Electric Power
Generation: A Comparative Review of Estimates,” GSI, IISD, September 2011.
Kitson, Lucy, Wooders, and Tom Moerenhout, 2011, Subsides and External Costs in Electric Power
Generation: A Comparative Review of Estimates,” GSI, IISD, September 2011.
Kok, Nils, Marquise McGraw and John M. Quigley, 2011, “The Diffusion of Energy Efficiency in Buildings,”
Annual Meeting of the American Economic Association, Denver.
Komiyama, Ryoichi, Takashi Otsuki, Yasumasa Fujii, 2015, “Energy modeling and analysis for optimal grid
integration of large-scale variable renewables using hydrogen storage in Japan,” Energy, 81.
Komiyamaa, Ryoichi and Yasumasa Fujiib, 2014, “Assessment of massive integration of photovoltaic system
considering rechargeable battery in Japan with high time-resolution optimal power generation mix model,”
Energy Policy, March, 66.
Koohi-Kamali, Sam, et al., 2013, “Emergence of energy storage technologies as the solution for reliable
operation of smart power systems: A review,” Renewable and Sustainable Energy Reviews, 25.
119
Koomey, Jonathan, 2011.Was the Three Mile Island accident in 1979 the main cause of US nuclear power’s
woes?, June.
Krozer, Yoram, 2013, “Cost and benefit of renewable energy in the European Union,” Renewable Energy, 50.
Kucseraa, Dénes and Margarethe Rammerstorfer, 2014, “Regulation and grid expansion investment with
increased penetration of renewable generation,” Resource and Energy Economics, 37.
Lazar, Jim and Ken Colburn, 2013, Recognizing the Full Value of Energy Efficiency (What’s Under the Feel-
Good Frosting of the World’s Most Valuable Layer Cake of Benefits), September.
Lazar, Jim, 2014, Teaching the “Duck” to Fly, Regulatory Analysis Project, January 2014.
Lazard, 2013, Levelized Cost of Energy Analysis – Version 7.0, June.
Lazard, 2014, Levelized Cost of Energy Analysis – Version 8.0, June.
Llera, E., et al., 2013, “Forecasting job creation from renewable energy deployment through a value-chain
approach,” Renewable and Sustainable Energy Review, 21
Locatelli, Giorgio, Emanuele Palerma and Mauro Mancini, 2015, “Assessing the economics of large Energy
Storage Plants with an optimisation methodology,” Energy, 83.
Lochbaum, David, 2006, Walking a Nuclear Tightrope: Unlearned Lessons of Year-Plus Reactor Outages,
September.
Loisel, Rodica, Guzay Pasaoglu and Christian Thiel, 2014, “Large-scale deployment of electric vehicles in
Germany by 2030: An analysis of grid-to-vehicle and vehicle-to-grid concepts,” Energy Policy, 65.
Lopez, Anthony, et al., 2012, U.S. Renewable Energy Technical Potential: A GIS-Based analysis, NREL, July.
Lovins, Amory, 2014, An initial critique of Dr. Charles R. Frank, Jr.’s working paper “The Net Benefits of Low
and No-Carbon Electricity Technologies,” summarized in the Economist as “Free exchange: Sun, Wind
and Drain, Rocky Mountain Institute, August 7, 2014.
Lovins, Amory, et al., 2011, Reinventing Fire: Bold Business solutions for the New Energy Era, Rocky
Mountain Institute, Boulder, Colorado.
Lu, Xi, 2013, “Optimal integration of offshore wind power for a steadier, environmentally friendlier, supply of
electricity in China,” Energy Policy, 62
Lyons, Chet, 2014, Guide to Procurement of Flexible Peaking Capacity: Energy Storage Or Combustion
Turbines?, Energy Strategies Group.
MacGill, Iain, 2013, The impact of wind on electricity prices in the Australian National Electricity Market,
Centre for Energy and Environmental Markets, June.
Mahoney, Amy and Eleanor Denny, 2011, The Merit Order Effect of Wind Generation in The Irish Electricity
Market, Department of Economics, Trinity College, Dublin.
Maia, Trieu, et al., 2014, “Envisioning a renewable electricity future for the United States,” Energy, 65.
Malik, Naureen S. and Jim Poulson, 2015, “New York Reactors Survival Tests Pricey Nuclear,” Bloomberg,
January 5.
Maloney, Stephen, 2008, Financial Issues Confronting Nuclear Construction, Carnegie Endowment for
International Peace, November 13.
Maloney, Stephen, 2009, Nuclear Power Economics and Risk, Council on Foreign Relations, July 10, 2009.
Mariana Aguirre, GbengaI Bikunle, 2014, “Determinants of renewable energy growth: A global sample
analysis,” Energy Policy, 69.
Martínez Ceseña, Eduardo A. Nicholas Good and Pier Luigi Mancarella, 2015, “Electrical network capacity
support from demand side response: Techno-economic assessment of potential business cases for small
commercial and residential end-users,” Energy Policy, 82.
120
Massetti, Emanuele and Lea Nicita, 2010, The Optimal Climate Policy Portfolio, CESifo Working Paper Energy
and Climate Economics, 2988.
Maxim, Alexandru, 2014, “Sustainability assessment of electricity generation technologies using weighted
multi-criteria decision analysis,” Energy Policy, 65.
McConnell, Dylan, et al., 2013, “Retrospective modeling of the merit-order effect on wholesale electricity prices
from distributed photovoltaic generation in the Australian National Electricity Market,” Energy Policy, 58.
McKinsey and Company, 2009, Unlocking Energy Efficiency in the U.S. Economy, July.
McKinsey and Company, 2010, Energy Efficiency: A Compelling Global Resource.
McMahon, 2015a, Did Tesla Just Kill Nuclear Power?, Forbes Blog, May 1.
McMahon, 2015b, “Why Tesla Batteries Are Cheap Enough To Prevent New Power Plants,” Forbes Blog, May
5
Melbourne Energy Institute, 2013, The impact of distributed solar generation on the wholesale electricity
market, June.
Milligan, M.., et al., 2014, Impact of Electric Industry Structure on High Wind Penetration Potential, NREL,
July 2009.
Milligan, Michael, et. Al., 2009, “Wind Power Myths Debunked,” IEEE power & energy systems,
November/December, 2009.
Mills A, and R. Wiser, 2010, Implications of wide-area geographic diversity for short-term variability of solar
power. Tech. Rep. Lawrence Berkeley National Laboratory.
Mills Andrew and Ryan Wiser, 2013, Changes in the Economic Value of Variable Generation at High
Penetration Level: A Pilot Case Study of California.
Mills, Andrew, and Ryan Wiser, 2014, Strategies for Mitigating the Reduction in Economic Value of Variable
Generation with Increasing Penetration Levels, 2014.
Mishra, Gouri Shankar, et al., 2014, “Mitigating climate change: Decomposing the relative roles of energy
conservation, technological change, and structural shift,” Energy Economics, 44.
MISO, 2014, 2013 Annual Market Assessment Report Information Delivery and Market Analysis, June.
Molina, Maggie, 2014, The Best Value for America’s Energy Dollar: A National Review of the Cost of Utility
Energy Efficiency Programs, ACEEE, March.
Molyneaux, Lynette, et al., 2012, Australian Power: Can renewable technologies change the dominant industry
view?, Australian Solar Energy Society Conference, Melbourne December.
Moody’s Special Comment, 2009, New Nuclear Generation: Ratings Pressure Increasing, June.
Moody’s, 2008, Nuclear Generating Capacity: Potential Credit Implications for U.S. Investor Owned Utilities.
Moody’s, 2012, Low Gas Prices and Weak Demand are Masking US Nuclear Plant Reliability Issues, Special
Comment, November 8.
Moomaw, W. P., et al., 2011 Annex H, Methodology: IPCC; Special Report on Renewable Energy Source and
Climate Change Mitigation.
Mountain, Bruce, 2012, Market Power and Generation from Renewables: The Case of Wind in the South
Australian Electricity Market Australian Economic Report: No. 2, Centre for Strategic Economic Studies
Victoria University, Melbourne, June.
Munksgaard, J. and Morthorst, P.E., 2008, “Wind power in the Danish liberalized power market—policy
measures, price impact and investor incentives,” Energy Policy, 36.
Murphy, Lorraine, 2014, “The influence of the Energy Performance Certificate: The Dutch case,” Energy Policy,
April, 67.
121
Nadel, Steve, 2014, Conquering the Evening Peak, ACEEE.
Nadel, Steve, Anna Shipley and R. Neal Elliot, 2004, Technical, Economic and Achievable Potential for Energy-
Efficiency in the U.S. – A Meta-Analysis of Recent Studies (American Council for an Energy-Efficient
Economy.
Nadel, Steven and Andrew Delaski, 2013, Appliance Standards: Comparing Predicted and Observed Prices,
American Council for an Energy Efficient Economy and Appliance Standards Awareness Project, July.
National Academy of Sciences, Panel on Policy Implications of Greenhouse Warming, Policy Implications of
Greenhouse Warming: Mitigation, Adaptation, and the Science Base 1995.
National Renewable Energy Laboratory, N.D. Wind-to-Hydrogen Project, Hydrogen and Fuel Cells Research.
National Research Council of the National Academies, 2009, America’s Energy Future: Technology and
Transformation, Summary Edition (Washington, D.C.).
Naus, Joeri, et al., 2014, “Smart grids, information flows and emerging domestic energy practices,” Energy
Policy, 68.
Navid, Nivad, 2012, Reserve Requirement Identification with the Presence of Variable Generation, UVIG
Spring Technical Meeting, April 26.
Navigant, 2014, Carbon Dioxide Reductions from Demand Response: Impacts in Three Markets, November 25.
Nayyar, Ashutosh, 2013, Aggregate Flexibility of a Collection of Loads, 52nd IEEE Conference on Decision and
Control, December 10-13.
NERC, Potential Reliability Impacts of EPA’s Proposed Clean Power Plan: Initial Reliability Review,
New York State Energy Research & Development Authority, 2011, Macro-economic Impact Analysis of New
York’s Energy Efficiency Programs: Using REMI Software, August 4.
Nicolli, Francesco and Francesco Vona, 2012, The Evolution of Renewable Energy Policy in OECD Countries:
Aggregate Indicators and Determinants, ofce.sciences-po, Working Paper, 2012-13.
November 2014.
NRC Staff Answer to San Luis Obispo Mothers for Peace’s Motion to File New Contentions Regarding the
Adequacy of the Updated Environmental Report for Diablo Canyon, 2015, In the Matter of Pacific Gas
And Electric Company, Diablo Canyon Nuclear Power Plant, Units 1 and 2, Docket Nos. 50-275-LR/ 50-
323-LR, May 1.
Nuclear Energy Institute, Operating Costs, http://www.nei.org/Knowledge-Center/Nuclear-Statistics/Costs-
Fuel,-Operation,-Waste-Disposal-Life-Cycle/US-Electricity-Production-Costs-and-Components).
Nuclear Energy Institute, Operating Costs, http://www.nei.org/Knowledge-Center/Nuclear-Statistics/Costs-
Fuel,-Operation,-Waste-Disposal-Life-Cycle/US-Electricity-Production-Costs-and-Components).
Nuclear Information and Resource Service, Killing the Competition: The Nuclear Industry Agenda to Block
Climate Action, Stop Renewable Energy, and Subsidize Old Reactors, September, 2014
Nuclear Regulatory Commission, 1996, License Renewal GEIS.
Nuclear Regulatory Commission, 2013, License Renewal GEIS.
O’Connell, Niamh, et al., 2014, “Benefits and challenges of electrical demand response: A critical review,”
Renewable and Sustainable Energy Reviews, 39.
Oggioni, G., F.H. Murphy and Y. Smeers, 2014, “Evaluating the impacts of priority dispatch in the European
electricity market,” Energy Economics, 42.
Ottinger, Richard, et al., 1990, Environmental Costs of Electricity, Pace University Center for Environmental
Legal Studies, Oceana, New York.
Pacific Gas & Electric, 2015, Diablo Canyon Environmental Report.
122
Pacific Gas and Electric, 2014, Diablo Canyon Amended Environmental Report.
Park, Chan-Kook et al., 2014, “A study off actors enhancing smart grid consumer engagement,” Energy Policy,
72.
Parker, Michael W., et al., 2014, Bernstein Energy and Power Blast: If solar wins, Who Loses?, Bernstein
Research, April 2.
Parsons, George R., 2014, “Willingness to pay for vehicle-to-grid (V2G) electric vehicles and their contract
terms,” Energy Economics, 42.
Pearce, David W., 1984, The Dictionary of Modern Economics, MIT Press.
Pearre, Nathaniel S. and Lukas G. Swan, 2015, “Technoeconomic feasibility of grid storage: Mapping electrical
services and energy storage technologies,” Applied Energy, 137.
Pearson, Peter J.G. and Timothy J. Foxon, 2012, “A low-carbon industrial revolution? Insights and challenges
from past technological and economic transformations,” Energy Policy, 50.
Pechan, Anna and Klaus Eisenack, 2014,“The impact of heat waves on electricity spot markets,” Energy
Economics, 43.
Pepermans, Guido, 2014, “Valuing smart meters,” Energy Economics, 45.
Perez, Carlota, 2002, Technology Revolutions and Financial Capital: The dynamics of Bubbles and Golden
Ages.
Petkovi, Dalibor, 2014, “Adaptive neuro-fuzzy maximal power extraction of wind turbine with continuously
variable transmission,” Energy, 64
Pfenninger, Stefan, et al., 2014, “Potential for concentrating solar power to provide baseload and dispatchable
power,” Nature Climate Change, Volume: 4.
Pfund, Nancy and Ben Healey, 2011, What Would Jefferson Do? The Historical Role of Federal Subsidies in
Shaping America’s Energy Future, Double Bottom Line Investors, September.
Phuangpornpitak, N. and S. Tia, 2013, “Opportunities and Challenges of Integrating Renewable Energy in Smart
Grid System,” 10th Eco-Energy and Materials Science and Engineering Symposium, Energy Procedia, 34
Platts, January 9, 2013, “Some Merchant Nuclear Reactors Could Face Early Retirement: UBS.”
Pleßmann, Guido, et al., 2014, “Global energy storage demand for a 100% renewable electricity supply,” Energy
Procedia, 8th International Renewable Energy Storage Conference and Exhibition, IRES 2013.
Poindexter, Owen, 2014, The Internet Of Things Will Thrive On Energy Efficiency, Government Technology,
July 29.
Pringles, Rolando, Fernando Olsina, and Francisco Garcés, 2014, “Designing regulatory frameworks for
merchant transmission investments by real options analysis,” Energy Policy, 67.
Qui, Yeuming and Laura D. Anadon, 2012, “The price of wind in china during its expansion: Technology
adoption, learning-by-doing, economies of scale, and manufacturing localization,” Energy Economics, 34.
Rabl, Ari and Veronika A. Rabl, 2013, “External costs of nuclear: Greater or less than the alternatives?” Energy
Policy, 57.
Rangel, Lina Escobar and François Lévêque, 2012, “Revisiting the Nuclear Power Construction Costs Escalation
Curse,” Interdisciplinary Institute for Innovation, Working Paper, 12-ME-08.
Rasmussen, Morten Grud, et al., N.D. Optimal Combination of Storage and Balancing in a 100% Renewable
European Power System, http://pure.au.dk//portal/files/40755839/
Rasmussen, Morten Grud, Gorm Bruun Andresen, and Martin Greiner, 2012, Storage and balancing synergies in
a fully or highly renewable pan-European power system, Conference proceedings MGR, August 31.
Rauch, Jason, 2014, “Price and Risk Reduction Opportunities in the New England Electricity Generation
Portfolio,” Electricity Journal, 27.
123
Ravindranath, Mohana, 2014, “At GSA, an ‘Internet of Things’ experiment,” Washington Post, August 31.
Reber, Timothy Jet al., 2014, “The transformative potential of geothermal heating in the U.S. energy market: A
regional study of New York and Pennsylvania,” Energy Policy, 70.
Reichelstein, Stefan and Michael Yorston, 2013, “The prospects for cost competitive solar PV power,” Energy
Policy, 55.
Renewables International, 2012, Little power storage or coal power needed for 40% green power supply, August,
10.
Rodriguez, Rolando A., et al., 2014, “Transmission needs across a fully renewable, European power system,”
Renewable Energy, 63.
Rowe, John, 2010, Fixing the Carbon Problem Without Breaking the Economy, Resources for the Future Policy
Leadership Forum Lunch, May 12.
Rowe, John, 2011, Energy Policy: Above All, Do No Harm, American Enterprise Institute, March 8.
Ryan, Lisa and Nina Campbell, 2012, Spreading the Net: The Multiple Benefits of Energy Efficiency
Improvements, International Energy Agency, Insight Series.
Sahu, Bikash Kumar, Moonmoon Hiloidhari, and D.C. Baruah, 2013, “Global trend in wind power with special
focus on the top five wind power producing countries,” Renewable and Sustainable Energy Reviews, 19
Sahu, Bikash Kumar, Moonmoon Hiloidhari, and D.C. Baruah, 2013, “Global trend in wind power with special
focus on the top five wind power producing countries,” Renewable and Sustainable Energy Reviews, 19
Santiago, Katarina, et al., 2014, “A strong argument for using non-commodities to generate electricity,” Energy
Economics, May, 43.
Santiago, Katarina, et al., 2014, “A strong argument for using non-commodities to generate electricity,” Energy
Economics, May, 43.
Sanzillo, Tom and Cathy Kunkel, 2014, First Energy: A Major Utility Seeks a Subsidized Turnaround, Institute
for Energy Economics and Financial Analysis, October.
Sarah Becker, et al., 2015, “Renewable build-up pathways for the US: Generation costs are not system costs,”
Energy, 81.
Sarah Becker, et al., 2015, Renewable build-up pathways for the US: Generation costs are not system costs,”
Energy 8.
Schaber, Katrin, Florian Steinke, and Thomas Hamacher, 2013, Managing Temporary Oversupply from
Renewables Efficiently: Electricity Storage Versus Energy Sector Coupling in Germany, International
Energy Workshop, Paris, July.
Schleich, Joachim, Bradford Mills, and Elisabeth Dütschke, 2014, “A brighter future? Quantifying the rebound
effect in energy efficient lighting,” Energy Policy, 72.
Schumpeter, Joseph , 1961, The Theory of Economic Development,
Seel, Joachim, Galen Barbose, and Ryan Wiser, 2013, Why Are Residential PV Prices in Germany So Much
Lower Than in the United States?, U.S. Department of Energy, SunSpot, February.
Sener, Can and Vasilis Fthenakis, 2014, “Energy policy and financing options to achieve solar energy grid
penetration targets: Accounting for external costs,” Renewable and Sustainable Energy Reviews, 32.
Sensfuss, F., M. Ragwitz, and M. Genoese, 2008, “The merit-order effect: a detailed analysis of the price effect
of renewable electricity generation on spot market prices in Germany,” Energy Policy, 36 (8).
Shah, Vishal and Jerimiah Booream-Phelps, 2015, Crossing the Chasm Solar Grid Parity in a Low Oil Price
Era, Deutsche Bank, February 27.
Shrimali, Gireesh, Melissa Lynes and, Joe Indvik, 2015, “Wind energy deployment in the U.S.: An empirical
analysis of the role of federal and state policies,” Renewable and Sustainable Energy Reviews, 43.
124
Shuman, Michael and Ralph Cavanagh, 1982, A Model of Conservation and Electric Power Plan for the Pacific
Northwest: Appendix 2: Environmental Costs, Seattle, WA: Northwest Conservation Act coalition,
November.
Sinden G., 2007, “Characteristics of the UK wind resource: long-term patterns and relationship to electricity
demand,” Energy Policy, 2007, 3
Slavin, Matthew, 2009, “The federal energy subsidy scorecard: how renewables stack up,” Renewable Energy
World.com http://www.renewableenergyworld.com/rea/news/article/2009/11/the-federal-energy-subsidy-
scorecard-how-renewables-stack-up
Smith, Alexander M. and Marilyn A. Brown, 2015, “Demand response: A carbon-neutral resource?,” Energy,
85.
Sobotka, Katarzyna, 2009, A wind-power fuel cell hybrid system study Model of energy conversion for wind
energy system with hydrogen storage, The School for Renewable Energy Science, Akureyri, Iceland.
Sorrell, Steve, Alexandra Mallett & Sheridan Nye. 2011, Barriers to Industrial Energy Efficiency, A Literature
Review, United Nations Industrial Development Organization, Vienna.
Sovacool, Benjamin K. Alex Gilbert and Daniel Nugent, 2014b, “Risk, innovation, electricity infrastructure and
construction cost overruns: Testing six Hypotheses,” Energy, 74.
Sovacool, Benjamin K. Alex Gilbert and Daniel Nugent, 2014c, “An International Comparative Assessment of
Construction Cost Overruns for Electricity Infrastructure,” Energy Research and Social Science, 3.
Sovacool, Benjamin K., Alex Gilbert and Daniel Nugent, 2014a, “Construction cost Overruns and electricity
infrastructure: an unavoidable risk?,” Electricity Journal, May.
Sperling, Dan et al., 2004, Analysis of Auto Industry and Consumer Responses to Regulation and Technological
Change and Customization of Consumer Response Models in Support of AB 1493 Rulemaking, Institute of
Transportation Studies, UC Davis, June 1.
Standard & Poor’s, 2008, For New U.S. Nuclear Power Plants, Liquidity Requirement Could be Substantial,
October 21.
Standard & Poor’s, 2009, Utilities Make Some Progress on New Nuclear Power, But Hurdles Still Linger, March
9.
Stein, Eric W., 2013, “A comprehensive multi-criteria model to rank electric energy production technologies,”
Renewable and Sustainable Energy Reviews, 22.
Steinke, Florian, Philipp Wolfrum, and Clemens Hoffmann, 2013, “Grid vs. storage in a 100% renewable
Europe,” Renewable Energy, 50.
Stephenson, W. David, 2014, “Internet Of Things Could Offset Government Inaction On Climate,”
Greenbiz.com, November 17, 2014
Stirling, Andrew, 2010, Multicriteria Diversity Analysis; A Novel Heuristic Framework for Appraising energy
Portfolios, Energy Policy, 38
Sueyoshia, Toshiyuki and Mika Gotob, 2014, “Photovoltaic power stations in Germany and the United States: A
comparative study by data envelopment analysis,” Energy Economics, March, 42.
Sundqvist, Thomas, 2004, “What Causes the Disparity of electricity Sources?,” Energy Policy, 32.
Takahashi, Kenji and David, Nichols, 2008, The Sustainability and Cost of Increasing Efficiency Impacts:
Evidence from Experience to Date, American Council For An Energy Efficient Economy, Summer Study
on energy Efficient Buildings.
Tascikaraoglu, A., and M. Uzunoglu, 2014, “A review of combined approaches for prediction of short-term wind
speed and power,” Renewable and Sustainable Energy Reviews, 34
Tierney, Susan, Eric Svenson and Brian Parsons, 2015, Ensuring Electric Grid Reliability Under the Clean
Power Plan: Addressing Key Themes From The FERC Technical Conferences, April 2015.
125
Twomey, P. and K. Neuhoff, K., 2010, “Wind power and market power in competitive markets,” Energy Policy,
38(7).
U. S. Department of Energy, 2013, SunSpot, Utility Scale Solar.
U. S. Department of Energy, 2013, Wind Technologies Market Report.
U.S Congressional Office of Technology Assessment, 1994, Studies of the Environmental Costs of Electricity,
Washington, D.C., September.
U.S. Department of Energy, 2012, SunShot Vision Study, February
U.S. Department of Energy, 2015, Wind Vision: A New Era for Wind Power in the United States.
U.S. Energy Information Administration, 2010, Nuclear Generating Units, 1955-2009;
U.S. Energy Information Administration, 2010, Nuclear Power Plant Operations, 1957-2009;
U.S. Energy Information Administration, 2011, Direct Federal Financial Interventions and Subsidies in Energy
in Fiscal Year 2010, July 2011.
U.S. Energy Information Administration, 2015, Nonhydro electricity storage increasing as new policies are
implemented, Energy Today, April, 3.
U.S. Environmental Protection Agency and Department of Transportation, 2011, In the Matter of Notice of
Upcoming Joint Rulemaking to Establish 2017 and Later Model Year Light Duty Vehicle GHG Emissions
and CAFE Standards, Docket ID No. EPA-HQ-OAR-0799 Docket ID No. NHTSA-2010-0131.
U.S. Environmental Protection Agency, 2013, Regulatory Impact Analysis for the Proposed Standards of
Performance for Greenhouse Gas Emissions for New Stationary Sources: Electric Utility Generating Units,
Washington, D.C., September.
U.S. Environmental Protection Agency, 2014a, 40 CFR Part 60, Carbon Pollution Emission Guidelines for
Existing Stationary Sources: Electric Utility Generating Units; Regulatory Impact Assessment, June 18.
U.S. Environmental Protection Agency, 2014b, 40 CFR Part 60, Carbon Pollution Emission Guidelines for
Existing Stationary Sources: Electric Utility Generating Units; Proposed Rule, Federal Register / Vol. 79,
No. 117, June 18.
U.S. GAO, 2007, Federal Electricity Subsidies: Information on Research Funding, Tax Expenditures, and Other
Activities That Support Electricity Production, GAO-08-102, October.
UBS Investment Research, 2013a, In Search of Washington’s Latest Realities (DC Field Trip Takeaways),
February 20.
UBS Investment Research, 2013b, Entergy Corp., Re-assessing Cash Flows from the Nukes, January 2.
UBS Investment Research, 2013c, Entergy Corp. Challenging Outlook for New Team at Kickoff, February 4.
UBS, 2014, Global Utilities, Autos & Chemicals Will solar, batteries and electric cars re-shape the electricity
system?, August 20.
Ueckerdt, Falko, Robert Brecha and Gunnar Luderer, 2015, “Analyzing major challenges of wind and solar
variability in power Systems,” Renewable Energy, 8.
Veena, P., et al., 2014, “Review of grid integration schemes for renewable power generation system,” Renewable
and Sustainable Energy Reviews, 34.
Vine, Doug and Timothy Juliant, 2014, Climate Solutions: The Role of Nuclear Power, Center for Climate and
Energy Solutions.
Vithayasrichareon, Peerapat, Jenny Riesz and Iain F. MacGill, 2015, “Using renewables to hedge against future
electricity industry uncertainties—An Australian case study,” Energy Policy, 76.
Vorrath, Sophie, Energy storage to reach cost ‘holy grail’, mass adoption in 5 years, Renew Economy, 3 March
2015.
126
Walwyn, David Richard and Alan Colin Brent, 2015, “Renewable energy gathers steam in South Africa,”
Renewable and Sustainable Energy Reviews, 41.
Walz, R., 2007, “The Role of Regulation for Sustainable Infrastructure Innovation: the Case of Wind Energy,”
International Journal of Public Policy.
Walz, R., J. Schleich, and M. Ragwitz, 2011, Regulation, Innovation and Wind Power Technologies – An
Empirical Analysis for OECD Countries, DIME Final Conference, Maastricht, April.
Warr, Benjamin S, Robert U. Ayers and Eric Williams, 2009, Increase Supplies, Increase Efficiency: Evidence
of Causality Between the Quantity and Quality of Energy Consumption and Economic Growth, INSEAD.
Weiss, Jurgen, et al., 2015, EPA’s Clean Power Plan and Reliability: Assessing NERC’s Initial Reliability
Review, Brattle Group, February.
Whitefoot, Kate, Meredith Fowler and Steven Skerlos, 2012, Product Design Response to Industrial Policy:
Evaluating Fuel Economy Standards Using an Engineering Model of Endogenous Product Design, Energy
Institute at Haas, May.
Widen J, 2011, “Correlations between large-scale solar and wind power in a future scenario for Sweden,” IEEE
Trans Sustain Energy, 2(2):
Wie, Max Shana Patadia and Daniel Kammen, 2010, “Putting Renewables and Energy Efficiency to work: How
Many Jobs Can the Clean energy Industry Generate in the US?,” Energy Policy, 38.
Wiemken E, Beyer H, Heydenreich W, Kiefer K, 2010, Power characteristics of PV ensembles: experiences
from the combined power production of 100 grid connected PV systems distributed over the area of
Germany. Sol Energy 2001; 70 (6).
Wirl, Franz, 2014, “Taxes versus permits as incentive for the intertemporal supply of a clean technology by a
monopoly,” Resource and Energy Economics, 36.
Wiser, Ryan and Mark Bolinger, 2013, 2012 Wind Technologies Market Report, U.S. Department of Energy.
Wu, Jing, et al., 2015, “Integrating solar PV (photovoltaics) in utility system operations: Analytical framework
and Arizona case study,” Energy, 85.
Yang, Yun, Shijie Zhang and Yunhan Xiao, 2015, Optimal design of distributed energy resource systems
coupled with energy distribution networks,” Energy, 85.
Zarnikau, Jay, Steve Isser and Amy Martin, 2015, Energy Efficiency Programs in a Restructured Market: The
Texas Framework, The Electricity Journal, March.
Zelenika-Zovk, I. and J. M. Pearce, 2011, Diverting indirect subsidies from the nuclear industry to the
photovoltaic industry: Energy and financial returns,” Energy Policy, 39.
Zhao, Haoran, 2015, Review of energy storage system for wind power integration support,”
Zhao, Haoran, et. 2015, Review of energy storage system for wind power integration support, Applied Energy,
137.
Zheng, Chengn and Daniel M. Kammen, 2014, “An innovation-focused roadmap for a sustainable global
photovoltaic industry,” Energy Policy, 67.
Zinaman, Owen, et al., 2015, “Power Systems of the Future,” The Electricity Journal, March, 28.