Embed Size (px)
Citation preview
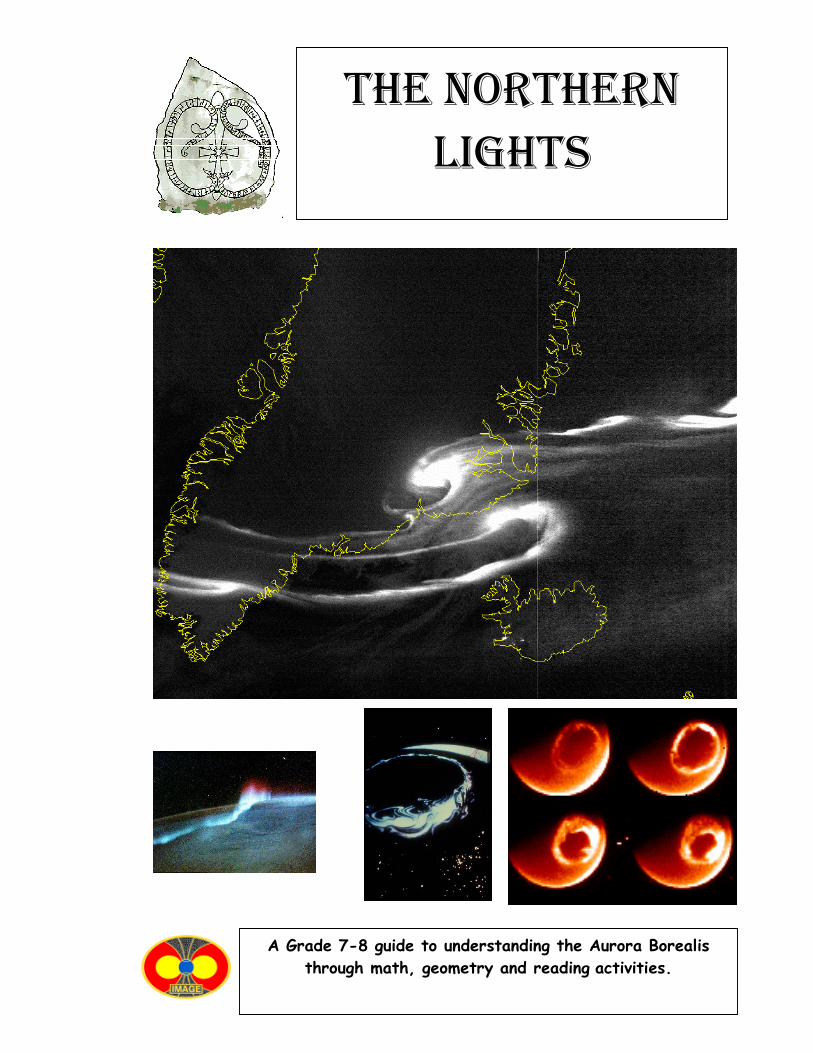
IMAGE Exploring the Northern Lights 1
THE NORTHERNLIGHTS
A Grade 7-8 guide to understanding the Aurora Borealisthrough math, geometry and reading activities.
IMAGE Exploring the Northern Lights 2
This series of activities will help students understand how theNorthern Lights work, what causes them, and how to observe them.
Through a series of math and reading activities, students will learn:How aurora are described by scientists and by other students(Reading)The geographic locations of aurora based on satellite data(Geography)How aurora appear in the sky at different geographiclatitudes (Geometry)The height of aurora above the ground (Geometry - parallax)How to predict when they will appear (Mathematics)What Norse Mythology had to say about aurora (symboliccode translation)
This booklet was created by the NASA,IMAGE satellite program's Education andPublic Outreach Project.
Writers:Dr. Sten Odenwald (NASA/IMAGE)Ms. Susan Higley (Cherry Hill School)Mr. Bill Pine (Chaffey High School)
Students:Emily Clermont (Holy Redeemer School)Denali Foldager (Seward Elementary School)Sonta Hamilton (Mt. Edgecumbe High School)
The cover shows a view from the NPOESS satellite looking down at an aurora over Greenland.(http://npoesslib.ipo.noaa.gov/S_sess.htm). Viking rune inscription(http://www.commersen.se/vikingar/vardag/runor.html). The three smaller images at the bottom of thepage are: (Left) an aurora borealis viewed from the Space Shuttle; (middle) portion of the auroraloval over North America viewed by the DMSP satellite showing city lights; (right) the auroral ovalviewed over the Arctic region on July 15, 2000 by the IMAGE satellite.
For more classroom activities aboutaurora and space weather, visit theIMAGE website at:
http://image.gsfc.nasa.gov/poetry
IMAGE Exploring the Northern Lights 3
C o n t e n t s
Activity 1 Aurora: The Human Dimension 4Students read essays by a scientist andtwo Alaskan students and answer questions.
Activity 2 Where to See an Aurora. 8Students plot satellite data on polar map to seegeographic location of auroral belt (auroral oval)
Activity 3 Aurora Viewing from the Ground 10Students use geometry to find observing latitudesfor aurora given their height above ground.
Activity 4 Estimating Heights with a Clinometer 13Students use a simple instrument to measure
the height of an object in the classroom and outdoors.
Activity 5 How High Up are Aurora? 22Students learn about the triangulation methodfor finding the altitude of aurora above ground.
Activity 6 Aurora Triangulation from Photographs. 29Students analyze two photographs to measurethe parallax and altitude of an aurora.
Activity 7 Auroral Magnetism from the Ground. 37Students analyze graphs to determine the rangeof magnetic changes at Canadian observatories.
Activity 8 How to Predict an Aurora. 41Students learn about the Kp index and relateit to predicting aurora.
Activity 9 Auroral Activity and Latitude 45Students extract data from a graph andcalculate a best-fit curve using a calculator.
Activity 10 Decoding an Ancient Mystery. 54Students decode a simulated viking runeinscription using a decoder table, and answera question about what causes aurora.
Useful Web Resources 56
IMAGE Exploring the Northern Lights 4
Activity 1 Aurora: The Human Dimension
Introduction:
Aurora are the beautiful curtains of colored light that arecommonly seen in the Arctic and Antarctic regions of Earth, andwhich have a long history of sightings by humans for over 3000years. We now know that aurora are caused by high-speedelectrons that collide with oxygen and nitrogen atoms in theupper atmosphere. One popular misunderstanding is that thesestreams of particles come directly from the Sun and flow downinto the polar regions along Earth's magnetic field. In this activity,we will read about the scientific explanation for Aurora and alsoread student essays that describe how aurora make you feelwhen you see them from the ground!
Objectives:Students will read essays to
be informed about auroral activityand describe the information given.
Materials:EssaysStudent Page
Procedure:1) Discuss the student's priorknowledge about aurora.
2) Allow sufficient time for thestudents to read the threeessays.
3) Students will answerquestions 1 through 5.Encourage the students torefer to the article as needed.
4) Discuss the studentresponses.
Conclusion:Students will learn about
the aurora phenomenon andhow scientists have studied itover the last few centuries. Theywill learn how older ideas havebeen replaced by newerexplanations.
IMAGE Exploring the Northern Lights 5
The most spectacular example of the way that the Sun and Earth areinvisibly connected is the phenomenon of the Aurora Borealis (Northern Lights)and the Aurora Australis (Southern Lights). For millennia, people have watchedthem and worried about what ill omens they represented: war, death or thewrath of God. It wasn't until the mid-1800s that scientists finally began todiscover many of their mysteries. Like lightning and earthquakes, they werenatural events, not supernatural ones. Thanks to intensive study by researchsatellites during the Space Age, aurora have been substantially de-mystified,even as their ethereal beauty has remained to dazzle us and inspire awe.
Scientists learned that aurora often accompanied magnetic 'storms' andan unsettled magnetosphere; they were produced by flows of charged particlesentering the atmosphere; they came and went with the sunspot cycle; and theircolors were the product of excited oxygen and nitrogen atoms hundreds ofmiles above the surface of the Earth.
By the turn of the 20th century, scientists actually created artificialaurora in their laboratories. Once television and the fluorescent lamp wereinvented, it was pretty clear just how aurora worked. What scientists stilldidn't understand was what was triggering them. Some thought it was fromdirect currents of particles from the Sun itself. This is still the explanationyou will find in your textbooks today! Other scientists felt it was morecomplicated than that. Here is what the standard explanation looks like today:
When a major solar storm buffets Earth's magnetic field, it causessome parts of this field to rearrange itself, like rubber bands pulled to theirbreaking point. This releases energy that causes powerful currents of particlesto flow from distant parts of the magnetic field, into the atmosphere. Theseparticles did not originate from the Sun, but were already trapped in themagnetic field like flies in a bottle. Once they reach a charged layer of theatmosphere called the ionosphere, they pick up still more energy like a rollercoaster shooting down the other side of a tall hill. The currents of fast-movingcharged particles continue to flow along the magnetic field into the polarregions and collide with nitrogen and oxygen atoms in the atmosphere. Thesecollisions produce deep red glows as high up as 1,000 kilometers above theground, and beautiful curtains of green and blue light at altitudes as low as 90kilometers. They never reach the ground, though they can sometimes seem asthough they do!
(Dr. Sten Odenwald. IMAGE Satellite Program)
Nature's Spectacular Light Show
IMAGE Exploring the Northern Lights 6
Alaskan Student Essays about Aurora
Heavenly Lights ..... Denali Foldager (Seward Elementary School)
Beautiful, heavenly lights in the sky, different colors for different dancers way up high.Waves like a colorful mid ocean, swimming around in the sky like a dance that never ends.Shimmering and shiny colors across the world, like a colorful raindrop surrounded by a blackpuddle. Heavenly lights that are peaceful like a flower, but big and colorful as the sun and lots ofrainbows. Its colors glowing into the night like it's the diamond and the stars are the gems. Alaskais as beautiful as the northern lights. You could almost touch them because they seem so close toyou when you look up at the sky. It makes me feel happy and proud to live in Alaska. The great,wonderful northern lights will always be there when you need them or when you don't. The colorswill brighten up your day some way or another. Even though when you can't see them, you canalways feel them around you. A swirl of colors all in one. It's either the colors on a cold night orjust when you're seeing them for the first time. But just knowing that you have seen the blue, red,or even green the colors are great. Skies, I think, would never be the same without the colorful,calm dance of the heavenly lights. It would just be black with no rainbow to brighten your day anddancers would have no color to their dances. The colors are magnificent and nothing will changethat. Color after color day after day a new color is made into the swirl to make it better. All of theauroras are magnificent and heavenly. It doesn't matter what you call it, heavenly lights, gates toheaven, rainbow in the sky, all of them are the same. Auroras will always be there colors and all.
The Compelling Dance of Light .... Sonta Hamilton (Mt. Edgecumbe High School)
What can a person find by looking deep into the Alaskan Aurora Borealis? The Alaskannorthern lights are usually a pale hue of green and purple. No matter what the color is at thattime, people witnessing the event find something within themselves. Ancestral generations thathave resided in Alaska's great outdoors over many years have felt that warmth of life that thenorthern lights have breathed into them. When the night air is crisp and calm, the onlookers arestill comforted and feel enriched with a quiet hope. The beams and flashes of vibrant color in thecreamy dark sky spreads like a blanket over the land and its inhabitants. There are manymoments of quiet stillness and wonder that spreads throughout the vast snow-powdered land.Changes occur in a swift motion, and a person is strangely hypnotized by the northern light'seffective grasp on the earth's skies. Its wispy enchanting hands grab a strong hold and guide aperson on a journey that tells a comforting story. There is no need to drink hot coca on this night,for the spectacle warms you inside and out. Take off those worn-out gloves and dance with thesky, just as the soft gentle bounce of a person mask dancing can be kept in sync with theswaying colors as it glides through the night's sky. The momentum and beat speaks the northernlights story. A story told by the northern lights is one that a person's ancestors have heard andwitnessed on many blustery nights. The story is whispered in and out of different souls, each witha different meaning. All of the colors and resonant light ignites a spark in the many soul seekersof this event. These are the moments in the wilderness of Alaska that a person can feel fortifiedwith everlasting hope towards a secure future. Events such as these don't last one single night; aperson remembers the northern lights throughout their life.
To read more essays by Alaskan students, visit the IMAGE 'Alaskan Schools' web page at:http://image.gsfc.nasa.gov/poetry/alaska/alaska.html
IMAGE Exploring the Northern Lights 7
Student Name _______________________________________ Date _____________
Read the accompanying essays about aurora and answer the following questionsbased on what you have learned in each essay:
1) Why do aurora make some people feel strong emotions?
2) What kinds of colors and shapes are seen in an aurora? Be sure to citespecific examples from each essay.
3) Compare the essay by Denali Foldager and Sonta Hamilton. Do you thinkage makes a difference in the way some people express themselves?
4) According to Dr. Odenwald, what kind of explanation has been given forwhy aurora occur?
5) Is there a natural phenomenon you have witnessed that made you feel likethe Alaskan students did? Describe the circumstances.
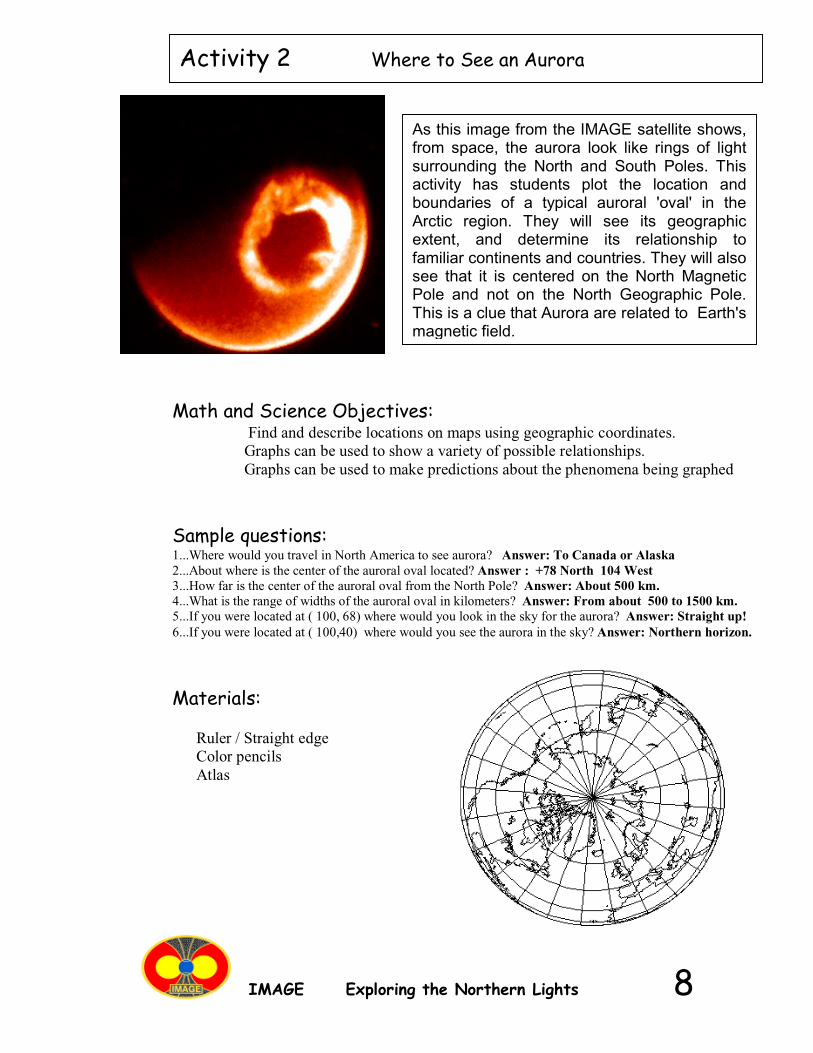
IMAGE Exploring the Northern Lights 8
Activity 2 Where to See an Aurora
As this image from the IMAGE satellite shows,from space, the aurora look like rings of lightsurrounding the North and South Poles. Thisactivity has students plot the location andboundaries of a typical auroral 'oval' in theArctic region. They will see its geographicextent, and determine its relationship tofamiliar continents and countries. They will alsosee that it is centered on the North MagneticPole and not on the North Geographic Pole.This is a clue that Aurora are related to Earth'smagnetic field.
Math and Science Objectives:Find and describe locations on maps using geographic coordinates.Graphs can be used to show a variety of possible relationships.Graphs can be used to make predictions about the phenomena being graphed
Sample questions:1...Where would you travel in North America to see aurora? Answer: To Canada or Alaska2...About where is the center of the auroral oval located? Answer : +78 North 104 West3...How far is the center of the auroral oval from the North Pole? Answer: About 500 km.4...What is the range of widths of the auroral oval in kilometers? Answer: From about 500 to 1500 km.5...If you were located at ( 100, 68) where would you look in the sky for the aurora? Answer: Straight up!6...If you were located at ( 100,40) where would you see the aurora in the sky? Answer: Northern horizon.
Materials:
Ruler / Straight edgeColor pencilsAtlas
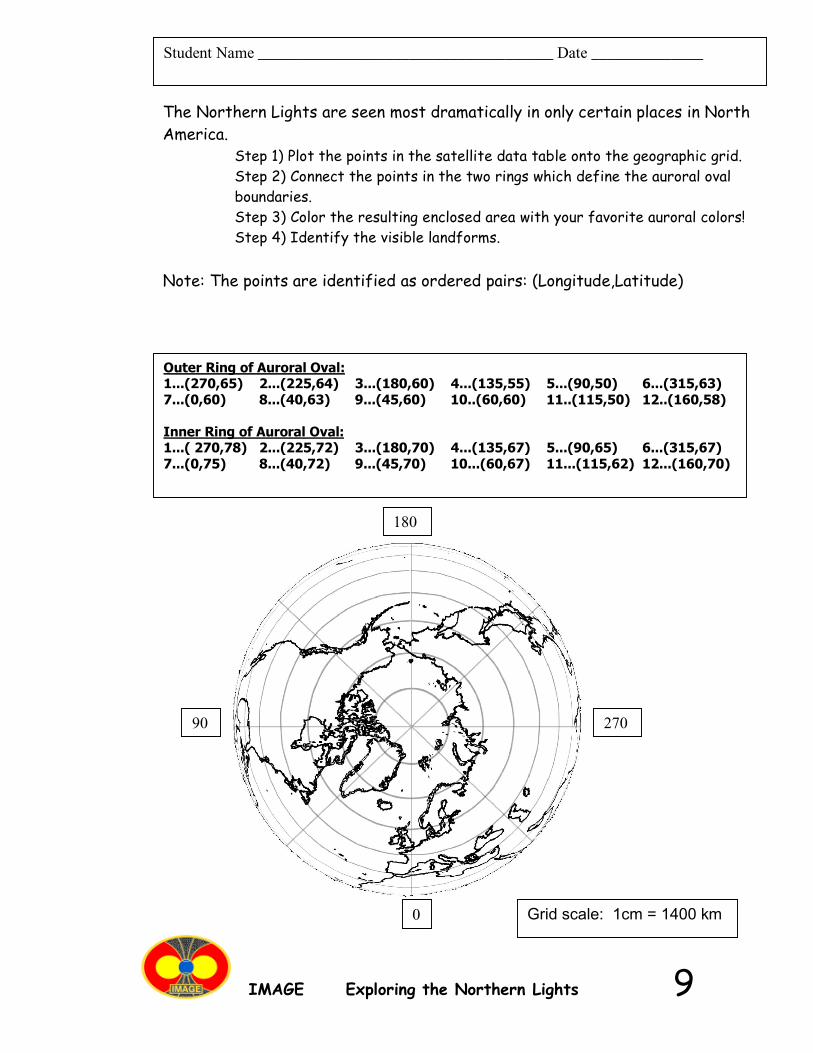
IMAGE Exploring the Northern Lights 9
Student Name _____________________________________ Date ______________
The Northern Lights are seen most dramatically in only certain places in NorthAmerica.
Step 1) Plot the points in the satellite data table onto the geographic grid.Step 2) Connect the points in the two rings which define the auroral ovalboundaries.Step 3) Color the resulting enclosed area with your favorite auroral colors!Step 4) Identify the visible landforms.
Note: The points are identified as ordered pairs: (Longitude,Latitude)
Outer Ring of Auroral Oval:1...(270,65) 2...(225,64) 3...(180,60) 4...(135,55) 5...(90,50) 6...(315,63)7...(0,60) 8...(40,63) 9...(45,60) 10..(60,60) 11..(115,50) 12..(160,58)
Inner Ring of Auroral Oval:1...( 270,78) 2...(225,72) 3...(180,70) 4...(135,67) 5...(90,65) 6...(315,67)7...(0,75) 8...(40,72) 9...(45,70) 10...(60,67) 11...(115,62) 12...(160,70)
Grid scale: 1cm = 1400 km0
90
180
270
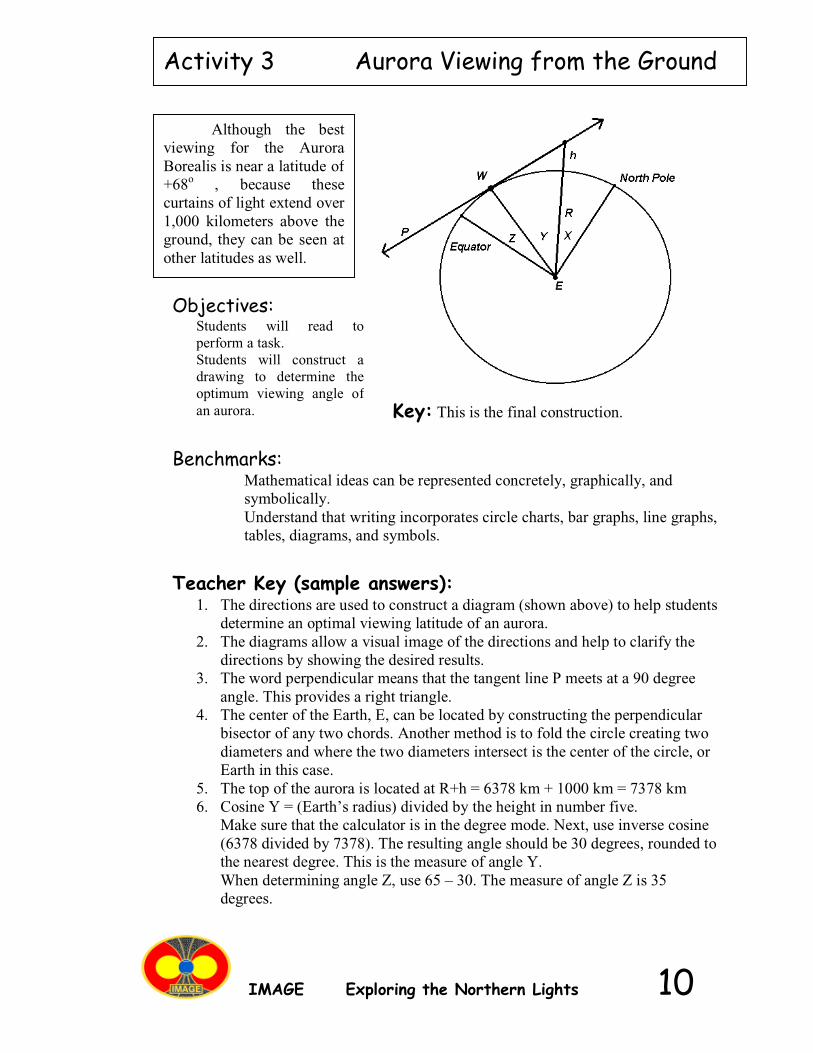
IMAGE Exploring the Northern Lights 10
Teacher Key (sample answers):1. The directions are used to construct a diagram (shown above) to help students
determine an optimal viewing latitude of an aurora.2. The diagrams allow a visual image of the directions and help to clarify the
directions by showing the desired results.3. The word perpendicular means that the tangent line P meets at a 90 degree
angle. This provides a right triangle.4. The center of the Earth, E, can be located by constructing the perpendicular
bisector of any two chords. Another method is to fold the circle creating twodiameters and where the two diameters intersect is the center of the circle, orEarth in this case.
5. The top of the aurora is located at R+h = 6378 km + 1000 km = 7378 km6. Cosine Y = (Earth’s radius) divided by the height in number five.
Make sure that the calculator is in the degree mode. Next, use inverse cosine(6378 divided by 7378). The resulting angle should be 30 degrees, rounded tothe nearest degree. This is the measure of angle Y.When determining angle Z, use 65 – 30. The measure of angle Z is 35degrees.
Activity 3 Aurora Viewing from the Ground
Benchmarks:Mathematical ideas can be represented concretely, graphically, andsymbolically.Understand that writing incorporates circle charts, bar graphs, line graphs,tables, diagrams, and symbols.
Although the bestviewing for the AuroraBorealis is near a latitude of+68o , because thesecurtains of light extend over1,000 kilometers above theground, they can be seen atother latitudes as well.
Key: This is the final construction.
Objectives:Students will read toperform a task.Students will construct adrawing to determine theoptimum viewing angle ofan aurora.
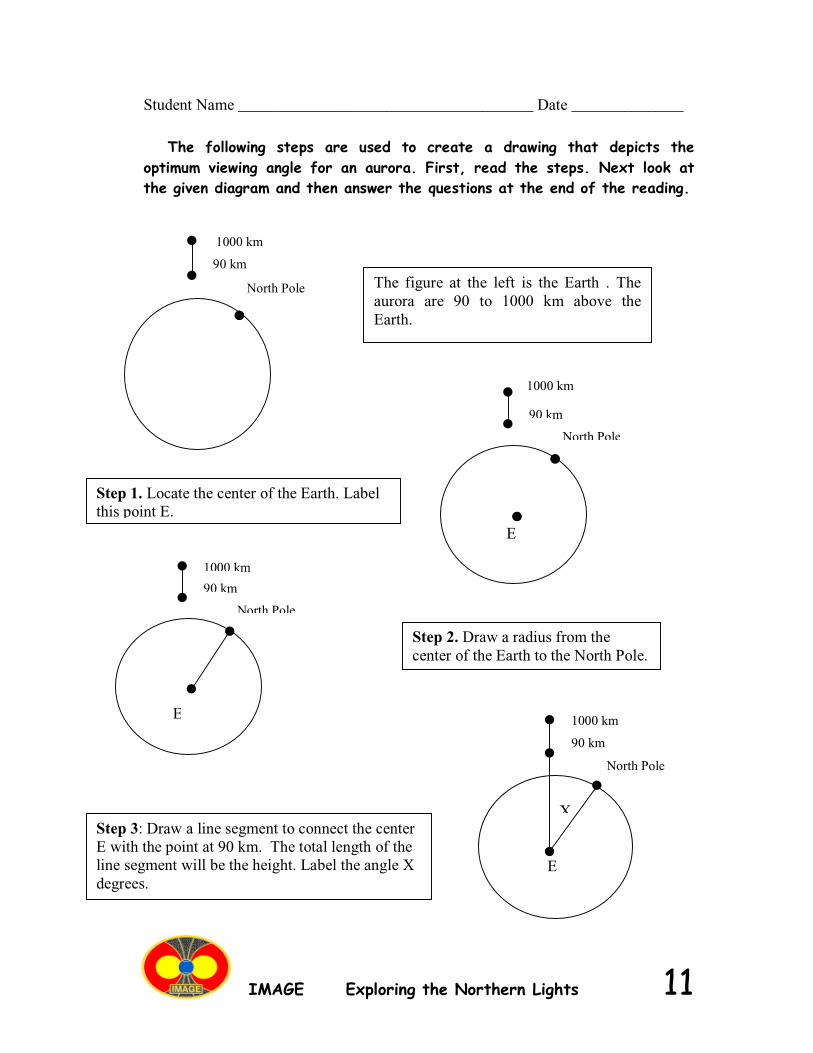
IMAGE Exploring the Northern Lights 11
Student Name _____________________________________ Date ______________
The following steps are used to create a drawing that depicts theoptimum viewing angle for an aurora. First, read the steps. Next look atthe given diagram and then answer the questions at the end of the reading.
Step 1. Locate the center of the Earth. Labelthis point E.
North Pole
90 km
E
North Pole
1000 km
90 km
Step 2. Draw a radius from thecenter of the Earth to the North Pole.
North Pole
1000 km
90 km
E
XStep 3: Draw a line segment to connect the centerE with the point at 90 km. The total length of theline segment will be the height. Label the angle Xdegrees.
E
1000 km
North Pole
90 km
The figure at the left is the Earth . Theaurora are 90 to 1000 km above theEarth.
1000 km
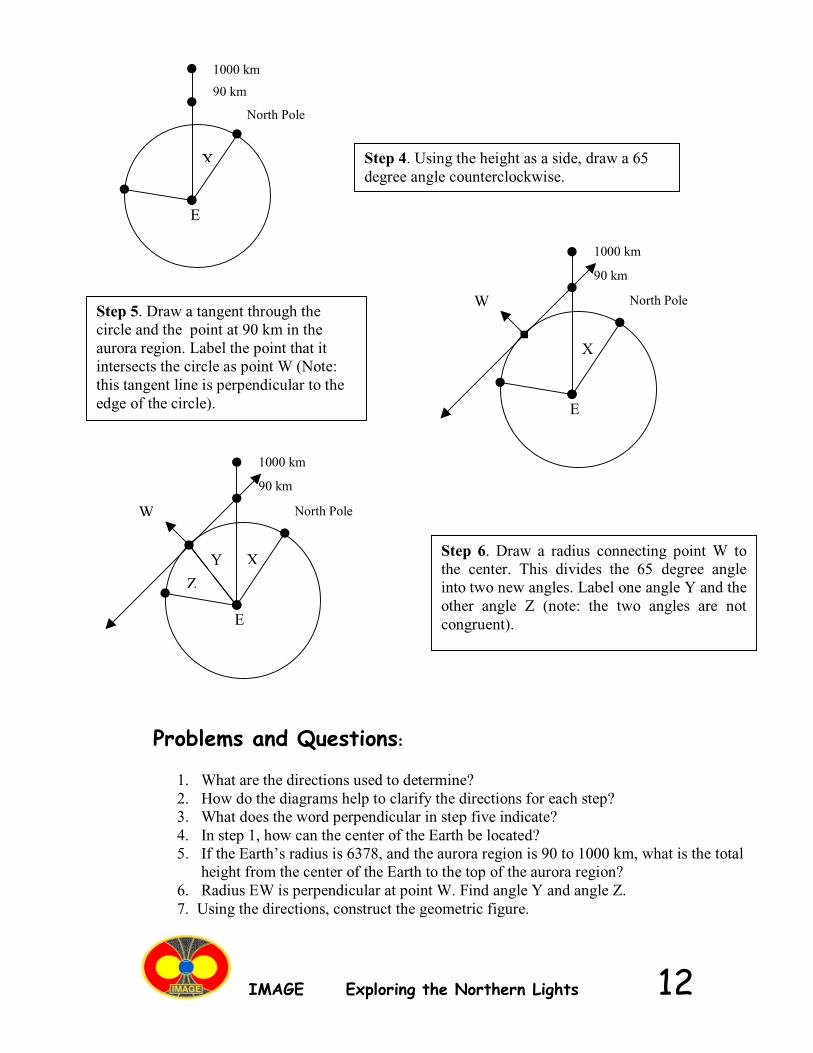
IMAGE Exploring the Northern Lights 12
Step 5. Draw a tangent through thecircle and the point at 90 km in theaurora region. Label the point that itintersects the circle as point W (Note:this tangent line is perpendicular to theedge of the circle).
North Pole
1000 km
90 km
E
X
W
Y
Z
Step 6. Draw a radius connecting point W tothe center. This divides the 65 degree angleinto two new angles. Label one angle Y and theother angle Z (note: the two angles are notcongruent).
Problems and Questions:
1. What are the directions used to determine?2. How do the diagrams help to clarify the directions for each step?3. What does the word perpendicular in step five indicate?4. In step 1, how can the center of the Earth be located?5. If the Earth’s radius is 6378, and the aurora region is 90 to 1000 km, what is the total
height from the center of the Earth to the top of the aurora region?6. Radius EW is perpendicular at point W. Find angle Y and angle Z.7. Using the directions, construct the geometric figure.
Step 4. Using the height as a side, draw a 65degree angle counterclockwise.
North Pole
1000 km
90 km
E
X
North Pole
1000 km
90 km
E
X
W
IMAGE Exploring the Northern Lights 13
Activity 4 Estimating Heights with a Clinometer
A clinometer is a simple-to-make instrument which lets you estimate the height ofan object (building, tree, flag pole) by using the properties of a right-triangle.
Objectives:Students will apply direct
measurement of angles and length todetermine height using the tangentratio and the clinometer (a measuringtool).
Materials for the lesson:Rulers or yardsticksAn object to hangA big X to hang under the objectClinometersCalculators – degree modeTangent table (optional if calculator isnot available)Graph paper or drawing paperStudent worksheetStudent Clinometer Activity SheetTeacher Demonstration Examples(Transparency)Teachers scaled drawingLadder for the teacherRoll of yarnScissorsStation marking items (paper taped tothe floor indicating use this point here)Ducked Tape
Benchmarks:6-8 Models are often used to think
about processes that happen too slowly, tooquickly or on too small a scale to observedirectly, or that are too vast to be changeddeliberately.
9-12 Find answers to problems bysubstituting numerical values in simplealgebraic formulas.
9-12 Make and interpret scaledrawings
Procedure:Step 1: Hang an object high from the center of the classroom. A big X can be tapedto the floor so that the object hanging from it is directly under it. Based on thenumber of students in the class, locate enough stations so that each group will makeat least two measurements from opposite sides of the room. Students will measurethe distance out from the point right under the object, or the teacher could havealready located the corresponding points. This is teacher discretion. In either case,vary the length of the distance for each station from where the student will stand tomeasure with the clinometer and the object. For instance, Station 1 is located fivefeet out from the point directly under the object while Station 3 is located 3.5 feetaway from the point beneath the hanging object.
See the following figure for an example of the station set up. Note: groups may sharea station since they could be on opposite sides of the room measuring.
Extension: Have students measure the height of a tree or flagpole using theclinometer.
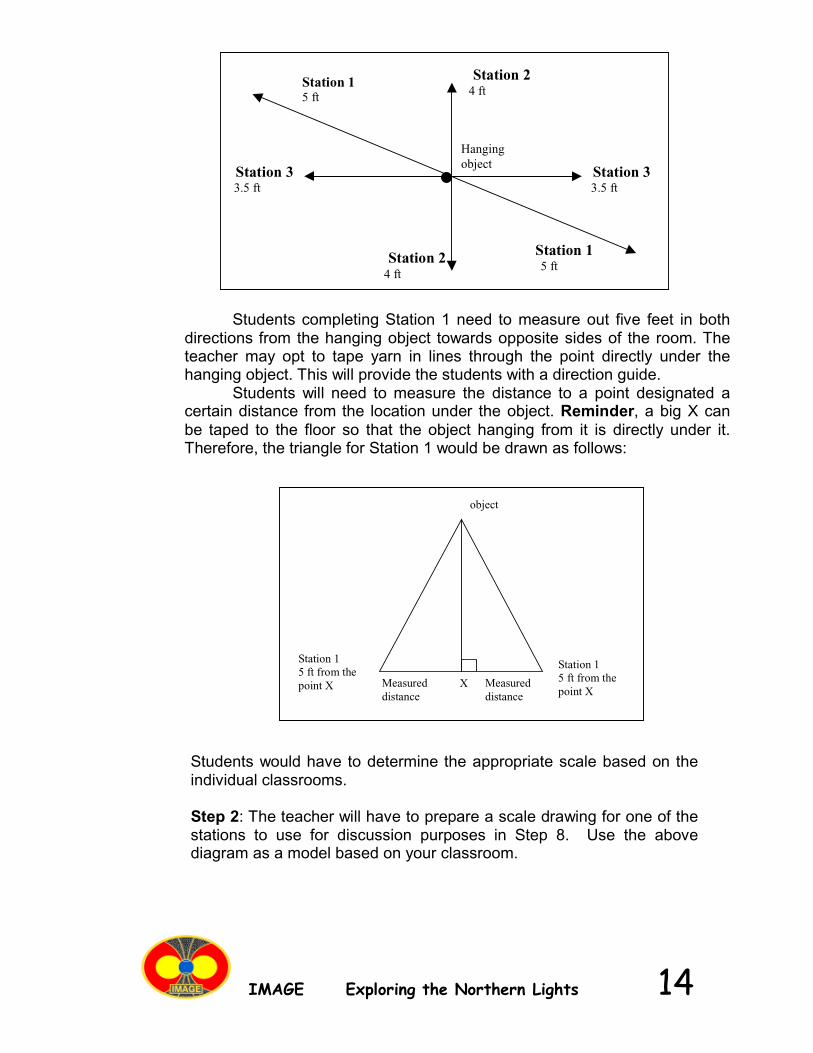
IMAGE Exploring the Northern Lights 14
Students completing Station 1 need to measure out five feet in bothdirections from the hanging object towards opposite sides of the room. Theteacher may opt to tape yarn in lines through the point directly under thehanging object. This will provide the students with a direction guide.
Students will need to measure the distance to a point designated acertain distance from the location under the object. Reminder, a big X canbe taped to the floor so that the object hanging from it is directly under it.Therefore, the triangle for Station 1 would be drawn as follows:
Hangingobject
Station 15 ft
Station 15 ft
Station 24 ft
Station 24 ft
Station 33.5 ft
Station 33.5 ft
object
X
Station 15 ft from thepoint X
Station 15 ft from thepoint X
Measureddistance
Measureddistance
Students would have to determine the appropriate scale based on theindividual classrooms.
Step 2: The teacher will have to prepare a scale drawing for one of thestations to use for discussion purposes in Step 8. Use the abovediagram as a model based on your classroom.
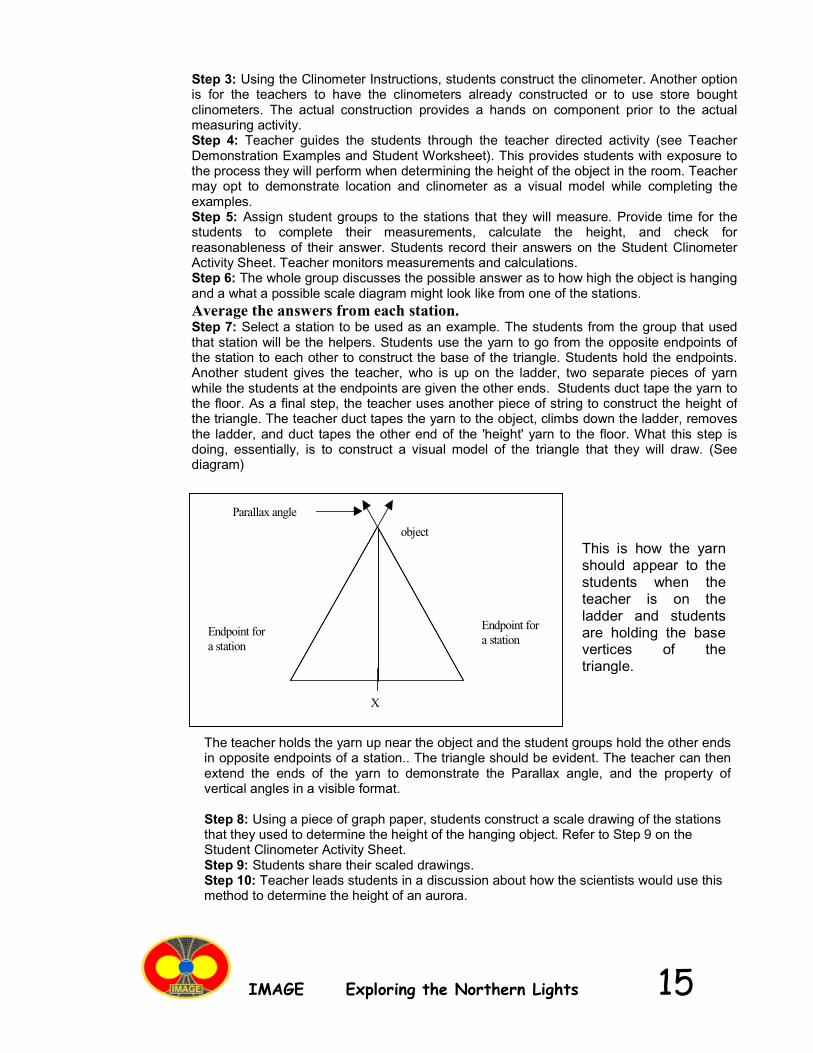
IMAGE Exploring the Northern Lights 15
Step 3: Using the Clinometer Instructions, students construct the clinometer. Another optionis for the teachers to have the clinometers already constructed or to use store boughtclinometers. The actual construction provides a hands on component prior to the actualmeasuring activity.Step 4: Teacher guides the students through the teacher directed activity (see TeacherDemonstration Examples and Student Worksheet). This provides students with exposure tothe process they will perform when determining the height of the object in the room. Teachermay opt to demonstrate location and clinometer as a visual model while completing theexamples.Step 5: Assign student groups to the stations that they will measure. Provide time for thestudents to complete their measurements, calculate the height, and check forreasonableness of their answer. Students record their answers on the Student ClinometerActivity Sheet. Teacher monitors measurements and calculations.Step 6: The whole group discusses the possible answer as to how high the object is hangingand a what a possible scale diagram might look like from one of the stations.Average the answers from each station.Step 7: Select a station to be used as an example. The students from the group that usedthat station will be the helpers. Students use the yarn to go from the opposite endpoints ofthe station to each other to construct the base of the triangle. Students hold the endpoints.Another student gives the teacher, who is up on the ladder, two separate pieces of yarnwhile the students at the endpoints are given the other ends. Students duct tape the yarn tothe floor. As a final step, the teacher uses another piece of string to construct the height ofthe triangle. The teacher duct tapes the yarn to the object, climbs down the ladder, removesthe ladder, and duct tapes the other end of the 'height' yarn to the floor. What this step isdoing, essentially, is to construct a visual model of the triangle that they will draw. (Seediagram)
Endpoint fora station
Endpoint fora station
object
X
Parallax angle
The teacher holds the yarn up near the object and the student groups hold the other endsin opposite endpoints of a station.. The triangle should be evident. The teacher can thenextend the ends of the yarn to demonstrate the Parallax angle, and the property ofvertical angles in a visible format.
Step 8: Using a piece of graph paper, students construct a scale drawing of the stationsthat they used to determine the height of the hanging object. Refer to Step 9 on theStudent Clinometer Activity Sheet.Step 9: Students share their scaled drawings.Step 10: Teacher leads students in a discussion about how the scientists would use thismethod to determine the height of an aurora.
This is how the yarnshould appear to thestudents when theteacher is on theladder and studentsare holding the basevertices of thetriangle.
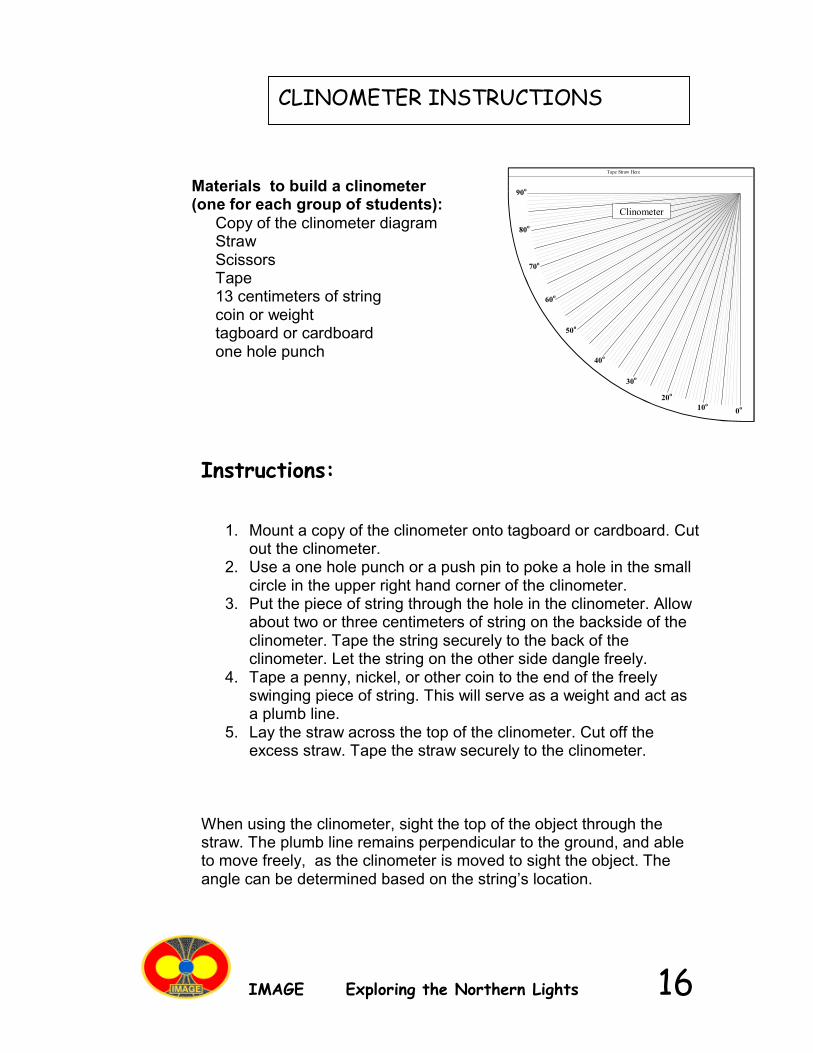
IMAGE Exploring the Northern Lights 16
Materials to build a clinometer(one for each group of students):
Copy of the clinometer diagramStrawScissorsTape13 centimeters of stringcoin or weighttagboard or cardboardone hole punch
Instructions:
1. Mount a copy of the clinometer onto tagboard or cardboard. Cutout the clinometer.
2. Use a one hole punch or a push pin to poke a hole in the smallcircle in the upper right hand corner of the clinometer.
3. Put the piece of string through the hole in the clinometer. Allowabout two or three centimeters of string on the backside of theclinometer. Tape the string securely to the back of theclinometer. Let the string on the other side dangle freely.
4. Tape a penny, nickel, or other coin to the end of the freelyswinging piece of string. This will serve as a weight and act asa plumb line.
5. Lay the straw across the top of the clinometer. Cut off theexcess straw. Tape the straw securely to the clinometer.
When using the clinometer, sight the top of the object through thestraw. The plumb line remains perpendicular to the ground, and ableto move freely, as the clinometer is moved to sight the object. Theangle can be determined based on the string’s location.
CLINOMETER INSTRUCTIONS
90o
80o
70o
60o
50o
40o
30o
20o
10o0o
Clinometer
Tape Straw Here
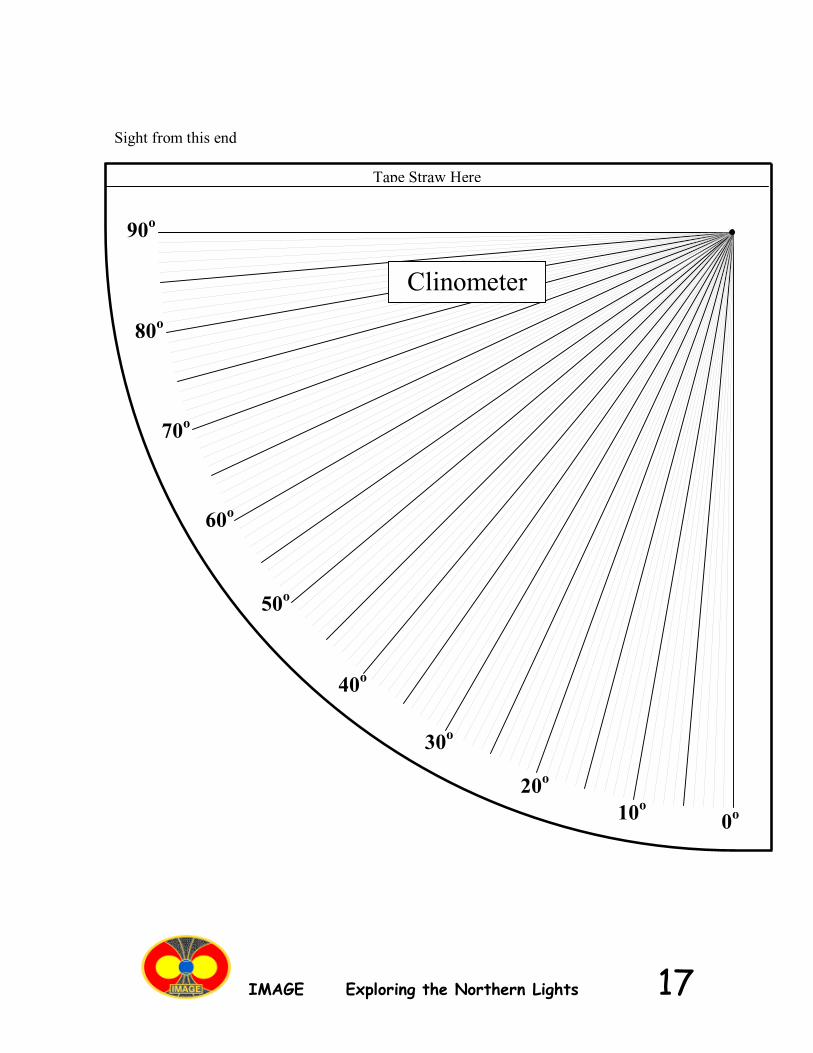
IMAGE Exploring the Northern Lights 17
90o
80o
70o
60o
50o
40o
30o
20o
10o0o
Clinometer
Tape Straw Here
Sight from this end
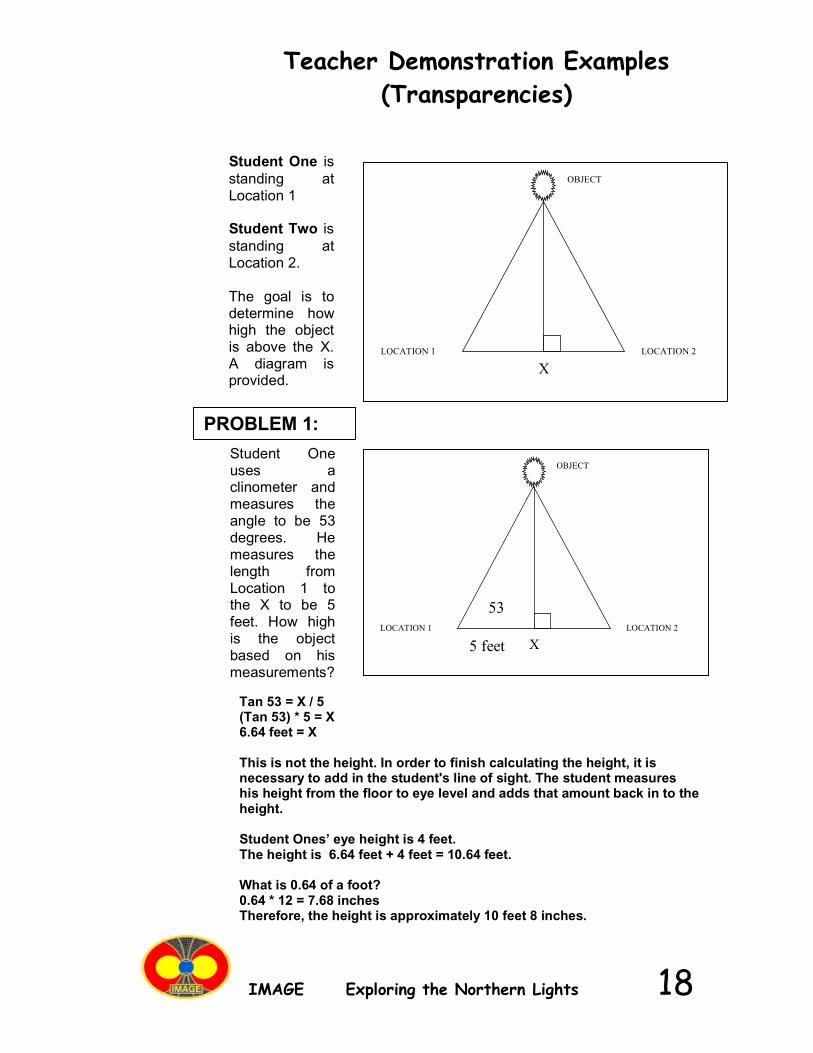
IMAGE Exploring the Northern Lights 18
Teacher Demonstration Examples(Transparencies)
XLOCATION 1 LOCATION 2
OBJECT
Student One isstanding atLocation 1
Student Two isstanding atLocation 2.
The goal is todetermine howhigh the objectis above the X.A diagram isprovided.
Student Oneuses aclinometer andmeasures theangle to be 53degrees. Hemeasures thelength fromLocation 1 tothe X to be 5feet. How highis the objectbased on hismeasurements?
XLOCATION 1 LOCATION 2
OBJECT
53
5 feet
Tan 53 = X / 5(Tan 53) * 5 = X6.64 feet = X
This is not the height. In order to finish calculating the height, it isnecessary to add in the student's line of sight. The student measureshis height from the floor to eye level and adds that amount back in to theheight.
Student Ones’ eye height is 4 feet.The height is 6.64 feet + 4 feet = 10.64 feet.
What is 0.64 of a foot?0.64 * 12 = 7.68 inchesTherefore, the height is approximately 10 feet 8 inches.
PROBLEM 1:
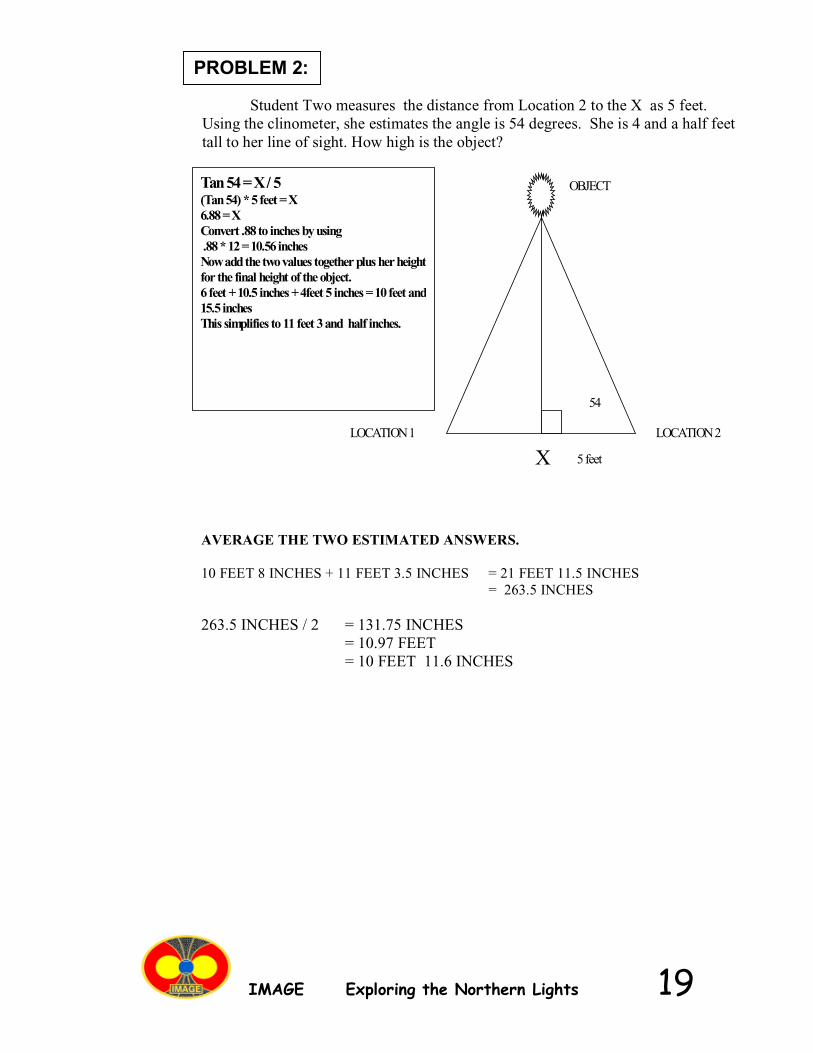
IMAGE Exploring the Northern Lights 19
Student Two measures the distance from Location 2 to the X as 5 feet.Using the clinometer, she estimates the angle is 54 degrees. She is 4 and a half feettall to her line of sight. How high is the object?
XLOCATION1 LOCATION2
OBJECT
54
5feet
Tan54=X/ 5(Tan54) *5feet =X6.88=XConvert .88to inches byusing.88*12=10.56 inchesNowaddthetwovalues together plus herheightfor the final height of the object.6 feet +10.5 inches +4feet 5 inches =10feet and15.5 inchesThis simplifies to 11 feet 3and half inches.
AVERAGE THE TWO ESTIMATED ANSWERS.
10 FEET 8 INCHES + 11 FEET 3.5 INCHES = 21 FEET 11.5 INCHES= 263.5 INCHES
263.5 INCHES / 2 = 131.75 INCHES= 10.97 FEET= 10 FEET 11.6 INCHES
PROBLEM 2:
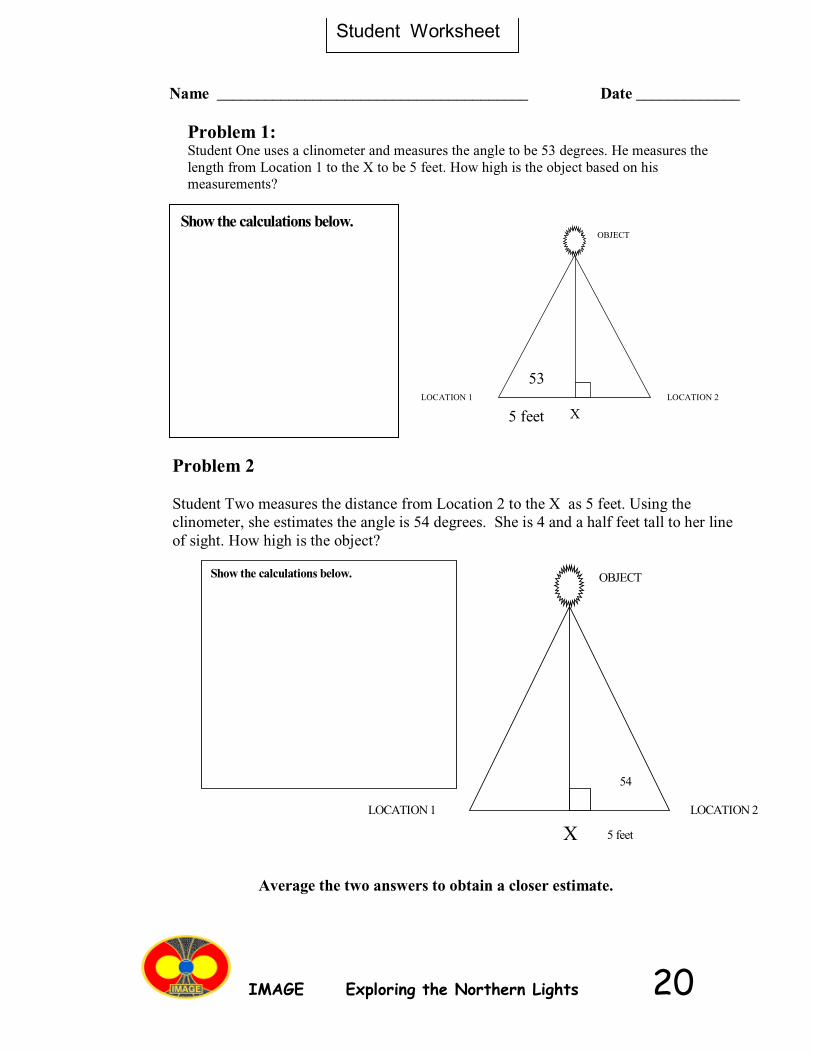
IMAGE Exploring the Northern Lights 20
Problem 1:Student One uses a clinometer and measures the angle to be 53 degrees. He measures thelength from Location 1 to the X to be 5 feet. How high is the object based on hismeasurements?
Show the calculations below.
XLOCATION 1 LOCATION 2
OBJECT
53
5 feet
Problem 2
Student Two measures the distance from Location 2 to the X as 5 feet. Using theclinometer, she estimates the angle is 54 degrees. She is 4 and a half feet tall to her lineof sight. How high is the object?
XLOCATION 1 LOCATION 2
OBJECT
54
5 feet
Show the calculations below.
Average the two answers to obtain a closer estimate.
Name _______________________________________ Date _____________
Student Worksheet
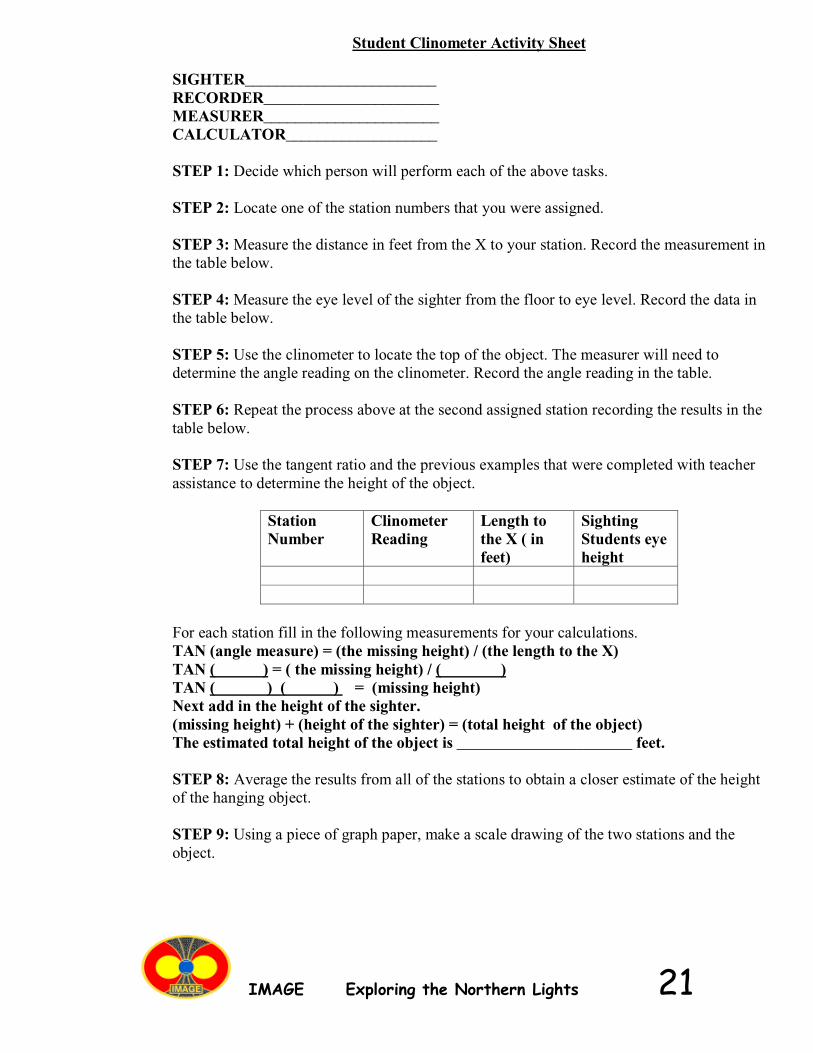
IMAGE Exploring the Northern Lights 21
Student Clinometer Activity Sheet
SIGHTER________________________RECORDER______________________MEASURER______________________CALCULATOR___________________
STEP 1: Decide which person will perform each of the above tasks.
STEP 2: Locate one of the station numbers that you were assigned.
STEP 3: Measure the distance in feet from the X to your station. Record the measurement inthe table below.
STEP 4: Measure the eye level of the sighter from the floor to eye level. Record the data inthe table below.
STEP 5: Use the clinometer to locate the top of the object. The measurer will need todetermine the angle reading on the clinometer. Record the angle reading in the table.
STEP 6: Repeat the process above at the second assigned station recording the results in thetable below.
STEP 7: Use the tangent ratio and the previous examples that were completed with teacherassistance to determine the height of the object.
StationNumber
ClinometerReading
Length tothe X ( infeet)
SightingStudents eyeheight
For each station fill in the following measurements for your calculations.TAN (angle measure) = (the missing height) / (the length to the X)TAN ( ) = ( the missing height) / ( )TAN ( ) ( ) = (missing height)Next add in the height of the sighter.(missing height) + (height of the sighter) = (total height of the object)The estimated total height of the object is ______________________ feet.
STEP 8: Average the results from all of the stations to obtain a closer estimate of the heightof the hanging object.
STEP 9: Using a piece of graph paper, make a scale drawing of the two stations and theobject.
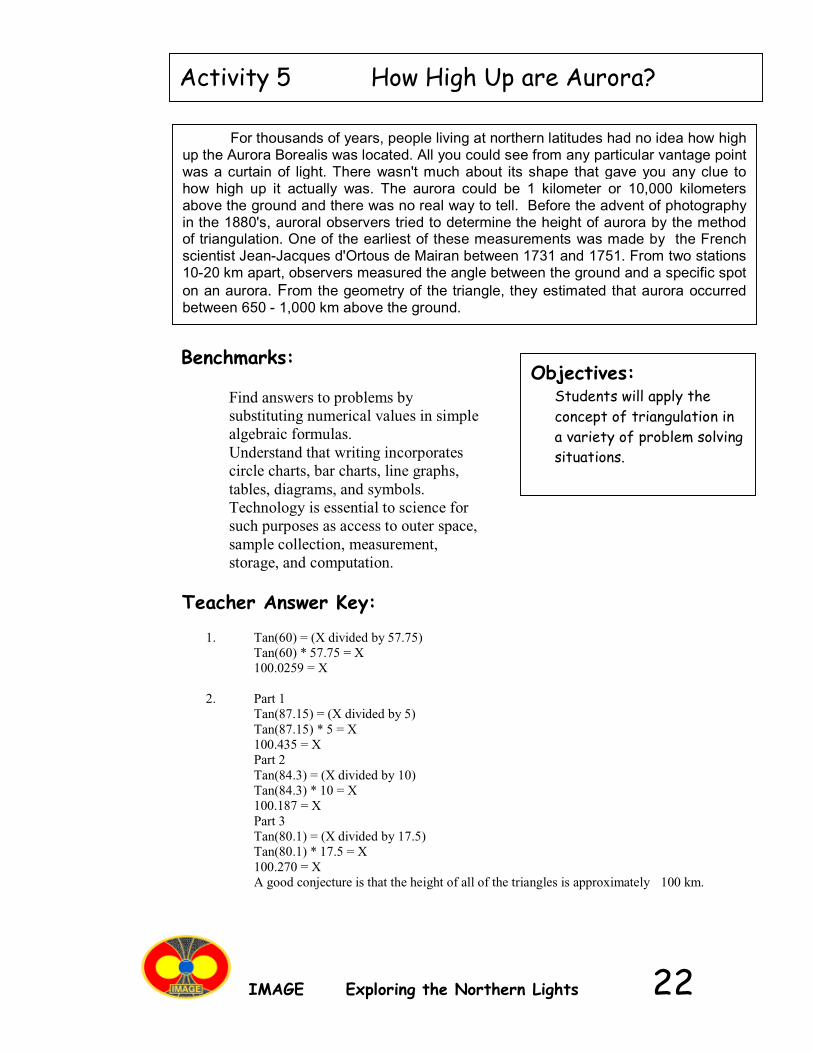
IMAGE Exploring the Northern Lights 22
Benchmarks:
Find answers to problems bysubstituting numerical values in simplealgebraic formulas.Understand that writing incorporatescircle charts, bar charts, line graphs,tables, diagrams, and symbols.Technology is essential to science forsuch purposes as access to outer space,sample collection, measurement,storage, and computation.
For thousands of years, people living at northern latitudes had no idea how highup the Aurora Borealis was located. All you could see from any particular vantage pointwas a curtain of light. There wasn't much about its shape that gave you any clue tohow high up it actually was. The aurora could be 1 kilometer or 10,000 kilometersabove the ground and there was no real way to tell. Before the advent of photographyin the 1880's, auroral observers tried to determine the height of aurora by the methodof triangulation. One of the earliest of these measurements was made by the Frenchscientist Jean-Jacques d'Ortous de Mairan between 1731 and 1751. From two stations10-20 km apart, observers measured the angle between the ground and a specific spoton an aurora. From the geometry of the triangle, they estimated that aurora occurredbetween 650 - 1,000 km above the ground.
Teacher Answer Key:
1. Tan(60) = (X divided by 57.75)Tan(60) * 57.75 = X100.0259 = X
2. Part 1Tan(87.15) = (X divided by 5)Tan(87.15) * 5 = X100.435 = XPart 2Tan(84.3) = (X divided by 10)Tan(84.3) * 10 = X100.187 = XPart 3Tan(80.1) = (X divided by 17.5)Tan(80.1) * 17.5 = X100.270 = XA good conjecture is that the height of all of the triangles is approximately 100 km.
Activity 5 How High Up are Aurora?
Objectives:Students will apply theconcept of triangulation ina variety of problem solvingsituations.
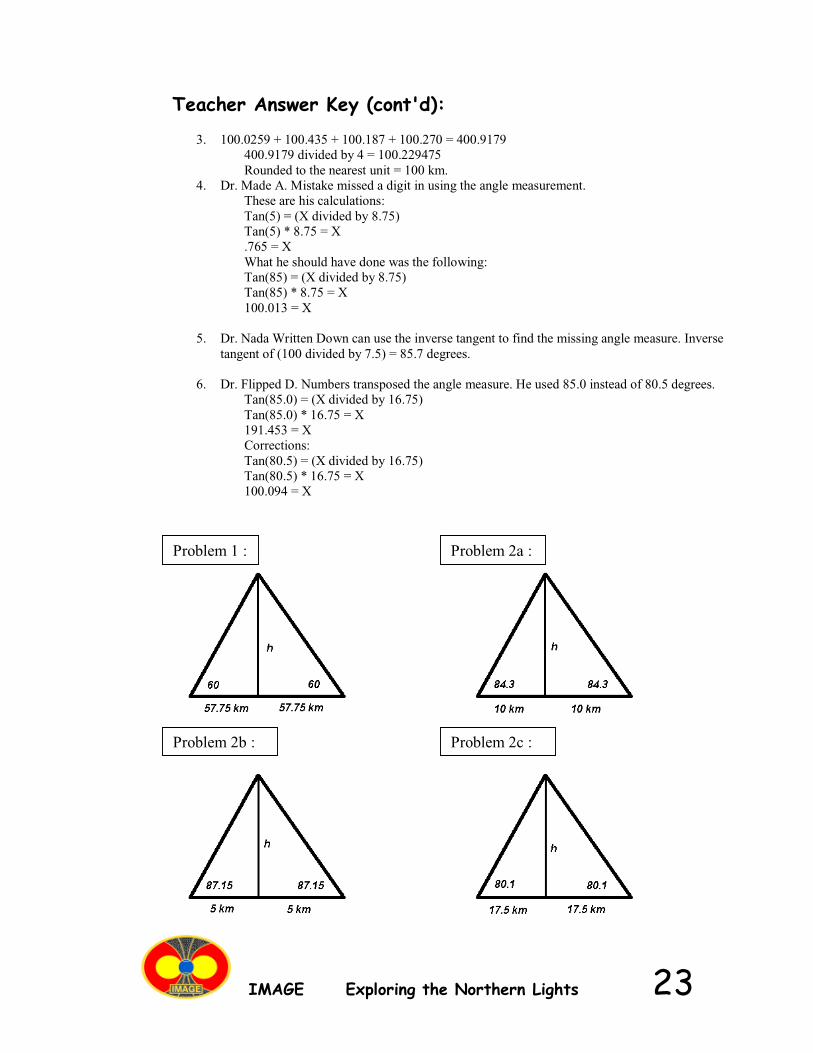
IMAGE Exploring the Northern Lights 23
Teacher Answer Key (cont'd):
3. 100.0259 + 100.435 + 100.187 + 100.270 = 400.9179400.9179 divided by 4 = 100.229475Rounded to the nearest unit = 100 km.
4. Dr. Made A. Mistake missed a digit in using the angle measurement.These are his calculations:Tan(5) = (X divided by 8.75)Tan(5) * 8.75 = X.765 = XWhat he should have done was the following:Tan(85) = (X divided by 8.75)Tan(85) * 8.75 = X100.013 = X
5. Dr. Nada Written Down can use the inverse tangent to find the missing angle measure. Inversetangent of (100 divided by 7.5) = 85.7 degrees.
6. Dr. Flipped D. Numbers transposed the angle measure. He used 85.0 instead of 80.5 degrees.Tan(85.0) = (X divided by 16.75)Tan(85.0) * 16.75 = X191.453 = XCorrections:Tan(80.5) = (X divided by 16.75)Tan(80.5) * 16.75 = X100.094 = X
Problem 1 : Problem 2a :
Problem 2b : Problem 2c :
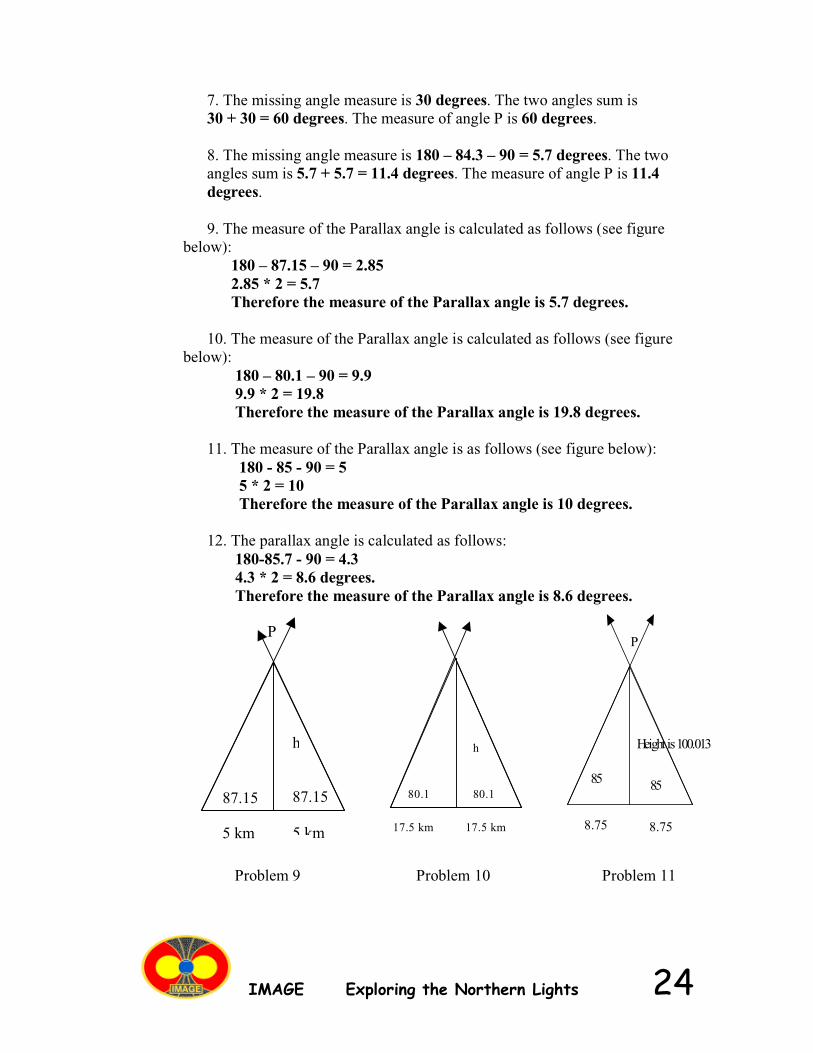
IMAGE Exploring the Northern Lights 24
7. The missing angle measure is 30 degrees. The two angles sum is30 + 30 = 60 degrees. The measure of angle P is 60 degrees.
8. The missing angle measure is 180 – 84.3 – 90 = 5.7 degrees. The twoangles sum is 5.7 + 5.7 = 11.4 degrees. The measure of angle P is 11.4degrees.
9. The measure of the Parallax angle is calculated as follows (see figurebelow):
180 – 87.15 – 90 = 2.852.85 * 2 = 5.7Therefore the measure of the Parallax angle is 5.7 degrees.
10. The measure of the Parallax angle is calculated as follows (see figurebelow):
180 – 80.1 – 90 = 9.99.9 * 2 = 19.8Therefore the measure of the Parallax angle is 19.8 degrees.
11. The measure of the Parallax angle is as follows (see figure below):180 - 85 - 90 = 55 * 2 = 10Therefore the measure of the Parallax angle is 10 degrees.
12. The parallax angle is calculated as follows:180-85.7 - 90 = 4.34.3 * 2 = 8.6 degrees.Therefore the measure of the Parallax angle is 8.6 degrees.
h
87.15 87.15
5 km 5 km
P
Problem 9 Problem 10 Problem 11
h
80.1 80.1
17.5 km 17.5 km
Height is100.013
85 85
P
8.75 8.75
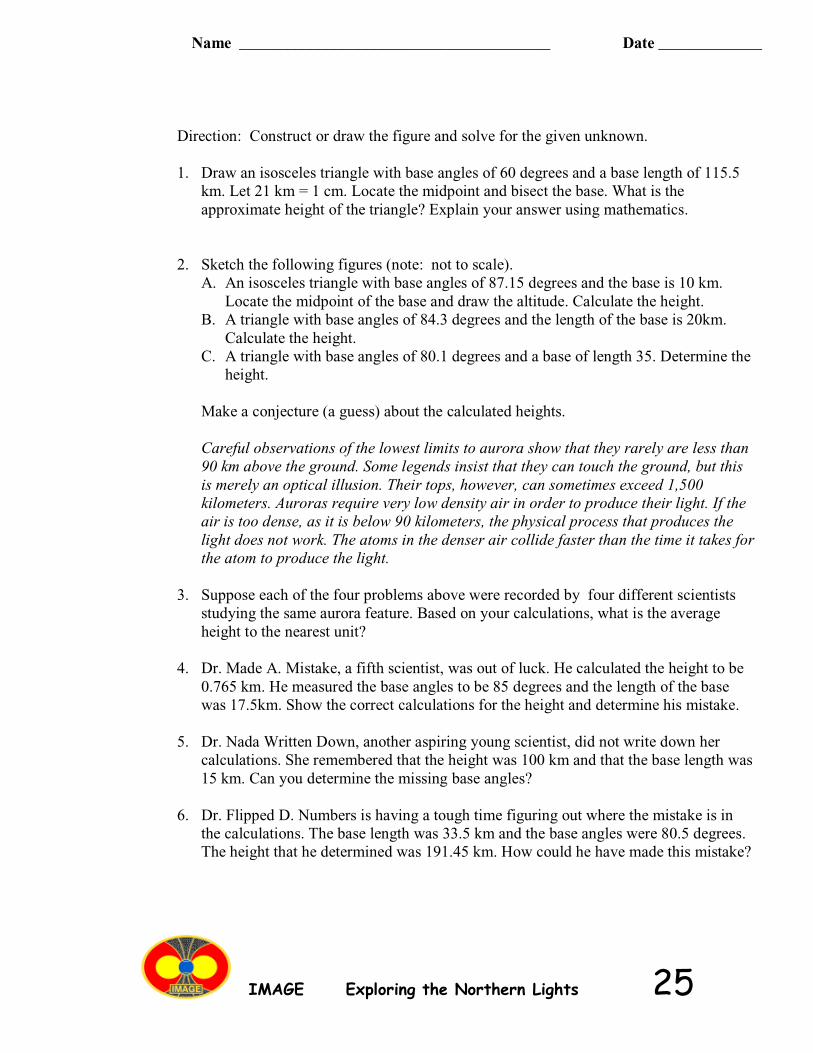
IMAGE Exploring the Northern Lights 25
Direction: Construct or draw the figure and solve for the given unknown.
1. Draw an isosceles triangle with base angles of 60 degrees and a base length of 115.5km. Let 21 km = 1 cm. Locate the midpoint and bisect the base. What is theapproximate height of the triangle? Explain your answer using mathematics.
2. Sketch the following figures (note: not to scale).A. An isosceles triangle with base angles of 87.15 degrees and the base is 10 km.
Locate the midpoint of the base and draw the altitude. Calculate the height.B. A triangle with base angles of 84.3 degrees and the length of the base is 20km.
Calculate the height.C. A triangle with base angles of 80.1 degrees and a base of length 35. Determine the
height.
Make a conjecture (a guess) about the calculated heights.
Careful observations of the lowest limits to aurora show that they rarely are less than90 km above the ground. Some legends insist that they can touch the ground, but thisis merely an optical illusion. Their tops, however, can sometimes exceed 1,500kilometers. Auroras require very low density air in order to produce their light. If theair is too dense, as it is below 90 kilometers, the physical process that produces thelight does not work. The atoms in the denser air collide faster than the time it takes forthe atom to produce the light.
3. Suppose each of the four problems above were recorded by four different scientistsstudying the same aurora feature. Based on your calculations, what is the averageheight to the nearest unit?
4. Dr. Made A. Mistake, a fifth scientist, was out of luck. He calculated the height to be0.765 km. He measured the base angles to be 85 degrees and the length of the basewas 17.5km. Show the correct calculations for the height and determine his mistake.
5. Dr. Nada Written Down, another aspiring young scientist, did not write down hercalculations. She remembered that the height was 100 km and that the base length was15 km. Can you determine the missing base angles?
6. Dr. Flipped D. Numbers is having a tough time figuring out where the mistake is inthe calculations. The base length was 33.5 km and the base angles were 80.5 degrees.The height that he determined was 191.45 km. How could he have made this mistake?
Name _______________________________________ Date _____________
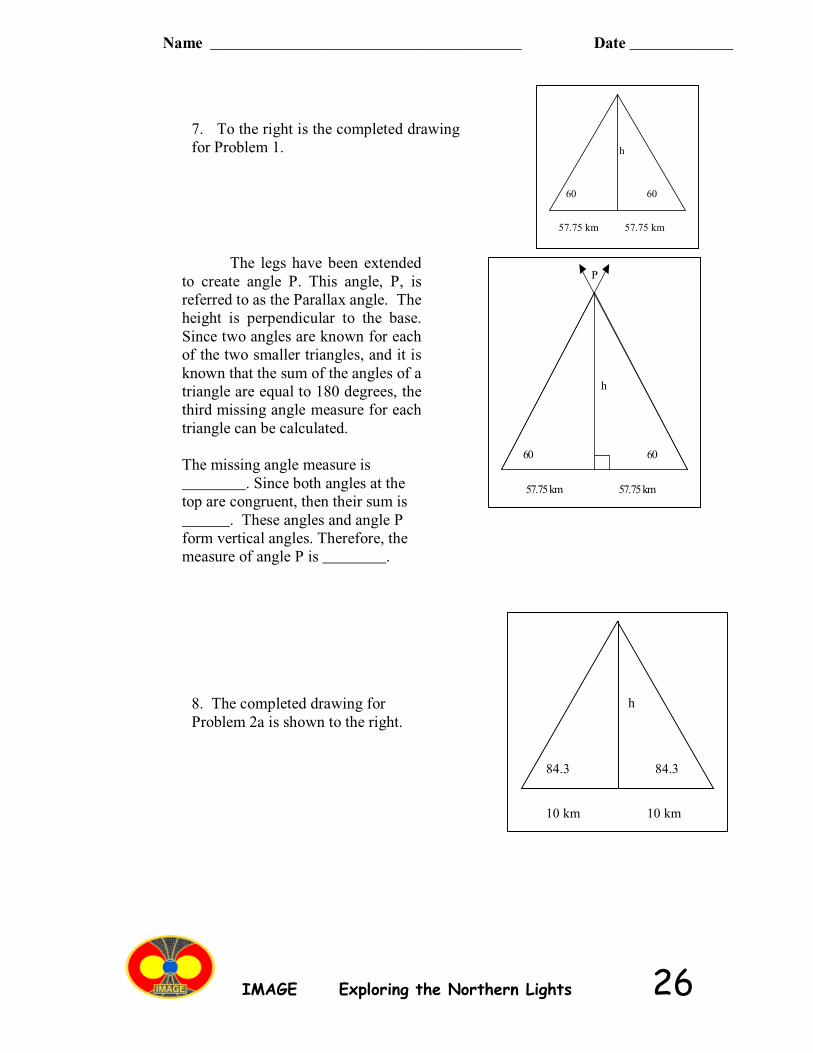
IMAGE Exploring the Northern Lights 26
7. To the right is the completed drawingfor Problem 1. h
60 60
57.75 km 57.75 km
h
6060
P
57.75km 57.75km
The legs have been extendedto create angle P. This angle, P, isreferred to as the Parallax angle. Theheight is perpendicular to the base.Since two angles are known for eachof the two smaller triangles, and it isknown that the sum of the angles of atriangle are equal to 180 degrees, thethird missing angle measure for eachtriangle can be calculated.
The missing angle measure is________. Since both angles at thetop are congruent, then their sum is______. These angles and angle Pform vertical angles. Therefore, themeasure of angle P is ________.
8. The completed drawing forProblem 2a is shown to the right.
h
84.3 84.3
10 km 10 km
Name _______________________________________ Date _____________
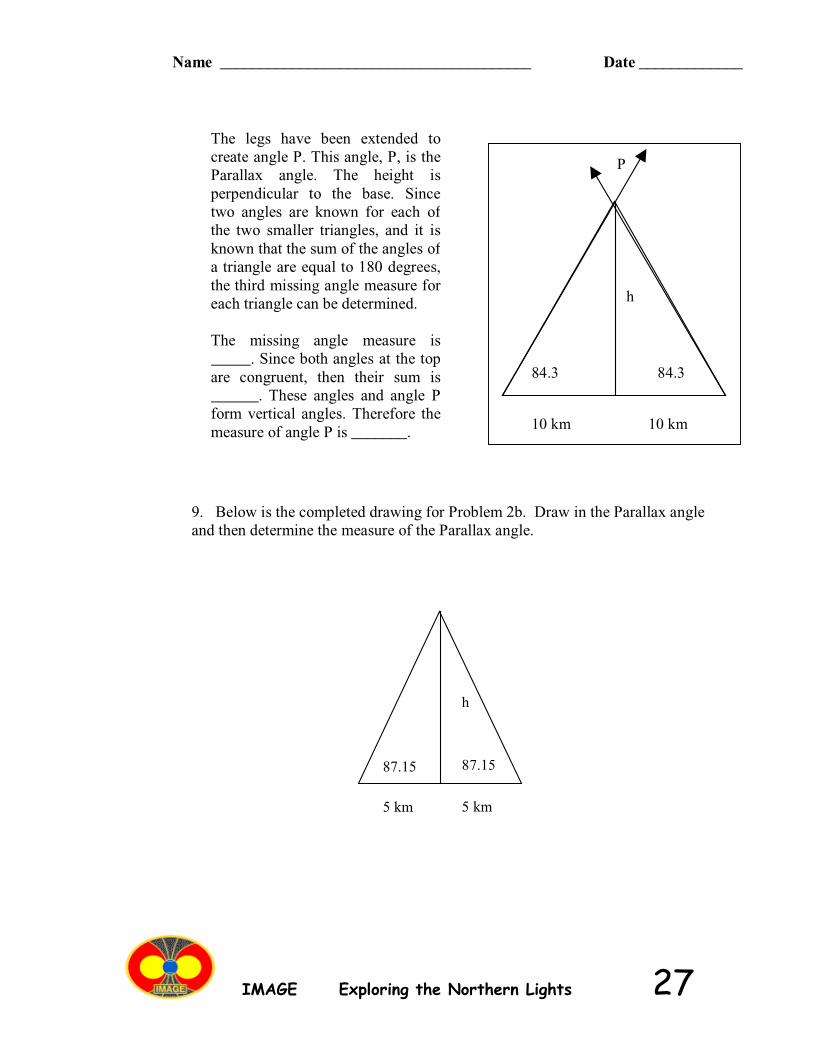
IMAGE Exploring the Northern Lights 27
h
84.3 84.3
10 km 10 km
P
The legs have been extended tocreate angle P. This angle, P, is theParallax angle. The height isperpendicular to the base. Sincetwo angles are known for each ofthe two smaller triangles, and it isknown that the sum of the angles ofa triangle are equal to 180 degrees,the third missing angle measure foreach triangle can be determined.
The missing angle measure is_____. Since both angles at the topare congruent, then their sum is______. These angles and angle Pform vertical angles. Therefore themeasure of angle P is _______.
9. Below is the completed drawing for Problem 2b. Draw in the Parallax angleand then determine the measure of the Parallax angle.
h
87.15 87.15
5 km 5 km
Name _______________________________________ Date _____________
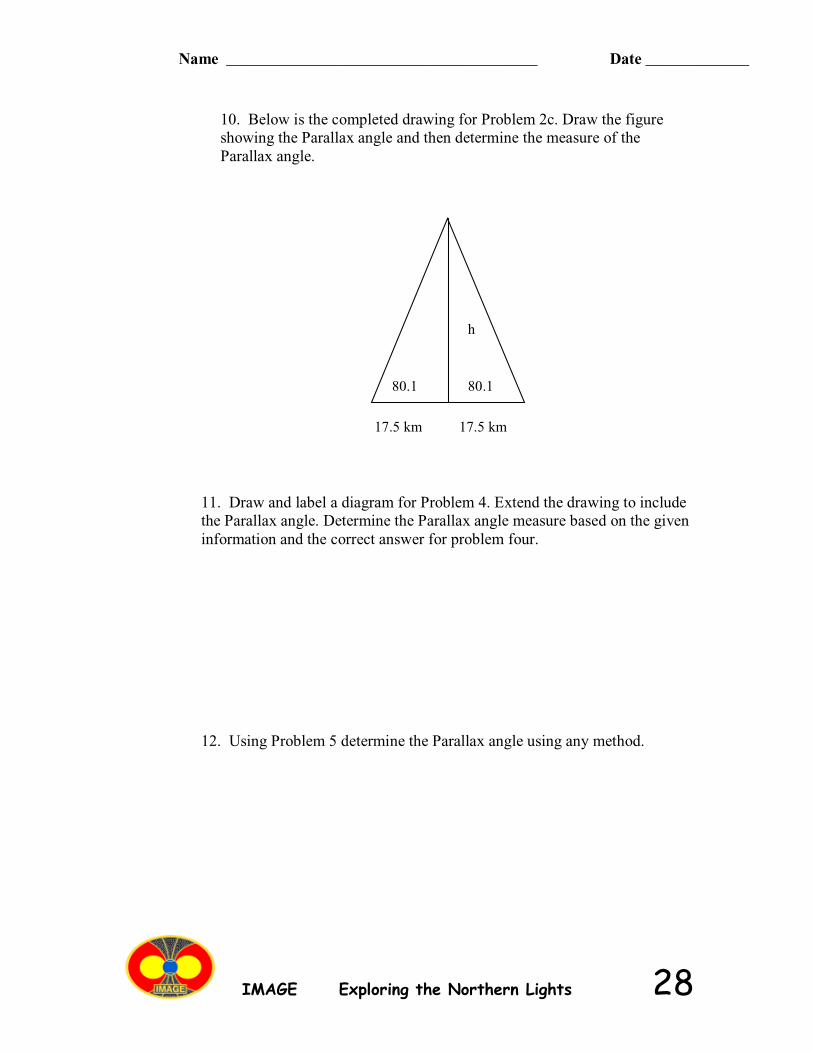
IMAGE Exploring the Northern Lights 28
10. Below is the completed drawing for Problem 2c. Draw the figureshowing the Parallax angle and then determine the measure of theParallax angle.
h
80.1 80.1
17.5 km 17.5 km
11. Draw and label a diagram for Problem 4. Extend the drawing to includethe Parallax angle. Determine the Parallax angle measure based on the giveninformation and the correct answer for problem four.
12. Using Problem 5 determine the Parallax angle using any method.
Name _______________________________________ Date _____________
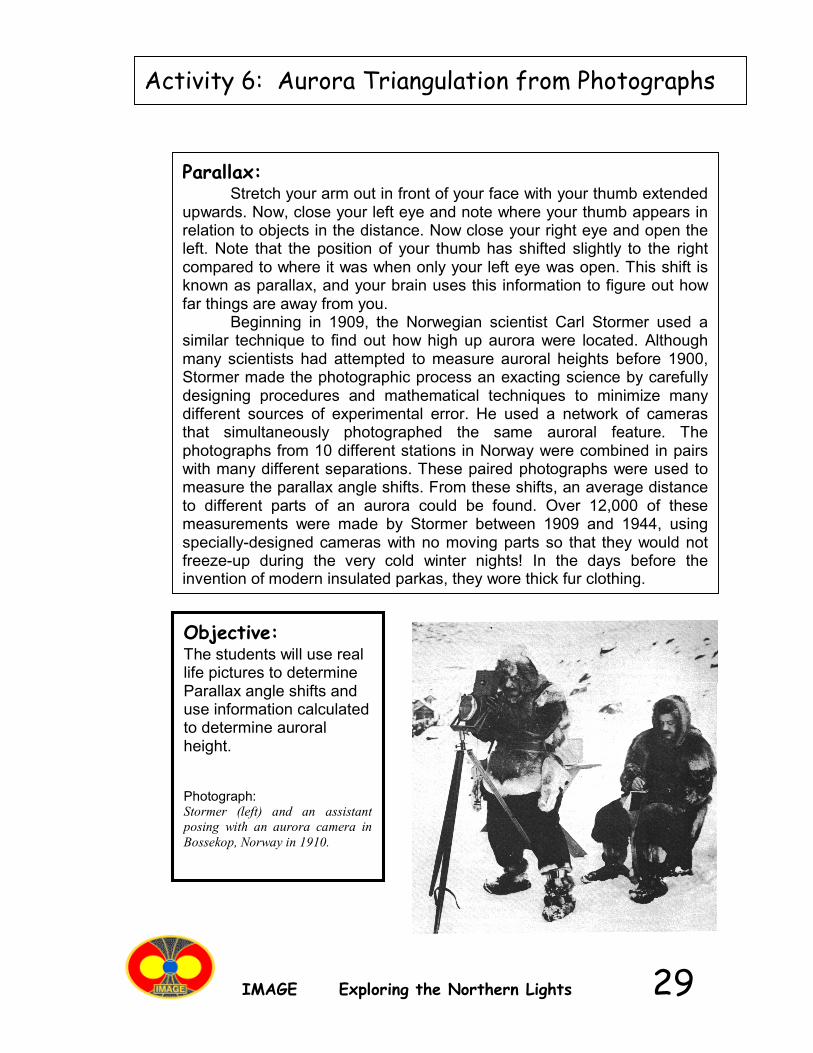
IMAGE Exploring the Northern Lights 29
Parallax:Stretch your arm out in front of your face with your thumb extended
upwards. Now, close your left eye and note where your thumb appears inrelation to objects in the distance. Now close your right eye and open theleft. Note that the position of your thumb has shifted slightly to the rightcompared to where it was when only your left eye was open. This shift isknown as parallax, and your brain uses this information to figure out howfar things are away from you.
Beginning in 1909, the Norwegian scientist Carl Stormer used asimilar technique to find out how high up aurora were located. Althoughmany scientists had attempted to measure auroral heights before 1900,Stormer made the photographic process an exacting science by carefullydesigning procedures and mathematical techniques to minimize manydifferent sources of experimental error. He used a network of camerasthat simultaneously photographed the same auroral feature. Thephotographs from 10 different stations in Norway were combined in pairswith many different separations. These paired photographs were used tomeasure the parallax angle shifts. From these shifts, an average distanceto different parts of an aurora could be found. Over 12,000 of thesemeasurements were made by Stormer between 1909 and 1944, usingspecially-designed cameras with no moving parts so that they would notfreeze-up during the very cold winter nights! In the days before theinvention of modern insulated parkas, they wore thick fur clothing.
Objective:The students will use reallife pictures to determineParallax angle shifts anduse information calculatedto determine auroralheight.
Photograph:Stormer (left) and an assistantposing with an aurora camera inBossekop, Norway in 1910.
Activity 6: Aurora Triangulation from Photographs
IMAGE Exploring the Northern Lights 30
Benchmarks:
Materials:Pictures of the starsStudent worksheetsCalculator – degree modeMetric RulerVocabulary list
6-8 Technology is essential to science for such purposes as access to outer space,sample collection, measurement, storage and computation.9-12 Distances and angles that are inconvenient to measure directly can be foundfrom measurable distances and angles using scale drawings.6-8 Models are often used to think about processes that happen too slowly, tooquickly or on too small a scale to observe directly, or that are too vast to be changeddeliberately.9-12 Find answers to problems by substituting numerical values in simple algebraicformulas.6-8 Understand writing that incorporates circle charts, bar graphs line graphs, tables,diagrams and symbols
Procedures:
Step 1: Teacher introduces the vocabulary list to the students. These can beplace on the overhead or on the chalkboard.
Step 2: Students work through the steps on the student worksheet. Theactivity can be completed by the student if the teacher is confident that theycan perform the tasks, or the steps can be completed one at a time in pairs orgroups. If the teacher opts to do this, it might be good to stop after each stepor every two steps and discuss the results prior to completing more steps.The teacher may wish to have a transparency of the student worksheets andthe stars to show how and fill in as the activity progresses.
Step 3: Discuss the answers if not already completed.
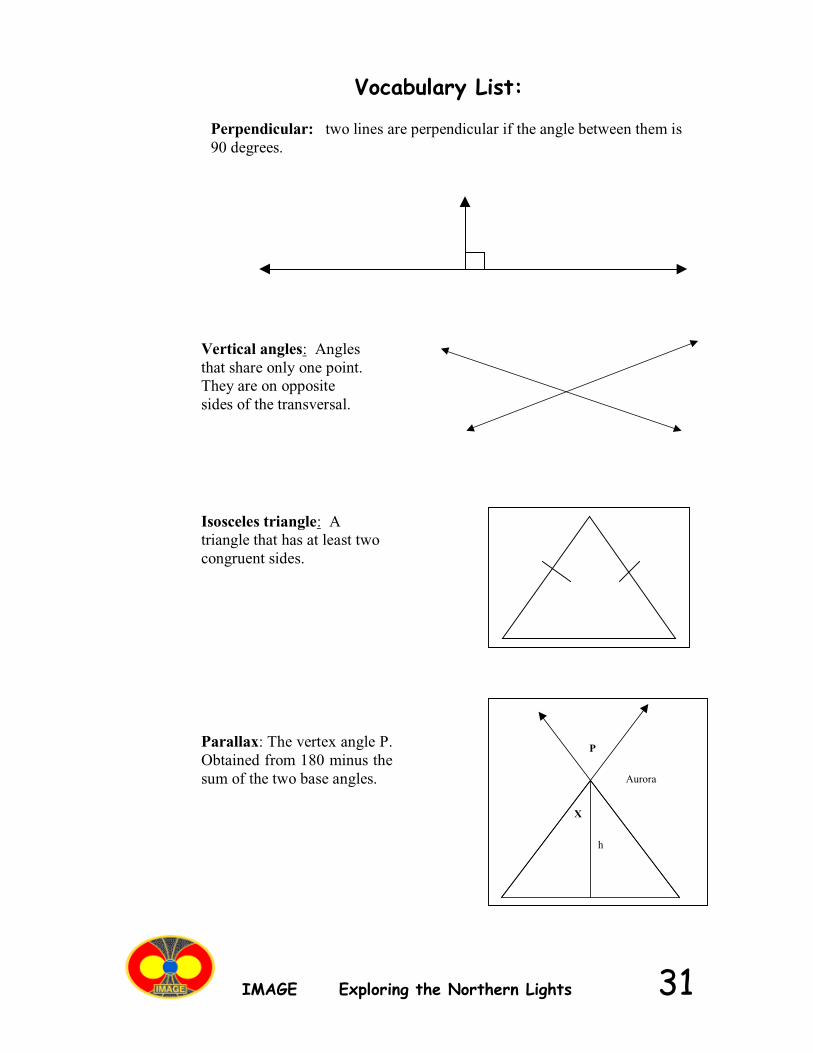
IMAGE Exploring the Northern Lights 31
Vocabulary List:
Perpendicular: two lines are perpendicular if the angle between them is90 degrees.
Vertical angles: Anglesthat share only one point.They are on oppositesides of the transversal.
Isosceles triangle: Atriangle that has at least twocongruent sides.
P
h
Aurora
X
Parallax: The vertex angle P.Obtained from 180 minus thesum of the two base angles.

IMAGE Exploring the Northern Lights 32
Name _______________________________________ Date _____________
Station 1: This is aphotograph taken at oneobserving station of anaurora that passedthrough the bowl of the BigDipper (Ursa Major). Thenumbered stars are:
1...Dubhe2...Mirak3...Phecda4...Megrez5...Alioth6...Mizar
Station 2: This is aphotograph of the aurorain the Big Dipper (UrsaMajor) taken at the sametime from a secondobserving station 17. 6kilometers from Station 1.Note that there is a shift inthe location of the aurorabetween the two stations.
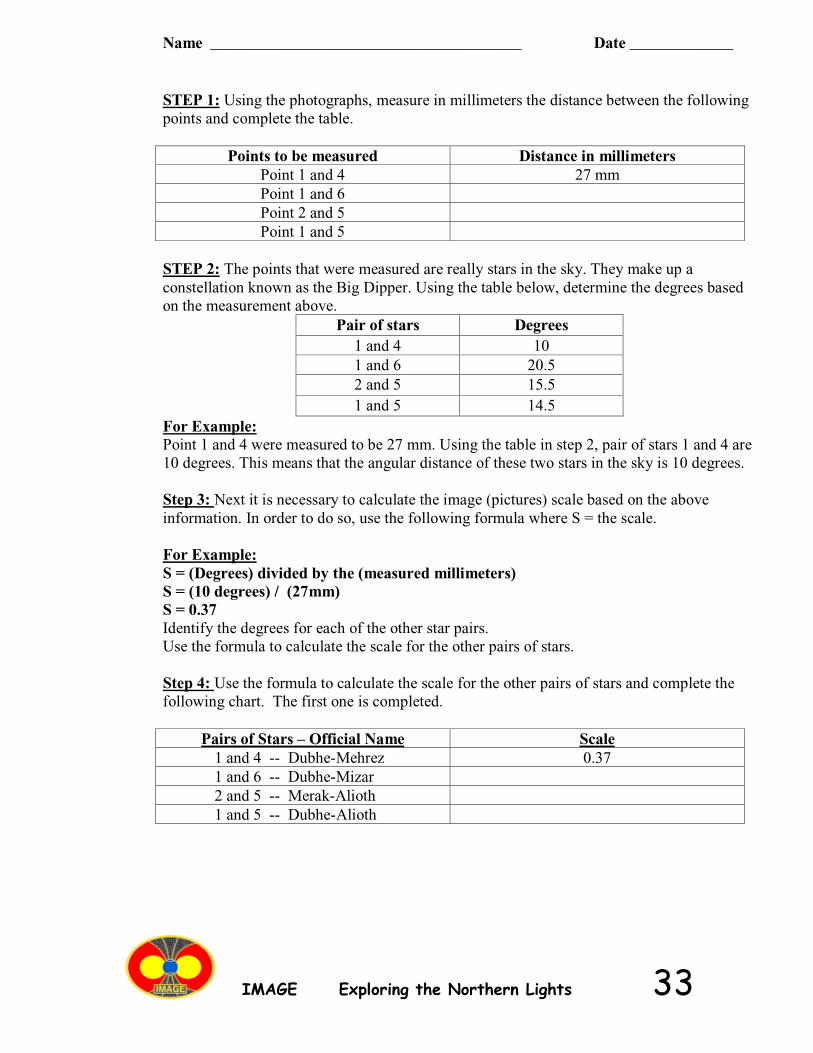
IMAGE Exploring the Northern Lights 33
STEP 1: Using the photographs, measure in millimeters the distance between the followingpoints and complete the table.
Points to be measured Distance in millimetersPoint 1 and 4 27 mmPoint 1 and 6Point 2 and 5Point 1 and 5
STEP 2: The points that were measured are really stars in the sky. They make up aconstellation known as the Big Dipper. Using the table below, determine the degrees basedon the measurement above.
Pair of stars Degrees1 and 4 101 and 6 20.52 and 5 15.51 and 5 14.5
For Example:Point 1 and 4 were measured to be 27 mm. Using the table in step 2, pair of stars 1 and 4 are10 degrees. This means that the angular distance of these two stars in the sky is 10 degrees.
Step 3: Next it is necessary to calculate the image (pictures) scale based on the aboveinformation. In order to do so, use the following formula where S = the scale.
For Example:S = (Degrees) divided by the (measured millimeters)S = (10 degrees) / (27mm)S = 0.37Identify the degrees for each of the other star pairs.Use the formula to calculate the scale for the other pairs of stars.
Step 4: Use the formula to calculate the scale for the other pairs of stars and complete thefollowing chart. The first one is completed.
Pairs of Stars – Official Name Scale1 and 4 -- Dubhe-Mehrez 0.371 and 6 -- Dubhe-Mizar2 and 5 -- Merak-Alioth1 and 5 -- Dubhe-Alioth
Name _______________________________________ Date _____________
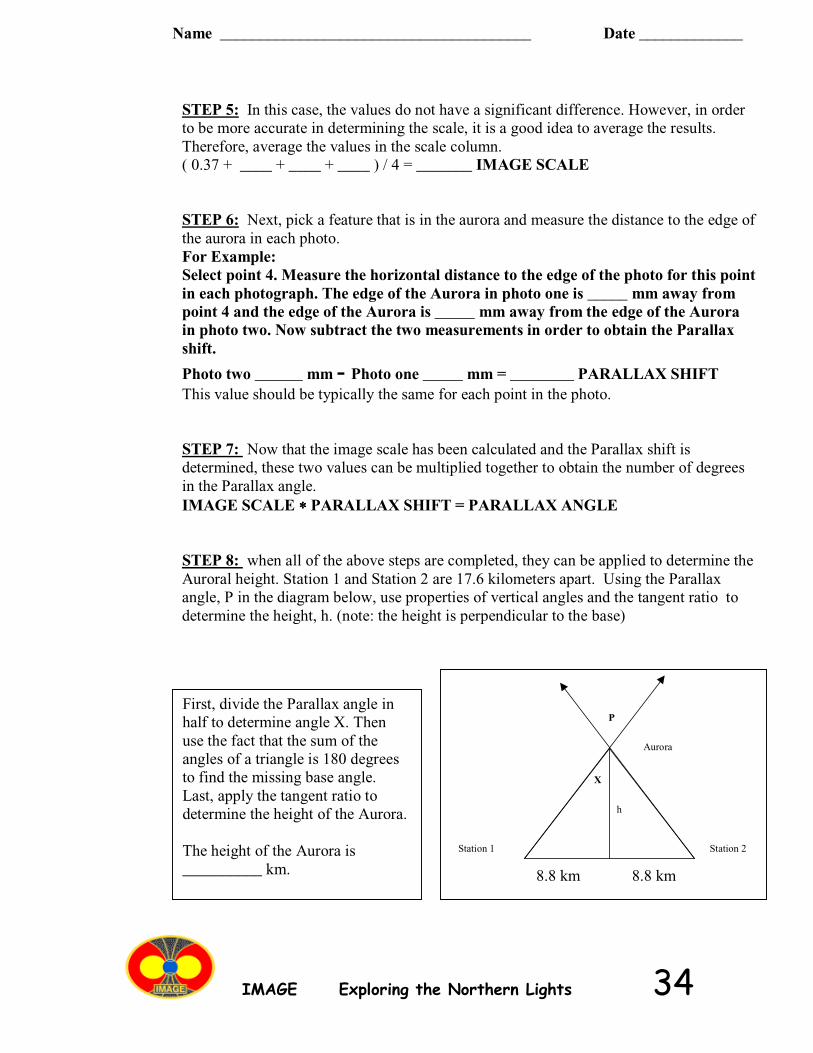
IMAGE Exploring the Northern Lights 34
STEP 5: In this case, the values do not have a significant difference. However, in orderto be more accurate in determining the scale, it is a good idea to average the results.Therefore, average the values in the scale column.( 0.37 + ____ + ____ + ____ ) / 4 = _______ IMAGE SCALE
STEP 6: Next, pick a feature that is in the aurora and measure the distance to the edge ofthe aurora in each photo.For Example:Select point 4. Measure the horizontal distance to the edge of the photo for this pointin each photograph. The edge of the Aurora in photo one is _____ mm away frompoint 4 and the edge of the Aurora is _____ mm away from the edge of the Aurorain photo two. Now subtract the two measurements in order to obtain the Parallaxshift.
Photo two ______ mm - Photo one _____ mm = ________ PARALLAX SHIFTThis value should be typically the same for each point in the photo.
STEP 7: Now that the image scale has been calculated and the Parallax shift isdetermined, these two values can be multiplied together to obtain the number of degreesin the Parallax angle.IMAGE SCALE ∗∗∗∗ PARALLAX SHIFT = PARALLAX ANGLE
STEP 8: when all of the above steps are completed, they can be applied to determine theAuroral height. Station 1 and Station 2 are 17.6 kilometers apart. Using the Parallaxangle, P in the diagram below, use properties of vertical angles and the tangent ratio todetermine the height, h. (note: the height is perpendicular to the base)
P
h
Aurora
X
Station 1 Station 2
First, divide the Parallax angle inhalf to determine angle X. Thenuse the fact that the sum of theangles of a triangle is 180 degreesto find the missing base angle.Last, apply the tangent ratio todetermine the height of the Aurora.
The height of the Aurora is__________ km. 8.8 km 8.8 km
Name _______________________________________ Date _____________
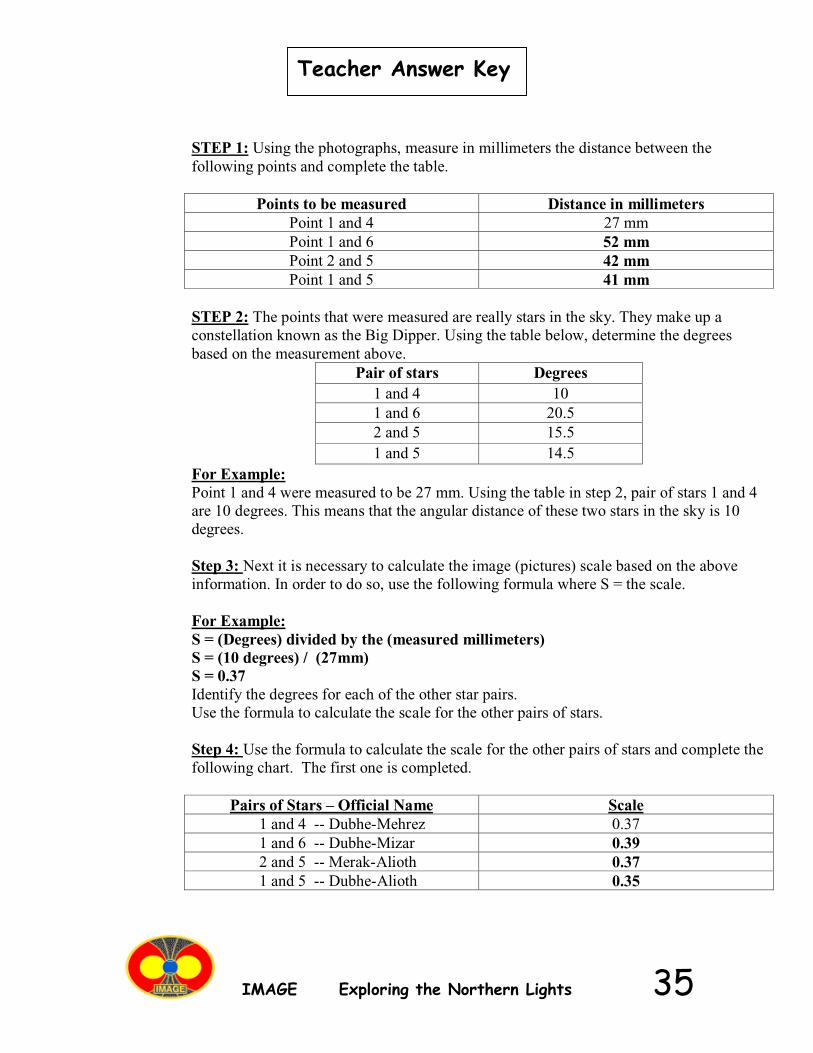
IMAGE Exploring the Northern Lights 35
Teacher Answer Key
STEP 1: Using the photographs, measure in millimeters the distance between thefollowing points and complete the table.
Points to be measured Distance in millimetersPoint 1 and 4 27 mmPoint 1 and 6 52 mmPoint 2 and 5 42 mmPoint 1 and 5 41 mm
STEP 2: The points that were measured are really stars in the sky. They make up aconstellation known as the Big Dipper. Using the table below, determine the degreesbased on the measurement above.
Pair of stars Degrees1 and 4 101 and 6 20.52 and 5 15.51 and 5 14.5
For Example:Point 1 and 4 were measured to be 27 mm. Using the table in step 2, pair of stars 1 and 4are 10 degrees. This means that the angular distance of these two stars in the sky is 10degrees.
Step 3: Next it is necessary to calculate the image (pictures) scale based on the aboveinformation. In order to do so, use the following formula where S = the scale.
For Example:S = (Degrees) divided by the (measured millimeters)S = (10 degrees) / (27mm)S = 0.37Identify the degrees for each of the other star pairs.Use the formula to calculate the scale for the other pairs of stars.
Step 4: Use the formula to calculate the scale for the other pairs of stars and complete thefollowing chart. The first one is completed.
Pairs of Stars – Official Name Scale1 and 4 -- Dubhe-Mehrez 0.371 and 6 -- Dubhe-Mizar 0.392 and 5 -- Merak-Alioth 0.371 and 5 -- Dubhe-Alioth 0.35
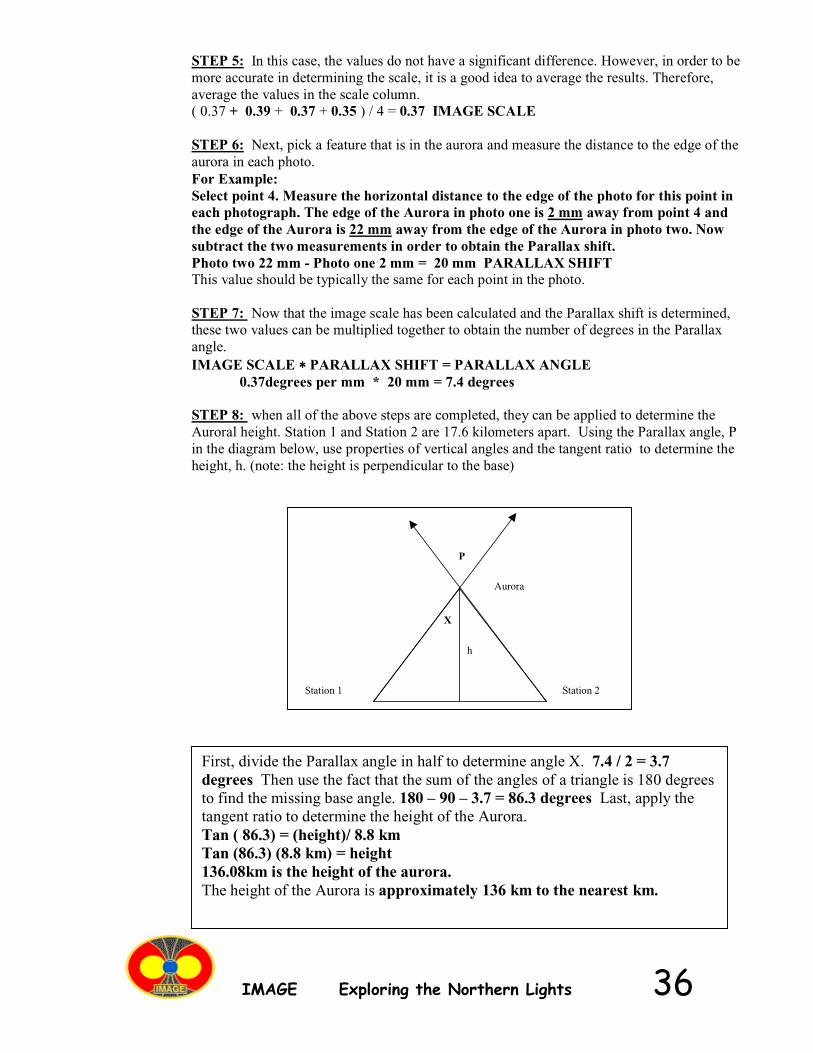
IMAGE Exploring the Northern Lights 36
STEP 5: In this case, the values do not have a significant difference. However, in order to bemore accurate in determining the scale, it is a good idea to average the results. Therefore,average the values in the scale column.( 0.37 + 0.39 + 0.37 + 0.35 ) / 4 = 0.37 IMAGE SCALE
STEP 6: Next, pick a feature that is in the aurora and measure the distance to the edge of theaurora in each photo.For Example:Select point 4. Measure the horizontal distance to the edge of the photo for this point ineach photograph. The edge of the Aurora in photo one is 2 mm away from point 4 andthe edge of the Aurora is 22 mm away from the edge of the Aurora in photo two. Nowsubtract the two measurements in order to obtain the Parallax shift.Photo two 22 mm - Photo one 2 mm = 20 mm PARALLAX SHIFTThis value should be typically the same for each point in the photo.
STEP 7: Now that the image scale has been calculated and the Parallax shift is determined,these two values can be multiplied together to obtain the number of degrees in the Parallaxangle.IMAGE SCALE ∗∗∗∗ PARALLAX SHIFT = PARALLAX ANGLE
0.37degrees per mm * 20 mm = 7.4 degrees
STEP 8: when all of the above steps are completed, they can be applied to determine theAuroral height. Station 1 and Station 2 are 17.6 kilometers apart. Using the Parallax angle, Pin the diagram below, use properties of vertical angles and the tangent ratio to determine theheight, h. (note: the height is perpendicular to the base)
P
h
Aurora
X
Station 1 Station 2
First, divide the Parallax angle in half to determine angle X. 7.4 / 2 = 3.7degrees Then use the fact that the sum of the angles of a triangle is 180 degreesto find the missing base angle. 180 – 90 – 3.7 = 86.3 degrees Last, apply thetangent ratio to determine the height of the Aurora.Tan ( 86.3) = (height)/ 8.8 kmTan (86.3) (8.8 km) = height136.08km is the height of the aurora.The height of the Aurora is approximately 136 km to the nearest km.
IMAGE Exploring the Northern Lights 37
Activity 7 Auroral Magnetism from the Ground
Introduction:Solar storms can buffet the magnetic field of the Earth with clouds of
charged particles and magnetic fields. Not only do these interactions affect thelarge-scale properties of the geomagnetic field, but their effects can also beeasily detected on the ground. During the last 100 years, many ‘magneticobservatories’ have been commissioned around the world to monitor Earth’ssurface field conditions. These have been, historically, important for navigationby ships at sea. The data from these observatories can also be used toexamine what happens when solar storms arrive at Earth.
Objectives:By analyzing graphical data, students will become familiar with Earth’s
changing magnetic field through solar storm activity plots.
Materials:5-station Data Sheet.CalculatorMap of Canada
Procedure:1) Plot the location of each magnetic observatoryon a map of Canada. Label each station numbernext to the plotted point.
2) Analyze the magnetic intensity plot for each station and identify the largestdifference in change in activity on the plot. The units of magnetic intensity are innano-Teslas. One nanoTessla (nT) is equal to one billionth of a Tessla.
3) Find the absolute magnitude of the change for each station. Write the numberbelow the location of the station on the map.
4) Discuss and work the following questions and procedures:
Where are the largest magnetic changes located for this event?Draw a circle around the three stations with the largest magnetic changes.Did the largest changes occur at the same time? Explain.On the Data Sheet, organize the plots in order from the largest to thesmallest change. Do you see any patterns?Organize the magnetic intensity plots according to similar shapes. Arethere any trends?
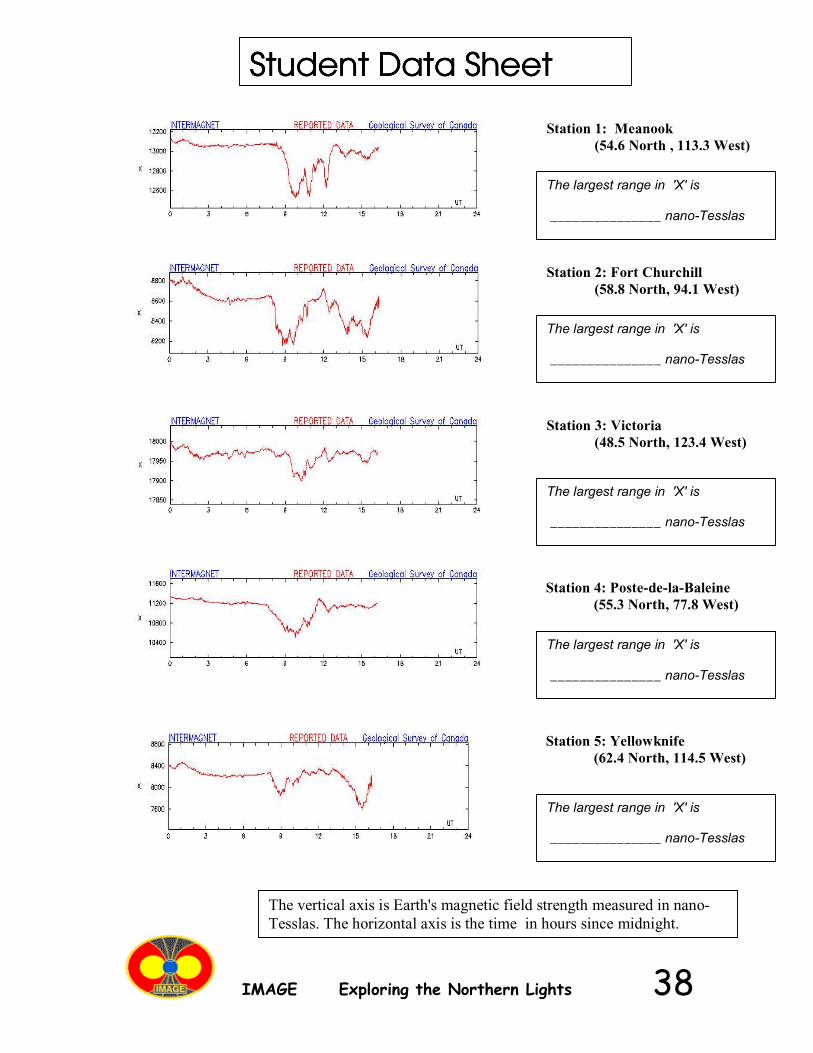
IMAGE Exploring the Northern Lights 38
Student Data SheetStudent Data SheetStudent Data SheetStudent Data Sheet
Station 1: Meanook(54.6 North , 113.3 West)
Station 2: Fort Churchill(58.8 North, 94.1 West)
Station 3: Victoria(48.5 North, 123.4 West)
Station 4: Poste-de-la-Baleine(55.3 North, 77.8 West)
Station 5: Yellowknife(62.4 North, 114.5 West)
The vertical axis is Earth's magnetic field strength measured in nano-Tesslas. The horizontal axis is the time in hours since midnight.
The largest range in 'X' is
_______________ nano-Tesslas
The largest range in 'X' is
_______________ nano-Tesslas
The largest range in 'X' is
_______________ nano-Tesslas
The largest range in 'X' is
_______________ nano-Tesslas
The largest range in 'X' is
_______________ nano-Tesslas
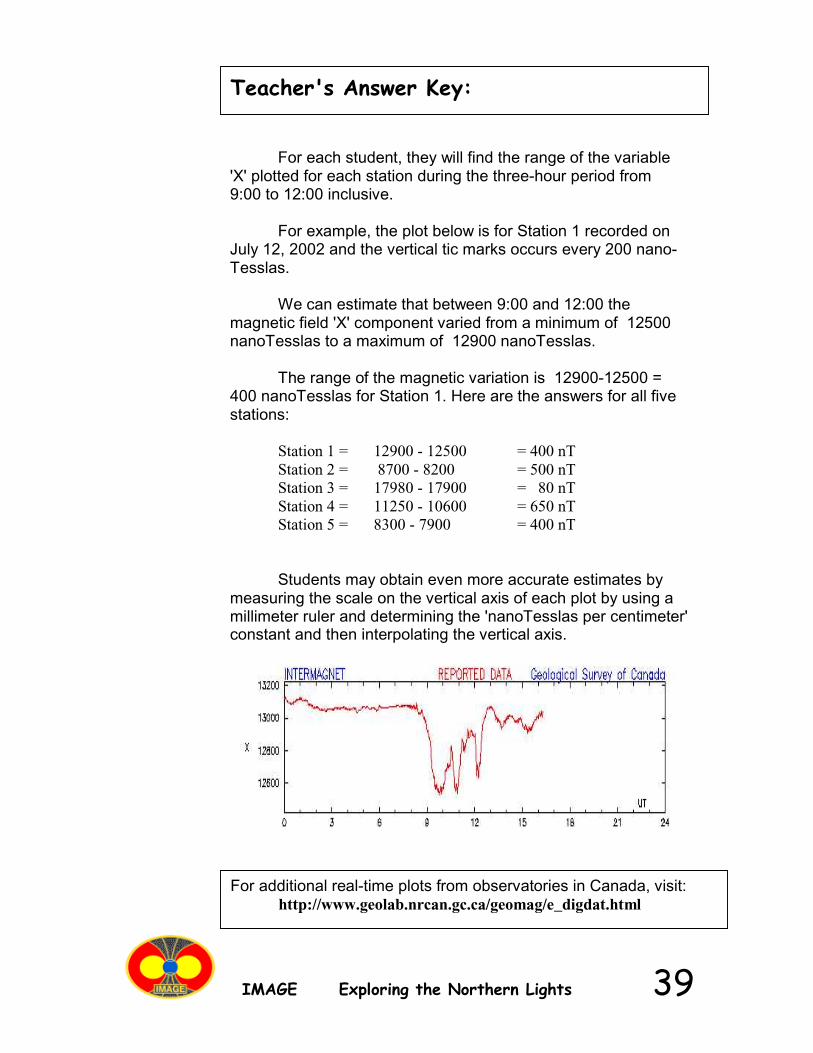
IMAGE Exploring the Northern Lights 39
Teacher's Answer Key:
For each student, they will find the range of the variable'X' plotted for each station during the three-hour period from9:00 to 12:00 inclusive.
For example, the plot below is for Station 1 recorded onJuly 12, 2002 and the vertical tic marks occurs every 200 nano-Tesslas.
We can estimate that between 9:00 and 12:00 themagnetic field 'X' component varied from a minimum of 12500nanoTesslas to a maximum of 12900 nanoTesslas.
The range of the magnetic variation is 12900-12500 =400 nanoTesslas for Station 1. Here are the answers for all fivestations:
Station 1 = 12900 - 12500 = 400 nTStation 2 = 8700 - 8200 = 500 nTStation 3 = 17980 - 17900 = 80 nTStation 4 = 11250 - 10600 = 650 nTStation 5 = 8300 - 7900 = 400 nT
Students may obtain even more accurate estimates bymeasuring the scale on the vertical axis of each plot by using amillimeter ruler and determining the 'nanoTesslas per centimeter'constant and then interpolating the vertical axis.
For additional real-time plots from observatories in Canada, visit:http://www.geolab.nrcan.gc.ca/geomag/e_digdat.html
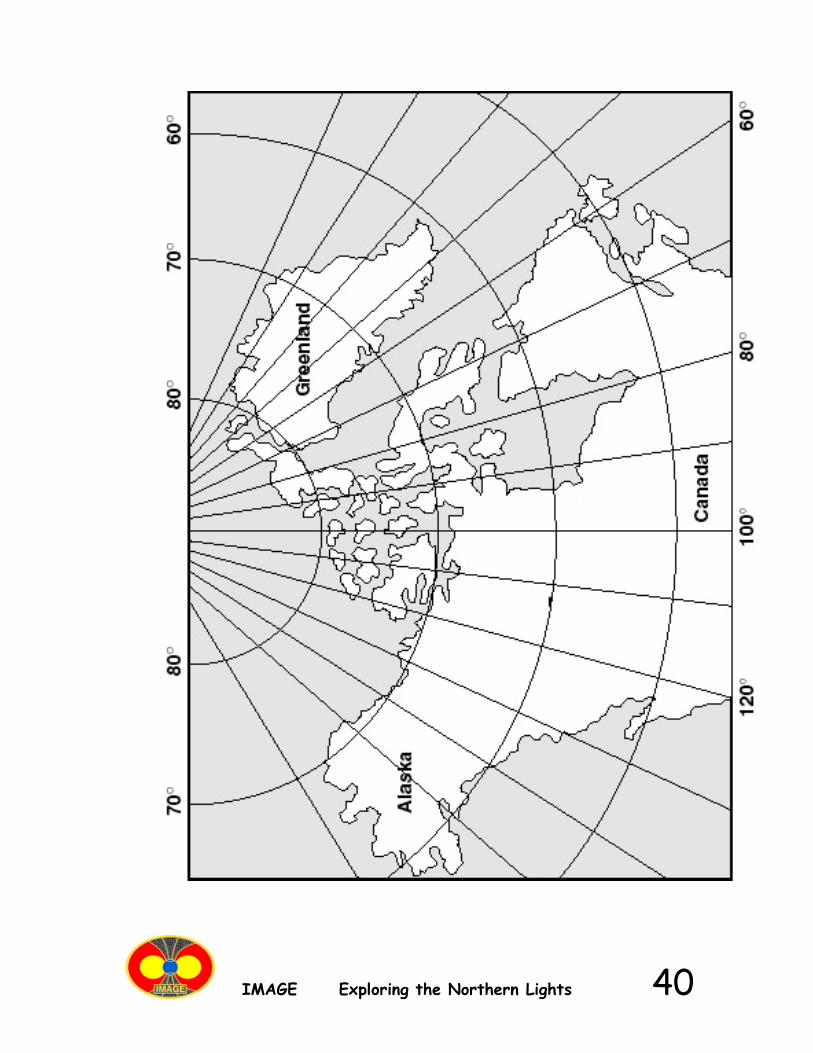
IMAGE Exploring the Northern Lights 40
IMAGE Exploring the Northern Lights 41
Up until the mid-1800's, no one really knew why aurora occur. As youcan imagine, this makes it very hard to predict when they will be seen next. Bycombining different kinds of data, scientists in the late 1800's and early 1900'sbegan to see patterns emerge, and were soon able to use them to predict whenaurora would occur. For example, during an aurora, Earth's magnetic fieldchanges slightly, and this can be detected on the ground as a 'magnetic storm'.For some of the most severe storms, even a simple compass can sometimeswork to sense these large changes in the field which can last for several hours.With the help of dozens of specially-designed observatories around the world,especially in the northern and southern polar regions, scientists have created amagnetic storm scale that is much like the scales that other scientists use tomeasure hurricanes and tornadoes. The scale was designed in 1939 by theGerman physicist Julius Bartles and we now call it the 'Kp' scale. Another,easier to use, 'Ap' index is directly related to the amount of change in themagnetic field, and is measured in units of nano-Tesslas.
In the previous activity, we measured the largest magnetic change thatoccurred in a three-hour period on July 12, 2002 based on the measurementsfrom five magnetic observatories. Every three hours, the observatories identifythe largest change in Earth's magnetic field at ground level, then by averagingthese numbers together with the several dozen other observatorymeasurements around the globe, an average magnetic storm value in nano-Tesslas is found. This is then converted into the Kp index by using a table.
When an aurora is occurring, the Kp index is usually higher than about 6or 7. Whenever these values are exceeded during any 3-hour period, thisusually means that an aurora is in progress or will soon be visible.
Benchmarks:6-8 Technology is essential to science for such purposes as access to outerspace, sample collection, measurement, storage and computation.6-8 Most of what goes on in the universe involves some form of energybeing transformed into another.6-8 Graphs can show a variety of possible relationships between twovariables.9-12 Sometimes scientists can control conditions in order to obtainevidence. When that is not possible, they try to observe as wide a range ofnatural occurrences as possible to be able to discern patterns.9-12 Increasingly sophisticated technology is used to learn about theuniverse.9-12 Use charts and graphs in making claims in oral and writtenpresentations.
Activity 8 How to Predict an Aurora
IMAGE Exploring the Northern Lights 42
Objective:The students read and interpret graphs, average data values, and use the
results to draw conclusions based on the data.
Materials:CalculatorAccess to the internet
Procedures:1. Provide each student with a copy of the student page.2. Guide students through the May 27, 2002 exercise on the teacher page.3. Permit time and access to the internet to complete the exercises.4. Discuss the student results and compare their analysis of the data.5. Provide time for the students to develop a written summary.6. Students can present their summary.
Selected Answers:
1...April 19, 2002Ap= ( 27 + 27 + 27 + 80 + 80 + 48 + 48 + 48)/ 8 Ap = 48 Kp = 5
2...April 20, 2002Ap= (140 + 140 + 140 + 80 + 27 + 27 + 27 + 7)/8 Ap = 74 Kp = 5
3...July 13, 2000Ap= (7 + 7 + 15 + 48 + 140 + 48 + 7 + 15)/ 8 Ap = 36 Kp = 4
4...July 14, 2000Ap=( 27 + 15 + 27 + 27 + 27 + 80 + 48 + 27)/8 Ap = 35 Kp = 4
5...July 15, 2000Ap= (27 + 27 + 48 + 48 + 80 + 400 + 400)/ 8 Ap= 129 Kp = 6
Conclusions:Students should note that when the Ap value is larger, there is a much more
observable auroral oval in the IMAGE data. The May 27, 2002 date had very littlenoticeable auroral oval and a low Ap value of 28. In contrast, in 2000 on July 14 and 15ththere was a very significant oval and a very high A value of 129 . Furthermore, on the Kpindex graphs, there were a number of Kp values that were 9 in July 2000 versus nothinghigher than a 5 in May 2002.
Current Kp index plots are available at:http://www.sec.noaa.gov/rt_plots/kp_3d.html
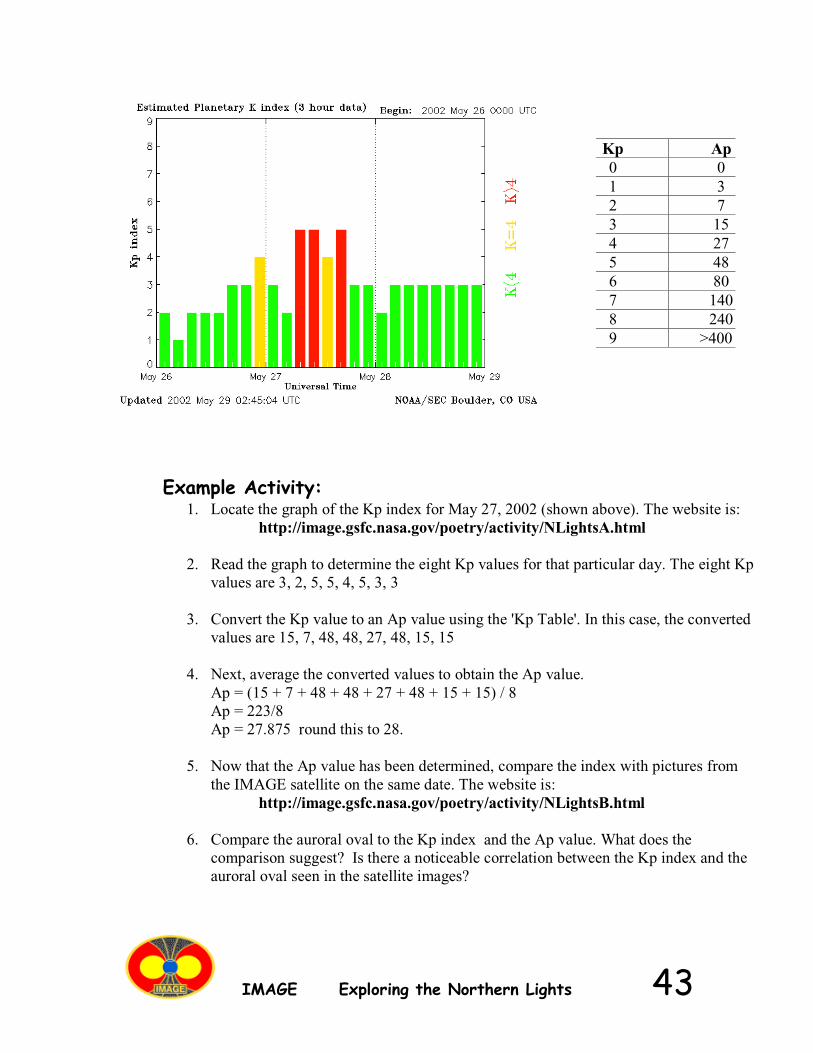
IMAGE Exploring the Northern Lights 43
Kp Ap0 01 32 73 154 275 486 807 1408 2409 >400
Example Activity:1. Locate the graph of the Kp index for May 27, 2002 (shown above). The website is:
http://image.gsfc.nasa.gov/poetry/activity/NLightsA.html
2. Read the graph to determine the eight Kp values for that particular day. The eight Kpvalues are 3, 2, 5, 5, 4, 5, 3, 3
3. Convert the Kp value to an Ap value using the 'Kp Table'. In this case, the convertedvalues are 15, 7, 48, 48, 27, 48, 15, 15
4. Next, average the converted values to obtain the Ap value.Ap = (15 + 7 + 48 + 48 + 27 + 48 + 15 + 15) / 8Ap = 223/8Ap = 27.875 round this to 28.
5. Now that the Ap value has been determined, compare the index with pictures fromthe IMAGE satellite on the same date. The website is:
http://image.gsfc.nasa.gov/poetry/activity/NLightsB.html
6. Compare the auroral oval to the Kp index and the Ap value. What does thecomparison suggest? Is there a noticeable correlation between the Kp index and theauroral oval seen in the satellite images?
IMAGE Exploring the Northern Lights 44
Student Name __________________________________ Date ________________
In each of the following problems, locate the Kp graph for the given date, convertthe Kp values to an Ap value, and compare those two variables to the IMAGE datafor the corresponding dates. Analyze and compare the results for each of the givendates. Summarize the results in a written format. Be sure to include data andreasoning to support your conclusions.
Problem 1 April 19, 2002Kp graph and IMAGE data:
http://image.gsfc.nasa.gov/poetry/activity/NLights1.html
Problem 2 April 20, 2002Kp graph and IMAGE data:
http://image.gsfc.nasa.gov/poetry/activity/NLights2.html
Problem 3 July 13, 2000Kp graph and IMAGE data:
http://image.gsfc.nasa.gov/poetry/activity/NLights3.html
Problem 4 July 14, 2000Kp graph and IMAGE data:
http://image.gsfc.nasa.gov/poetry/activity/NLights4.html
Problem 5 July 15, 2000Kp graph and IMAGE data:
http://image.gsfc.nasa.gov/poetry/activity/NLights5.html
IMAGE Exploring the Northern Lights 45
Activity 9 Auroral Activity and Latitude
Objectives:Math is essential to science for such purposes as access to outer space,sample collection, measurement, storage, and computation.Graphs can show a variety of possible relationships between two variables.Find answers by substituting numerical values in simple algebraic formulas.Use computers for providing tables and graphs and for making spreadsheetcalculations.Find locations on maps using rectangular and polar coordinates.
Materials:Graphing calculatorStudent pageCalculator instruction pagesMap
Procedures:Students apply map reading skills to complete a table of values.Students graph the table of values and determine a possible correlationbetween the Kp index and the latitude of the auroral oval.Students use the graphing calculator (if available) or determine a line of bestfit based on the data values.Students draw the line of best fit.Students use the line of best fit to determine various latitudes given a specificKp index value.Students use the equation for the line of best fit to calculate the latitude for agiven Kp value. Students use the equation for the line of best fit to calculatethe Kp index when the latitude is given.Students write a summary of the correlation between the Kp index and thelatitude of the auroral oval.
Over the last 100 years, scientists have recognized that there is arelationship between the appearance of the aurora and the amount ofdisturbance to Earth's magnetic field. As the magnetic field becomes moredisturbed, the Northern Lights will be visible the farther south from the Arcticregion. By measuring these disturbances, we can predict what the latitude ofthe southern edge of the Northern Lights will be. This activity lets studentsuse a geographic plot of aurora location and activity, to create their ownforecasting relationship for a selected longitude in North America.
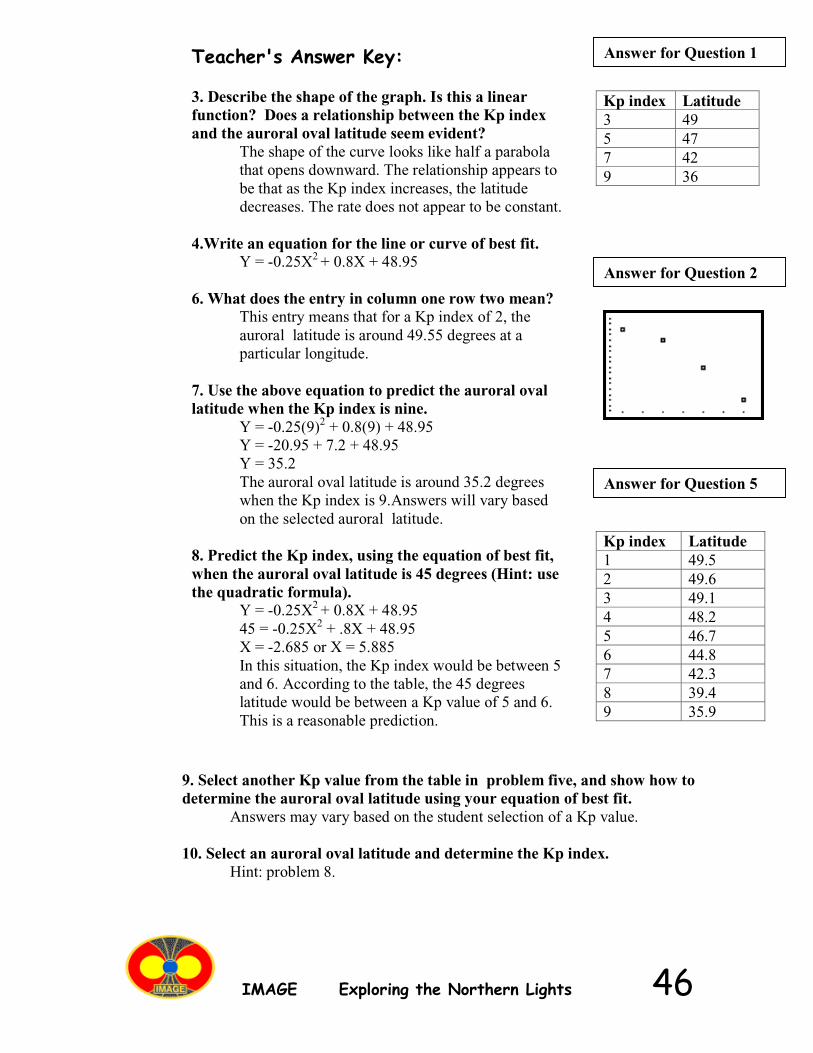
IMAGE Exploring the Northern Lights 46
Teacher's Answer Key:
3. Describe the shape of the graph. Is this a linearfunction? Does a relationship between the Kp indexand the auroral oval latitude seem evident?
The shape of the curve looks like half a parabolathat opens downward. The relationship appears tobe that as the Kp index increases, the latitudedecreases. The rate does not appear to be constant.
4.Write an equation for the line or curve of best fit.Y = -0.25X2 + 0.8X + 48.95
6. What does the entry in column one row two mean?This entry means that for a Kp index of 2, theauroral latitude is around 49.55 degrees at aparticular longitude.
7. Use the above equation to predict the auroral ovallatitude when the Kp index is nine.
Y = -0.25(9)2 + 0.8(9) + 48.95Y = -20.95 + 7.2 + 48.95Y = 35.2The auroral oval latitude is around 35.2 degreeswhen the Kp index is 9.Answers will vary basedon the selected auroral latitude.
8. Predict the Kp index, using the equation of best fit,when the auroral oval latitude is 45 degrees (Hint: usethe quadratic formula).
Y = -0.25X2 + 0.8X + 48.9545 = -0.25X2 + .8X + 48.95X = -2.685 or X = 5.885In this situation, the Kp index would be between 5and 6. According to the table, the 45 degreeslatitude would be between a Kp value of 5 and 6.This is a reasonable prediction.
Kp index Latitude3 495 477 429 36
Kp index Latitude1 49.52 49.63 49.14 48.25 46.76 44.87 42.38 39.49 35.9
9. Select another Kp value from the table in problem five, and show how todetermine the auroral oval latitude using your equation of best fit.
Answers may vary based on the student selection of a Kp value.
10. Select an auroral oval latitude and determine the Kp index.Hint: problem 8.
Answer for Question 1
Answer for Question 2
Answer for Question 5
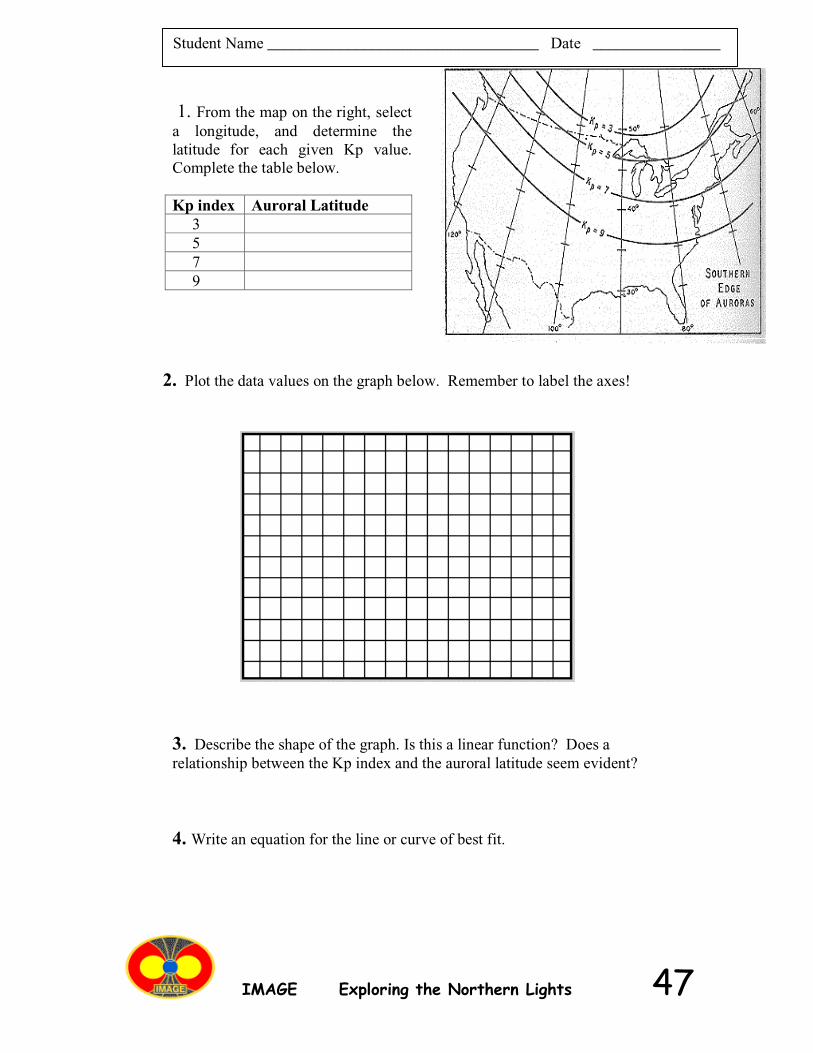
IMAGE Exploring the Northern Lights 47
1. From the map on the right, selecta longitude, and determine thelatitude for each given Kp value.Complete the table below.
Kp index Auroral Latitude3579
2. Plot the data values on the graph below. Remember to label the axes!
3. Describe the shape of the graph. Is this a linear function? Does arelationship between the Kp index and the auroral latitude seem evident?
4. Write an equation for the line or curve of best fit.
Student Name __________________________________ Date ________________
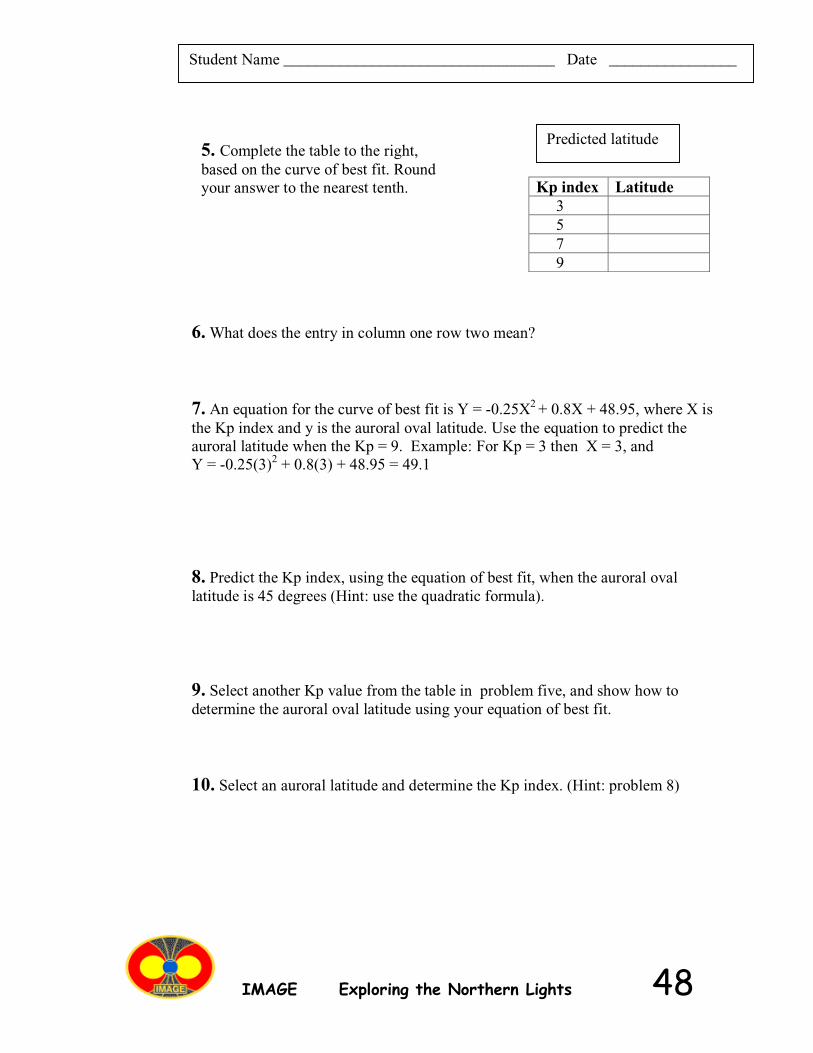
IMAGE Exploring the Northern Lights 48
Student Name __________________________________ Date ________________
6. What does the entry in column one row two mean?
7. An equation for the curve of best fit is Y = -0.25X2 + 0.8X + 48.95, where X isthe Kp index and y is the auroral oval latitude. Use the equation to predict theauroral latitude when the Kp = 9. Example: For Kp = 3 then X = 3, andY = -0.25(3)2 + 0.8(3) + 48.95 = 49.1
8. Predict the Kp index, using the equation of best fit, when the auroral ovallatitude is 45 degrees (Hint: use the quadratic formula).
9. Select another Kp value from the table in problem five, and show how todetermine the auroral oval latitude using your equation of best fit.
10. Select an auroral latitude and determine the Kp index. (Hint: problem 8)
Kp index Latitude3579
Predicted latitude5. Complete the table to the right,based on the curve of best fit. Roundyour answer to the nearest tenth.
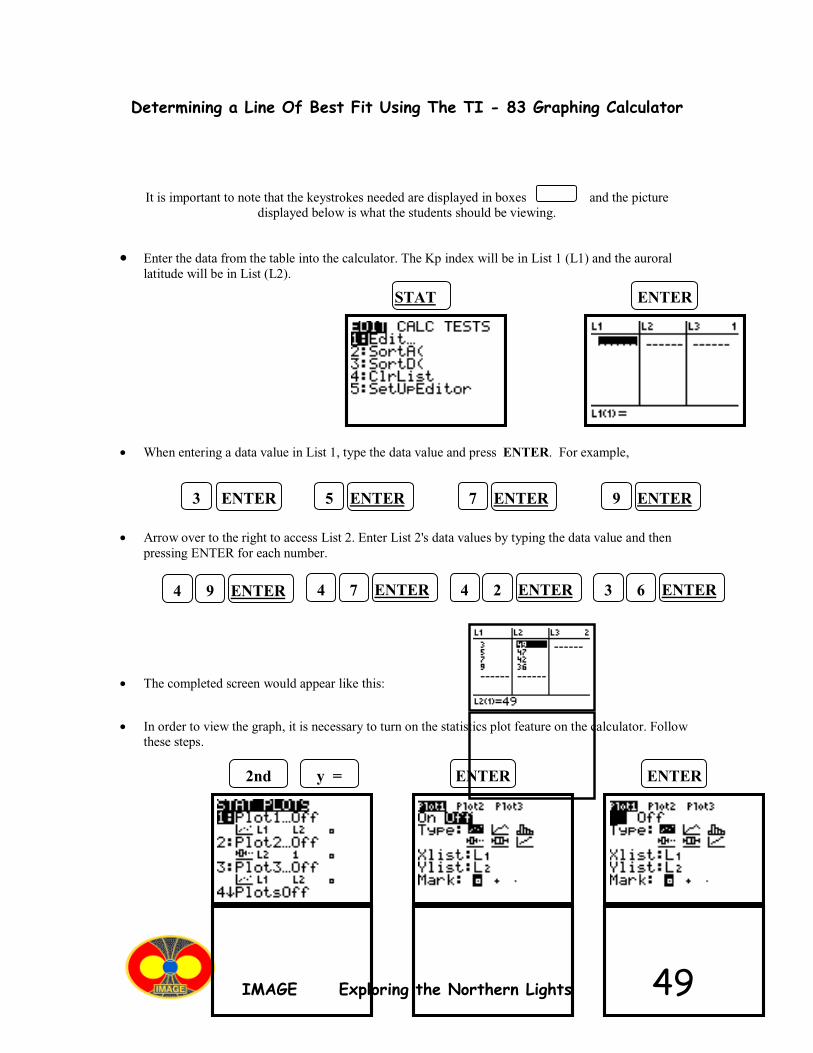
IMAGE Exploring the Northern Lights 49
Determining a Line Of Best Fit Using The TI - 83 Graphing Calculator
It is important to note that the keystrokes needed are displayed in boxes and the picturedisplayed below is what the students should be viewing.
• Enter the data from the table into the calculator. The Kp index will be in List 1 (L1) and the aurorallatitude will be in List (L2).
• When entering a data value in List 1, type the data value and press ENTER. For example,
• Arrow over to the right to access List 2. Enter List 2's data values by typing the data value and thenpressing ENTER for each number.
• The completed screen would appear like this:
• In order to view the graph, it is necessary to turn on the statistics plot feature on the calculator. Followthese steps.
9 ENTER4 7 ENTER4 2 ENTER4 6 ENTER3
3 ENTER 5 ENTER 7 ENTER 9 ENTER
STAT ENTER
2nd y = ENTERENTER
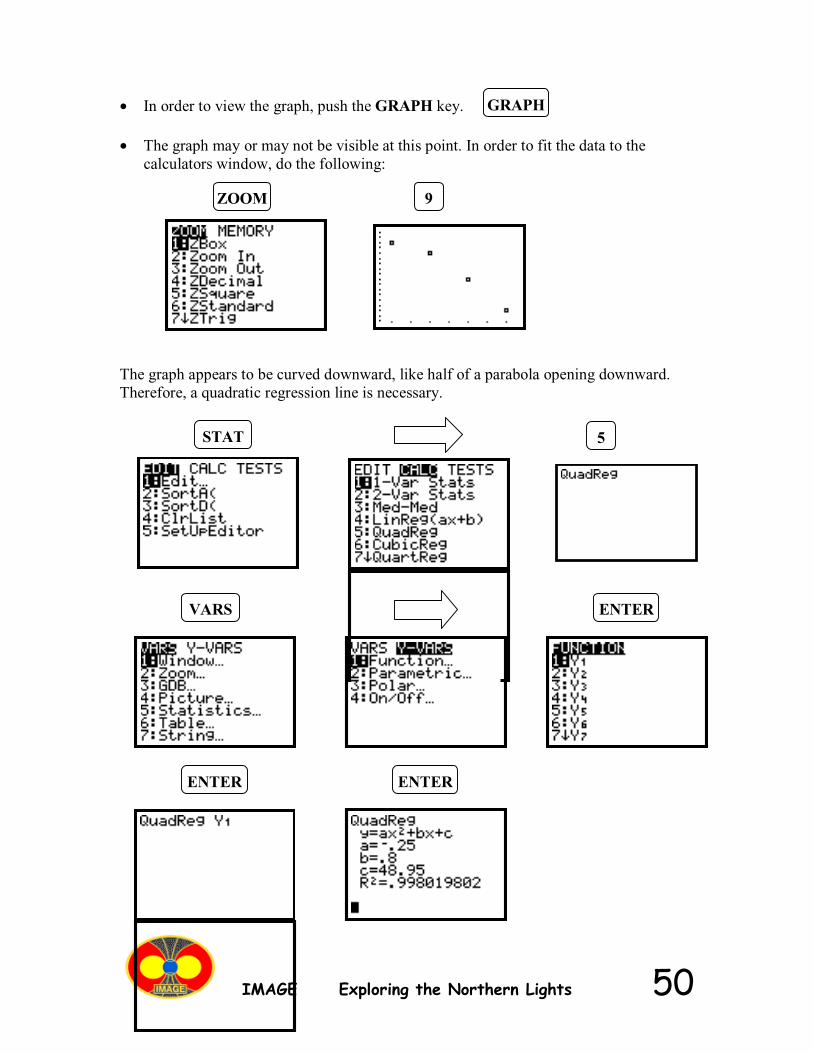
IMAGE Exploring the Northern Lights 50
• In order to view the graph, push the GRAPH key.
• The graph may or may not be visible at this point. In order to fit the data to thecalculators window, do the following:
The graph appears to be curved downward, like half of a parabola opening downward.Therefore, a quadratic regression line is necessary.
GRAPH
ZOOM 9
STAT 5
VARS ENTER
ENTERENTER
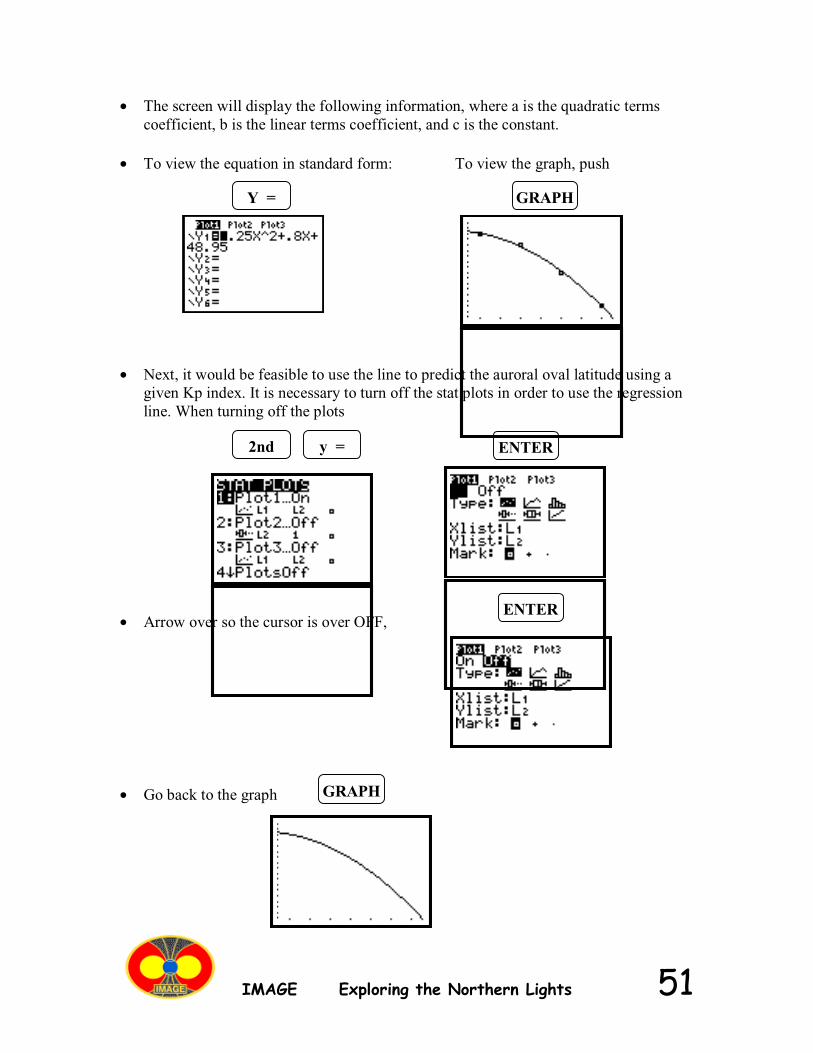
IMAGE Exploring the Northern Lights 51
• The screen will display the following information, where a is the quadratic termscoefficient, b is the linear terms coefficient, and c is the constant.
• To view the equation in standard form: To view the graph, push
• Next, it would be feasible to use the line to predict the auroral oval latitude using agiven Kp index. It is necessary to turn off the stat plots in order to use the regressionline. When turning off the plots
• Arrow over so the cursor is over OFF,
• Go back to the graph
Y = GRAPH
2nd y = ENTER
ENTER
GRAPH
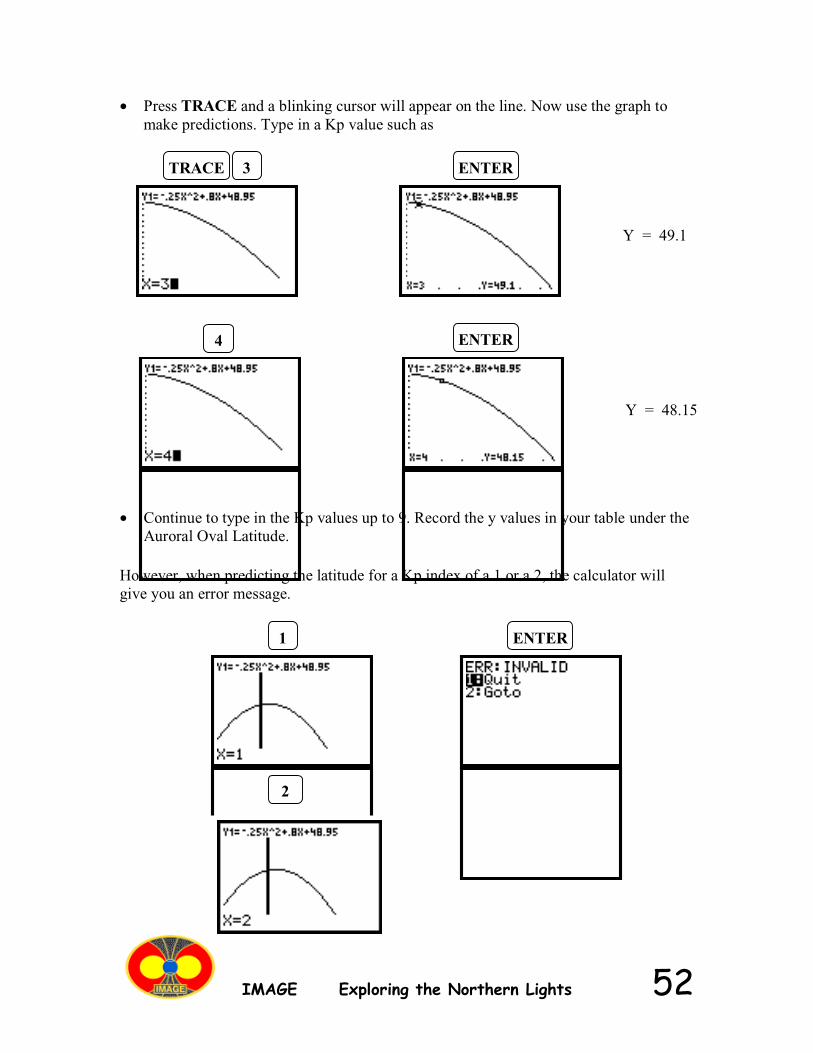
IMAGE Exploring the Northern Lights 52
• Press TRACE and a blinking cursor will appear on the line. Now use the graph tomake predictions. Type in a Kp value such as
• Continue to type in the Kp values up to 9. Record the y values in your table under theAuroral Oval Latitude.
However, when predicting the latitude for a Kp index of a 1 or a 2, the calculator willgive you an error message.
Y = 49.1
Y = 48.15
3TRACE ENTER
4 ENTER
ENTER1
2
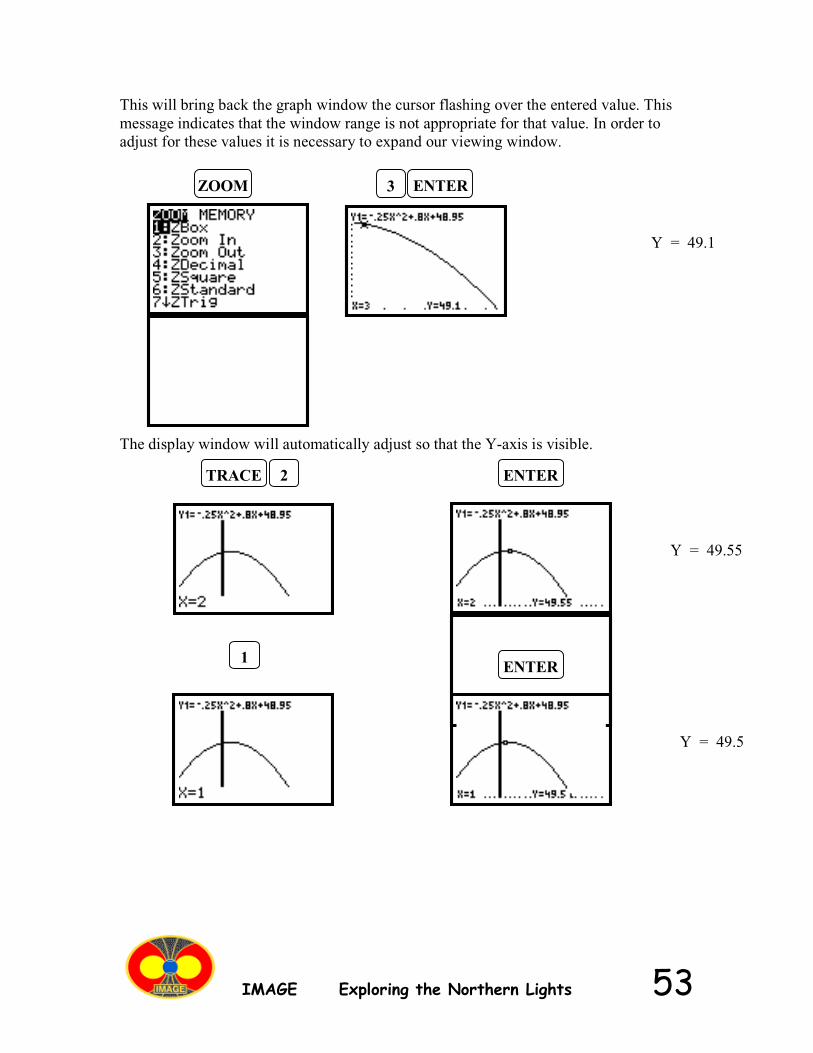
IMAGE Exploring the Northern Lights 53
This will bring back the graph window the cursor flashing over the entered value. Thismessage indicates that the window range is not appropriate for that value. In order toadjust for these values it is necessary to expand our viewing window.
The display window will automatically adjust so that the Y-axis is visible.
ZOOM 3 ENTER
ENTER
ENTER
2TRACE
1
Y = 49.1
Y = 49.55
Y = 49.5
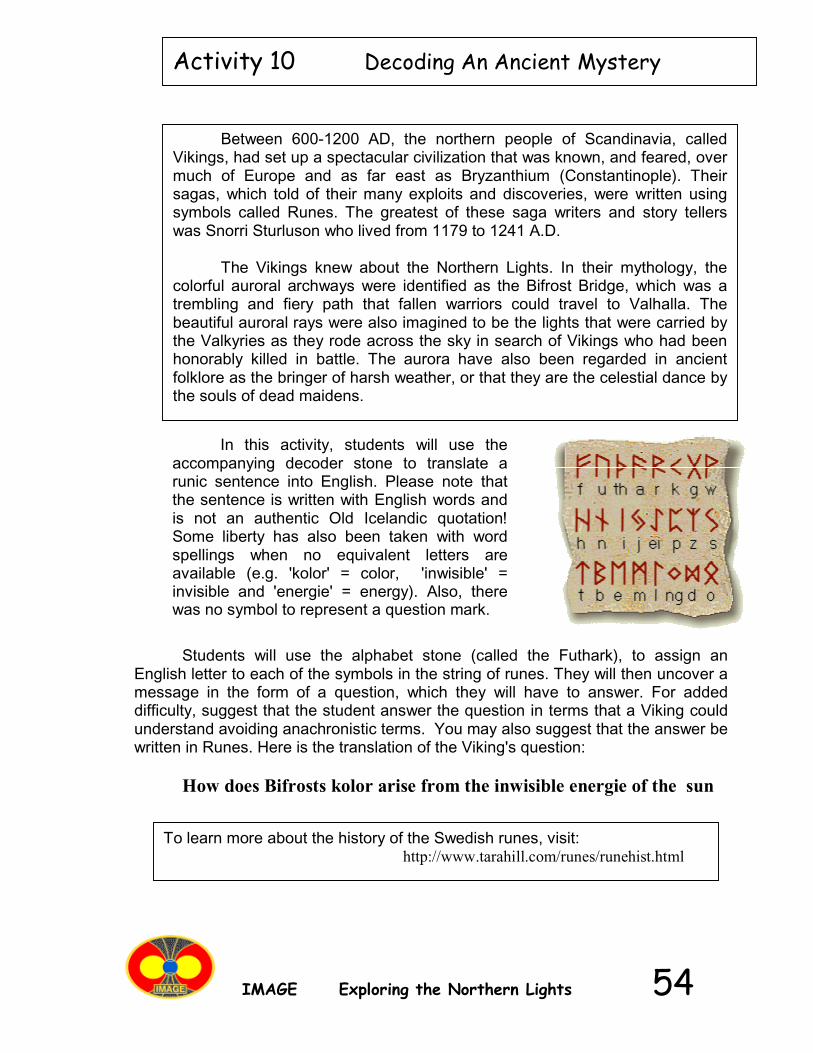
IMAGE Exploring the Northern Lights 54
To learn more about the history of the Swedish runes, visit:http://www.tarahill.com/runes/runehist.html
Between 600-1200 AD, the northern people of Scandinavia, calledVikings, had set up a spectacular civilization that was known, and feared, overmuch of Europe and as far east as Bryzanthium (Constantinople). Theirsagas, which told of their many exploits and discoveries, were written usingsymbols called Runes. The greatest of these saga writers and story tellerswas Snorri Sturluson who lived from 1179 to 1241 A.D.
The Vikings knew about the Northern Lights. In their mythology, thecolorful auroral archways were identified as the Bifrost Bridge, which was atrembling and fiery path that fallen warriors could travel to Valhalla. Thebeautiful auroral rays were also imagined to be the lights that were carried bythe Valkyries as they rode across the sky in search of Vikings who had beenhonorably killed in battle. The aurora have also been regarded in ancientfolklore as the bringer of harsh weather, or that they are the celestial dance bythe souls of dead maidens.
In this activity, students will use theaccompanying decoder stone to translate arunic sentence into English. Please note thatthe sentence is written with English words andis not an authentic Old Icelandic quotation!Some liberty has also been taken with wordspellings when no equivalent letters areavailable (e.g. 'kolor' = color, 'inwisible' =invisible and 'energie' = energy). Also, therewas no symbol to represent a question mark.
Students will use the alphabet stone (called the Futhark), to assign anEnglish letter to each of the symbols in the string of runes. They will then uncover amessage in the form of a question, which they will have to answer. For addeddifficulty, suggest that the student answer the question in terms that a Viking couldunderstand avoiding anachronistic terms. You may also suggest that the answer bewritten in Runes. Here is the translation of the Viking's question:
How does Bifrosts kolor arise from the inwisible energie of the sun
Activity 10 Decoding An Ancient Mystery
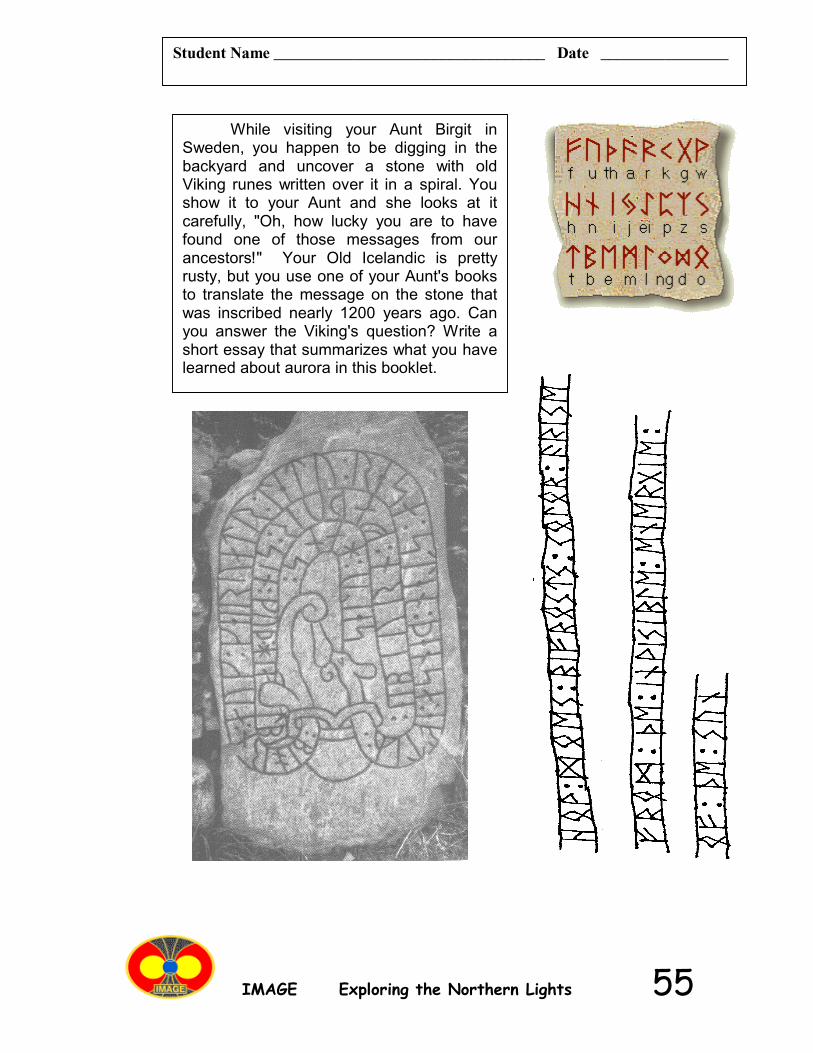
IMAGE Exploring the Northern Lights 55
While visiting your Aunt Birgit inSweden, you happen to be digging in thebackyard and uncover a stone with oldViking runes written over it in a spiral. Youshow it to your Aunt and she looks at itcarefully, "Oh, how lucky you are to havefound one of those messages from ourancestors!" Your Old Icelandic is prettyrusty, but you use one of your Aunt's booksto translate the message on the stone thatwas inscribed nearly 1200 years ago. Canyou answer the Viking's question? Write ashort essay that summarizes what you havelearned about aurora in this booklet.
Student Name __________________________________ Date ________________
IMAGE Exploring the Northern Lights 56
Useful Web Resources
Exploratorium "Auroras:Paintings in the Sky"http://www.exploratorium.edu/learning_studio/auroras/
Archive of aurora photos by Jan Curtis:http://www.geo.mtu.edu/weather/aurora/images/aurora/jan.curtis/
Archive of aurora photos by Dick Hutchinson:http://www.ptialaska.net/~hutch/aurora.html
Space Weather Today:http://www.spaceweather.com/
IMAGE real-time aurora images from space:http://image.gsfc.nasa.gov/poetry/today/intro.htmlhttp://www.sec.noaa.gov/IMAGE/http://sprg.ssl.berkeley.edu/image/
NOAA Auroral Activity monitor:http://www.sec.noaa.gov/pmap/index.html
CANOPUS real-time auroral monitor:http://www.dan.sp-agency.ca/www/rtoval.htm#TOPOFPAGE
Current solar activity report:http://www.dxlc.com/solar/
Alaska Science Aurora page for kids:http://www.alaskascience.com/aurora.htm
Human Impacts of Space Weather:http://image.gsfc.nasa.gov/poetry/weather01.html
Ask the Space Scientist:http://image.gsfc.nasa.gov/poetry/ask/askmag.html
More classroom activities:http://image.gsfc.nasa.gov/poetry/activities.html
The Northern Lights Essay Competition:http://image.gsfc.nasa.gov/poetry/alaska/alaska.html