Embed Size (px)
Citation preview
THE NORTH WEST COMPANY INC. 2011
Management’sDiscussion & Analysis
Delivering on our promise

CGAAP Year Ended Year Ended
(1) Year Ended($ in thousands, except per share information) January 31, 2012 January 31, 2011 January 31, 2010
RESULTS FOR THE YEARSales $ 1,495,136 $ 1,448,104 $ 1,444,366
Same store sales % increase (2) 3.3% 2.7% 0.1%
Trading profit (3) (EBITDA) $ 125,881 $ 125,764 $ 130,274
Earnings from operations (3) (EBIT) 89,309 90,272 95,124
Net earnings 57,961 69,656 81,813
Cash flow from operating activities 114,658 114,564 107,973
FINANCIAL POSITION Total assets $ 626,917 $ 616,588 $ 623,800
Total debt 175,892 192,596 209,170
Total equity 283,709 286,475 289,926
FINANCIAL RATIOS Debt-to-equity .62:1 .67:1 .72:1
Return on net assets (3) 18.5% 17.9% 18.7%
Return on average equity (3) 20.1% 24.1% 29.3%
Sales blend: Food 76.4% 76.4% 77.2%
General Merchandise 20.2% 20.3% 19.8%
Other 3.4% 3.3% 3.0%
PER SHARE ($) - DILUTED (4) Trading profit (3) (EBITDA) $ 2.59 $ 2.59 $ 2.69
Net earnings 1.19 1.44 1.69
Cash flow from operating activities 2.36 2.36 2.23
Market price: January 31 19.40 21.09 17.94
high 22.50 23.00 19.60
low 17.85 17.02 14.88
(1) The January 31, 2011 comparative figures previously reported in accordance with Canadian generally accepted accounting principles (CGAAP) have been restated to conform with International Financial Reporting Standards (IFRS). An explanation of the transition from CGAAP to IFRS is provided in Note 24 to the January 31, 2012 consolidated financial statements. The financial information for the fiscal years 2007 to 2009 was prepared in accordance with CGAAP and has not been restated.
(2) Same store sales, excluding the foreign exchange impact(3) See Non-GAAP financial measures section on page 26(4) Effective January 1, 2011, North West Company Fund converted to a share corporation called The North West Company Inc. The comparative information
refers to the units of the Fund. See conversion to a share corporation on page 7 for further information.
Financial HighlightsAll currency figures in this report are in Canadian dollars, unless otherwise noted
1,500
1,250
1,000
750
500
250
0
Sales (1)
($ in millions)
1.50
1.25
1.00
0.75
0.50
0.25
0
Cash Dividends/DistributionsPer Share/Unit - Diluted ($)
1,064
150
125
100
75
50
25
0
Trading Profit (1)
($ in millions)
107
1221.13
20112007 2008 2009 2010
1,3931,444 1,448 1,495
20112007 2008 2009 2010
130 126 126
20112007 2008 2009 2010
1.40 1.39 1.42
1.05

Management’s Discussion & Analysis TABLE OF CONTENTS
THE NORTH WEST COMPANY INC. 2011
Management’s Discussion & Analysis
Forward-Looking Statements ......................................................................................... 2
Our Business Today, Vision and Principles ...................................................... 3
Strategies .............................................................................................................................................4
Key Performance Drivers and Capabilities to Deliver Results .............6
Conversion to a Share Corporation .......................................................................... 7
Consolidated Results ............................................................................................................... 7
Canadian Operations ........................................................................................................... 10
International Operations ................................................................................................... 12
Consolidated Liquidity and Capital Resources ...........................................13
Quarterly Financial Information ..................................................................................18
Disclosure Controls ................................................................................................................19
Internal Controls over Financial Reporting .....................................................19
Outlook ................................................................................................................................................19
Risk Management .....................................................................................................................19
Critical Accounting Estimates ....................................................................................23
Transition to International Financial Reporting Standards (IFRS) .....................................................................................24
Future Accounting Standards .......................................................................................25
Non-GAAP Financial Measures ...............................................................................26
Glossary of Terms ...................................................................................................................27
Unless otherwise stated, this Management’s Discussion & Analysis
(“MD&A”) for The North West Company Inc. (“NWC”) or its
predecessor North West Company Fund (“NWF” or “Fund”)
and its subsidiaries (collectively, “North West Company”,
the “Company”, “North West”, or “NWC”) is based on, and
should be read in conjunction with, the 2011 annual audited
consolidated financial statements and accompanying notes. The
Company’s annual audited consolidated financial statements and
accompanying notes for the year ended January 31, 2012 are in
Canadian dollars, except where otherwise indicated, and are the
first annual audited consolidated financial statements prepared
in accordance with International Financial Reporting Standards
(“IFRS”). Due to the transition to IFRS, comparative figures for
the year ended January 31, 2011 (“2010”) that were previously
reported in the consolidated financial statements prepared
in accordance with Canadian generally accepted accounting
principles (“CGAAP”) have been restated to conform with the
accounting policies and financial statement presentation adopted
under IFRS. The financial information for the fiscal years 2009 and
prior was prepared in accordance with CGAAP and has not been
restated. Further information on the transition to IFRS and the
impact on the Company’s financial statements is provided in Note
24 to the consolidated financial statements.
The Board of Directors, on the recommendation of its Audit
Committee, approved the contents of this MD&A on April 9, 2012
and the information contained in this MD&A is current to April 9,
2012, unless otherwise stated.
Forward-Looking Statements This MD&A contains
forward-looking statements about North West including its
business operations, strategy and expected financial performance
and condition. Forward-looking statements include statements
that are predictive in nature, depend upon or refer to future events
or conditions, or include words such as “expects”, “anticipates”,
“plans”, “believes”, “estimates”, “intends”, “targets”, “projects”,
“forecasts” or negative versions thereof and other similar
expressions, or future or conditional future financial performance
(including sales, earnings, growth rates, dividends, debt levels,
financial capacity, access to capital, and liquidity), ongoing
business strategies or prospects, and possible future action by the
Company, are also forward-looking statements. Forward-looking
statements are based on current expectations and projections
about future events and are inherently subject to, among other
things, risks, uncertainties and assumptions about the Company,
economic factors and the retail industry in general. They are
not guarantees of future performance, and actual events and
results could differ materially from those expressed or implied by
forward-looking statements made by the Company due to, but not
limited to, important factors such as general economic, political
and market factors in North America and internationally, interest
and foreign exchange rates, changes in accounting policies and
methods used to report financial condition, including uncertainties
associated with critical accounting assumptions and estimates,
the effect of applying future accounting changes, business
competition, technological change, changes in government
2 T H E N O RT H W E S T CO M PA N Y I N C . 2 0 1 1
regulations and legislation, changes in tax laws, unexpected
judicial or regulatory proceedings, catastrophic events, the
Company’s ability to complete strategic transactions and
integrate acquisitions and the Company’s success in anticipating
and managing the foregoing risks. The reader is cautioned that
the foregoing list of important factors is not exhaustive. Other
risks are outlined in the Risk Management section of this MD&A
and in the Risk Factors sections of the Annual Information Form.
The reader is also cautioned to consider these and other factors
carefully and not place undue reliance on forward-looking
statements. Other than as specifically required by applicable law,
the Company has no specific intention to update any forward-
looking statements whether as a result of new information, future
events or otherwise.
Additional information on the Company, including our Annual
Information Form, can be found on SEDAR at www.sedar.com or
on the Company’s website at www.northwest.ca.

OUR BUSINESS TODAY
The North West Company is a leading retailer to underserved rural communities and urban neighbourhood markets in the following regions: northern Canada, western Canada, rural Alaska, the South Pacific islands and the Caribbean. Our stores offer a broad range of products and services with an emphasis on food. Our value offer is to be the best local shopping choice for everyday household and local lifestyle needs. North West’s core strengths include: our ability to adapt our product mix to each market we serve; our logistics expertise in moving product to, and operating stores within, remote or difficult-to-reach locations; our knowledge in serving indigenous and lower-income customers; and our ability to apply these strengths to serve customers within complementary niche businesses. North West has a rich enterprising legacy as one of the longest continuing retail enterprises in the world. The Company traces its roots back to 1668 with many of our store locations in northern Canada and Alaska having been in operation for over 200 years. Today these northern stores serve communities with populations from 500 to 8,000. A typical store is 7,500 square feet in size and offers food, family apparel, housewares, appliances, outdoor products and services such as post offices, income tax return preparation, quick-service prepared food, commercial business sales, money transfers and cheque cashing. Growth at North West has come from market share expansion within existing locations and from applying our expertise and infrastructure to new markets and complementary businesses. The latter includes wholesaling to independent stores, opening Giant Tiger junior discount stores in rural communities and urban neighbourhoods in western Canada, and our late 2007 acquisition of Cost-U-Less, Inc. (“CUL”), a chain of mid-sized warehouse format stores serving the South Pacific islands and the Caribbean. A key strength and ongoing strategy of North West is to adapt to unique local lifestyles, cultures and selling opportunities better than our competition. Store development flexibility, store management selection and learning programs, store-level merchandise ordering, community relations and profit-sharing incentive plans are all ingredients of the model we have built to support this leading market position. We believe that continued, efficient enhancement of our execution skills in general and our localization skills specifically, are essential components in effectively meeting the customer needs within each market we serve.
North West delivers its products and services through the following retail banners and wholesale businesses, in two reporting segments:
Canadian Operations• 123 Northern stores, offering a combination of food, financial
services and general merchandise to remote northern Canadian communities;
• 36 Giant Tiger junior discount stores, offering family fashion, household products and food to urban neighbourhoods and larger rural centers in western Canada;
• 7 NorthMart stores, targeted at larger northern markets with an emphasis on an expanded selection of fresh foods, fashion and health products and services;
• 12 Quickstop convenience stores, offering ready-to-eat foods, petroleum products and related services;
• 1 Valu Lots clearance center; • 1 Solo Market store, targeted at less remote, rural markets; • 1 NorthMart Drug Store, a stand-alone pharmacy and
convenience store combination; • Crescent Multi Foods (CMF), a distributor of produce and
fresh meats to independent grocery stores in Saskatchewan, Manitoba and northwestern Ontario;
• 2 North West Company Fur Marketing outlets, trading in wild furs and offering Aboriginal handicrafts and authentic Canadian heritage products; and
• The Inuit Art Marketing Service, Canada’s largest distributor of Inuit art.
International Operations • 30 AC Value Centers, stores similar to Northern and NorthMart,
offering a combination of food and general merchandise to communities across remote and rural regions of Alaska;
• 3 Quickstop convenience stores; • Pacific Alaska Wholesale (formerly Frontier Expeditors and
SPAN Alaska), a leading distributor to independent grocery stores and individual households in rural Alaska;
• 12 Cost-U-Less (CUL), mid-sized warehouse stores, offering discount food and general merchandise products to island communities in the South Pacific and the Caribbean; and
• 1 Island Fresh Supermarket, neighborhood store offering convenience with an emphasis on fresh and prepared foods.
VISION
At North West our mission is to be a trusted community store of choice. Our vision is to be a leading community retailer within underserved and less developed markets by providing customers with the ability and desire to shop locally with us for the widest possible range of products and services that meet their everyday needs. We do this by being more accessible and convenient, more locally flexible, friendlier and having the lowest local cost, enabled by lean, innovative processes. For our associates, we want to be a preferred, fulfilling place to work. For our investors, we want to deliver superior, top-quartile returns over the long term.
Management’s Discussion & Analysis
M A N AG E M E N T ’ S D I S CU S S I O N & A N A LYS I S 3
PRINCIPLES
The way we work at North West is shaped by six core principles: Customer Driven, Enterprising, Passion, Accountability, Trust, and Personal Balance.
Customer Driven is our practice of always looking through the eyes of our customers while recognizing our stores’ unique role as a supportive community citizen.Enterprising is our spirit of innovation, improvement and growth, reflected in our unrelenting focus on new products, services and processes. Passion refers to our connection to our work, our role as a community store and our opportunity to do great things at North West.Accountability is our management approach to getting work done through clear roles, tasks and resources.Trust at North West means doing what you say you will do, with fairness, integrity and respect.Personal Balance is our commitment to sustaining ourselves and our organization, so that we work effectively for our customers and communities over the long term.
STR ATEGIES
The strategies at North West reflect our total return approach to performance. We place an equal emphasis on growth and income yield in delivering top-quartile total returns to investors. Investment opportunities are considered in terms of their ability to sustain an attractive current cash return in addition to growth prospects. The Company’s long-range plans (“LRP”) are developed in multi-year cycles and are reviewed and adjusted on an annual basis or as required at the senior management and board levels. 2009 was the start of a LRP cycle and included an in-depth assessment of North West’s past performance, opportunity gaps within each business segment, and new business growth potential. As a result of our 2009 LRP work, we identified operational excellence as the first priority within our existing retail network, themed as “More Growth in Store”. This finding and subsequent direction-setting is based on gaps that we see within our current store base which, if effectively addressed, will deliver attractive financial returns over the next three to five years and set the foundation for new market, product and service growth over the long term. The strategic rationale for this approach fully considered our past successes and unrealized opportunities. Over the past five years, food market share and margin rates increased through better sourcing, through more store-branded products that offered a value alternative to national brands and by building on our store-level capability with training, new technology and best practices. Our food growth strategy was augmented by opportunistically pursuing complimentary everyday products and services. These included financial services, post offices, fuel and pharmacies. New store growth was achieved by acquiring independent stores in northern Canada and Alaska, through Giant Tiger store expansion in western Canada and through our acquisition of CUL in late 2007.
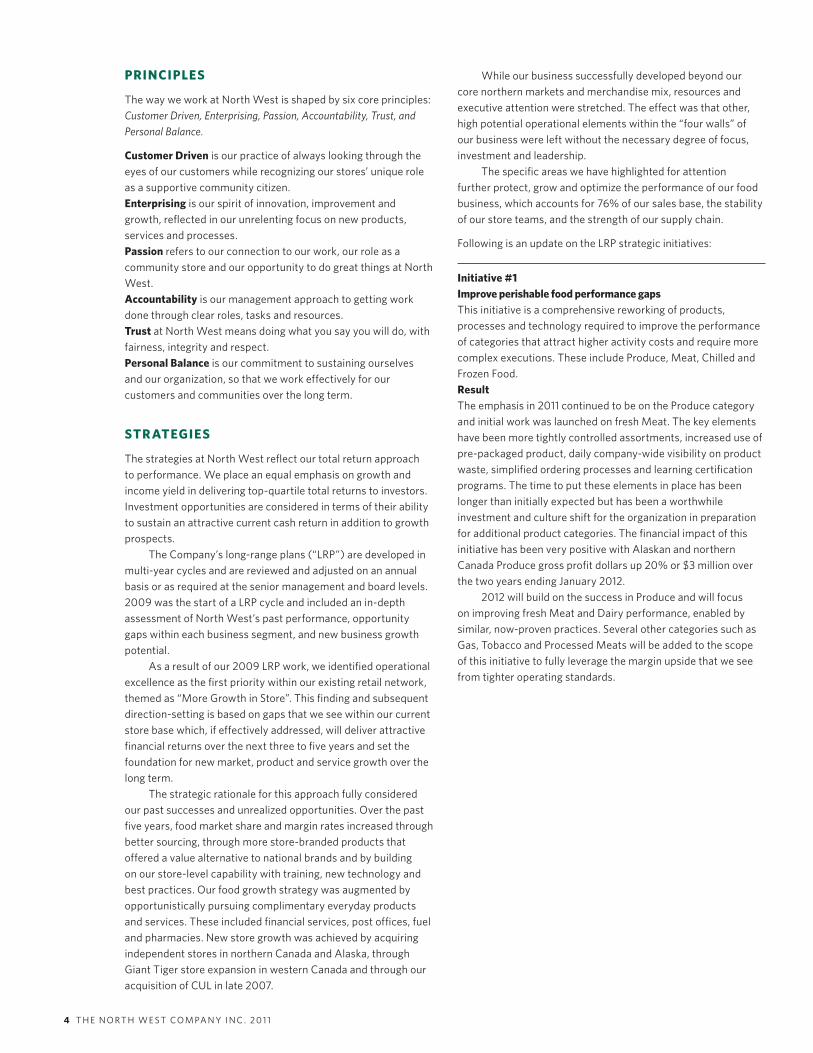
While our business successfully developed beyond our core northern markets and merchandise mix, resources and executive attention were stretched. The effect was that other, high potential operational elements within the “four walls” of our business were left without the necessary degree of focus, investment and leadership. The specific areas we have highlighted for attention further protect, grow and optimize the performance of our food business, which accounts for 76% of our sales base, the stability of our store teams, and the strength of our supply chain.
Following is an update on the LRP strategic initiatives:
Initiative #1Improve perishable food performance gapsThis initiative is a comprehensive reworking of products, processes and technology required to improve the performance of categories that attract higher activity costs and require more complex executions. These include Produce, Meat, Chilled and Frozen Food.ResultThe emphasis in 2011 continued to be on the Produce category and initial work was launched on fresh Meat. The key elements have been more tightly controlled assortments, increased use of pre-packaged product, daily company-wide visibility on product waste, simplified ordering processes and learning certification programs. The time to put these elements in place has been longer than initially expected but has been a worthwhile investment and culture shift for the organization in preparation for additional product categories. The financial impact of this initiative has been very positive with Alaskan and northern Canada Produce gross profit dollars up 20% or $3 million over the two years ending January 2012. 2012 will build on the success in Produce and will focus on improving fresh Meat and Dairy performance, enabled by similar, now-proven practices. Several other categories such as Gas, Tobacco and Processed Meats will be added to the scope of this initiative to fully leverage the margin upside that we see from tighter operating standards.
4 T H E N O RT H W E S T CO M PA N Y I N C . 2 0 1 1
Initiative #2Optimize in-stock positionWhile the number one potential for customer satisfaction and margin improvement lies within our perishable categories, driving sales at North West depends on the strength of our convenience offer and our in-stock position. This priority is highlighted by the fact that 87% of our sales (excluding Giant Tiger) are in everyday consumable products. This initiative focuses on improving in-stock rates through technology-enabled tracking and ordering processes that were launched in the second half of 2010 and further refined in 2011 by adjusting product space allocations. Result2011 in-stock performance at our Alaskan and northern Canada stores improved by 580 basis points to 92% by year-end, on top of a significant basis point improvement achieved in 2010. Combined with a wider range of products now being measured under this initiative, the estimated annualized sales gain is $5 million or 1% of the food sales base of these divisions. In 2012, the in-stock initiative will cycle through a full year of the gains achieved in 2011 with additional, more modest improvements targeted for Alaskan and northern Canada and larger gains expected at Cost-U-Less as this becomes a focus point.
Initiative #3Ensure store teams stabilityWith such a diverse store network, our employees, especially at store level, have always made the difference at North West. Through our assessment, we identified a critical need to solidify our store teams so that they stay together longer in specific locations, deepening customer and community relationships, and building their business. For this to happen consistently, we are revamping recruitment, retention and store work processes to ensure we attract and keep highly productive, capable store personnel in key roles. This initiative specifically addresses the opportunity to optimize overall store performance by ensuring that a highly capable store team is in place and secure within each store location for an average time of at least three years. Similar to other “More Growth in Store” work, 2011 was an important year for putting plans into action to achieve desired stability levels in two thirds of our stores by year-end. ResultBy year-end, all of the targeted stores were on track to meet the stability criteria established for them. A key accomplishment was the recruitment of a record 37 store manager candidates by year-end, setting the stage for successful results in 2012 when the final third of our stores are targeted for completion. Capital spending on new and refurbished housing was $7 million in 2011 and will be $5 million in 2012 as part of an $18 million three-year investment to provide a higher-standard housing benefit for store management personnel recruited into the communities. Work was also completed on success profiles for all store manager positions at North West providing a solid, practical reference for future development and recruitment.
Initiative #4Be “priced right”We consider improved price management to be a strategic opportunity at North West, especially in our more remote banners. Market-based pricing is more difficult due to limited local shopping options in many of these locations, and this requires a deeper, more sophisticated understanding of consumer purchase behaviour relative to price. ResultA major project under this initiative was to establish and deliver price reductions on nutritious perishable foods qualifying for higher freight subsidies under a new Canadian federal government program (“Nutrition North”) that took effect on April 1, 2011. The price changes that directly resulted from this program, additional reductions from lower negotiated freight costs and a second round of lower prices under Nutrition North in October 2011 were all passed directly onto our customers. Food tonnage and sales gains from stores serving Nutrition North eligible markets were significant in 2011 as were sales in other product categories, demonstrating the impact of customers with lower living costs and more spending power created by Nutrition North items combined with the transportation cost efficiencies passed on by North West. In 2012 we will continue to find efficiencies that can further reduce our cost of business, helping our customers realize even more value for their dollar and attract more local shopping.
Initiative #5Build our supply chain advantageNorth West is a major shipper of merchandise and other freight into the remote markets that we serve. This creates an opportunity to work more collaboratively with our transportation partners to fully leverage our knowledge and forecasted volumes. The outcomes we expect from this strategy are improved product visibility and delivery service within a more productive and lower cost transportation network. ResultIn 2011, $4 million in outbound freight savings were achieved by consolidating freight that was previously shipped through the Canada Post system under the Canadian federal government’s previous food mail system and the negotiation of new routing and freight rates across the remainder of our distribution network in Canada. During the year, work was completed on the scope, design and selection of a technology provider for a $7 million transportation management system (“TMS”) investment. The TMS will initially track merchandise throughout our outbound Canadian supply chain and provide management with the necessary tools to proactively manage our diverse network of freight modes and carriers to achieve optimal load and routing configurations. We expect to be able to reduce our annual supply chain costs by a further $6 million over the 18 months beginning with TMS’ launch in late 2012.
M A N AG E M E N T ’ S D I S CU S S I O N & A N A LYS I S 5

Initiative #6Cascade our leadership principles into practicesWe consider our leadership principles in action to be the foundation for great, sustainable performance across all levels of our organization. From our cashiers to our buyers and store managers, we recognize the potential for measurable, effective practices that reflect these principles and align our work. Our work in 2011 carried forward this commitment to making leadership at North West deeper and more effective. ResultThroughout 2011, we continued to cascade our leadership principles and practices to our managers, supervisors and store management. The training sessions included 267 participants with on-going coaching and follow-up on usage and effectiveness of the practices. We have found that the practices are valued as practical, effective management tools that help people work better, based on common understood principles. 2012 will be a year of refining our leadership and management practices with emphasis on our 2012 theme of “Delivering on our Promise” and being even more sharply focused on the important work that we are committed to.
Beyond our “More Growth in Store” emphasis, we continue to focus on banner performance improvement work at Giant Tiger and CUL. Giant Tiger has identified staff productivity, apparel inventory control and several expense management opportunities as areas for performance gains in 2012. CUL has developed an in-stock inventory plan with improvement goals similar to Alaska and northern Canada. CUL is also expected to deliver expense savings in 2012 and plans to launch more lower price point and special buy products across all merchandise groups to improve their value offer amidst lingering recession conditions in several markets. We will continue to carefully assess the long-term potential of any major new business, product or service, and the probability of achieving threshold returns on a sustainable and consistent basis. Across this work we continue to emphasize new ideas, clear principles, execution, and the ability to track performance.
KEY PERFORMANCE DRIVERS ANDCAPABILITIES TO DELIVER RESULTS
The ability to protect and enhance the performance of northern store locations Our stores in Alaska and northern Canada represent the highest potential for improved productivity and customer satisfaction. We believe that the shift in our culture and capability towards efficiency, innovation and operational excellence within our new LRP strategies is working and is the best path to achieve these goals.
The financial capability to sustain the competitiveness of our existing store base and to pursue growth Our sustaining investments include replacement and renovated stores, staff housing, energy-efficiency and technology. Non-capital expenditures are centered on improvements to our in-store
capabilities through more in-depth training programs and the on-going investment in our LRP work.
The ability to be a leading community store in every market we serve This depends on our ability to tailor our store formats, product/service mix, community support and store associate employment offer, while still realizing the scale efficiencies of our size or the size of our alliance partners. A broad range of products, services and store sizes, combined with flexible technology platforms and “best practice” work processes, are all required to give us the ability to achieve this goal.
The ability to successfully add new stores and renew existing store leases Our new store opening success depends on finding viable locations, communities that are interested in having our store services, willing sellers of independent stores or chains, and being able to integrate and accelerate their full contribution potential. Renewing store leases, especially when the landlord is a community development entity, depends on our track record of solid store operations, our positive community relations and the superior attractiveness of our retail store compared to other options. Other factors include achieving product sourcing, operating and transportation cost savings, while building strong, entrepreneurial store teams.
Our ability to achieve best-selling practices and build supportive community relations Enhancing store stability and capability is an on-going priority that aligns with our goal of being a trusted local store. We continually invest in recruiting, retention and best practice work methods. We modify store processes to fully leverage our technology, specifically in the areas of communications, merchandise ordering, staff scheduling and training. This recognizes the important role played by our managers and other key store-level personnel and the reality that remoteness, employment competition from other local sectors and other conditions of our markets create challenges in attracting and keeping talented people. Related to this is our on-going ability to develop local management and to foster positive community relationships, especially within the indigenous markets we serve.
Our ability to reduce costs across all of our store banners, improve competitiveness and create more time and skill at store level to order and sell merchandise A key goal is to shift more staff time and skill towards ordering and selling merchandise tailored to the unique markets we serve, while reducing costs in the non-selling facets of store work. Productivity opportunities include labour scheduling, energy usage and inventory shrinkage. We have developed alliances with other non-competing retailers to provide sales and distribution services for certain products and services where we do not have the scale to achieve a lower cost structure on our own. Our new store banners and recent acquisitions have further enabled us to achieve cost efficiencies in direct importing, freight consolidation and general administration expenses while enabling us to share our specialized retail knowledge and ideas among our retail, wholesale and support service groups.
6 T H E N O RT H W E S T CO M PA N Y I N C . 2 0 1 1

CONVERSION TO A SHARE CORPOR ATION
On January 1, 2011, the North West Company Fund (the “Fund”) completed its previously announced conversion to a corporation named The North West Company Inc. (the “Company”) by way of a plan of arrangement under section 192 of the Canada Business Corporations Act. Unitholders of the Fund received one common share of the Company for each unit of the Fund held. Upon conversion, the Company assumed all of the covenants and obligations of the Fund and the common shares of the Company began trading on the Toronto Stock Exchange under the symbol “NWC”. The details of the conversion and the Arrangement are contained in the management information circular dated April 29, 2010 which is available on the Company’s website at www.northwest.ca or on SEDAR at www.sedar.com. The conversion was accounted for as a continuity of interests and as such the carrying amounts of the assets, liabilities and unitholders’ equity in the consolidated financial statements of the Fund immediately before the conversion was the same as the carrying values of the Company immediately after the conversion. The comparative amounts in this MD&A and in the consolidated financial statements are those of the Fund restated to conform with IFRS. The MD&A and consolidated financial statements contain references to “shareholders”, “shares” and “dividends” which were previously referred to as “unitholders”, “units” and “distributions” under the Fund. As a result of the conversion to a share corporation, the earnings from The North West Company LP that previously flowed to the Fund on a pre-tax basis are now subject to income taxes based on statutory federal and provincial income tax rates commencing January 1, 2011. While higher corporate taxes will reduce the Company’s net earnings and cash available for dividends to shareholders, the after-tax impact on personal income is largely offset for taxable investors benefiting from the dividend tax credit.
Consolidated Results2011 Highlights• Sales increased to $1.495 billion, our twelfth consecutive year
of sales growth.• Same store sales increase of 3.3% led by strong food sales. • Return on net assets was 18.5% • Return on average equity was 20.1%. • Total returns to shareholders, although negative 3.6% for the
year, compared favourably to the TSX composite index and were 10.7% on a compound annual basis over the past five years.
• The Company’s trading symbol was changed to “NWC” which is more reflective of the Company’s corporate identity and is consistent with the trading symbol of the Company prior to converting to an income trust in 1997.
• In February 2012, the Company held its 13th annual Wintering Partners Conference and Trade Show in Winnipeg. For the first time, store managers from across all of the Company’s banners attended this conference which focuses on best
practice learning and selling plans for the year ahead. During the week a special celebration was held marking the 25th anniversary of North West as an independent company beginning with the acquisition of the Northern Stores Division of The Hudson’s Bay Company in 1987.
FINANCIAL PERFORMANCE
As a result of the transition to International Financial Reporting Standards (IFRS), comparative figures for the year ended January 31, 2011 (“2010”) that were previously reported in the consolidated financial statements prepared in accordance with Canadian generally accepted accounting principles (“CGAAP”) have been restated to conform with the accounting policies adopted under IFRS. Further information on the transition to IFRS and the impact on the Company’s consolidated financial statements is provided in Note 24 to the audited consolidated financial statements. All other financial information for 2009 and prior was prepared in accordance with CGAAP and has not been restated. Some of the key performance indicators used by management to assess results are summarized in the following table:
Key Performance Indicators($ in thousands, CGAAPexcept per share/unit) 2011 2010 2009
Sales $ 1,495,136 $ 1,448,104 $1,444,366
Same store sales % increase (1) 3.3% 2.7% 0.1%
Trading profit (2) (EBITDA) $ 125,881 $ 125,764 $ 130,274
EBIT (2) $ 89,309 $ 90,272 $ 95,124
Net earnings $ 57,961 $ 69,656 $ 81,813
Net earnings per share/unit —basic $ 1.20 $ 1.45 $ 1.71
Net earnings per share/unit —diluted $ 1.19 $ 1.44 $ 1.69
Cash dividends/distributions
per share/unit $ 1.05 $ 1.42 $ 1.39
Total assets $ 626,917 $ 616,588 $ 623,800
Total long-term liabilities $ 215,206 $ 144,736 $ 161,928
Return on net assets (2) 18.5% 17.9% 18.7%
Return on average equity (2) 20.1% 24.1% 29.3%
(1) All references to same store sales excludes the foreign exchange impact
(2) See Non-GAAP financial measures section on page 26
Consolidated Sales Sales for the year ended January 31, 2012 (“2011”) increased 3.2% to $1.495 billion compared to $1.448 billion for the year ended January 31, 2011 (“2010”), and were up 3.5% compared to $1.444 billion for the year ended January 31, 2010 (“2009”). Sales growth was partially offset by the negative impact of foreign exchange on the translation of U.S. denominated sales. Excluding the foreign exchange impact, sales increased 4.4% from 2010 and were up 8.2% from 2009. On a same store basis, sales increased 3.3% compared to increases of 2.7% in 2010 and 0.1% in 2009. Food sales increased 3.2% from 2010, and were up 4.5% excluding the foreign exchange impact with all banners contributing to the sales growth. Improvements to our in-stock performance in our northern Canada and Alaska stores
M A N AG E M E N T ’ S D I S CU S S I O N & A N A LYS I S 7

contributed to the sales gains. Same store food sales increased 3.5% over last year with quarterly same store increases of 3.0%, 2.8%, 4.0% and 4.3% in the fourth quarter. Canadian food sales increased 5.1% and International food sales were up 3.3% excluding the foreign exchange impact. General merchandise sales increased 2.8% compared to 2010 and were up 3.5% excluding the foreign exchange impact. Same store general merchandise sales increased by 2.2% for the year with a decrease of 3.1% in the first quarter and quarterly increases of 1.7%, 1.1%, and 7.5% in the last three quarters of the year. General merchandise sales growth in our northern Canada stores more than offset weaker sales performance in our other banners in the first three quarters of the year. Other revenue, which includes fuel, fur and service charge revenue, increased 7.0% compared to 2010 largely due to higher gas prices.
Sales Blend The table below shows the consolidated sales blend over the past three years: 2011 2010 2009
Food 76.4% 76.4% 77.2%
General merchandise 20.2% 20.3% 19.8%
Other 3.4% 3.3% 3.0%
Canadian Operations accounted for 68.8% of total sales (67.6% in 2010 and 63.8% in 2009) while International Operations contributed 31.2% (32.4% in 2010 and 36.2% in 2009).
Gross Profit Gross profit increased 3.5% to $428.0 million compared to $413.3 million last year driven primarily by sales gains as gross profit rates were up 9 basis points to 28.63%. Lower gross profit rates in Canadian Operations, largely due to reductions in general merchandise margins caused by weather-related apparel markdowns and lower food prices in select markets, were more than offset by higher food gross profit rates in International Operations from improved margin management.
Selling, operating and administrative expenses Selling, operating and administrative expenses (“expenses”) increased 4.8% to $338.7 million and increased 34 basis points as a percentage of sales compared to last year. The most significant factor was higher incentive plan costs. Annual and long-term incentive plan expenses increased $6.3 million compared to last year as a result of improved financial performance, led by the International Operations, and incremental expense related to
share-based compensation programs. In 2010, the minimum earnings threshold for annual incentive plan payments was not met for both the International Operations and consolidated incentive earnings measures. Higher fuel-related utility costs particularly in the International Operations, also contributed to the increase in expenses. Partially offsetting these increases was the impact of a stronger Canadian dollar on the translation of International Operations expenses and lower debt loss expense in our Canadian Operations.
Earnings from operations (EBIT) Earnings from operations or earnings before interest and income taxes (“EBIT”) decreased 1.1% to $89.3 million compared to $90.3 million last year as higher incentive plan expenses included in selling, operating and administrative expenses offset the impact of higher sales. Excluding the foreign exchange impact and the incentive plan expense, earnings from operations increased 6.7%. Trading profit or earnings before interest, income taxes, depreciation and amortization (EBITDA) of $125.9 million was flat to last year. Excluding the foreign exchange impact and the increase in incentive plan expense, trading profit increased 5.9% and was 8.8% as a percentage to sales compared to 8.7% last year.
Interest expense Interest expense decreased 0.8% to $6.0 million compared to $6.1 million last year. An increase in the average cost of borrowing to 3.1% compared to 2.8% in 2010 was more than offset by a 10.7% decrease in average debt levels compared to 2010.
Income tax expense The provision for income taxes increased to $25.3 million compared to $14.5 million last year largely due to the taxation of Canadian Operations earnings as a result of the conversion to a share corporation on January 1, 2011. Prior to the conversion to a share corporation, the earnings from The North West Company LP flowed to North West Company Fund on a pre-tax basis and were ultimately distributed to unitholders. There was no current income tax payable by the Fund on these distributions. See Conversion to a Share Corporation on page 7 for further information. The effective tax rate for the year was 30.4% compared to 17.3% last year reflecting the taxation of Canadian Operations earnings and higher earnings in the International Operations. In the ordinary course of business, the Company is subject to audits by tax authorities. While the Company believes that its tax filing positions are appropriate and supportable, the possibility exists that certain matters may be reviewed and challenged by the tax authorities. The Company regularly reviews the potential for adverse outcomes and the adequacy of its tax provisions. The Company believes that it has adequately provided for these matters. If the final outcome differs materially from the tax provisions, the Company’s income tax expense and its earnings could be affected positively or negatively in the period in which the matters are resolved. A more detailed explanation of the income tax provision and deferred tax assets is provided in Note 9 to the consolidated financial statements.
8 T H E N O RT H W E S T CO M PA N Y I N C . 2 0 1 1
Sales & Trading Profit ($ in millions)
Sales Trading Profit
130.3122.3
106.6
125.8 125.9
20112007CGAAP
2008CGAAP
2009CGAAP
2010
1,500
1,250
1,000
750
500
250
0
150
125
100
75
50
25
0
1,064
1,3931,444 1,448 1,495

Net earnings Consolidated net earnings decreased 16.8% to $58.0 million or $1.19 per share on a diluted basis compared to $69.7 million or $1.44 per share in 2010. The change in income taxes in the Canadian Operations as a result of the conversion to a share corporation was the largest factor negatively impacting diluted earnings per share by approximately $0.21. Additional information on the financial performance of Canadian Operations and International Operations is included on page 10 and page 12 respectively. In 2011, the average exchange rate used to translate U.S. denominated sales and expenses from the International Operations was 3.4% lower at 0.991 compared to 1.026 last year. The Canadian dollar’s appreciation versus the U.S. dollar in 2010 had the following net impact on the 2011 results:
Sales .................................................. decrease of $16.4 million or 1.1%Earnings from operations .............................decrease of $0.7 millionNet earnings .................................................... decrease of $0.4 millionDiluted earnings per share ................... decrease of $0.01 per share
Total Assets Consolidated assets increased 1.7% to $626.9 million compared to $616.6 million in 2010 and were up 0.5% compared to $623.8 million in 2009. The increase in consolidated assets is largely due to higher inventories, accounts receivable and property and equipment partially offset by a decrease in deferred tax assets compared to last year and 2009. Consolidated working capital for the past three years is summarized in the following table:
CGAAP($ in thousands) 2011 2010 2009
Current assets $ 295,836 $ 284,789 $ 285,843
Current liabilities $(128,002) $(185,377) $(171,946)
Working capital $ 167,834 $ 99,412 $ 113,897
Working capital increased $68.4 million or 68.8% to $167.8 million compared to 2010 and was up $53.9 million or 47.4% compared to 2009. The increase in working capital is primarily due to a decrease in current liabilities largely related to the current portion of long-term debt. The current portion of long-term debt decreased to $0.6 million compared to $68.3 million in 2010 and $56.3 million in 2009 as a result of refinancing loan facilities upon maturity. See Note 11 to the consolidated financial statements for further information on long-term debt. Return on net assets employed increased to 18.5% from 17.9% in 2010, and return on average equity decreased to 20.1%
M A N AG E M E N T ’ S D I S CU S S I O N & A N A LYS I S 9
from 24.1% in 2010. Return on net assets increased due to lower average net assets employed partially offset by a decrease in earnings before interest and taxes. Additional information on net assets employed for the Canadian and International Operations is on page 11 and page 13 respectively. Return on average equity decreased largely due to the taxation of Canadian Operations earnings as a result of the conversion to a share corporation, partially offset by a $15.3 million charge to retained earnings related to net actuarial losses on the Company’s defined benefit pension plan. Further information on shareholder’s equity is provided in the statements of changes in shareholders’ equity in the consolidated financial statements.
Total long-term liabilities Consolidated long-term liabilities increased $70.5 million or 48.7% to $215.2 million from 2010 and were up $53.3 million or 32.9% compared to 2009. The increase in long-term liabilities from 2010 and 2009 is largely due to a decrease in the current portion of long-term debt related to loan facilities that were refinanced on a long-term basis and an increase in the defined benefit plan obligation. Further information on long-term debt is included in the sources of liquidity and capital structure sections on page 15 and page 17 respectively and in Note 11 to the consolidated financial statements. The defined benefit plan obligation increased $18.6 million compared to 2010 largely due to a significant decrease in the discount rate used to calculate pension liabilities and lower than expected returns on pension plan assets. The defined benefit plan obligation under IFRS is not comparable to the obligation reported under CGAAP used in 2009. Further information on post-employment benefits is provided in Note 12 to the consolidated financial statements.
Trading Profit & Net Earnings ($ in millions)
106.6
Trading Profit Net Earnings
20112007CGAAP
2008CGAAP
2009CGAAP
2010
150
125
100
75
50
25
0
63.075.4
81.869.7
58.0
122.3130.3 125.8 125.9
Return on Net Assets & Equity (%)
RONA ROE
21.0
30
25
20
15
10
5
020112007
CGAAP2008
CGAAP2009
CGAAP2010
24.9
19.8
28.6
18.7
29.3
17.9
24.1
18.520.1

impacted by cool spring weather conditions in the first half of the year and warm weather conditions in more southern markets in the second half. Other revenues, which include fuel, fur and service charge revenue, were up 6.8% from 2010 and increased 20.9% over 2009. The increase in other revenues is largely due to higher fuel prices. Sales Blend The table below shows the sales blend for the Canadian Operations over the past three years:
2011 2010 2009
Food 71.8% 71.8% 72.0%
General merchandise 23.6% 23.7% 23.8%
Other 4.6% 4.5% 4.2%
Same Store Sales Canadian Operations have consistently achieved top-quartile same store food sales reflecting the Company’s focus on superior food selling execution within what are generally growing and younger markets with stable base income profiles. Same store general merchandise sales have been more volatile because they are heavily weighted to big-ticket durable goods that depend upon customers’ discretionary income. Same store sales for the past three years are shown in the following table: Same Store Sales
(% change) 2011 2010 2009
Food 3.8% 4.6% 4.4%
General merchandise 3.3% 2.6% (7.7%)
Total sales 3.7% 4.1% 1.1%
Gross Profit Gross profit dollars for Canadian Operations increased by 3.5% as sales growth more than offset lower gross profit rates. The lower gross profit rates were due to more aggressive promotional food pricing in select markets and higher markdowns to clear seasonal merchandise. Lower gross profit rates on gasoline were also a factor Selling, operating and administrative expenses Selling, operating and administrative expenses (“expenses”) increased 5.6% from 2010 and were up 11 basis points as a percentage of sales compared to last year. The largest factor was higher incentive plan expenses compared to last year as a result of improved financial performance as noted under the consolidated financial results on page 7. An increase in non-incentive staff costs and utility expenses were also factors. Partially offsetting these costs was lower debt loss expense. Excluding the incentive plan costs, expenses decreased 21 basis points as a percentage of sales. Earnings from operations (EBIT) Earnings from operations decreased $2.0 million or 2.8% to $69.3 million compared to $71.3 million in 2010 as lower gross profit rates and higher expenses more than offset the increase in sales. Trading profit from Canadian Operations decreased $0.8 million or 0.8% to $98.0 million and was 9.5% as a percentage of sales
1 0 T H E N O RT H W E S T CO M PA N Y I N C . 2 0 1 1
FINANCIAL PERFORMANCE
Canadian Operations results for the year are summarized by the key performance indicators used by management as follows:
Key Performance Indicators
CGAAP($ in thousands) 2011 2010 2009
Sales $ 1,028,396 $ 978,662 $ 921,621
Same store sales % increase 3.7% 4.1% 1.1%
Trading profit (1)(EBITDA) $ 97,998 $ 98,781 $ 96,599
Earnings from operations (1)(EBIT) $ 69,253 $ 71,270 $ 69,872
Return on net assets (1) 20.7% 20.2% 20.0%
(1) See Non-GAAP financial measures section on page 26
Sales Canadian Operations sales increased $49.7 million or 5.1% to $1.028 billion compared to $978.7 million in 2010, and were up $106.8 million or 11.6% compared to 2009. Same store sales increased 3.7% compared to a 4.1% increase in 2010. Food sales accounted for 71.8% (71.8% in 2010) of total Canadian sales. The balance was made up of general merchandise sales at 23.6% (23.7% in 2010) and other sales, which consists primarily of fuel sales and service charge revenue at 4.6% (4.5% in 2010). Food sales increased by 5.1% over 2010 and were up 11.4% compared to 2009. Same store food sales increased 3.8% compared to 4.6% in 2010. Same store food sales, led by strong sales growth in our northern stores, had quarterly increases of 2.2%, 2.6%, 4.9% and 5.6%. Food sales were up in all banners led by strong sales growth in our remote stores due in part to better in-stock performance. On April 1, 2011, the federal government launched a new program called Nutrition North Canada (“NNC”) whereby freight subsidies were established for qualifying food items by community and each retailer became accountable to deliver these products to the communities as efficiently as possible. The NNC freight subsidies resulted in price reductions in eligible communities of approximately $9 million on an annualized basis. In conjunction with the program, the Company announced further price reductions of approximately $3 million on an annual basis as a result of transportation cost efficiency gains. Northern markets qualifying for the NNC freight subsidy contributed to the food sales growth in spite of the deflationary impact of the NNC subsidy and investment in pricing made by the Company. Food inflation resulting from higher commodity costs, fuel surcharges, less NNC eligible store freight subsidies was approximately 2%. General merchandise sales increased 4.6% from 2010 and were up 10.4% compared to 2009. Same store sales increased 3.3% compared to 2.6% in 2010. On a quarterly basis, same store sales decreased 2.2% in the first quarter followed by increases of 3.3%, 2.5% and 7.6% in the last three quarters of the year. Sales growth driven primarily by transportation, electronics, home furnishings and seasonal hardlines categories in northern markets offset weaker sales performance in apparel categories across all banners. Apparel sales were negatively
Canadian Operations

compared to 10.1% in 2010. Excluding the increase in incentive plan expense, trading profit increased 3.1% and was 9.9% as a percentage of sales.
Net Assets Employed Net assets employed at January 31, 2012, decreased 4.7% to $315.5 million compared to $330.9 million at January 31, 2011, as summarized in the following table:
Net Assets Employed CGAAP
($ in millions at the end of the fiscal year) 2011 2010 2009
Property and equipment $ 196.1 $ 189.6 $ 183.8
Inventory 131.3 126.2 122.3
Accounts receivable 66.6 61.1 61.7
Other assets 49.9 58.9 69.5
Liabilities (128.4) (104.9) (89.5)
Total $ 315.5 $ 330.9 $ 347.8
Property and equipment increased reflecting investments in new stores, major store renovation projects, staff housing renovations, an ATM replacement project, energy-efficient refrigeration upgrades and a store point-of-sale system upgrade.
Inventory increased primarily due to higher food inventories in stores serviced by seasonal winter roads and sealift to take advantage of lower transportation costs compared to air freight and higher gasoline inventory due to timing of purchases. Average inventory levels in 2011 were $1.1 million or 0.9% higher than 2010 and $6.2 million or 4.9% higher than 2009 due in part to commodity and transportation cost increases and new stores compared to 2009. Inventory turnover improved to 5.5 times from 5.2 times in 2010 due to higher sales.
Accounts receivable increased $5.5 million or 9.0% from 2010 and average accounts receivable were $2.3 million or 3.9% higher than 2010. The increase in accounts receivable is due to the timing of collections and insurance related accounts receivable resulting from stores destroyed by fire during the year.
Other assets decreased $9.0 million or 15.3% compared to last year largely due to a decrease in deferred tax assets. As a result of the conversion to a share corporation, the earnings of The North West Company LP are now taxed in the Company based on statutory corporate income tax rates. Although the Company has been accruing Canadian income tax expense throughout the year, a significant portion of these income taxes will be deferred to a subsequent period. On November 21, 2011, new income tax legislation was enacted to curtail
income deferral by corporations with a partnership that has a different taxation year. The new legislation requires income from these partnerships to be reported on an accrual basis for tax purposes but also includes transitional provisions whereby income earned from the partnership during the initial adoption year can be deferred and recognized over a subsequent five-year period. As a result of these transition rules, a substantial portion of the income tax payable of the Canadian Operations for 2011 has been deferred and will be paid over the next five years. This deferred tax liability has been recorded as a reduction of deferred tax assets. Further information on deferred tax assets and deferred tax liabilities is provided in Note 9 to the consolidated financial statements. The decrease in other assets compared to 2009 is due to differences in accounting for defined benefit pension plans under IFRS compared to CGAAP and a decrease in deferred tax assets as noted above. Further information on the transition from CGAAP to IFRS is provided in Note 24 to the 2011 consolidated financial statements.
Liabilities increased $23.5 million or 22.4% from 2010 primarily due to an $18.6 million increase in the defined benefit plan obligation. Further information on post-employment benefits is provided on page 15 and in Note 12 to the consolidated financial statements. The remaining increase in liabilities over the prior year is due to higher trade accounts payable related to the timing of payments.
Return on Net Assets The return on net assets employed for Canadian Operations increased to 20.7% from 20.2% in 2010 as the impact of lower average net assets more than offset a decrease in EBIT compared to last year.
M A N AG E M E N T ’ S D I S CU S S I O N & A N A LYS I S 1 1
Canadian Return on Net AssetsEBIT ($ in millions) RONA (%)
80
60
40
20
020112007
CGAAP2008
CGAAP2009
CGAAP2010
40
30
20
10
0
20.8
64.8
20.9 20.0 20.2 20.7
66.169.9 71.3 69.3
Canadian EBIT & Trading Profit Margins (% of sales)
EBIT Trading Profit
7.6
12
10
8
6
4
2
020112007
CGAAP2008
CGAAP2009
CGAAP2010
10.3
7.4
10.1
7.6
10.5
7.3
10.1
6.7
9.5
which will enable the flow of fresh merchandise as part of our performance improvement plan. Other revenues, which consist of fuel and service charge revenue, were up 12.3% from 2010 and were up 35.2% from 2009 primarily due to higher fuel prices.
Sales Blend The table below reflects the importance of food sales to the total sales of the International Operations:
2011 2010 2009
Food 86.3% 85.9% 86.4%
General merchandise 12.6% 13.1% 12.8%
Other 1.1% 1.0% 0.8%
Same store sales International Operations same store sales for the past three years are shown in the following table. General merchandise same store sales are significantly impacted by consumer spending on big-ticket durable goods that are largely influenced by special payments such as the Permanent Fund Dividend in Alaska which can result in greater sales volatility. The decrease in general merchandise same store sales in 2009 is primarily due to a decrease in the PFD from $3,269 in 2008 to $1,305 in 2009.
Same store sales(% change) 2011 2010 2009
Food 2.9% (0.1%) 0.6%
General merchandise (1.8%) (1.0%) (15.6%)
Total sales 2.3% (0.2%) (2.1%)
Gross Profit Gross profit dollars increased 7.2% from 2010 due to sales growth and improved gross profit rates. The increase in gross profit rate was due to higher rates in food resulting from better product sourcing, improved perishable food profitability and a decrease in promotional food pricing in stable food categories in several key markets. Partially offsetting the improvement in food gross profit was higher markdowns to clear slow-moving general merchandise in CUL stores.
Selling, operating and administrative Selling, operating and administrative expenses (“expenses”) increased 6.8% over last year and were up 80 basis points as a percentage of sales. Higher incentive plan expenses resulting from improved financial performance and continuing increases in utility expenses were the leading factors contributing to the increase in expenses. Fuel-related utility costs were up 12.4% compared to 2010 and were up 15.8% compared to 2009 for a total increase of $1.9 million over two years.
Earnings from operations (EBIT) Earnings from operations increased $1.7 million or 9.3% to $20.2 million compared to $18.5 million in 2010 as higher sales and improved gross profit rates more than offset the increase in expenses. Trading profit increased $1.8 million or 7.0% to $28.1 million and was 6.0% as a percentage of sales compared to 5.7% in 2010. Excluding the increase in incentive plan expense, trading profit increased 16.3% and was 6.5% as a percentage of sales.
1 2 T H E N O RT H W E S T CO M PA N Y I N C . 2 0 1 1
International Operations include Alaska Commercial Company (“AC”), Cost-U-Less (“CUL”) and Pacific Alaska Wholesale (“PAW”).
FINANCIAL PERFORMANCE
International Operations results for the year are summarized by the key performance indicators used by management as follows:
Key Performance Indicators
CGAAP($ in thousands) 2011 2010 2009
Sales $ 470,932 $457,590 $ 464,167
Same store sales % 2.3% (0.2%) (2.1%)
Trading profit (1) (EBITDA) $ 28,133 $ 26,302 $ 29,902
Earnings from operations (1) (EBIT) $ 20,236 $ 18,522 $ 22,422
Return on net assets (1) 13.6% 12.6% 16.0%
(1) See Non-GAAP financial measures section on page 26
Sales International sales increased 2.9% to $470.9 million compared to $457.6 million in 2010, and were up 1.5% compared to 2009 as strong food sales growth more than offset a decrease in general merchandise sales. Same store sales increased 2.3% compared to a 0.2% decrease in 2010 and a 2.1% decrease in 2009. Food sales accounted for 86.3% (85.9% in 2010) of total sales with the balance comprised of general merchandise at 12.6% (13.1% in 2010) and other sales, which consist primarily of fuel sales and service charge revenues, at 1.1% (1.0% in 2010). Food sales increased 3.3% from 2010 and were up 1.3% compared to 2009. Same store food sales were up 2.9% compared to a 0.1% decrease in 2010. Quarterly same store food sales increases were 4.5%, 3.0%, 2.4% and 1.9% in the fourth quarter with both AC and CUL stores contributing to the quarterly increases. CUL delivered consistent food sales growth throughout the year compared to negative same store sales in 2010 as a result of adverse economic conditions. The PAW business delivered moderate sales gains for the year after a significant sales decrease in 2010 as a result of shipping disruptions relating to the consolidation of our distribution and information systems. General merchandise sales decreased 0.5% from 2010 but were up 0.2% from 2009. On an annual basis, general merchandise same store sales were down 1.8% compared to a decrease of 1.0% in 2010. Quarterly same store sales were down 6.8%, 4.7% and 4.1% in the first three quarters but rebounded in the fourth quarter with a 7.1% increase. The impact of lower discretionary spending in CUL markets was partially offset by sales growth in home furnishings and electronics in AC stores driven by the Permanent Fund Dividend (“PFD”), regional native corporation dividends and other settlement payments. The PFD paid to qualifying Alaskan residents was $1,174 compared to $1,281 last year and $1,305 in 2009. The strong general merchandise sales growth in the fourth quarter was largely generated by markdown activity in our CUL stores. These markdowns successfully reduced slow-moving inventory
International Operations (Stated in U.S. dollars)

Net Assets Employed International Operations net assets employed decreased $4.6 million or 3.1% to $143.4 million compared to $148.0 million in 2010 but were up $1.4 million or 1.0% from 2009 as summarized in the following table:
Net Assets Employed CGAAP
($ in millions at the end of the fiscal year) 2011 2010 2009
Property and equipment $ 73.9 $ 69.9 $ 70.6
Inventory 54.5 50.7 52.2
Accounts receivable 9.9 9.1 9.4
Other assets 43.7 50.8 43.0
Liabilities (38.6) (32.5) (33.2)
Total $ 143.4 $ 148.0 $142.0
Property and equipment increased reflecting the replacement of an existing store, store renovations, and the beginning of construction on a new Cost-U-Less store in Barbados that is scheduled to open in the first quarter of 2013. Inventories at the end of the year increased from 2010 largely due to food inventory. Average inventory levels in 2011 were $1.7 million or 3.0% higher than 2010 and $4.5 million higher than 2009 due in part to commodity cost increases. Inventory turnover decreased to 6.2 times in 2011 compared to 6.3 times in 2010. Other assets decreased $7.1 million or 14.0% compared to last year due in part to lower cash balances at the end of the year. Liabilities increased $6.1 million or 18.8% from 2010 due to higher trade accounts payable and an increase in income tax payable related to higher earnings.
Return on Net Assets The return on net assets employed for International Operations increased to 13.6% from 12.6% in 2010 primarily due to higher EBIT and lower average net assets employed as noted above.
Consolidated Liquidity and Capital Resources The following table summarizes the major components of cash flow:
($ in thousands) 2011 2010 Change
Cash flows from (used in):
Operating activities $114,658 $114,564 $ 94
Investing activities $ (45,137) $ (34,124) $ (11,013)
Financing activities $ (73,768) $ (76,487) $ 2,719
Net change in cash $ (4,247) $ 3,953 $ (8,200)
Cash from operating activities Cash flow from operating activities was flat to last year at $114.7 million. Changes in non-cash working capital negatively impacted cash flow from operating activities by $4.0 million compared to an increase in cash flow of $0.6 million in 2010. The change in non-cash working capital is largely due to an increase in accounts receivable and inventories partially offset by an increase in accounts payable as noted in the Canadian and International net assets employed on pages 11 and 13 respectively. As a result of the conversion to a share corporation and the deferral of the payment of Canadian income taxes in the transition year in accordance with new income tax legislation enacted November 21, 2011, income tax installments will begin being paid in the first quarter of 2012 and will increase in 2013 based on the recognition of the deferred income taxes. Further information is provided in other assets under Canadian Operations net assets employed on page 11. Cash flow from operating activities and unutilized credit available on existing loan facilities are expected to be sufficient to fund operating requirements, pension plan contributions, sustaining and planned growth-related capital expenditures as well as anticipated dividends during 2012. The compound annual growth rate (CAGR) for cash flow from operating activities over the past 10 years is 8.9% as shown in the following graph:
M A N AG E M E N T ’ S D I S CU S S I O N & A N A LYS I S 1 3
International Return on Net AssetsEBIT ($ in millions) RONA (%)
20112007CGAAP
2008CGAAP
2009CGAAP
2010
21.7
25
20
15
10
5
0
50
40
30
20
10
0
17.2 16.012.6 13.6
14.0
22.2 22.4
18.520.2
International EBIT & Trading Profit Margins (% of sales)
EBIT Trading Profit
7.0
20112007CGAAP
2008CGAAP
2009CGAAP
20100
2
4
6
8
10
9.0
4.9
6.4
4.8
6.4
4.0
5.7
4.3
6.0
2011
Cash Flow from Operating Activities (1) ($ in millions)
120
0
CAGR 8.9%
2001
49
80
60
40
20
100
2002 2003 2004 2005 2006 2007 2008 2009 2010
5967
49
7581
94 90
108115
115
(1) 2011 is reported under IFRS. 2010 has been restated in accordance with IFRS. All other financial information was prepared in accordancewith CGAAP and has not been restated.

Cash used in investing activities Net cash used in investing activities was $45.1 million compared to $34.1 million in 2010. Net investing in Canadian Operations was $33.5 million ($27.2 million in 2010). A summary of the Canadian Operations investing activities is included in net assets employed on page 11. Net investing in International Operations was $11.6 million compared to $6.9 million in 2010. A summary of the International Operations investing activities is included in net assets employed on page 13. The following table summarizes the number of stores and selling square footage under NWC’s various retail banners at the end of the fiscal year:
Number of Stores Selling square footage
2011 2010 2011 2010
Northern 123 126 690,921 703,414
NorthMart 7 7 148,306 148,306
Quickstop 15 15 26,566 26,566
Giant Tiger 36 34 577,432 544,175
AC Value Centers 30 30 295,742 294,597
Cost-U-Less 12 12 336,138 336,138
Other Formats 6 6 45,716 45,716
Total at year-end 229 230 2,120,821 2,098,912
In the Canadian Operations, two Giant Tiger stores were opened and two smaller Northern stores were closed in Obedjiwan, Quebec and Fort Ware, BC as satisfactory lease renewal terms could not be reached with the landlords. During the year, three Northern stores, one of which was leased, were destroyed by fire. These fire losses were insured. Operations were resumed in temporary facilities in two communities and the Company is working with the community in the other location to develop plans to meet the community’s needs. Total selling square feet in Canada increased to 1,466,054 from 1,445,291 in 2010. In the International Operations, a new AC Value Center was opened in Kotlik, Alaska replacing an existing facility. International selling square feet increased to 654,767 from 653,621 in 2010.
Cash used in financing activities Cash used in financing activities was $73.8 million compared to $76.5 million in 2010. The decrease in long-term debt is due to lower borrowings in the International Operations. During the year the Company repaid a US$3.9 million note payable in the International Operations. The Unit Purchase Loan Plan was discontinued January 31, 2011 and $6.4 million in outstanding loans granted to officers were repaid in the prior year.
Shareholder Dividends / Unitholder Distributions The Company paid dividends, including the final distribution from the Fund, of $50.8 million or $1.05 per share compared to $68.7 million or $1.42 per unit paid in 2010. The decrease in dividends in 2011 compared to the distributions paid in 2010 is due to the conversion to a share corporation and the taxation of earnings of the Canadian Operations. Prior to the conversion to a share corporation, earnings from The North West Company LP flowed to the Fund on a pre-tax basis and were distributed to unithholders. While higher corporate taxes have reduced the Company’s net earnings and cash available for dividends to shareholders, the after-tax impact on personal income is largely offset for taxable Canadian investors due to the dividend tax credit. The following table shows the quarterly cash dividends per share and distributions per unit paid for the past three years:
Dividends Distributions Distributions 2011 2010 2009
First Quarter $ 0.24 $ 0.34 $ 0.32
Second Quarter 0.24 0.34 0.32
Third Quarter 0.24 0.34 0.34
Fourth Quarter 0.24 0.34 0.34
Special distribution 0.09 0.06 0.07
Total $ 1.05 $ 1.42 $ 1.39
The payment of dividends on the Company’s common shares are subject to the approval of the Board of Directors and is based on, among other factors, the financial performance of the Company, its current and anticipated future business needs and the satisfaction of solvency tests imposed by the Canada Business Corporations Act (“CBCA”) for the declaration of dividends. The dividends were designated as eligible dividends in accordance with the provisions of the Canadian Income Tax Act. The determination to declare and make payable distributions from the Fund was subject to the terms of the Fund’s Declaration of Trust and the discretion of the Board of Trustees. The Fund’s distribution policy was to make distributions to unitholders equal to the taxable income of the Fund. The taxable income of the Fund was primarily based on an allocation of the taxable income of The North West Company LP less Fund expenses. In addition to the quarterly distributions, a special year-end distribution was declared to unitholders if the taxable income of the Fund exceeded the cumulative distributions for the year. A special distribution of $0.09 per unit was paid February 18, 2011 to unitholders of record on December 31, 2010 ($0.06 per unit was paid February 19, 2010 to unitholders of record on December 31, 2009). The Fund’s obligation to pay the $0.09 per unit special distribution was assumed by the Company as part of the conversion to a share corporation (see Conversion to a Share Corporation on page 7). Further information on dividends is included in Note 19 to the consolidated financial statements.
1 4 T H E N O RT H W E S T CO M PA N Y I N C . 2 0 1 1
The following table shows dividends and distributions paid in comparison to cash flow from operating activities for the past three years: CGAAP 2011 2010 2009
Dividends/Distributions $ 50,797 $ 68,700 $ 67,245
Cash flow fromoperating activities $ 114,658 $ 114,564 $107,973
Dividends/Distributions as a % of cash flow fromoperating activities 44.3% 60.0% 62.3%
The decrease in dividends as a percentage of cash flow from operating activities to 44.3% compared to 2010 is due to the conversion to a share corporation and the taxation of earnings in the Canadian Operations. The Canadian Operations will begin paying income tax installments in 2012 which will reduce cash flow from operating activities. Further information is provided under cash from operating activities on page 13. The compound annual growth rate (CAGR) for distributions/dividends over the past 10 years is 7.9% as shown in the following graph:
Subsequent event - dividends On March 16, 2012, the Board of Directors approved a quarterly dividend of $0.26 per share to shareholders of record on March 30, 2012, payable on April 16, 2012. This is an increase of $0.02 per share or 8.3% compared to the $0.24 per share quarterly dividend paid in 2011. On an annual basis, the Company anticipates paying dividends of approximately $1.04 per share compared to $0.96 per share in 2011.
Post-employment benefits The Company sponsors defined benefit and defined contribution pension plans covering the majority of Canadian employees. Effective January 1, 2011, the Company entered into an amended and restated staff pension plan, which incorporated legislated changes, administrative practice, and added a defined contribution provision. Under the amended pension plan, all members who did not meet a qualifying threshold based on number of years in the pension plan and age were transitioned to the defined contribution pension plan effective January 1, 2011 and no longer accumulate years of service under the defined benefit pension plan. The defined benefit pension previously earned by the members transitioned to the defined contribution plan will continue to accrue in accordance with the provisions of the amended plan based on the member’s current pensionable earnings. Members who met the required qualifying threshold elected between continuing to accrue a defined benefit pension and accruing a defined contribution benefit. As a result of volatile capital markets and further reductions in already historically low long-term interest rates, the Company recorded an increase in defined benefit plan obligations of $20.8 million, an increase in deferred tax assets of $5.5 million and net actuarial losses of $15.3 million (January 31, 2011 - $1.0 million) as a charge to other comprehensive income. The charge to other comprehensive income was immediately recognized in retained earnings. The actuarial loss is due to a significant decrease in the discount rate used to calculate pension liabilities from 5.8% in 2010 to 4.5% in 2011 and lower than expected returns on pension plan assets. In 2012, the Company expects to contribute approximately $6.0 million to the defined benefit pension plan compared to $4.3 million in 2011. A portion of this obligation may be funded by the issuance of a letter of credit in accordance with new pension legislation. The actual amount of the contributions may be different from the estimate based on actuarial valuations, plan investment performance, volatility in discount rates, regulatory requirements and other factors. The Company also expects to contribute approximately $1.9 million to the defined contribution pension plan in 2012 compared to $1.8 million in 2011. Additional information regarding post-employment benefits is provided in Note 12 to the consolidated financial statements.
Sources of liquidity On December 5, 2011, the Company completed the refinancing of its $140.0 million loan facilities in the Canadian Operations. The new committed, extendible, revolving loan facilities, provide the Company with a $170.0 million revolving loan facility for working capital requirements and general business purposes. These facilities, which mature on December 31, 2015, are secured by a floating charge on the assets of the Company and rank pari passu with the US$70.0 million senior notes and the US$52.0 million loan facilities. The new loan facilities bear a floating interest rate based on banker’s acceptances plus stamping fees or the Canadian prime interest rate. At January 31, 2012, the Company had drawn $68.9 million on these facilities (January 31, 2011 – $67.4 million). At January 31, 2012, the Canadian Operations have outstanding US$70.0 million senior notes (January 31, 2011 – US$70.0 million) that mature on June 15, 2014. The senior
M A N AG E M E N T ’ S D I S CU S S I O N & A N A LYS I S 1 5
Distributions Per Unit/Dividends Per Share (1) (2) (4)
CAGR 7.9%
All per unit information has been restated to reflect the three-for-one unitsplit that occurred on September 20, 2006
From 2001 to 2010, amounts paid to unitholders were distributions from theFund. The Fund converted to a share corporation effective January 1, 2011.The $1.05 paid to shareholders in 2011 includes a $0.09 per unit finaldistribution from the Fund paid by the Company as part of the conversion toa share corporation plus dividends of $0.96 per share.
20112001(2) 2002 2003(3)2004 2005 2006 2007 2008 2009 2010
1.50
0
1.00
.75
.50
.25
1.25
0.49 0.52 0.63 0.60 0.630.80
1.13
1.40 1.39 1.42
1.05
(1)
(2)
The Fund paid a special distribution of $0.11 per unit on a split adjusted basis(3)
2011 is reported under IFRS. 2010 has been restated in accordance with IFRS.All other financial information was prepared in accordance with CGAAP andhas not been restated.
.(4)

notes are secured by a floating first charge on the assets of the Company and rank pari passu with the $170.0 million loan facilities and the US$52.0 million loan facilities. The US$70.0 million senior notes have been designated as a hedge against the U.S. dollar investment in the International Operations. Of this amount, US$42.0 million of the senior notes are at a fixed interest rate of 6.55%. Interest on US$28.0 million has been converted by an interest rate swap from fixed to floating rates at the three-month London Interbank Offered Rate (LIBOR) plus a spread. For more information on the senior notes and financial instruments, see Note 11 and Note 14 to the consolidated financial statements. The Company’s International Operations have available committed, revolving loan facilities of US$52.0 million that mature on December 31, 2013. These facilities are secured by a floating first charge against the assets of the Company and rank pari passu with the US$70.0 million senior notes and the $170.0 million loan facilities. These facilities bear interest at LIBOR plus a spread or the U.S. prime rate. At January 31, 2012, the Company had drawn US$36.0 million (January 31, 2011 – US$50.0 million) on these facilities. The International Operations also have available a committed, revolving loan facility of US$20.0 million that matures October 31, 2012. This facility bears interest at LIBOR plus a spread and is secured by a charge against certain accounts receivable and inventories of the International Operations. At January 31, 2012, the Company had nothing drawn on these facilities (January 31, 2011 – US$ NIL). For further information on risks related to refinancing, see liquidity risk in the risk management section on page 22.
The coverage ratio of earnings from operations (EBIT) to interest was flat at 14.9 times compared to 14.8 times in 2010.
Interest Costs and Coverage CGAAP 2011 2010 2009
Coverage ratio 14.9 14.8 17.3
EBIT ($ in millions) $ 89.3 $ 90.3 $ 95.1
Interest ($ in millions) $ 6.0 $ 6.1 $ 5.5
The loan facilities and senior notes contain covenants and restrictions including the requirement to meet certain financial ratios and financial condition tests. The financial covenants include a fixed charge coverage ratio, minimum current ratio, a leverage test and a minimum net worth test. At January 31, 2012, the Company is in compliance with all covenants under these facilities. Current and forecasted debt levels are regularly monitored for compliance with debt covenants.
Contractual Obligations and Other Commitments
Contractual obligations of the Company are listed in the chart below:
($ in thousands) Total 0-1 Year 2-3 Years 4-5 Years 6 Years+
Long-term debt
(including capital
lease obligations) $175,892 $ 629 $106,413 $68,850 $ -
Operating leases 149,131 24,374 40,727 28,238 55,792
Other liabilities (1) 7,818 4,611 3,207 - -
Total $332,841 $29,614 $150,347 $97,088 $55,792
(1) At year-end, the Company had additional long-term liabilities of $34.1 million which included provisions, defined benefit plan obligations and deferred income tax liabilities. These have not been included as the timing and amount of the future payments are uncertain.
Director and Officer Indemnification Agreements The Company has agreements with its current and former directors, trustees, and officers to indemnify them against charges, costs, expenses, amounts paid in settlement and damages incurred from any lawsuit or any judicial, administrative or investigative proceeding in which they are sued as a result of their service. Due to the nature of these agreements, the Company cannot make a reasonable estimate of the maximum amount it could be required to pay to counterparties. The Company has also purchased directors’, trustees’, and officers’ liability insurance. No amount has been recorded in the financial statements regarding these indemnification agreements.
Other Indemnification Agreements The Company provides indemnification agreements to counterparties for events such as intellectual property right infringement, loss or damage to property, claims that may arise while providing services, violation of laws or regulations, or as a result of litigation that might be suffered by the counterparties. The terms and nature of these agreements are based on the specific contract. The Company cannot make a reasonable estimate of the maximum amount it could be required to pay to counterparties. No amount has been recorded in the financial statements regarding these agreements.
Giant Tiger Master Franchise Agreement In 2002, the Company signed a 30-year Master Franchise Agreement with Giant Tiger Stores Limited, based in Ottawa, Ontario which grants the Company the exclusive right to open Giant Tiger stores in western Canada. Under the agreement, Giant Tiger Stores Limited provides product sourcing, merchandising, systems and administration support to the Company’s Giant Tiger stores in return for a royalty based on sales. The Company is responsible for opening, owning, operating and providing distribution services to the stores. The Company’s exclusivity right requires that a minimum number of Giant Tiger stores be opened each year, based on an expected roll-out of 72 stores over the term of the agreement. As at April 9, 2012, the Company has opened 37 Giant Tiger stores. In order to maintain exclusivity, the Company is required to have 36 stores open by July 31, 2012 and must have open an additional four stores per year until July 31, 2016, and then two stores per year thereafter until July 31, 2026. Additional information on commitments, contingencies and guarantees is provided in Note 22 to the consolidated financial statements.
1 6 T H E N O RT H W E S T CO M PA N Y I N C . 2 0 1 1

Related Parties The Company has a 50% ownership interest in a Canadian Arctic shipping company, Transport Nanuk Inc. and purchases freight handling and shipping services from Transport Nanuk Inc. and its subsidiaries. The purchases are based on market rates for these types of services in an arm’s length transaction. Additional information on the Company’s transactions with Transport Nanuk Inc. is included in Note 23 to the consolidated financial statements.
Capital Structure The Company’s objectives in managing capital are to deploy capital to provide an appropriate total return to shareholders and to maintain a capital structure that provides the flexibility to take advantage of the growth and development opportunities of the business, maintain existing assets, meet financial covenants and obligations and enhance shareholder value. The capital structure of the Company consists of bank advances, long-term debt and shareholders’ equity. The Company manages capital to ensure an appropriate balance between debt and equity to optimize capital costs. In order to maintain or adjust its capital structure, the Company may purchase shares for cancellation pursuant to normal course issuer bids, issue additional shares, borrow additional funds, adjust the amount of dividends paid or refinance debt at different terms and conditions. On a consolidated basis, the Company had $175.9 million in debt and $283.7 million in equity at the end of the year and a debt-to-equity ratio of .62:1 compared to .67:1 last year. The decrease in the debt-to-equity ratio is due to a reduction in the amount of debt outstanding at the end of the year partially offset by lower equity compared to the prior year.
The strength of the Company’s capital structure is reflected in the preceding chart. Over the past five years, the Company’s debt-to-equity ratio has ranged from .62:1 to .78:1. Equity has increased $27.4 million or 10.7% to $283.7 million over the past five years and interest-bearing debt has increased $16.1 million or 10.1% to $175.9 million compared to $159.8 million in 2007. During this same time frame, the Company has made capital expenditures of $216.6 million and has paid distributions and dividends of $309.1 million while maintaining an appropriate amount of debt. This reflects the Company’s balanced approach of investing to sustain and grow the business while providing shareholders with an annual cash return. Consolidated debt at the end of the year decreased $16.7 million or 8.7% to $175.9 million compared to $192.6 million in 2010, and was down $33.3 million or 15.9% from $209.2 million in 2009. The decrease in debt compared to 2010 is largely due
to a decrease in amounts drawn on International Operations loan facilities and the repayment of a US$3.9 million note payable as summarized in the debt table below. The exchange rate used to translate U.S. denominated debt into Canadian dollars at January 31, 2012 was 1.0052 compared to 1.0022 at January 31, 2011 and 1.0650 at January 31, 2010. The difference in exchange rate did not have a significant impact on the translation of U.S. denominated debt in 2011 compared to 2010 but the impact of the stronger Canadian dollar in 2011 resulted in a $6.4 million decrease in long-term debt compared to 2009. Average debt outstanding during the year excluding the foreign exchange impact decreased $20.5 million or 9.6% from 2010 and was down $25.9 million or 11.8% compared to 2009. The debt outstanding at the end of the fiscal year is summarized as follows:
Debt CGAAP($ in thousands at the end of the fiscal year) 2011 2010 2009
Senior notes $ 69,626 $ 69,199 $ 73,481
Canadian revolving loan facilities 68,850 67,445 72,853
U.S revolving loan facilities 36,187 50,110 55,380
Notes payable 659 4,850 5,567
Capital leases 570 992 1,577
Bank advances - - 312
Total $175,892 $192,596 $209,170
Shareholder Equity The Company has an unlimited number of authorized shares and had issued and outstanding shares at January 31, 2012 of 48,378,000 (48,378,000 as at January 31, 2011). Further information on the Company’s capital is provided in Note 15 to the consolidated financial statements. Book value per share, on a diluted basis, at the end of the year decreased to $5.85 compared to $5.91 per share in 2010. Shareholders’ equity decreased $2.8 million or 1.0% compared to 2010 due to lower net earnings, largely related to the taxation of Canadian earnings as a result of the conversion to a share corporation, and a $15.3 million charge to retained earnings related to net actuarial losses on the Company’s defined benefit pension plan. This was partially offset by dividends of $46.4 million in 2011 compared to distributions of $70.2 million under the Fund structure in 2010. Further information is provided in the statements of changes in shareholders’ equity in the consolidated financial statements.
M A N AG E M E N T ’ S D I S CU S S I O N & A N A LYS I S 1 7
Capital StructureDebt Equity ($ in millions) Debt:Equity
0
40
80
120
160
200
240
280
320
20112007CGAAP
2008CGAAP
2009CGAAP
20100.00
0.40
0.80
1.20
1.60
2.00
2.40
2.80
3.20
160
256
213
274
209
290
193
286
176
284
.62.78 .72 .67 .62
1 8 T H E N O RT H W E S T CO M PA N Y I N C . 2 0 1 1
QUARTERLY FINANCIAL INFORMATION
Historically, the Company’s first quarter sales are the lowest and fourth quarter sales are the highest, reflecting consumer buying patterns. Weather conditions are often more extreme compared to other retailers and can affect sales in any quarter. Net earnings generally follow higher sales, but can be dependent on markdown activity in key sales periods to reduce excess inventories. Net earnings are historically lower in the first quarter due to lower sales and fixed costs such as rent and overhead that apply uniformly throughout the year.
The following is a summary of selected quarterly financial information:
($ thousands) Q1 Q2 Q3 Q4 Total
Sales
2011 $346,262 $372,945 $378,359 $397,570 $1,495,136
2010 $340,133 $366,205 $367,285 $374,481 $1,448,104
Trading profit (EBITDA)
2011 $ 28,387 $ 32,408 $ 34,476 $ 30,610 $ 125,881
2010 $ 28,333 $ 32,235 $ 34,215 $ 30,981 $ 125,764
Earnings from operations (EBIT)
2011 $ 19,385 $ 23,408 $ 25,448 $ 21,068 $ 89,309
2010 $ 19,521 $ 23,376 $ 25,420 $ 21,955 $ 90,272
Net earnings
2011 $ 12,425 $ 15,035 $ 17,000 $ 13,501 $ 57,961
2010 $ 17,848 $ 20,233 $ 22,409 $ 9,166 $ 69,656
Earnings per share/unit—basic
2011 $ 0.26 $ 0.31 $ 0.35 $ 0.28 $ 1.20
2010 $ 0.37 $ 0.42 $ 0.47 $ 0.19 $ 1.45
Earnings per share/unit—diluted
2011 $ 0.26 $ 0.31 $ 0.35 $ 0.27 $ 1.19
2010 $ 0.37 $ 0.42 $ 0.46 $ 0.19 $ 1.44
Fourth Quarter Highlights Fourth quarter consolidated sales increased 6.2% to $397.6 million compared to $374.5 million in 2010. Excluding the foreign exchange impact, sales increased 5.7% and were up 5.1% on a same store basis as a result of strong food and general merchandise sales growth across all of our banners. Food sales(1) increased 4.6% and were up 4.3% on a same store basis. General merchandise sales(1) increased 8.4% and were up 7.5% on a same store basis. Earnings from operations decreased 4.0% to $21.1 million compared to the fourth quarter last year as increases in sales and gross profit were offset by higher selling, operating and administrative expenses related largely to higher incentive plan expenses. Annual and long-term incentive plan expenses increased $4.2 million compared to last year as a result of improved financial performance, led by the International Operations, and incremental expense related to share-based compensation programs. Excluding the foreign exchange impact and the increase in incentive plan expense, earnings from operations increased 14.2% compared to the fourth quarter last year. Trading profit
(2) or earnings before interest, income taxes, depreciation and amortization (EBITDA) decreased 1.2%
to $30.6 million compared to $31.0 million last year. Excluding the foreign exchange impact and the increase in incentive plan expense, trading profit increased 11.7% and was 8.8% as a percentage to sales compared to 8.3% last year. Income tax expense decreased to $6.0 million compared to $11.2 million in the fourth quarter last year. This decrease is largely due to the conversion to a share corporation on January 1, 2011 and the related impact of IFRS on the income tax rates used to calculate deferred income tax assets and liabilities under the Fund structure compared to a corporate structure (see Conversion to a Share Corporation on page 7 for further information). Upon conversion to a share corporation, the fourth quarter 2010 deferred tax assets and liabilities were calculated using substantively enacted corporate income tax rates of approximately 27% compared to the 46.4% that was required to be used by IFRS under the Fund structure prior to conversion. This change in income tax rates resulted in an incremental income tax expense of approximately $8.4 million in the 2010 fourth quarter comparative numbers. Net earnings increased 47.3% to $13.5 million and diluted earnings per share increased to $0.27 compared to $0.19 per unit last year largely due to the changes in deferred income taxes in the 2010 fourth quarter comparative numbers discussed above. Excluding the impact of the Canadian income tax expense in 2011 and 2010, diluted earnings per share would have decreased $0.02 per share compared to the fourth quarter last year. Working capital increased 68.8% or $68.4 million compared to the fourth quarter last year largely due to the decrease in the current portion of long-term debt. The decrease in the current portion of long-term debt is due to the Canadian Operations loan facilities that were refinanced on December 5, 2011. Excluding the impact of the maturing loan facilities, working capital increased $1.0 million or 0.6% compared to last year. Cash flow from operating activities in the quarter decreased $1.8 million to $52.3 million from $54.1 million last year largely due to lower earnings before income taxes. Cash used for investing activities in the quarter increased to $16.6 million compared to $10.7 million last year due to a difference in the timing of capital investments. For the year, cash used in investing activities increased 32.3% to $45.1 million compared to last year. Cash used for financing activities in the quarter was $42.8 million compared to $41.0 million last year. The change in long-term debt in the quarter is largely due to a decrease in the amount drawn on the International Operations revolving loan facility compared to last year. Further information on the quarterly financial performance of the Company is provided in the interim MD&A available on the Company’s website at www.northwest.ca or on SEDAR at www.sedar.com.
(1) Excluding the foreign exchange impact (2) See Non-GAAP financial measures section on page 26

M A N AG E M E N T ’ S D I S CU S S I O N & A N A LYS I S 1 9
banners in these markets in 2012. Expanded discount square footage in western Canada will potentially have an adverse impact on approximately half of our Giant Tiger stores beginning in late 2012, which will be partially offset by improvements to Giant Tiger’s fashion apparel offer, relatively strong consumer demand, and the exit of some competitors. Sales growth in our Alaskan stores are expected to moderate as economic conditions and rising utility costs are projected to impact consumer discretionary income. Sales at CUL are expected to deliver mixed growth as tourism dependent economies improve at varying rates. Net capital expenditures for 2012 are projected to be in the range of $60 million to $70 million (2011 - $45.1 million) reflecting the opening and acquisition of new stores, major replacement store projects, energy conservation projects, staff housing renovations, corporate information systems upgrades and the implementation of a transportation management system. The investments in staff housing and the transportation management system, which are the result of our “More Growth in Store” focus, account for approximately $11 million of the projected capital expenditures. The remaining increase in projected capital spending in 2012 compared to prior years is due to a larger than usual number of northern store replacement projects caused by fire losses over the past 18 months and agreements being reached with First Nation communities. Actual year-to-year expenditures depend upon the completion of negotiations and shipment of construction materials to remote markets and therefore, the amount and timing can fluctuate as it has over the past few years. Beyond 2012, capital spending is expected to return to an average of $40 million to $50 million per year.
RISK MANAGEMENT
The North West Company is exposed to a number of risks in its business. The descriptions of the risks below are not the only ones facing the Company. Additional risks and uncertainties not presently known to the Company, or that the Company deems immaterial, may also impair the operations of the Company. If any of such risks actually occur, the business, financial condition, liquidity, and results of operations of the Company could be materially adversely affected. Readers of this MD&A are also encouraged to refer to the Key Performance Drivers and Capabilities and Outlook sections of this MD&A, as well as North West’s Annual Information Form, which provides further information on the risk factors facing the Company. While the Company employs strategies to minimize these risks, these strategies do not guarantee that events or circumstances will not occur that could negatively impact the Company’s financial condition and performance. Careful consideration should be given to the risk factors which include, but are not limited to, the following:
Retail Industry and Economic Environment External factors which affect customer demand, and over which the Company exercises no influence, include general economic growth, inflation, interest rates, exchange rates, changes in commodity prices, personal debt levels, unemployment rates and levels of personal disposable income. In an economic downturn, discounting by
DISCLOSURE CONTROLS
Management is responsible for establishing and maintaining a system of disclosure controls and procedures to provide reasonable assurance that material information relating to the Company is reported to senior management, including the Chief Executive Officer (“CEO”) and Chief Financial Officer (“CFO”) on a timely basis so that decisions can be made regarding public disclosure. There are inherent limitations to the effectiveness of any system of disclosure controls and procedures, including the possibility of human error and the circumvention or overriding of the controls and procedures. Accordingly, even effective disclosure controls and procedures can only provide reasonable assurance of achieving their control objectives. Based on an evaluation of the Company’s disclosure controls and procedures, as required by National Instrument 52-109 (Certification of Disclosure in Issuers’ Annual and Interim Filings), the Company’s CEO and CFO have concluded that these controls and procedures were designed and operated effectively as of January 31, 2012.
INTERNAL CONTROLS OVER FINANCIAL REPORTING
Management is responsible for establishing and maintaining internal controls over financial reporting to provide reasonable assurance regarding the reliability of financial reporting and the preparation of financial statements for external purposes in accordance with International Financial Reporting Standards. All internal control systems, no matter how well designed, have inherent limitations. Therefore, even those systems determined to be effective can only provide reasonable assurance with respect to financial reporting. Based on an evaluation of the Company’s internal controls over financial reporting using the framework published by The Committee of Sponsoring Organizations of the Treadway Commission (“COSO Framework”) as required by National Instrument 52-109, the Company’s CEO and CFO have concluded that the internal controls over financial reporting were designed and operated effectively as of January 31, 2012. There have been no changes in the internal controls over financial reporting during the quarter and for the year ended January 31, 2012 that have materially affected or are reasonably likely to materially affect the internal controls over financial reporting.
OUTLOOK
The Company’s strategic priorities are based on four “More Growth in Store” initiatives: in-stock performance, perishable food profitability, supply chain improvements and store management stability. Progress on each of these work streams was significant in 2011 and met our performance targets. Our success in these areas is helping to offset longer-duration performance improvement work within our Giant Tiger and Cost-U-Less store banners. Economic conditions in northern Canada, led by resource development and a cycling through of Nutrition North price reductions, are expected to remain favourable and this is expected to contribute to same store sales gains from our

2 0 T H E N O RT H W E S T CO M PA N Y I N C . 2 0 1 1
major retailers may result in more out-shopping by consumers from the Company’s markets, which may negatively impact sales and gross profit. Changes in the inflation rate are unpredictable and may impact the cost of merchandise and the prices charged to consumers which in turn could negatively impact sales and net earnings. Although our core customer is a lower income shopper with relatively stable income sources, a recession or significant and prolonged decline in consumer spending could have an adverse effect on the financial condition and results of operations. Management regularly monitors economic conditions and considers factors which can affect customer demand in making operating decisions and the development of strategic initiatives and long-range plans.
Consumer Income Our largest customer segment derives most of its income directly or indirectly from government infrastructure spending or direct payment to individuals in the form of social assistance, child tax benefits and old age security. These tend to be stable sources of income, independent of economic cycles. Other forms of government spending such as the Nutrition North Canada food subsidy program, although not directly paid to individuals, also contribute to lower cost of living for customers in eligible communities. A major source of employment income is generated from local government and spending on infrastructure projects. This includes new housing, schools, healthcare facilities, military facilities, roads and sewers. Local employment levels will fluctuate from year-to-year depending on a community’s fiscal health, especially near the end of the government budget year. A similar fluctuating source of income is employment related to tourism and natural resource development and extraction activities. A significant or prolonged reduction in government transfers, subsidy programs, spending on infrastructure projects, natural resource development and tourism spending would have a negative impact on consumer income which in turn could result in a decrease in sales and gross profit, particularly for more discretionary general merchandise items.
Competition We have a leading market position in a large percentage of the markets we serve. Sustaining and growing this position depends on our ability to continually improve customer satisfaction while identifying and pursuing new sales opportunities. We actively monitor competitive activity and we are proactive in enhancing our value offer elements, ranging from in-stock position to service and pricing. The entrance of new competitors or an increase in competition in the Company’s markets could negatively impact sales and financial performance.
Community Relations A portion of the Company’s sales are derived from communities and regions that restrict commercial land ownership and usage by non-indigenous or non-local owned businesses or which have enacted policies and regulations to support locally-owned businesses. We successfully operate within these environments through initiatives that promote positive community and customer relations. These include store lease arrangements with community-based development organizations, initiatives to recruit local residents into management positions, encourage indigenous or Aboriginal participation on our Board of Directors, and direct investment
in the Company by locally-owned entities. To the extent the Company is not successful in maintaining positive community and customer relations in these locations, or is unable to renew lease agreements with community-based organizations, it could have an adverse effect on sales and financial performance.
Employee Development and Retention Retaining and developing high calibre employees is essential to effectively managing our business, executing our strategies and meeting our objectives. Due to the vast geography and remoteness of the Company’s markets, there is significant competition for talent and a limited number of experienced personnel, particularly at the store management level. The degree to which the Company is not successful in retaining and developing employees and establishing appropriate succession plans could lead to a lack of knowledge, skills and experience required to effectively run our operations and execute our strategies. In 2010, the Company began work on the store stability initiative. This initiative, which is part of the long-range plan, is focused on having all stores reach a targeted level of capability and stability within three years. In addition to compensation programs that are designed to attract and retain qualified personnel, the Company also continues to implement and refine initiatives such as comprehensive store-based manager-in-training programs and the Company’s in-depth leadership development program. These types of programs are long-term management investments that continue to be refined.
Food Safety The Company is exposed to risks associated with food safety and product handling. Food sales represent approximately 76% of total Company sales. A significant outbreak of a food-borne illness or increased public concerns with certain food products could have an adverse effect on the financial performance of the Company. The Company has food preparation, handling and storage procedures which help mitigate these risks. The Company also has product recall procedures in place in the event of a food-borne illness outbreak. The existence of these procedures does not eliminate the underlying risks and the ability of these procedures to mitigate risk in the event of a food-borne illness is dependent on their successful execution.
Fuel and Utility Costs Compared to other retailers, the Company is more exposed to fluctuations in the price of energy, particularly oil. Due to the vast geography and remoteness of the store network, expenses related to aviation fuel, diesel-generated electricity, and heating fuel costs are a more significant component of the Company’s and its customers’ expenses compared to other companies in the retail industry. To the extent that escalating fuel and utility costs cannot be offset by energy conservation practices or offsetting productivity gains, they may result in lower margins or higher retail prices which may affect the Company’s financial performance. Consumer spending, especially on discretionary items, may also be adversely affected.
Income Taxes The Company accounts for income taxes using the liability method of tax allocation. Under the liability method, deferred income tax assets and liabilities are determined based on the differences between the financial statement carrying

M A N AG E M E N T ’ S D I S CU S S I O N & A N A LYS I S 2 1
values and tax bases of assets and liabilities, and are measured using substantively enacted tax rates and laws that are expected to be in effect in the periods in which the deferred income tax assets or liabilities are expected to be realized or settled. The provision for income taxes is recorded in the Company at applicable statutory rates. In the ordinary course of business, the Company is subject to ongoing audits by tax authorities. While the Company believes that its tax filing positions are appropriate and supportable, the possibility exists that certain matters may be reviewed and challenged by the tax authorities. The Company regularly reviews the potential for adverse outcomes and the adequacy of its tax provisions. The Company believes that it has adequately provided for these matters. If the final outcome differs materially from the tax provisions, the Company’s income tax expense and its earnings could be affected positively or negatively in the period in which the matters are resolved.
Environmental The Company owns a large number of facilities and real estate, particularly in remote locations, and is subject to environmental risks associated with the contamination of such facilities and properties. The Company operates gasoline dispensing units in a number of locations and also uses fuel to heat stores and housing. Contamination resulting from gasoline and heating fuel is possible. The Company employs monitoring and testing procedures to minimize the risk of contamination. The Company also operates refrigeration equipment in its stores and distribution centers which, if the equipment fails, could release gases that may be harmful to the environment. The Company has monitoring and preventative maintenance procedures to reduce the risk of this contamination occurring. Even with these risk mitigation policies and procedures, the Company could incur increased or unexpected costs related to environmental incidents and remediation activities, including litigation and regulatory compliance costs, all of which could have an adverse effect on the reputation and financial condition and financial performance of the Company.
Insurance The Company manages its exposure to certain risks through an integrated insurance program which combines an appropriate level of self-insurance and the purchase of various insurance policies. The Company’s insurance program is based on various lines and limits of coverage. Insurance is arranged with financially stable insurance companies as rated by the professional rating agencies. There is no guarantee that any given risk will be mitigated in all circumstances or that the Company will be able to continue to purchase this insurance coverage at reasonable rates.
Climate Weather conditions can play a significant role in the operation of the stores of the Company’s operating subsidiaries. These weather conditions can range from blizzards to hurricanes and cyclones, and can cause loss of life, damage to and destruction of key stores. Such losses may have an adverse effect on the financial condition and performance. As well, any global warming conditions would have a more pronounced effect, both positive and negative, on the Company’s most northern latitude stores. The stores located in the South Pacific, Caribbean and coastal areas of Alaska are also at risk from
hurricanes, cyclones, typhoons, earthquakes and tsunamis which can result in loss of life and destruction of assets.
Information Technology The Company relies on information technology (“IT”) to support the current and future requirements of the business. IT systems are relied upon to provide essential information to management for decision making. Any significant failure or disruption in IT systems, or the failure to successfully upgrade legacy systems or implement new systems could have an adverse effect on the financial condition and results of operations. In 2012, the Company will begin implementing a transportation management system (“TMS”). Failure by the Company to successfully implement this system could cause disruption in the flow of merchandise to the stores, which could negatively affect the reputation and financial performance of the Company. Furthermore, the failure to integrate the TMS with other IT systems and implement appropriate processes to support the TMS may result in failing to capture planned efficiency and effectiveness gains. To mitigate these risks, the Company has engaged an implementation partner and instilled a strong governance structure and disciplined project management.
Laws, Regulations and Standards The Company is subject to various laws and regulations administered by federal, provincial and foreign regulatory authorities, including but not limited to income, commodity and other taxes, duties, currency repatriation, zoning, health and safety, employment standards, privacy laws and licensing requirements. New accounting standards and pronouncements or changes in accounting standards, including the transition to International Financial Reporting Standards, may also impact the Company’s financial results. These laws, regulations and standards and their interpretation by various courts and agencies are subject to change. In the course of complying with such changes, the Company may incur significant costs. Failure by the Company to fully comply with applicable laws, regulations and standards could result in financial penalties, assessments, sanctions, or legal action that could have an adverse effect on the reputation and the financial performance of the Company.
Management of Inventory Success in the retail industry is dependent upon the ability to manage merchandise inventories in proportion to the demand for such merchandise. A miscalculation of consumer demand for merchandise could result in having excess inventory for some products and missed sales opportunities for others. Excess inventory may result in higher markdowns or inventory shrinkage all of which could have an adverse effect on the financial performance of the Company.
Vendor and Service Partner Management The Company relies on a broad base of manufacturers and suppliers to provide goods and services. Events or disruptions affecting these suppliers outside of the Company’s control could in turn result in delays in the delivery of merchandise to the stores and therefore negatively impact financial performance. A portion of the merchandise the Company sells is purchased offshore. Offshore sourcing could provide products that contain harmful or banned substances or do not meet the required standards. The Company uses offshore consolidators and sourcing agents

2 2 T H E N O RT H W E S T CO M PA N Y I N C . 2 0 1 1
to monitor product quality and reduce the risk of sub-standard products however, there is no certainty that these risks can be completely mitigated in all circumstances.
Ethical Business Conduct The Company has a Code of Business Conduct and Ethics policy which governs both employees and Directors. The Business Ethics Committee monitors compliance with the Code of Business Conduct and Ethics. The Company also has a Vendor Information Manual which outlines the Company’s expectations for the ethical conduct of its vendors. Unethical business conduct could negatively impact the Company’s reputation and relationship with its customers, investors, and employees, which in turn could have an adverse effect on the financial performance of the Company.
Geopolitical Changes in the domestic or international political environment may impact the Company’s ability to source and provide products and services. Acts of terrorism, riots, and political instability could have an adverse effect on the financial condition and results of operations.
Post-Employment Benefits The Company engages professional investment advisors to manage the assets in the defined benefit pension plans. The performance of the Company’s pension plans and the plan funding requirements are impacted by the returns on plan assets, changes in the discount rate and regulatory funding requirements. The Company regularly monitors and assesses the performance of the pension plan assets and the impact of changes in capital markets, changes in plan member demographics, and other economic factors that may impact funding requirements, benefit plan expenses and actuarial assumptions. If capital market returns are below the level estimated by management, or if the discount rate used to value the liabilities of the plans decreases, the Company may be required to make contributions to its defined benefit pension plans in excess of those currently contemplated, which may have an adverse effect on the Company’s financial condition and performance.
Financial Risks In the normal course of business, the Company is exposed to financial risks that have the potential to negatively impact its financial performance. The Company manages financial risk with oversight provided by the Board of Directors, who also approve specific financial transactions. The Company uses derivative financial instruments only to hedge exposures arising in respect of underlying business requirements and not for speculative purposes. These risks and the actions taken to minimize the risks are described below. See Note 14 to the consolidated financial statements for additional information on the Company’s financial instruments and associated risks.
Credit Risk Credit risk is the risk of financial loss to the Company if a customer or counterparty to a financial instrument fails to meet its contractual obligations. The Company is exposed to credit risk primarily in relation to individual and commercial accounts receivable. The Company manages credit risk by performing regular credit assessments of its customers and provides allowances for potentially uncollectible accounts receivable. The Company does not have any individual customer accounts greater than 10% of total accounts receivable.
Liquidity Risk Liquidity risk is the risk that the Company will not be able to meet its financial obligations as they come due or can do so only at excessive cost. The Company manages liquidity risk by maintaining adequate credit facilities to fund operating requirements and sustaining and growth-related capital expenditures and regularly monitoring actual and forecasted cash flow and debt levels. At January 31, 2012, the Company had undrawn committed revolving loan facilities available of $126.4 million (January 31, 2011 - $94.6 million). The Company’s International Operations has a US$20.0 million loan facility that matures on October 31, 2012. The Company does not anticipate any difficulty in refinancing this loan facility however, global economic conditions continue to result in uncertainty and volatility in the credit markets which may negatively impact the availability of credit, interest rates and covenants for Companies seeking to refinance debt. To the extent the Company cannot meet its obligations or refinance its debt when it comes due, or can do so only at an excessive cost, this may have an adverse effect on the financial condition and financial performance of the Company. For further information on loan facilities, see Note 11 to the consolidated financial statements.
Currency Risk Currency risk is the risk that the fair value or future cash flows of a financial instrument will fluctuate because of changes in foreign exchange rates. The Company is exposed to currency risk, primarily the U.S. dollar, through its net investment in International Operations and its U.S. dollar denominated borrowings. The Company manages its exposure to currency risk by hedging the net investment in foreign operations with a portion of U.S. dollar denominated borrowings. The Company is also exposed to currency risk relating to the translation of International Operations earnings from U.S. dollars to Canadian dollars. During 2011, the Canadian dollar was on average stronger than the U.S. dollar compared to 2010. In 2010, the Canadian dollar was on average stronger than the U.S. dollar compared to 2009. The stronger Canadian dollar in 2011 decreased the translation of U.S. denominated net earnings from International Operations by $0.4 million compared to a decrease in the translation of net earnings of $1.2 million in 2010 compared to 2009.
Interest Rate Risk Interest rate risk is the risk that the fair value or future cash flows of a financial instrument will fluctuate because of changes in market interest rates. The Company is exposed to interest rate risk primarily through its long-term borrowings. The Company manages exposure to interest rate risk by using a combination of interest rate swaps and a mixture of fixed and floating interest rate debt. Additional information regarding interest rate swaps is provided in Note 11 and Note 14 to the consolidated financial statements.

M A N AG E M E N T ’ S D I S CU S S I O N & A N A LYS I S 2 3
CRITICAL ACCOUNTING ESTIMATES
The preparation of financial statements in accordance with IFRS requires management to make estimates and assumptions that affect the reported amounts and disclosures made in the consolidated financial statements and accompanying notes. Management continually evaluates the estimates and assumptions it uses. These estimates and assumptions are based on management’s historical experience, knowledge of current events, expectations of future outcomes and other factors that management considers reasonable under the circumstances. Actual results could differ from these estimates as confirming events occur. The estimates and assumptions described in this section depend upon subjective or complex judgments about matters that may be uncertain and changes in these estimates and assumptions could materially impact the consolidated financial statements. Valuation of Accounts Receivable The Company records an allowance for doubtful accounts related to accounts receivable that may potentially be impaired. The allowance is based on the aging of the accounts receivable, our knowledge of our customers’ financial condition, the current business environment and historical experience. A significant change in one or more of these factors could impact the estimated allowances for doubtful accounts recorded in the consolidated balance sheet and the provisions for debt loss recorded in the consolidated statement of earnings. Valuation of Inventories Retail inventories are stated at the lower of cost and net realizable value. Significant estimation or judgment is required in the determination of: (1) discount factors used to convert inventory to cost after a physical count at retail has been completed; (2) recognizing merchandise for which the customer’s perception of value has declined and appropriately marking the retail value of the merchandise down to the perceived value; and (3) estimating inventory losses, or shrinkage, occurring between the last physical count and the balance sheet date. Food inventories counted at retail are converted to cost by applying a discount factor to retail selling prices. This discount factor is calculated in relation to historical gross margins and is reviewed on a regular basis for reasonableness. General merchandise inventories counted at retail are converted to cost by applying average cost factors by merchandise category. These cost factors represent the average cost-to-retail ratio for each merchandise category based on beginning inventory and purchases made throughout the year. Inventory shrinkage is estimated as a percentage of sales for the period from the date of the last physical inventory count to the balance sheet date. The estimate is based on experience and the most recent physical inventory results. To the extent that actual losses experienced vary from those estimated, both inventories and cost of sales may be impacted. Changes or differences in these estimates may result in changes to inventories on the consolidated balance sheet and a charge or credit to cost of sales in the consolidated statement of earnings. Additional information regarding inventories is provided in Note 6 to the consolidated financial statements.
Post-Employment Benefits The cost and accrued benefit plan obligations of the Company’s defined benefit pension plans are accrued based on actuarial valuations which are dependent on assumptions determined by management. These assumptions include the discount rate used to calculate benefit plan obligations, the expected long-term rate of return on plan assets, the rate of compensation increase, retirement ages, and mortality rates. These assumptions are reviewed by management and the Company’s actuaries. The discount rate used to calculate benefit plan obligations, the expected long-term rate of return on plan assets and the rate of compensation increase are the three most significant assumptions. The discount rate used to calculate benefit plan obligations is based on market interest rates, as at the Company’s measurement date of January 31, 2012 on a portfolio of Corporate AA bonds with terms to maturity that, on average, matches the terms of the accrued benefit plan obligations. The discount rates used to measure the benefit plan obligations for fiscal 2011 and 2010 were 4.5% and 5.8% respectively. The expected long-term rate of return on plan assets is based on historical returns, the asset mix and current investment yields. The expected long-term rate of return on plan assets for fiscal 2011 and 2010 was 6.5%. Management assumed the rate of compensation increase for fiscal 2011 and 2010 at 4%. These assumptions may change in the future and may result in material changes in the defined benefit plan obligation on the Company’s consolidated balance sheet, the defined benefit plan expense on the consolidated statement of earnings and the net actuarial gains or losses recognized in comprehensive income and retained earnings. Changes in financial market returns and interest rates could also result in changes to the funding requirements of the Company’s defined benefit pension plans. Additional information regarding the Company’s post-employment benefits is provided in Note 12 to the consolidated financial statements. Impairment of Long-lived Assets The Company assesses the recoverability of values assigned to long-lived assets quarterly after considering potential impairment indicated by such factors as business and market trends, future prospects, current market value and other economic factors. If there is an indication of impairment, the recoverable amount of the asset, which is the higher of its fair value less costs to sell and its value in use, is estimated in order to determine the extent of the impairment loss. Where the asset does not generate cash flows that are independent from other assets, the Company estimates the recoverable amount of the cash-generating unit (CGU) to which the asset belongs. For tangible and intangible assets excluding goodwill, the CGU is the smallest group of assets that generates cash inflows from continuing use that are largely independent of the cash inflows of other assets or groups of assets. Any impairment charge is recognized in the consolidated statement of earnings in the period in which it occurs, to the extent that the carrying value exceeds its recoverable amount. The underlying estimates for cash flows include estimates for future sales, gross margin rates and store expenses, and are based upon the stores’ past and expected future performance. Changes which may impact future cash flows include, but are not limited to, competition, general economic conditions and unrecoverable
2 4 T H E N O RT H W E S T CO M PA N Y I N C . 2 0 1 1
increases in operating costs. To the extent that management’s estimates are not realized, future assessments could result in impairment charges that may have a significant impact on the Company’s consolidated balance sheet and consolidated statement of earnings. Goodwill Goodwill is not amortized but is subject to an impairment test annually and whenever indicators of impairment are detected. Goodwill is allocated to CGU’s that are expected to benefit from the synergies of the related business combination and represents the lowest level within the Company at which goodwill is monitored for internal management purposes, which is the Company’s International Operating segment before aggregation. The value of the goodwill was tested by means of comparing the recoverable amount of the operating segment to its carrying value. To calculate the operating segment’s recoverable amount, the Company uses the capitalized earnings method. The product of maintainable earnings and a capitalization rate are used to determine the recoverable amount. The capitalization rate is based on the International Operations weighted-average cost of capital. Key assumptions in the capitalization rate include: equity risk premium, debt-to-equity ratio, pre-tax cost of debt capital and company specific risk premium. To the extent that management’s estimates are not realized, future assessments could result in impairment charges that may have a significant impact on the Company’s consolidated balance sheet and consolidated statement of earnings. The Company performed the annual goodwill impairment test in 2011 and it was determined that the recoverable amount of the International Operations operating segment exceeded its carrying value and therefore, no goodwill impairment was identified. Income Taxes Deferred tax assets and liabilities are recognized for the future income tax consequences attributable to temporary differences between the financial statement carrying values of assets and liabilities and their respective income tax bases. Deferred income tax assets or liabilities are measured using enacted or substantively enacted income tax rates expected to apply to taxable income in the years in which those temporary differences are expected to be recovered or settled. The calculation of current and deferred income taxes requires management to make estimates and assumptions and to exercise a certain amount of judgment regarding the financial statement carrying values of assets and liabilities which are subject to accounting estimates inherent in those balances. The deferred income tax assets and liabilities are also impacted by the interpretation of income tax legislation across various jurisdictions, expectations about future financial results and the timing of reversal of temporary differences, and possible audits of tax filings by the regulatory agencies. Changes or differences in these estimates or assumptions may result in changes to the current or deferred income tax balances on the consolidated balance sheet, a charge or credit to income tax expense in the consolidated statement of earnings and may result in cash payments or receipts. Additional information on income taxes is provided in Note 9 to the consolidated financial statements.
TR ANSITION TO INTERNATIONAL FINANCIAL REPORTING STANDARDS (IFRS)
The Accounting Standards Board of the Canadian Institute of Chartered Accountants required all publicly accountable enterprises to adopt International Financial Reporting Standards (IFRS) for interim and annual financial statements relating to fiscal years beginning on or after January 1, 2011. Accordingly, the transition from previous Canadian generally accepted accounting principles (CGAAP) to IFRS was applicable to the Company’s financial reporting for the year ended January 31, 2012 (“2011”) commencing with the first quarter beginning February 1, 2011. The comparative financial information for 2010 was also restated to conform with IFRS. The transition from CGAAP to IFRS impacted the Company’s accounting, financial statements and disclosures, information systems, internal controls over financial reporting and disclosure controls and procedures. Financial reporting under IFRS differs from CGAAP in a number of respects, some of which are significant. The transition to IFRS resulted in an increase in assets of $4.7 million, an increase in liabilities of $13.1 million and a decrease in shareholders’ equity of $8.4 million on the Company’s February 1, 2010 opening transition balance sheet. The increase in liabilities and decrease in shareholders’ equity was primarily related to differences in accounting for post-employment benefits and income taxes. The decrease in 2010 net earnings reported under IFRS is primarily due to the Company’s conversion to a share corporation and the application of corporate tax rates used to calculate deferred tax assets. An explanation of the transition from CGAAP to IFRS as well as reconciliations prepared in accordance with IFRS 1, First-time Adoption of International Financial Reporting Standards is provided in Note 24 to the consolidated financial statements. In connection with the transition to IFRS, the Company completed a review of the impact of IFRS on disclosure controls and internal controls over financial reporting to ensure appropriate controls and procedures are in place. There were no material changes in disclosure controls and internal controls over financial reporting as a result of adopting IFRS.

M A N AG E M E N T ’ S D I S CU S S I O N & A N A LYS I S 2 5
FUTURE ACCOUNTING STANDARDS
The Company is currently assessing the impact of the following standards that may apply in future periods. Unless otherwise noted, the following revised standards and amendments are effective for the Company’s annual periods beginning February 1, 2013.
Financial Instruments: Disclosures The IASB issued amendments to IFRS 7, Financial Instruments: Disclosures to expand the disclosure requirements for transfers of financial assets. The Company will apply the amendment for its financial year beginning February 1, 2012 and does not expect its implementation to have a significant impact on its disclosures.
Consolidated Financial Statements The IASB issued IFRS 10, Consolidated Financial Statements replacing portions of IAS 27, Consolidated and Separate Financial Statements addressing consolidation and superseding Standing Interpretations Committee (SIC) Interpretation 12 in its entirety. IFRS 10 establishes principles for the presentation and preparation of consolidated financial statements when an entity controls one or more other entities.
Joint Arrangements The IASB issued IFRS 11, Joint Arrangements superseding IAS 31, Interest in Joint Ventures and SIC-13, Jointly Controlled Entities – Non Monetary Contributions by Venturers. IFRS 11 establishes principles for determining the type of joint arrangement by assessing the venturers’ rights and obligations. This standard provides guidance for financial reporting activities required by entities that have an interest in a jointly controlled arrangement. Joint ventures will be accounted for using the equity method of accounting, whereas for a joint operation the venturer will recognize its share of the ventures’ assets, liabilities, revenues and expenses.
Disclosure of Interests in Other Entities The IASB issued IFRS 12, Disclosure of Interests in Other Entities requiring extensive disclosures relating to a company’s interest in subsidiaries, associates and certain other arrangements. IFRS 12 enables financial statement users to evaluate the nature and risks associated with these interests and evaluate their effect on its own financial performance.
Employee Benefits The IASB has revised IAS 19, Employee Benefits to eliminate the option to defer the recognition of actuarial gains and losses, enhance the guidance around measurement of plan assets and benefit obligations, and streamline the presentation of changes in assets and liabilities arising from defined benefit plans including enhanced disclosure requirements.
Income Taxes The IASB has issued an amendment to IAS 12, Income Taxes introducing an exception to the general measurement requirements of IAS 12 for investment properties measured at fair value. The Company does not expect this
change to have a significant effect on its consolidated financial statements.
Financial Instruments The IASB has issued a new standard which will eventually replace IAS 39, Financial Instruments: Recognition and Measurement. The development of IFRS 9, Financial Instruments is a multi-phase project with a goal of improving and simplifying financial instrument reporting. IFRS 9 uses a single approach to determine measurement of a financial asset based on how an entity manages financial impairment, replacing the multiple classification options in IAS 39 with only two categories: amortized cost and fair value through profit or loss. This standard is effective for the Company’s financial year beginning February 1, 2015.
Presentation of Financial Statements The IASB has amended IAS 1, Presentation of Financial Statements to enhance the presentation of Other Comprehensive Income (OCI). These amendments require the components of OCI to be presented separately for items that may be reclassified to the statement of earnings from those that remain in equity. Fair Value Measurement IFRS 13, Fair Value Measurement is a comprehensive standard for fair value measurement and disclosure requirements for use across all IFRS. The new standard clarifies that fair value is the price that would be received to sell an asset, or paid to transfer a liability in an orderly transaction between market participants, at the measurement date. It also establishes disclosures about fair value measurement.
Financial Instruments The IASB has issued amendments to IFRS 7, Financial Instruments: Disclosures and IAS 32, Financial Instruments: Presentation which clarify the requirements for offsetting financial assets and financial liabilities along with new disclosure requirements for financial assets and liabilities that are offset. These amendments are effective for the Company’s financial years beginning February 1, 2014 and February 1, 2013 respectively.

2 6 T H E N O RT H W E S T CO M PA N Y I N C . 2 0 1 1
NON- GA AP FINANCIAL MEASURES
(1) Trading Profit (EBITDA) is not a recognized measure under IFRS. Management believes that in addition to net earnings, trading profit is a useful supplemental measure as it provides investors with an indication of the Company’s operational performance before allocating the cost of interest, income taxes and capital investments. Investors should be cautioned however, that trading profit should not be construed as an alternative to net earnings determined in accordance with IFRS as an indicator of the Company’s performance. The Company’s method of calculating trading profit may differ from other companies and may not be comparable to measures used by other companies. A reconciliation of consolidated net earnings to trading profit or EBITDA is provided below:
Reconciliation of Net Earnings to Trading Profit (EBITDA)
CGAAP($ in thousands) 2011 2010 2009
Net earnings $ 57,961 $ 69,656 $ 81,813
Add: Amortization 36,572 35,492 35,150
Interest expense 6,026 6,077 5,470
Income taxes 25,322 14,539 7,841
Trading profit (EBITDA) $ 125,881 $ 125,764 $ 130,274
For trading profit information by business segment, see Note 4 “Segmented Information” in the notes to the consolidated financial statements
(2) Earnings From Operations (EBIT) is not a recognized measure under IFRS. Management believes that EBIT is a useful measure as it provides investors with an indication of the performance of the consolidated operations and/or business segments, prior to interest expense and income taxes. Investors should be cautioned however, that EBIT should not be construed as an alternative to net earnings determined in accordance with IFRS as an indicator of the Company’s performance. The Company’s method of calculating EBIT may differ from other companies and may not be comparable to measures used by other companies. A reconciliation of consolidated net earnings to EBIT is provided below:
Reconciliation of Net Earnings to EBIT
CGAAP
($ in thousands) 2011 2010 2009
Net earnings $ 57,961 $ 69,656 $ 81,813
Add: Interest expense 6,026 6,077 5,470
Income taxes 25,322 14,539 7,841
Earnings from operations (EBIT) $ 89,309 $ 90,272 $ 95,124
For earnings from operations (EBIT) information by business segment, see Note 4 “Segmented Information” in the notes to the consolidated financial statements
(3) Return on Net Assets (RONA) is not a recognized measure under IFRS. Management believes that RONA is a useful measure to evaluate the financial return on the net assets used in the business. RONA is calculated as earnings from operations (EBIT) for the year divided by average monthly net assets. The following table reconciles net assets used in the RONA calculation to IFRS measures reported in the audited consolidated financial statements as at January 31:
CGAAP($ in thousands) 2011 2010 2009
Total assets $ 626.9 $ 616.6 $ 623.8
Less: Current liabilities (127.4) (117.1) (115.3)
Other long-term liabilities (39.9) (20.4) (9.4)
Net Assets Employed $ 459.6 $ 479.1 $ 499.1
(4) Return on Equity (ROE) is not a recognized measure under IFRS. Management believes that ROE is a useful measure to evaluate the financial return on the amount invested by shareholders. ROE is calculated by dividing net earnings for the year by average monthly total shareholders’ equity. There is no directly comparable IFRS measure for return on equity.
M A N AG E M E N T ’ S D I S CU S S I O N & A N A LYS I S 2 7
GLOSSARY OF TERMS
Basic earnings per share Net earnings available to shareholders divided by the weighted average number of shares outstanding during the period.
Basis point A unit of measure that is equal to 1/100th of one percent.
CGAAP (Canadian generally accepted accounting principles) The consolidated financial statements for the fiscal years 2009 and prior were prepared in accordance with Canadian generally accepted accounting principles as issued by the Canadian Institute of Chartered Accountants.
Compound Annual Growth Rate (CAGR) The compound annual growth rate is the year-over-year percentage growth rate over a given period of time.
Control label or Private label A brand or related trademark that is owned by the Company for use in connection with its own products and services.
Debt loss An expense resulting from the estimated loss on potentially uncollectible accounts receivable.
Debt covenants Restrictions written into banking facilities and senior notes and loan agreements that prohibit the Company from taking actions that may negatively impact the interests of the lenders.
Debt-to-equity ratio Provides information on the proportion of debt and equity the Company is using to finance its operations and calculated by total debt divided by shareholder equity.
Diluted earnings per share The amount of net earnings for the period available to shareholders divided by the weighted-average number of shares outstanding during the period including the impact of all potential dilutive outstanding shares at the end of the period.
Earnings from operations (EBIT) Net earnings before interest and income taxes provides an indication of the Company’s performance prior to interest expense and income taxes. See Non-GAAP financial measures on page 26.
EBIT margin EBIT divided by sales.
Fair value The amount of consideration that would be agreed upon in an arm’s length transaction between knowledgeable, willing parties who are under no compulsion to act.
Gross profit Sales less cost of goods sold and inventory shrinkage.
Gross profit rate Gross profit divided by sales.
Hedge A risk management technique used to manage interest rate, foreign currency exchange or other exposures arising from business transactions.
Interest coverage Net earnings before interest and income taxes divided by interest expense.
IFRS (International Financial Reporting Standards) Effective for the 2011 fiscal year, the consolidated financial statements were prepared in accordance with International Financial Reporting Standards as issued by the International Accounting Standards Board. Comparative financial information for the year ended January 31, 2011 (“2010”) previously reported in the consolidated financial statements prepared in accordance with CGAAP has been restated in accordance with the accounting policies and financial statement presentation adopted under IFRS.
Return on equity Net earnings divided by average shareholder equity.
Return on net assets Net earnings before interest and income taxes divided by average net assets employed (average total assets less accounts payable and accrued liabilities, income taxes payable and asset retirement obligations).
Same store sales Retail sales from stores that have been open more than 52 weeks in the periods being compared.
Trading profit (EBITDA) Net earnings before interest, income taxes, depreciation and amortization provides an indication of the Company’s operational performance before allocating the cost of interest, income taxes and capital investments. See Non-GAAP financial measures on page 26.
Trading profit margin Trading profit divided by sales.
Working capital Total current assets less total current liabilities.
Year The fiscal year ends on January 31. The 2011 year which ended January 31, 2012 had 365 days of operations. The 2010 year which ended January 31, 2011 had 365 days of operations. The 2009 year which ended January 31, 2010 had 365 days of operations. The 2008 year which ended January 31, 2009 had 366 days of operations as a result of the February 29 leap year. The 2007 year which ended January 31, 2008 had 365 days of operations.

The North West Company Inc.Gibraltar House, 77 Main Street Winnipeg, Manitoba Canada R3C 2R1T 204 934 1756 F 204 934 1317Toll-free 1 800 563 [email protected]
Nor’Westers are associated with the vision, perseverance, and enterprising spirit of the voyageurs who pushed past limits to further our Company’s growth during the fur trade. We trace our roots to 1668, and the establishment of one of North America’s early trading posts at Waskaganish on James Bay. Today, we continue to embrace this pioneering culture as true “frontier merchants.”