Embed Size (px)
Citation preview
The North American Monsoon in a Changing Climate
Christopher L. CastroDepartment of Hydrology and Atmospheric SciencesUniversity of Arizona
2020 Sun-Climate SymposiumInvited Presentation
30 January 2020Photo credit: L. G. Bailey
Presentation Outline
• Information about our department at UA• North American monsoon climatology, importance• Observed monsoon trends• Projected changes• Summary points
3
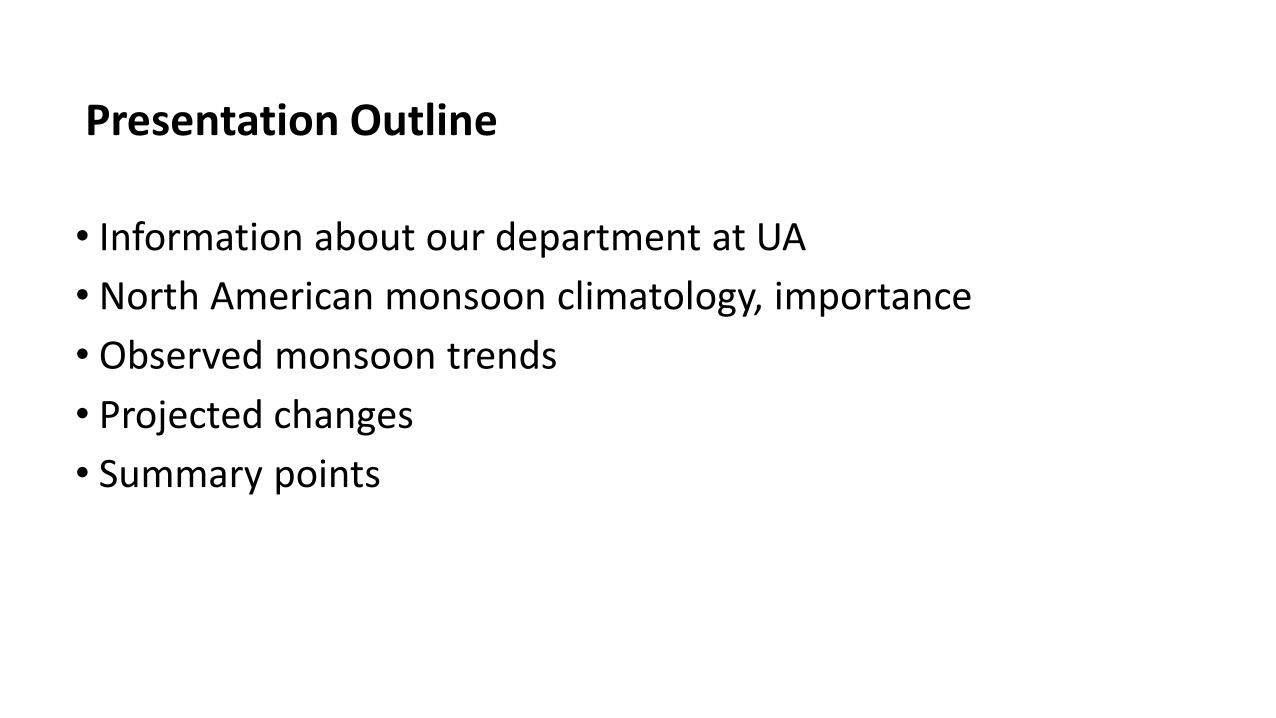
Department of Atmospheric Sciences established in 1957, help oversee the establishment of the National Center for Atmospheric Research.
Department of Hydrology and Water Resources established in 1961, from Geology. The first autonomous department in the U.S. devoted to the study of water.
Departments combined in 2016, allowing us to better consider the integrated water cycle.
5
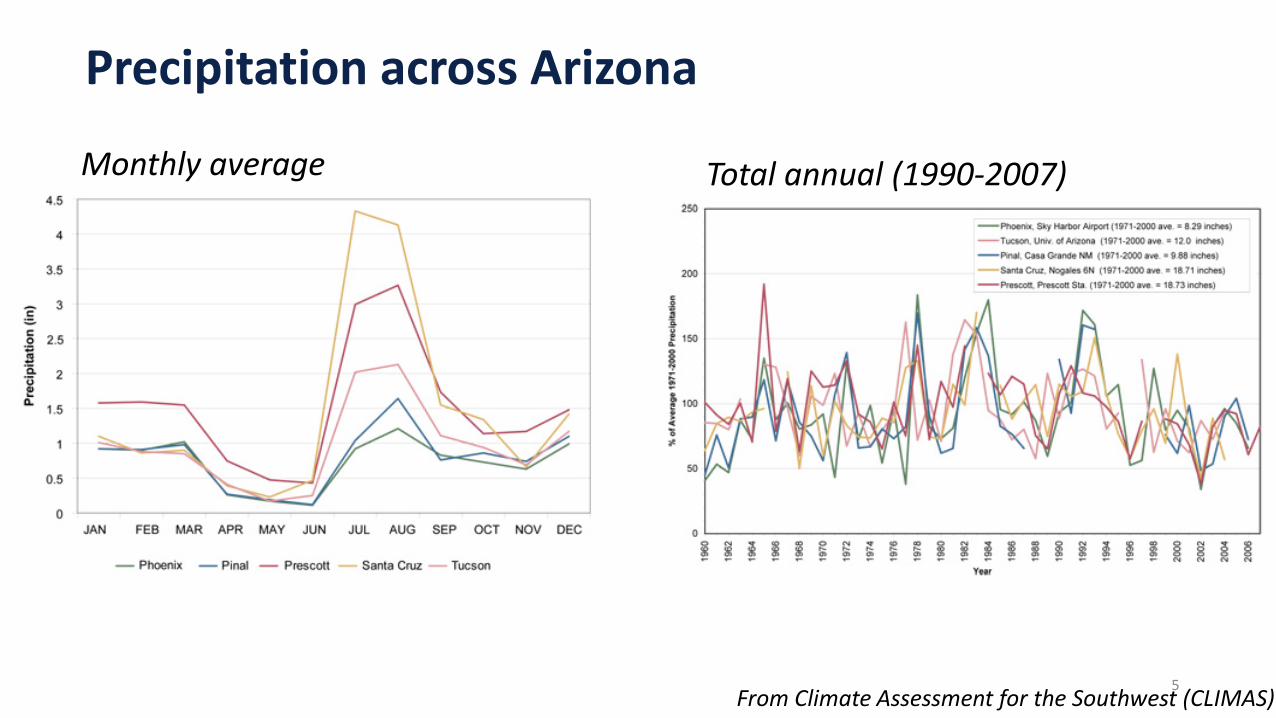
Precipitation across Arizona
Monthly average Total annual (1990-2007)
From Climate Assessment for the Southwest (CLIMAS)
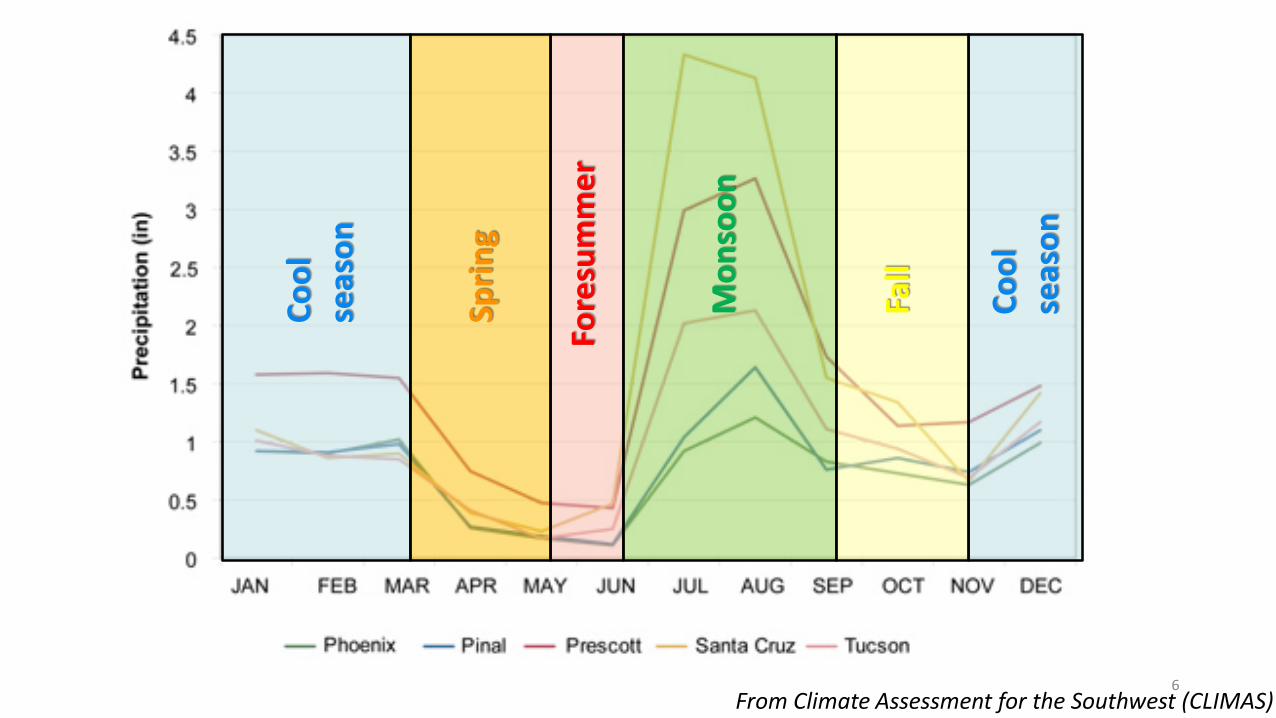
6
Cool
se
ason
Fore
sum
mer
Mon
soon
Fall
Cool
se
ason
Sprin
g
From Climate Assessment for the Southwest (CLIMAS)
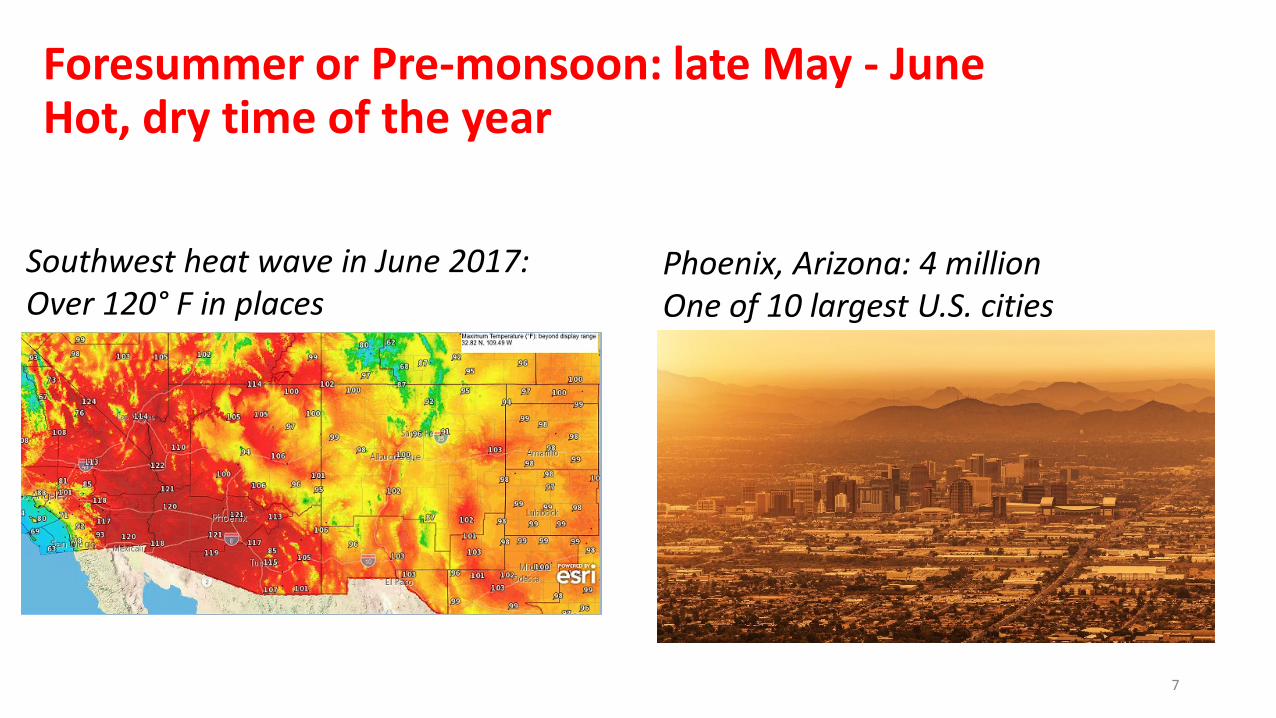
Foresummer or Pre-monsoon: late May - JuneHot, dry time of the year
7
Southwest heat wave in June 2017:Over 120° F in places
Phoenix, Arizona: 4 millionOne of 10 largest U.S. cities
8
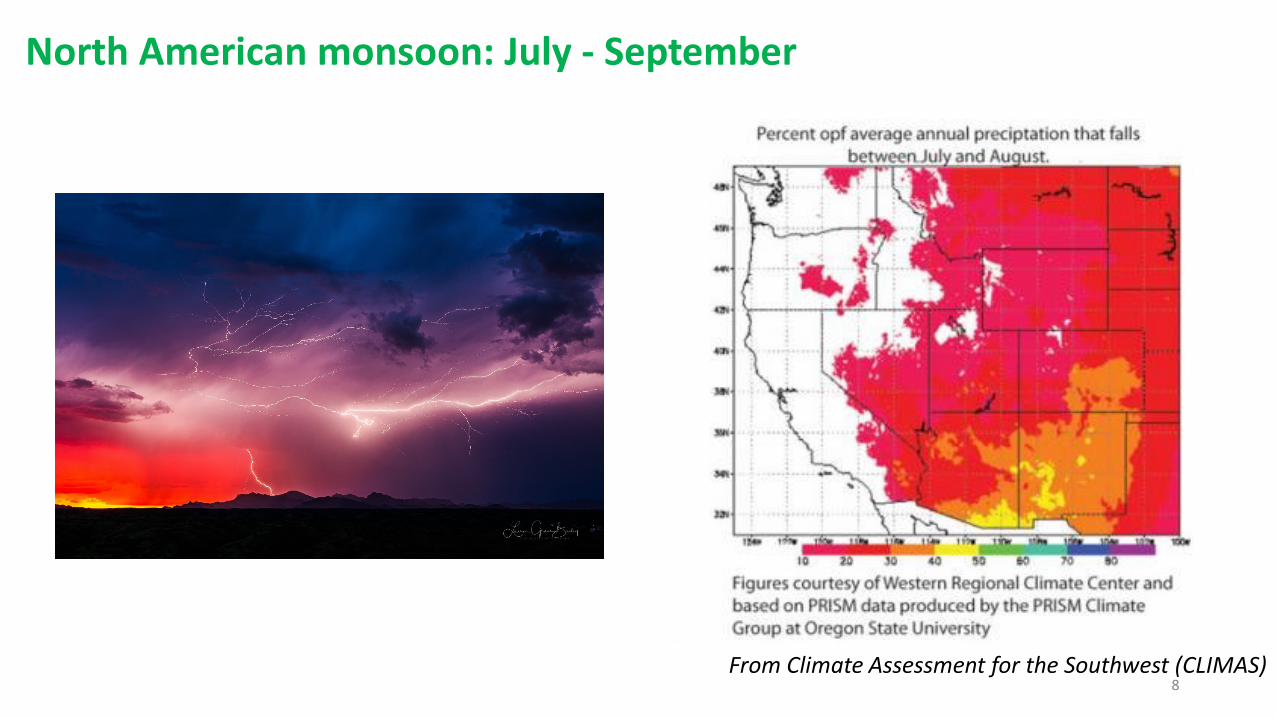
North American monsoon: July - September
From Climate Assessment for the Southwest (CLIMAS)
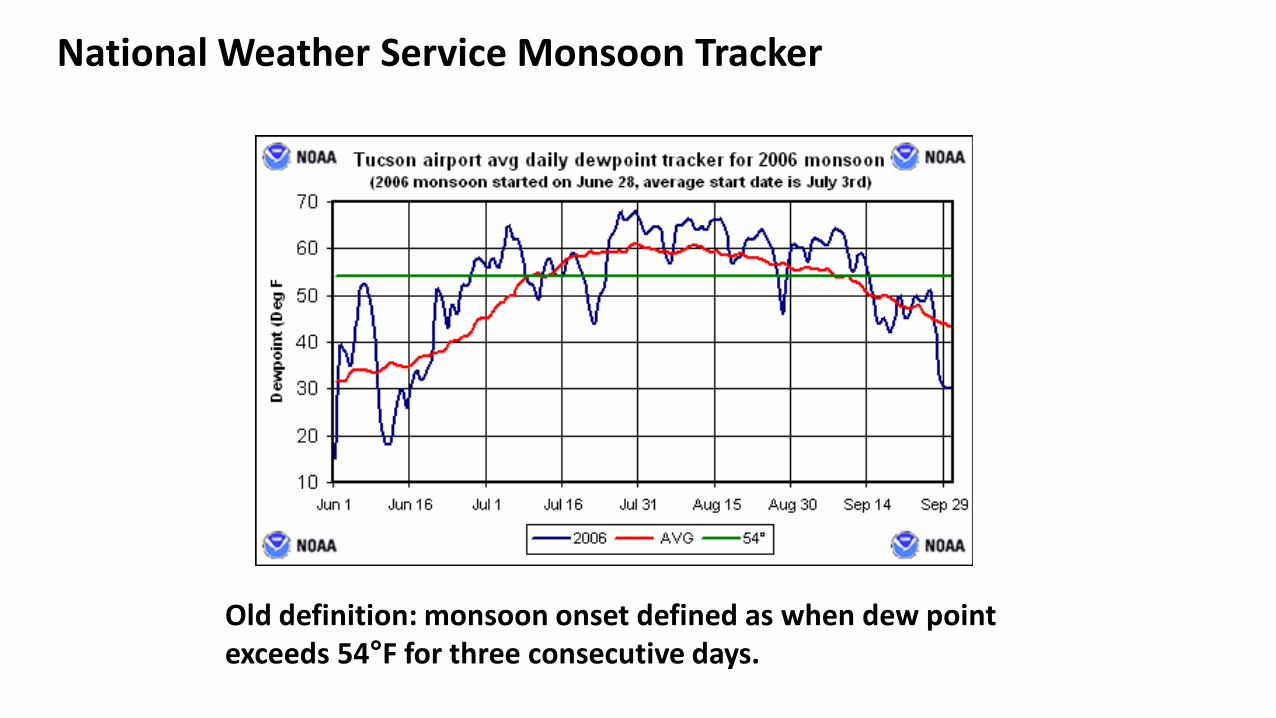
National Weather Service Monsoon Tracker
Old definition: monsoon onset defined as when dew point exceeds 54°F for three consecutive days.
North American monsoon:climatological evolution
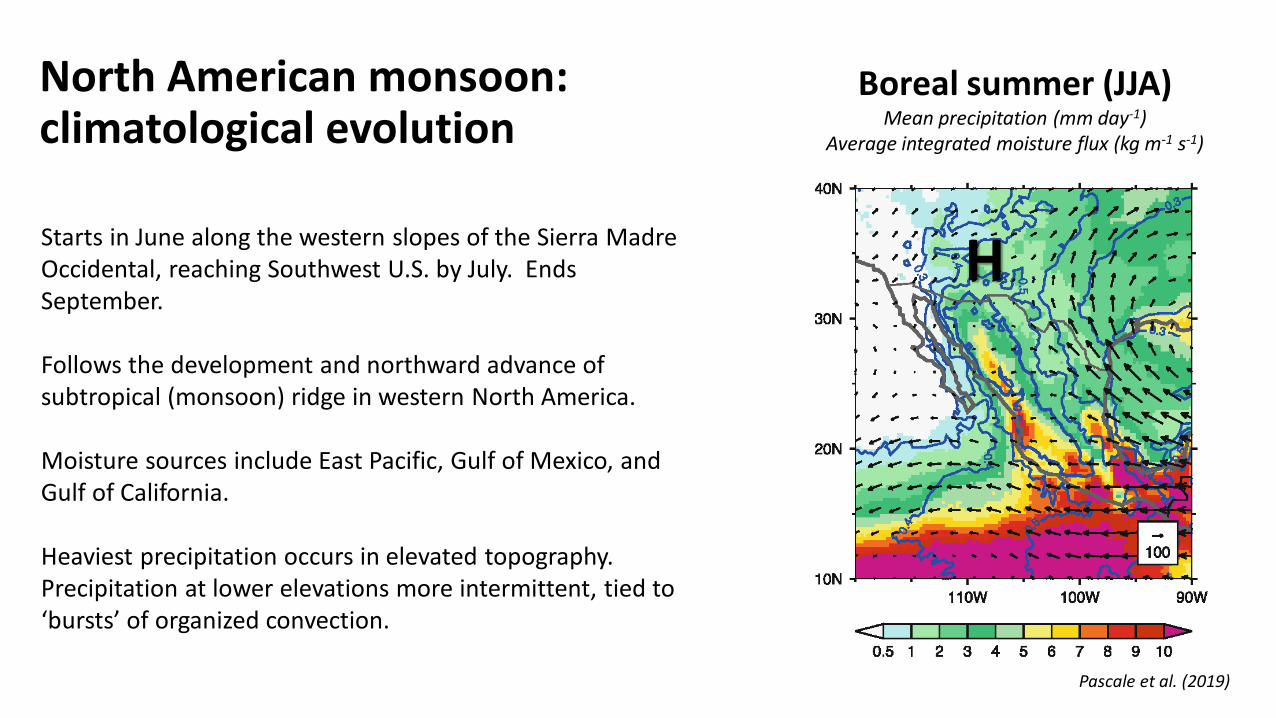
Boreal summer (JJA)Mean precipitation (mm day-1)
Average integrated moisture flux (kg m-1 s-1)
Pascale et al. (2019)
Starts in June along the western slopes of the Sierra Madre Occidental, reaching Southwest U.S. by July. Ends September.
Follows the development and northward advance of subtropical (monsoon) ridge in western North America.
Moisture sources include East Pacific, Gulf of Mexico, and Gulf of California.
Heaviest precipitation occurs in elevated topography. Precipitation at lower elevations more intermittent, tied to ‘bursts’ of organized convection.
H
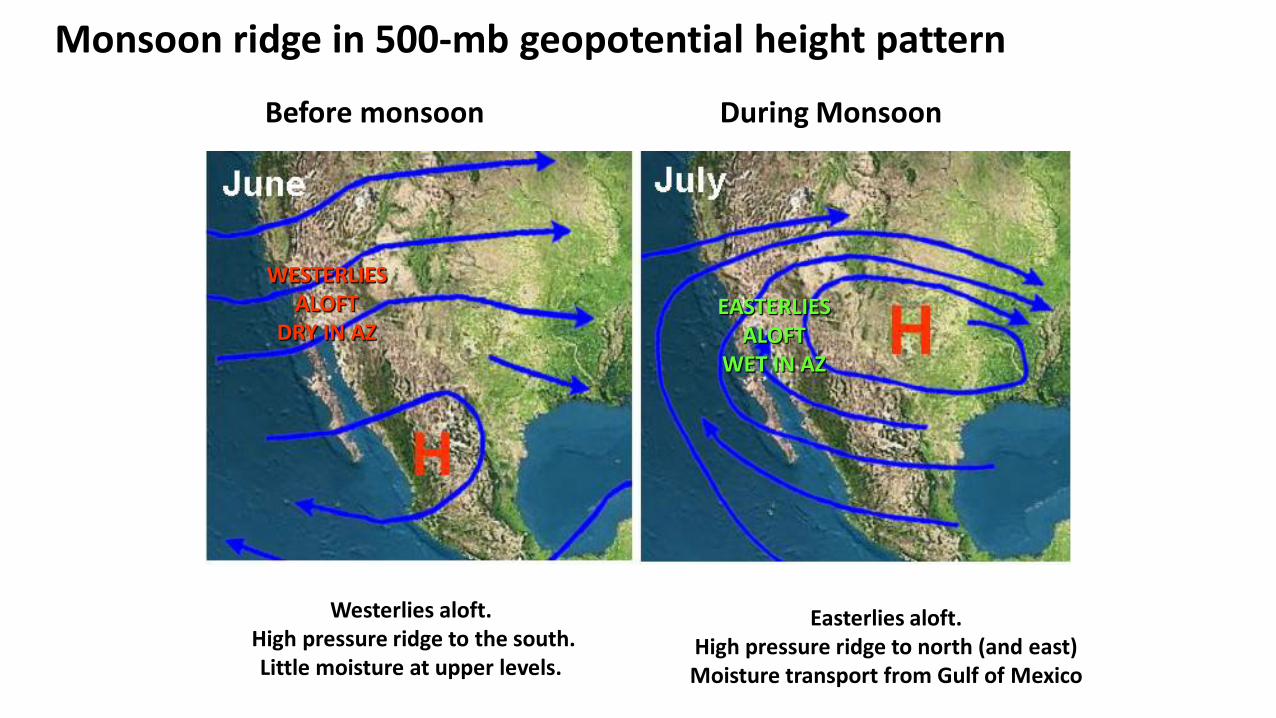
Monsoon ridge in 500-mb geopotential height pattern
WESTERLIESALOFT
DRY IN AZ
Before monsoon During Monsoon
Westerlies aloft. High pressure ridge to the south.Little moisture at upper levels.
EASTERLIES ALOFT
WET IN AZ
Easterlies aloft.High pressure ridge to north (and east)Moisture transport from Gulf of Mexico
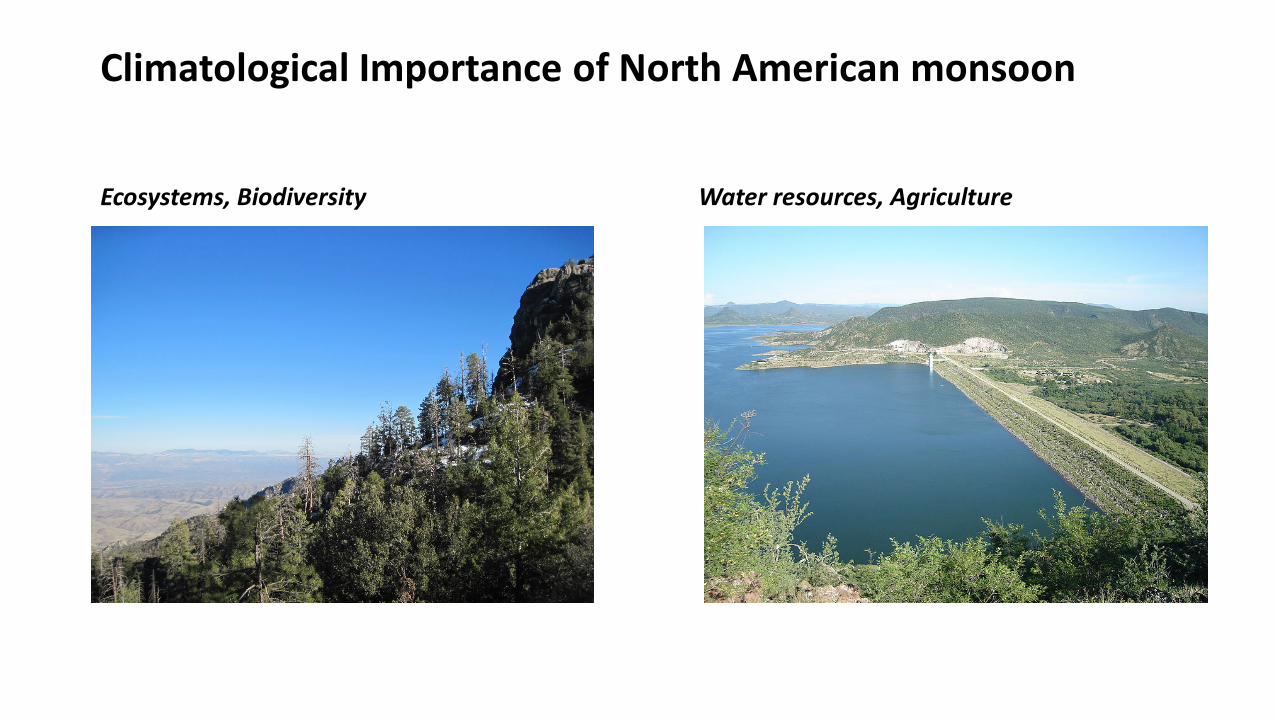
Climatological Importance of North American monsoon
Ecosystems, Biodiversity Water resources, Agriculture
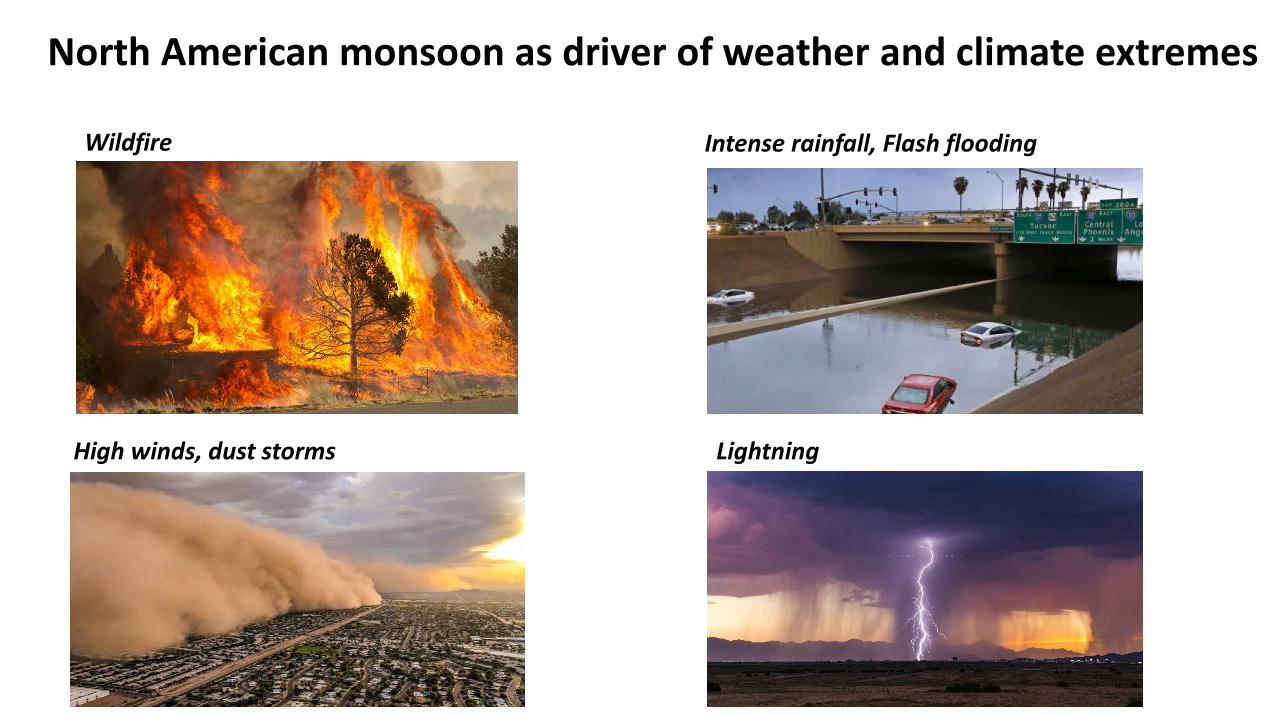
North American monsoon as driver of weather and climate extremes
Wildfire
High winds, dust storms
Intense rainfall, Flash flooding
Lightning
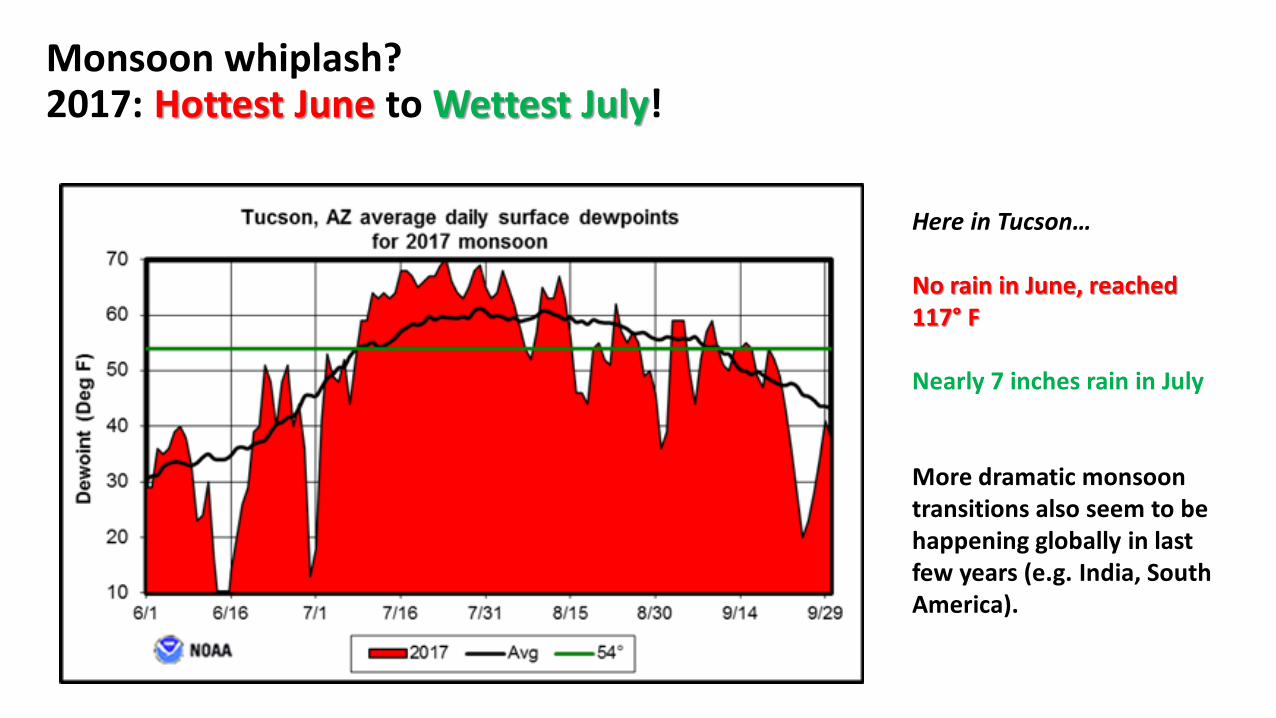
Monsoon whiplash? 2017: Hottest June to Wettest July!
Here in Tucson…
No rain in June, reached 117° F
Nearly 7 inches rain in July
More dramatic monsoon transitions also seem to be happening globally in last few years (e.g. India, South America).
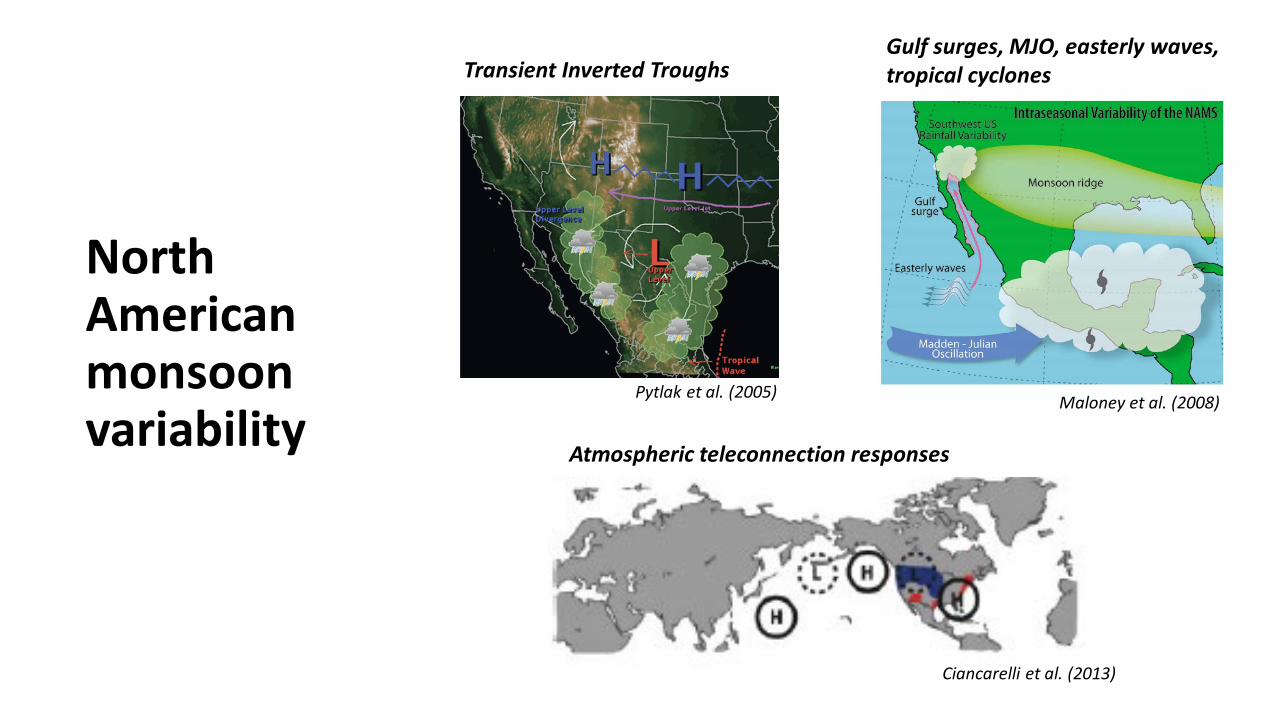
North American monsoonvariability
Transient Inverted TroughsGulf surges, MJO, easterly waves, tropical cyclones
Atmospheric teleconnection responses
Pytlak et al. (2005) Maloney et al. (2008)
Ciancarelli et al. (2013)
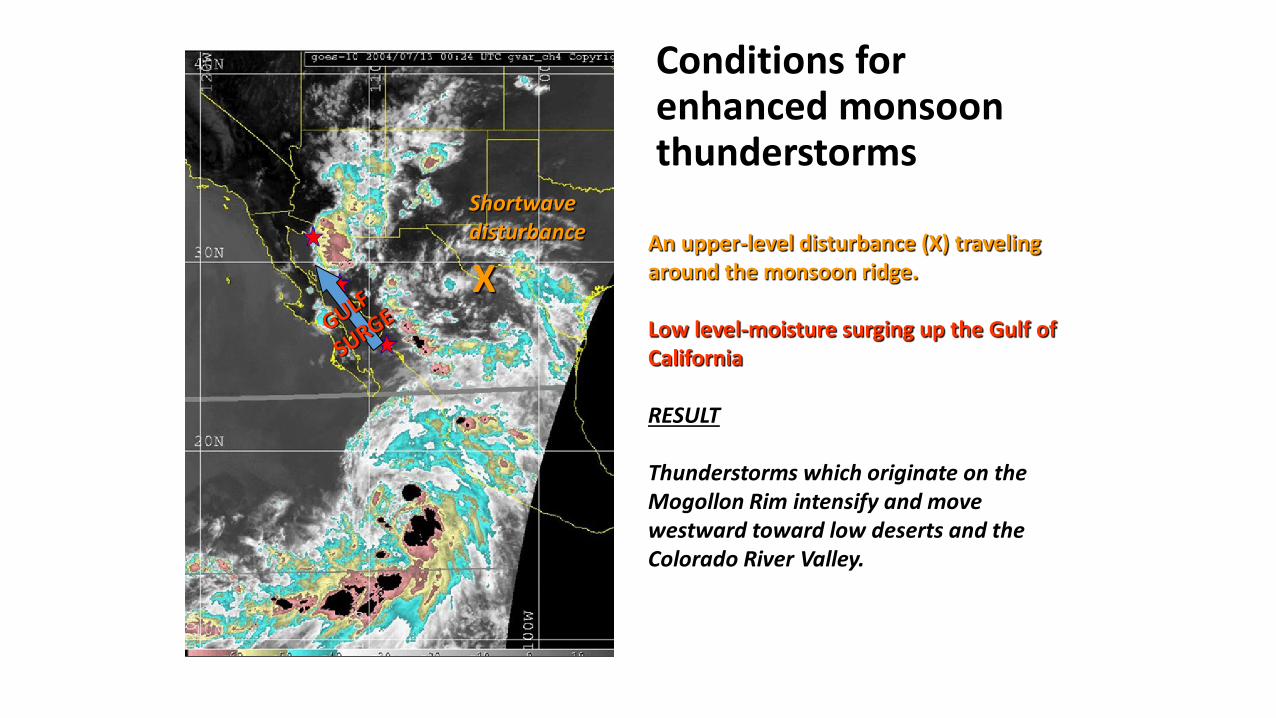
Conditions for enhanced monsoon thunderstorms
An upper-level disturbance (X) traveling around the monsoon ridge.
Low level-moisture surging up the Gulf of California
RESULT
Thunderstorms which originate on the Mogollon Rim intensify and move westward toward low deserts and the Colorado River Valley.
X
Shortwavedisturbance
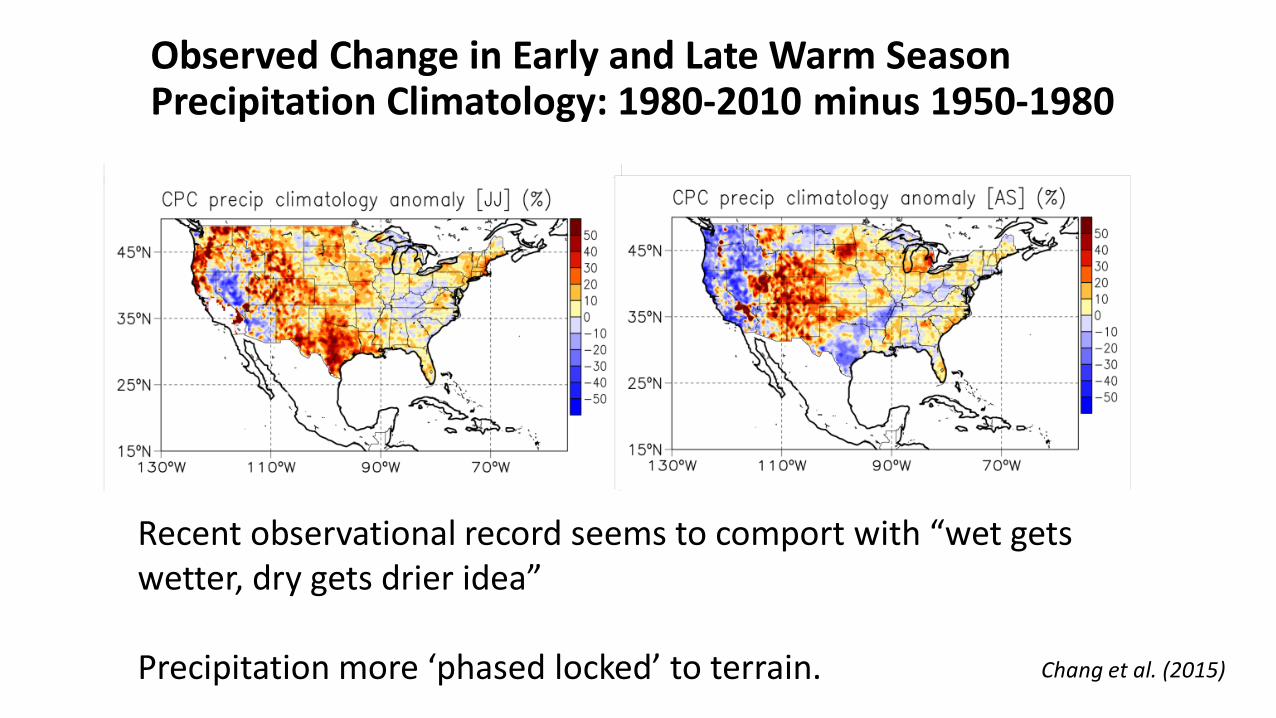
Observed Change in Early and Late Warm Season Precipitation Climatology: 1980-2010 minus 1950-1980
Recent observational record seems to comport with “wet gets wetter, dry gets drier idea”
Precipitation more ‘phased locked’ to terrain. Chang et al. (2015)
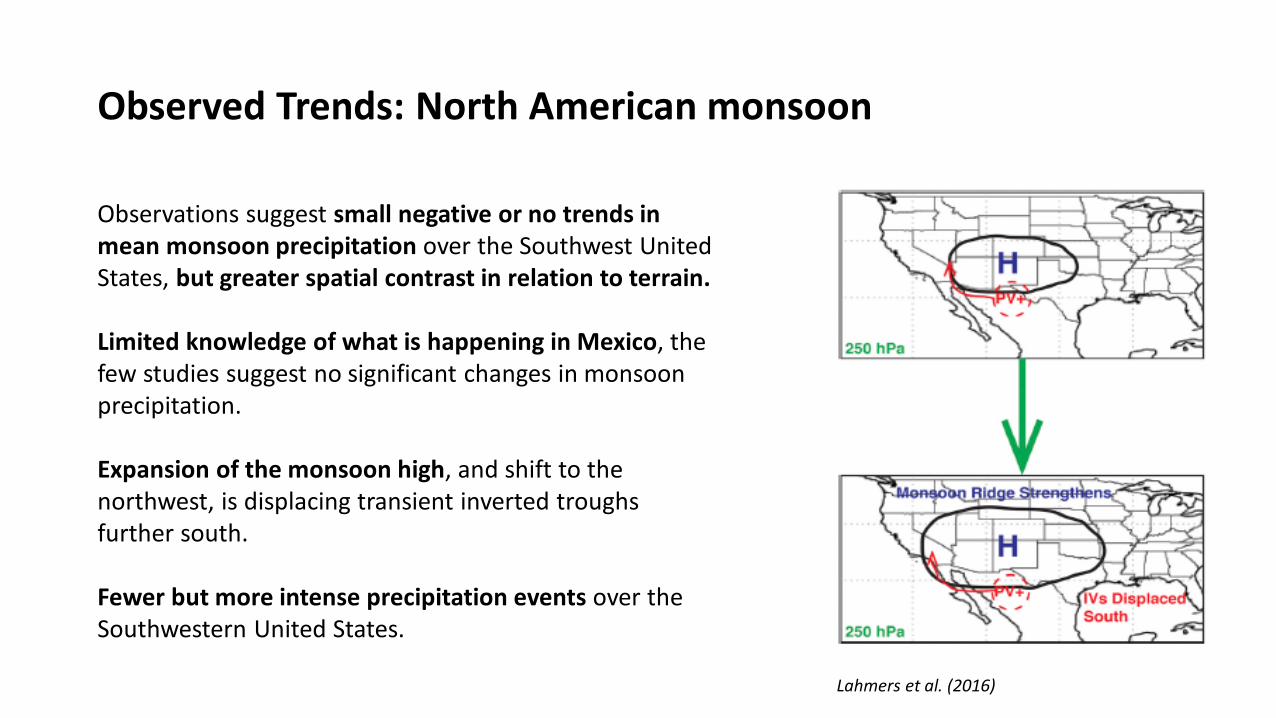
Observed Trends: North American monsoon
Observations suggest small negative or no trends in mean monsoon precipitation over the Southwest United States, but greater spatial contrast in relation to terrain.
Limited knowledge of what is happening in Mexico, the few studies suggest no significant changes in monsoon precipitation.
Expansion of the monsoon high, and shift to the northwest, is displacing transient inverted troughs further south.
Fewer but more intense precipitation events over the Southwestern United States.
Lahmers et al. (2016)
20
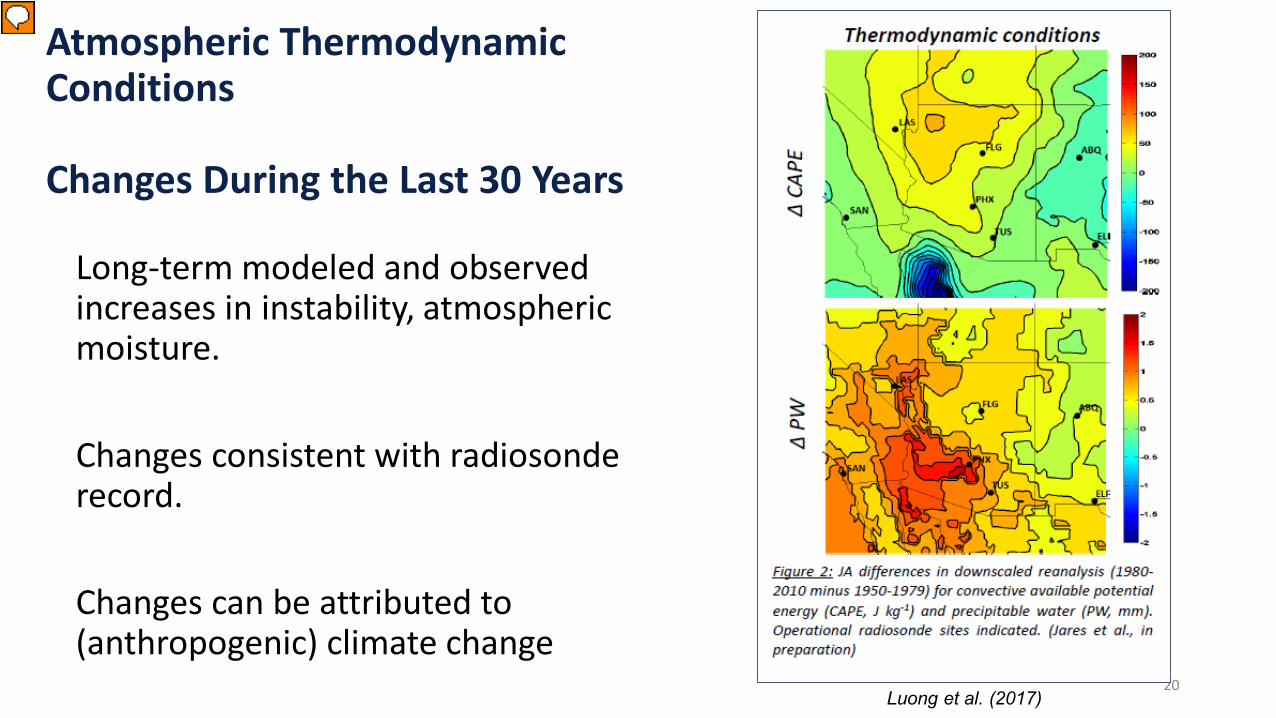
Long-term modeled and observed increases in instability, atmospheric moisture.
Changes consistent with radiosonde record.
Changes can be attributed to (anthropogenic) climate change
Atmospheric Thermodynamic Conditions
Changes During the Last 30 Years
Luong et al. (2017)
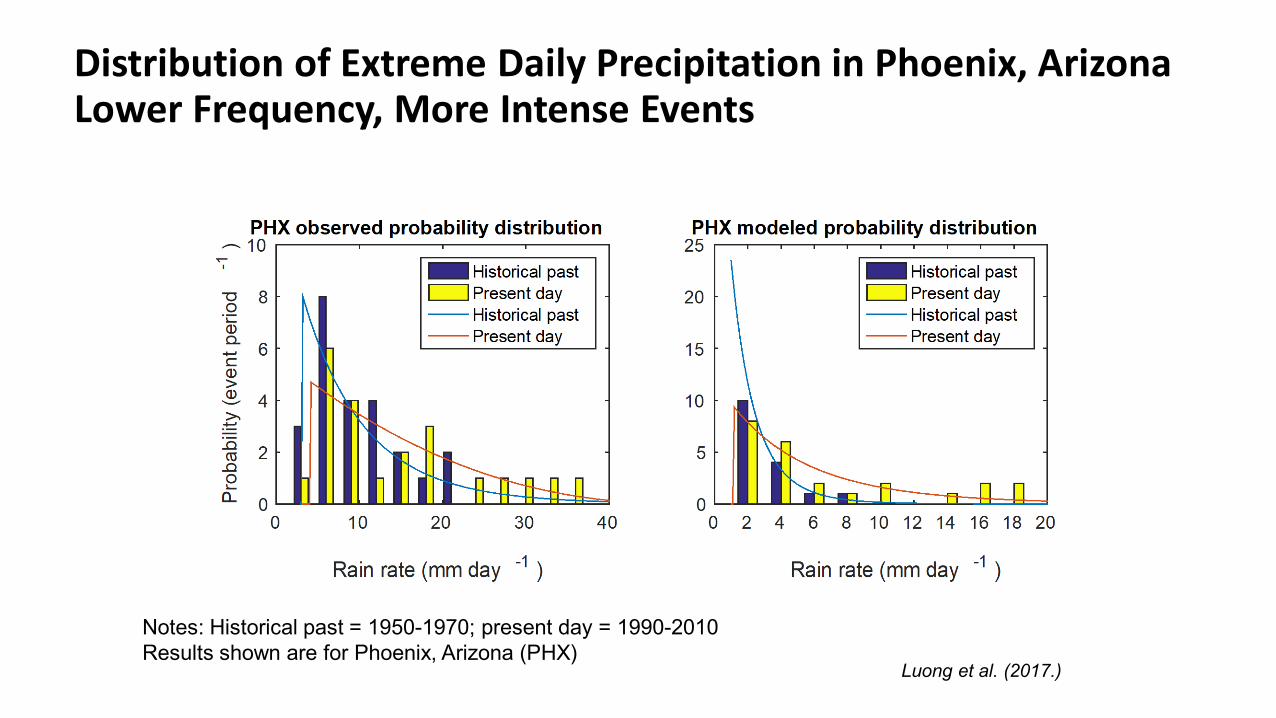
Notes: Historical past = 1950-1970; present day = 1990-2010Results shown are for Phoenix, Arizona (PHX)
Distribution of Extreme Daily Precipitation in Phoenix, ArizonaLower Frequency, More Intense Events
Luong et al. (2017.)
22
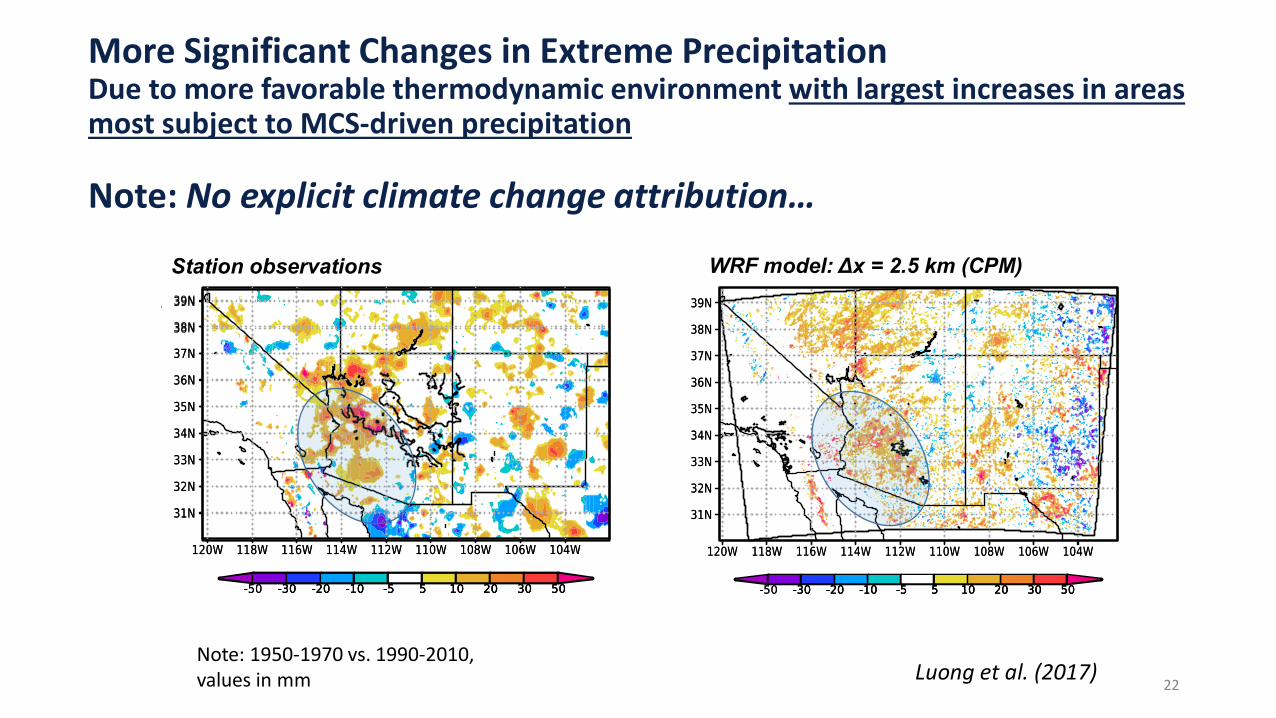
More Significant Changes in Extreme Precipitation Due to more favorable thermodynamic environment with largest increases in areas most subject to MCS-driven precipitation
Note: No explicit climate change attribution…
Station observations WRF model: Δx = 2.5 km (CPM)
Note: 1950-1970 vs. 1990-2010, values in mm Luong et al. (2017)
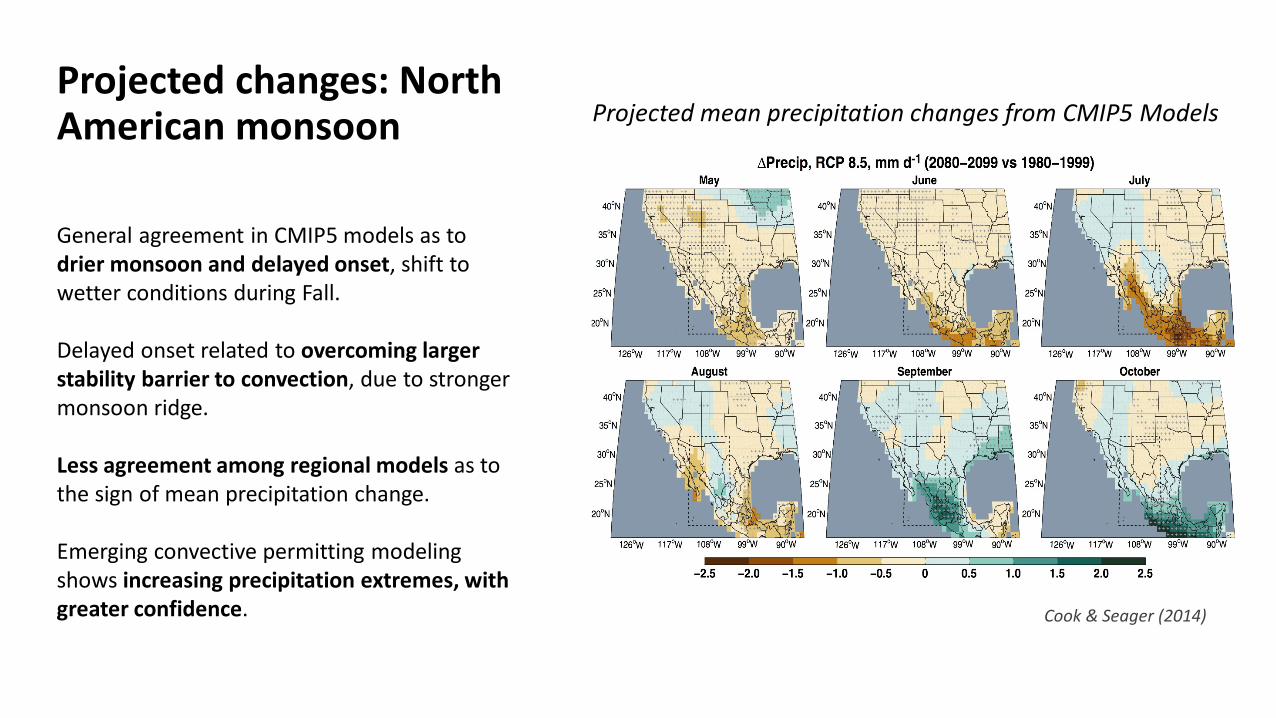
Projected changes: North American monsoon
Cook & Seager (2014)
Projected mean precipitation changes from CMIP5 Models
General agreement in CMIP5 models as to drier monsoon and delayed onset, shift to wetter conditions during Fall.
Delayed onset related to overcoming larger stability barrier to convection, due to stronger monsoon ridge.
Less agreement among regional models as to the sign of mean precipitation change.
Emerging convective permitting modeling shows increasing precipitation extremes, with greater confidence.
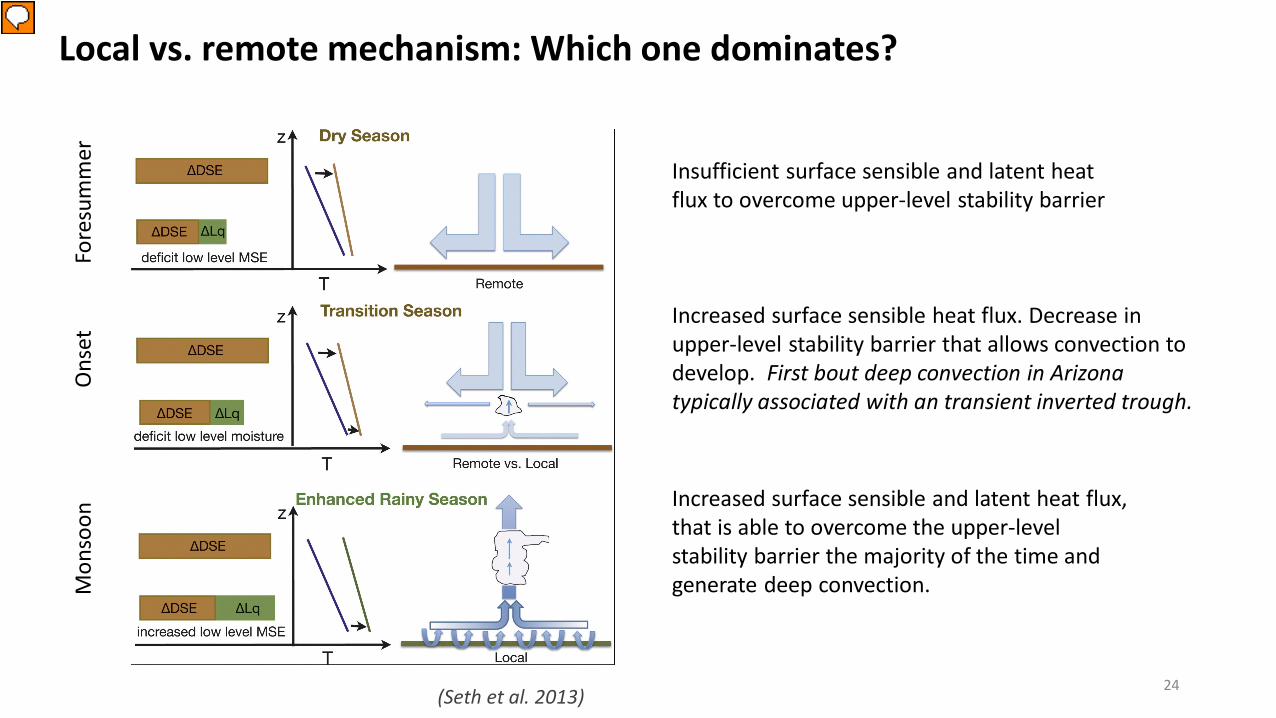
Local vs. remote mechanism: Which one dominates?
24(Seth et al. 2013)
Insufficient surface sensible and latent heat flux to overcome upper-level stability barrier
Increased surface sensible heat flux. Decrease in upper-level stability barrier that allows convection to develop. First bout deep convection in Arizona typically associated with an transient inverted trough.
Increased surface sensible and latent heat flux, that is able to overcome the upper-level stability barrier the majority of the time and generate deep convection.
Fore
sum
mer
Ons
etM
onso
on
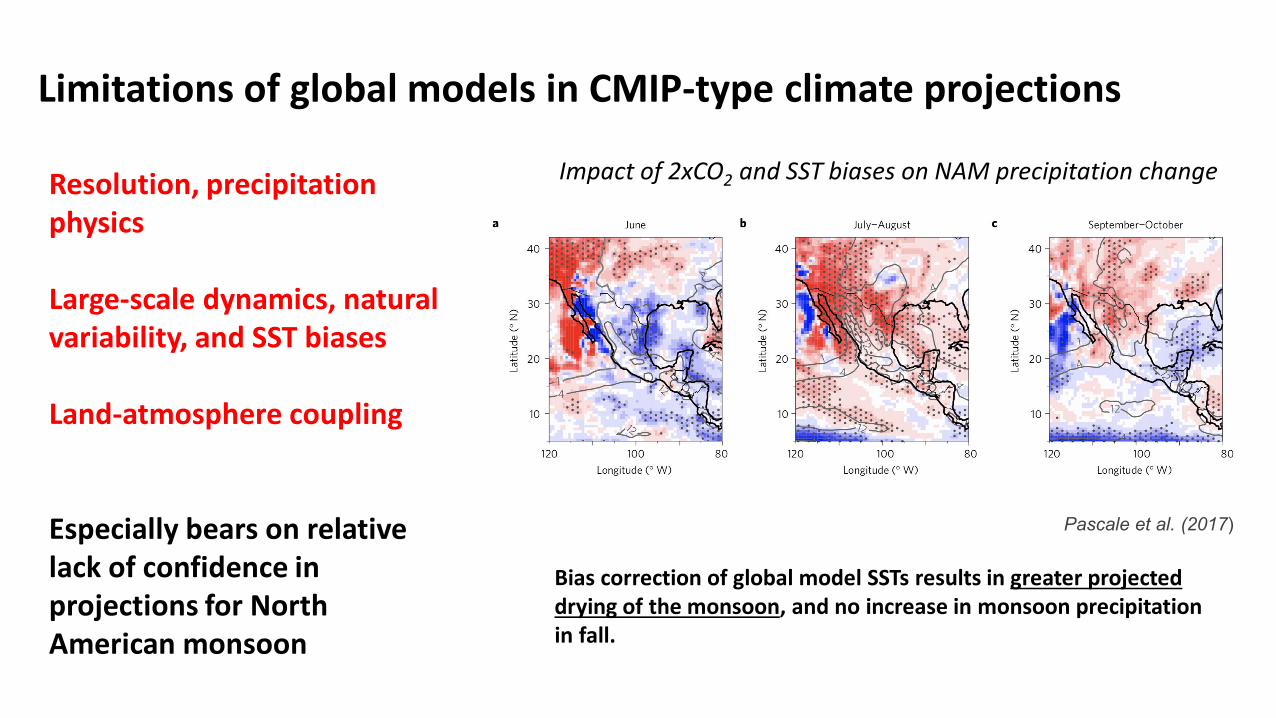
Impact of 2xCO2 and SST biases on NAM precipitation change
Limitations of global models in CMIP-type climate projections
Resolution, precipitation physics
Large-scale dynamics, natural variability, and SST biases
Land-atmosphere coupling
Especially bears on relative lack of confidence in projections for North American monsoon
Pascale et al. (2017)
Bias correction of global model SSTs results in greater projected drying of the monsoon, and no increase in monsoon precipitation in fall.
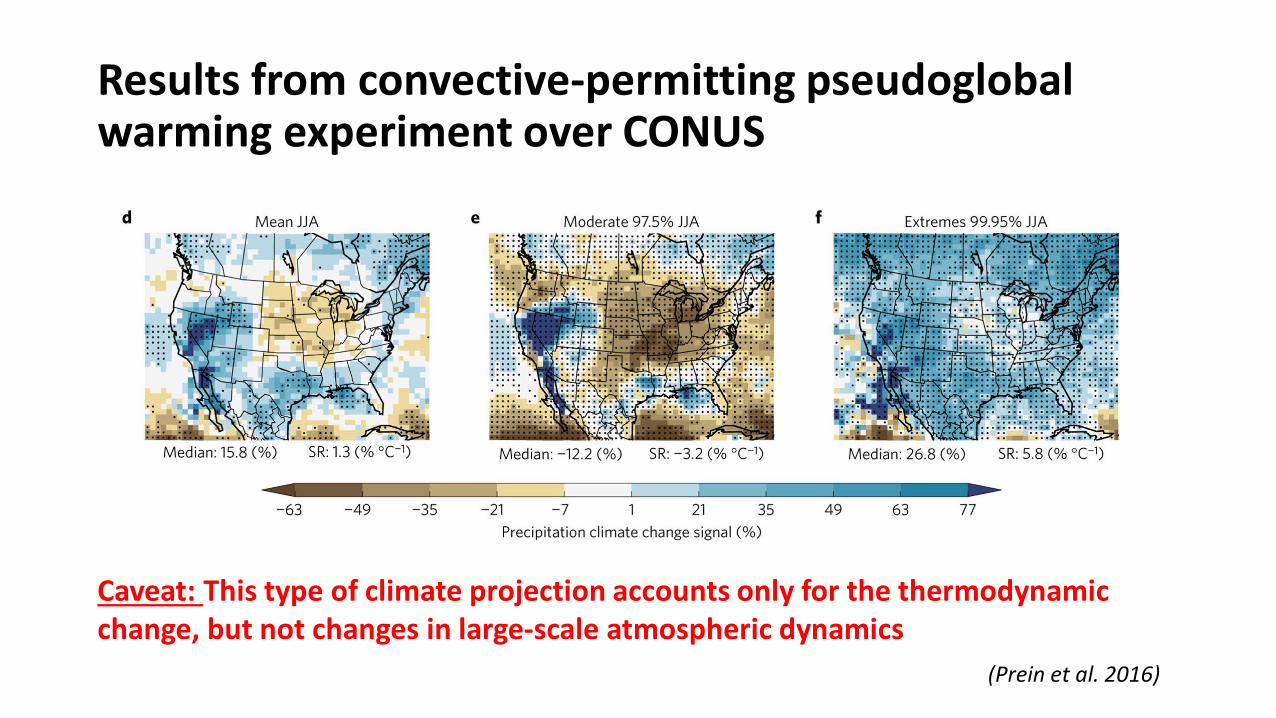
Results from convective-permitting pseudoglobalwarming experiment over CONUS
Caveat: This type of climate projection accounts only for the thermodynamic change, but not changes in large-scale atmospheric dynamics
(Prein et al. 2016)
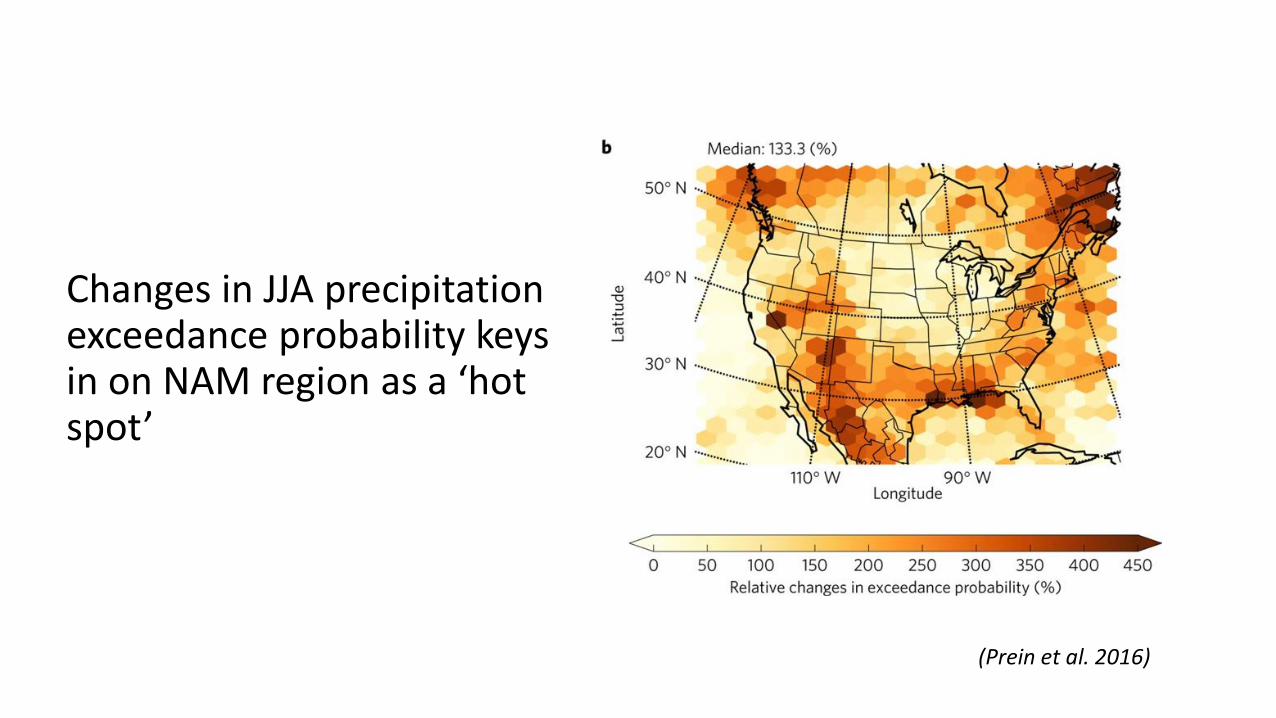
Changes in JJA precipitation exceedance probability keys in on NAM region as a ‘hot spot’
(Prein et al. 2016)
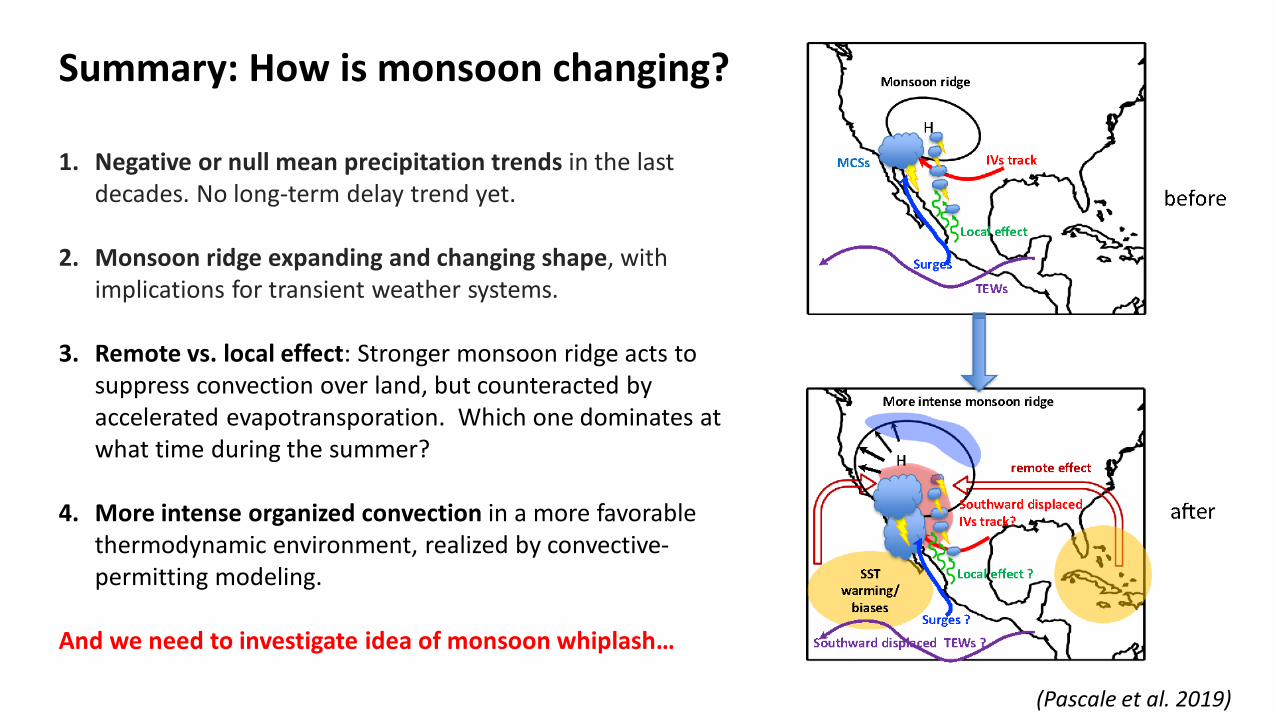
Summary: How is monsoon changing?
1. Negative or null mean precipitation trends in the last decades. No long-term delay trend yet.
2. Monsoon ridge expanding and changing shape, with implications for transient weather systems.
3. Remote vs. local effect: Stronger monsoon ridge acts to suppress convection over land, but counteracted by accelerated evapotransporation. Which one dominates at what time during the summer?
4. More intense organized convection in a more favorable thermodynamic environment, realized by convective-permitting modeling.
And we need to investigate idea of monsoon whiplash…
(Pascale et al. 2019)