Embed Size (px)
Citation preview

The North American Drought Monitor- History, Approach and Benefits -
Trevor HadwenNational Agroclimate Information Service
Agriculture &Agri-Food Canada
Prepared for the CARIWIN 2nd Senior Administrators WorkshopCaribbean Institute for Meteorology and Hydrology, Barbados
January 19-20, 2009

2
Presentation OverviewPresentation Overview
• Why Monitor Drought?• NADM Background• USDM / NADM History• Objectives• Participants• Procedure• Input Indicators• Where do we go from here?

3
Why Monitor Drought?Why Monitor Drought?
• Drought is a normal part of the Climatic Cycle• Drought events will likely be more frequent in the future.• Drought Impacts are significant & widespread• Many economic sectors are affected• Drought is expensive
– Since 1980, major droughts and heat waves within the U.S. alone have resulted in costs exceeding 100 billion dollars
– In Canada, over the same period, Droughts have resulted in close to 30 billion dollars, with single year droughts in excess of more than 5 billion

4From National Drought Mitigation CenterLincoln, Nebraska
Why Monitor Drought?Why Monitor Drought?

5
Why a Why a ““Drought MonitorDrought Monitor””??• Drought Difficult to Quantify and Measure
– Many Drought Tools; None Universally Applicable• Important at the National Level
– Efforts to improve the planning, preparation and mitigation of drought now include drought monitoring programs at levels from national to regional and local
• Important at the International Level• In today’s global economy the costs and effects of drought often
extend beyond international borders – Drought in the Southwest U.S. and a prolonged period of drought in Mexico led
to debates about shared water rights– Multi-year drought in the U.S. northern Rockies and western Great Plains
extends into the agricultural prairies of Canada, affecting agricultural productivity in both countries
• Consistent Drought Depiction Across International Boundaries

6
• In the summer of 1998, a dialogue began between the NDMC and NOAA/CPC • What emerged was a plan to develop a classification system for droughts that
would be as recognizable to the public as the Fujita tornado intensity scale and the Saffir-Simpson hurricane intensity scale.
• Early in the process, the U.S. Department of Agriculture (USDA) joined the effort. • As a result of meetings held during the spring of 1999, an agreement was reached
between NOAA, USDA, and NDMC to produce and maintain a drought monitoring product.
• Since 1999, NOAA (CPC and NCDC), USDA, and the NDMC have produced a composite drought map -- the U.S. Drought Monitor -- each week with input from numerous federal and non-federal agencies
A Brief History of the U.S. Drought MonitorA Brief History of the U.S. Drought Monitor

7
The Drought MonitorThe Drought Monitor’’s Original Objectivess Original Objectives• A consolidation of indices & indicators into one comprehensive national drought map• Assessment of current conditions—NOT a forecast!• A general assessment—not intended to capture all local details• “Fujita-like” scale• Try to capture these characteristics:
– the drought’s magnitude (duration + intensity)– spatial extent – Probability of occurrence (percentile rank category)– Impacts (A – Agricultural & H – Hydrological/Water)
• Incorporates local expert input• As objective as possible• Keep things simple for the end user

8
• A partnership between the NDMC, USDA, and NOAA’s CPC and NCDC – Authors
• Incorporate relevant information and products from all entities (and levels of government) dealing with drought (RCC’s, SC’s, federal/state agencies, etc.) – Contributors
• The Drought Monitor is updated weekly and provides a general up-to-date summary of current drought conditions across the lower 48 states, Hawaii & Alaska, and Puerto Rico.
• Integrates daily rainfall reports from thousands of stations• Rates drought intensity by percentile ranks• Uses weekly feedback from local experts to reflect impacts and for
the product’s “ground truth”The US Drought Monitor:
A new way of looking at drought in the U.S.
The Drought Monitor Concept The Drought Monitor Concept

9
USDM Growing Pains, 1999USDM Growing Pains, 1999--20002000

10
USDM Growing Pains, 1999USDM Growing Pains, 1999--2000 Cont2000 Cont’’dd……

11
USDM Growing Pains, 1999USDM Growing Pains, 1999--2000 Cont2000 Cont’’dd……

12
USDM Growing Pains, 1999USDM Growing Pains, 1999--2000 Cont2000 Cont’’dd……

13
USDM Growing Pains, 1999USDM Growing Pains, 1999--2000 Cont2000 Cont’’dd……

14
USDM Present DayUSDM Present Day

15
• The North America Drought Monitor is modeled after the highly successful US-Drought Monitor
• The NADM is a cooperative effort between drought experts in Canada, Mexico and the United States.
• The objective is to monitor drought across the continent on an ongoing basis.
• Initiated at a workshop 2002 and is part of a larger effort to improve the monitoring of climate extremes on the continent and to provide an ongoing comprehensive and integrated assessment of drought
• The NADM has been delivering monthly assessments of drought severity on since March 2003.
NADM BackgroundNADM Background

16
• November 2001– Meeting at NCDC to discuss assessment and monitoring of
climate extremes across North America– The three countries agree in principle to establish extremes
monitoring partnership (NACEM)– Decision to initiate assessment of extremes with most widespread
problem – DROUGHT• First, develop monthly continental drought monitoring
capabilities (Develop monitoring program similar to U.S. Drought Monitor)
– Eventually assess long-term variability and trends in extremes(National Climate Preparedness & Potential IPCC Applications)
Evolution of the NADM EffortEvolution of the NADM Effort

17
• April 2002– Combined USDM / NADM Workshop at NCDC (Ashville NC )– One day devoted to discussions on the new drought monitoring
program for North America– The NADM concept was developed as part of the extremes
monitoring initiative– Canada made a commitment to provide analyses in the agricultural
landscapes of Canada• December 2002
– First experimental North America Drought Monitor Map completed• April 2003
– First experimental NADM map released
Evolution of the NADM Effort ContEvolution of the NADM Effort Cont’’dd……

18
• May 2003– Canada held its first NADM Workshop (Edmonton AB) with the purpose to
develop a Canadian team to conduct the NADM operationally. Included federal attendees from EC, NrCan, Statistics Canada as well as provincial representatives from Alberta, Saskatchewan, Ontario, Nova Scotia
NADM Project Vision - from Edmonton 2003 • A long term co-operative strategy that assures access to real time and
historic climate data (including non-standard).• A set of indicators that defines drought and has the flexibility to be
geographically sensitive.• Indicators that meet the information needs of agriculture, forestry, water use
sectors and native ecologies. • A team from federal and provincial departments and other regional and local
centers such as universities work in partnership to complete a national assessment of drought in support of adaptation programs.
• A North American assessment of drought completed on a routine and scheduled basis in partnership with the USA and Mexico.
Evolution of the NADM Effort ContEvolution of the NADM Effort Cont’’dd……

19
• October 2004– AAFC Hosted the hosted the NADM International Workshop (Regina, SK)
• Fall 2005– AAFC hosted a special focus workshop on Canadian forested regions with the
purpose to determine how to monitor conditions in forested regions of Canada (Edmonton AB)
• October 2006– The Mexican National Meteorological Service hosted the NADM International
Workshop (Mexico City, MX) • March 2008
– Canada held its 2nd National NADM Workshop with the purpose to engage more participation in the program especially from Eastern and central Canada (Guelph, ON.)
• October 2008 – AAFC hosted the NADM International Workshop (Ottawa, ON.)
Evolution of the NADM Effort ContEvolution of the NADM Effort Cont’’dd……

20
Participants– U.S.A.: NOAA, USDA, National Drought Mitigation Center– Canada: Agriculture & Agri-Food Canada (PFRA),
Environment Canada (Metrological Service of Canada)– Mexico: National Meteorological Service (SMN)
Responsibilities – Each country determines drought depiction &
narrative within their national boundaries– NADM lead authorship rotates amongst the
participants– NADM lead author integrates national drought
assessments from each country, prepares continental monthly map & narrative
– All participants peer review producthttp://www.ncdc.noaa.gov/oa/climate/monitoring/drought/nadm/index.html
NADM Participants and ResponsibilitiesNADM Participants and Responsibilities

21
• B.C Ministry of Environment –River Forecast Centre
• Manitoba Hydrologic Forecast Centre
• Ontario Ministry of Natural Resources – Low Water Response
• Saskatchewan Agriculture, Food and Rural Revitalization
• Saskatchewan Watershed Authority
• AAFC-PFRA District and Regional Offices
• AAFC Climate Relate Risk Committee
• Environment Canada • Natural Resources Canada –
Canadian Forest Service• Alberta Environment• Alberta Agriculture, Food and
Rural Development
Canadian Contributing OrganizationsCanadian Contributing Organizations
All arrangements with contributing organizations are informal at this point

22
• Depending on:– their normal climate– their needs
• Main categories of drought are– meteorological – agricultural– hydrological– (socioeconomic)
Drought can mean many different things to different people
The availability of water depends largely on rainfall, (but) theconcept of drought cannot be divorced from the use to which water is put. Gibbs & Maher (1967):
Most Drought indices measure meteorological
drought
Drought Drought –– more than just lack of rainfallmore than just lack of rainfall
23
Types of DroughtTypes of Drought

24
The North America Drought Monitor blends science and art. There is no one 'correct' way to measure drought. Drought indices are used to detect and measure droughts, but different indices measure drought in different ways, and no single index works under all circumstances
=
A Blend of Science and ArtA Blend of Science and Art

25
“The essence of drought is in its impact”
D. Wilhite, National Drought Mitigation Center, Lincoln, Nebraska

26
4 drought categories (D1-D4) plus abnormally dry (D0) category, based on percentile rank (Fujita-like scale)
D0 – Abnormally Dry (30 Percentile Rank)
D1 Drought – Moderate (20 Percentile Rank)
D2 Drought – Severe (10 Percentile Rank)
D3 Drought – Extreme (5 Percentile Rank)
D4 Drought – Exceptional (2 Percentile Rank)
Once every 10 to 20 years
Once every 5 to 10 years
Once every 3 to 5 years
Once every 20 to 50 years
Once every 50 years or less
NADM Drought Intensity CategoriesNADM Drought Intensity Categories

27Indices used primarily during the snow season and in the West include the River Basin Snow Water Content, River Basin Average Precipitation and SWSI.
Drought Severity ClassificationsDrought Severity Classifications

28
• Initially Canada was only assessing the agricultural areas and maps were only produced in English.
• Added French and Spanish versions in November 2003
• Added northern regions of the prairies in the spring of 2004.
• Later in 2004 the rest of the Canadian Provinces, outside the agricultural extent were added.
• We still do not map the territories!
CanadaCanada’’s Monitoring and Reportings Monitoring and Reporting

29
Regions in northern Canada may not be as accurate as other regions due to limited information
Not Experimental Anymore, BUT...Not Experimental Anymore, BUT...

30
• The U.S. portion of the NADM uses the U.S. Drought Monitor (USDM) for the week closest to the end of the month
http://drought.unl.edu/dm/monitor.html
• USDM authors include:– NOAA (NCDC, CPC)– USDA (JAWF)– National Drought Mitigation Center– Western Regional Climate Center
• NOAA/NCDC:– Maintains NADM web site– Computes continental indicators– Developing NADM objective blends
• NDMC:– Maintains USDM web site
• NOAA/CPC:– Maintains USDM / NADM ftp site
NADM NADM –– U.S. Assessment ProcessU.S. Assessment Process

31
NADM NADM –– U.S. Assessment Process ContU.S. Assessment Process Cont’’dd……Integrates KeyDrought Indicators:
- Palmer Drought Index- SPI- KBDIModeled Soil Moisture
- 7-Day Avg. Streamflow- Precipitation Anomalies
Growing Season:- Crop Moisture Index- Sat. Veg. Health IndexSoil MoistureMesonet data
In The West:- SWSI- Reservoir levelsSnowpackStreamflow

32
1. Production of the near real time monitoring products. (1st of each month)(Drought Watch – www.agr.gc/drought)
2. Data sent from Environment Canada to NCDC and NAIS. (5-7th)
3. Production of the monthly National Drought Model products4. Collection of other various maps and reports from a wide range of
organizations. (including AAFC Climate Production Related Risk Committee)5. Create Canadian Draft Assessment Map merged with US and Mexican
assessments.6. Send out the draft map to the Canadian Review Team. (8-9th)
7. Evaluate and incorporate feedback into a final map of Canada8. Add impact areas on to the map9. Work out boarder issues with the US authors 10. Draft Narrative11. Finalize map and narrative (15th)
Canada Canada –– Current Monthly ProcedureCurrent Monthly Procedure

33
• Monthly assessments are based on a wide range of products at national, provincial and regional scales.
• The data consists of near real time monitoring (AAFC and others), maps from the national drought model (AAFC), and a wide variety of provincial/regional products.
• Assessments also use many conditions reports from other agencies including provincial crop reports, stream flow reports, low water level advisories.
Canada Canada –– NADM AssessmentNADM Assessment

34
• Mapped NRT stations = 508
• Complete List of NRT Stations = 761
• Maps include:- % of normal ppt - Percentile ppt - Accumulated ppt
Near RealNear Real--Time Monitoring NetworkTime Monitoring Network

35
The National Drought Model:• Drought Model Stations
for April 2007 = 874 • Standardized Precipitation
Index (SPI)– From 1 month to 5 years
• Soil Moisture– Percent of Average – Difference from Normal – Total Soil Moisture– Has the ability to do future
projections• Palmer Drought Index (PDI)
– PDI– Palmer Z – Moisture
Anomaly
The National Drought Model NetworkThe National Drought Model Network

36
1. 1. ““Relative IndicatorsRelative Indicators””
2. 2. ““Absolute IndicatorsAbsolute Indicators””
Provide a measure of moisture relativeto the long-term mean and variability ata given location.e.g., - Standardized Precipitation Index,
- Palmer Indices- Percent of Average
Provide a measure of moisture conditions asProvide a measure of moisture conditions asthey affect biophysical processes such as firethey affect biophysical processes such as fire(fuel moisture), forest carbon & water fluxes(fuel moisture), forest carbon & water fluxes(soil moisture) & stream flow (water runoff)(soil moisture) & stream flow (water runoff)e.g., - Canadian Forest Fire Weather Index
System- Climate Moisture Index
Two Major Drought Indicator TypesTwo Major Drought Indicator Types
37
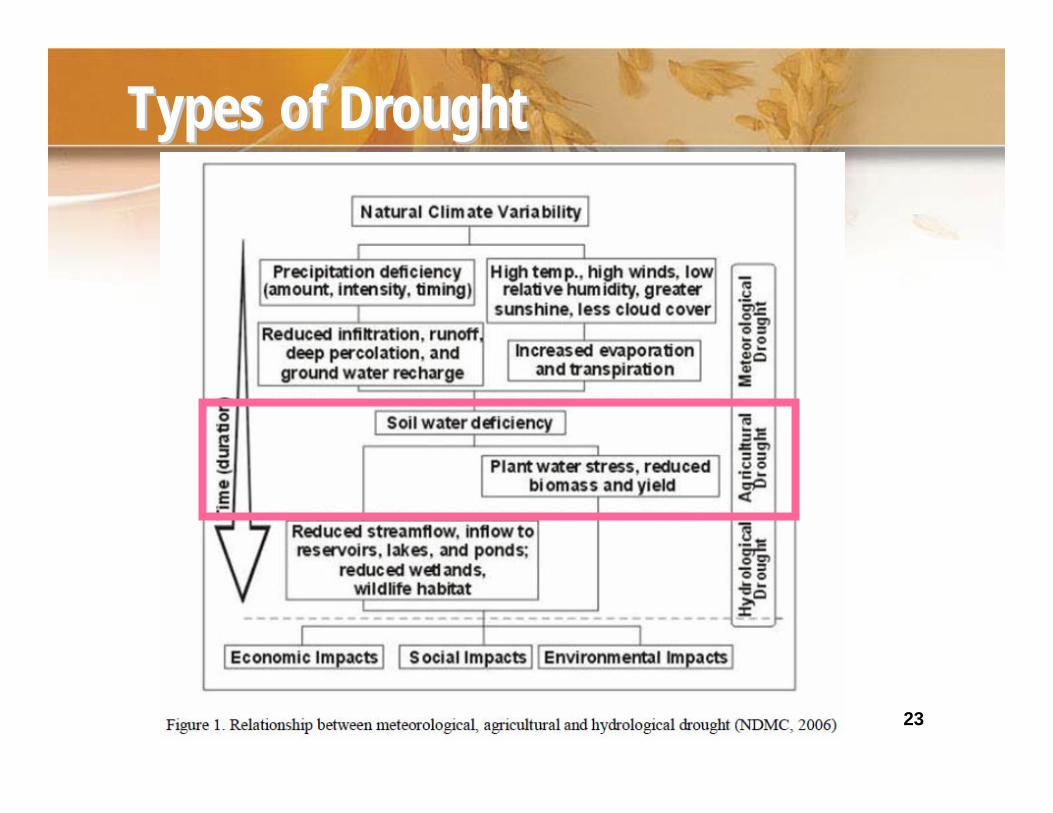
• The NADM drought assessments are determined independently, within each country, based on different data, indices, & analyses
• Drought indices covering entire continent are needed– Same indices, same analysis period, same methodologies
– This consistency needed for depiction across international boundaries
http://www.ncdc.noaa.gov/oa/climate/monitoring/drought/nadm/index.html
NADM Continental Drought IndicatorsNADM Continental Drought Indicators

38
• Standardizing Period: 1951-2001 (for PCTPCP, SPI, PDI)• Station Network Density in Canada Coarse• Results in Unreliable Contours
NADM Continental Indicators ContNADM Continental Indicators Cont’’dd……

39
• Other indicators that could be used
– University College London’s Global Drought Monitor
NADM Continental Drought IndicatorsNADM Continental Drought Indicators

40
Other AlternativesOther Alternatives––Continental Modeled DataContinental Modeled DataNOAA/CPC Leaky Bucket Soil Moisture Percentiles

41
Weekly NRT surface wetness and surface temperature anomaly
data from passive microwave data
Near-Real-Time NDVI composite generation
from MODIS
Area with extensiveaspen dieback during2001-2002 drought
NOAA/NESDIS Satellite Vegetation Health Index
Weekly NDVI, AVHRR Data
Remotely Sensed DataRemotely Sensed Data

42
Short-Term Blend
35% Palmer Z Index25% 3-Month Precip.20% 1-Month Precip.13% CPC Soil Model7% Palmer Drought Index
Long-Term Blend
25% Palmer Hydro. Index20% 24-Month Precip.20% 12-Month Precip.15% 6-Month Precip.10% 60-Month Precip.10% CPC Soil Model
• Operationally Integrate multiple indicators in a weekly update using a percentile ranking method
• The US produces these maps on a weekly time step using CPC’s real-time daily, weekly climate division data and NCDC’s Monthly archive of indices for 1932-2000.
• All products are first rendered as percentiles with respect to the 1932-2000 data.
• Canada is exploring the creation of blended indicators similar to USDM Objective Blends, but with different components and likely different weights
• Would need serially complete data, so could not be computed on station data
Blended IndicatorsBlended Indicators

43
The Importance of Local Expert InputThe Importance of Local Expert Input
Montana StateDrought Advisory Committee
Oregon State Climatologist Office Local NWS & USDA/NRCS Offices
State Climate Offices
State Drought Task Forces
Regional ClimateCenters
Low Water Advisory from Consevation Districts
AAFC’s Climate Relate Production Risks
Committe
• The U.S. Drought Monitor Team Relies on Field Observation Feedback from the Local Experts for Impacts Information & “Ground Truth”– Listserver (140-150 Participants: 2/3 Federal, 1/3 State/University)

44
Monitoring Outside the Agricultural Extent, Monitoring Outside the Agricultural Extent, Especially in the Northern ExtremesEspecially in the Northern Extremes
• Lack of station data for northern regions.
• Lack of understanding of drought assessment and drought issues in northern areas, especially north of the treeline.
• Research is required on how to address these issues.
• First priority is to improve monitoring in the boreal regions.
• We need to develop relative indicators for northern regions. CFS currently uses Absolute indicators.
• Remove sensing may be able to assist in some regions.

45
• Currently EC is sending data to the NCDC to be used in creating the NADM indicator maps.
• Lack of station density in Canada has prevented us from providing and interpolated map of all of North America.
• The data that is represented on the dot maps is far below what we currently get from EC for our Drought model products.
• This issue needs to be examined.
Station Density IssuesStation Density Issues

46
The Importance of Station DensityThe Importance of Station Density

47
Roadblocks in the Drought Monitoring Process: Portrayal of Drought Resolution
Colorado:-- 5 Climate Divisions-- 104,091 square miles-- Elevation Range:
3,320 to 14,433 feet
Maryland:-- 8 Climate Divisions-- 10,460 square miles-- Elevation Range:
sea level to 3,360 feet
The Importance of Station Density ContThe Importance of Station Density Cont’’dd……

48
Potential Data Potential Data –– Untapped Data OptionsUntapped Data OptionsNew sources of data from:
• Private networks i.e. Weather Innovations (WIN) and the Weather Bug.
• Provincial seasonal networks - i.e. agriculture and forestry departments
• New projects such as Crop Insurance Weather Derivatives

49
The USDM is moving toward state-level trend analysis capabilities (left) and providing more county-level drought assessment information (right).
Is this a model that we would like to follow? Do Canada and Mexico have the ability to monitor at this scale?
Scale and ScalabilityScale and Scalability

50
Moving Forward: Web Mapping ServicesMoving Forward: Web Mapping ServicesSpatial resolution is also critical to drought monitoring and assessment.

51
Online Drought Impact Data CollectionOnline Drought Impact Data Collection

52
an option of receiving data and reports
Exploring Internet Mapping Systems (IMS)Exploring Internet Mapping Systems (IMS)

53
CONTACT: Mark Svoboda, National Drought Mitigation Center [email protected] Brewer, NOAA/National Climatic Data Center [email protected]
The National Integrated Drought Information SystemThe National Integrated Drought Information System
NIDIS is an integrated, interagency national droughtmonitoring and forecasting system that provides:
• An early warning & forecast system for drought.• Drought impact and causation education.• Information for drought mitigation.• An interactive, web-based drought portal.• Improved observational capabilities.
NIDIS Builds Upon Collaborative Successes!
A Web site and services that improve the access, processing, and sharing of structured and unstructured information within and across a given “enterprise”through Service-Oriented Architecture that Fosters ease of communication.

54
Moving Forward: Spatial OverlaysMoving Forward: Spatial Overlays

55
Moving Forward: Spatial Overlays ContMoving Forward: Spatial Overlays Cont’’dd……

56
Moving Forward: Spatial Overlays ContMoving Forward: Spatial Overlays Cont’’dd……

57
Moving Forward: Spatial Overlays ContMoving Forward: Spatial Overlays Cont’’dd……

58
Potential Opportunities and Areas of Growth and Potential Opportunities and Areas of Growth and Limiting FactorsLimiting Factors
• Possibilities are endless, however we face some significant limited factors including:– Lack of data - Most of our data is for the agricultural areas of Canada.
Very little is available for artic or even the boreal areas. There is certainly room to improve this by adding more provincial data.
– Need for research. We need to better understand how to assess drought regionally, including in northern Canada.
– The resources (people and money) dedicated to this project is very low in Canada (as well as Mexico); we need to expand the team withinCanada to deliver the NADM more efficiently and more accurately.
– In order to progress the NADM in Canada we must link the assessments to programs and policy

59
Current Research Activities to Improve Monitoring and Current Research Activities to Improve Monitoring and our Understanding of Drought in Canadaour Understanding of Drought in Canada
• Relevant Indicators– Can we apply these indicators uniformly across the continent? – Are these indicators sensitive to the climate variations in the diverse
geography of Canada’s agricultural landscape, and throughout North America, and can they be applied in the generalized and uniform way they are proposed?
– Using percent of normal precipitation criteria as defined for NADM, in humid locations obtaining a drought classification beyond D1 (moderate drought) would be rare
• Trigger levels – intensity, duration• Timing of moisture deficiencies as it relates to:
– Runoff – stream flow, pond, lake and reservoir levels– Soil moisture– Perennial crop yield– Annual crop yield– Groundwater levels

60
Summary of issuesSummary of issues
• Canadian environment is complex (making a summary of what is going on is not easy)
• Inputs to generate DI’s are not always there• A number of indices may not be meaningful at some
locations• Sensitivity analysis has not been done- uncertainties in
most of the indices are unknown• Conflict among indices:
– Moderate drought (D1) using the percent of normal precipitation while the SPI values classified an extreme drought (D3).

61
NADM NADM -- StrengthsStrengths
• Continental-scale depiction of drought• Consistent across international borders• Integrates many indicators• Provides a integrated image (easy-view) of all drought
conditions in one product• Pool resources, increase communication, increased
cooperation and collaboration.• Uses input from local experts.• Catches local errors
62
NADM NADM –– Future GoalsFuture Goals• Increase spatial density of stations across North America• Better understand the application of indicators on local conditions• Continue to research and develop a set of indicators that defines drought but has the
flexibility to be geographically sensitive and meaningful to all sectors.• Better understand the needs of each of the regions in terms of drought monitoring
and reporting. • Develop blended of indices for Canada on a regional scale. • Develop contacts with in the regions to assist with local conditions reporting • Improve our understand and ability to monitor outside the agricultural region of Canada. • Do a better job incorporating hydrologic data• Improve our data density Incorporate Remote Sensing data into the assessments• Explore linking NADM to policy and programs in Canada.

Thank You
Trevor Hadwen
The National Agroclimate Information Service, Agriculture &Agri-Food Canada

64
Other Benefits of the NADMOther Benefits of the NADM


![Weekly Report Drought Monitor / Snowpack Update€¦ · Weekly Report - Snowpack / Drought Monitor Update Date: 29 December 2011 [End of Year Edition] SNOTEL SNOWPACK AND PRECIPITATION](https://img.pdfslide.us/doc/110x75/5f14161a6565b54157769b36/weekly-report-drought-monitor-snowpack-update-weekly-report-snowpack-drought.jpg)

![DROUGHT MONITOR [IHP-VIII] - UNESDOC Databaseunesdoc.unesco.org/images/0023/002319/231937e.pdf · DROUGHT MONITOR [IHP-VIII] International Hydrological Programme. THE CONTEXT Drought](https://img.pdfslide.us/doc/110x75/5b99333609d3f26e678b70e8/drought-monitor-ihp-viii-unesdoc-drought-monitor-ihp-viii-international.jpg)