Embed Size (px)
Citation preview
The North American Crude Boom: Impacts on US and PADD IV Refiners
John R. Auers
Turner, Mason & Company
Platts’ 7th Annual Rockies Oil & Gas Conference April 15, 2013 Denver, CO
Presented by
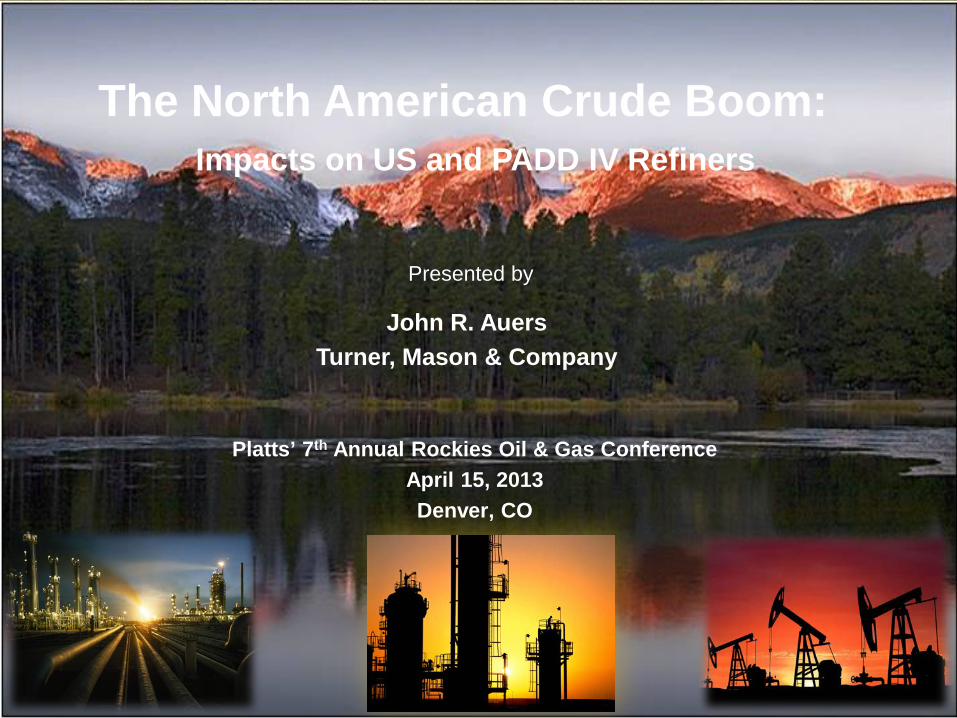
International consulting practice since 1971
Downstream focus; refinery/chemical engineers
Industry and financial clients
Publish various outlook and forecast products Crude and Refined Products Outlook Refinery Construction Outlook World Crude Oil Outlook The Great NGL Surge! (with BENTEK Energy) Special Studies
2
Turner, Mason & Company
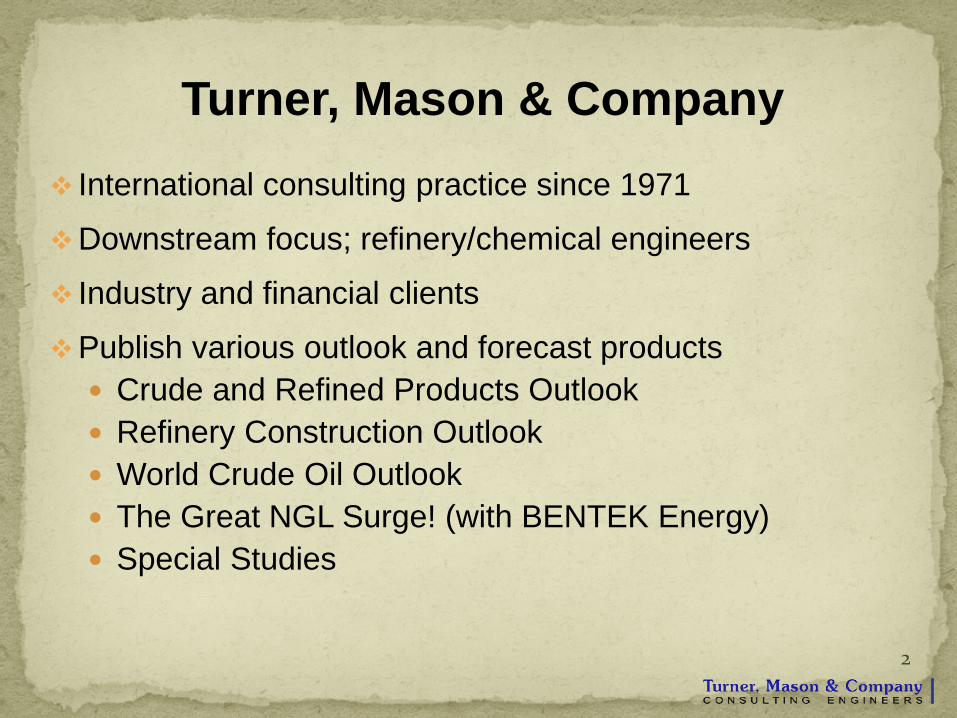
Detailed regional production forecasts; focus on quality
Determination of refinery demand and capability to run different types of crude by facility/region
Analysis of required logistics
Evaluate challenges and opportunities for producers and refiners and midstream operators
Initial publication – June 2012
Update issued in October 2012
Next edition scheduled for release in June 2013
3
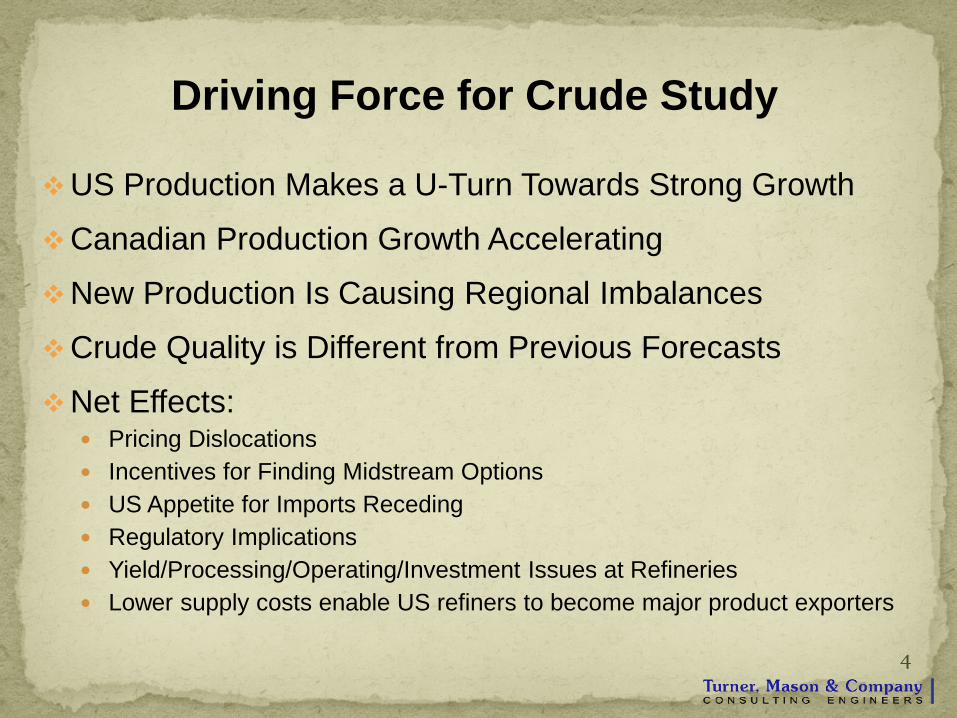
US Production Makes a U-Turn Towards Strong Growth
Canadian Production Growth Accelerating
New Production Is Causing Regional Imbalances
Crude Quality is Different from Previous Forecasts
Net Effects: Pricing Dislocations Incentives for Finding Midstream Options US Appetite for Imports Receding Regulatory Implications Yield/Processing/Operating/Investment Issues at Refineries Lower supply costs enable US refiners to become major product exporters
4
Driving Force for Crude Study
Presentation Agenda
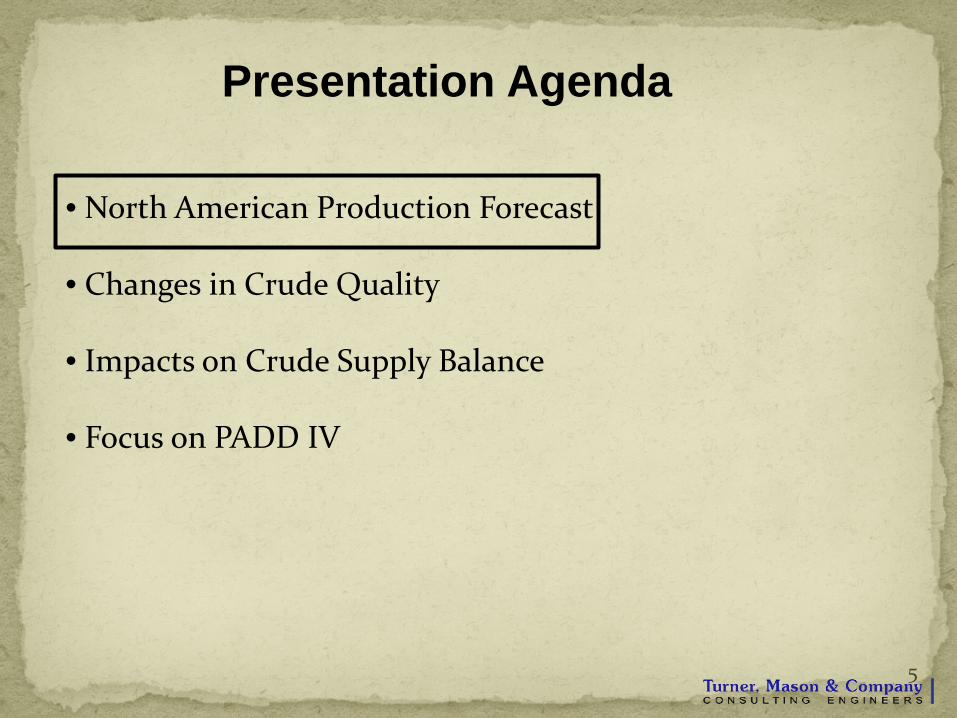
• North American Production Forecast
• Changes in Crude Quality • Impacts on Crude Supply Balance
• Focus on PADD IV
5
Recent Developments
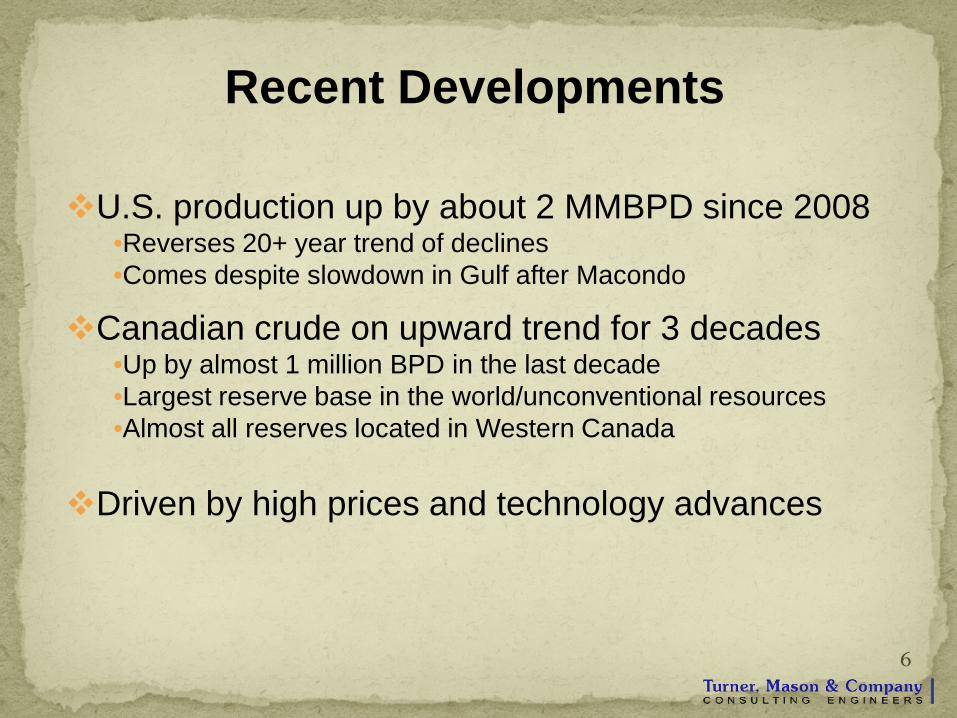
U.S. production up by about 2 MMBPD since 2008 •Reverses 20+ year trend of declines •Comes despite slowdown in Gulf after Macondo
Canadian crude on upward trend for 3 decades •Up by almost 1 million BPD in the last decade •Largest reserve base in the world/unconventional resources •Almost all reserves located in Western Canada
Driven by high prices and technology advances
6
Production Forecasts
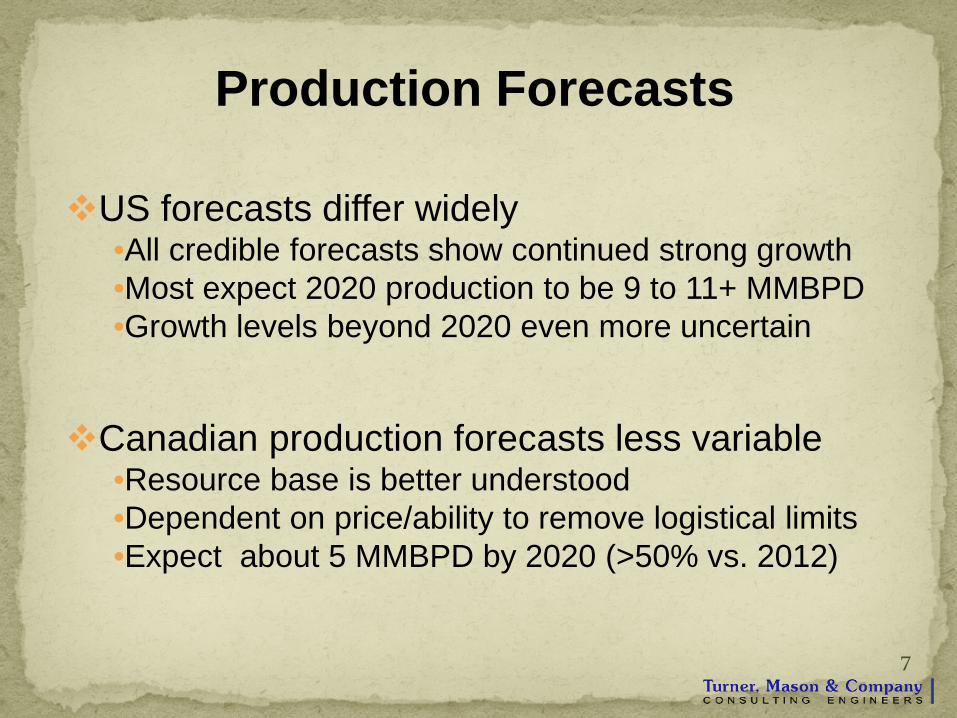
US forecasts differ widely •All credible forecasts show continued strong growth •Most expect 2020 production to be 9 to 11+ MMBPD •Growth levels beyond 2020 even more uncertain
Canadian production forecasts less variable •Resource base is better understood •Dependent on price/ability to remove logistical limits •Expect about 5 MMBPD by 2020 (>50% vs. 2012)
7
Production Forecasts (cont.)
Where/What Type? • U.S. growth mostly in PADDs 2 and 3 • Declines in Alaska/California to continue • Predominantly light sweet • Canadian growth primarily in the West • Vast majority heavy sour
Production dependent on key assumptions
• Crude prices – both absolute and regional • Production potential of tight oil plays very uncertain • Prospective fields (Utica, Tuscaloosa, SCOOP) even harder to forecast • Various limitations (manpower, materials, regulatory, etc.) affect growth • Ability to move crude to markets in timely and cost effective ways will be
particularly critical
8
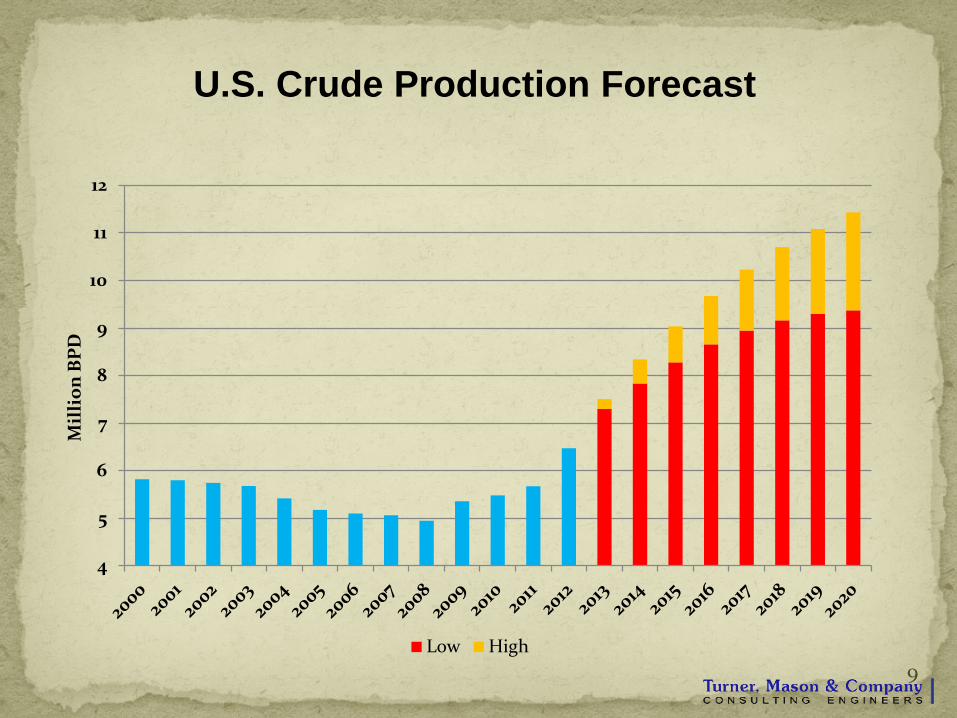
U.S. Crude Production Forecast
9
4
5
6
7
8
9
10
11
12
Mil
lion
BPD
Low High
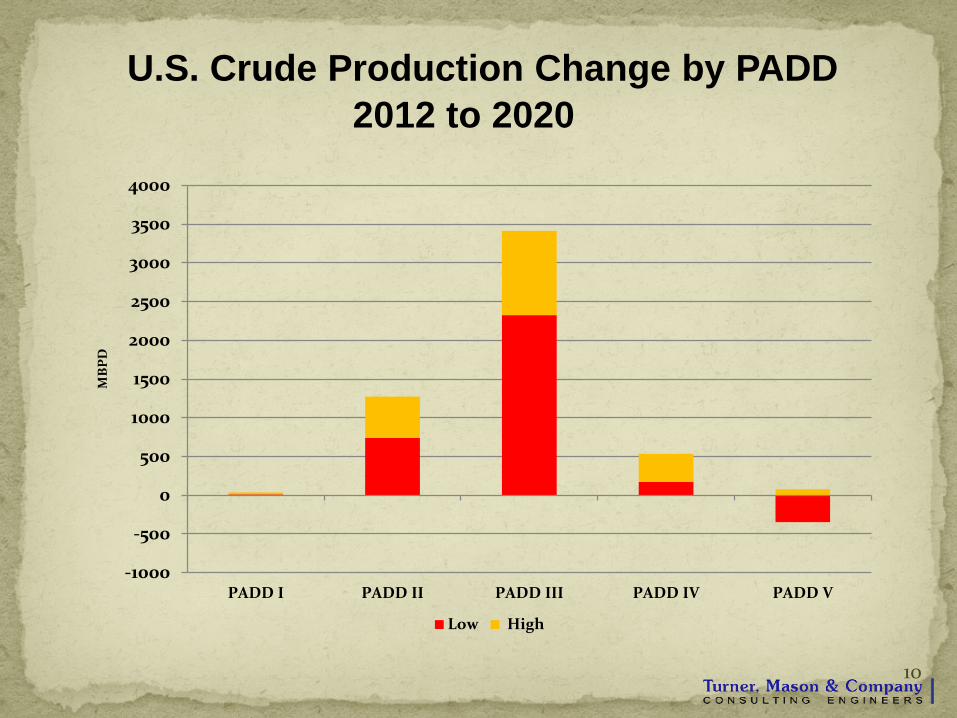
U.S. Crude Production Change by PADD 2012 to 2020
10
-1000
-500
0
500
1000
1500
2000
2500
3000
3500
4000
PADD I PADD II PADD III PADD IV PADD V
MB
PD
Low High
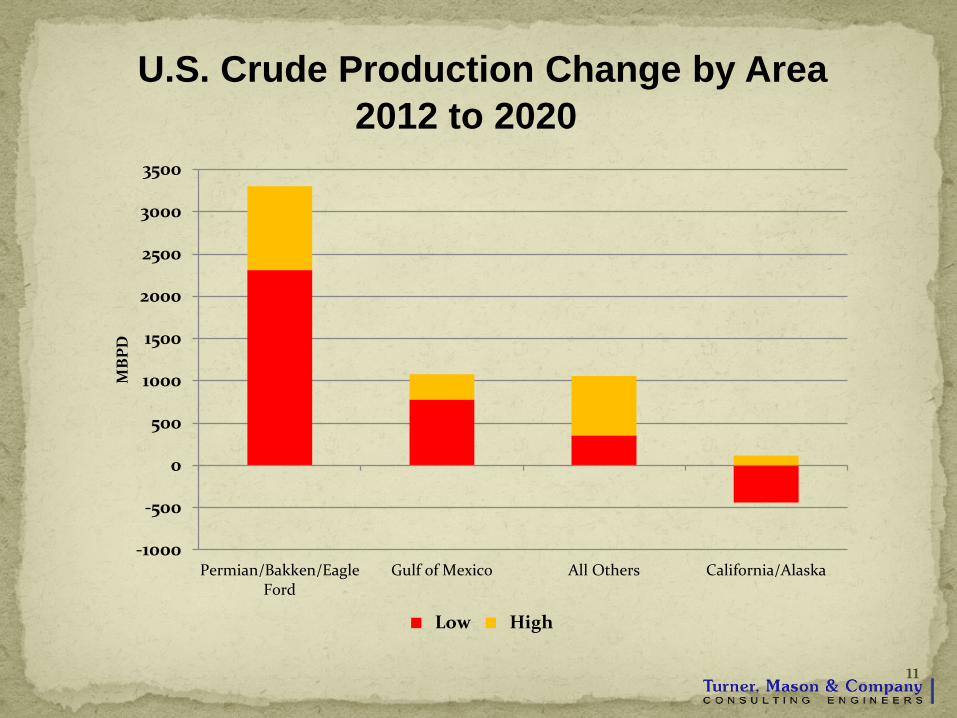
U.S. Crude Production Change by Area 2012 to 2020
11
-1000
-500
0
500
1000
1500
2000
2500
3000
3500
Permian/Bakken/EagleFord
Gulf of Mexico All Others California/Alaska
MB
PD
Low High
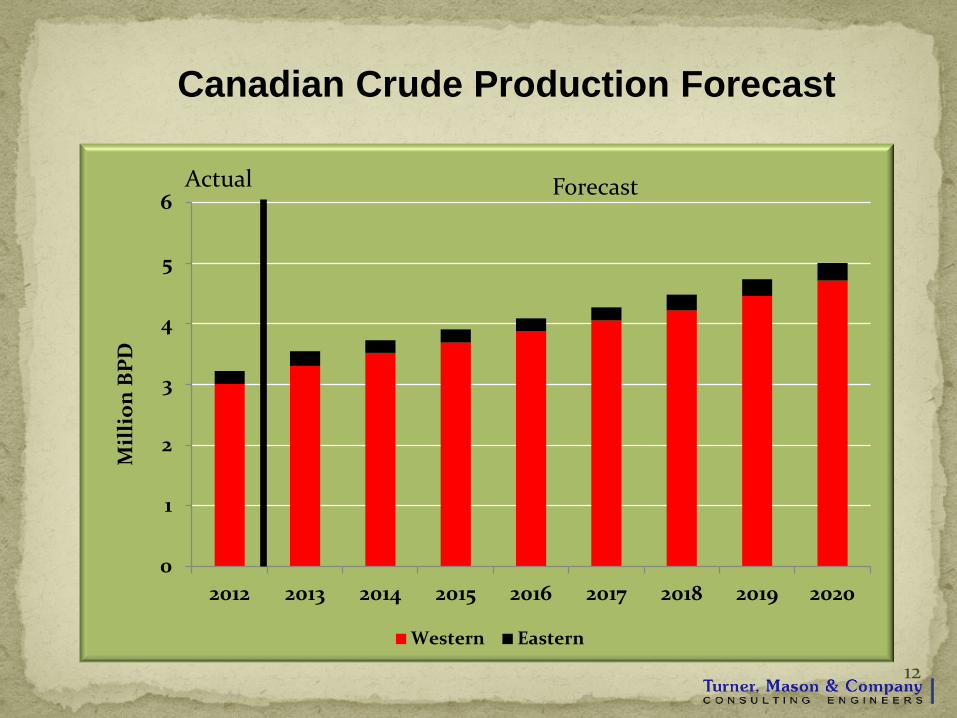
0
1
2
3
4
5
6
2012 2013 2014 2015 2016 2017 2018 2019 2020
Mil
lion
BPD
Western Eastern
Forecast
Canadian Crude Production Forecast
12
Actual
Presentation Agenda
• Crude Production Forecast
• Changes in Crude Quality • Impacts on Crude Supply Balance
• Focus on PADD IV
13
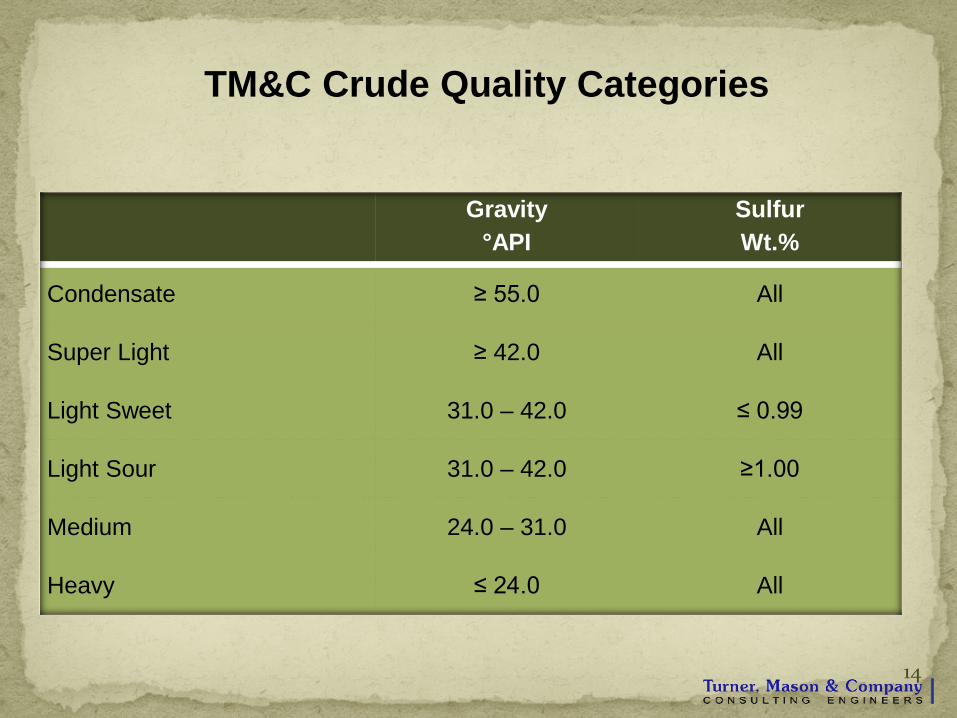
Gravity °API
Sulfur Wt.%
Condensate ≥ 55.0 All
Super Light ≥ 42.0 All
Light Sweet 31.0 – 42.0 ≤ 0.99
Light Sour 31.0 – 42.0 ≥1.00
Medium 24.0 – 31.0 All
Heavy ≤ 24.0 All
TM&C Crude Quality Categories
14
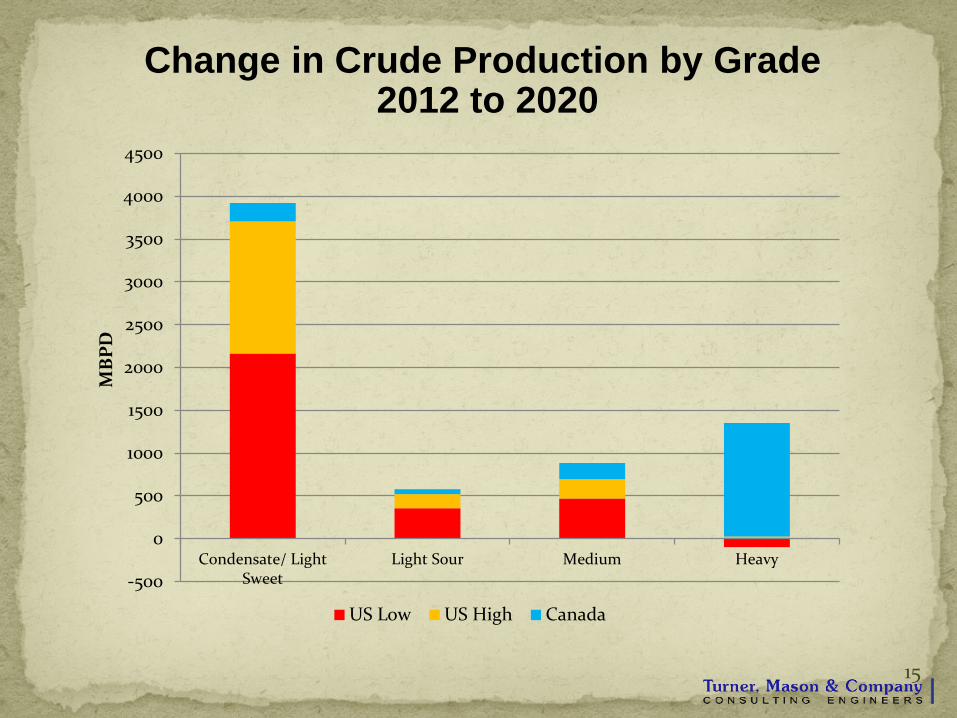
Change in Crude Production by Grade 2012 to 2020
15
-500
0
500
1000
1500
2000
2500
3000
3500
4000
4500
Condensate/ LightSweet
Light Sour Medium Heavy
MB
PD
US Low US High Canada
0.2
0.4
0.6
0.8
1.0
1.2
1.4
31
32
33
34
35
36
37
2000 2002 2004 2006 2008 2010 2012 2014 2016 2018 2020
Sulf
ur, w
t. %
API
Gra
vity
API Gravity Sulfur, wt. %
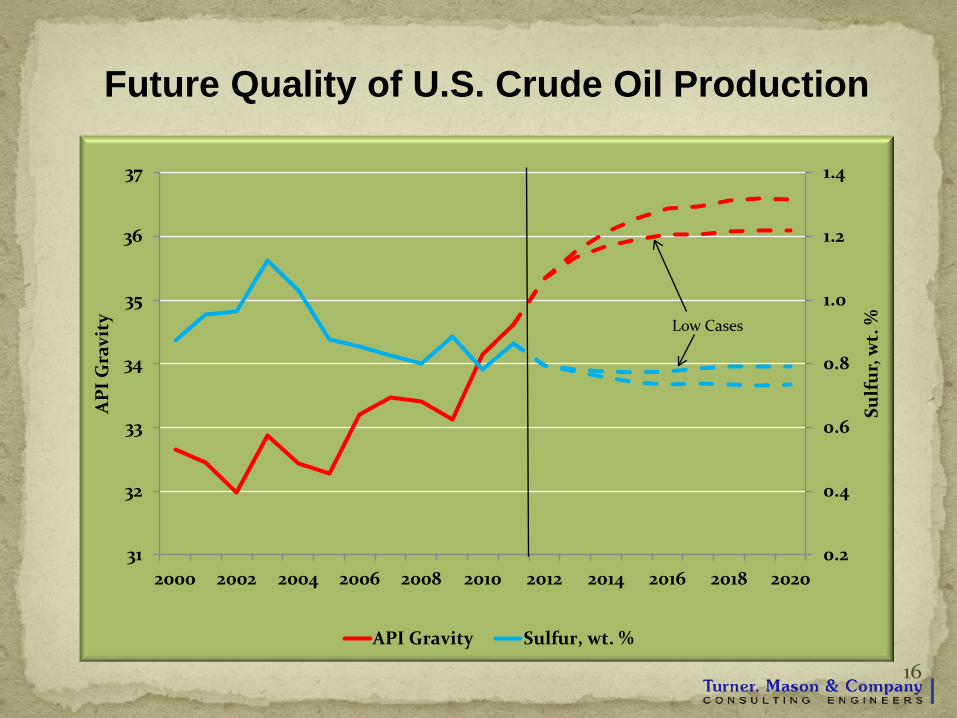
Future Quality of U.S. Crude Oil Production
16
Low Cases
17
30
30.5
31
31.5
32
32.5
33
API G
ravi
ty
API Gravity
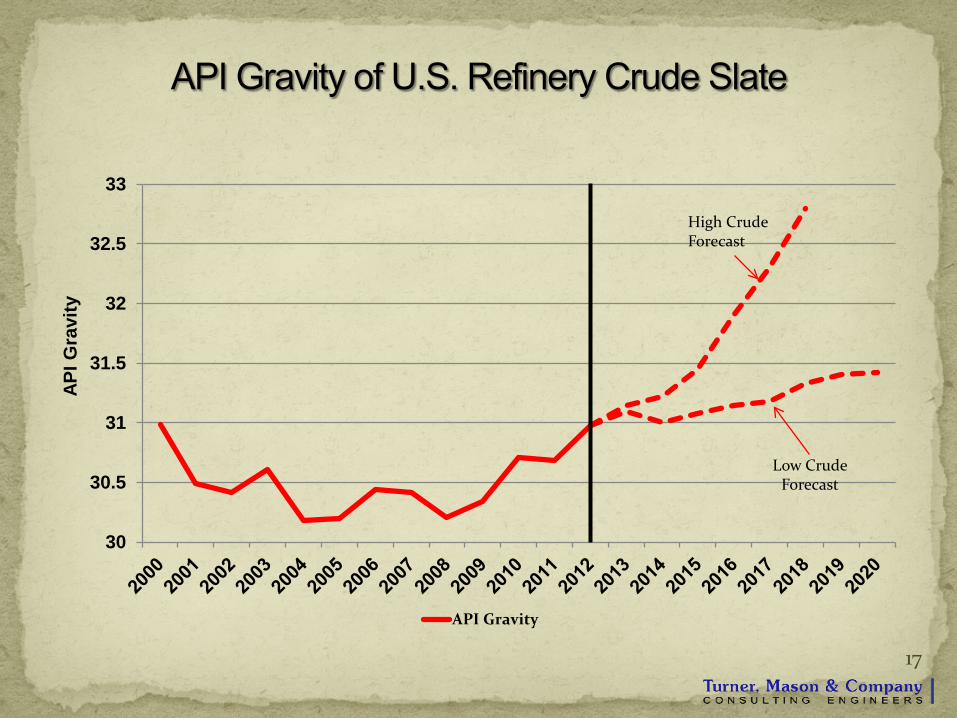
High Crude Forecast
Low Crude Forecast
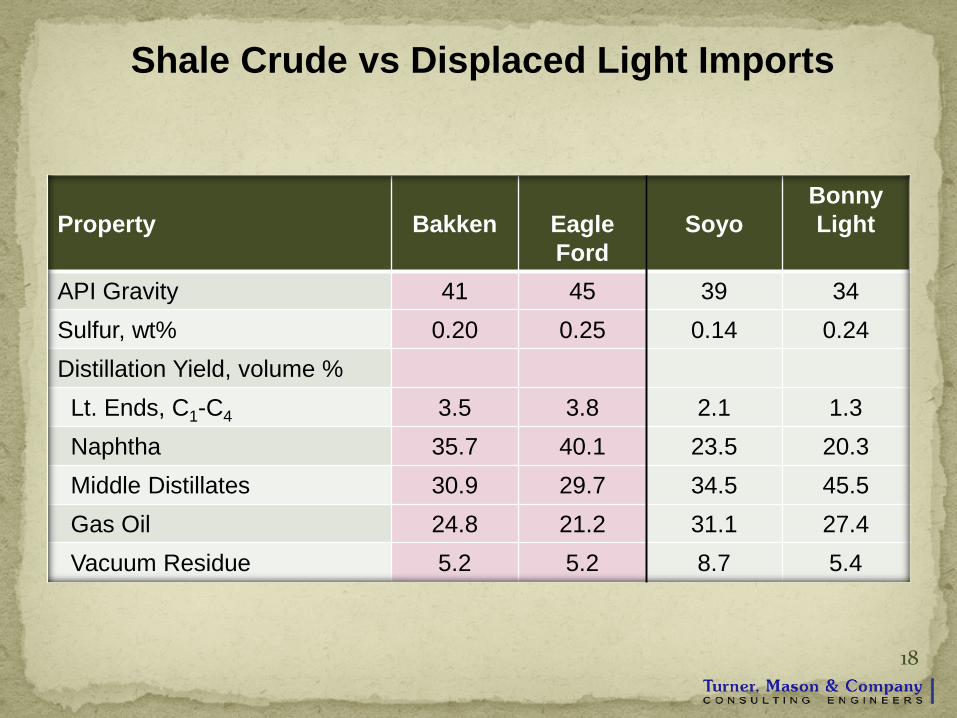
Shale Crude vs Displaced Light Imports
18
Property
Bakken
Eagle Ford
Soyo
Bonny Light
API Gravity 41 45 39 34 Sulfur, wt% 0.20 0.25 0.14 0.24 Distillation Yield, volume % Lt. Ends, C1-C4 3.5 3.8 2.1 1.3 Naphtha 35.7 40.1 23.5 20.3 Middle Distillates 30.9 29.7 34.5 45.5 Gas Oil 24.8 21.2 31.1 27.4 Vacuum Residue 5.2 5.2 8.7 5.4
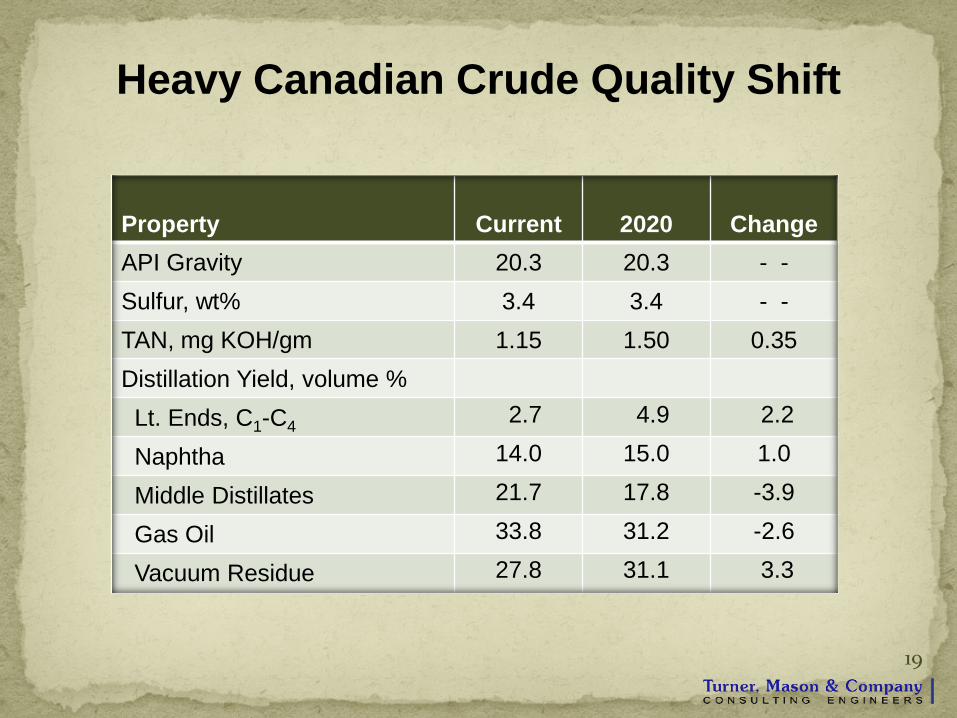
Heavy Canadian Crude Quality Shift
19
Property
Current
2020
Change
API Gravity 20.3 20.3 - - Sulfur, wt% 3.4 3.4 - - TAN, mg KOH/gm 1.15 1.50 0.35 Distillation Yield, volume % Lt. Ends, C1-C4 2.7 4.9 2.2
Naphtha 14.0 15.0 1.0
Middle Distillates 21.7 17.8 -3.9
Gas Oil 33.8 31.2 -2.6
Vacuum Residue 27.8 31.1 3.3
• Crude Production Forecast
• Changes in Crude Quality
• Impacts on Crude Supply Balance
• Focus on PADD IV
Presentation Agenda
20
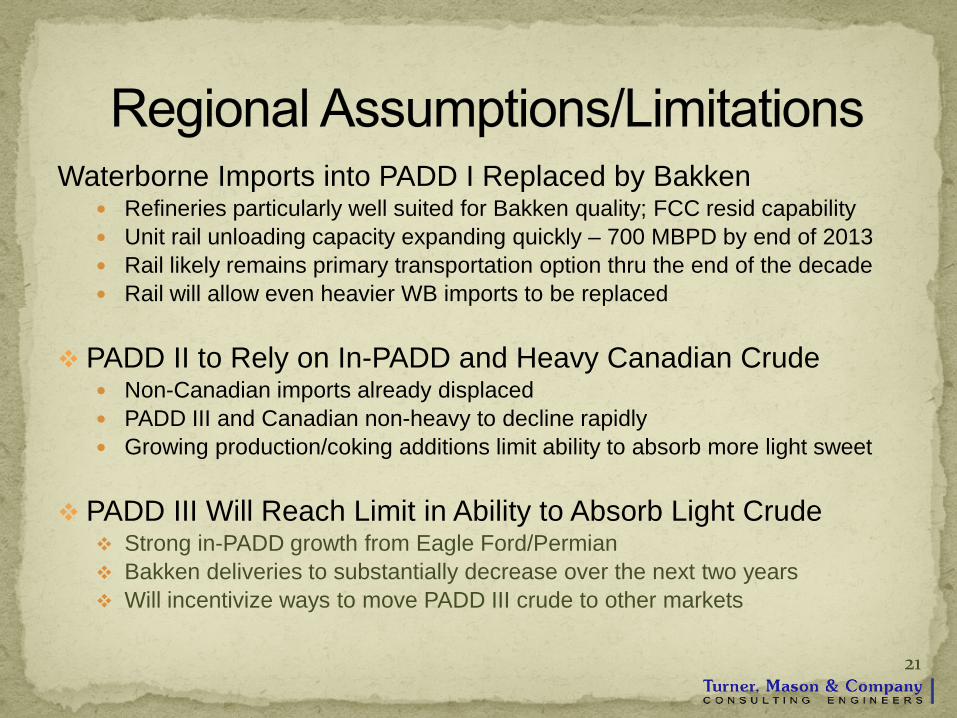
Waterborne Imports into PADD I Replaced by Bakken Refineries particularly well suited for Bakken quality; FCC resid capability Unit rail unloading capacity expanding quickly – 700 MBPD by end of 2013 Rail likely remains primary transportation option thru the end of the decade Rail will allow even heavier WB imports to be replaced
PADD II to Rely on In-PADD and Heavy Canadian Crude Non-Canadian imports already displaced PADD III and Canadian non-heavy to decline rapidly Growing production/coking additions limit ability to absorb more light sweet
PADD III Will Reach Limit in Ability to Absorb Light Crude Strong in-PADD growth from Eagle Ford/Permian Bakken deliveries to substantially decrease over the next two years Will incentivize ways to move PADD III crude to other markets
21
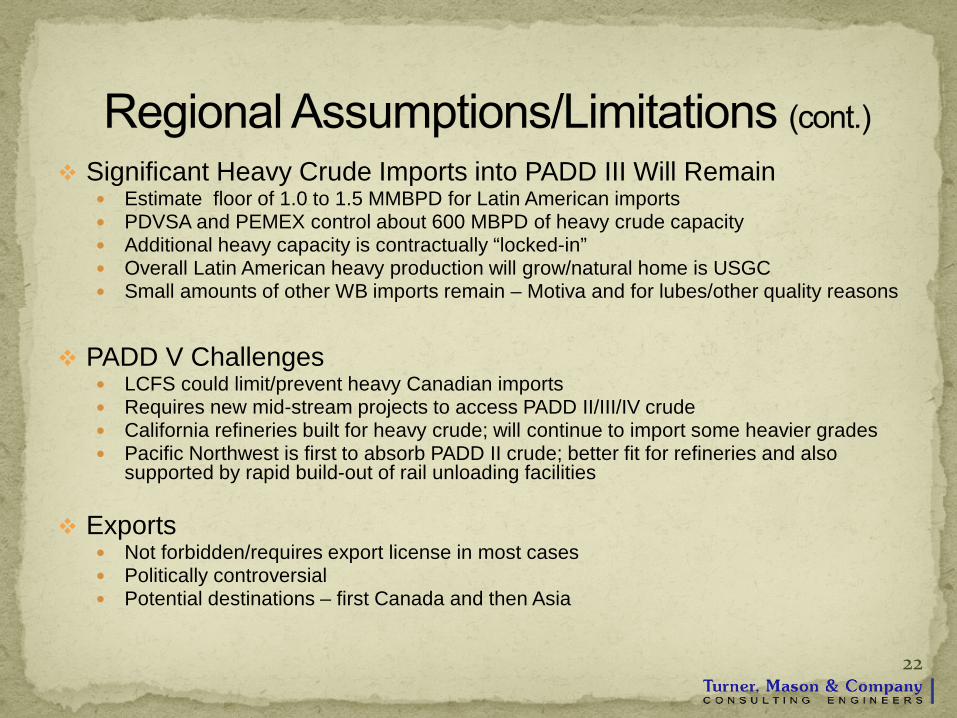
Significant Heavy Crude Imports into PADD III Will Remain Estimate floor of 1.0 to 1.5 MMBPD for Latin American imports PDVSA and PEMEX control about 600 MBPD of heavy crude capacity Additional heavy capacity is contractually “locked-in” Overall Latin American heavy production will grow/natural home is USGC Small amounts of other WB imports remain – Motiva and for lubes/other quality reasons
PADD V Challenges
LCFS could limit/prevent heavy Canadian imports Requires new mid-stream projects to access PADD II/III/IV crude California refineries built for heavy crude; will continue to import some heavier grades Pacific Northwest is first to absorb PADD II crude; better fit for refineries and also
supported by rapid build-out of rail unloading facilities
Exports Not forbidden/requires export license in most cases Politically controversial Potential destinations – first Canada and then Asia
22
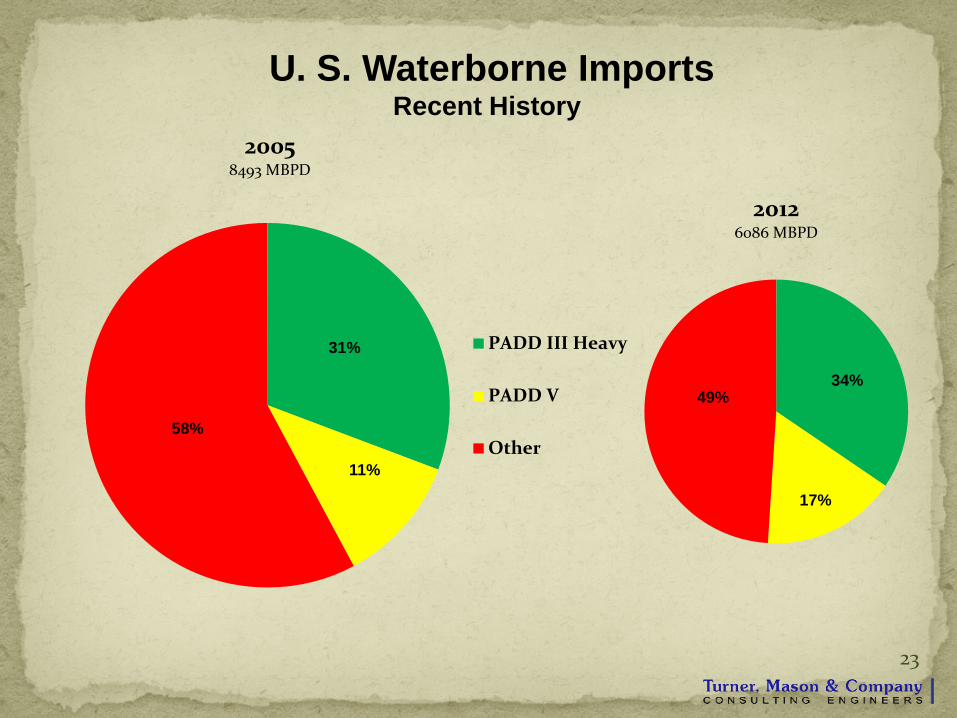
U. S. Waterborne Imports Recent History
23
31%
11%
58%
2005 8493 MBPD
PADD III Heavy
PADD V
Other
34%
17%
49%
2012 6086 MBPD
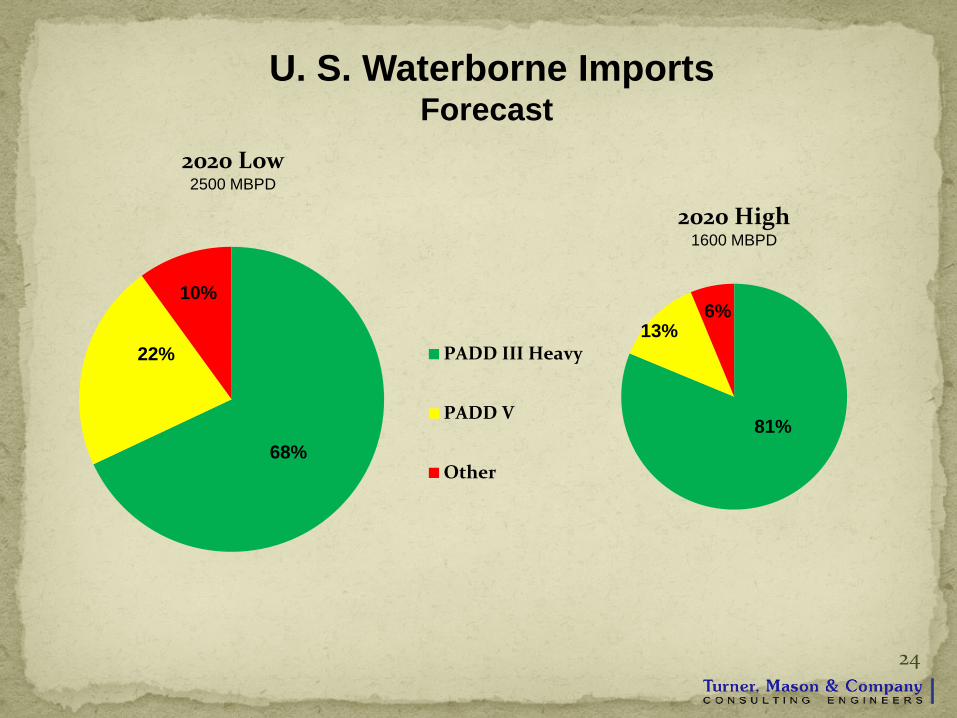
U. S. Waterborne Imports Forecast
24
68%
22%
10%
2020 Low 2500 MBPD
PADD III Heavy
PADD V
Other
81%
13% 6%
2020 High 1600 MBPD
Presentation Agenda
• Crude Production Forecast
• Changes in Crude Quality • Impacts on Crude Supply Balance
• Focus on PADD IV
25
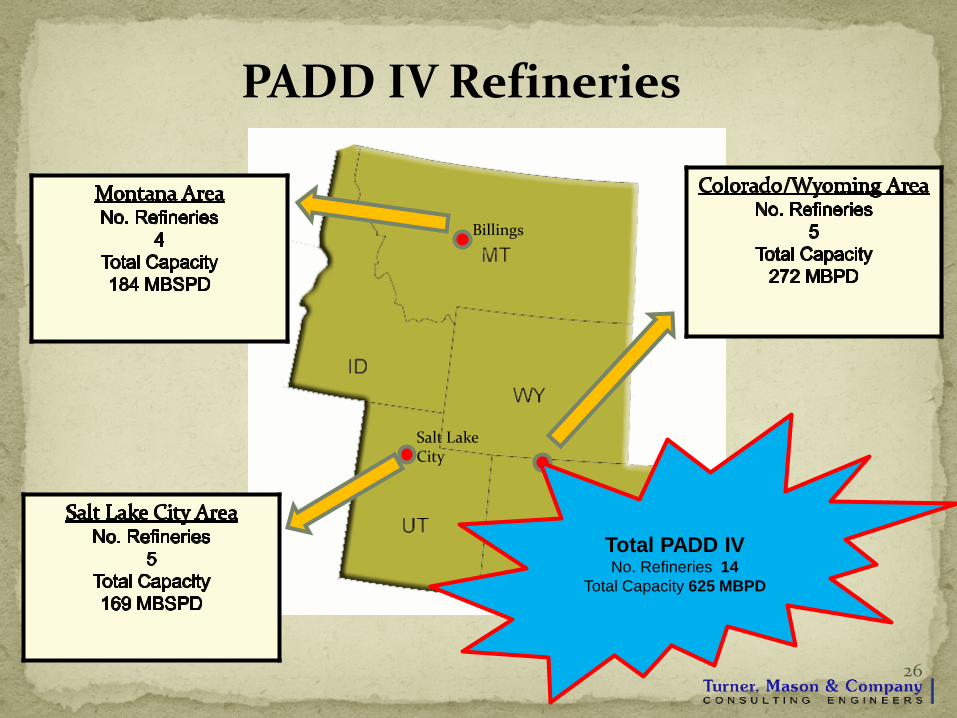
Total PADD IV No. Refineries 14
Total Capacity 625 MBPD
PADD IV Refineries
26
Billings
Salt Lake City
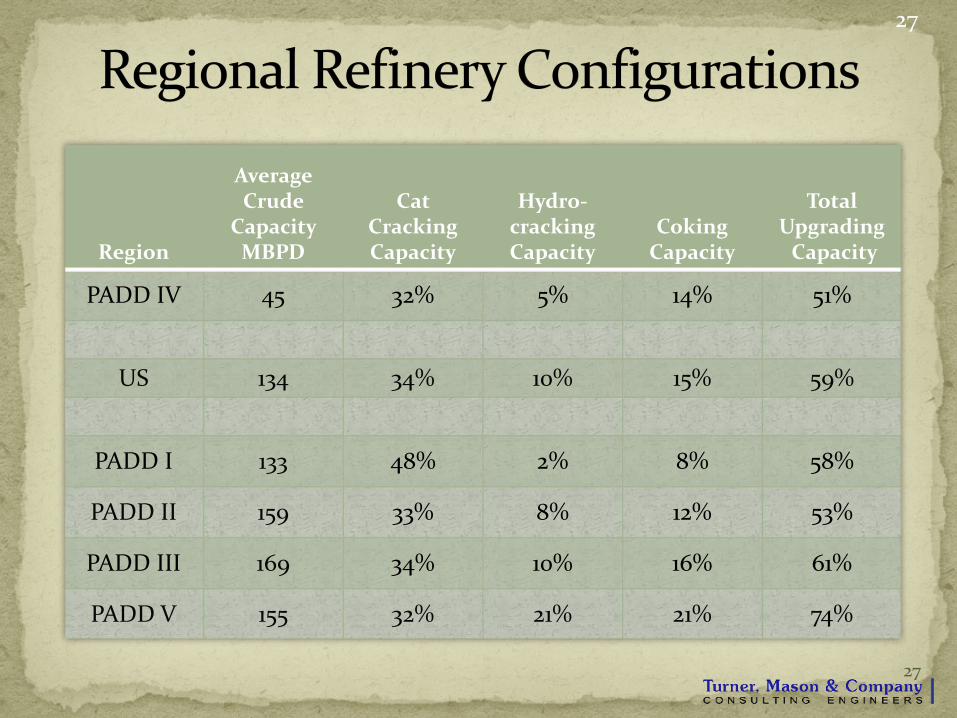
Region
Average Crude
Capacity MBPD
Cat Cracking Capacity
Hydro-cracking Capacity
Coking Capacity
Total Upgrading Capacity
PADD IV 45 32% 5% 14% 51%
US 134 34% 10% 15% 59%
PADD I 133 48% 2% 8% 58%
PADD II 159 33% 8% 12% 53%
PADD III 169 34% 10% 16% 61%
PADD V 155 32% 21% 21% 74%
27
27
28
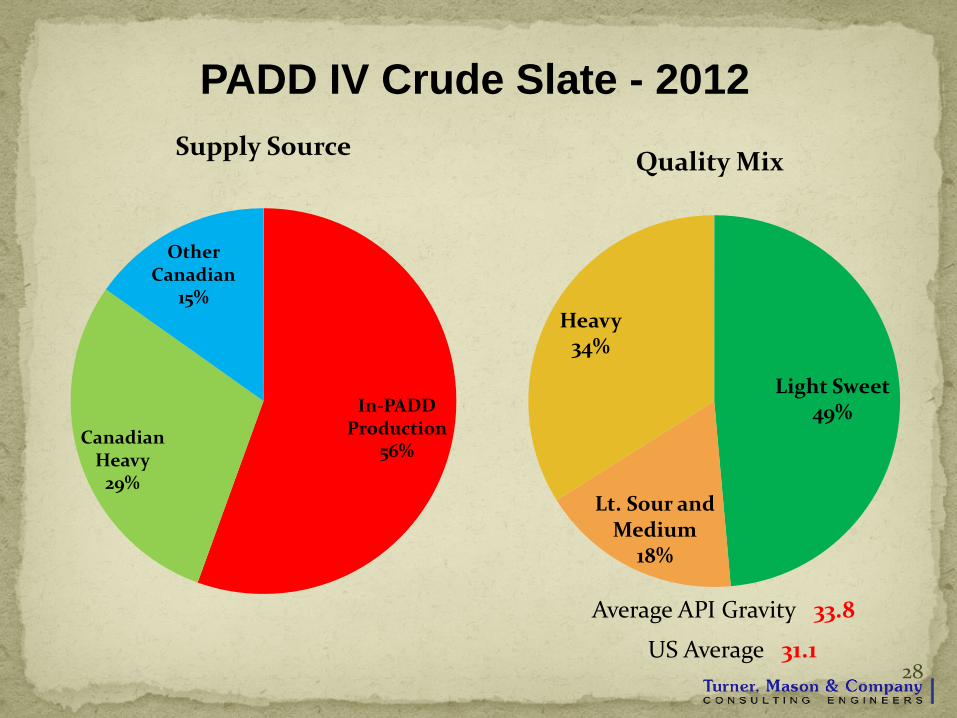
In-PADD Production
56% Canadian
Heavy 29%
Other Canadian
15%
Supply Source
Light Sweet 49%
Lt. Sour and Medium
18%
Heavy 34%
Quality Mix
PADD IV Crude Slate - 2012
Average API Gravity 33.8
US Average 31.1
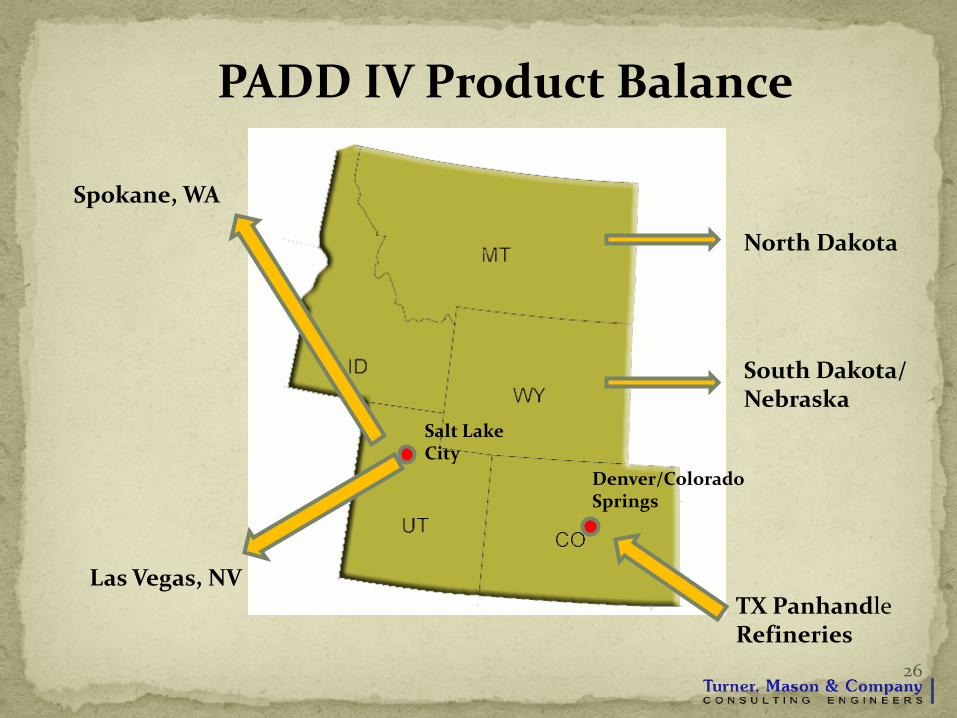
PADD IV Product Balance
26
Denver/Colorado Springs
TX Panhandle Refineries
Las Vegas, NV
Spokane, WA
Salt Lake City
North Dakota
South Dakota/ Nebraska
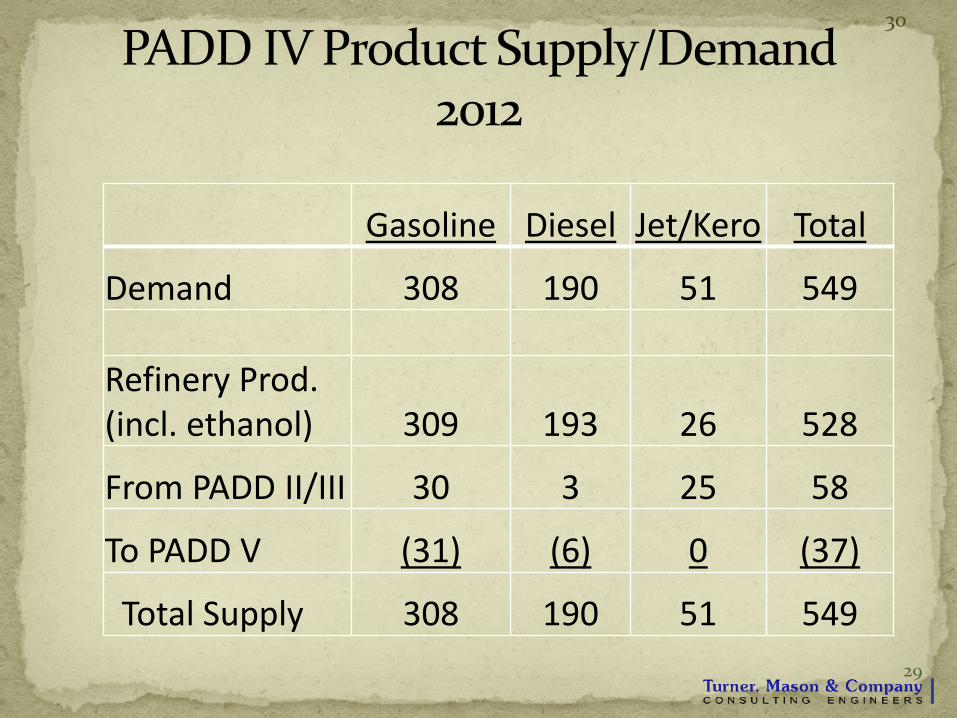
Gasoline Diesel Jet/Kero Total
Demand 308 190 51 549
Refinery Prod. (incl. ethanol) 309 193 26 528
From PADD II/III 30 3 25 58
To PADD V (31) (6) 0 (37)
Total Supply 308 190 51 549
30
29
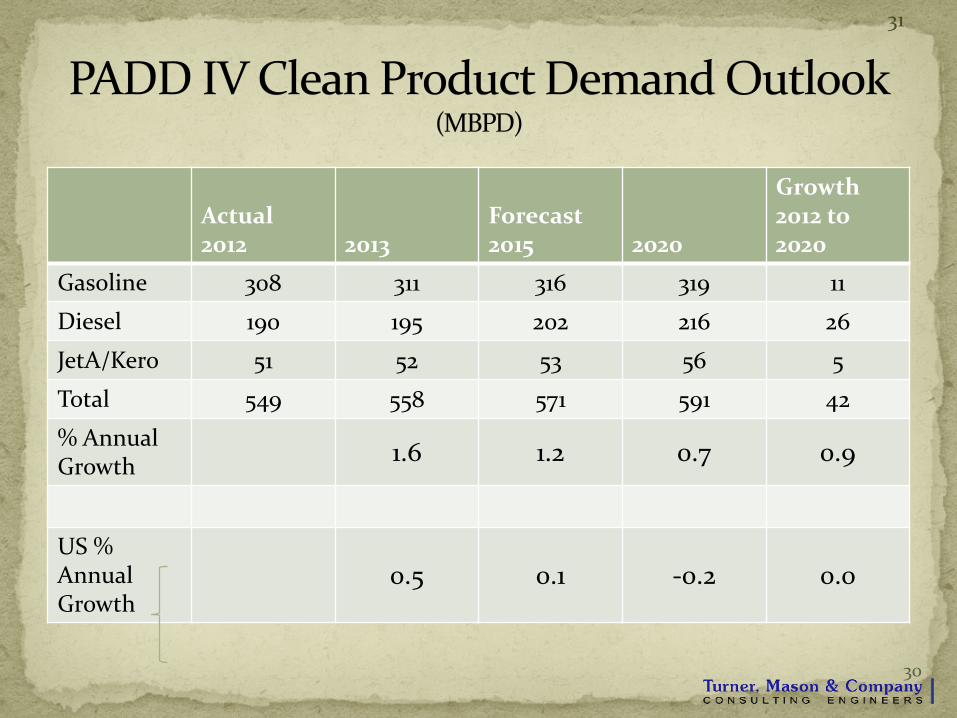
Actual 2012 2013
Forecast 2015 2020
Growth 2012 to 2020
Gasoline 308 311 316 319 11
Diesel 190 195 202 216 26
JetA/Kero 51 52 53 56 5
Total 549 558 571 591 42
% Annual Growth 1.6 1.2 0.7 0.9
US % Annual Growth
0.5 0.1 -0.2 0.0
31
30
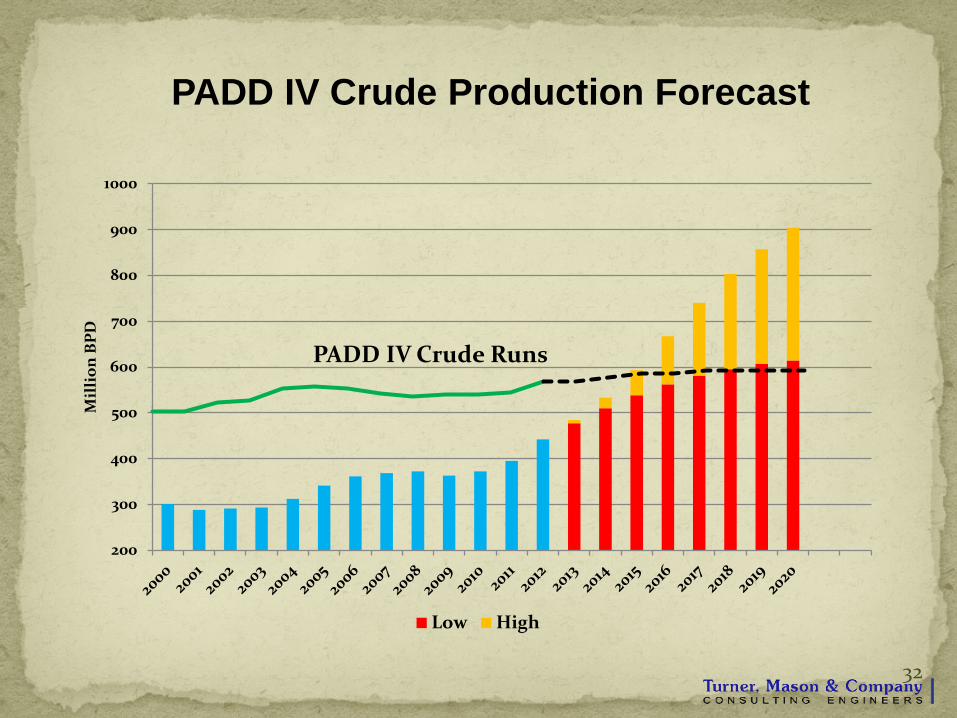
PADD IV Crude Production Forecast
32
200
300
400
500
600
700
800
900
1000
Mil
lion
BPD
Low High
PADD IV Crude Runs
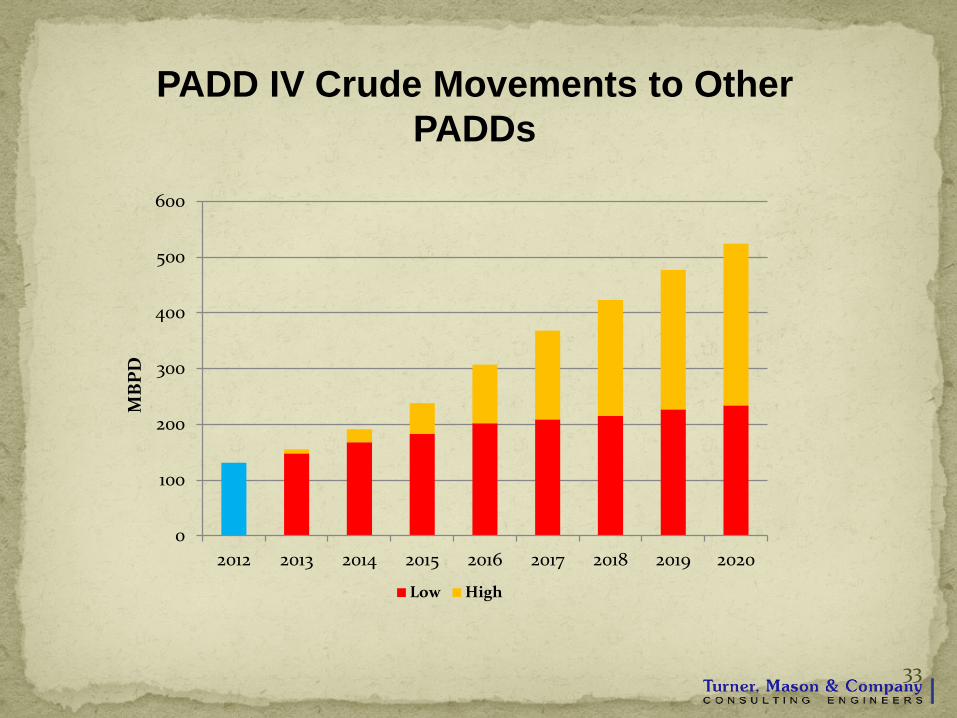
PADD IV Crude Movements to Other PADDs
33
0
100
200
300
400
500
600
2012 2013 2014 2015 2016 2017 2018 2019 2020
MB
PD
Low High
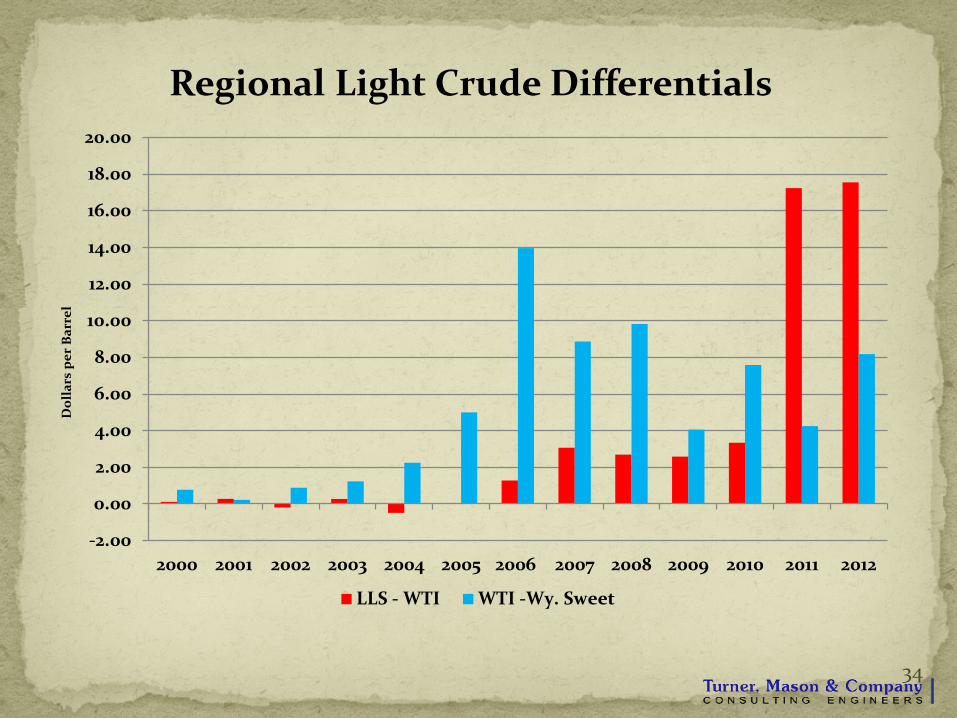
34
-2.00
0.00
2.00
4.00
6.00
8.00
10.00
12.00
14.00
16.00
18.00
20.00
2000 2001 2002 2003 2004 2005 2006 2007 2008 2009 2010 2011 2012
Dol
lars
per
Bar
rel
LLS - WTI WTI -Wy. Sweet
Regional Light Crude Differentials
Surplus of Crude in PADD IV will Continue to Grow Only PADD with production greater than in-PADD demand Wide range for potential surplus due to unknown production prospects Quality of new crude will be light; question is how light?
Finding Markets for New Crude/Ways to Access Markets Critical
Several P/L projects are being developed Rail projects are also moving ahead; well behind developments in Bakken A major challenge: PADD II and III are already saturated with light crude PADD V could be potential destination; challenge is logistics One advantage in marketing to California refiners is the low CI assigned to Niobrara
PADD IV Refiners Should Continue to Experience Superior Margins
Lower crude costs than in other regions Product demand growth above U.S. averages Incentivize some small projects – focus on running local crude/produce distillates Expansion of capacity/crude runs limited by regional demand More exposed to domestic economic conditions because of inability to export products
35

36

John R. Auers – Senior Vice President Turner, Mason & Company [email protected]
Telephone: 214-754-0898
37