Embed Size (px)
Citation preview
The Nonprofit Research Collaborative November 2010 Fundraising Survey
Executive Summary In this ninth annual survey of nonprofit organizations (charities and foundations), respondents answered questions comparing their organizations’ total contributions in the first nine months of 2010 compared with the same period in 2009. Nearly the same percentage of organizations reported that giving was up as those that reported giving was down. Of the about 2,500 responses, 36 percent said giving rose and 37 percent said giving fell, while the other 26 percent reported that total giving remained the same.
However, there are some differences across organizations according to charity type and budget size.
Organizations in four of the analyzed subsectors reported an equal percentage of both increases and decreases in contributions. These subsectors include: Arts, Education, Environment/Animals, and Human Services.
International organizations were the most likely to report an increase in contributions, reflecting donations made for disaster relief.
In the Health, Public‐society Benefit, and Religion subsectors, a larger percentage of organizations reported a decrease in charitable contributions than reported an increase. In these three subsectors, there is at least a five‐point gap between the percentage with a drop and the percentage with an increase in gifts received.
The larger the organization’s size based on total annual expenditures, the more likely the organization was to report an increase in charitable receipts in the first nine months of 2010, compared with the same period in 2009.
Approximately 22 percent of charities used volunteers in positions that were formerly paid positions during the first nine months of 2010. This is up from 15 percent a year ago.
Most organizations were hopeful about 2011. About 47 percent planned budget increases,
33 percent expected to maintain their current level of expenditures, and only 20 percent anticipated a lower budget for 2011.
Contents Executive Summary ....................................................................................................................................... 1
Summary of the Nonprofit Research Collaborative Fundraising Survey ...................................................... 1
Main Finding ................................................................................................................................................. 2
Changes in Contribution Levels by Type of Charity ...................................................................................... 3
Analysis of Changes in Giving by Mission of Organization ............................................................................ 4
Contribution Levels, January‐September 2010, Grouped by Organizations’ Total Annual Expenditures .... 8
Details about Decreased Contributions from Individuals, Grouped by Organizations’ Total Annual
Expenditures ................................................................................................................................................. 9
Details about Private Foundation Grants, Grouped by Organizations’ Total Annual Expenditures ....... 10
Details about Corporate Giving, Grouped by Organizations’ Total Annual Expenditures ...................... 11
Demand for Services Rises Further in 2010 ................................................................................................ 12
Demand for Services Increases across all Subsectors in 2010 .................................................................... 13
Share of Organizations Receiving the Majority of Funding in the Last Three Months of the Year ............ 14
Expected Contribution Levels, October—December 2010, by Type of Charity ......................................... 15
Expected Contribution Levels in October—December 2010 are Driven by Experience to Date in 2010 .. 16
Expected 2011 Budget Compared with 2010 Budget, by Subsector .......................................................... 17
Grantmakers’ Experiences in 2010 and Predictions for 2011 ..................................................................... 19
Disaster Giving Focused on a Small Share of Charities ............................................................................... 20
A majority of those passed the money along ......................................................................................... 20
Prior GuideStar Surveys Compared with the Nonprofit Research Collaborative Survey for 2010 ............. 21
Comparing the GuideStar‐NRC Results to Giving USA ................................................................................ 22
Relationship between this Survey and Other Studies ................................................................................ 23
The Nonprofit Research Collaborative ........................................................................................................ 23
Methodology ............................................................................................................................................... 24
Appendix A: The Nonprofit Fundraising Survey .......................................................................................... 25
1
Summary of the Nonprofit Research Collaborative Fundraising Survey
People at more than 2,350 public charities and 163 private foundations answered this survey. The majority of people taking the survey served their organization as CEO, director of finance, or director of development. Questions focused on how the first nine months of 2010 compared with the first nine months of 2009. Topics covered include:
How total contributions changed.
Whether or not the organization receives the majority of its contributions from October through December and outlook for next year.
Changes in demands for service.
Past and future grantmaking (asked of grantmaking organizations only).
Budget predictions and what measures might be used to reduce the budget.
Risk of folding in the coming year due to financial reasons.
Receipt of contributions for Haitian earthquake or Pakistani flood relief and whether funds were passed on to another organization to perform the relief work.
All charities were asked to identify their main subject category or service area from 26 options. The analysis team researched and recoded subject categories for organizations that entered “other” or “unclassified” for the main subject category (134 organizations).
Please see Appendix A for the survey questions and the number of responses to each.
2
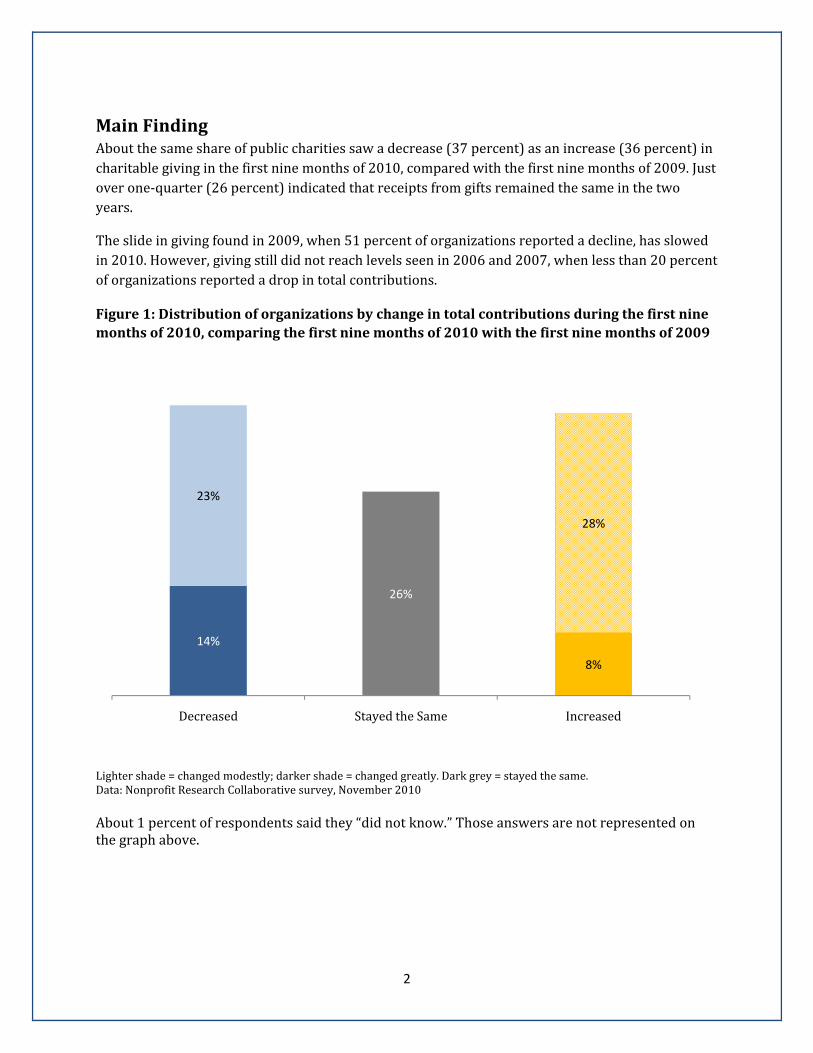
Main Finding About the same share of public charities saw a decrease (37 percent) as an increase (36 percent) in charitable giving in the first nine months of 2010, compared with the first nine months of 2009. Just over one‐quarter (26 percent) indicated that receipts from gifts remained the same in the two years.
The slide in giving found in 2009, when 51 percent of organizations reported a decline, has slowed in 2010. However, giving still did not reach levels seen in 2006 and 2007, when less than 20 percent of organizations reported a drop in total contributions.
Figure 1: Distribution of organizations by change in total contributions during the first nine months of 2010, comparing the first nine months of 2010 with the first nine months of 2009
Lighter shade = changed modestly; darker shade = changed greatly. Dark grey = stayed the same. Data: Nonprofit Research Collaborative survey, November 2010 About 1 percent of respondents said they “did not know.” Those answers are not represented on the graph above.
14%
8%
23%
26%
28%
Decreased Stayed the Same Increased
3
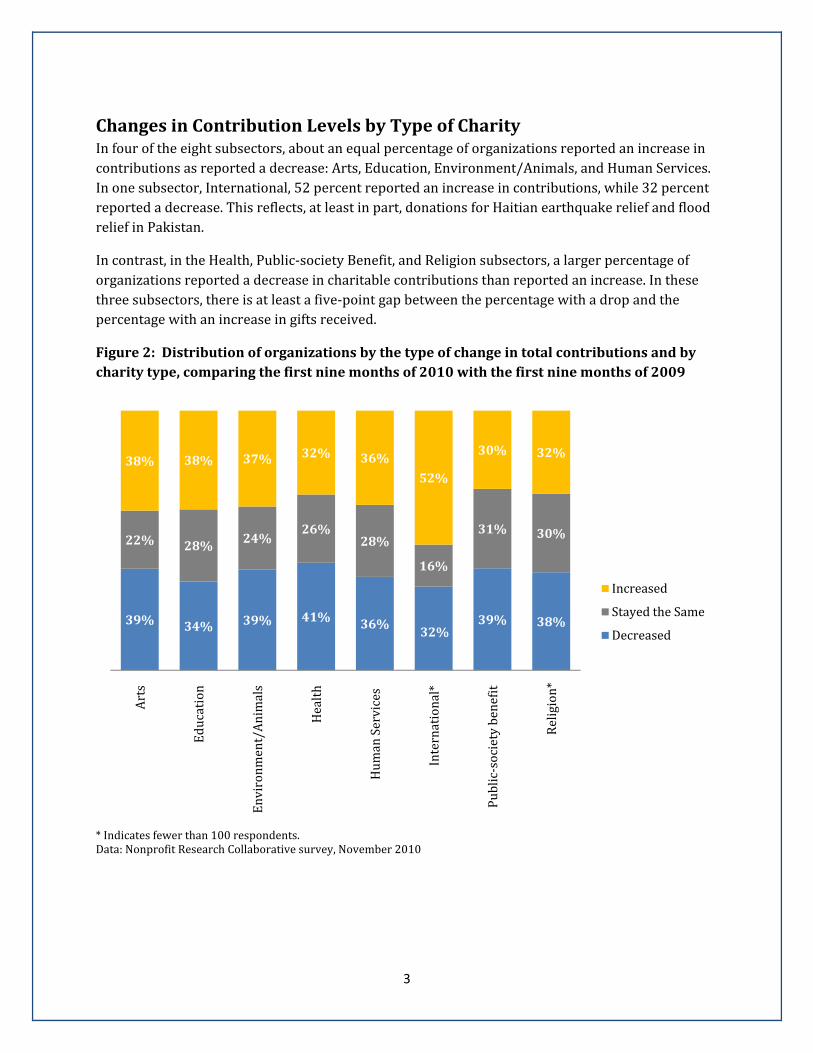
Changes in Contribution Levels by Type of Charity In four of the eight subsectors, about an equal percentage of organizations reported an increase in contributions as reported a decrease: Arts, Education, Environment/Animals, and Human Services. In one subsector, International, 52 percent reported an increase in contributions, while 32 percent reported a decrease. This reflects, at least in part, donations for Haitian earthquake relief and flood relief in Pakistan.
In contrast, in the Health, Public‐society Benefit, and Religion subsectors, a larger percentage of organizations reported a decrease in charitable contributions than reported an increase. In these three subsectors, there is at least a five‐point gap between the percentage with a drop and the percentage with an increase in gifts received.
Figure 2: Distribution of organizations by the type of change in total contributions and by charity type, comparing the first nine months of 2010 with the first nine months of 2009
* Indicates fewer than 100 respondents. Data: Nonprofit Research Collaborative survey, November 2010
39% 34% 39% 41% 36%32%
39% 38%
22% 28% 24%26%
28%
16%
31% 30%
38% 38% 37% 32% 36%
52%
30% 32%
Arts
Education
Environm
ent/Animals
Health
Hum
an Services
International*
Public‐society benefit
Religion*
Increased
Stayed the Same
Decreased
4
Analysis of Changes in Giving by Mission of Organization Respondents to this Nonprofit Research Collaborative fundraising survey were asked to identify their organizational type by selecting from a list of 26 categories, which are used by the IRS for classification. Related categories were then aggregated into subsectors (or “major groups”) to provide a broader view of the nonprofit world. Thus, the Human Services subsector includes organizations in these categories: housing/shelter, public safety, disaster relief, employment services, crime/legal‐related, food and nutrition, youth development, and a category simply termed, “human services.” Subsectors (Major Groups) I. Arts, Culture, and Humanities II. Education III. Environment/Animals IV. Health V. Human Services VI. International, Foreign Affairs VII. Public-Society Benefit VIII. Religion Related IX. Mutual/Membership Benefit X. Unknown, Unclassified
Similarly, the categories for animal‐related and environmental quality and protection were grouped into the Environment/Animals subsector, while the Health subsector encompassed mental health, health‐general and rehabilitative, and specific diseases, disorders, or medical disciplines.
This section shows the changes in giving where there were 100 or more responses in a major category, and it is organized alphabetically by the name of the subsector: Arts, Culture, Humanities, Education, Environment/Animals, etc.
5
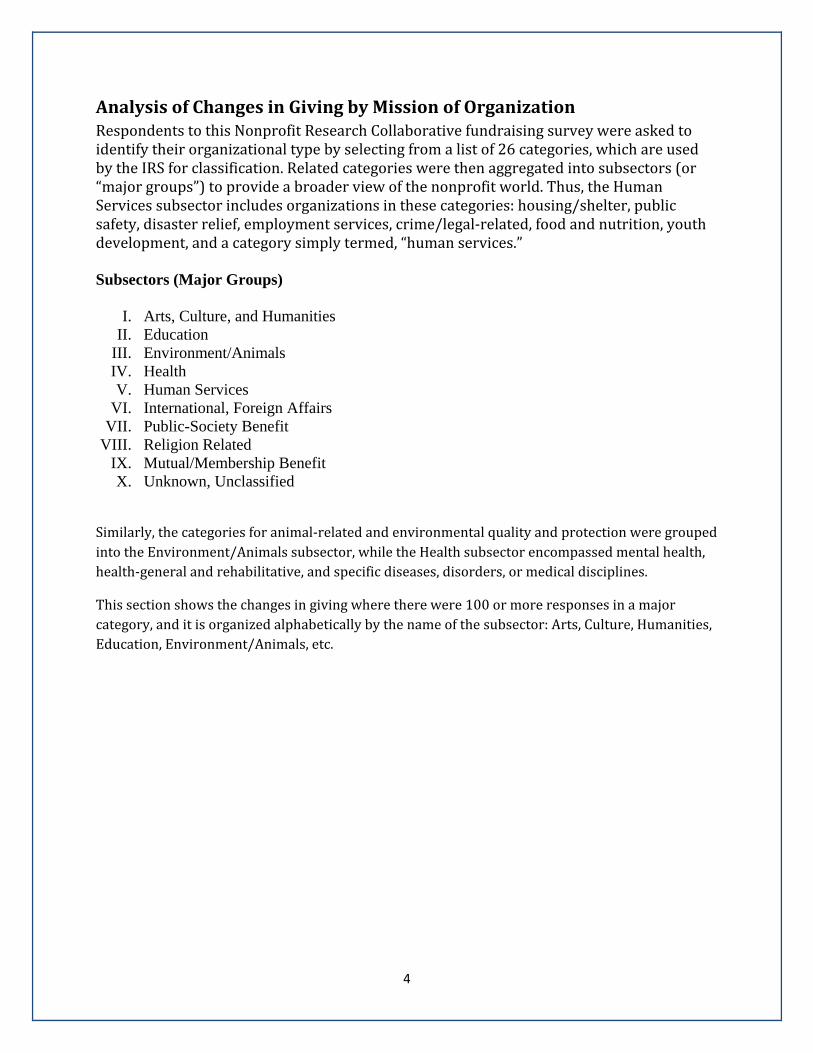
Environment/Animals Subsector and Its Major Categories
Among organizations related to animals: 31 percent reported an increase, 23 percent reported that contributions remained the same as in the first nine months of 2009, and 44 percent reported a decline in giving.
For environmental organizations: 43 percent reported an increase, 25 percent reported that giving stayed the same, and 28 percent reported that giving declined in the first nine months of 2010.
Considered together as a subsector, 37 percent of charities coded in the Animals/Environment section of the National Taxonomy of Exempt Entities (NTEE) reported an increase in total contributions in 2010, compared with the same period in 2009.
Figure 3: Distribution of organizations by the type of change in total contributions, by animal organizations, environmental organizations, and the Environment/Animal subsector, comparing the first nine months of 2009 and 2010
Data: Nonprofit Research Collaborative survey, November 2010
44%
28%39%
23%
25%
24%
31%43%
37%
Animal Organizations Environment Organizations Combined Organizations in the Environment/Animals
Subsector
Increased
Stayed the Same
Decreased
6
Health Subsector and Its Major Categories
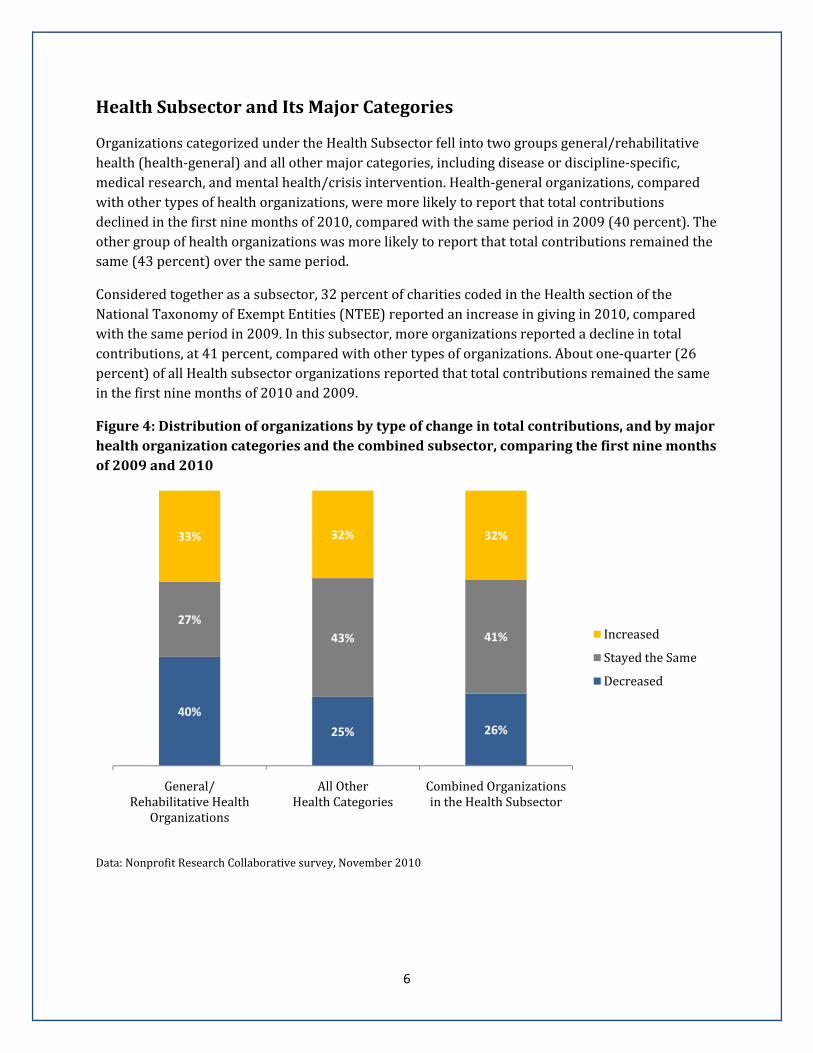
Organizations categorized under the Health Subsector fell into two groups general/rehabilitative health (health‐general) and all other major categories, including disease or discipline‐specific, medical research, and mental health/crisis intervention. Health‐general organizations, compared with other types of health organizations, were more likely to report that total contributions declined in the first nine months of 2010, compared with the same period in 2009 (40 percent). The other group of health organizations was more likely to report that total contributions remained the same (43 percent) over the same period.
Considered together as a subsector, 32 percent of charities coded in the Health section of the National Taxonomy of Exempt Entities (NTEE) reported an increase in giving in 2010, compared with the same period in 2009. In this subsector, more organizations reported a decline in total contributions, at 41 percent, compared with other types of organizations. About one‐quarter (26 percent) of all Health subsector organizations reported that total contributions remained the same in the first nine months of 2010 and 2009.
Figure 4: Distribution of organizations by type of change in total contributions, and by major health organization categories and the combined subsector, comparing the first nine months of 2009 and 2010
Data: Nonprofit Research Collaborative survey, November 2010
40%
25% 26%
27%
43% 41%
33% 32% 32%
General/Rehabilitative Health
Organizations
All Other Health Categories
Combined Organizations in the Health Subsector
Increased
Stayed the Same
Decreased
7
Human Services Subsector and Its Major Categories
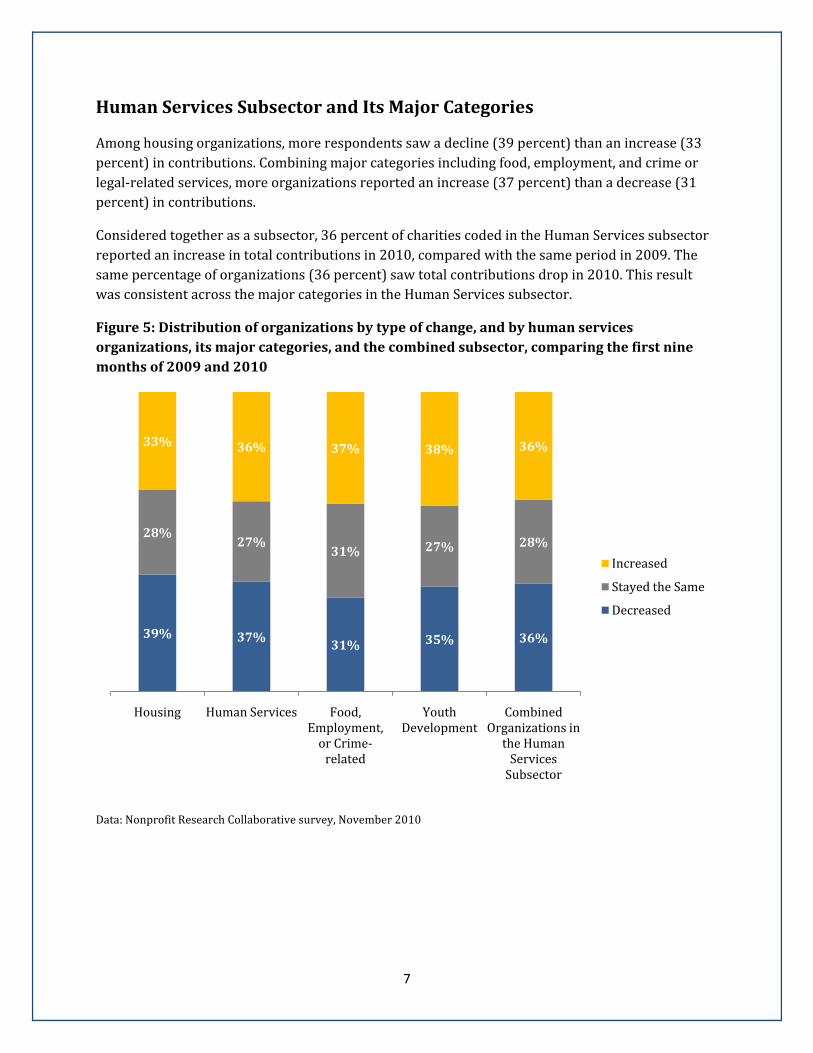
Among housing organizations, more respondents saw a decline (39 percent) than an increase (33 percent) in contributions. Combining major categories including food, employment, and crime or legal‐related services, more organizations reported an increase (37 percent) than a decrease (31 percent) in contributions.
Considered together as a subsector, 36 percent of charities coded in the Human Services subsector reported an increase in total contributions in 2010, compared with the same period in 2009. The same percentage of organizations (36 percent) saw total contributions drop in 2010. This result was consistent across the major categories in the Human Services subsector.
Figure 5: Distribution of organizations by type of change, and by human services organizations, its major categories, and the combined subsector, comparing the first nine months of 2009 and 2010
Data: Nonprofit Research Collaborative survey, November 2010
39% 37%31% 35% 36%
28%27%
31% 27% 28%
33% 36% 37% 38% 36%
Housing Human Services Food, Employment, or Crime‐related
Youth Development
Combined Organizations in the Human Services Subsector
Increased
Stayed the Same
Decreased
8
Contribution Levels, JanuarySeptember 2010, Grouped by Organizations’ Total Annual Expenditures
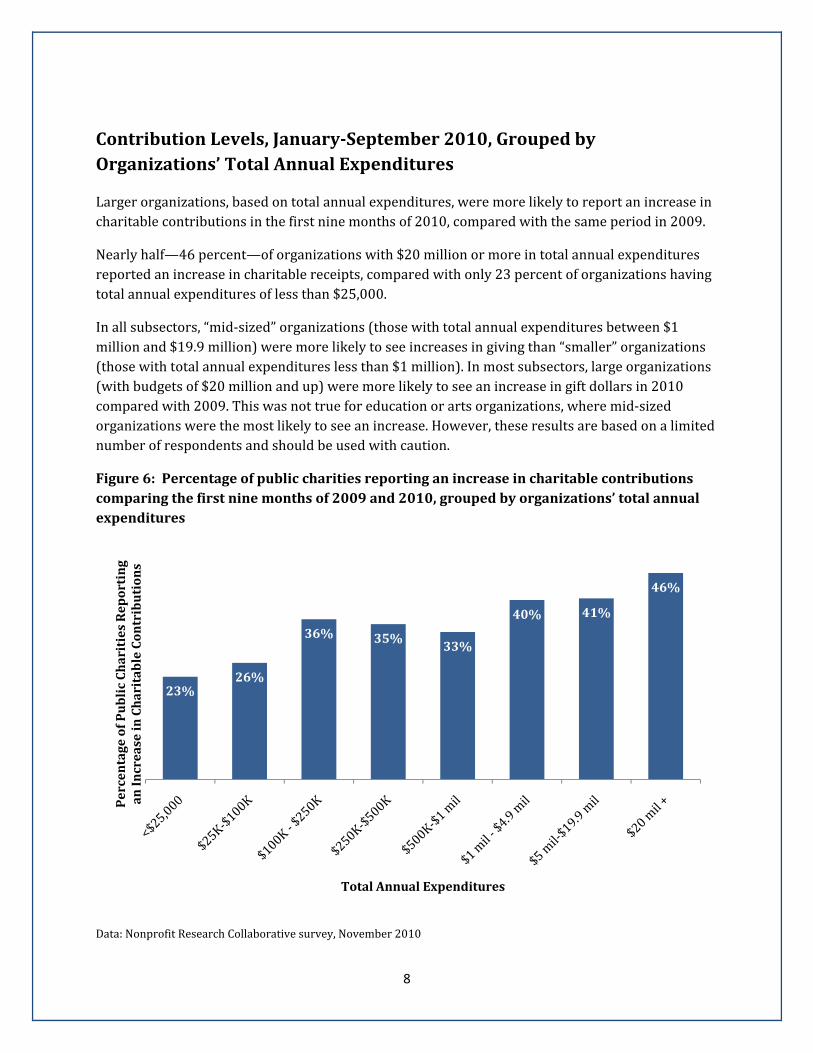
Larger organizations, based on total annual expenditures, were more likely to report an increase in charitable contributions in the first nine months of 2010, compared with the same period in 2009.
Nearly half—46 percent—of organizations with $20 million or more in total annual expenditures reported an increase in charitable receipts, compared with only 23 percent of organizations having total annual expenditures of less than $25,000.
In all subsectors, “mid‐sized” organizations (those with total annual expenditures between $1 million and $19.9 million) were more likely to see increases in giving than “smaller” organizations (those with total annual expenditures less than $1 million). In most subsectors, large organizations (with budgets of $20 million and up) were more likely to see an increase in gift dollars in 2010 compared with 2009. This was not true for education or arts organizations, where mid‐sized organizations were the most likely to see an increase. However, these results are based on a limited number of respondents and should be used with caution.
Figure 6: Percentage of public charities reporting an increase in charitable contributions comparing the first nine months of 2009 and 2010, grouped by organizations’ total annual expenditures
Data: Nonprofit Research Collaborative survey, November 2010
23%26%
36% 35%33%
40% 41%
46%
Percentage of Public Charities Reporting
an Increase in Charitable Contributions
Total Annual Expenditures
9
Details about Decreased Contributions from Individuals, Grouped by Organizations’ Total Annual Expenditures
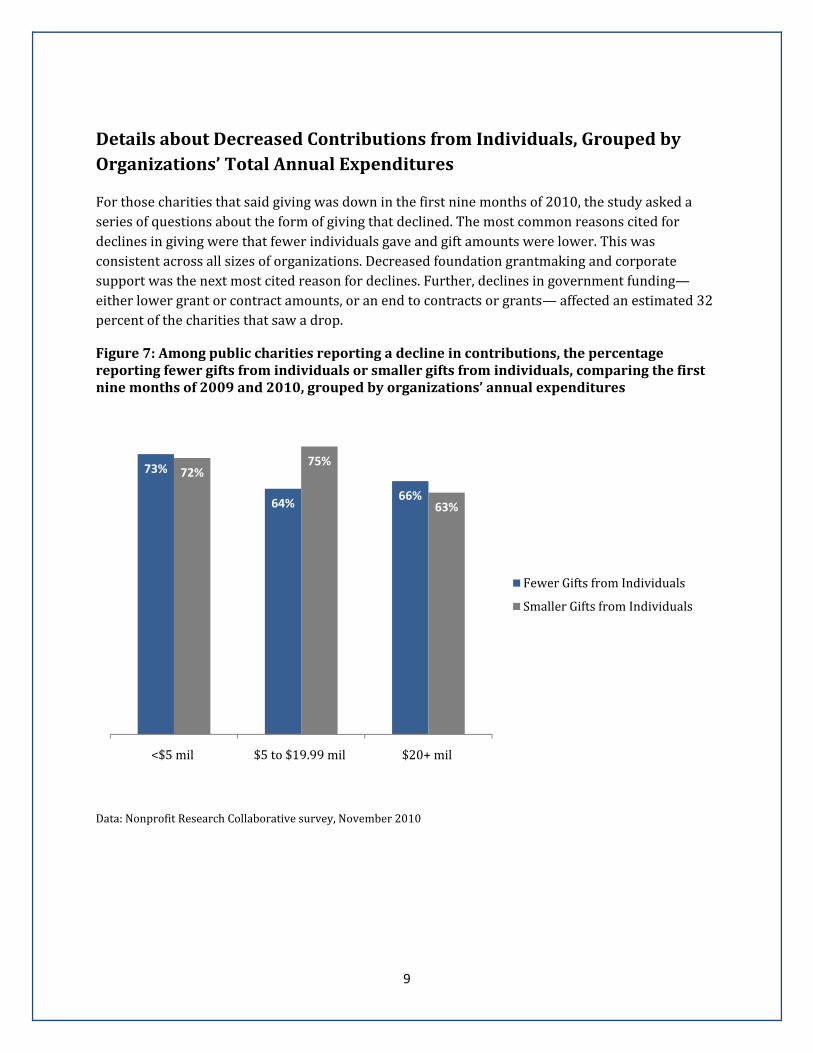
For those charities that said giving was down in the first nine months of 2010, the study asked a series of questions about the form of giving that declined. The most common reasons cited for declines in giving were that fewer individuals gave and gift amounts were lower. This was consistent across all sizes of organizations. Decreased foundation grantmaking and corporate support was the next most cited reason for declines. Further, declines in government funding—either lower grant or contract amounts, or an end to contracts or grants— affected an estimated 32 percent of the charities that saw a drop.
Figure 7: Among public charities reporting a decline in contributions, the percentage reporting fewer gifts from individuals or smaller gifts from individuals, comparing the first nine months of 2009 and 2010, grouped by organizations’ annual expenditures
Data: Nonprofit Research Collaborative survey, November 2010
73%
64%66%
72%75%
63%
<$5 mil $5 to $19.99 mil $20+ mil
Fewer Gifts from Individuals
Smaller Gifts from Individuals
10
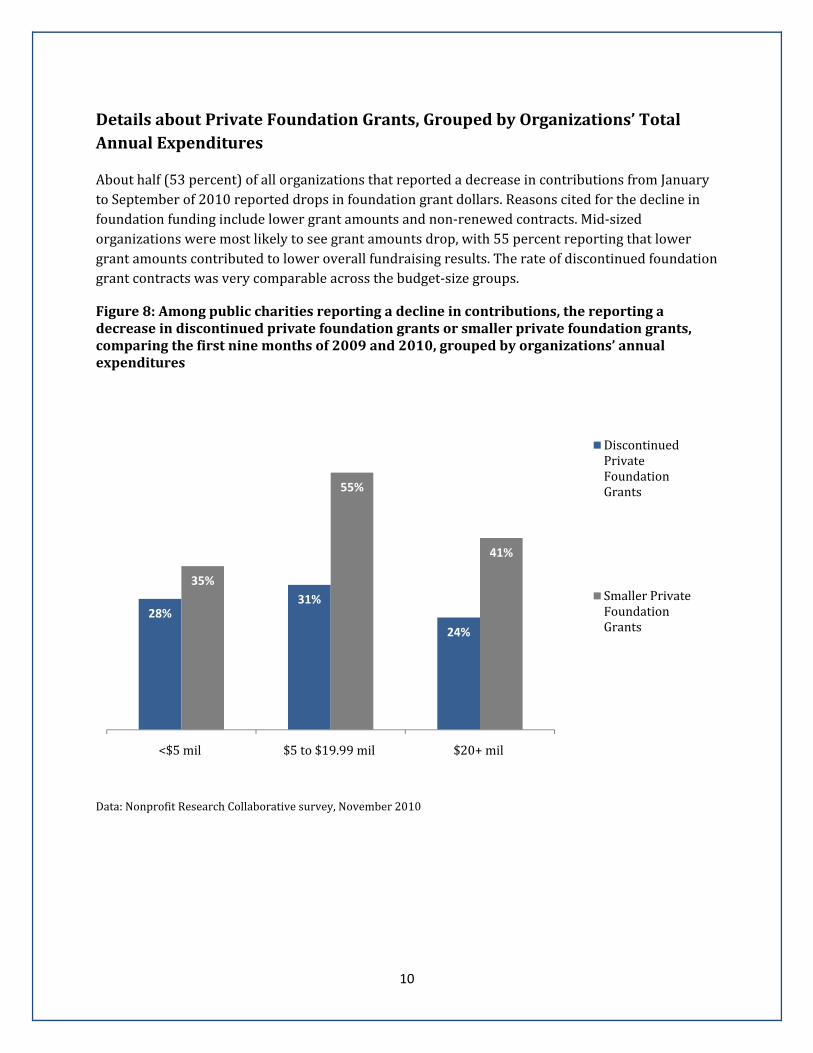
Details about Private Foundation Grants, Grouped by Organizations’ Total Annual Expenditures
About half (53 percent) of all organizations that reported a decrease in contributions from January to September of 2010 reported drops in foundation grant dollars. Reasons cited for the decline in foundation funding include lower grant amounts and non‐renewed contracts. Mid‐sized organizations were most likely to see grant amounts drop, with 55 percent reporting that lower grant amounts contributed to lower overall fundraising results. The rate of discontinued foundation grant contracts was very comparable across the budget‐size groups.
Figure 8: Among public charities reporting a decline in contributions, the reporting a decrease in discontinued private foundation grants or smaller private foundation grants, comparing the first nine months of 2009 and 2010, grouped by organizations’ annual expenditures
Data: Nonprofit Research Collaborative survey, November 2010
28%31%
24%
35%
55%
41%
<$5 mil $5 to $19.99 mil $20+ mil
Discontinued Private Foundation Grants
Smaller Private Foundation Grants
11
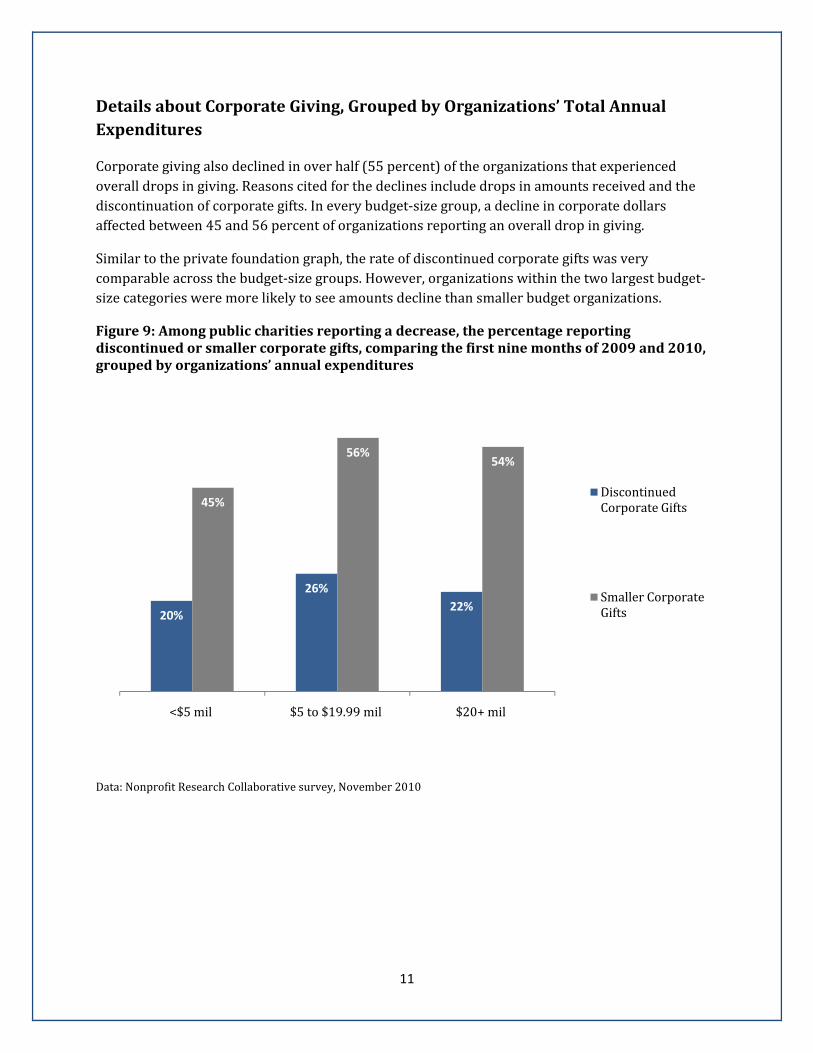
Details about Corporate Giving, Grouped by Organizations’ Total Annual Expenditures
Corporate giving also declined in over half (55 percent) of the organizations that experienced overall drops in giving. Reasons cited for the declines include drops in amounts received and the discontinuation of corporate gifts. In every budget‐size group, a decline in corporate dollars affected between 45 and 56 percent of organizations reporting an overall drop in giving.
Similar to the private foundation graph, the rate of discontinued corporate gifts was very comparable across the budget‐size groups. However, organizations within the two largest budget‐size categories were more likely to see amounts decline than smaller budget organizations.
Figure 9: Among public charities reporting a decrease, the percentage reporting discontinued or smaller corporate gifts, comparing the first nine months of 2009 and 2010, grouped by organizations’ annual expenditures
Data: Nonprofit Research Collaborative survey, November 2010
20%
26%
22%
45%
56%54%
<$5 mil $5 to $19.99 mil $20+ mil
Discontinued Corporate Gifts
Smaller Corporate Gifts
12
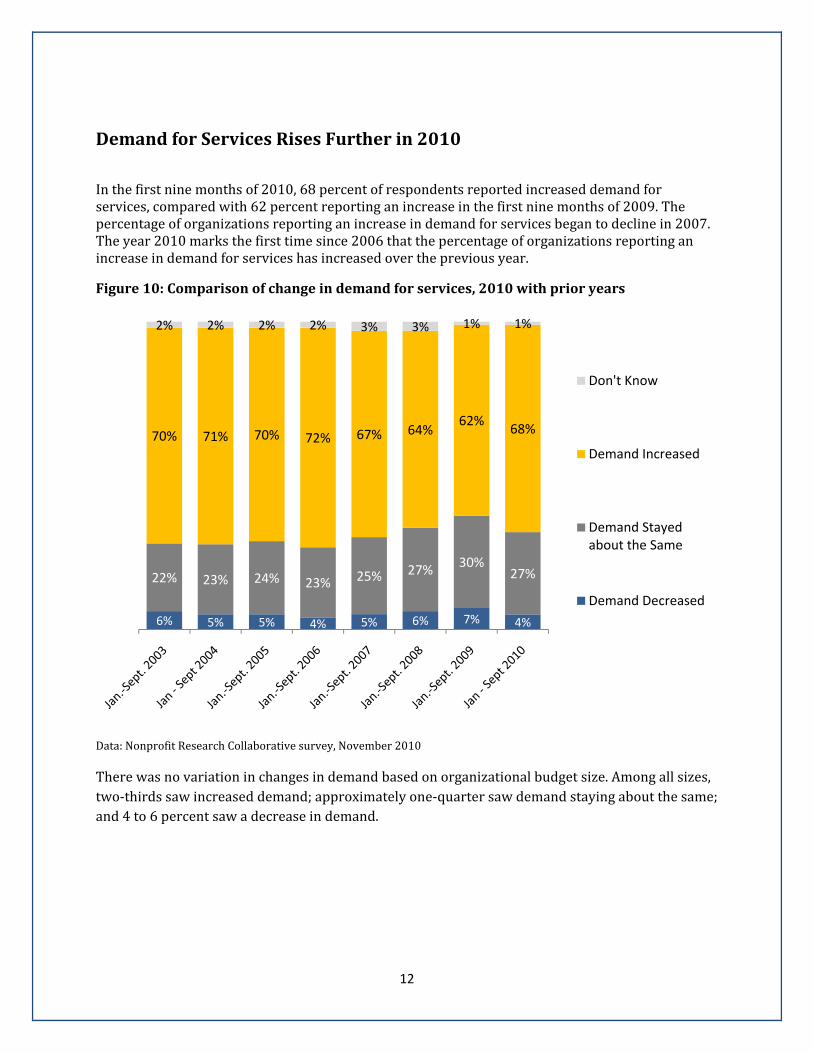
Demand for Services Rises Further in 2010
In the first nine months of 2010, 68 percent of respondents reported increased demand for services, compared with 62 percent reporting an increase in the first nine months of 2009. The percentage of organizations reporting an increase in demand for services began to decline in 2007. The year 2010 marks the first time since 2006 that the percentage of organizations reporting an increase in demand for services has increased over the previous year.
Figure 10: Comparison of change in demand for services, 2010 with prior years
Data: Nonprofit Research Collaborative survey, November 2010
There was no variation in changes in demand based on organizational budget size. Among all sizes, two‐thirds saw increased demand; approximately one‐quarter saw demand staying about the same; and 4 to 6 percent saw a decrease in demand.
6% 5% 5% 4% 5% 6% 7% 4%
22% 23% 24% 23% 25% 27%30%
27%
70% 71% 70% 72% 67% 64%62%
68%
2% 2% 2% 2% 3% 3% 1% 1%
Don't Know
Demand Increased
Demand Stayed about the Same
Demand Decreased
13
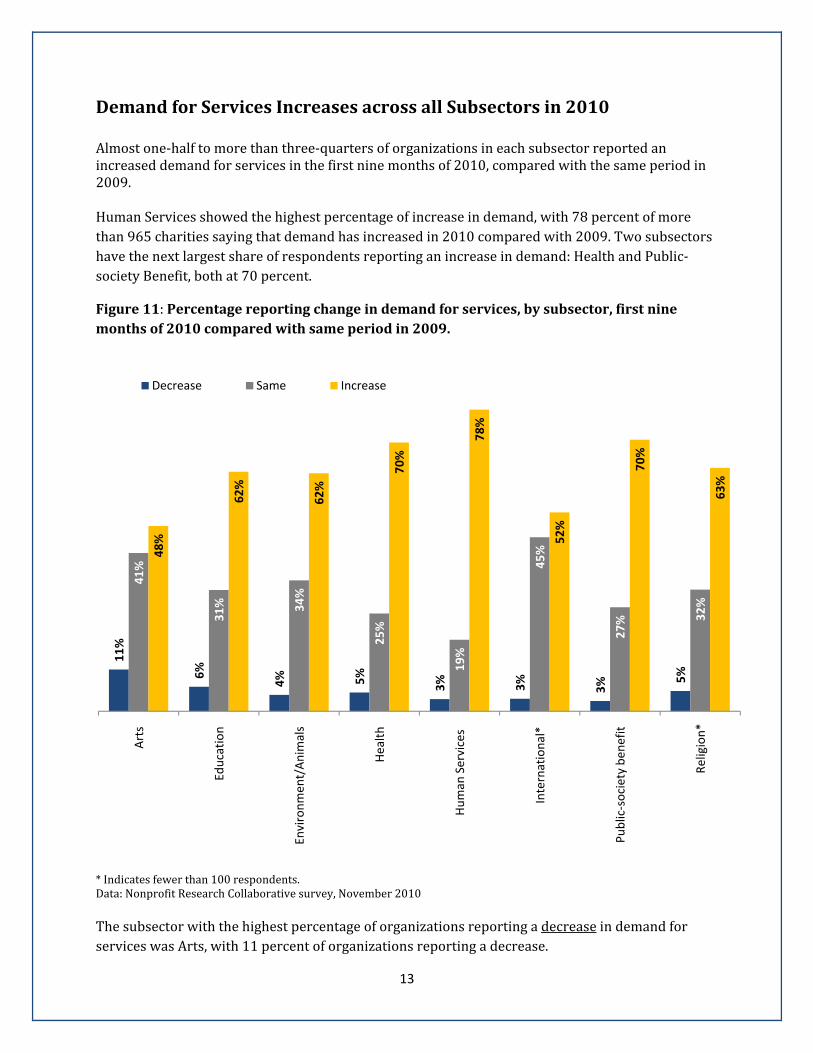
Demand for Services Increases across all Subsectors in 2010 Almost one‐half to more than three‐quarters of organizations in each subsector reported an increased demand for services in the first nine months of 2010, compared with the same period in 2009. Human Services showed the highest percentage of increase in demand, with 78 percent of more than 965 charities saying that demand has increased in 2010 compared with 2009. Two subsectors have the next largest share of respondents reporting an increase in demand: Health and Public‐society Benefit, both at 70 percent.
Figure 11: Percentage reporting change in demand for services, by subsector, first nine months of 2010 compared with same period in 2009.
* Indicates fewer than 100 respondents. Data: Nonprofit Research Collaborative survey, November 2010 The subsector with the highest percentage of organizations reporting a decrease in demand for services was Arts, with 11 percent of organizations reporting a decrease.
11%
6%
4% 5%
3% 3%
3% 5%
41%
31% 34%
25%
19%
45%
27% 32%
48%
62%
62%
70%
78%
52%
70%
63%
Arts
Education
Environmen
t/Anim
als
Health
Human
Services
International*
Public‐society ben
efit
Religion*
Decrease Same Increase
14
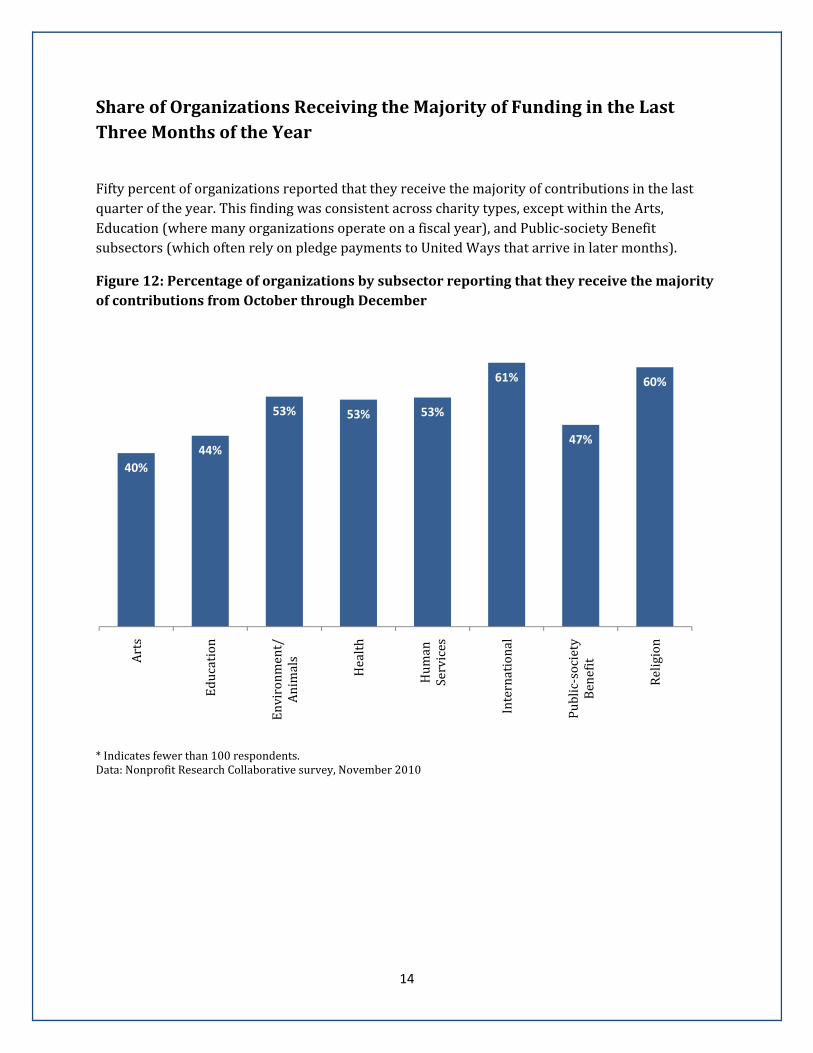
Share of Organizations Receiving the Majority of Funding in the Last Three Months of the Year
Fifty percent of organizations reported that they receive the majority of contributions in the last quarter of the year. This finding was consistent across charity types, except within the Arts, Education (where many organizations operate on a fiscal year), and Public‐society Benefit subsectors (which often rely on pledge payments to United Ways that arrive in later months).
Figure 12: Percentage of organizations by subsector reporting that they receive the majority of contributions from October through December
* Indicates fewer than 100 respondents. Data: Nonprofit Research Collaborative survey, November 2010
40%
44%
53% 53% 53%
61%
47%
60%
Arts
Education
Environm
ent/
Animals
Health
Hum
an
Services
International
Public‐society
Benefit
Religion
15
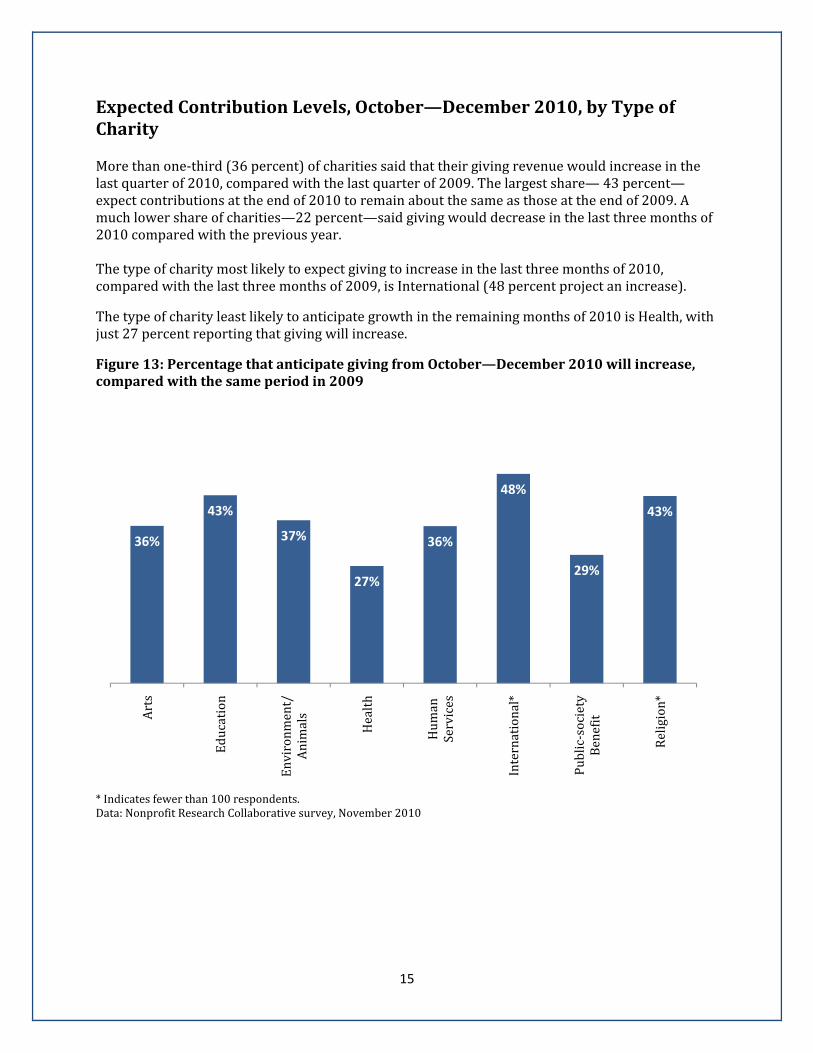
Expected Contribution Levels, October—December 2010, by Type of Charity More than one‐third (36 percent) of charities said that their giving revenue would increase in the last quarter of 2010, compared with the last quarter of 2009. The largest share— 43 percent—expect contributions at the end of 2010 to remain about the same as those at the end of 2009. A much lower share of charities—22 percent—said giving would decrease in the last three months of 2010 compared with the previous year. The type of charity most likely to expect giving to increase in the last three months of 2010, compared with the last three months of 2009, is International (48 percent project an increase).
The type of charity least likely to anticipate growth in the remaining months of 2010 is Health, with just 27 percent reporting that giving will increase.
Figure 13: Percentage that anticipate giving from October—December 2010 will increase, compared with the same period in 2009
* Indicates fewer than 100 respondents. Data: Nonprofit Research Collaborative survey, November 2010
36%
43%
37%
27%
36%
48%
29%
43%
Arts
Education
Environm
ent/
Animals
Health
Hum
anServices
International*
Public‐society
Benefit
Religion*
16
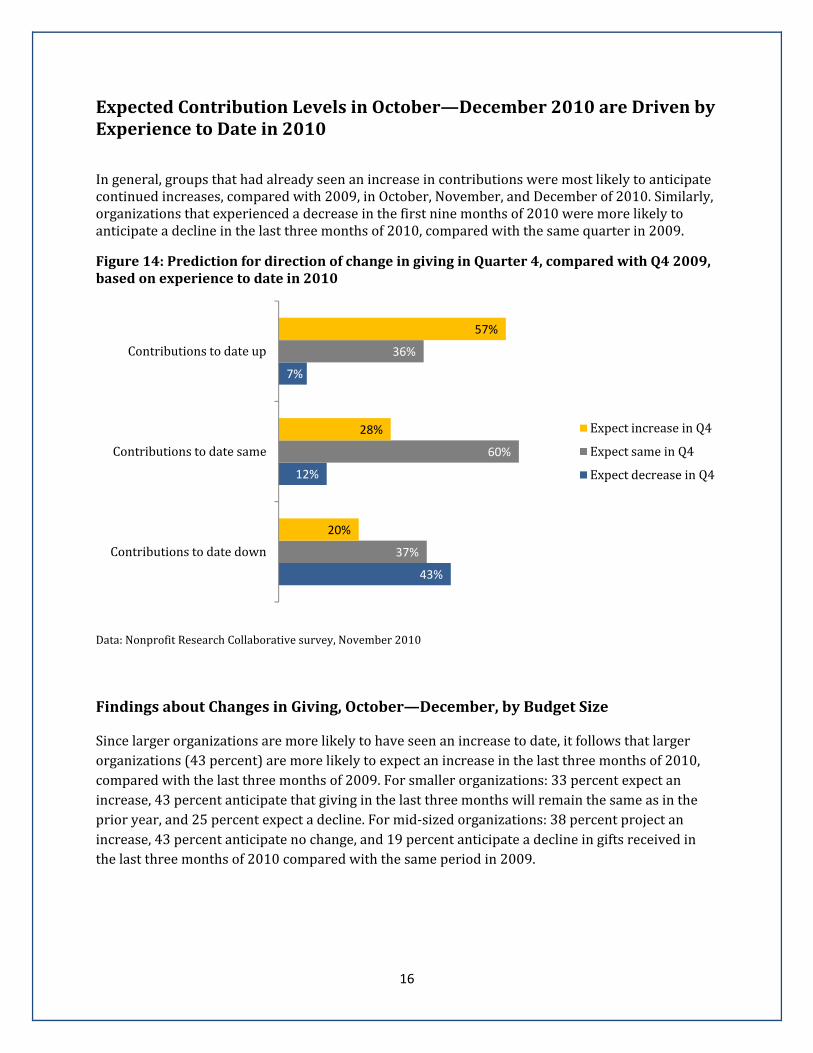
Expected Contribution Levels in October—December 2010 are Driven by Experience to Date in 2010
In general, groups that had already seen an increase in contributions were most likely to anticipate continued increases, compared with 2009, in October, November, and December of 2010. Similarly, organizations that experienced a decrease in the first nine months of 2010 were more likely to anticipate a decline in the last three months of 2010, compared with the same quarter in 2009.
Figure 14: Prediction for direction of change in giving in Quarter 4, compared with Q4 2009, based on experience to date in 2010
Data: Nonprofit Research Collaborative survey, November 2010
Findings about Changes in Giving, October—December, by Budget Size
Since larger organizations are more likely to have seen an increase to date, it follows that larger organizations (43 percent) are more likely to expect an increase in the last three months of 2010, compared with the last three months of 2009. For smaller organizations: 33 percent expect an increase, 43 percent anticipate that giving in the last three months will remain the same as in the prior year, and 25 percent expect a decline. For mid‐sized organizations: 38 percent project an increase, 43 percent anticipate no change, and 19 percent anticipate a decline in gifts received in the last three months of 2010 compared with the same period in 2009.
43%
12%
7%
37%
60%
36%
20%
28%
57%
Contributions to date down
Contributions to date same
Contributions to date up
Expect increase in Q4
Expect same in Q4
Expect decrease in Q4
17
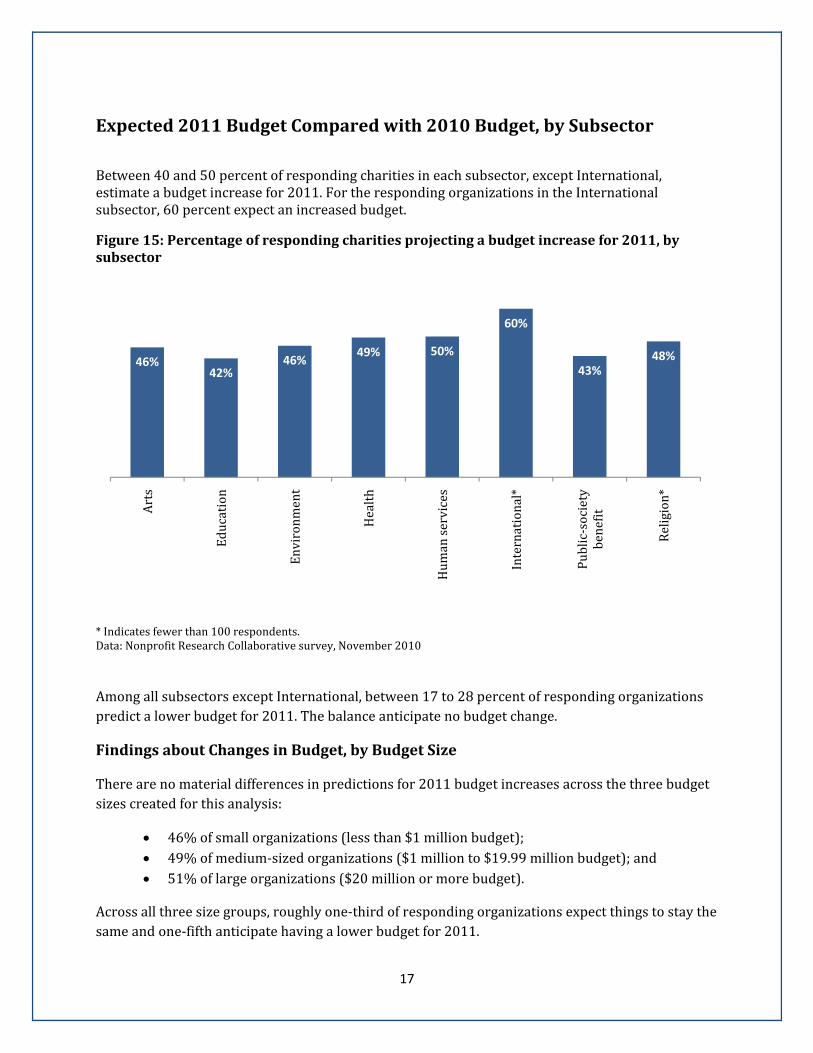
Expected 2011 Budget Compared with 2010 Budget, by Subsector
Between 40 and 50 percent of responding charities in each subsector, except International, estimate a budget increase for 2011. For the responding organizations in the International subsector, 60 percent expect an increased budget.
Figure 15: Percentage of responding charities projecting a budget increase for 2011, by subsector
* Indicates fewer than 100 respondents. Data: Nonprofit Research Collaborative survey, November 2010
Among all subsectors except International, between 17 to 28 percent of responding organizations predict a lower budget for 2011. The balance anticipate no budget change.
Findings about Changes in Budget, by Budget Size
There are no material differences in predictions for 2011 budget increases across the three budget sizes created for this analysis:
46% of small organizations (less than $1 million budget); 49% of medium‐sized organizations ($1 million to $19.99 million budget); and 51% of large organizations ($20 million or more budget).
Across all three size groups, roughly one‐third of responding organizations expect things to stay the same and one‐fifth anticipate having a lower budget for 2011.
46%42%
46%49% 50%
60%
43%48%
Arts
Education
Environm
ent
Health
Hum
an services
International*
Public‐society
benefit
Religion*
18
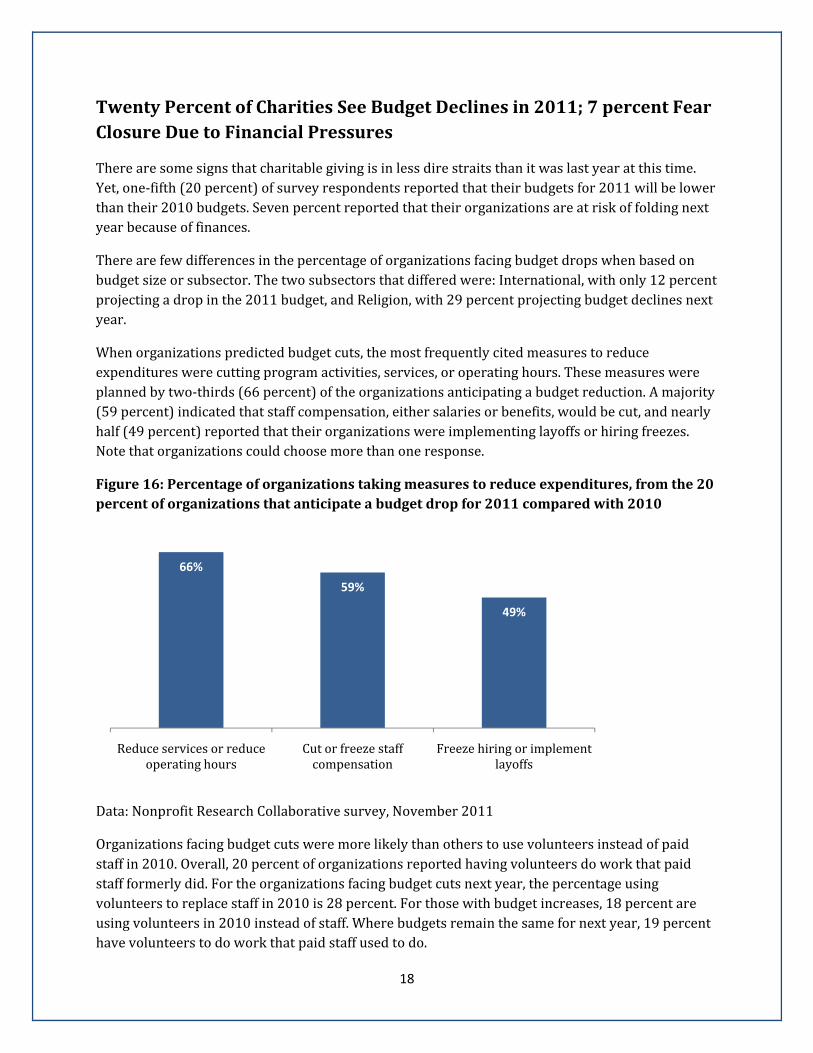
Twenty Percent of Charities See Budget Declines in 2011; 7 percent Fear Closure Due to Financial Pressures
There are some signs that charitable giving is in less dire straits than it was last year at this time. Yet, one‐fifth (20 percent) of survey respondents reported that their budgets for 2011 will be lower than their 2010 budgets. Seven percent reported that their organizations are at risk of folding next year because of finances.
There are few differences in the percentage of organizations facing budget drops when based on budget size or subsector. The two subsectors that differed were: International, with only 12 percent projecting a drop in the 2011 budget, and Religion, with 29 percent projecting budget declines next year.
When organizations predicted budget cuts, the most frequently cited measures to reduce expenditures were cutting program activities, services, or operating hours. These measures were planned by two‐thirds (66 percent) of the organizations anticipating a budget reduction. A majority (59 percent) indicated that staff compensation, either salaries or benefits, would be cut, and nearly half (49 percent) reported that their organizations were implementing layoffs or hiring freezes. Note that organizations could choose more than one response.
Figure 16: Percentage of organizations taking measures to reduce expenditures, from the 20 percent of organizations that anticipate a budget drop for 2011 compared with 2010
Data: Nonprofit Research Collaborative survey, November 2011
Organizations facing budget cuts were more likely than others to use volunteers instead of paid staff in 2010. Overall, 20 percent of organizations reported having volunteers do work that paid staff formerly did. For the organizations facing budget cuts next year, the percentage using volunteers to replace staff in 2010 is 28 percent. For those with budget increases, 18 percent are using volunteers in 2010 instead of staff. Where budgets remain the same for next year, 19 percent have volunteers to do work that paid staff used to do.
66%
59%
49%
Reduce services or reduce operating hours
Cut or freeze staff compensation
Freeze hiring or implement layoffs
19
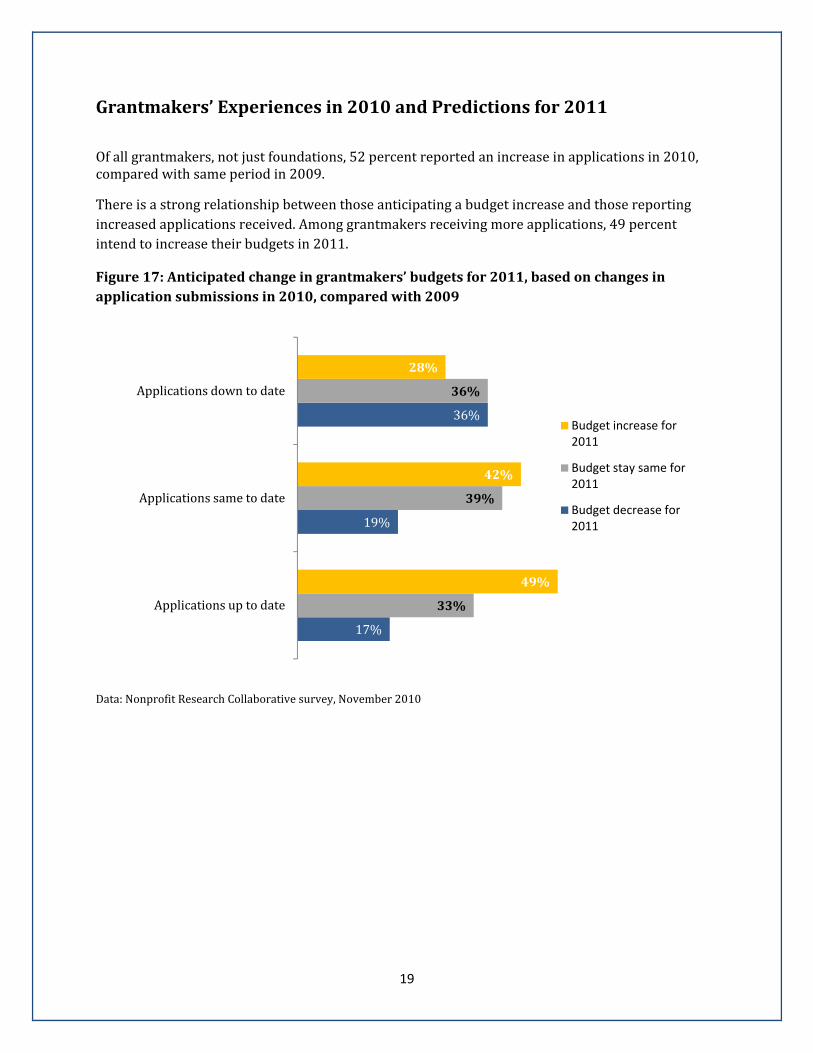
Grantmakers’ Experiences in 2010 and Predictions for 2011
Of all grantmakers, not just foundations, 52 percent reported an increase in applications in 2010, compared with same period in 2009.
There is a strong relationship between those anticipating a budget increase and those reporting increased applications received. Among grantmakers receiving more applications, 49 percent intend to increase their budgets in 2011.
Figure 17: Anticipated change in grantmakers’ budgets for 2011, based on changes in application submissions in 2010, compared with 2009
Data: Nonprofit Research Collaborative survey, November 2010
17%
19%
36%
33%
39%
36%
49%
42%
28%
Applications up to date
Applications same to date
Applications down to date
Budget increase for 2011
Budget stay same for 2011
Budget decrease for 2011
20
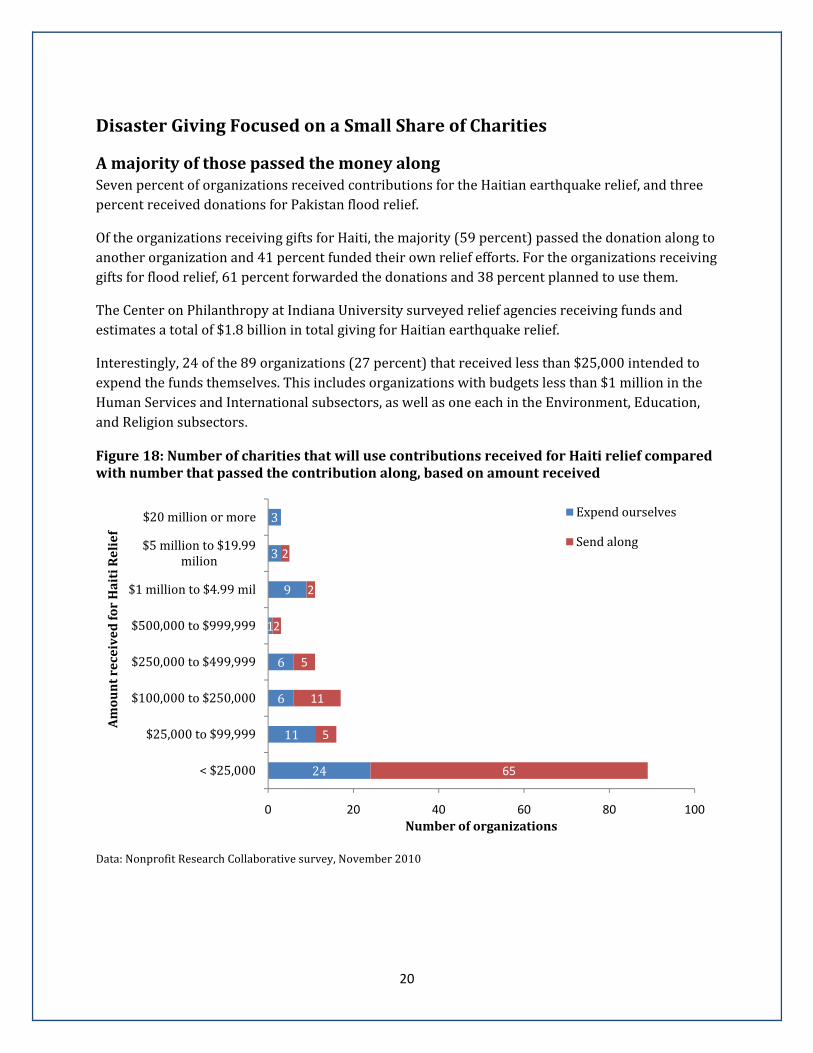
Disaster Giving Focused on a Small Share of Charities
A majority of those passed the money along Seven percent of organizations received contributions for the Haitian earthquake relief, and three percent received donations for Pakistan flood relief.
Of the organizations receiving gifts for Haiti, the majority (59 percent) passed the donation along to another organization and 41 percent funded their own relief efforts. For the organizations receiving gifts for flood relief, 61 percent forwarded the donations and 38 percent planned to use them.
The Center on Philanthropy at Indiana University surveyed relief agencies receiving funds and estimates a total of $1.8 billion in total giving for Haitian earthquake relief.
Interestingly, 24 of the 89 organizations (27 percent) that received less than $25,000 intended to expend the funds themselves. This includes organizations with budgets less than $1 million in the Human Services and International subsectors, as well as one each in the Environment, Education, and Religion subsectors.
Figure 18: Number of charities that will use contributions received for Haiti relief compared with number that passed the contribution along, based on amount received
Data: Nonprofit Research Collaborative survey, November 2010
24
11
6
6
1
9
3
3
65
5
11
5
2
2
2
0 20 40 60 80 100
< $25,000
$25,000 to $99,999
$100,000 to $250,000
$250,000 to $499,999
$500,000 to $999,999
$1 million to $4.99 mil
$5 million to $19.99 milion
$20 million or more
Number of organizations
Amount received for Haiti Relief
Expend ourselves
Send along
21
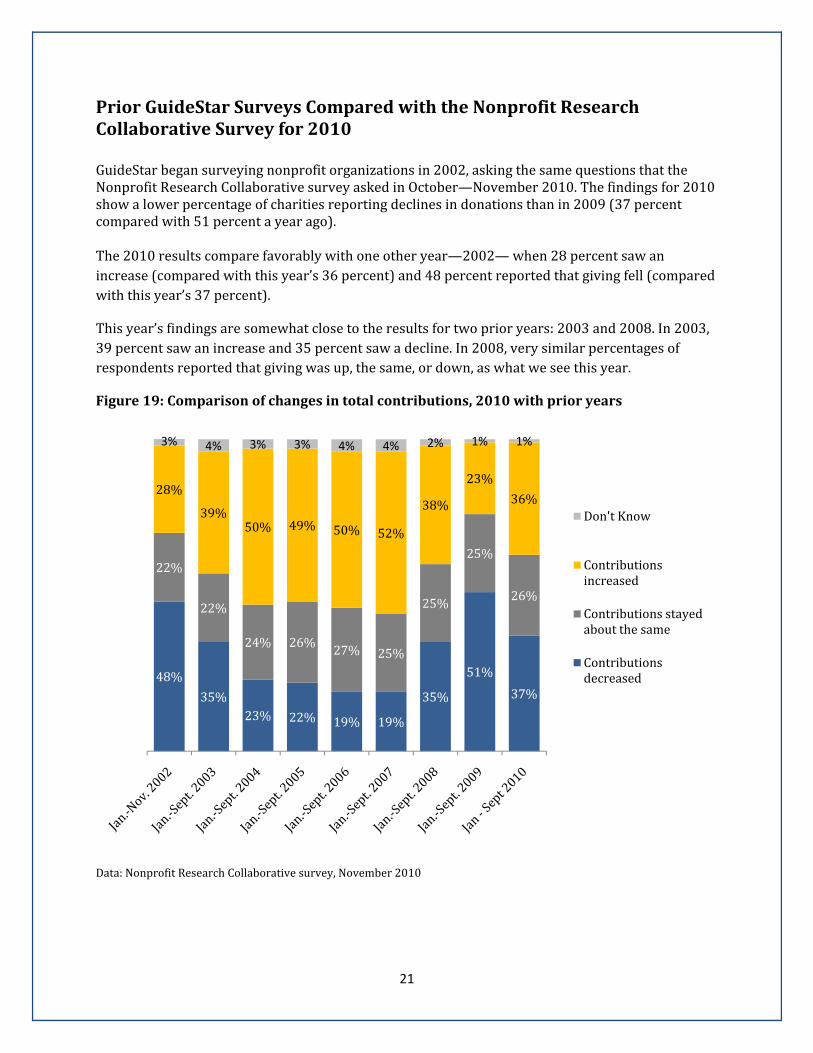
Prior GuideStar Surveys Compared with the Nonprofit Research Collaborative Survey for 2010 GuideStar began surveying nonprofit organizations in 2002, asking the same questions that the Nonprofit Research Collaborative survey asked in October—November 2010. The findings for 2010 show a lower percentage of charities reporting declines in donations than in 2009 (37 percent compared with 51 percent a year ago). The 2010 results compare favorably with one other year—2002— when 28 percent saw an increase (compared with this year’s 36 percent) and 48 percent reported that giving fell (compared with this year’s 37 percent).
This year’s findings are somewhat close to the results for two prior years: 2003 and 2008. In 2003, 39 percent saw an increase and 35 percent saw a decline. In 2008, very similar percentages of respondents reported that giving was up, the same, or down, as what we see this year.
Figure 19: Comparison of changes in total contributions, 2010 with prior years
Data: Nonprofit Research Collaborative survey, November 2010
48%
35%23% 22% 19% 19%
35%
51%
37%
22%
22%
24% 26%27% 25%
25%
25%
26%
28%
39%50% 49% 50% 52%
38%
23%
36%
3% 4% 3% 3% 4% 4% 2% 1% 1%
Don't Know
Contributions increased
Contributions stayed about the same
Contributions decreased
22
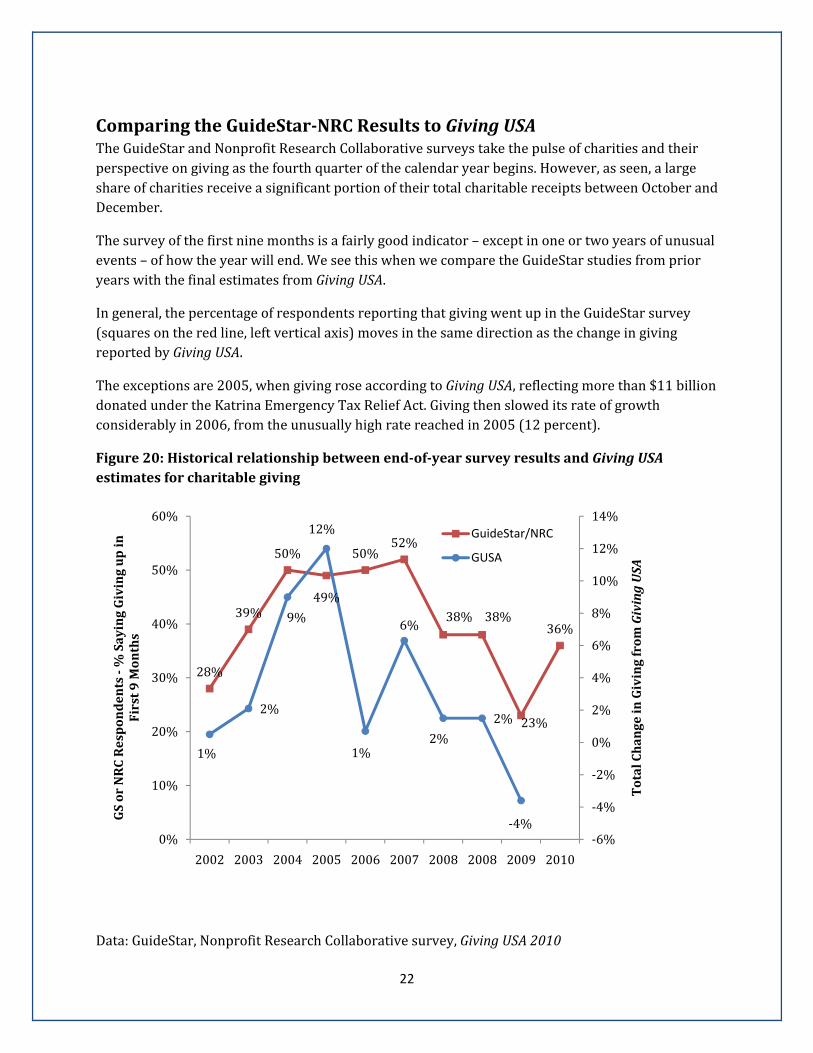
Comparing the GuideStarNRC Results to Giving USA The GuideStar and Nonprofit Research Collaborative surveys take the pulse of charities and their perspective on giving as the fourth quarter of the calendar year begins. However, as seen, a large share of charities receive a significant portion of their total charitable receipts between October and December.
The survey of the first nine months is a fairly good indicator – except in one or two years of unusual events – of how the year will end. We see this when we compare the GuideStar studies from prior years with the final estimates from Giving USA.
In general, the percentage of respondents reporting that giving went up in the GuideStar survey (squares on the red line, left vertical axis) moves in the same direction as the change in giving reported by Giving USA.
The exceptions are 2005, when giving rose according to Giving USA, reflecting more than $11 billion donated under the Katrina Emergency Tax Relief Act. Giving then slowed its rate of growth considerably in 2006, from the unusually high rate reached in 2005 (12 percent).
Figure 20: Historical relationship between endofyear survey results and Giving USA estimates for charitable giving
Data: GuideStar, Nonprofit Research Collaborative survey, Giving USA 2010
28%
39%
50%
49%
50%52%
38% 38%
23%
36%
1%
2%
9%
12%
1%
6%
2%
2%
‐4%‐6%
‐4%
‐2%
0%
2%
4%
6%
8%
10%
12%
14%
0%
10%
20%
30%
40%
50%
60%
2002 2003 2004 2005 2006 2007 2008 2008 2009 2010
Total Change in Giving from
Giving USA
GS or NRC Respondents % Saying Giving up in
First 9 Months
GuideStar/NRC
GUSA
23
RelationshipbetweenthisSurveyandOtherStudies
Blackbaud,aproviderofsoftwareandservicesfornonprofits,issuesTheBlackbaudIndexonthe15thofeachmonth.TheIndexcomparesthemostrecentthreemonthsofrevenuetothesameperiodthepreviousyearandisthemostcomprehensiveandtimelysourceofcharitablegivingavailable.TheNovember15threleaseshowsthatoverallgivingforthethreemonthsendinginSeptember2010isup4.3percentfromtheprioryear,withonlinegivingup19.5percent.LiketheNFRCsurvey,theIndexreportsthattherecoveryisunevenacrossorganizations,withsomesectorsandsizesoforganizationsfaringbetterthanothers.Blackbaudissuesamonthlyindexofcharitablegivingthatcomparesreceiptsatmorethan1,300organizationscomparedtothesamemonthlastyear.ThatindexshowsstronggrowthincharitablerevenueforallrespondingorganizationsinMarchthroughMayof2010andslowgrowthordeclinesinthemonthssincethen.TheseresultsfitthepatternfoundintheNFRCsurvey,inwhichsomeorganizationsareseeingmoregivinginthefirstninemonthsof2010andaboutthesamenumberareseeingdeclines.Sincelate2008,theFoundationCenterhasreleasednumerousanalysesoftheimpactoftheeconomiccrisisonfoundations.ResultsintheNFRCsurveyaregenerallyconsistentwithgivingtrendsandestimatesreportedinthisongoingseriesofresearchreports,whichcanbeaccessedathttp://foundationcenter.org/focus/economy/.Thissiteincludesaninteractivemapdetailing$440millionineconomiccrisisresponsefunding.
TheNonprofitResearchCollaborative
SixorganizationshaveformedtheNonprofitResearchCollaborative.Eachoftheseentitieshas,ataminimum,adecadeofdirectexperiencecollectinginformationfromnonprofitsconcerningcharitablereceipts,fundraisingpractices,and/orgrantmakingactivities.
Thecollaboratingpartnerstodateare: AssociationofFundraisingProfessionals,whichprovideseducation,ethicalguidanceand
otherprograms,includingavarietyofsurveysandreports,tocharitablefundraisersaroundtheworld;
Blackbaud,Inc.,whichpublishesTheBlackbaudIndexandpreparesareportabouttheStateoftheNonprofitIndustry;
TheCenteronPhilanthropyatIndianaUniversity,whichconductedthePhilanthropicGivingIndexfrom1998through2009;
TheFoundationCenter,whichprovidesservicestononprofitorganizationsanddocumentstrendsinfoundationgivingworldwide;
GuideStarUSA,Inc.,whichhasissuedannualreportsabouttheimpactoftheeconomyonthenonprofitsectorsince2002;and
TheNationalCenterforCharitableStatisticsattheUrbanInstitute,whichtracksthefinancesandactivitiesofnonprofitorganizationsandpreparestheNonprofitAlmanacandotherpublicationsandresources.
Thecollaborationstreamlinestheprocessforcharities,whichwillreceivefewersurveyswillrespondtoquestionsonceinsteadofrepeatedly.Surveyparticipantswillformapanelovertime,allowingfortrendcomparisonsamongthesameorganizations.Thisapproachprovidesmoreusefulbenchmarkinginformationthanrepeatedcross‐sectionalstudies.
24
Methodology
The first Nonprofit Research Collaborative fundraising survey was fielded between October 19 and November 3, 2010. This study was fielded online through a site constructed by the National Center for Charitable Statistics (NCCS). Invitations to participate in the survey were sent by the six partner organizations to their constituents. It received 2,519 responses. Of those, 2,489 were eligible participants from nonprofit charities, foundations, or grantmakers. A total of 2,349 charities completed the questions, as did 163 foundations. The analysis for grantmakers includes responses from charities that make grants, but are not foundations. These include United Ways, Jewish federations, congregations, and a number of other types of organizations. There were responses from 386 grantmakers. The respondents form a convenience sample.1 There is no margin of error or measure of statistical significance using this sampling technique, as it is not a random sample of the population studied. However, given the long‐running nature of GuideStar’s economic surveys and the strong relationship between findings in those studies in prior years and actual results once tax data about charitable giving are available, the method employed here is a useful barometer of what charities experience and what total giving will look like.
1 In statistics, a convenience sample occurs when the study invites participants who are not drawn from a random sample that forms an accurate representation of some larger group or population. This study was sent to organizations that had registered to receive emails from the sponsors. No effort was made to form a random sample of nonprofit organizations.
25
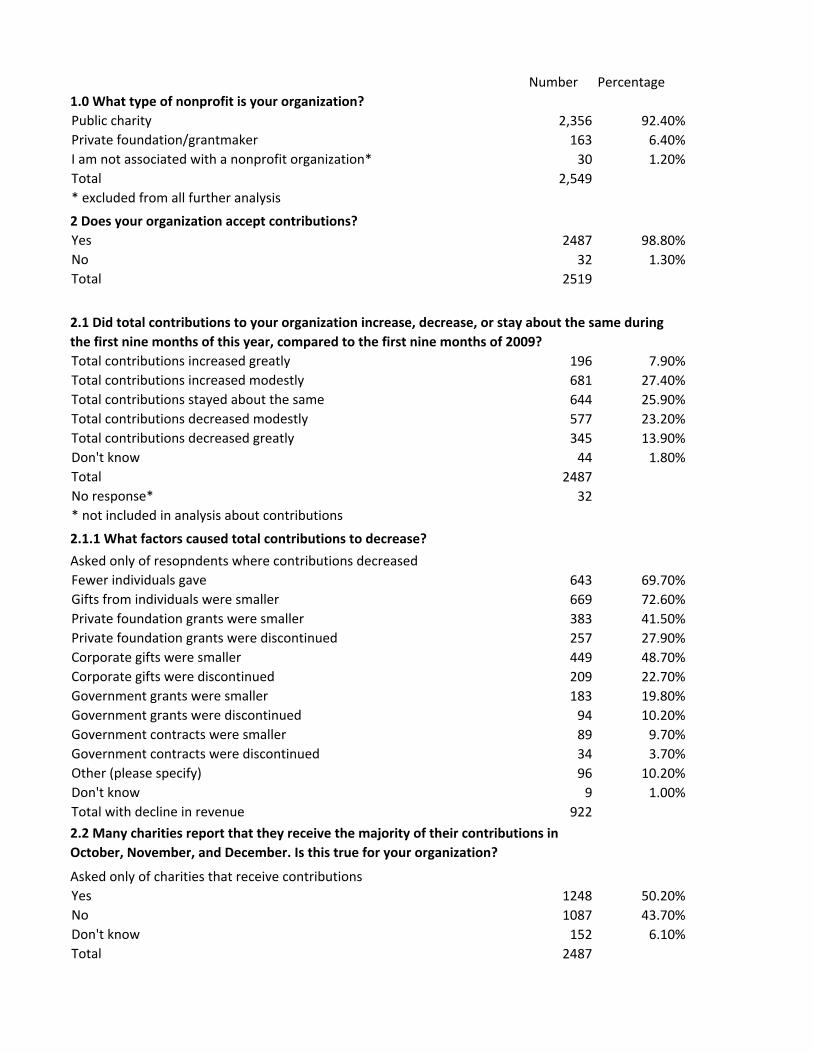
Appendix A: The Nonprofit Fundraising Survey November 2010
Questions and the number and percentage of responses for each.
Number Percentage
Public charity 2,356 92.40%
Private foundation/grantmaker 163 6.40%
I am not associated with a nonprofit organization* 30 1.20%
Total 2,549
* excluded from all further analysis
Yes 2487 98.80%
No 32 1.30%
Total 2519
Total contributions increased greatly 196 7.90%
Total contributions increased modestly 681 27.40%
Total contributions stayed about the same 644 25.90%
Total contributions decreased modestly 577 23.20%
Total contributions decreased greatly 345 13.90%
Don't know 44 1.80%
Total 2487
No response* 32
* not included in analysis about contributions
Fewer individuals gave 643 69.70%
Gifts from individuals were smaller 669 72.60%
Private foundation grants were smaller 383 41.50%
Private foundation grants were discontinued 257 27.90%
Corporate gifts were smaller 449 48.70%
Corporate gifts were discontinued 209 22.70%
Government grants were smaller 183 19.80%
Government grants were discontinued 94 10.20%
Government contracts were smaller 89 9.70%
Government contracts were discontinued 34 3.70%
Other (please specify) 96 10.20%
Don't know 9 1.00%
Total with decline in revenue 922
Yes 1248 50.20%
No 1087 43.70%
Don't know 152 6.10%
Total 2487
Asked only of charities that receive contributions
2.1.1 What factors caused total contributions to decrease?
2.1 Did total contributions to your organization increase, decrease, or stay about the same during
the first nine months of this year, compared to the first nine months of 2009?
1.0 What type of nonprofit is your organization?
2 Does your organization accept contributions?
2.2 Many charities report that they receive the majority of their contributions in
October, November, and December. Is this true for your organization?
Asked only of resopndents where contributions decreased
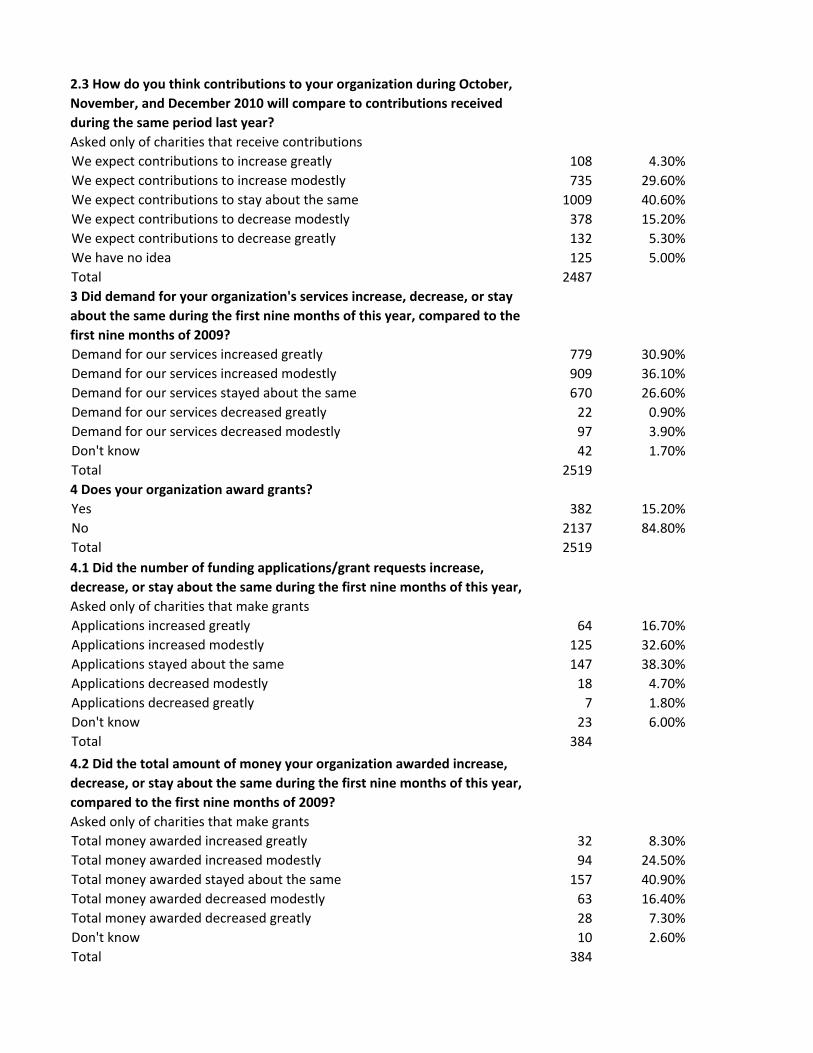
We expect contributions to increase greatly 108 4.30%
We expect contributions to increase modestly 735 29.60%
We expect contributions to stay about the same 1009 40.60%
We expect contributions to decrease modestly 378 15.20%
We expect contributions to decrease greatly 132 5.30%
We have no idea 125 5.00%
Total 2487
Demand for our services increased greatly 779 30.90%
Demand for our services increased modestly 909 36.10%
Demand for our services stayed about the same 670 26.60%
Demand for our services decreased greatly 22 0.90%
Demand for our services decreased modestly 97 3.90%
Don't know 42 1.70%
Total 2519
Yes 382 15.20%
No 2137 84.80%
Total 2519
Applications increased greatly 64 16.70%
Applications increased modestly 125 32.60%
Applications stayed about the same 147 38.30%
Applications decreased modestly 18 4.70%
Applications decreased greatly 7 1.80%
Don't know 23 6.00%
Total 384
Total money awarded increased greatly 32 8.30%
Total money awarded increased modestly 94 24.50%
Total money awarded stayed about the same 157 40.90%
Total money awarded decreased modestly 63 16.40%
Total money awarded decreased greatly 28 7.30%
Don't know 10 2.60%
Total 384
Asked only of charities that make grants
4.2 Did the total amount of money your organization awarded increase,
decrease, or stay about the same during the first nine months of this year,
compared to the first nine months of 2009?
Asked only of charities that make grants
2.3 How do you think contributions to your organization during October,
November, and December 2010 will compare to contributions received
during the same period last year?
Asked only of charities that receive contributions
3 Did demand for your organization's services increase, decrease, or stay
about the same during the first nine months of this year, compared to the
first nine months of 2009?
4 Does your organization award grants?
4.1 Did the number of funding applications/grant requests increase,
decrease, or stay about the same during the first nine months of this year,
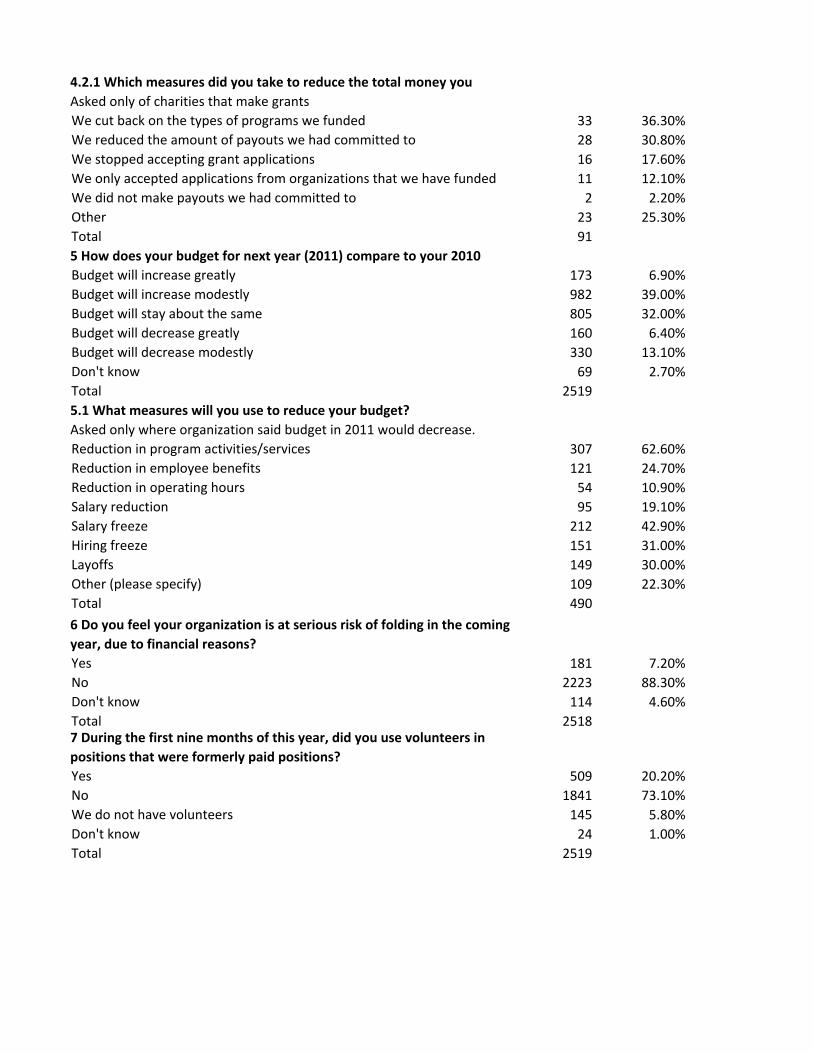
We cut back on the types of programs we funded 33 36.30%
We reduced the amount of payouts we had committed to 28 30.80%
We stopped accepting grant applications 16 17.60%
We only accepted applications from organizations that we have funded 11 12.10%
We did not make payouts we had committed to 2 2.20%
Other 23 25.30%
Total 91
Budget will increase greatly 173 6.90%
Budget will increase modestly 982 39.00%
Budget will stay about the same 805 32.00%
Budget will decrease greatly 160 6.40%
Budget will decrease modestly 330 13.10%
Don't know 69 2.70%
Total 2519
Reduction in program activities/services 307 62.60%
Reduction in employee benefits 121 24.70%
Reduction in operating hours 54 10.90%
Salary reduction 95 19.10%
Salary freeze 212 42.90%
Hiring freeze 151 31.00%
Layoffs 149 30.00%
Other (please specify) 109 22.30%
Total 490
Yes 181 7.20%
No 2223 88.30%
Don't know 114 4.60%
Total 2518
Yes 509 20.20%
No 1841 73.10%
We do not have volunteers 145 5.80%
Don't know 24 1.00%
Total 2519
5.1 What measures will you use to reduce your budget?
Asked only where organization said budget in 2011 would decrease.
6 Do you feel your organization is at serious risk of folding in the coming
year, due to financial reasons?
7 During the first nine months of this year, did you use volunteers in
positions that were formerly paid positions?
4.2.1 Which measures did you take to reduce the total money you
Asked only of charities that make grants
5 How does your budget for next year (2011) compare to your 2010
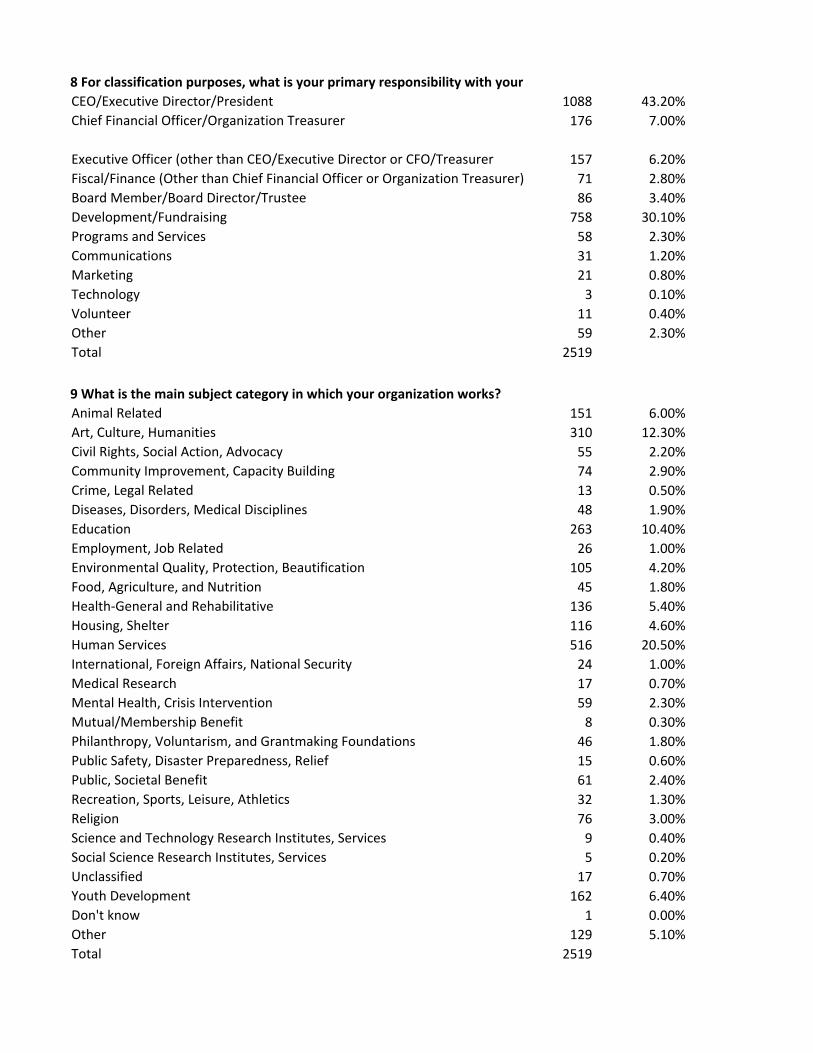
CEO/Executive Director/President 1088 43.20%
Chief Financial Officer/Organization Treasurer 176 7.00%
Executive Officer (other than CEO/Executive Director or CFO/Treasurer 157 6.20%
Fiscal/Finance (Other than Chief Financial Officer or Organization Treasurer) 71 2.80%
Board Member/Board Director/Trustee 86 3.40%
Development/Fundraising 758 30.10%
Programs and Services 58 2.30%
Communications 31 1.20%
Marketing 21 0.80%
Technology 3 0.10%
Volunteer 11 0.40%
Other 59 2.30%
Total 2519
Animal Related 151 6.00%
Art, Culture, Humanities 310 12.30%
Civil Rights, Social Action, Advocacy 55 2.20%
Community Improvement, Capacity Building 74 2.90%
Crime, Legal Related 13 0.50%
Diseases, Disorders, Medical Disciplines 48 1.90%
Education 263 10.40%
Employment, Job Related 26 1.00%
Environmental Quality, Protection, Beautification 105 4.20%
Food, Agriculture, and Nutrition 45 1.80%
Health‐General and Rehabilitative 136 5.40%
Housing, Shelter 116 4.60%
Human Services 516 20.50%
International, Foreign Affairs, National Security 24 1.00%
Medical Research 17 0.70%
Mental Health, Crisis Intervention 59 2.30%
Mutual/Membership Benefit 8 0.30%
Philanthropy, Voluntarism, and Grantmaking Foundations 46 1.80%
Public Safety, Disaster Preparedness, Relief 15 0.60%
Public, Societal Benefit 61 2.40%
Recreation, Sports, Leisure, Athletics 32 1.30%
Religion 76 3.00%
Science and Technology Research Institutes, Services 9 0.40%
Social Science Research Institutes, Services 5 0.20%
Unclassified 17 0.70%
Youth Development 162 6.40%
Don't know 1 0.00%
Other 129 5.10%
Total 2519
8 For classification purposes, what is your primary responsibility with your
9 What is the main subject category in which your organization works?
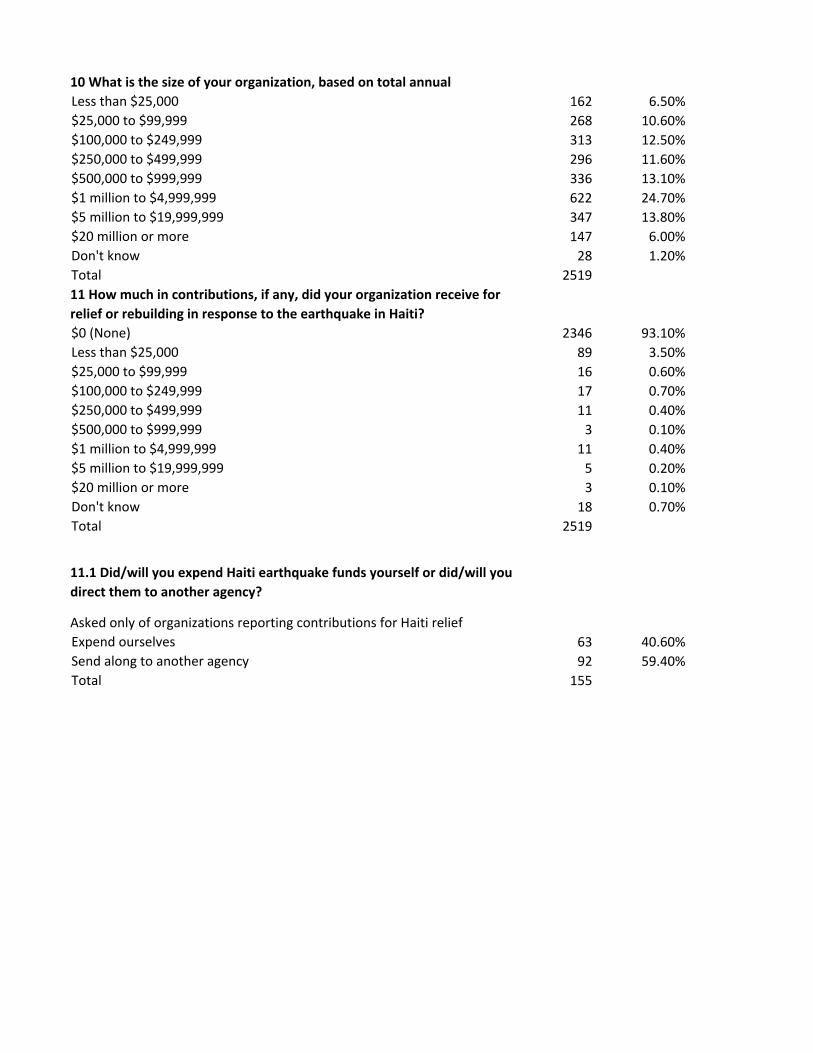
Less than $25,000 162 6.50%
$25,000 to $99,999 268 10.60%
$100,000 to $249,999 313 12.50%
$250,000 to $499,999 296 11.60%
$500,000 to $999,999 336 13.10%
$1 million to $4,999,999 622 24.70%
$5 million to $19,999,999 347 13.80%
$20 million or more 147 6.00%
Don't know 28 1.20%
Total 2519
$0 (None) 2346 93.10%
Less than $25,000 89 3.50%
$25,000 to $99,999 16 0.60%
$100,000 to $249,999 17 0.70%
$250,000 to $499,999 11 0.40%
$500,000 to $999,999 3 0.10%
$1 million to $4,999,999 11 0.40%
$5 million to $19,999,999 5 0.20%
$20 million or more 3 0.10%
Don't know 18 0.70%
Total 2519
Expend ourselves 63 40.60%
Send along to another agency 92 59.40%
Total 155
10 What is the size of your organization, based on total annual
11 How much in contributions, if any, did your organization receive for
relief or rebuilding in response to the earthquake in Haiti?
11.1 Did/will you expend Haiti earthquake funds yourself or did/will you
direct them to another agency?
Asked only of organizations reporting contributions for Haiti relief
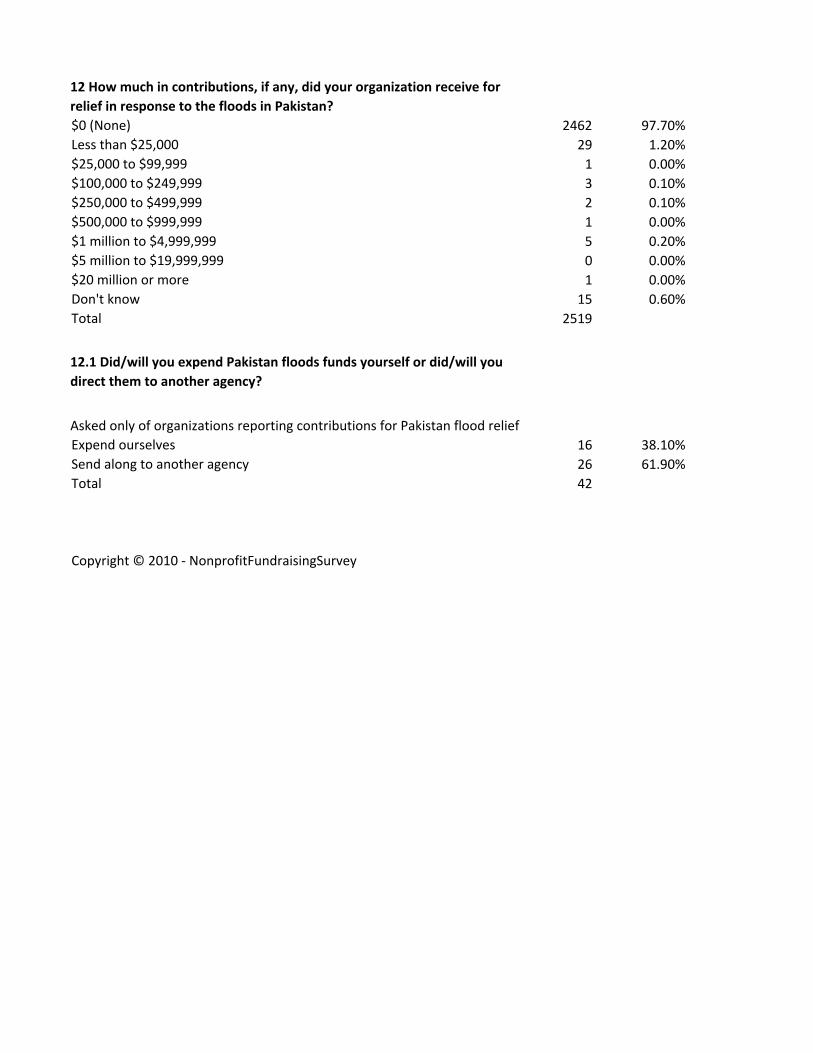
$0 (None) 2462 97.70%
Less than $25,000 29 1.20%
$25,000 to $99,999 1 0.00%
$100,000 to $249,999 3 0.10%
$250,000 to $499,999 2 0.10%
$500,000 to $999,999 1 0.00%
$1 million to $4,999,999 5 0.20%
$5 million to $19,999,999 0 0.00%
$20 million or more 1 0.00%
Don't know 15 0.60%
Total 2519
Expend ourselves 16 38.10%
Send along to another agency 26 61.90%
Total 42
Copyright © 2010 ‐ NonprofitFundraisingSurvey
Asked only of organizations reporting contributions for Pakistan flood relief
12 How much in contributions, if any, did your organization receive for
relief in response to the floods in Pakistan?
12.1 Did/will you expend Pakistan floods funds yourself or did/will you
direct them to another agency?