Embed Size (px)
Citation preview
The Nominal Share Price Puzzle
William C. Weld, Roni Michaely,Richard H. Thaler, and Shlomo Benartzi
E volution generally results in organisms that seem well-adapted to theirenvironment. However, many animals have vestigial structures that onceserved a crucial purpose but no longer do, such as the human appendix.
Many societal customs appear to be vestigial remnants from earlier generations aswell. For example, the tradition of wearing neckties began in the sixteenth centurywhen men donned linen cravats and the necktie served the sensible purpose of abib or napkin. Although silk neckties still collect stains, they no longer serve anypractical function.
The question we investigate in this paper is whether vestigial norms and customsaffect corporate decision making. Consider the following fact: The average nominalprice for a share of stock on the New York Stock exchange has remained roughlyconstant (about $35) since the Great Depression. The mechanism that has allowedshare prices to remain remarkably constant for over 70 years is stock splits. However,the existence of stock splits is merely a necessary, not a sufficient, condition for nominalprices to remain stable. In fact, stock splits could have been used to create almost any
y William C. Weld is Assistant Professor, Finance, Investment and Banking, University ofWisconsin School of Business, Madison, Wisconsin. Roni Michaely is Rudd Family Professorof Management, Professor of Finance, Johnson Graduate School of Management, CornellUniversity, Ithaca, New York, and is also Professor of Finance, Interdisciplinary Center,Herzelia, Israel. Richard H. Thaler is Ralph and Dorothy Keller Distinguished ServiceProfessor of Behavioral Science and Economics, University of Chicago Booth School ofBusiness, Chicago, Illinois, and Research Associate, National Bureau of Economic Research,Cambridge, Massachusetts. Shlomo Benartzi is Professor and Co-Chair of the BehavioralDecision-Making Group, Anderson School of Management, University of California at LosAngeles, Los Angeles, California. Their e-mail addresses are �[email protected]�,�[email protected]�, �[email protected]�, and �[email protected]�, respectively.
Journal of Economic Perspectives—Volume 23, Number 2—Spring 2009—Pages 121–142
time series of nominal prices. Research on stock splits has proposed some theoret-ical explanations of why managers may choose to split their stock, but theseproposed models fail to predict that nominal share prices would remain constant.1
To illustrate the phenomenon consider the case of General Electric (GE). OnDecember 31, 1935, GE was trading at $38.25 a share, and exactly 72 years later, itwas trading at $37.07 a share. Had GE never split its shares from 1933 to 2007, itsshare price on December 31, 2007, would have been $10,676.16. In fact, it has splitits stock seven times over this time period, resulting in a cumulative split of 288:1,and each targeted price was about the same. GE, like most firms, is proactive atkeeping its nominal share price constant by splitting its shares. We argue that in sodoing, GE and most other U.S. firms follow a norm that keeps their nominal shareprices in a narrow and roughly constant range through time. Furthermore, while itmay have made sense to maintain share prices in this range for some time period,it is difficult to think of a rationale that could support a constant share price asbeing optimal over the past 72 years.
Adhering to the norm and actively maintaining nominal stock prices in anarrow band through stock splits is costly. Based on discussions with lawyers andbankers who have been involved in these transactions, we estimate the directadministrative costs of splits to be in the range of $250,000 to $800,000 for a largefirm, which is similar to the estimate offered by Ryser (1996). However, this directcost is dwarfed by the costs imposed on shareholders. First, the relative bid–askspread increases after splits (Copeland, 1979; Conroy, Harris, and Benet, 1990;Kadapakkam, Krishnamurthy, and Tse, 2005), which increases trading costs for allinvestors. (The relative bid–ask spread is defined as the posted bid price, less theposted ask price, scaled by the bid–ask midpoint, and is a measure of cost of tradinga stock for investors.) Second, institutional investors (at least since the mid-1970s)tend to pay a fixed brokerage commission per share, regardless of share price. (Weuse the term institutional investor to describe professional money managers, asopposed to retail investors.) Thus, trading 288 shares of GE at $37.07 would besignificantly more expensive than trading a single share at $10,676.16. Had GEnever split its stock (and everything else had remained the same), investors couldhave saved more than 99 percent of their brokerage commissions—which wouldsave those trading GE stock about $100 million a year in commissions.2 Third, the
1 We focus on the role of stock splits in setting prices, rather than cash dividends or other corporateactions, because a stock split is, at least on a first-order approximation, strictly cosmetic—nothingfundamental about the firm changes. The firm does not reduce its cash balance or retained earnings asit would in a cash dividend, and in a stock split no money is transferred from the firm to investors.Investors merely trade one share of old stock in exchange for, say, two new shares, each of whichrepresents an economic right in the firm that is exactly one-half of the right of their old share.2 The number in the text is based on a cost estimate of 2 cents/share, which we believe to beconservative. In discussions with several large and active money managers, we have been told thatcommissions are typically between 3 and 5 cents per share. The total cost estimate is also conservativeby a factor of two, as each trade involves a buyer and seller. In essence, we are assuming that each tradeis a trade with the market maker and none of the trades are driven by institutions on both the buy andsell side, each of which would have to pay the commission.
122 Journal of Economic Perspectives
New York Stock Exchange charges a per-share fee to companies listed on itsexchange, so this fee increases after a split.
Given the economic consequences for investors, why do firms proactively keeptheir share prices in a nominally constant narrow band? We suggest norms as apotential explanation. The role of norms in economics has been established as amechanism to coordinate actions in settings where there are multiple equilibria(Warneryd, 1994). “Social norms are customary rules of behavior that coordinateour interactions with others . . . (a norm) continues in force because we prefer toconform to the rule given the expectation that others are going to conform”(Young, 2008). Our investigation points to a specific norm about nominal shareprices and how it has continued in force long after any possible benefit of coordi-nation on this specific equilibrium has dissipated.
In the next section, we describe facts and patterns relevant to constant shareprices, because any satisfactory explanation for the nominal share price puzzleshould be consistent with all these facts. Next, we discuss whether economichypotheses about optimal trading-ranges or about signaling can explain why shareprices are nominally constant. We then explain some of the implications of normson optimal price ranges and describe some possible reasons why the average pricenorm was set to $35 a share.
Facts and Patterns
U.S. Share Prices Have Remained Constant since the Great DepressionFigure 1A displays the annual average share price of every stock from the New
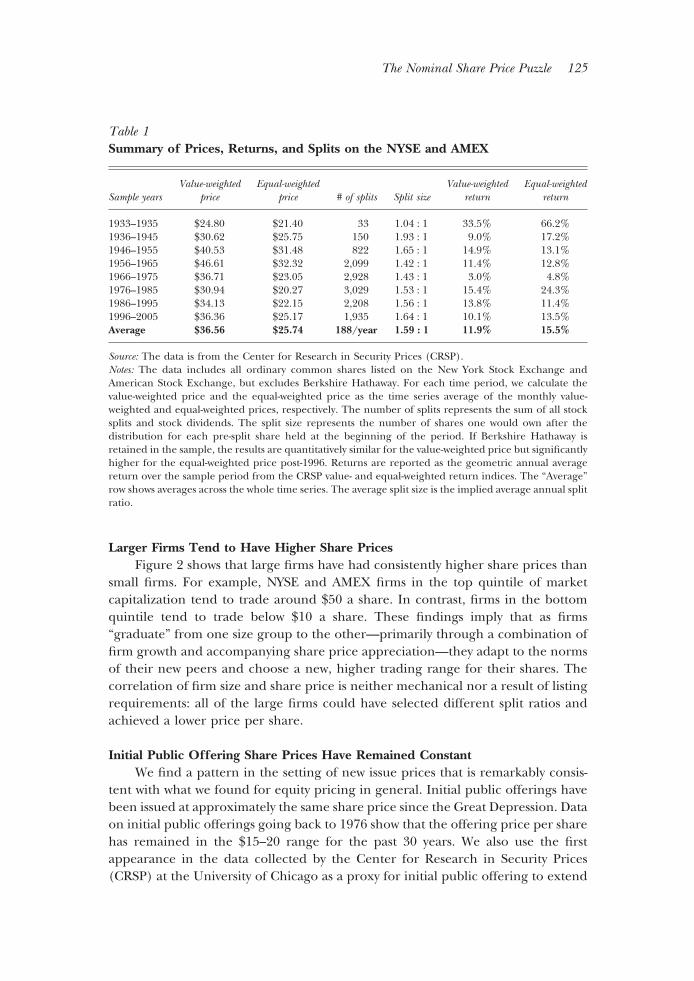
York Stock Exchange (NYSE) and the American Stock Exchange (AMEX) from1933 through 2007. The equally weighted average of share prices remained close to$25 throughout the entire period. While the value-weighted price is higher with amean of $36.56, the overall pattern is similar, suggesting that the results are notdriven by just a few large stocks. Table 1 presents the average price, return, numberof splits, and average split factor for all NYSE- and AMEX-listed securities by decade.Again, the same pattern emerges, the average price of securities remains close to$35/share, and many firms undertake splits in order to maintain this nominallyconstant price. As a reference, the Consumer Price Index experienced a geometricaverage annual inflation of 3.5 percent over this time, for a cumulative increase of1,528 percent. Therefore, maintaining constant nominal prices resulted in a dra-matic decrease in real prices. Figure 1B illustrates that real share prices havedeclined by more than 90 percent over this period. In today’s dollars, the equiva-lent of average stock prices from the 1930s and 1940s is a price per share of around$450! Not only do the mean and median nominal prices remain constant, but thereis also no trend in the cross-sectional variability of share prices, which has remainedroughly constant over the last 72 years.
William C. Weld, Roni Michaely, Richard H. Thaler, and Shlomo Benartzi 123
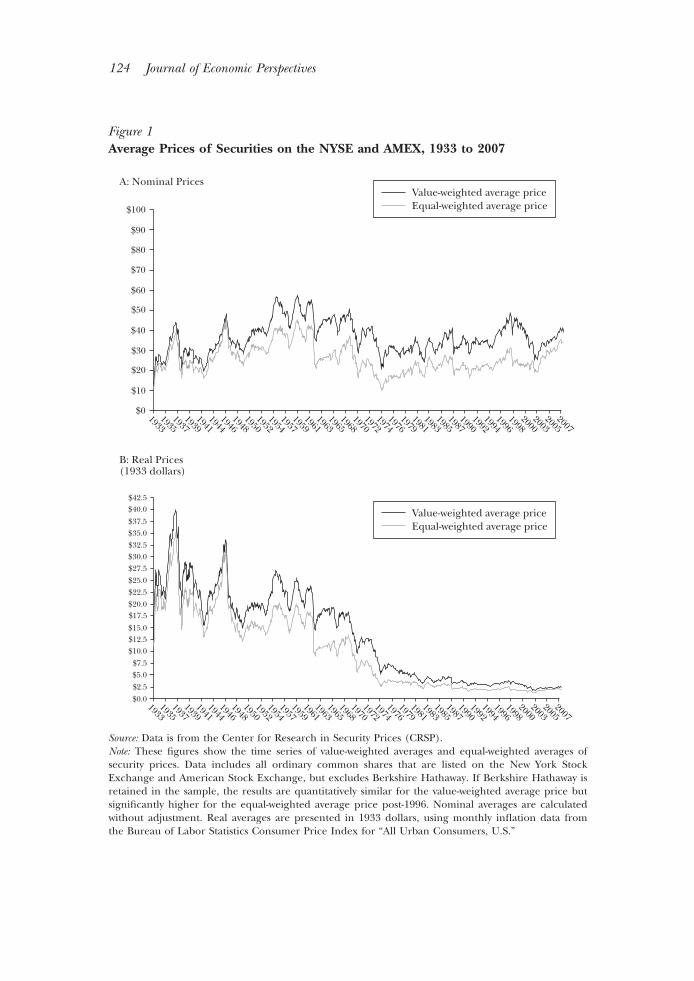
Figure 1Average Prices of Securities on the NYSE and AMEX, 1933 to 2007
20072005
20032000
19981996
19941992
19901987
19851983
19811979
19761974
19721970
19681965
19631961
19591957
19541952
19501948
19461944
19411939
19371935
1933
$100
$90
$80
$70
$60
$50
$40
$30
$20
$10
$0
A: Nominal Prices
B: Real Prices (1933 dollars)
Value-weighted average priceEqual-weighted average price
Value-weighted average priceEqual-weighted average price
20072005
20032000
19981996
19941992
19901987
19851983
19811979
19761974
19721970
19681965
19631961
19591957
19541952
19501948
19461944
19411939
19371935
1933
$42.5$40.0
$37.5$35.0
$32.5$30.0$27.5
$25.0
$22.5
$20.0$17.5
$15.0$12.5$10.0
$7.5
$5.0
$2.5
$0.0
Source: Data is from the Center for Research in Security Prices (CRSP).Note: These figures show the time series of value-weighted averages and equal-weighted averages ofsecurity prices. Data includes all ordinary common shares that are listed on the New York StockExchange and American Stock Exchange, but excludes Berkshire Hathaway. If Berkshire Hathaway isretained in the sample, the results are quantitatively similar for the value-weighted average price butsignificantly higher for the equal-weighted average price post-1996. Nominal averages are calculatedwithout adjustment. Real averages are presented in 1933 dollars, using monthly inflation data fromthe Bureau of Labor Statistics Consumer Price Index for “All Urban Consumers, U.S.”
124 Journal of Economic Perspectives
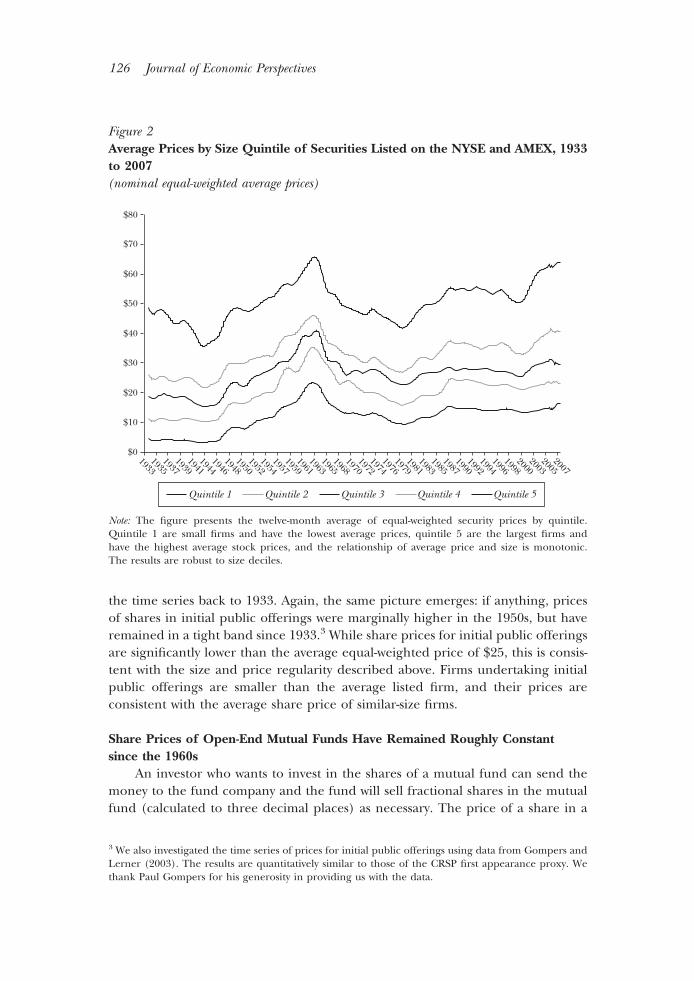
Larger Firms Tend to Have Higher Share PricesFigure 2 shows that large firms have had consistently higher share prices than
small firms. For example, NYSE and AMEX firms in the top quintile of marketcapitalization tend to trade around $50 a share. In contrast, firms in the bottomquintile tend to trade below $10 a share. These findings imply that as firms“graduate” from one size group to the other—primarily through a combination offirm growth and accompanying share price appreciation—they adapt to the normsof their new peers and choose a new, higher trading range for their shares. Thecorrelation of firm size and share price is neither mechanical nor a result of listingrequirements: all of the large firms could have selected different split ratios andachieved a lower price per share.
Initial Public Offering Share Prices Have Remained ConstantWe find a pattern in the setting of new issue prices that is remarkably consis-
tent with what we found for equity pricing in general. Initial public offerings havebeen issued at approximately the same share price since the Great Depression. Dataon initial public offerings going back to 1976 show that the offering price per sharehas remained in the $15–20 range for the past 30 years. We also use the firstappearance in the data collected by the Center for Research in Security Prices(CRSP) at the University of Chicago as a proxy for initial public offering to extend
Table 1Summary of Prices, Returns, and Splits on the NYSE and AMEX
Sample yearsValue-weighted
priceEqual-weighted
price # of splits Split sizeValue-weighted
returnEqual-weighted
return
1933–1935 $24.80 $21.40 33 1.04 : 1 33.5% 66.2%1936–1945 $30.62 $25.75 150 1.93 : 1 9.0% 17.2%1946–1955 $40.53 $31.48 822 1.65 : 1 14.9% 13.1%1956–1965 $46.61 $32.32 2,099 1.42 : 1 11.4% 12.8%1966–1975 $36.71 $23.05 2,928 1.43 : 1 3.0% 4.8%1976–1985 $30.94 $20.27 3,029 1.53 : 1 15.4% 24.3%1986–1995 $34.13 $22.15 2,208 1.56 : 1 13.8% 11.4%1996–2005 $36.36 $25.17 1,935 1.64 : 1 10.1% 13.5%Average $36.56 $25.74 188/year 1.59 : 1 11.9% 15.5%
Source: The data is from the Center for Research in Security Prices (CRSP).Notes: The data includes all ordinary common shares listed on the New York Stock Exchange andAmerican Stock Exchange, but excludes Berkshire Hathaway. For each time period, we calculate thevalue-weighted price and the equal-weighted price as the time series average of the monthly value-weighted and equal-weighted prices, respectively. The number of splits represents the sum of all stocksplits and stock dividends. The split size represents the number of shares one would own after thedistribution for each pre-split share held at the beginning of the period. If Berkshire Hathaway isretained in the sample, the results are quantitatively similar for the value-weighted price but significantlyhigher for the equal-weighted price post-1996. Returns are reported as the geometric annual averagereturn over the sample period from the CRSP value- and equal-weighted return indices. The “Average”row shows averages across the whole time series. The average split size is the implied average annual splitratio.
The Nominal Share Price Puzzle 125
the time series back to 1933. Again, the same picture emerges: if anything, pricesof shares in initial public offerings were marginally higher in the 1950s, but haveremained in a tight band since 1933.3 While share prices for initial public offeringsare significantly lower than the average equal-weighted price of $25, this is consis-tent with the size and price regularity described above. Firms undertaking initialpublic offerings are smaller than the average listed firm, and their prices areconsistent with the average share price of similar-size firms.
Share Prices of Open-End Mutual Funds Have Remained Roughly Constantsince the 1960s
An investor who wants to invest in the shares of a mutual fund can send themoney to the fund company and the fund will sell fractional shares in the mutualfund (calculated to three decimal places) as necessary. The price of a share in a
3 We also investigated the time series of prices for initial public offerings using data from Gompers andLerner (2003). The results are quantitatively similar to those of the CRSP first appearance proxy. Wethank Paul Gompers for his generosity in providing us with the data.
Figure 2Average Prices by Size Quintile of Securities Listed on the NYSE and AMEX, 1933to 2007(nominal equal-weighted average prices)
$80
$70
$60
$50
$40
$30
$20
$10
$02007
20052003
20001998
19961994
19921990
19871985
19831981
19791976
19741972
19701968
19651963
19611959
19571954
19521950
19481946
19441941
19391937
19351933
Quintile 1 Quintile 2 Quintile 3 Quintile 4 Quintile 5
Note: The figure presents the twelve-month average of equal-weighted security prices by quintile.Quintile 1 are small firms and have the lowest average prices, quintile 5 are the largest firms andhave the highest average stock prices, and the relationship of average price and size is monotonic.The results are robust to size deciles.
126 Journal of Economic Perspectives
mutual fund is a purely arbitrary number, a true numeraire. Nevertheless, mutualfund companies also have splits to keep share prices relatively constant.
Using the Mutual Fund Database from the Center for Research in SecurityPrices (CRSP), we find that from 1961 to 2007 the average open-end mutual fundnet asset value per share drifted slightly upward. The average price is around $9 pershare in the first 20 years of the sample and around $13 in the second part of thesample—about a 50 percent increase. However, this increase is very small whencompared to cumulative increases in consumer prices of 605 percent and in stockreturns of 11,250 percent over the same time period.
The Pattern of Share Prices Varies Dramatically across CountriesConsider the experience of the Tokyo Stock Exchange. The average nominal
prices for individual shares in Tokyo has fluctuated considerably; it rose from about¥300/share in 1975 to ¥1500/share in 1990, then dropped to about ¥800 to ¥1000per share for most of the time from 1991 to 2005—although with a brief jump backto ¥1400/share in 2001. The main index for the Tokyo stock market, the Nikkei225, has followed a similar pattern, generating a correlation of 0.85. For example,from 1975 to 1990 the Nikkei 225 index increased by 436 percent, and the averageshare price increased by a very similar 409 percent. Looking just at the 1980s, theNikkei 225 increased ten-fold in market value and the average price of individualshares increased at the same pace—which suggests that large stock splits wererather rare in Japan.4 As the Nikkei 225 index declined after 1990, share pricesdeclined as well.
Share prices in the United Kingdom are also not close to constant in nominalterms. Since 1981 (the first year of data), nominal share prices increased approx-imately from £1.33 per share to over £4 per share in 2000, before falling back to£2.99 per share by 2005. As in Japan, the average price of a share and the mainindex of stock market returns are highly correlated at 0.79. For example, from 1981to 1998, average share prices rose from £1.33 to £4.00, a rise of 200 percent, whilethe FTSE index rose from 313 to 2,674, a rise of 750 percent.
Unlike Japan or the United Kingdom, U.S. share prices remained roughlyconstant over this time period while the index increases dramatically. For examplefrom 1975 to 2005, the Dow Jones Industrial index increased by 1,157 percent, butthe average nominal share price changed only from $27.00 to $34.98, an increaseof 30 percent (while consumer prices increased by 275 percent). In the UnitedStates, nominal share prices are only modestly correlated with the stock marketindex at 0.41; that is, in some cases share prices and the overall stock market indexrise together, but then a number of corporations split their shares and the patternis broken. The difference between the evolution of share prices in the United States
4 We thank Mr. Yamaguchi from Ibbotson Associates for sharing data and information on the Tokyostock exchange. Greenwood (2008) provides comprehensive coverage of split activity in Japan anddocuments that, prior to 1999, over 95 percent of splits in Japan were in the form of what would becalled small stock dividends in the United States.
William C. Weld, Roni Michaely, Richard H. Thaler, and Shlomo Benartzi 127
as compared with the United Kingdom or Japan does not appear to be driven bydifferent levels of inflation as Tokyo nominal average share prices increased atapproximately 2.4 times the rate of inflation, UK share prices increased at approx-imately 70 percent of the inflation rate, and U.S. average nominal share pricesincreased at only 10 percent of the rate of inflation.5
Firms in the United States, Japan, and the United Kingdom all face a roughlysimilar business climate. Firms in all three countries have the ability through stocksplits to maintain constant nominal prices—yet only U.S. firms do so. The UnitedStates is the only country where average share prices have remained essentiallyconstant in nominal terms. The international evidence we present suggests that theunderlying preference for a specific price point in the United States is probably notdetermined by some underlying fundamental economic reason.
In addition to London and Tokyo, we investigated share prices on 16 interna-tional stock exchanges and found substantial cross-sectional variation in terms ofaverage stock price, variation of stock price, and covariation of average price forindividual stocks and the overall value of the stock exchange index. The data aresuggestive of the fact that the nominal price fixation is primarily a U.S. or NorthAmerican phenomenon. When we examine the correlation between prices and theprimary stock index for the various exchanges, we find the New York StockExchange has the lowest correlation at 0.41, followed by the Toronto Stock Ex-change with ��0.64. On the other extreme are the Johannesburg Stock Exchangeand the Mexican and Italian stock exchanges with � �0.90. The New York StockExchange also has the smallest coefficient of variation over the time series at 0.14,which is less than half of the variation on every other exchange (except for Torontoat 0.24).
Maintaining Constant Prices Increases Trading CostsMaintaining constant share prices through stock splits is costly for investors.
First, as mentioned earlier, institutional investors and many individual investors paya fixed commission per share or per trade. Even if commissions are as low as 2 centsa share, the cumulative costs are nontrivial. Second, we find, more generally, thattrading costs are related to price level. We use Hasbrouck’s (2005) data on pricesand bid–ask spreads for several hundred stocks starting in the 1920s until 2005.This data is generated by sampling daily stock data to estimate bid–ask spreads forover 190,000 firm-year observations, and it allows us to test the relation betweenprices and the cost of trading, defined as the relative bid–ask spread.
We regress the relative bid–ask spread on price, trading volume, turnover, andmarket capitalization on an annual basis, and report in Table 2 the time seriesaverages of the annual coefficients (using what is called the “Fama-Macbeth pro-cedure” from Fama and MacBeth, 1973). We find that higher-priced firms have
5 Japan inflation data is from the Japanese Ministry of Internal Affairs and Communications’ StatisticsBureau, available at �http://www.stat.go.jp/english/data/cpi/index.htm�. UK inflation data is from theCDKO index, available at �http://www.statistics.gov.uk/default.asp�.
128 Journal of Economic Perspectives
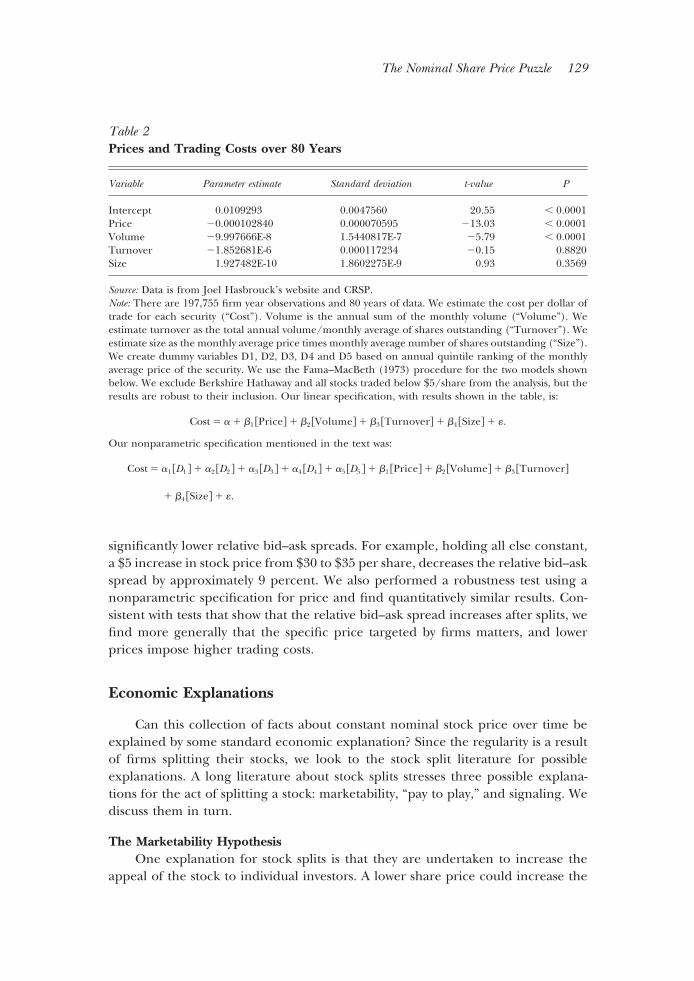
significantly lower relative bid–ask spreads. For example, holding all else constant,a $5 increase in stock price from $30 to $35 per share, decreases the relative bid–askspread by approximately 9 percent. We also performed a robustness test using anonparametric specification for price and find quantitatively similar results. Con-sistent with tests that show that the relative bid–ask spread increases after splits, wefind more generally that the specific price targeted by firms matters, and lowerprices impose higher trading costs.
Economic Explanations
Can this collection of facts about constant nominal stock price over time beexplained by some standard economic explanation? Since the regularity is a resultof firms splitting their stocks, we look to the stock split literature for possibleexplanations. A long literature about stock splits stresses three possible explana-tions for the act of splitting a stock: marketability, “pay to play,” and signaling. Wediscuss them in turn.
The Marketability HypothesisOne explanation for stock splits is that they are undertaken to increase the
appeal of the stock to individual investors. A lower share price could increase the
Table 2Prices and Trading Costs over 80 Years
Variable Parameter estimate Standard deviation t-value P
Intercept 0.0109293 0.0047560 20.55 � 0.0001Price �0.000102840 0.000070595 �13.03 � 0.0001Volume �9.997666E-8 1.5440817E-7 �5.79 � 0.0001Turnover �1.852681E-6 0.000117234 �0.15 0.8820Size 1.927482E-10 1.8602275E-9 0.93 0.3569
Source: Data is from Joel Hasbrouck’s website and CRSP.Note: There are 197,755 firm year observations and 80 years of data. We estimate the cost per dollar oftrade for each security (“Cost”). Volume is the annual sum of the monthly volume (“Volume”). Weestimate turnover as the total annual volume/monthly average of shares outstanding (“Turnover”). Weestimate size as the monthly average price times monthly average number of shares outstanding (“Size”).We create dummy variables D1, D2, D3, D4 and D5 based on annual quintile ranking of the monthlyaverage price of the security. We use the Fama–MacBeth (1973) procedure for the two models shownbelow. We exclude Berkshire Hathaway and all stocks traded below $5/share from the analysis, but theresults are robust to their inclusion. Our linear specification, with results shown in the table, is:
Cost � � � �1 �Price� � �2 �Volume� � �3 �Turnover� � �4 �Size� � �.
Our nonparametric specification mentioned in the text was:
Cost � �1 �D1 � � �2 �D2 � � �3 �D3 � � �4 �D4 � � �5 �D5 � � �1 �Price� � �2 �Volume� � �3 �Turnover�
� �4 �Size� � �.
The Nominal Share Price Puzzle 129
pool of potential investors in the company, and so the demand for the stock willincrease. It is sometimes also argued that this will also increase the stock’s liquidity.This argument has a long tradition and some empirical support, but it does notexplain many of the key facts presented in the previous section.
Dolley’s (1933) early study of stock splits reported that 33 of 36 corporationsthat split their shares in the 1920s indicated that the primary objective was toincrease the marketability of their common stocks. Half a century later, Baker andGallagher (1980) surveyed chief financial officers of two groups of firms, one thathad split and another that had not. For both groups, they report that the mostpopular reason for splitting is to “make it easier for small stockholders to purchaseround lots (more shares, lower price).” Within the stock split group, 98.4 percentagreed with the trading-range hypothesis, and even within the non-split group, 93.8percent supported the trading-range hypothesis. In a follow-up study, Baker andPowell (1993) report similar results. Even some managers of open-end mutualfunds support the trading-range hypothesis, with 40.4 percent agreeing that “alower NAV [net asset value] per share attracts more investors” (Fernando, Krish-namurthy, and Spindt, 1999).
Not only do managers appear to have this belief, but also several empiricalstudies have provided evidence that can be interpreted as supportive of the mar-ketability hypothesis. Dyl and Elliott (2006) document a positive correlation be-tween share price and institutional ownership, suggesting that individuals mightprefer lower-priced stocks. Fernando, Kirsnamurthy, and Spindt (2004) documenta positive correlation between institutional ownership and share prices of initialpublic offerings. One could conclude that institutional investors prefer high shareprices due to lower brokerage commissions, whereas individual investors can onlyafford buying round lots of low-priced shares. However, direct tests of the increasedmarketability for common stocks subsequent to a stock split suggest that there is nolong-term increase in marketability (for example, Lakonishok and Lev, 1987), andif there are any short-term effects, they are very small (for example, Byun andRozeff, 2003).
More importantly for our investigation, the marketability hypothesis makesclear-cut predictions that are inconsistent with many of the patterns of constantnominal share prices. For example, why didn’t share prices keep up with inflation?According to the marketability hypothesis, individuals have a budget constraint thatrestricts them to lower-priced shares. Suppose, for example, that an individualwould like to diversify across ten stocks, and she has only $25,000 to invest. If sheallocates $2,500 to each stock, and she is restricted to buying “round lots” (sharesin multiples of 100), she can pay no more than $25 a share. This simple arithmeticignores one important consideration: the investor who had $25,000 to invest in1933 is likely to have much more money (in nominal terms) today. It seems naturalto assume that the budget constraint of the average individual investor shouldremain approximately constant in real dollars. Assuming that the funds availablefor investing increase with inflation, then the marketability hypothesis clearly
130 Journal of Economic Perspectives
predicts that nominal share prices should keep up with inflation. The data refutewhat is arguably the most basic prediction of the marketability hypothesis.
The idea that stock splits are undertaken by firms to maintain a preferredtrading range for retail investors is problematic for other reasons as well. First,many firms offer direct investment programs that allow investors to buy smallquantities of shares without any commissions (Scholes and Wolfson, 1989). Second,over the past 20 years the pricing of retail brokerage has changed in a way thatmakes the marketability hypothesis untenable. Many brokerage firms charge a flatfee for trades up to 20,000 shares. This commission structure means that retailinvestors should have no preference about the number of shares that they trade.Also, while trading odd lots was difficult and expensive historically, in a world ofelectronic trading this is no longer the case.6 So unless individual investors havespecific preferences for lower-priced stocks unrelated to their budget consider-ations, the marketability hypothesis is inconsistent with the facts. And if investors dohave such preferences, why would their preferences for lower-priced stocks dependon the size of the company?
The marketability hypothesis also makes a clear prediction about diversifiedinvestment vehicles. In the mutual fund and exchange-traded fund settings, wherea retail investor can obtain a well-diversified portfolio by purchasing one security,the marketability hypothesis predicts no splits at all. However, exchange-tradedfunds split their shares. For example, on April 24, 2006, the Rydex equal weightStandard & Poor’s index fund executed a 4:1 split, and on June 13, 2005, a dozendifferent iShares funds managed by Barclays Global Investors split either 2:1 or 3:1.In the case of open-end mutual funds, the theoretical prediction is even moredramatic. The share price of such a fund is irrelevant, because you can purchase orsell whatever dollar value you want and the fund will calculate fractions of shares asnecessary. And yet mutual funds do split. Moreover, we note that many mutualfunds have a minimum initial investment requirement, which is consistent with ourclaims that very small shareholders are not the preferred investors for most firms,and mutual fund splits are hard to rationalize under the marketability hypothesis.
Finally, the marketability hypothesis suggests that share prices should respondto changes in the composition of stock owners—in particular, to the dramaticincrease in institutional ownership that has occurred. According to the NYSE“Factbook,” the percent of corporate stocks that were directly owned by individualsdeclined from 90.2 percent in 1950, to 41.1 percent in 1998. At the same time,indirect holdings of corporate stocks, such as via mutual funds, have increased
6 In fact, there is some evidence that odd-lot trades get better execution on the New York StockExchange because of Rule 124 and the elimination of the odd-lot differential in 1991. Rule 124effectively requires specialists to execute odd lots at the same price as the most recent or next trade. Anexample of the benefits of odd-lot trading was highlighted in 2004 when the NYSE announced that it wasimposing a censure and $50,000 fine against Westminster Securities Corporation. The alleged abuse byWestminster was breaking up customer round-lot orders into odd-lot orders to sneak them ahead ofother round-lot orders awaiting execution. The full text of Rule 124 is available at �http://rules.nyse.com/NYSE/Help/Map/rules-sys186.html�.
William C. Weld, Roni Michaely, Richard H. Thaler, and Shlomo Benartzi 131
many-fold from 3.3 to 27.5 percent, and the fraction of stock owned by nonhouse-holds, such as defined benefit pensions, has increased from 6.5 to 31.4 percent, asseen in the Federal Reserve Flow of Funds Accounts data. Nonretail trading in atleast some securities accounted for 96 percent of New York Stock Exchange tradingvolume in 2002 (Jones and Lipson, 2003). In short, institutional holdings andtrading dominate the market.
The major reduction in direct household holdings, and the correspondingincrease in institutional holdings and trading, indicates that there has been asignificant change in the characteristics of investors. Therefore, the marketabilityhypothesis would predict higher prices as this investor composition shift occurs andfirms cater to the new class of important investors. However, we already saw thatshare prices remained around $35 throughout the entire period, despite the majorchanges in stock ownership.
The nominal share price puzzle could also be related to characteristics of theretail investor.7 For example, perhaps a few very wealthy individuals held stock inearlier periods, but now many more, though less-wealthy, individuals hold equitysecurities directly. The reduction in real price over time could then be a conse-quence of the fact that those less wealthy individuals are the marginal investors.However, the level of direct equity participation now and 80 years ago is quitesimilar. For example, the percentage of households with direct holdings of sharesof stock in the 1920s was around 20 percent, roughly the same as in the late 1990s.As mutual funds have become increasingly popular since the mid-1960s, mostindividuals’ stock-holdings are indirect, through these funds. Moreover, even now-adays stock ownership is highly concentrated: the wealthiest 10 percent of thepopulation in the United States owns 85.1 percent of common stock, and approx-imately one-half of all households have zero stock holdings (Mishel, Bernstein, andAllegretto, 2005). It seems unlikely that the nominal price stationarity can beattributed to changing characteristics of retail investors.
The Pay-to-Play HypothesisA related hypothesis, which also posits an optimal trading range for stock
prices, is based in the notion that firms set their share prices to induce brokers/dealers to provide liquidity through higher market-making profitability. Angel(1997) develops a theory of “relative tick size.” In this approach, firms split theirstock to lower the share price and increase the ratio of tick size (defined as theminimum possible difference between the bid and the ask price) to share price. Ahigher relative tick size economically motivates more dealers to make markets forthe stock and to provide more liquidity.
This theory is consistent with the pattern observed in the United States overthe period 1930–1996 where both tick sizes and prices remained constant. How-ever, the theory predicts that if tick sizes fall, prices should fall as well. A natural test
7 We thank George Akerlof for his suggestion to investigate this point.
132 Journal of Economic Perspectives
is provided by the decimalization that occurred on the New York Stock Exchange.As Angel (1997, p. 678) boldly stated: “[A] reduction in the minimum pricevariation from $0.125 to $0.01 could eventually lead to a reduction in the averageshare price by the same factor, 12.5 resulting in an average share price around $3.”Starting in 1997, the natural experiment Angel hypothesized actually took place.The tick size on the NYSE changed from 1/8 to 1/16 and then to 1/100. ButAngel’s prediction was not successful. Rather than falling by a factor of 12.5, shareprices remained roughly constant during this period. Similarly, the reduction inminimum tick size on the Toronto stock exchange did not result in a like reductionin the average prices of shares traded on that exchange.
Another problem with this theory is that it is hard to see why large firms wouldfeel any need to pay anyone to provide liquidity. Does the management at Microsoftor GE think that their shares would not trade if the price were $500 or $1,000 whenBerkshire Hathaway, which has traded at over $100,000 per share, is among themost consistently profitable stocks traded by specialist firm LaBranche?8 Evenputting aside Berkshire Hathaway, Google’s management seems to share our viewthat this argument is implausible since their share price has traded above $700 andthe firm appears to have no intention of splitting. Clayton Moran, an analyst withStanford Group, remarked, “All the indications I get from the company is that theyare comfortable with a stock price that implies a superiority to competitors so Idon’t think they are motivated to split the stock” (La Monica, 2006). Finally, thetick size explanation can provide no explanation for mutual fund splits.
The Signaling HypothesisIn a world of asymmetric information between those insiders who are manag-
ers and those outsiders who are investors, insiders may wish to convey their privateinformation to the outsiders in the market, even if it is costly to do so. Severalpapers suggest that a stock split may serve as such a signaling device. As in allsignaling models, two immediate questions arise: 1) what do the managers signal;and 2) what is the cost of the signal?
Brennan and Copeland (1988a) develop a model in which undervalued firmsuse stock splits to signal the quality and strength of their future prospects. In theirmodel, splits are credible signals because they are costly. Since commissions arerelated to the number of shares traded, investors would save money by trading asmaller number of shares, each having a higher share price. Another component ofthe costs is the bid–ask spread. The relative bid–ask spread—defined as the bid–askspread for $1 worth of trade—is greater post-split, as our own tests and previous
8 “As a rule, the spread on Berkshire A shares fluctuates between $100 and $200 a share. (On most othershares on the Big Board, the spread is a matter of pennies.) Like other chief executives, Mr. Buffettdoesn’t want to see big spreads between buyers and sellers of his stock. However, large spreads can belucrative for specialist firms. ‘I want Berkshire to be a good stock for LaBranche, but not the best stock,’says Mr. Buffett, referring to Mr. Maguire’s employer, the specialist company LaBranche & Co. Berkshireshares rank among LaBranche’s most consistently profitable stocks, but not the most profitable, saysowner Michael LaBranche” (Richardson, 2005).
The Nominal Share Price Puzzle 133
studies show (for example, Conroy, Harris, and Benet, 1990). There are alsoadministrative costs that add to the cost of the split, as mentioned earlier. In asignaling model, undervalued firms increase the number of shares and decreaseshare prices to signal their higher quality.9 In equilibrium, one might expectundervalued firms to end up with lower share prices than overvalued firms. Thegreater the split factor and the lower the price, the more credible the signal and themore likely the firm is undervalued. A final implication of the signaling hypothesisis that the market reaction to the split should be positive.
If stock splits are a rational economic signal, then they presumably should becorrelated with future profitability. Lakonishok and Lev (1987) report that profit-ability does increase significantly, but it does so prior to the split rather than after thesplit. Asquith, Healy, and Palepu (1989) also find large earning increases andreturns prior to a split, but none thereafter. Do splitting firms try to signal that theyhave already reached their peak and their growth rate should revert back to a lowerlevel? That interpretation seems unlikely. The price of shares after stock splitsseems less consistent with signaling then with “rejoining the herd” at the near-constant nominal stock price.
The evidence on price performance after splits is not uniform. In the seminalpaper on this subject, Fama, Fisher, Jensen, and Roll (1969) found that firmshaving a stock split have experienced abnormal returns of 34 percent in the 30months leading up to the split, but experience no abnormal returns thereafter.Byun and Rozeff (2003) find that any abnormal returns subsequent to a split arespecific to the sample period chosen. Some studies do find abnormal returns overlong horizons after splits, but such studies are very sensitive to the methods usedand there is no consensus on the results.10
The signaling model also predicts less information asymmetry after splits sincemanagement’s private information has already been conveyed to the market via thesplit. This ought to lead to a reduction in “informed trades” following splits. Easley,O’Hara, and Saar (1998) examine this prediction and find no evidence thatinformation asymmetry is reduced after splits.
Several of the facts we discussed earlier also seem at odds with the signalinghypothesis. Many exchange-traded funds are passive index funds, and it is verydifficult to believe that they somehow have superior “inside information” that theunderlying index they hold is going to outperform in subsequent periods—and yet
9 Note that the signaling explanation is the opposite of the “pay to play” explanation: In the first, thesplit reduces liquidity and the costs are truly just burning money. In the second, the costs are effectivelya payment for better liquidity and promotion. However both stories (and the entire literature related tosplits) are premised upon the fact that costs of trade are increased by stock splits.10 For example, Grinblatt, Masulis, and Titman (1984) find median abnormal returns of 27 percent inthe four months prior to the stock split, and 3 percent in the four months subsequent to the split. Desaiand Jain (1997) find buy-and-hold abnormal returns of 7.05 percent in the year after the split, whichsuggests that the firm continues to have good performance post-split, and yet the signal is not fullyincorporated into prices by the market. Ikenberry, Rankine, and Stice (1996) and Ikenberry andRamnath (2002) find abnormal returns of between 8 and 9 percent, and abnormally low negativeearnings realization in the year subsequent to the split.
134 Journal of Economic Perspectives
they split. Mutual funds split too, yet it is difficult to construct a model in which thefunds can (much less do) predict out-performance. ADRs, or American DepositoryReceipts, are a financial vehicle that represents a certain number of shares of aforeign stock, but they are denominated in dollars and sold on U.S. stock ex-changes. Unsponsored ADRs split, while their home country security, where mostof the trades are done, does not (Muscarella and Vetsuypens, 1996). The depositorybank that created the unsponsored ADR is unlikely to have better “inside informa-tion” on the future prospects of the firm than do the managers of the firm itself.From these examples, it seems difficult to identify exactly what splits signal.
Signaling theories also imply that as the cost of the signal changes, the intensityof the signal should change as well. Thus when brokerage commissions dramaticallydecreased with the shift from fixed minimum to negotiated commission on “May-day” in May 1975, and again with the penetration of discount brokers, we shouldhave observed a like decline in share price. Similarly, the reduction in the mini-mum bid–ask spread over a very brief period in time should have an abrupt impacton share prices, which it has not. From 1933 to 1997, the minimum tick sizeremained constant at 1/8 of a nominal dollar. June 23, 1997, marked the firstchange in nominal tick size from 1/8 to 1/16, and January 29, 2001, marked thetransition on the New York Stock Exchange to having all stocks quoted in decimals,and yet throughout these changes, prices have remained remarkably constant.In summary, the evidence casts doubt that signaling could explain share pricesremaining at a nominal price of $35 since the Great Depression.
Finally, certain questions always arise with signaling hypotheses. Firms that splittheir shares are primarily those whose shares have greatly increased in price. Whyis this signal more likely to be available in bull markets or for firms that have beendoing exceptionally well? Wouldn’t firms in down markets (or firms that have donepoorly in the recent past) also have private information they would like to signal?In fact, why don’t low-price firms use splits to signal strong future prospects, sincea split to an abnormally low price would seem to be an especially strong signal?Finally, why does every high-priced company undertake this specific signal? Doesevery high-priced firm have good future prospects, except for Berkshire Hathawayand Google?
Customs and Norms
As Sherlock Holmes liked to say, “When you have eliminated the impossible,whatever remains, however improbable, must be the truth” (Doyle, 1890). Thestandard economic explanations for stock splits cannot account for the factssurrounding the nominal share price puzzle, so we must consider alternatives. Weconsider the possibility that firms are simply following convention when they set theshare price. They set the price to whatever is considered the norm. Unlike the normof driving on either the left- or right-hand side of the road, in this case there is nostrong penalty for violating the norm. Having an outlier price such as Berkshire
William C. Weld, Roni Michaely, Richard H. Thaler, and Shlomo Benartzi 135
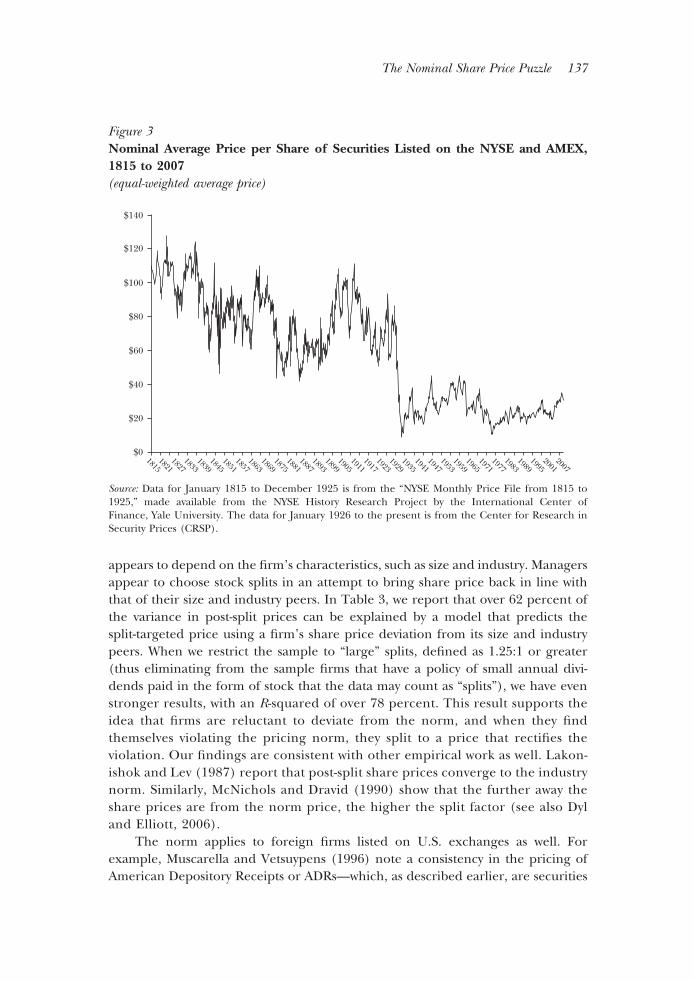
Hathaway or Google will not get you killed. However, the norm is sufficientlyengrained that going against it invites scrutiny. Almost every in-depth article in thepopular press on Berkshire Hathaway comments on its unusually high per shareprice and on Warren Buffet’s unwillingness to split the stock. Interestingly, thenorm of an average price of about $35 has been formed only since the 1929 crash.Figure 3 shows that, until the crash in 1929, stock prices were much higher. Priorto 1915, share prices were quoted as a percentage of their par value, not in dollars(Angel, 1997), and it was very common for par values to be to set at $100 a share.However, after the market crash of 1929, share prices dropped from roughly $70 to$35 and have never increased. This pattern suggests that the norm around shareprices can be changed in response to a dramatic shock. Additional anecdotalevidence from Europe around the introduction of the euro currency suggests thatprice norms can be broken when the set of “peer” firms change. After the intro-duction of the euro, for example, many Italian-listed companies reportedly consid-ered reverse stock splits to raise their trading prices to more “respectable” levels(Bologna, 1999).
Admittedly, because no formal model exists of how norms are created andmaintained, it is difficult to test the norms hypothesis. At this stage, we canconjecture about the process of the formation of the “price-range norm.” Perhaps$35/share was a binding constraint for investors in the 1930s. The average annualincome in the 1930s in the United States was under $1,400, making a $35 purchasea meaningful amount of money. With this in mind, the findings of Dolley (1933)are plausible—a lower price allowed investors to purchase shares of the companiesand therefore increased the breadth of share ownership. For example, a May 17,1916, article in the New York Times reported that the Willys-Overland Company (anautomotive company) split its shares 4:1, moving its price from approximately$225/share to $56. Anticipation of the increased participation by a broader set ofinvestors precipitated by the split had led to almost a 15 percent increase in price.However, by 2004 the mean annual income in the United States exceeded $60,000.This dramatic increase in nominal income, by over 40 times, makes $35/share seemno longer relevant as a binding constraint. In other words, the $35 share price is avestigial norm.
If investors used price information for classifying firms (perhaps because ofinformation costs or bounded rationality), it made sense for firms to coordinate onprice. Once established, the norm for firms to split their stocks when the per-shareprice has gotten high became self-reinforcing. When considered in the time series,each of the explanations for why a particular share price might have been optimalat one point in time also leads to the conclusion that $35/share could not havebeen optimal in 1930, 2007, and every date in between. However, the activetargeting of a price of $35/share persisted throughout this time series. Regardlessas to what mechanism was initially responsible, once the behavior became a norm,it became self-reinforcing.
As our discussion has suggested in a number of places, the norm is not quiteas simple as “$35 a share.” Instead, the norm for the stock price of U.S. firms
136 Journal of Economic Perspectives
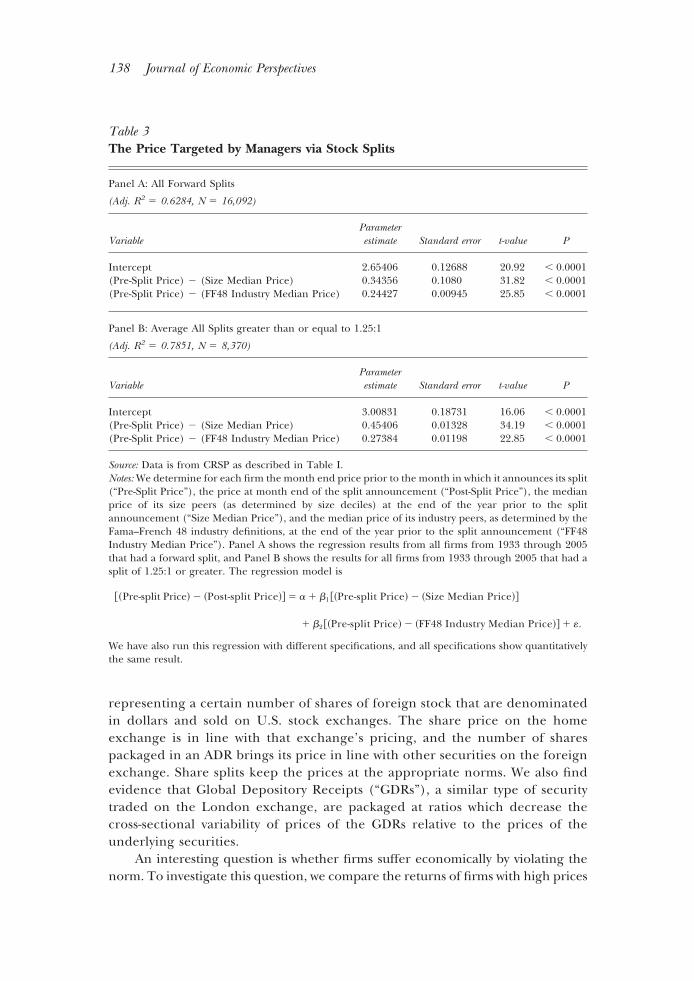
appears to depend on the firm’s characteristics, such as size and industry. Managersappear to choose stock splits in an attempt to bring share price back in line withthat of their size and industry peers. In Table 3, we report that over 62 percent ofthe variance in post-split prices can be explained by a model that predicts thesplit-targeted price using a firm’s share price deviation from its size and industrypeers. When we restrict the sample to “large” splits, defined as 1.25:1 or greater(thus eliminating from the sample firms that have a policy of small annual divi-dends paid in the form of stock that the data may count as “splits”), we have evenstronger results, with an R-squared of over 78 percent. This result supports theidea that firms are reluctant to deviate from the norm, and when they findthemselves violating the pricing norm, they split to a price that rectifies theviolation. Our findings are consistent with other empirical work as well. Lakon-ishok and Lev (1987) report that post-split share prices converge to the industrynorm. Similarly, McNichols and Dravid (1990) show that the further away theshare prices are from the norm price, the higher the split factor (see also Dyland Elliott, 2006).
The norm applies to foreign firms listed on U.S. exchanges as well. Forexample, Muscarella and Vetsuypens (1996) note a consistency in the pricing ofAmerican Depository Receipts or ADRs—which, as described earlier, are securities
Figure 3Nominal Average Price per Share of Securities Listed on the NYSE and AMEX,1815 to 2007(equal-weighted average price)
$140
$120
$100
$80
$60
$40
$20
$02007
20011995
19891983
19771971
19651959
19531947
19411935
19291923
19171911
19051899
18931887
18811875
18691863
18571851
18451839
18331827
18211815
Source: Data for January 1815 to December 1925 is from the “NYSE Monthly Price File from 1815 to1925,” made available from the NYSE History Research Project by the International Center ofFinance, Yale University. The data for January 1926 to the present is from the Center for Research inSecurity Prices (CRSP).
The Nominal Share Price Puzzle 137
representing a certain number of shares of foreign stock that are denominatedin dollars and sold on U.S. stock exchanges. The share price on the homeexchange is in line with that exchange’s pricing, and the number of sharespackaged in an ADR brings its price in line with other securities on the foreignexchange. Share splits keep the prices at the appropriate norms. We also findevidence that Global Depository Receipts (“GDRs”), a similar type of securitytraded on the London exchange, are packaged at ratios which decrease thecross-sectional variability of prices of the GDRs relative to the prices of theunderlying securities.
An interesting question is whether firms suffer economically by violating thenorm. To investigate this question, we compare the returns of firms with high prices
Table 3The Price Targeted by Managers via Stock Splits
Panel A: All Forward Splits
(Adj. R2 � 0.6284, N � 16,092)
VariableParameterestimate Standard error t-value P
Intercept 2.65406 0.12688 20.92 � 0.0001(Pre-Split Price) � (Size Median Price) 0.34356 0.1080 31.82 � 0.0001(Pre-Split Price) � (FF48 Industry Median Price) 0.24427 0.00945 25.85 � 0.0001
Panel B: Average All Splits greater than or equal to 1.25:1
(Adj. R2 � 0.7851, N � 8,370)
VariableParameterestimate Standard error t-value P
Intercept 3.00831 0.18731 16.06 � 0.0001(Pre-Split Price) � (Size Median Price) 0.45406 0.01328 34.19 � 0.0001(Pre-Split Price) � (FF48 Industry Median Price) 0.27384 0.01198 22.85 � 0.0001
Source: Data is from CRSP as described in Table I.Notes: We determine for each firm the month end price prior to the month in which it announces its split(“Pre-Split Price”), the price at month end of the split announcement (“Post-Split Price”), the medianprice of its size peers (as determined by size deciles) at the end of the year prior to the splitannouncement (“Size Median Price”), and the median price of its industry peers, as determined by theFama–French 48 industry definitions, at the end of the year prior to the split announcement (“FF48Industry Median Price”). Panel A shows the regression results from all firms from 1933 through 2005that had a forward split, and Panel B shows the results for all firms from 1933 through 2005 that had asplit of 1.25:1 or greater. The regression model is
�Pre-split Price � Post-split Price� � � � �1 �Pre-split Price � Size Median Price�
� �2 �Pre-split Price � FF48 Industry Median Price� � �.
We have also run this regression with different specifications, and all specifications show quantitativelythe same result.
138 Journal of Economic Perspectives
to firms with norm prices. Specifically, we run the following cross-sectional regres-sion each year (from 1962 through 2005):
pi � � � �j�1
5
djSizej � �k�1
48
dkIndustryk � ei ,
where pi is the firm’s average annual price, “Size” is a dummy variable for five sizequintiles, and “Industry” is a dummy for 48 industry categories provided by EugeneFama and Kenneth French.11
We use the error term from the regression to rank order firms in terms of theirdeviation from the norm. We then use these ranks to assign firms into deciles, andcall the firms in the tenth decile (firms with the highest prices relative to theirpeers) “norm violators” and firms in the 5th and 6th deciles “norm adherents.” Everyyear we match each “norm violator” firm to a set of firms from the “norm adherentgroup,” which are in the same book-to-market and size quintile. We then calculatethe average return of the norm violator portfolio, and subtract the average returnof the norm adherent portfolio of matched firms for each year. We then use thetime series average of the difference in portfolio returns, and their standarddeviation, to calculate the difference in returns for firms that violate price normsrelative to firms that adhere to the price norm. We find that the violators actuallyearn a tiny (and insignificant) 7.34 basis points per year more than the firms thatadhere to the norm.
Based on this analysis, it appears that firms that violate the price norm do notgenerate any economically, or statistically significantly, different returns over thenext year. This finding suggests that the failure to split is not punished in any wayand that the aggregate effects of adhering to the norm compared to violating thenorm are not material. (Warren Buffett can relax—he has been right all along.)This is further evidence that the mechanism that generates the price stationarity isnorms and not some economic rationale. It also suggests that while firms may try tocater to investor preferences via price targeting actions as suggested by Greenwood,Baker, and Wurgler (2008), the gains from catering are short-lived and reversedover time.
Conclusion
U.S. share prices have remained constant at around $35 in nominal termssince the Great Depression, while the general price level in the U.S. economy hasrisen more than tenfold. These constant share prices are not a coincidence, butrather result from a pro-active effort of firms splitting their stock. This pattern
11 The industry definition comes from Kenneth R. French’s data library, available online at �http://mba.tuck.dartmouth.edu/pages/faculty/ken.french/index.html�.
William C. Weld, Roni Michaely, Richard H. Thaler, and Shlomo Benartzi 139
cannot be explained by the standard explanations for stock splits, such as market-ability and investor budget constraints, nor by “pay to play” considerations such asbid–ask spread and brokerage commissions, nor by signaling. The average pricechoice of firms and mutual funds in the United States has remained stable in theface of changing tic size, investor composition, trading costs, inflation, real wealth,and market returns. We conclude that the constant nominal share prices are apuzzle when viewed through the conventional lenses.
In our view, firms are following norms when they determine their “optimal”trading range. Specifically, keeping share prices in the same range for 70 years isthe result of firms following traditions and norms that have evolved over time. Whyhave nominal U.S. share prices remained at $35 for so long? We respond in thesame manner as Tevya, the central character in Fiddler on the Roof. When asked whythings were done as they had always been done, he replied that he had a simpleexplanation: “And what is that you may ask? I can tell you that in one word.‘Tradition!’”
Tradition may also explain other aspects of corporate behavior (Akerlof, 2007;Cronqvist, Low, and Nilsson, 2009; Ben-David, Graham, and Harvey, 2007). Forexample: Why do some firms have almost no debt? When and why do firms initiatedividend payments (which are also irrelevant in a Miller and Modigliani (1961)world)? Why are some firms sensitive to cash flows while others are not (Kaplan andZingales, 1997, 2000)? Why do spin-offs behave like their parents (Cronqvist, Low,and Nilsson, 2009)? Norms provide a parsimonious explanation for all thesephenomena: this is the way things have always been done.
y We would like to thank the editors and George Akerlof, Markus Brunnermeier, HenrikCronqvist, Eugene Fama, Owen Lamont, Toby Moskowitz, Lubos Pastor, Avi Vohl, JefferyWurgler, and seminar participants at the 2007 NBER Behavioral Economics Working Group,2007 AFA meeting, Cornell University, the University of Chicago, IDC, the University ofMiami, the University of Utah, and the School of Management, Binghamton University, forhelpful comments and suggestions. Benartzi is grateful for financial support from ReishLuftman McDaniel & Reicher and the Vanguard Group.
References
Akerlof, George. A. 2007. “The Missing Moti-vation in Macroeconomics.” American EconomicAssociation Presidential Address, January 6.
Angel, James J. 1997. “Tick Size, Share Prices,and Stock Splits.” Journal of Finance, 52(2): 655–81.
Asquith, Paul, Paul Healy, and Krishna G.
Palepu. 1989. “Earnings and Stock Splits.” TheAccounting Review, 64(3): 387–403.
Baker, H. Kent, and Patricia L. Gallagher.1980. “Management’s View of Stock Splits.”Financial Management, 9(2): 73–77.
Baker, H. Kent, and Gary E. Powell. 1993.
140 Journal of Economic Perspectives
“Further Evidence on Managerial Motives forStock Splits.” Quarterly Journal of Business andEconomics, 32(3): 21–31.
Ben-David, Itzhak, Campbell R. Harvey, andJohn R. Graham. 2007. “Managerial Overconfi-dence and Corporate Policies.” NBER WorkingPaper No. W13711. Available at SSRN: http://ssrn.com/abstract�1079308.
Bologna, Stephanie Apap. 1999. “Single Cur-rency Creates New Penny Stocks, But Do TheyHave Value?: In Italy, Euro Means More andLess.” International Herald Tribune, January 16.
Brennan, Michael J., and Thomas E. Cope-land. 1988a. “Stock Splits, Stock Prices andTransaction Costs.” Journal of Financial Economics,22(1): 83–101.
Brennan, Michael J., and Thomas E. Cope-land. 1988b. “Beta Changes Around Stock Splits:A Note.” Journal of Finance, 43(4): 1009–13.
Byun, Jinho, and Michael S. Rozeff. 2003.“Long-run Performance after Stock Splits: 1927to 1996.” Journal of Finance, 58(3): 1063–86.
Conroy, Robert M., Robert Harris, and BruceBenet. 1990. “The Effects of Stock Splits on Bid–Ask Spread.” Journal of Finance, 45(4): 1285–95.
Copeland, Thomas E. 1979. “Liquidity ChangesFollowing Stock Splits.” Journal of Finance, 37(1):115–41.
Cronqvist, Henrik, Angie Low, and MattiasNilsson. 2009. “Persistence in Firm Policies,Firm Origin, and Corporate Culture: Evidencefrom Corporate Spin-Offs.” EFA 2007 LjubljanaMeetings Paper; Second Singapore Interna-tional Conference on Finance 2008; Charles A.Dice Working Paper No. 2007-1; Fisher Col-lege of Business Working Paper No. 2007-03-001. Available at SSRN: http://ssrn.com/abstract�954791.
Desai, Hemang, and Prem C. Jain. 1997.“Long-Run Common Stock Returns followingStock Splits and Reverse Splits.” Journal of Busi-ness, 70(3): 409–33.
Dolley, James C. 1933. “Common Stock Split-Ups, Motives and Effects.” Harvard Business Review,12(1): 70–81.
Doyle, (Sir) Arthur Conan. 1890. “SherlockHolmes Gives a Demonstration.” Chapter 6 ofThe Sign of Four. (Kessinger Publishing, 2004.)
Durlauf, Steven N., and Lawrence E. Blume,eds. 2008. The New Palgrave Dictionary of Eco-nomics Online. http://www.dictionaryofeco-nomics.com/articles_az (accessed November14).
Dyl, Edward A., and William B. Elliott. 2006.“The Share Price Puzzle.” Journal of Business,79(4): 2045–66.
Easley, David, Maureen O’Hara, and Gideon
Saar. 1998. “How Stock Splits Affect Trading: AMicrostructure Approach.” Journal of Financialand Quantitative Analysis, 36(1): 25–51.
Fama, Eugene F., Lawrence Fisher, MichaelJensen, and Richard Roll. 1969. “The Adjust-ment of Stock Prices to New Information.” Inter-national Economic Review, 10(1): 1–21.
Fama, Eugene, and Kenneth MacBeth. 1973.“Risk, Return, and Equilibrium: EmpiricalTests.” Journal of Political Economy, 81(3): 607–36.
Fernando, Chitru S., Srinivasan Krishnamur-thy, and Paul A. Spindt. 1999. “Is Share PriceRelated to Marketability? Evidence from MutualFund Share Splits.” Financial Management, 28(3):54–67.
Fernando, Chitru S., Srinivasan Krishnamur-thy, and Paul A. Spindt. 2004. “Are Share PriceLevels Informative? Evidence from the Owner-ship, Pricing, Turnover, and Performance ofIPO Firms.” Journal of Financial Markets, 7(4):377–403.
Gompers, Paul Alan, and Josh Lerner. 2003.“The Really Long-Run Performance of InitialPublic Offerings: The Pre-NASDAQ Evidence.”Journal of Finance, 58(4): 1355–92.
Greenwood, Robin. 2008. “Trading Restric-tions and Stock Prices.” Review of Financial Stud-ies, 22(2): 509–39.
Greenwood, Robin, Malcolm Baker, and Jef-frey Wurgler. Forthcoming. “Catering ThroughNominal Share Prices.” Journal of Finance.
Grinblatt, Mark, Ronald W. Masulis, andSheridan Titman. 1984. “The Valuation Effectsof Stock Splits and Stock Dividends.” Journal ofFinancial Economics, 13(4): 461–90.
Hasbrouck, Joel. 2005. “Trading Costs andReturns for US Equities: The Evidence fromDaily Data.” NYU Stern School Department ofFinance Working Paper. Available at SSRN:http://ssrn.com/abstract�388360.
Ikenberry, David L., and Sundaresh Ramnath.2002. “Underreaction to Self-Selected NewsEvents: The Case of Stock Splits.” Review ofFinancial Studies, 15(2): 489–526.
Ikenberry, David L., Graeme Rankine, andEarl K. Stice. 1996. “What Do Stock Splits ReallySignal?” Journal of Financial and QuantitativeAnalysis, 31(3): 357–75.
Jones, Charles M., and Marc L. Lipson. 2003.“Are Retail Orders Different?” http://www2.gsb.columbia.edu/faculty/cjones/RetailNYSE5.pdf.
Kadapakkam, Palani-Rajan, Srinivasan Krish-namurthy, and Yiuman Tse. 2005. “Stock Splits,Broker Promotion, and Decimalization.” Journalof Financial and Quantitative Analysis, 40(4): 873–95.
Kaplan, Steven N., and Luigi Zingales. 1997.
The Nominal Share Price Puzzle 141
“Do Financing Constraints Explain Why Invest-ment is Correlated with Cash Flow?” QuarterlyJournal of Economics, 112(1): 169–215.
Kaplan, Steven N., and Luigi Zingales. 2000.“Investment–Cash Flow Sensitivities Are NotValid Measures of Financing Constraints.” Quar-terly Journal of Economics, 115(2): 707–12.
Lakonishok, Josef, and Baruch Lev. 1987.“Stock Splits and Stock Dividends: Why, Whoand When.” Journal of Finance, 42(4): 913–32.
La Monica, Paul R. 2006. “Google Jumps Past$500: No. 1 Search Engine Tops Mark for FirstTime, Is Up Nearly Sixfold since Going Public.”CNNMoney.com, November 21. http://money-.cnn.com/2006/11/21/technology/google/in-dex.htm.
McNichols, Maureen, and Ajay Dravid. 1990.“Stock Dividends, Stock Splits, and Signaling.”Journal of Finance, 45(3): 857–79.
Miller, Merton H., and Franco Modigliani.1961. “Dividend Policy, Growth, and the Valua-tion of Shares.” Journal of Business, 34(4): 411–33.
Mishel, Lawrence, Jared Bernstein, and SylviaAllegretto. 2005. The State of Working America,2004/2005. An Economic Policy Institute Book.”Ithaca, NY: ILR Press.
Muscarella, Chris J., and Michael R. Vet-suypens. 1996. “Stock Splits: Signaling or Liquid-ity? The Case of ADR ‘Solo splits.’” Journal ofFinancial Economics, 42(1): 3–26.
Richardson, Karen. 2005. “Mr. MaguireTrades One Stock All Day Long; A Throwback toa Bygone Era, Berkshire Hathaway ‘Specialist’ IsIn Charge of Only Those Shares.” Wall StreetJournal (Eastern edition), Nov 12, p. B.1.
Rozeff, Micheal S. 1998. “Stock Splits: Evi-dence from Mutual Funds.” Journal of Finance,53(1): 335–49.
Ryser, Jeff. 1996. “Split Opinions.” CFO, Sep-tember, pp. 82–85.
Scholes, Myron S., and Mark A. Wolfson.1989. “Decentralized Investment Banking: TheCase of Discount Dividend-Reinvestment andStock-Purchase Plans.” NBER Working PaperNo. W3093. Available at SSRN: http://papers.ssrn.com/sol3/papers.cfm?abstract_id�238172.
Warneryd, Karl. 1994. “Transaction Cost, In-stitutions, and Evolution.” Journal of EconomicBehavior & Organization, 25(2): 219–39.
Young, H. Peyton. 2008. “Social Norms.” TheNew Palgrave Dictionary of Economics. 2nd edi-tion. Palgrave Macmillan.
142 Journal of Economic Perspectives

This article has been cited by:
1. GRAEME G. ACHESON, JOHN D. TURNER, QING YE. 2011. The character and denomination ofshares in the Victorian equity market1. The Economic History Review no-no. [CrossRef]
2. David Michayluk, Ruoyun Zhao. 2010. Stock Splits and Bond Yields: Isolating the SignalingHypothesis. Financial Review 45:2, 375-386. [CrossRef]
3. MALCOLM BAKER, ROBIN GREENWOOD, JEFFREY WURGLER. 2009. Catering throughNominal Share Prices. The Journal of Finance 64:6, 2559-2590. [CrossRef]