Embed Size (px)
Citation preview

The Nociceptin System in Inflammation and Sepsis
Dr Alcira Serrano-Gómez
FRCA
Thesis submitted for the degree of Doctor of Medicine (MD)
September 2012
Department of Cardiovascular Sciences, Division of Anaesthesia, Critical Care and Pain Management, Leicester Royal Infirmary
2
The Nociceptin System in Inflammation and Sepsis Dr Alcira Serrano-Gómez. FRCA Nociceptin/OrphaninFQ, N/OFQ, and its receptor NOP represent a non-opioid branch of the opioid family. There is growing interest in the involvement of this system during inflammation and sepsis as it is present in immune cells and modifies immunocyte function. Systemic N/OFQ increased mortality in an animal model of sepsis and there is limited evidence for increased plasma N/OFQ in patients with sepsis who died compared to those who survived. This thesis explores changes in the expression of NOP and ppN/OFQ-mRNA by polymorphs (PMN) and of N/OFQ peptide in plasma during inflammation and sepsis. A further aim was to investigate the relationship between the N/OFQ system with physiological and biochemical indicators of severity of disease. Forty patients undergoing cardiopulmonary bypass (CPB) and 49-patients with sepsis in the Intensive Care Unit (ICU) were recruited into 2-studies. In the CPB study we observed a 57% reduction of NOP-mRNA and a 95% reduction of ppN/OFQ-mRNA expression in PMN. Plasma N/OFQ concentrations increased by over 30%. Higher plasma N/OFQ was associated with lower NOP-mRNA. These changes were related to prolonged aortic cross clamp time. In patients with sepsis there was an 85% reduction of ppN/OFQ-mRNA expression compared to a sample taken after recovery from sepsis. Lower expression of ppN/OFQ-mRNA was associated with increased inotropic support and lactate concentrations on the first day of sepsis. Our data did not show any differences amongst survivors and non-survivors. During inflammation(CPB) and sepsis there was reduced expression of NOP and ppN/OFQ-mRNA with an inverse relationship between plasma N/OFQ(CPB study) and NOP-mRNA expression, suggestive of a possible feedback mechanism. Based on the current evidence (this thesis and literature) we suggest that N/OFQ could contribute to the complex pathophysiological process occurring during inflammation and sepsis and warrant further study.
(300words)

3
ACKNOWLEDGEMENTS
Now that I have finally finished my thesis I would like to thank a number of individuals for all their help in completing this task. I apologise in advance if I have missed any one out. To the Anaesthetic Department at the Leicester Royal Infirmary, I really enjoyed the whole experience and the teamwork it brought. To Dave Lambert and Jonathan Thompson, for all their patience, support and excellent guidance throughout the process. I could not have asked for better supervisors. To John McDonald, who painstakingly taught me all the lab techniques and for being a great listener for lab and non-lab related matters. To Sarah Bowrey, Natalie Rich and Niki Griffin-Teal, the research nurses, who helped me massively with patient recruitment and the data collection and without whom I would not have been able to complete this task. Special thanks to Sarah for her contagious laugh that kept my spirits up, her fantastic organisational skills, and for always knowing what to do and where to find the answers. To the Cardiac Lab at Glenfield General Hospital for providing the facilities and support with recruiting patients for the studies. To Prof Alison Goodall for patiently teaching me how to do flow cytometry. To my research colleagues, Simon Young and Nadia Ladak. Simon guided me through my first steps into research. Nadia was a great research partner and friend, who also introduced me to the pleasures of peppermint tea. To my family in Colombia, for all their love, support and encouragement. Special thanks to my sister Coqui, who for the last 6 months would start each conversation with the words "When are you going to finish your thesis?" Finally to my husband, Aruna and daughter, Katerina for all their love and support. Aruna came into my life at the correct time. I am thankful that he was also doing clinical research at the same time and his knowledge and support was a great source of strength throughout the good and not so good times. Despite being only 9 months old, Katerina inspired me to make the best use of my time. The umpteen times she woke up in the middle of the night for milk encouraged me to continue to work on the thesis instead of returning to a nice warm bed. Her smiles and laughter kept me going and made up for the lack of sleep.

4
Table of Contents
1 Introduction .................................................................................................... 13
1.1 The N/OFQ System.................................................................................. 13
1.2 The N/OFQ system in inflammation and sepsis ....................................... 18
1.3 Pain control by N/OFQ during inflammation and the neuroimmune axis .. 23
1.4 N/OFQ and the Hypothalamic-Pituitary-Adrenal (HPA) axis .................... 27
1.5 Effects of N/OFQ in the cardiovascular system ........................................ 28
1.5.1 Centrally mediated cardiovascular effects ......................................... 29
1.5.2 Peripherally mediated cardiovascular effects .................................... 30
1.6 Leucocytes, PAMPs, DAMPs and CARS ................................................. 34
1.7 Inflammatory markers .............................................................................. 37
1.8 Inflammatory response during Cardiopulmonary bypass (CPB) .............. 39
1.9 Summary .................................................................................................. 40
1.10 Aims ...................................................................................................... 42
1.11 Hypothesis ............................................................................................ 43
2 Methods ......................................................................................................... 44
2.1 Blood collection ........................................................................................ 44
2.2 Polymorphonuclear cell extraction ........................................................... 46
2.3 Cell counter and Flow Cytometry ............................................................. 47
2.3.1 Theory ............................................................................................... 47
2.3.2 FCM materials ................................................................................... 49
2.3.3 FCM Method ...................................................................................... 49
5
2.4 Polymerase Chain Reaction (RT-qPCR) .................................................. 52
2.4.1 Theory ............................................................................................... 53
2.4.2 Materials ............................................................................................ 58
2.4.3 RNA extraction .................................................................................. 59
2.4.4 RNA Quantification ............................................................................ 62
2.4.5 Removal of DNA contamination......................................................... 62
2.4.6 Reverse Transcription (RT) ............................................................... 63
2.4.7 qPCR development ........................................................................... 64
2.5 Radioimmunoassay.................................................................................. 67
2.5.1 Theory ............................................................................................... 67
2.5.2 Materials ............................................................................................ 68
2.5.3 Solid phase extraction ....................................................................... 69
2.5.4 Radioimmunoassay stage ................................................................. 69
2.6 ELISA ....................................................................................................... 73
2.6.1 Theory ............................................................................................... 73
2.6.2 Materials ............................................................................................ 76
2.6.3 ELISA method ................................................................................... 76
2.7 Data collection and analysis software ...................................................... 79
2.7.1 Data analysis ..................................................................................... 79
3 The effect of Cardiac surgery under cardiopulmonary bypass on the N/OFQ
system ................................................................................................................... 81
3.1 Introduction .............................................................................................. 81
3.2 Materials and Methods ............................................................................. 85

6
3.2.1 Patients recruitment and sample collection ....................................... 85
3.2.2 Cardio Pulmonary Bypass pump ....................................................... 86
3.2.3 Blood collection for plasma extraction ............................................... 86
3.2.4 Radioimmunoassay ........................................................................... 87
3.2.5 ELISA ................................................................................................ 87
3.2.6 RT-PCR ............................................................................................. 87
3.2.7 Statistical analysis ............................................................................. 87
3.3 Results ..................................................................................................... 88
3.3.1 Baseline patient characteristics ......................................................... 88
3.3.2 Intra-operative and postoperative data, and physiological variables . 91
3.3.3 NOP and ppN/OFQ mRNA expression by PMN leucocytes ............. 93
3.3.4 Relationship between NOP and ppN/OFQ mRNA ............................. 98
3.3.5 N/OFQ plasma concentrations measured by RIA .............................. 98
3.3.6 Relationship between plasma N/OFQ concentrations and NOP and
ppN/OFQ mRNA expression ........................................................................ 100
3.3.7 Inflammatory markers. Cytokines IL-8, IL-10, TNFα, and MPO ....... 101
3.3.8 Relationship between NOP and ppN/OFQ mRNA expression and
inflammatory markers during inflammation .................................................. 106
3.3.9 Relationship between plasma N/OFQ concentrations and inflammatory
markers ........................................................................................................ 106
3.3.10 Correlation between clinical findings and laboratory results ......... 109
3.4 Discussion .............................................................................................. 111
3.4.1 Plasma N/OFQ ................................................................................ 112

7
3.4.2 NOP and ppN/OFQ mRNA expression by PMN cells ...................... 113
3.4.3 Limitations of the study .................................................................... 114
3.5 Conclusion ............................................................................................. 115
4 Effect of N/OFQ in vitro on NOP and ppN/OFQ mRNA expression by PMN
cells ..................................................................................................................... 116
4.1 Introduction ............................................................................................ 116
4.1.1 Sample collection ............................................................................ 116
4.1.2 Method ............................................................................................ 117
4.1.3 Results ............................................................................................ 118
4.2 Discussion .............................................................................................. 122
4.3 Conclusion ............................................................................................. 123
5 The effect of systemic sepsis on the N/OFQ system ................................... 124
5.1 Introduction ............................................................................................ 124
5.1.1 N/OFQ system and sepsis ............................................................... 127
5.2 Materials and methods ........................................................................... 128
5.2.1 Patients recruitment and sample collection ..................................... 128
5.2.2 RT-PCR ........................................................................................... 129
5.2.3 Blood collection for plasma extraction ............................................. 129
5.3 Statistical analysis .................................................................................. 129
5.3.1 Study power .................................................................................... 130
5.4 Results ................................................................................................... 131
5.4.1 Baseline patient characteristics ....................................................... 132
5.4.2 Physiological variables .................................................................... 133

8
5.4.3 Recovery sub-group patient characteristics, n=22 ........................... 134
5.4.4 Physiological variables, recovery sub-group n=22 .......................... 135
5.4.5 Patient characteristics and physiological variables of 13 patients who
died of sepsis ............................................................................................... 136
5.4.6 NOP and ppN/OFQ mRNA expression by Polymorphonuclear
leucocytes .................................................................................................... 138
5.4.7 Relationship between NOP and ppN/OFQ mRNA expression ........ 144
5.4.8 Relationship between clinical findings and mRNA expression of NOP
and ppN/OFQ ............................................................................................... 144
5.4.9 Survivors and non-survivors NOP and ppN/OFQ mRNA expression ....
........................................................................................................ 150
5.4.10 Correlation between clinical findings and changes in mRNA
expression of NOP and ppN/OFQ in the recovery sub-group, n=22 ............ 151
5.4.11 Inflammatory markers – Clinical and biochemical ........................ 154
5.5 Discussion .............................................................................................. 155
5.5.1 Limitations of this study: .................................................................. 159
5.6 Conclusion ............................................................................................. 160
6 Discussion .................................................................................................... 162
6.1 The effect of cardiopulmonary bypass on N/OFQ .................................. 166
6.1.1 Unexpected findings in the CPB study ............................................ 169
6.2 The effects of sepsis on N/OFQ ............................................................. 170
6.2.1 Unexpected findings in the sepsis study .......................................... 172
6.3 Relevance of the N/OFQ system in inflammation and sepsis ................ 175

9
6.4 Problems encountered during the studies .............................................. 176
6.4.1 CPB study ....................................................................................... 176
6.4.2 Sepsis study .................................................................................... 177
6.5 Suggestions for future research ............................................................. 178
6.6 Conclusion ............................................................................................. 178
7 Appendix ...................................................................................................... 180
7.1 CPB Study: Ethics approval ................................................................... 180
7.2 CPB study: Participant Information Sheet .............................................. 181
7.3 CPB Study: Consent Form ..................................................................... 184
7.4 Sepsis Study: Ethics Approval ............................................................... 185
7.5 Sepsis Study: QED Audit ....................................................................... 186
7.6 Sepsis study: Participant Information Sheet ........................................... 187
7.7 Sepsis study: Consent Form .................................................................. 191
7.8 Sepsis study: Consultee/Relative’s Information Sheet ........................... 192
7.9 Sepsis study: Consultee Consent Form ................................................. 196
7.10 Sepsis study: Research grant letter of approval ................................. 197
7.11 CPB Study: qPCR ΔCt Results for NOP and ppN/OFQ ...................... 199
7.12 Sepsis Study: qPCR ΔCt Results for NOP and ppN/OFQ .................. 203
10
List of Abbreviations
ALT Alanine transaminase
APACHE Acute physiology and chronic health evaluation
AXC Aortic cross clamp
bpm Beats per minute
BSA Bovine serum albumin
COPD Chronic obstructive pulmonary disease
CPB Cardio-pulmonary bypass
cpm Counts per minute
CRH Corticotropin releasing hormone
CRP C-reactive protein
Ct Cycle threshold
CVVH Continuous veno-venous hemofiltration
dl Decilitre
EDTA Ethylenediaminetetraacetic acid
ELISA Enzyme-linked immunosorbent assay
ESR Erythrocyte sedimentation rate
FBS Foetal Bovine Serum
G-CSF Granulocyte colony-stimulating factor
GM-CSF Granulocyte-macrophage colony-stimulating factor
h Hours
Hb Haemoglobin
HR Heart rate

11
IABP Intra aortic balloon pump
IFNγ Interferon gamma
IHD Ischaemic heart disease
IL-1Ra Interleukin-1 receptor anatagonist
IPPV Intermittent positive pressure ventilation
iu International units
kPa Kilopascals
MAP Mean arterial pressure
MCP Monocyte chemo-attractant protein
mg Milligrams
ml Millilitres
MMP Matrix metalloproteinase
MPO Myeloperoxidase
mRNA Messenger Ribonucleic Acid
NIPPV Non-invasive positive pressure ventilation
N/OFQ Nociceptin/Orphanin FQ peptide
NOP Nociceptin/Orphanin FQ receptor
ORL1 Nociceptin.Opioid Receptor-Like
PCT Procalcitonin
PBS Phosphate Buffered Saline
pg.ml-1 picograms per ml
PI Peptidase inhibitor
PMN Polymorphonuclear leucocytes

12
ppN/OFQ pre-pro N/OFQ
RR Respiratory rate
RIA Radioimmunoassay
SIRS Systemic inflammatory response syndrome
SOFA Sequential Organ Failure Assessment
TGF Transforming Growth Factor
TFA Trifluoroacetic acid
TNFα Tumour necrosis factor alpha
µl Micro litres
VEGF Vascular endothelial growth factor
WCC White cell count

13
1 Introduction
1.1 The N/OFQ System
The nociceptin system comprise the peptide nociceptin/orphanin FQ (N/OFQ) and
the N/OFQ receptor (NOP). N/OFQ is a 17 amino acid opioid-like peptide (Phe-
Gly-Gly-Phe-Thr-Gly-Ala-Arg-Lys-Ser-Ala-Arg-Lys-Leu-Ala-Asn-Gln) first described
in 19951;2 with structural similarity to the endogenous κ (or KOP)-opioid dynorphin
A. N/OFQ is produced and released by neurons and other tissues from a 176
amino acid precursor pre-pro N/OFQ (ppN/OFQ).3 Other peptides derive from the
N/OFQ precursor ppN/OFQ, currently Orphanin FQ2 (biologically active), and
Nocistatin (functional antagonist of N/OFQ) have been identified. Neither of these
peptides bind the NOP receptor.4
The metabolism of N/OFQ (also known as Noc or NC) has been investigated in
animal and in human in vitro studies. In mouse brain cortex, aminopeptidase N
metabolises N/OFQ to Noc (2-17); endopeptidase is also involved in the
metabolism of N/OFQ. Noc (1-13) and Noc (1-9) metabolites have been observed
in rat hypoccampus;4 these substances are inactive.
In humans, N/OFQ concentrations have been measured in plasma, CSF and
synovial fluid in healthy controls and patients with a variety of conditions involving
acute and chronic pain. Plasma concentrations of N/OFQ in healthy controls have
been reported between 2.5 - 15 pg.ml-1.5-7 Yu and colleagues studied the
metabolism of N/OFQ in human blood. They sampled incubated human blood with

14
N/OFQ at 15 minute intervals for to 2 hours, and observed multiple metabolites
(mainly Noc (2-17) that had similar pattern to the metabolism of dynorphin A. It is
unknown what the end products and half-life of N/OFQ in vivo is in humans, and
whether they are active or not.
NOP was cloned in 1994 and is an inhibitory G protein coupled receptor (GPCR). It
is a member of the opioid receptor family (International Union of Basic and Clinical
Pharmacology, IUPHAR).8 NOP is distributed widely in the central9, peripheral and
sensory nervous systems, as well as other peripheral tissues.10;11 In the human
brain, NOP is found all throughout, but more abundant in cortical areas,
hypothalamus, thalamus, and striatum.9 In the rat spinal cord it is located in the
grey matter of dorsal and ventral horns.12 In peripheral tissues NOP has been
identified in human right atrium,11 immune cells9;13-17 mouse splenic lymphocytes,
rat intestine, porcine gastrointestinal tract and kidney, and guinea-pig sympathetic
ganglia.12
Much of the original work on the N/OFQ-NOP system centered around its complex
involvement in pain pathways: N/OFQ produces analgesia when administered at
spinal sites and hyperalgesia/anti-opioid actions when administered
supraspinally.18 N/OFQ also causes hypotension and bradycardia when
administered at central and peripheral sites (central: intracerebroventricular, rostral
ventrolateral medulla, and paraventricular nucleus of the hypothalamus. Peripheral:
intravenous, and into mesenteric vessels).19-21 The effect of N/OFQ on gastric
motility and acid secretion by the stomach varies depending on whether it is

15
administered central or peripherally. Intracerebroventricular administration of
N/OFQ inhibits contractility of the gastro-intestinal tract and reduces gastric acid
secretion; on the other hand, intraperitoneal N/OFQ increases gastric acid
secretion without changes on gastric emptying.18 Various other functions have
been attributed to N/OFQ as seen in Figure 1-1. It is unclear why some of the
N/OFQ and other NOP agonists actions are different and even opposite when
administered centrally vs peripherally. The extensive location of NOP throughout
the body and the diversity of effects that NOP ligands can cause in multiple
systems, will pose a challenge when the time comes to develop pharmacological
agents for the treatment of specific conditions.
There is now good evidence to support a role for this relatively new peptide-
receptor system in regulating other physiological functions, e.g. the cardiovascular,
hypothalamic-pituitary-adrenal (HPA) axis and immune systems. Binding of N/OFQ
to NOP causes a variety of cellular actions (Figure 1-2), which in neurones
reduces excitability and transmitter release (e.g. glutamate, serotonin,
noradrenaline and tachykinins)18. A vast array of experimental NOP ligands are
available of both peptide/non-peptide and agonist/antagonist nature. Of relevance
are the peptide and non-peptide antagonists UFP-101 and J113397 respectively.18
There are a growing number of in vitro and in vivo studies showing that; (1)
N/OFQ-NOP expression in cells of the immune system enables
immunomodulation, and (2) N/OFQ-NOP has important cardiovascular modulatory
effects. Notably there is growing evidence of the involvement of the N/OFQ system

16
in sepsis and the inflammatory response. In the following sections this evidence is
examined and the links between (1) and (2) are made with respect to sepsis.
Figure 1-1Schematic representation of the different functions of N/OFQ. Taken
from Nature Reviews18

17
Figure 1-2. Cellular effects of NOP activation. When N/OFQ binds NOP it has a
number of actions: 1) inhibits adenylyl cyclase, leading to reduced formation of
cAMP; 2) closes the voltage-gated Ca2+ channels; and 3) opens the inwardly
rectifying K+ channels. These actions reduce neuronal excitability and
neurotransmitter release (glutamate, serotonin, noradrenaline and tachykinins)18.
NOP also induces activation of mitogen-activated protein kinases (MAPK) and its
subtypes: extracellular-signal regulated kinases (ERKs)13 and c-Jun NH2-terminal
kinases (JNK). MAPK regulate various cellular actions such as gene expression,
mitosis, cell differentiation, survival and apoptosis.22 Activation of PLC is
controversial. Block arrows indicate activation, dashed arrows inhibition. NOP:
nociceptin/orphaninFQ receptor; AC: adenylyl cyclase; cAMP: cyclic AMP; PKA:
protein kinase A; PIP2: phosphatidylinositol biphosphate; PLC: phospholipase C;
DAG: diacylglycerol; IP3: inositol triphosphate; PKC: protein kinase
K+
Ca2+
NOP
AC
ATP cAMP
PKA
PLC
PIP2
DAG +
IP3
PKC Ca2+

18
1.2 The N/OFQ system in inflammation and sepsis
NOP and N/OFQ precursor (ppN/OFQ) mRNA are found in monocytes,
lymphocytes and polymorphonuclear cells9;14;15 (Table 1-1). This is not the case
with the other classical opioid receptors (mu;MOP, delta;DOP and kappa;KOP).16
Cells studied Target found Reference
Lymphocytes &
monocytes
NOP Peluso, 19989
Arjomand, 200223
PMN, lymphocytes,
monocytes
NOP and ppN/OFQ Fiset, 200314
PBMC NOP and ppN/OFQ Williams, 200716
Williams, 200815
PMN NOP and ppN/OFQ Young, 200817
Table 1-1 Distribution of the N/OFQ system in human peripheral blood
immunocytes. RT-PCR studies. PMN: polymorphonuclear cells. PBMC: peripheral
blood mononuclear cells.
In vitro studies show N/OFQ to be produced by immunocytes and to act as an
immunomodulator (Table 1-2). Its effects are mainly pro-inflammatory, e.g.
induction of chemotaxis and proliferation of immune cells. However, some studies
showed reduced immune cell proliferation and reduced chemokine production.
These differences could be attributed to differences in techniques used to activate
immune cells, cell population studied and the response analysed.

19
Cell Treatment Response Reference
CD4+ T cells SEB + N/OFQ cell proliferation with
N/OFQ
Easten,
200924
PMN N/OFQ Chemotaxis of PMN Serhan,
200125
Lymphocytes SEB + N/OFQ cell proliferation with
N/OFQ
Waits,
200426
Monocytes N/OFQ
Monocytes chemotaxis Trombella,
200527 PMN No effect on PMN
PBMC PHA + N/OFQ
50% of samples showed
cell proliferation
50% no effect.
Peluso,
200128
Rat
splenocytes
LPS, Con A, IL-
1, TNF,
dexamethasone
N/OFQ production Miller,
200729
Monocytes
CD14+
N/OFQ and
LPS + N/OFQ
production of
chemokines by monocytes
Kaminsky,
200830
Table 1-2 In vitro studies of N/OFQ in volunteer and animal samples. Different cell
populations were treated with either N/OFQ or toxins and their response analysed.
SEB: Staphylococcal Enterotoxin B. LPS: Lipopolysacharide. ConA: ConvalinA. IL-
1: Interleukin 1. TNF: Tumour Necrosis Factor. PHA: phytohaemagglutinin.
20
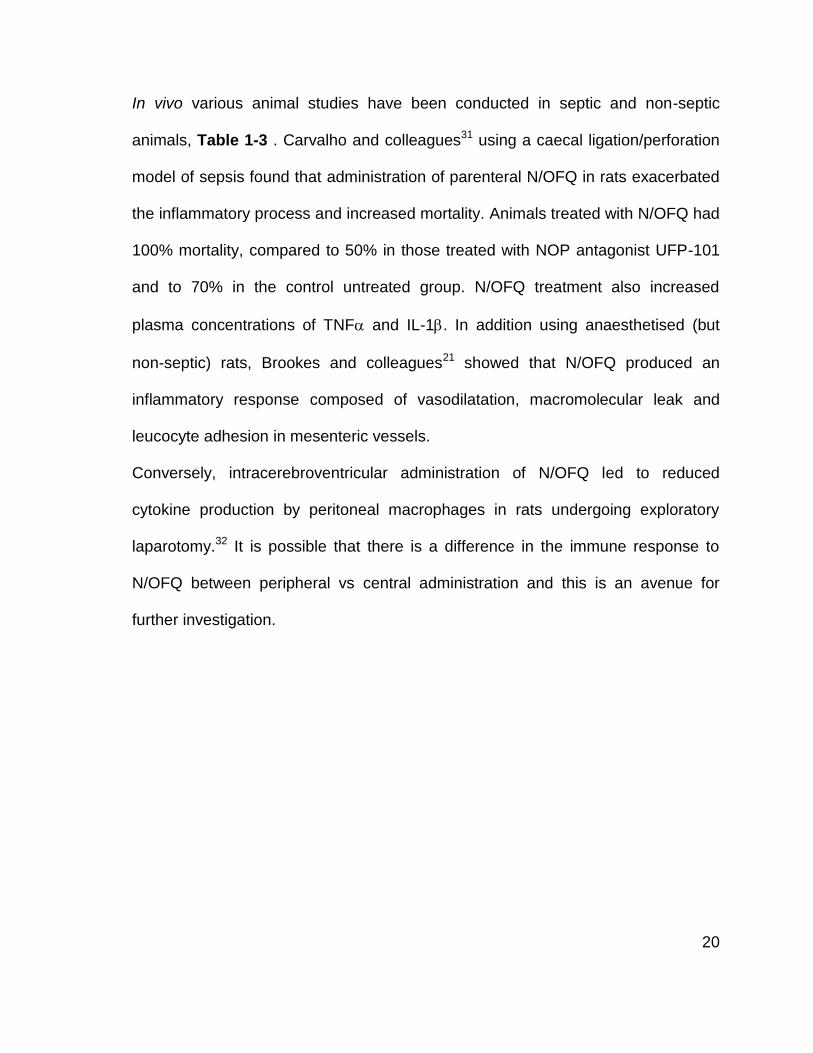
In vivo various animal studies have been conducted in septic and non-septic
animals, Table 1-3 . Carvalho and colleagues31 using a caecal ligation/perforation
model of sepsis found that administration of parenteral N/OFQ in rats exacerbated
the inflammatory process and increased mortality. Animals treated with N/OFQ had
100% mortality, compared to 50% in those treated with NOP antagonist UFP-101
and to 70% in the control untreated group. N/OFQ treatment also increased
plasma concentrations of TNF and IL-1. In addition using anaesthetised (but
non-septic) rats, Brookes and colleagues21 showed that N/OFQ produced an
inflammatory response composed of vasodilatation, macromolecular leak and
leucocyte adhesion in mesenteric vessels.
Conversely, intracerebroventricular administration of N/OFQ led to reduced
cytokine production by peritoneal macrophages in rats undergoing exploratory
laparotomy.32 It is possible that there is a difference in the immune response to
N/OFQ between peripheral vs central administration and this is an avenue for
further investigation.

21
Model Intervention Observations Reference
Anaesthetised
rats
iv N/OFQ On mesenteric vessels:
leucocyte rolling &
adhesion,
macromolecular leak,
blood flow
vasodilatation
Brookes,
200721
Septic rats (CLP) Group 1: sc N/OFQ
Group 2: UFP-101
Group 3: Control
Group 1 mortality 100%
Group 2 mortality 50%
Group 3 mortality 70%
Carvalho,
200831
Rats undergoing
exploratory
laparotomy
icv N/OFQ production of IL-1 and
TNF by peritoneal
macrophages.
Zhao,
200232
Table 1-3 In vivo animal studies showing the response to N/OFQ administration. iv:
intravenous. sc: subcutaneous. icv: intracerebroventricular. CLP: caecal ligation
and perforation. UFP-101: NOP antagonist.
There are few data in humans and to date only two observational studies in septic
patients have been published,33;34 Table 1-4. In a small study of 21 critically ill
patients admitted to ICU with a diagnosis of sepsis, our research group measured
plasma N/OFQ concentrations over 4 consecutive days. Plasma concentrations of
N/OFQ on the day of admission to ICU were higher in patients who subsequently
died (n=4) compared to those who survived (n=17) (median [IQR] concentrations

22
3.0 [2.5-5.0] and 1.0 [1.0-2.5] pg ml-1 respectively).33 It is worth noting that these
concentrations were lower overall than those reported in the literature from healthy
control patients (5 – 15pg.ml-1). Stamer and colleagues34 recently reported reduced
ppN/OFQ mRNA expression in peripheral blood cells in 18 critically ill patients with
sepsis, and increased NOP mRNA expression in non-survivors of sepsis,
compared with healthy controls. More data are required to confirm these findings
.
Population studied
Response studied Observations Reference
21 ICU septic
patients
Plasma
concentrations of
N/OFQ
Plasma N/OFQ
concentrations higher in
patients who died (n=4)
compared to survivors
(n=17)
Williams,
200833
18 ICU patients
with severe
sepsis
NOP and ppN/OFQ
mRNA expression in
peripheral blood
cells
↑NOP mRNA in septic
patients who died (n=9)
↓ppN/OFQ mRNA in
septic patients
compared to controls.
Stamer,
201134
Table 1-4 Human studies of the N/OFQ system during sepsis.
Further supporting evidence for the role of N/OFQ in the inflammatory response
comes from gene NOP knockout (NOP-/-) mice where the gene for NOP is absent.
Kato et al35 induced colitis in mice by giving oral dextran sulfate sodium (DSS).
They compared wild-type mice (non-genetically modified, NOP+/+) to NOP-/- mice.

23
Administration of DSS caused bloody diarrhoea in the NOP+/+ group compared to
normal stools in the NOP-/- group. On histological examination, the colon of NOP+/+
mice had crypt distortion and increased numbers of lymphocytes, macrophages
and neutrophils (evidence of colitis), compared to normal crypts and reduced
numbers of inflammatory cells in the NOP-/- group. This demonstrated that the
absence of NOP significantly reduced the inflammatory response to a known pro-
inflammatory stimulus (DSS).
1.3 Pain control by N/OFQ during inflammation and the neuroimmune axis
Pain is one of the cardinal features of inflammation and is mediated by
prostaglandins, substance P, histamine and other substances.
Endogenous opioids provide analgesia by increasing the number of opioid
receptors and the availability of endogenous opioid peptides at the site of
inflammation. Opioid receptors are up-regulated in the terminal nerve endings at
sites of inflammation; this can be attributed to increased synthesis of receptors in
the dorsal root ganglia36 and increased intra-axonal transport of receptors to the
terminal nerve endings (a process mediated by IL-1).37 The highest concentration
of opioid peptides available at the inflammatory site comes from lymphocytes,
monocytes, PMN and macrophages. These immunocytes, during inflammation,
have an increased expression of β-endorphin, met-enkephalin and dynorphin-A
which is stimulated by endotoxins, viruses, IL-1 and corticotropin releasing
hormone (CRH), (Figure 1-3). When leucocytes migrate into the inflamed tissue
they release these endogenous opioids.38;39 This mechanism of analgesia by

24
endogenous opioids acting at peripheral sites has been suggested by Stein and
others as being part of a physiological neuroimmune axis.40
Figure 1-3 Schematic representation of the neuroimmune axis. Classical opioid
receptors (MOP: mu; DOP: delta and KOP: kappa) are up-regulated in the
terminal nerve endings at sites of inflammation due to increased synthesis in the
dorsal root ganglia and increased intra-axonal transport to the terminal nerve
endings. Immunocytes at the inflammatory site have increased expression of β-
endorphin, met-enkephalin and dynorphin-A.DRG, dorsal root ganglion.
MOP
DOP
KOP
NOP
DRG
MOP
DOP
KOP
NOP
β-Endorphins
Met-enkephalins
Dynorphin-A
Inflammation
MOP
DOP
KOP
NOP

25
NOP has a similar distribution to classical opioid receptors in the dorsal root
ganglion,41 neuronal tissue,42 and is also present in leucocytes.9 Agostini et al43
examined the anti-nociceptive effect of N/OFQ in an animal model of bowel
inflammation comparing peripheral and centrally administered N/OFQ.
Intraperitoneal administration of N/OFQ reduced the painful response to colorectal
distension in rats with induced colitis; in contrast there was no effect when N/OFQ
was administered via the intracerebroventricular route. Administration of the
N/OFQ antagonist UFP-101 increased the painful response to colorectal distension
and antagonised the anti-nociceptive effect of N/OFQ. An increased number of
cells positive for NOP and myeloperoxidase activity (a marker of PMN granulation)
were observed in a segment of distal colon, which confirmed the infiltration of
immunocytes into the inflamed tissue. These findings support the hypothesis that
N/OFQ may act peripherally as an analgesic at sites of inflammation. More
classical modulation by N/OFQ of the pain response is covered extensively by
Zeilhofer et al44 and Lambert et al18 and is represented in Figure 1-4 .
26
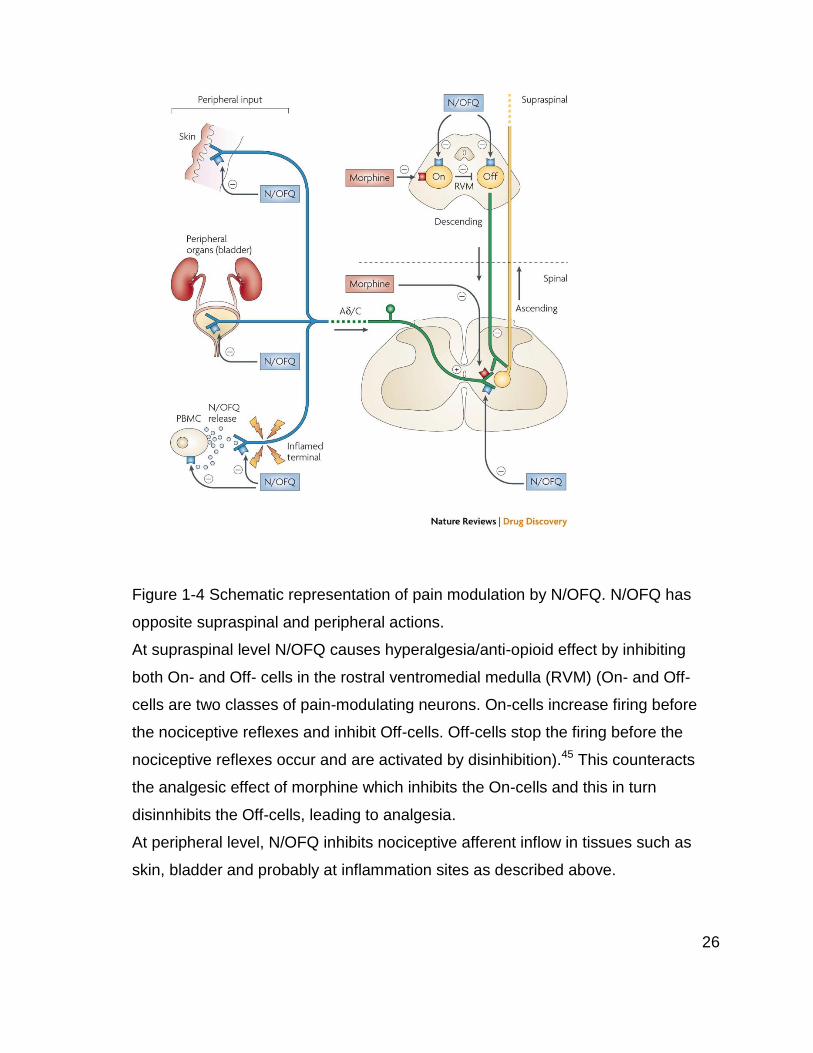
Figure 1-4 Schematic representation of pain modulation by N/OFQ. N/OFQ has
opposite supraspinal and peripheral actions.
At supraspinal level N/OFQ causes hyperalgesia/anti-opioid effect by inhibiting
both On- and Off- cells in the rostral ventromedial medulla (RVM) (On- and Off-
cells are two classes of pain-modulating neurons. On-cells increase firing before
the nociceptive reflexes and inhibit Off-cells. Off-cells stop the firing before the
nociceptive reflexes occur and are activated by disinhibition).45 This counteracts
the analgesic effect of morphine which inhibits the On-cells and this in turn
disinnhibits the Off-cells, leading to analgesia.
At peripheral level, N/OFQ inhibits nociceptive afferent inflow in tissues such as
skin, bladder and probably at inflammation sites as described above.

27
1.4 N/OFQ and the Hypothalamic-Pituitary-Adrenal (HPA) axis
The hypothalamus is involved in regulation of the stress response through the
production of steroids and in particular cortisol via the feedback system of the HPA
axis. Corticotropin releasing hormone (CRH), produced in the hypothalamus,
controls the release of adrenocorticotropic hormone (ACTH) from the anterior
pituitary, which in turn regulates the release of glucocorticoids (mainly cortisol)
from the adrenal cortex.46 Cortisol facilitates the normal response of
catecholamines (adrenaline and noradrenaline), angiotensin and vasopressin, up-
regulates receptor expression and has anti-inflammatory effects: 1) reduction of the
function and number of lymphocytes, monocytes, neutrophils and eosinophils at
the site of inflammation; 2) reduction of macrophage adhesion to the endothelium
and 3) reduction of IL-2 production from macrophages.47
N/OFQ activates the HPA axis under resting and mild stress conditions.
Intracerebroventricular injection of N/OFQ in rats led to increased plasma
corticosterone48 and ACTH concentrations49 for up to 30 minutes under resting
conditions. N/OFQ administered to rats under mild stress, enhanced the raised
ACTH response to stress and prolonged the higher concentrations of
corticosterone. Under a more stressful stimulus like restraint,
intracerebroventricular N/OFQ did not affect the already increased plasma
concentrations of ACTH or corticosterone.49 Leggett et al50 also observed

28
increased CRH mRNA expression in the paraventricular nucleus of the
hypothalamus in rats after intracerebroventricular N/OFQ administration.
These data show the potential effects of N/OFQ on HPA axis activity. Whether
these effects occur during an episode of systemic inflammation and lead to
maintenance of plasma hormone concentrations or to an immunosuppressant
effect has yet to be determined. Further data are required.
1.5 Effects of N/OFQ in the cardiovascular system
Activation of the immune system during inflammation and sepsis can cause
significant cardiovascular changes leading to hypotension, hypo-perfusion and
subsequent multi-organ failure. Endogenous and exogenous opioids have
important cardiovascular effects.51 Similarly, N/OFQ causes hypotension and
bradycardia when administered intravenously and intracerebroventricularly, as
demonstrated by various in vitro and in vivo animal studies and this has been
covered extensively in previous reviews.18;52 Different mechanisms of action have
been proposed and here we concentrate on the data which suggest an immuno-
vascular link.

29
1.5.1 Centrally mediated cardiovascular effects
The central nervous system contributes to the cardiovascular response during
inflammation via the hypothalamic-pituitary-axis, the sympathetic nervous system
and the cholinergic anti-inflammatory pathway.53 Over the past fifteen years it has
been found that NOP, N/OFQ and ppN/OFQ are present in areas of animal and
human brains associated with cardiovascular regulation. ppNOF/Q mRNA has
been isolated from brainstem in mice;54;55 NOP has been identified in the
hypothalamus56 and brainstem57 of human foetus and adult rats; and N/OFQ is
found in rat and human (neonatal deaths or foetal losses) brainstem57.
In vivo, administration of intracerebroventricular N/OFQ in mice caused a dose-
dependent drop in blood pressure and heart rate.19;20 These cardiovascular
changes had a rapid onset (< 1 minute) with a peak effect at 20 mins, and duration
of 40 – 50 mins. Pre-treatment with intracerebroventricular UFP-101, abolished the
cardiovascular response to N/OFQ.19
Notably the administration of intracerebroventricular UFP-101 alone in mice, also
led to significant bradycardia for up to 2 hrs.19 A similar finding was also reported in
conscious rats.58 This may be due to a weak partial agonist effect of centrally
administered UFP-101 when NOP expression is high. N/OFQ has also been
injected in more specific areas of the brain thought to be involved with the
regulation of the cardiovascular system: the rostral ventrolateral medulla (RVLM)
and the paraventricular nucleus of the hypothalamus. Direct administration into
30
these areas caused dose-dependent bradycardia and hypotension in
anaesthetised rats.59 Using comparable doses to those used in the
intracerebroventricular studies, the cardiovascular effects also had a rapid onset
and similar duration of 30 to 60 mins. Pre-treatment with the NOP antagonist
[Phe1ψ(CH2-NH)Gly2]N/OFQ(1–13)NH2 blocked the cardiovascular response to
N/OFQ. This NOP antagonist peptide was originally described as an antagonist in
the vas deferens where expression of NOP is low,60 but subsequent work has
revealed partial agonist activity.61;62
Burmeister and colleagues20 compared the effects of intracerebroventricular
N/OFQ in wild-type NOP+/+ and NOP knockout NOP-/- mice. Basal values for mean
arterial pressure and heart rate were similar in both groups. On administration of
intracerebroventricular N/OFQ, significant hypotension and bradycardia occurred in
NOP+/+ mice, in contrast to no cardiovascular changes in NOP-/- mice. These data
show the cardiodepressant effect of N/OFQ to be mediated by NOP when N/OFQ
is administered centrally in healthy animals. It is unknown whether the expression
of the N/OFQ system in the brain is altered during sepsis; however, current
evidence suggests this may be an option worthy of study.
1.5.2 Peripherally mediated cardiovascular effects
Multiple mechanisms are involved in the cardiovascular response that occurs
during inflammation and sepsis. The N/OFQ system is present in the immune cells

31
and activated as a response to inflammatory stimulus. Activation of immunocytes
and the release of N/OFQ possibly have an effect on vascular reactivity.63 N/OFQ
causes vasodilatation and increased capillary leak from mesenteric vessels that
could be a potential target during inflammation.21
The peripheral actions of N/OFQ have been noted by the cardio-depressor
response observed after intravenous administration of N/OFQ in anaesthetised
rats,21;64 guinea pigs65 and conscious mice66. These studies used similar doses of
N/OFQ, between 10 and 100 nmol.kg-1, and demonstrated dose-dependent
bradycardia and hypotension of nearly 30%,65 which lasted around 10 minutes.
These cardiovascular effects were antagonised by pre-treatment with UFP-101.
Based on evidence from animal studies (Figure 1-5) there are 4 potential
mechanisms for the peripheral effects of N/OFQ:
1) pre-synaptic inhibition of noradrenergic neurotransmission;
2) direct arterial vasodilatation with reduced blood flow;
3) histamine mediated,
4) via the parasympathetic nervous system (PNS).

32
Figure 1-5 Suggested peripherally mediated mechanisms of action of N/OFQ in the
cardiovascular system.
Direct arterial vasodilatation
Histamine mediated
PNS-mediated bradycardia
Pre-synaptic inhibition of noradrenergic neurotransmission
N/OFQ in vitro:
contractility of mesenteric arteries to EFS by over 50%*
N/OFQ In vivo:
plasma Noradrenaline concentrations of up to 46%**
NOP mRNA is present and functional in human aorta and umbilical vein endothelium§ N/OFQ in vitro:
rat mesenteric arteries diameter§§ N/OFQ In vivo:
rat hindquarters
perfusion pressure§§§
N/OFQ-induced vasodilatation of mesenteric vessels in anaesthetised rats was inhibited by ranitidine (H2 antagonist)¤
Vagotomy prevented bradycardic response to iv N/OFQ˜
Peripheral cardiovascular
effects of N/OFQ
Bradycardia, hypotension and vasodilatation
Ev
ide
nc
e
Pro
po
sed
me
ch
an
ism
C
lin
ical
eff
ect

33
PNS: parasympathetic nervous system. EFS: Electrical field stimulation. NA:
Noradrenaline.
* In rat mesenteric arteries67 and anococcygeal smooth muscle68. Pre-contracted
arteries with noradrenaline were not antagonised by N/OFQ.
**In anaesthetised guinea pigs65
§ Endothelial cells were exposed to N/OFQ and showed some functionality by
activating protein kinases.13
§§ Rat mesenteric arteries were pre-constricted with a thromboxane A2 agonist.69;70
N/OFQ caused a dose-dependant increase in vessel diameter, which was not
affected by removal of endothelium, exposure to nitric oxide synthase inhibitor,
atropine or phentolamine.
§§§ A response that was not altered by exposure to nitric oxide synthase inhibitor.70
¤Brookes21
˜N/OFQ iv 10, 30 and 100 nmol.kg-1, caused transient bradycardia and hypotension
in anaesthetised rats. Post- bilateral vagotomy, the animals had less bradycardia to
N/OFQ but the hypotensive response did not change significantly.64

34
1.6 Leucocytes, PAMPs, DAMPs and CARS
The human body responds to trauma, injury or infection by mounting an
inflammatory response. The immune system defends the organism via innate and
acquired immune responses, and is responsible for the degree of local or systemic
inflammation. Leucocytes are part of the innate immune system and in normal
circumstances count varies between 4 – 11 x 109/l. Leucocytes are classified as
neutrophils (40 – 75%), lymphocytes (20 – 50%), monocytes (2- 10%), eosinophils
(1- 6%) and basophils (<1%).71 Lymphocytes and monocytes are mononuclear
cells (PBMC) whilst neutrophils, eosinophils and basophils are polymorphonuclear
cells (PMN), (Figure 1-6). Of these, the neutrophils are the most important in the
pathogenesis of the inflammatory response.
Neutrophilic leucocytosis, occurs commonly in bacterial infection, stress, smoking,
pregnancy and following exercise. Lymphocytic leucocytosis, is more commonly
seen in viral infections, e.g. infectious mononucleosis, pertussis, or in lymphocytic
leukemias.
The response to sepsis evolves over time as a dynamic and complex process.
Activated neutrophils express toll-like receptors (TLRs) which recognize specific
molecules produced by microbial pathogens (pathogen-associated molecular
patterns (PAMPs). Lipo-polysaccharides, peptidoglycans, bacterial lipoprotein, and
bacterial RNA are examples of PAMPs which are only produced by bacteria.
Activation of TLRs cause activation of several signalling pathways amongst which
are the release of pro-inflammatory cytokines (IL-1β, TNFα, leukotrienes),

35
antimicrobial peptides, and reactive oxygen species.72 When host cell colonisation
and damage occurs, there is production of 'alarmins' or 'danger-associated
molecular patterns' (DAMPs) molecules which, in the same way as PAMPs,
activate TLRs. This cross-reactivity of TLR to both PAMPS and DAMPS worsen
the inflammatory response.(72, Bianchi 2007).
Persistent exposure to PAMPs reduces TLRs signalling and therefore reduces
production of pro-inflammatory cytokines with up-regulation of TLR inhibitors. The
development of a compensatory anti-inflammatory response syndrome (CARS),
which seems to occur simultaneously with the pro-inflammatory response, is
characterized by the release of cytokines such as IL-10, IL-1 receptor antagonist
(IL-1ra), IL-4, prostaglandins and immuno-modulatory hormones.73 Serum
concentrations of both pro- and anti-inflammatory cytokines are raised early on
during sepsis. As sepsis progresses an anti-inflammatory immunosuppressive
state develops with opportunistic secondary infections that persist even after the
pathogen has been cleared. Morbidity and mortality during SIRS and sepsis is
likely to be due to both, an excessive pro-inflammatory response to tissue damage
(infective or non-infective) and the opposing compensatory anti-inflammatory
response syndrome. These are the basis of sepsis and multi-organ failure.74;75
We have chosen to study the expression and changes of the N/OFQ system during
inflammation and sepsis in polymorphonuclear cells.

36
Figure 1-6 Schematic diagram of leucocyte classification. PBMC, peripheral blood mononuclear cell. Pictures taken
from http://en.wikipedia.org/wiki/White_blood_cell - Accessed on 30 April 2012.
Leucocytes
Mononuclear cells
PBMC
Polymorphonuclear cells
PMN
Lymphocytes
20 - 50%
Monocytes
2 – 10%
Neutrophils
40 – 75%
Eosinophils
1 – 6%
Basophils
<1%
37
1.7 Inflammatory markers
Inflammation, tissue injury and sepsis are some of the conditions that trigger a
pathophysiological cascade involving release of acute phase proteins and
cytokines. Acute phase proteins either increase or decrease (positive or
negative response) by at least 25% during an inflammatory response. Positive
acute phase proteins include CRP (C-reactive protein), amyloid, fibrinogen,
alpha-1-antitrypsin, IL-1Ra (receptor antagonist), haptoglobin, and ferritin.
Negative acute phase proteins include albumin, alpha-foetoprotein and
transferrin.76 The erythrocyte sedimentation rate (ESR) is a non-protein marker
of inflammation that reflects the presence of acute phase proteins by increased
plasma viscosity. Plasma concentrations of acute phase proteins and cytokines
often represent the presence of an inflammatory process and its severity.
However, they are also affected by chronic conditions, age, sex, and are not
specific to a particular disease, and do not change uniformly in all patients with
the same condition.76;77
Changes of the acute phase proteins occur mainly due to cytokines. Innate
immune cells, i.e. macrophages, monocytes, lymphocytes, neutrophils and
dendritic cells generate and release various pro- and anti- inflammatory
cytokines. Pro-inflammatory cytokines promote the development and
maintenance of the inflammatory response and include IL-1, IL-6, IL-8, IL-12, IL-
18, TNFα, G-CSF (granulocyte colony-stimulating factor), GM-CSF
(granulocyte-macrophage colony-stimulating factor), and interferon γ (IFN
gamma).78 IL-1, IL-6, TNF-α, and IFNγ are considered to be the main inducers
of the inflammatory cascade, they play an important role in initiating other

38
cytokines that make up the immune response to infection.76;78 The TNFα
receptor has the ability to activate multiple signal transduction pathways and the
ability to induce or suppress genes such as those for growth factors, cytokines,
transcription factors and acute phase proteins.79 TNFα is an inflammatory
marker during sepsis and has also been a therapeutic target; however, various
trials have failed to demonstrate improvement in mortality.80;81
Anti-inflammatory cytokines IL-1Ra, IL-4, IL-6, IL-10, IL-11, and IL-13 limit the
inflammatory response.82 IL-10 inhibits the production of TNF-α, IL-6 and IL-8
by monocytes.78;83 The balance maintained between pro- and anti- inflammatory
cytokines determines the severity of the inflammatory response and disease.
Various studies have looked into immunomodulatory therapy in vitro and in vivo
in animal and human studies with disappointing results. Furthermore, animal
studies do not necessarily have the same response in humans. An animal
model of sepsis by caecal ligation and perforation (CLP) showed inhibition of IL-
6, myeloperoxidase, and reduced mortality when treated with JTE-607, an
inhibitor of cytokine (IL-6, IL-8, TNFα, IL-1β, IL-10, IL-1ra, and GM-CSF)
production.84 In a human model of endotoxemia, JTE-607 decreased endotoxin-
induced IL-10 and IL-1ra production.85 Other immunomodulators that have been
researched are recombinant human IL-1ra, which did not improve mortality of
patients with severe sepsis in a multi-centre clinical trial,86 and toll-like receptor
4 antagonist, eritoran tetrasodium, did not show changes in mortality compared
to placebo in 300 critically ill patients with severe sepsis.87 The multiple
pathways involved in the pathophysiology of sepsis, and redundant signalling
pathways may explain the difficulties in developing immunomodulatory therapy
in critically ill patients with sepsis.

39
PMN cells when activated, also release myeloperoxidase (MPO),88 matrix-
metalloproteinases (MMPs), PMN elastases and oxygen-free radicals.89
Myeloperoxidase (MPO) is the most abundant protein in PMN cells,88 stored in
the azurophilic granules, and is also found to a lesser extent in monocytes. The
infiltration of PMN cells into inflamed tissues can be assessed by determining
MPO activity. MPO contributes to PMN cell recruitment, killing of
microorganisms engulfed by neutrophils and monocytes, and can be released
outside the cell and cause damage to an extracellular target.90 MPO plasma
concentration is increased in conditions such as SIRS, sepsis,91 and acute
myocardial infarction92
Procalcitonin (PCT) is another marker of inflammation and sepsis that has been
shown to be superior to CRP in the diagnosis of sepsis.93;94 However, there are
conflicting views in the accuracy of PCT in differentiating infective and non-
infective SIRS, and its ability to determine prognosis and mortality from
sepsis.93;95-97
1.8 Inflammatory response during Cardiopulmonary bypass (CPB)
CPB during cardiac surgery is used to maintain perfusion to the brain and other
vital organs, provide cardiac and pulmonary protection, and maintain
thermoregulation for organ protection while providing appropriate conditions to
the surgeons to perform cardiac surgery. The use of an extracorporeal circuit in
CPB involves non-pulsatile flow, contact of blood with foreign surfaces, changes
in venous pressure and core temperature and ischemia-reperfusion injury. All of

40
these trigger the release of inflammatory cytokines, activation of endothelial
cells, complement, kinin and coagulation cascades and activation of the innate
immune system. Activated PMN cells release proteolytic enzymes: MPO
(myeloperoxidase), MMPs (matrix-metalloproteinases), PMN elastases and
oxygen-free radicals, all of which promote organ dysfunction. PMN cell
activation is enhanced by raised cytokines.88;89
Non-pulsatile flow, ischemia-reperfusion injury and alterations in blood flow
have potential deleterious effects that can lead to myocardial injury, lung injury,
renal dysfunction, neurologic dysfunction, bleeding and coagulopathy.98-100
Extensive research has been conducted in patients undergoing cardiac surgery
under CPB in order to decrease and understand the inflammatory response to a
non-infective inflammatory stimulus.98;101 Different CPB circuits,
pharmacological agents (glucocorticoids, protease inhibitors,
phosphodiesterase inhibitors, antioxidants, complement inhibition and
monoclonal antibodies) and surgical techniques are some of the strategies that
have been investigated. Further details on the inflammatory response to CPB
are described in Chapter 3: The effect of Cardiac surgery under
cardiopulmonary bypass on the N/OFQ system, and is covered by Paparella
and colleagues.101
1.9 Summary
The N/OFQ system is present in multiple organ systems and has been
attributed different roles in pain control, anxiety, depression, drug abuse and
heart failure.18 Because of the location of NOP and N/OFQ in immune cells, a
number of studies have examined its involvement in inflammatory responses,

41
and specifically how it affects the immune response, the cardiovascular system
and the HPA axis.
The evidence available that the N/OFQ-NOP system has a role in sepsis-
inflammation is largely based on in vitro and in vivo animal studies; with only
two observational studies in human patients with sepsis.33;34 One of these was
our own and involved a very small number of patients. However, based on
these studies, one conclusion from these data is that the expression of the
N/OFQ system by leucocytes increases during sepsis. Circulating leucocytes
could then become N/OFQ delivery vehicles releasing N/OFQ at the site of
inflammation which may produce systemic hypotension and organ dysfunction.
Indeed, this may form an immuno-vascular axis. As NOP activation is
chemotactic the upregulation of this receptor in sepsis may contribute (possibly
via auto-activation) to the regulation of the inflammatory response. However,
these hypotheses require rigorous experimental validation as it remains unclear
how N/OFQ and NOP alter in patients with an ongoing inflammatory process or
systemic sepsis and whether the changes would correlate with
pathophysiological effects. When we have this information it should be possible
to design appropriate clinical studies to evaluate NOP ligands in sepsis. Based
on existing data31;33 we would predict that NOP antagonists might be useful in
this situation as they might 1) reduce the systemic effects of leucocyte delivered
peptide and 2) reduce the chemotactic response and ongoing inflammation.

42
1.10 Aims
The aims of the studies described in this thesis were:
1. To study mRNA expression of the N/OFQ system in polymorphonuclear cells
during inflammation and sepsis.
2. To study the plasma concentrations of N/OFQ during inflammation and
sepsis.
3. To analyze the relationship between 1) and 2), and with physiological and
biochemical markers of inflammation and sepsis (e.g. white cell count, CRP,
and cytokines).
4. To determine if changes in the N/OFQ system during inflammation and
sepsis relate to patient’s morbidity and outcome.
The thesis is based on detailed analysis of clinical data and laboratory analysis
from two observational studies. The first involved patients having an
inflammatory response unrelated to sepsis, and the second recruited patients
with severe systemic sepsis admitted to ICU:
Study 1: Patients undergoing cardiac surgery under cardio-pulmonary bypass
(CPB, as a non-septic model of inflammation without infection). Blood samples
for plasma and polymorphonuclear cell analysis were obtained at 3 stages: 1)
Baseline, before surgery, 2) at 3 hours post-CPB, and 3) at 18 – 24 hours post-
CPB.
Study 2: Patients admitted to the Intensive Care Unit with a clinical diagnosis of
sepsis. Blood samples were collected within the first 24h of ICU admission, and
43
a second blood sample on the following day. A third blood sample, where
possible, was collected once patients recovered from sepsis, and this served as
a within-patient control sample.
In the absence of any usable antibodies for Western blot or
Immunocytochemistry NOP expression is tracked using quantitative real time
PCR.
1.11 Hypothesis
The expression of NOP and ppN/OFQ mRNA by polymorphonuclear cells
increases during systemic inflammation and sepsis. Plasma concentrations of
N/OFQ are also increased as these are likely to originate from
polymorphonuclear cells.

44
2 Methods
We have investigated the change of the nociceptin (N/OFQ) system in plasma
and PMN cells in patients undergoing cardiac surgery under cardiopulmonary
bypass and in critically ill patients with sepsis. Plasma concentrations of
selected cytokines were also analysed. In addition to work in clinic we have
used the following laboratory methods:
- Gradient Polymorphprep® for PMN cells extraction
- Cell counter and flow cytometry (FCM) to confirm purity of PMN cell
extraction
- Polymerase Chain Reaction (RT-qPCR) to study the gene expression of
NOP and ppN/OFQ (N/OFQ precursor) by PMN cells.
- Radioimmunoassay (RIA) to determine plasma N/OFQ concentrations.
- ELISA to determine plasma concentrations of cytokines.
2.1 Blood collection
Blood collection procedure was the same for both cardiac surgery and sepsis
studies. A total of 22.5 ml whole blood was aspirated from the arterial line (in
most of the cases where one was in place, otherwise blood was aspirated from
the central venous access). Fifteen ml of blood were drawn into two 7.5 ml
EDTA bottles and transferred at room temperature to the laboratory.
Polymorphonuclear (PMN) leucocytes were then isolated by a gradient method,
within 30 minutes of the sample being taken.

45
The remaining 7.5 ml blood was drawn into a third EDTA bottle. 150 µl aprotinin
(containing 4.5 TIU, 0.6 TIU.ml-1) was immediately added to prevent protein
degradation. This sample was transferred on ice to the laboratory and
centrifuged at 3,000x g, 4˚C for 15 minutes. The plasma obtained was stored in
1 ml aliquots at -80˚C and used for batch analysis of N/OFQ peptide by
radioimmunoassay and of cytokines and MPO by ELISA.
Analysis of inflammatory markers is commonly used in research and there are
recommendations for optimal collection, storage and analysis of samples. Most
studies suggest that EDTA plasma samples is the optimal way to analyse
inflammatory markers. Sample collection and processing should be conducted
in a standardised manner. Immediate sample processing is not often possible
and therefore storage should be adequate. Samples should be kept cooled
during processing as some inflammatory markers can degrade or increase at
room temperature; TNFα seems to degrade at room temperature after 4 - 6
hours.102 When samples are stored over a long time degradation becomes an
issue. The temperature in a mechanical -80C freezer can vary depending
mainly on the location within the freezer (measured temperature can change
between -90 to -43.5). Assessment for degradation is difficult and different
results can be attributed to other variables like changes in the laboratory assay
over time, intra- and inter-observer variations. Generally, it is recommended to
store EDTA plasma samples for analysis of inflammatory markers at -70C or
lower and to avoid freeze-thaw cycles as some inflammatory markers are more
sensitive.102

46
2.2 Polymorphonuclear cell extraction
Fifteen ml of whole blood was aspirated from the arterial line into two 7.5 ml
EDTA bottles and transferred at room temperature to the laboratory.
Polymorphonuclear (PMN) leucocytes were isolated within 30 minutes of
sample being taken by a gradient method, Polymorphprep™ (Axis-Shield).
Following manufacturer’s instructions, 7.5 ml whole blood were carefully layered
over 7.5 ml Polymorphprep™ into two 15 ml centrifuge tubes. Samples were
centrifuged at 500x g for 30 minutes at 20˚C with 0 deceleration force (brake
off) to avoid disturbance of the layers.
After centrifugation, 2 bands of leucocytes were obtained, the top band
corresponding to mononuclear cells and the bottom band to polymorphonuclear
cells (Figure 2-1).
Figure 2-1. Schematic representation of polymorphonuclear leucocyte
extraction by gradient method.
The polymorphonuclear band was harvested and Phosphate Buffered Saline
(PBS) added in equal volumes for washing. The cells were centrifuged at 500x
g for 10 minutes at 20˚C. The supernatant was discarded and the pellet
Plasma
Mononuclear cells
Polymorphonuclear cells
RBC and platelet pellet

47
resuspended in 1 ml of Tri-reagent® (RNA isolation reagent). The samples were
stored at -80˚C for batch analysis.
2.3 Cell counter and Flow Cytometry
2.3.1 Theory
To determine the level of contamination of the PMN cell layer extracted using
the gradient method, we performed flow cytometry (FCM). 1 volunteer and 2
patient samples were analysed using a Coulter® EPICS XL™.MCL Flow
Cytometer.
FCM allows differentiating the type of cells present in a sample according to its
physical and/or chemical properties, like size, cytoplasmic granularity and
surface antigens. In brief, FCM uses light scattering and fluorescence by means
of lasers to differentiate cell types. For example, light scattering is used to
differentiate between monocytes, lymphocytes and granulocytes. The cells are
made to pass in a single line in a fluid stream and a laser light directed to them.
The measurement of light scattered by the cells is performed at two angles, 0˚
or forward scatter and 90˚ or side scatter103 (Figure 2-2). Forward scatter
determines the size of the cells, the bigger the cell the larger the light scatter.
Light scatter is then represented in voltage. Side scatter determines the
complexity and cytoplasmic granularity, granulocytes with higher cytoplasmic
granularity produce higher scatter of light than monocytes, which in turn is
higher than lymphocytes.104
Fluorescence is used to differentiate cell subtypes by staining cells with an
appropriate fluorophore-labelled antibody against specific surface antigens

48
(Figure 2-3). For example, in peripheral blood samples CD66a, CD66b, CD66c
and CD66d antigens are only expressed in granulocytes. When a laser light
hits the fluorophore-labelled antibody a signal is emitted and represented in
voltage directly proportional to the amount of labelled antibody. A variety of
dyes for antibodies are available, in our experiments we used Fluorescein
isothiocyanate (FITC) and R-Phycoerythrin-Cyanine 5 (RPE-Cy5) conjugated
dyes.
Figure 2-2. Flow cytometry. Schematic representation showing cells passing
one at the time with forward and side scatter detectors. Adapted from MRC
Clinical Sciences Centre, http://flow.csc.mrc.ac.uk
Sample
Sheath fluid
Cells in stream line
Laser light
Forward scatter detector
Side scatter detector

49
Figure 2-3 Graphical representation of side scatter, forward scatter and
fluorescence in flow cytometry.
Taken from http://www.wadsworth.org/cores/immunology/flowp.html
2.3.2 FCM materials
Phosphate buffered saline (PBS), 0.1% sodium azide, 0.1% bovine
serum albumin (BSA) and 1% formaldehyde.
Antibodies:
For mononuclear cells: CD45 and CD45-RPE-Cy5 as negative
control.
For granulocytes: CD66abce (Monoclonal Mouse Anti-Human)
and CD66-FITC as negative control.
2.3.3 FCM Method
Harvested PMN cells were washed in an equal volume of PBS, and then cells
were centrifuged at 500x g, at 20˚C for 10 minutes. The cell pellet was
resuspended in 0.5 ml of PBS. The samples were divided into 3 tubes and
washed with PBS + Sodium Azide 0.1% + 0.1% Bovine Serum Albumin (BSA)

50
and centrifuged at 500x g, at room temperature for 5 minutes. The supernatant
was discarded.
To each of the tubes we added the following:
Tube 1: CD45-RPE-Cy5 negative control
Tube 2: CD45 antibody + CD66-FITC negative control
Tube 3: CD45 + CD66abce
The samples were incubated at room temperature for 30 minutes protected
from light, and then we added 1% formaldehyde 500 µl. Samples were
analysed in a Coulter® EPICS XL™.MCL Flow Cytometer (Figure 2-4).
.
Thirty samples were also analysed in a cell counter, Coulter® AC.T diff
Analyzer, for granulocyte count. Even though this is not an accurate method for
determining the cell count, it gives an idea of the proportion and the type of cells
present. The granulocyte count of the PMN cells layer by FCM was 98.4%,
99.7% and 99.8% for 1 volunteer and 2 patient samples respectively. These
values corresponded to 83.8%, 85% and 94% respectively in the cell counter.
All 30 samples analysed had values ranging between 83.8% and 94%
granulocytes.

51
Figure 2-4. Flow cytometry result from one sample. Histogram 1 shows all cell
types in the sample by side and forward scatter. Histogram 2, using CD45-RPE-
Cy5 negative control, Gate A shows all leucocytes. Histogram 3, Gate B set for
granulocytes using CD66a FITC, showing granulocyte count of 98.4%.
Histogram 4 with both CD45-RPE-Cy5 and CD66a FITC identifying
granulocytes and PBMC.
Red cells Leucocytes All Leucocytes
Red cells
Granulocytes All Leucocytes

52
2.4 Polymerase Chain Reaction (RT-qPCR)
Figure 2-5 summarizes the processes involved in obtaining PCR product from
whole blood.
Product obtained Method used Details
Whole blood
sample
15 ml of blood aspirated from the patients
PMN extraction by gradient method
Gradient method, Polymorphprep®
PMN cells
PMN obtained. Confirmed by FCM
RNA extraction
Tri-chloroform extraction method
RNA
Purity of RNA considered on >1.7 A260/A280. Stored at -80˚C
DNA clean up
Up to 10 µg of RNA cleaned per reaction
Clean RNA
Stored at -80˚C
RT
10 µl of clean RNA used in a 20 µl reaction. A no-reverse transcription [RT(-)] assay was performed per sample.
cDNA
Stored at -20˚C
qPCR
StepOne
PCR product
Analysed by StepOne, Excel and Prism
Figure 2-5. Flow chart of steps taken from whole blood sample to qPCR results.

53
2.4.1 Theory
To analyse the expression of NOP and ppN/OFQ genes in polymorphonuclear
cells, we used Reverse Transcription - Real Time – Quantitative - Polymerase
Chain Reaction (RT-qPCR).
The human genome is comprised of approximately 30,000 (named and
unnamed) genes that represent the entire DNA sequence and is found in every
cell of the human body.105 A gene is a sequence of DNA which has nucleotides
as its basic unit and has sets of exons (regions of DNA that encode for protein)
and introns (regions of DNA that do not encode for protein). Each human cell
transcribes different regions of DNA into mRNA in the nucleus and then in the
cytoplasm the mRNA is translated into protein (Figure 2-6).
From DNA to protein
Double-stranded DNA is transcribed into single-stranded pre-mRNA (always
synthesised from 5’ end to 3’ end) in the cell nucleus by RNA polymerase II.
Pre-mRNA undergoes various modifications, including splicing, before being
released into the cytoplasm. The non-coding regions (introns) are spliced out
from the pre-mRNA to form the mature mRNA.
mRNA is then translated into protein by using transfer RNA (tRNA) and
ribosomes. Further modification of proteins occurs to ensure their activation
and stability. It is important to note that not all mRNA is translated into protein,
which means that by using PCR we are able to identify the transcription of a
given gene but cannot know if there is functional protein produced.

54
Figure 2-6. Schematic representation of conversion from DNA to Protein in the
cell.
PCR
Polymerase chain reaction is a method of identifying the presence of a given
gene by replicating its DNA sequence into millions of copies to make it
detectable. A variety of samples can be analysed, blood, tissue, and cell
cultures, amongst others. Very small amounts are sufficient to perform PCR.
There are four basic components of a PCR reaction:
1. Two primers, forward and reverse. These are known short nucleotide
sequences that synthesize the DNA in the 5’ to 3’ direction.
2. Thermo-stable DNA polymerase (an enzyme originally derived from the
bacterium Thermos aquaticus) to synthesise the complementary DNA. This
enzyme remains stable with high temperatures from PCR, in contrast to human
DNA polymerase which is not stable at such high temperatures.
3. Free deoxynucleotides for the new complementary strand.
4. The sample containing a small amount of DNA with the sequence of interest.
DNA mRNA Protein
Transcription Translation
RNA polymerase II
NUCLEUS CYTOPLASM
mRNA
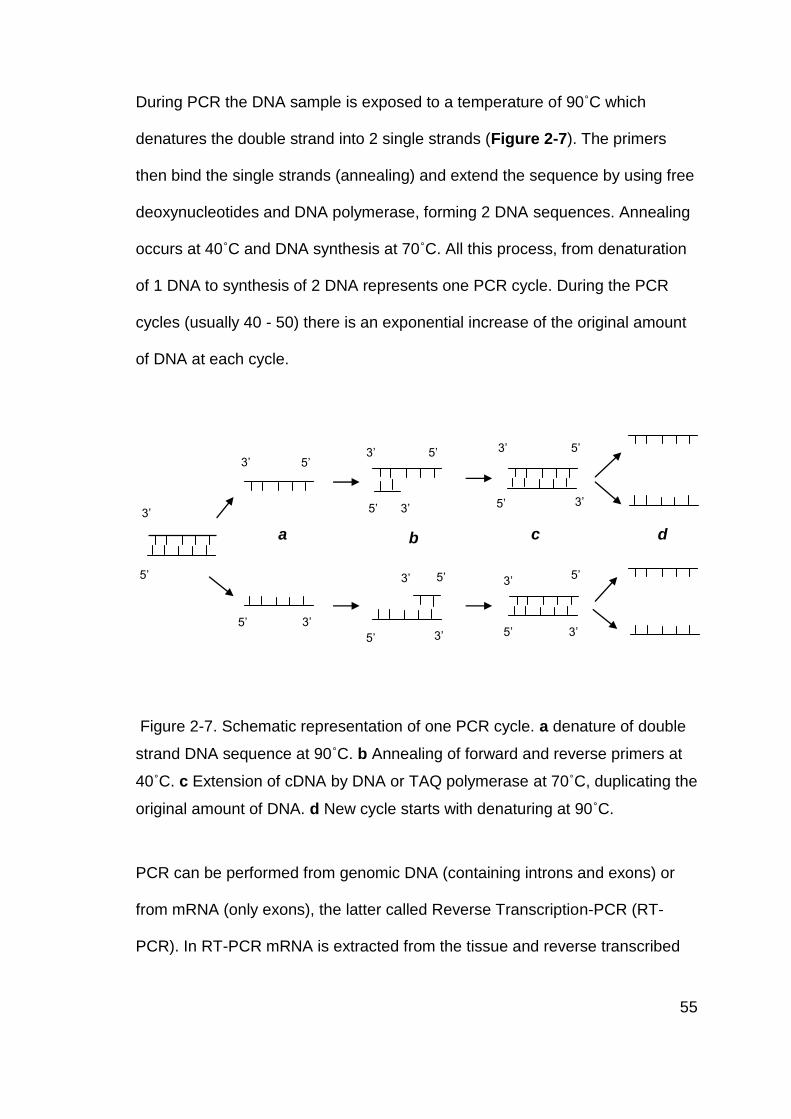
55
During PCR the DNA sample is exposed to a temperature of 90˚C which
denatures the double strand into 2 single strands (Figure 2-7). The primers
then bind the single strands (annealing) and extend the sequence by using free
deoxynucleotides and DNA polymerase, forming 2 DNA sequences. Annealing
occurs at 40˚C and DNA synthesis at 70˚C. All this process, from denaturation
of 1 DNA to synthesis of 2 DNA represents one PCR cycle. During the PCR
cycles (usually 40 - 50) there is an exponential increase of the original amount
of DNA at each cycle.
Figure 2-7. Schematic representation of one PCR cycle. a denature of double
strand DNA sequence at 90˚C. b Annealing of forward and reverse primers at
40˚C. c Extension of cDNA by DNA or TAQ polymerase at 70˚C, duplicating the
original amount of DNA. d New cycle starts with denaturing at 90˚C.
PCR can be performed from genomic DNA (containing introns and exons) or
from mRNA (only exons), the latter called Reverse Transcription-PCR (RT-
PCR). In RT-PCR mRNA is extracted from the tissue and reverse transcribed
5’
5’
5’
3’
3’
3’
a b c d
5’ 3’
5’ 3’
3’ 5’
5’ 3’
3’
3’
5’
5’
5’
5’
3’
3’

56
to complementary DNA (cDNA) by means of the reverse transcriptase (Figure
2-8). cDNA is then replicated using the PCR technique as described above.
Figure 2-8. Schematic representation of reverse transcription and PCR. cDNA,
complementary DNA.
Real time PCR can be performed by using fluorescence which allows for
quantifying the amount of genetic material at each cycle. One of the most
frequently used methods is based with TaqMan probes. These consist of a
nucleotide sequence which has a fluorophore attached at the 5’ end and
another molecule, a quencher, at the 3’. The proximity of the quencher to the
fluorophore prevents it from releasing fluorescence (Fluorescence resonance
energy transfer, FRET) therefore it does not fluoresce whilst in solution. During
the annealing phase the probe is attached to the DNA and the primer is
extended with the Taq polymerase (a type of polymerase enzyme). The
fluorophore is separated from the quencher when hydrolised by the Taq
polymerase. The amount of fluorescence produced is directly proportional to
the amount of PCR product (Figure 2-9).
Reverse transcription
Reverse transcriptase
cDNA mRNA PCR products
PCR
DNA polymerase or TAQ polymerase

57
Figure 2-9. Schematic representation of PCR using TaqMan reagents. From
Applied Biosystems StepOne™ Guide.106
http://www.appliedbiosystems.com/etc/medialib/appliedbio-media-
library/images/application-and-technology/real-time-pcr/taqman-sybr-green-
chemistry/data-images.Par.74690.Image.302.517.1.gif.Figure_2.gif

58
2.4.2 Materials
RNA extraction:
Tri – Chloroform method
99% Chloroform - Sigma,
Tri-reagent® Sigma-Aldrich,
Isopropanol, 75% ethanol, Tris-EDTA (TE) buffer.
mirVana™ extraction method (isolation kit, Ambion, by Applied Biosystems)
Chloroform - Sigma
100% Ethanol
miRNA Wash Solution 1
miRNA Wash Solution 2/3
Collection tubes and filter cartridges
DNA clean-up:
TURBO DNA free™ kit: Turbo DNase, 10x turbo DNase buffer, DNase
inactivation reagent, nuclease-free water – Ambion, UK
Reverse transcription (RT):
High-Capacity Reverse Transcription Kit, Applied Biosystems: 10x RT
buffer, 10x RT Random Primers, 25x dNTP Mix, MultiScribe™ Reverse
Transcriptase, RNase Inhibitor
59
Quantitative Polymerase Chain Reaction (q-PCR):
2x TaqMan® Universal PCR MasterMix, Gene expression assay for
GAPDH, gene expression assay for N/OFQ (Prepronociceptin, pNOC),
Gene expression assay for NOP, and nuclease-free water. Applied
Biosystems
Assay ID:
For ppN/OFQ: ppNOC HS 00173823-m1
For NOP: ORL-1 HS 00173471-m1
For GAPDH: 4326317E
2.4.3 RNA extraction
Tri – Chloroform method
For the study in patients undergoing cardiac surgery under CPB, the Tri-
chloroform extraction method107 was used. PMN leucocytes were extracted
from whole blood and stored in 1 ml of Tri-reagent® (deactivates RNases) at -
80˚C, as described above (polymorphonuclear leucocytes extraction). Batch
analysis was performed. The samples were defrosted and treated according to
the following protocol:
1. Add 200 µl of chloroform
2. Mix by vortex for 2 minutes
3. Stand at room temperature for 3 minutes
4. Centrifuge at 16,000x g, room temperature, 15 minutes
5. Remove upper aqueous layer (containing mRNA) to a clean eppendorf
tube

60
6. Add 500 µl of Tri-reagent® and 100 µl of chloroform
7. Mix by vortex for 2 minutes
8. Stand at room temperature for 3 minutes
9. Centrifuge at 16,000x g, room temperature, 15 minutes
10. Remove upper aqueous layer (containing mRNA) to a clean eppendorf
tube
11. Add 500 µl of Isopropanol
12. Stand at room temperature for 10 minutes
13. Centrifuge at 16,000x g, room temperature, 10 minutes to obtain a
pellet.
14. Discard the supernatant and resuspend the pellet in 75% ethanol.
15. Keep the pellet on ice for up to 1 h and then quantify.
For quantification, the alcohol was discarded and the pellet resuspended in up
to 100 µl of Tris-EDTA (TE). 2 µl of this sample was added to 48 µl of TE; this
was quantified using absorbance at 260 nm with the Eppendorf Biophotometer.
Purity was assessed using the absorbance ratio between 260 nm and 280 nm
and considered acceptable when > 1.7.
mirVana™ extraction method
For the sepsis study the mirVana™ isolation kit method was used. mirVana™
isolation kit, Ambion, by Applied Biosystems, is designed for purification of
small interfering RNAs (siRNA) and microRNAs (miRNA). The mirVana kit was
tested for use in PMN cells in our laboratory and we obtained high yields of

61
high quality mRNA in under 1 hour. We performed batch analysis following the
protocol:
1. Add 200 µl of chloroform to the PMN cells (already on 1 ml of Tri-
Reagent®)
2. Vortex for 30 – 60 seconds and centrifuge at 10,000x g at room
temperature for 5 minutes
3. Recover the upper aqueous phase carefully to a fresh tube
4. Add 100% ethanol 1.25 volumes.
5. For each sample place a Filter Cartridge into a collection tube and
pipette the ethanol/sample mixture onto the filter cartridge.
6. Centrifuge for 30 seconds at 10,000x g at room temperature to pass
the mixture through the filter and discard the flow-through.
7. Use the same collection tube to collect the remainder of the sample
and for the washing steps (up to 700 µl can be applied to a filter
cartridge).
8. Apply 700 µl of ‘Wash Solution 1’ to the filter cartridge and centrifuge
at 10,000x g at room temperature for 30 seconds, and discard the
flow-through.
9. Apply 500 µl of ‘Wash Solution 2/3’ and centrifuge for 30 seconds,
and
discard the flow-through.
10. Repeat previous step, apply 500 µl of ‘Wash Solution 2/3’ and
centrifuge for 30 seconds, and discard the flow-through.
11. Centrifuge for 1 minute to remove any residual fluid from the filter.
12. Transfer the filter cartridge to a fresh collection tube and add 100 µl

62
of pre-heated (95˚C) nuclease-free water.
13. Centrifuge at 10,000x g at room temperature for 30 seconds to
recover the RNA.
2.4.4 RNA Quantification
For RNA quantification, 2 µl of the recovered sample were added to 48 µl of
nuclease-free water; this was quantified using absorbance at 260 nm with the
Eppendorf Biophotometer. Purity was considered with an absorbance ratio
between 260 nm and 280 nm with a minimum of 1.7 taken as acceptable. RNA
samples were stored at -80˚C.
2.4.5 Removal of DNA contamination
The RNA extraction method does not consistently yield RNA that is free from
DNA contamination; therefore we used a kit to remove genomic DNA, TURBO
DNA-free™ Kit, Ambion, prior to RT-PCR. Up to 10 µg of mRNA were cleaned
from DNA contamination. For each sample, a 50 µl reaction was prepared
containing 1 µl Turbo DNase, 5 µl 10x turbo DNase buffer, sample volume
containing up to 10 µg mRNA and molecular biology grade water to a total
volume of 50 µl. This was mixed and incubated at 37˚C for 30 minutes. Then 5
µl of DNase inactivation reagent was added, mixed by vortex, and left to stand
for 3 minutes at room temperature mixing intermittently. The samples were then
centrifuged at 10,000x g, at room temperature for 30 seconds to precipitate the
inactivation reagent. The supernatant containing clean mRNA was transferred
to a clean tube and stored at -80˚C.

63
2.4.6 Reverse Transcription (RT)
mRNA cleaned from DNA contamination was reverse transcribed to obtain
complimentary DNA (cDNA). A High-Capacity cDNA Reverse Transcription Kit
(Applied Biosystems) was used. Reverse transcription was carried out in
duplicate for RT (+) and single for RT (-) (control, without reverse
transcriptase). A 20 µl reaction was prepared for each RT (+) and RT (-) for
each sample. The following mix was used:
RT (+) RT (-)
10x Reverse transcription buffer 2 µl 2 µl
25xDeoxynucleotidetriphosphates
(dNTP)
0.8 µl 0.8 µl
10x RT Random Primers 2 µl 2 µl
MultiScribe ™ Reverse Transcriptase 1 µl 0
RNase Inhibitor 1 µl 1 µl
Nuclease-free water 3.2 µl 4.2 µl
RNA sample 10 µl 10 µl
TOTAL 20 µl 20 µl
The mixtures were processed in an eppendorf Mastercycler™ according to the
following protocol:
Step 1 Step 2 Step 3 Step 4
Temperature 25˚C 37˚C 85˚C 4˚C
Time 10 min 120 min 5 min Hold
64
The cDNA obtained was stored at -20˚C for batch qPCR analysis.
2.4.7 qPCR development
Quantitative real time PCR (qPCR) was performed using TaqMan probes and
gene expression assays from Applied Biosystems and the StepOne™ Real-
Time PCR instrument from Applied Biosystems.
Reactions were performed in duplex (both NOP and GAPDH or ppNOC (pre-
pro N/OFQ) and GAPDH primers included in the same reaction). Reaction
efficiencies for NOP had been determined previously by McDonald and
colleagues11 using serial dilutions of SH-SY5Y (a neuroblastoma expressing
gene of interest) cDNA with GAPDH alone (singleplex) or with NOP (duplex).
The efficiencies were calculated using the formula Efficiency=(10[-1/slope]-1x100).
Efficiencies obtained were 94% and 98.9% for GAPDH, and 100% and 100%
for NOP in singleplex and duplex respectively. The accepted range for
efficiency is 90-110%.
Normalization was performed with GAPDH as a reference gene to control for
variations in the various stages of mRNA extraction, reverse transcription and
efficiencies of amplification. Ct values for GAPDH expression by PMN cells in
septic patients and patients undergoing an inflammatory response were
constant. The value of GAPDH as internal control has been corroborated by its
stability in PMN cells in septic patients when analysed by the software GeNorm
(unpublished data by our laboratory).

65
PCR set up
The following mixture was used per sample per gene of interest (NOP or
ppN/OFQ):
2x TaqMan® Universal PCR
Mastermix
10 µl
Assay mix for GAPDH 1 µl
Assay mix for gene of interest 1 µl
Nuclease-free water 6 µl
Sample 2 µl
TOTAL 20 µl
The thermal cycling conditions used during qPCR are shown in Table 2-1
PCR
step
Initial Steps PCR (40 cycles)
AmpErase®
UNG Activation
AmpliTAQ
Gold® DNA
polymerase
activation
Denature Anneal/Extend
HOLD HOLD CYCLE
2 min @ 50˚C 10 min @ 95˚C 15 sec @
95˚C
1 min @ 60˚C
Table 2-1. PCR thermal cycling conditions. AmpErase® UNG, uracil-N-
glycosylase, is used to prevent contamination from previous PCR products
(carry-over) where dUTP has been used in the master mix. UNG cleaves the
Uracil base from Uracil-containing DNA but does not affect natural DNA
(thymine-containing DNA).108

66
Data analysis was performed using StepOne™ software version 2.0.
Ct or cycle threshold is the cycle at which the fluorescence reaches a
predetermined threshold. We used Ct values to analyse PCR results. The ΔCt,
and ΔΔCt are commonly used in PCR studies. ΔCt is the difference between Ct
of the gene of interest (i.e. NOP or ppN/OFQ) and Ct of the reference gene
GAPDH. Figure 2-10. The ΔΔCt refers to the difference of ΔCt in between two
samples.
The maximum arbitrary cut-off point for reporting Ct values is 40. However, we
observed that Ct values for ppN/OFQ were around 40, and these were higher
after the inflammatory response. Therefore we accepted values above 40
(average ppN/OFQ Ct 34 to 42) when they were reproducible on repeated
analysis. High Ct values indicate low mRNA expression of the gene of interest.
We also use the 2-ΔΔCt method, or fold change, to analyse PCR results.
Figure 2-10 Graphical sample of qPCR result for NOP from one patient.
Showing Ct for NOP= 24, where the fluorescence increases above the
threshold line, Ct for GAPDH= 18, and therefore ΔCt= 6 (NOP Ct minus
GAPDH Ct). The higher the Ct and ΔCt, the lower the gene expression. The
values given are approximate for the purpose of explanation.

67
2.5 Radioimmunoassay
2.5.1 Theory
Radioimunoassay (RIA) is a technique used to measure concentrations of
antigens by the use of antibodies. It was introduced in 1960 by Berson and
Yalow.109 To perform RIA it is necessary to have a radio labelled antigen (e.g.
125I-N/OFQ), a specific antibody (e.g. specific for N/OFQ) and some method of
separating the bound antibody from the free labelled peptide (i.e. secondary
antibody).109 A known amount of radio labelled antigen is mixed to the specific
antibody to form a labelled antigen-antibody complex. The sample with the
unknown concentration of peptide is added and this peptide competes with the
labelled antigen (125I-N/OFQ in this case) for binding sites at the specific
primary antibody. As the assay is competitive, binding of 125I-N/OFQ is low at
higher peptide concentrations in the sample and vice versa. A secondary
antibody is used to precipitate the antigen/antibody complexes thus allowing for
measuring the radioactivity in the pellet with the means of a γ-counter (Figure
2-11). A standard curve is drawn and used to derive the unknown plasma
concentrations.

68
Figure 2-11. Schematic representation of radioimmunoassay. Taken from
http://www.immunoassay.org/radioimmunoassay-ria/
2.5.2 Materials
Aprotinin 0.6 TIU.ml-1 of blood
Acetonitrile
Trifluoroacetic acid (TFA)
Nociceptin.Opioid Receptor-Like (ORL1) Peptide (Orphanin FQ) RIA kit –
Phoenix Pharmaceuticals, Inc
69
2.5.3 Solid phase extraction
Plasma samples stored at -80C were used for batch measurement of plasma
N/OFQ concentrations. Blood sample collection was described above.
N/OFQ solid phase peptide extraction was performed using Strata cartridges
containing 200mg of C18-E. The cartridges were prepared by washing with 1
ml of 60% acetonitrile in 1% TFA followed by 3 ml of 1% TFA 3 times. Two ml
of plasma sample were acidified with equal volume of 1% trifluoroacetic acid
(TFA) for 30 minutes at 4˚C and then loaded into the column. The columns
were then washed with 3 ml of 1% TFA twice and the N/OFQ peptide then
eluted by adding 2.5 ml of 60% acetonitrile in 1% TFA to the columns. The
eluate samples were then dried at room temperature using a centrifugal
evaporator connected to a vacuum pump and stored at -20˚C until batch assay.
2.5.4 Radioimmunoassay stage
A radioimmunoassay kit from Phoenix pharmaceuticals was used. The
manufacturers’ protocol was followed:
1. Reconstitutions:
- Dilute the RIA buffer with 150 ml of distilled water – this is used to
reconstitute all the other compounds and to dilute the samples
- Reconstitute the standard peptide with 1 ml of RIA buffer. Mix well and
store on ice.
- Reconstitute the primary antibody (rabbit ant-peptide serum) with 13 ml
of RIA buffer, mix well and store on ice
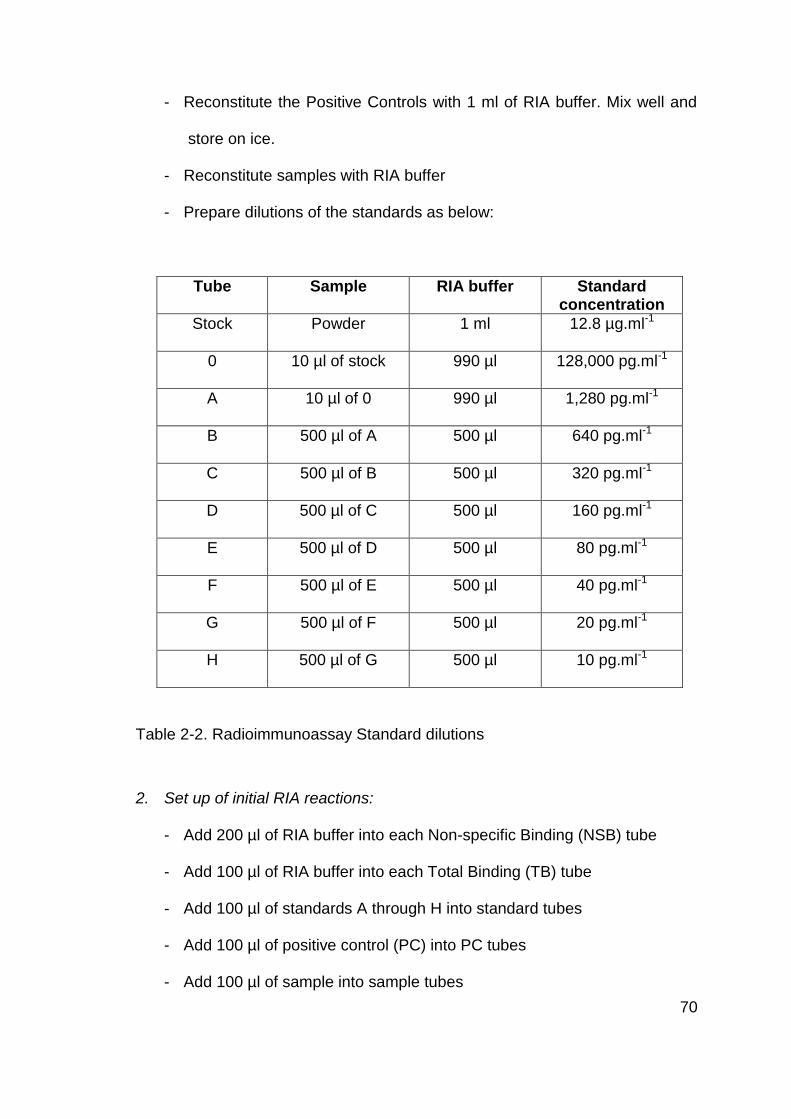
70
- Reconstitute the Positive Controls with 1 ml of RIA buffer. Mix well and
store on ice.
- Reconstitute samples with RIA buffer
- Prepare dilutions of the standards as below:
Tube Sample RIA buffer Standard concentration
Stock Powder 1 ml 12.8 µg.ml-1
0 10 µl of stock 990 µl 128,000 pg.ml-1
A 10 µl of 0 990 µl 1,280 pg.ml-1
B 500 µl of A 500 µl 640 pg.ml-1
C 500 µl of B 500 µl 320 pg.ml-1
D 500 µl of C 500 µl 160 pg.ml-1
E 500 µl of D 500 µl 80 pg.ml-1
F 500 µl of E 500 µl 40 pg.ml-1
G 500 µl of F 500 µl 20 pg.ml-1
H 500 µl of G 500 µl 10 pg.ml-1
Table 2-2. Radioimmunoassay Standard dilutions
2. Set up of initial RIA reactions:
- Add 200 µl of RIA buffer into each Non-specific Binding (NSB) tube
- Add 100 µl of RIA buffer into each Total Binding (TB) tube
- Add 100 µl of standards A through H into standard tubes
- Add 100 µl of positive control (PC) into PC tubes
- Add 100 µl of sample into sample tubes

71
- Add 100 µl of primary antibody into sample, standard and TB tubes
- Vortex, cover and incubate all tubes for 16 – 24 h at 4˚C
3. Addition of radio labelled 125I-N/OFQ antigen:
- Reconstitute the 125I-N/OFQ with 13 ml of RIA buffer and mix to make
tracer solution. Check the concentration of the tracer solution and adjust
with RIA buffer to obtain a total activity of between 8,000 and 10,000
cpm/100 µl
- Add 100 µl of 125I-N/OFQ to each tube
- Vortex and incubate all tubes for 16 – 24 h at 4˚C
4. Addition of secondary antibody and -count
- Reconstitute the secondary antibody (Goat Anti-Rabbit IgG serum, GAR)
with 13 ml of RIA buffer
- Reconstitute the Normal Rabbit Serum (NRS) with 13 ml of RIA buffer
- Add 100 µl of GAR to each tube, except TC tube
- Vortex and incubate for 90 minutes
- Add 500 µl of RIA buffer to each tube except TC tube and vortex.
- Centrifuge all tubes (except TC tube) at 1,700 x g for 20 minutes at 4 ˚C.
- Remove supernatant and assay pellet for 125I using a -counter
(Packard-Cobra)
The final contents of each tube for the measurement of plasma N/OFQ peptide
by RIA and the standard curve obtained are shown in Table 2-3 and Figure
2-12 respectively.

72
Sample
tube
RIA
buffer
Standard Sample Primary
antibody
125I-N/OFQ Secondary
antibody,
GAR
NRS
TC 100
NSB 200 100 100 100
TB 100 100 100 100 100
Standard 100 100 100 100 100
PC 100 100 100 100 100
Sample 100 100 100 100 100
Table 2-3 Summary of content in each RIA tube. Values expressed in µl. TC,
total count; NSB, non-specific binding; TB, total binding; PC, positive control
(supplied by manufacturer).
-13 -12 -11 -10 -9 -80
20
40
60
80
100
Log [N/OFQ] pg/tube
B/B
o1
25I
N/O
FQ
(%)
Figure 2-12. Radioimmunoassay standard curve. Proportion of Bound to
unbound (B/Bo) 125I-N/OFQ as a function of added N/OFQ standard. The
higher the standard (or sample) N/OFQ peptide concentration the lower the
radio labelled 125I-N/OFQ bound. The standard curve enables for the unknown
concentrations in plasma to be estimated.

73
Assay quality control data
In this assay for the cardiac study samples, 9327 cpm (counts per minute) were
added to each tube and 38.2% were bound in the total assay tubes (product
reference sheet Lot 506508 indicates 37%). The IC50 for the standard curve
was 27 pg.ml-1 (product reference sheet Lot 506508 quotes 15.47 pg.ml-1).
Quadruplicate analysis of the positive control gave an intra-assay CV of 6.27%.
2.6 ELISA
2.6.1 Theory
Various plasma inflammatory markers were analysed in both cardiac and septic
studies. Cardiopulmonary bypass (CPB) is known to cause increased plasma
concentrations of IL-6, IL-8, IL-10, IL-18 and TNFα.99;100 IL-8 has been
associated with new onset atrial fibrillation post-operatively,110 IL-10 associated
with development of organ failure111 and TNFα with more complicated recovery
based on inotrope requirement and plasma lactate.112 Myeloperoxidase (MPO)
is an enzyme released by activated neutrophils and is an indicator of
inflammation and sepsis.91
We investigated the plasma concentrations of IL-8, IL-10, TNFα and MPO by
Enzyme-linked immunosorbent assay (ELISA). These are known inflammatory
markers that will allow us to correlate the patient’s inflammatory response with
changes in plasma N/OFQ concentrations and in mRNA expression of the
N/OFQ system.

74
The principles of ELISA are similar to those of RIA. A capture antibody is used
to coat the wells where the sample with an unknown amount of antigen or the
standard is added, forming an antigen-antibody complex, (Figure 2-13). A
detection antibody that is linked to an enzyme then binds to the antigen-
antibody complex. In the final step a chemiluminescent reagent, such as
streptavidin-HRP, is added and the enzyme linked to the detection antibody
converts the streptavidin-HRP into a detectable signal which is then read by a
microplate reader. The amount of signal produced is directly proportional to the
amount of unknown antigen.
A standard curve is created by plotting t each standard concentration against
the absorbance and drawing a best fit curve, the sample concentrations are
then derived from the standard curve (we used GraphPad Prism version 5.0), It
is recommended to include a standard curve for each ELISA plate. There are
known variations in the ELISA results caused by different factors. A coefficient
of variation (CV) can be calculate to indicates any inconsistencies and
inaccuracies in the results. The coefficient of variation is the ratio of the
standard deviation to the mean (CV = standard deviation / mean). It is
expressed as a percentage of variance to the mean. Fluctuations in the CV can
be attributed to inaccurate pipetting, bacterial contamination of samples or
reagents, splashing of reagents between wells, cross contamination between
reagents, temperature variations across the plate, and wells drying out if there
are draughts or are not covered at incubation steps.113

75
Figure 2-13. Schematic representation of basic principles of ELISA. Adapted
from http://www.rndsystems.com/product_detail_objectname_mosaic_assay_
principle.aspx Accessed 29/02/2012.
Capture antibody is used to coat the wells where the sample or standard is added.
Capture antibody
Sample or standard
Detection antibody
Streptavidin HRP
+
+
+
Streptavidine binds the detection antibody. The enzyme linked to detection Antibody converts Streptavidin into readable signal. Optical density is then determined by a microplate reader.
Ag-Ab complex Antigen-antibody (Ag-Ab)
complexes are formed.Detection antibody is added and binds Ag-Ab complex
Streptavidin-HRP is added.
Comments

76
2.6.2 Materials
- DuoSet® ELISA Development Kit for IL-8, IL-10 and TNF - R&D
systems
- Phosphate Buffered Saline, PBS.
- Foetal Bovine Serum, FBS.
- Wash Buffer: 0.05% tween® 20 in PBS.
- Reagent Diluent: 1% Bovine serum albumin (BSA) in PBS.
- ILMA (Immunoluminometric assay buffer) 1 litre containing: Sodium
phosphate 1.5 mmol.l-1, disodium hydrogen phosphate 8 mmol.l-1,
sodium chloride 140 mmol.l-1, EDTA 1 mmol.l-1, BSA 1 g.l-1, sodium
azide 0.1 g.l-1, Triton x 100 0.1% 1 ml. pH 7.04
- Buffer B wash 10 litres containing: Sodium chloride 197.5 g, sodium
phosphate 2.3 g, disodium hydrogen phosphate 11.3 g, sodium azide 1
g, Tween®20 5 ml.
- Streptavidin-HRP.
2.6.3 ELISA method
Inflammatory markers were measured in plasma obtained from whole blood as
described under ‘Blood collection’ above. Batch analysis was performed using
an ELISA kit from R&D systems. The manufacturer’s protocol was followed:
1. Reconstitution of reagents
- Capture antibody: Add 1 ml of PBS to obtain a concentration of 720
µg.ml-1 of mouse anti-human TNFα. Dilute with PBS to a working

77
concentration of 4µg.ml-1 (working concentrations for IL-8 and IL-10
were 4µg.ml-1 and 2µg.ml-1 respectively).
- Detection antibody: Add 1 ml of Reagent Diluent to obtain a
concentration of 63 µg.ml-1 of goat anti-human TNFα. Dilute in ILMA to
a working concentration of 350 ng.ml-1.
- Standard: Add 0.5 ml of Reagent Diluent to obtain a concentration of
320 ng.ml-1 of recombinant human TNFα. Make 2-fold serial dilutions for
a 6 point standard curve up to 1,000 pg.ml-1.
- Streptavidin-HRP: Dilute to working concentration as specified on the
vial.
2. Plate preparation
- Coat plates with 100 µl of capture antibody, seal and incubate overnight
at room temperature
- Wash plates with PBS
- Block plates by adding 200 µl of 10% FBS in PBS and incubate at room
temperature for 2 h.
- Wash plates with Buffer B
3. Assay procedure
- Add 100 µl of ILMA buffer to each well
- Add 100 µl of sample or standard, cover and incubate at room
temperature for 2 h.
- Wash plate with Buffer B

78
- Add 100 µl of Detection Antibody, cover and incubate at room
temperature for 2 h.
- Wash plate in Buffer B
- Add 100 µl of Streptavidin to each well, cover and incubate at room
temperature for 2 h.
- Determine the optical density of each well using a microplate reader.
- Values were derived from a standard curve (Figure 2-14), where log of
relative light units (RLU) were directly proportional to log of plasma
concentrations of the inflammatory marker (TNF-α in this example).
-12 -11 -10 -9 -83.5
4.0
4.5
5.0
5.5
6.0
Log[TNF- (pg.ml-1
)]
Log R
LU
Figure 2-14 Example of a standard curve for cytokines using ELISA. A standard
curve was included on each plate assayed.

79
2.7 Data collection and analysis software
The following computer software programmes were used for data collection
and analysis:
StepOne™ software V 2.0, Applied Biosystems for PCR data
Microsoft office Excel 2007
GraphPad Prism version 5.0 for statistical analysis and graphical
representation.
2.7.1 Data analysis
Statistical analysis was performed using GraphPad Prism. Analysis of data
distribution was performed using D’Agostino & Pearson Omnibus normality
test.
Numerical non-parametric distributed data (e.g. NOP and ppN/OFQ mRNA
expression in the cardiac study) were analysed using Kruskal-Wallis analysis of
variance (ANOVA) with Dunn’s multiple comparison test for group analysis.
In the sepsis study the data from the recovery subgroup of 22 patients was
assumed to be of non-parametric distribution due to the small sample size.
Kruskal-Wallis ANOVA was also used in this case.
Parametric data (e.g. NOP and ppN/OFQ mRNA expression on D1 and D2 of
sepsis) were analysed with student’s t test for paired data.

80
Spearman’s Correlation coefficient for non-parametric continuous data was
used to see if there was a correlation between laboratory data (PCR results,
N/OFQ concentrations and inflammatory markers) and physiological data (e.g.
aortic cross clamp time, cardio-pulmonary bypass time, inotropic support, white
cell count, and lactate concentrations).

81
3 The effect of Cardiac surgery under cardiopulmonary
bypass on the N/OFQ system
3.1 Introduction
Cardiopulmonary bypass (CPB) is known to cause a Systemic Inflammatory
Response Syndrome (SIRS)99;100 due to mechanisms such as contact of blood
with foreign surfaces in the extracorporeal circuit, non-physiologic pulsatile
perfusion and ischemia-reperfusion injury due to cardioplegic arrest.99 These
mechanisms lead to:
- Activation of complement, kinin, fibrinolytic and coagulation cascades
- Endothelial cell activation
- Production of cytokines and of adhesion molecules
- Activation and aggregation of neutrophils and cellular immune system100
CPB is associated with increased plasma concentrations of the cytokines IL-6,
IL-8, IL-10, IL-18 and TNFα.99;100;114 Table 3-1 shows previous studies on
interleukins and CPB. Increased plasma concentrations of IL-8 have been
associated with new onset atrial fibrillation post-operatively,110 Increased IL-10
concentrations have been related to development of organ failure,111 and
increased TNFα concentrations are linked with a more complicated recovery
after cardiac surgery (based on inotrope requirement and plasma lactate).112
CPB activates PMN cells by contact with the surface of the bypass circuit;71 this
PMN cell activation is then promoted by raised cytokines. Activated PMN cells

82
release proteolytic enzymes including myeloperoxidase (MPO, see Chapter 1:
Introduction, inflammatory markers),88 matrix-metalloproteinases (MMPs), PMN
elastases and oxygen-free radicals,89 which promote organ dysfunction.
All the above mechanisms can lead to derangement in coagulation pathways98,
altered regional organ perfusion, alterations in acid-base balance, intense
systemic inflammatory activation, lung dysfunction,89 renal impairment,
gastrointestinal and metabolic changes, microemboli and neurological
impairement.115
Limited data is available regarding the N/OFQ system in patients with SIRS and
in patients with cardiac disease. Our research group has previously reported
the presence of NOP mRNA in human right atrium (n=38), but not of ppN/OFQ
mRNA (n=10), in patients with coronary artery disease undergoing cardiac
surgery with CPB.11 Fontana and colleagues116 showed increased plasma
concentrations of N/OFQ in patients with unstable angina (n=41) compared to
those with stable angina (n=7) and controls (n=20), without changes in blood
pressure or heart rate. On the other hand, Krepuska et al6 showed lower
plasma N/OFQ concentrations in patients with severe chronic angina (n=12)
compared to patients with mild angina (n=10) and healthy controls (n=14).
Stamer and colleagues34 recently reported reduced ppN/OFQ mRNA
expression in peripheral blood cells in 18 critically ill patients with sepsis (i.e.
with SIRS and documented infection), and increased NOP mRNA expression in
non-survivors of sepsis, compared with healthy controls. Williams and
colleagues33 also studied critically ill ICU patients with sepsis (n=21) and found

83
increased plasma N/OFQ concentrations in those who died compared to
survivors.
It is unclear what the human response of ppN/OFQ and NOP to inflammation
is, and whether the response of the N/OFQ system has an effect on patient
outcome. Based on animal studies and the limited evidence available in
humans (described in Chapter 1: Introduction), we hypothesise that plasma
concentrations of N/OFQ are increased in patients undergoing CPB and that
the origin of N/OFQ is the PMN cell, therefore we further hypothesise that
mRNA expression for NOP and ppN/OFQ by the PMN cells is up-regulated.
With this study we aimed to analyse the response of the N/OFQ system in
plasma and in PMN cells, and its association with clinical outcome in patients
undergoing cardiac surgery with cardiopulmonary bypass, as a model of the
inflammatory response.

84
Cytokines
studied
Methods Results Reference
IL-2, -6, -8 and -
10, MCP-1, VEGF
60 patients undergoing
CABG
Group 1: Off pump
Group 2: Pulsatile CPB
Group 3: Linear CPB
↑MCP-1, VEGF,
IL-6, -8and -10 in
CPB
↓IL-2 in CPB
Onorati,
201099
IL-1, -1ra, -6, -10
and TNFα
43 patients undergoing
CABG with CPB
↑ IL-1, -1ra, -6, -
10 and TNFα
Poulsen,
2009117
IL-6, -8 and -10 113 patients
undergoing CABG with
CPB
↑IL-6, -8 and -10
IL8 was related to
new onset AF
Wu, 2008110
TNFα and IL-10
mRNA in PBMCs
82 patients undergoing
cardiac surgery with
CPB
↑TNFα and IL-10 Duggan,
2006112
IL-10 150 patients
undergoing CABG with
CPB
↑IL-10.
IL-10 higher in
patients with
organ dysfunction
Galley,
2003111
IL-8, -10, -1ra and
TNFα
20 patients undergoing
cardiac surgery with
CPB
↑IL-8, -10, and -
1ra
No change in
TNFα
McBride,
1995118
Table 3-1 Evidence of increased inflammatory markers during cardiopulmonary
bypass. MCP-1, Monocyte chemo-attractant protein; VEGF, vascular
endothelial growth factor; CABG, coronary artery bypass grafting; CPB,
Cardiopulmonary bypass;

85
3.2 Materials and Methods
3.2.1 Patients recruitment and sample collection
With local research ethics committee approval (LREC ref: 08/H0406/103) and
written informed consent 40 patients undergoing cardiac surgery with Cardio-
Pulmonary Bypass (CPB) at Glenfield Hospital, Leicester, were recruited
between July 2008 and January 2010. Patients were ASA III and IV and aged
over 18. Most patients had an arterial line placed before induction of
anaesthesia. General anaesthesia was administered by the cardiac
anaesthetist responsible for clinical care. Overall, all patients received the
following drugs at induction of anaesthesia: alfentanil 5 – 10mg or fentanyl 0.5
– 1mg, and propofol or etomidate until loss of eyelash reflex. Vecuronium or
rocuronium was given to produce neuromuscular blockade and facilitate
tracheal intubation. Isoflurane 1 – 2% in an oxygen/air mixture was used for
maintenance of anaesthesia. Morphine 10mg was administered for analgesia at
the end of surgery. All patients had a central line and a pulmonary artery
flotation catheter sheath inserted after induction of anaesthesia. Most blood
samples were taken from the arterial line (in 2 patients the third blood sample
was taken from the central line as the arterial line had been removed).
Blood samples, 22.5 ml at each sampling, were taken at the following times:
Sample 1 (t0): Before induction of anaesthesia. 3 patients had t0 sample
taken post-induction of anaesthesia as there was no arterial line present.
We have previously seen that there is no difference in plasma N/OFQ
concentrations comparing before and immediately after induction of
anaesthesia [Median (IQR) = 5.8(1.2 – 10.8) and 3.4 (1.2 – 9) pg.ml-1
86
respectively. P value = 0.8, data from 16 patients undergoing abdominal
aortic aneurysm repair].119 Based on these results, we did not consider
necessary to standardise the anaesthetic technique.
Sample 2 (t3): 3 hours post-start of CPB
Sample 3 (t24): 18 to 24 hours post-start of CPB
3.2.2 Cardio Pulmonary Bypass pump
CPB pumps were primed following the standard local protocol at Glenfield
Hospital with the following solutions:
Plasmalyte 148 1,000 ml
Colloid 500 ml
Mannitol 10% 200 ml
Sodium bicarbonate 8.4% 45 ml
Heparin 10,000 iu
3.2.3 Blood collection for plasma extraction
As described in Chapter 2: Methods, 7.5 ml of blood was aspirated from the
arterial line into an EDTA bottle. 150 µl of aprotinin (containing 4.5 TIU, 0.6
TIU.ml-1) were immediately added to prevent protein degradation. The samples
were then transferred on ice to the laboratory and centrifuged at 3,000x g, 4˚C
for 15 minutes. The plasma obtained was stored in 1ml aliquots at -80˚C and
used for batch analysis of N/OFQ peptide by radioimmunoassay and of
cytokines and MPO by ELISA.

87
3.2.4 Radioimmunoassay
Plasma N/OFQ concentration was measured in all 120 samples (3 samples per
patient) by Radioimmunoassay. Details are described in Chapter 2: Methods.
3.2.5 ELISA
Known inflammatory markers were analysed by ELISA in all 120 samples.
Plasma IL-8, IL-10, TNFα, and MPO concentrations were determined. Details
are described in Chapter 2: Methods.
3.2.6 RT-PCR
Polymorphonuclear leucocytes were isolated from the blood samples and RT-
PCR for NOP and ppN/OFQ mRNA expression performed. Details of
polymorphonuclear extraction and RT-PCR are described in Chapter 2:
Methods.
3.2.7 Statistical analysis
Physiological data, RT-PCR results, N/OFQ plasma concentrations and
interleukin plasma concentrations were analysed for normality distribution using
D’Agostino and Pearson Omnibus using GraphPad Prism version 5.01 for
Windows, GraphPad Software, San Diego California USA, www.graphpad.com.
Statistical analyses used the non-parametric test, Kruskal-Wallis Analysis of
Variance (ANOVA), as there were more than 2 groups (t0, t3 and Rec) and
data were unpaired (some measured values were undetermined or below
detection limit, therefore there was a need to use an unpaired test).

88
Spearman’s Correlation coefficient for non-parametric data was used for
analysis of the relationship between laboratory data (i.e. PCR results, N/OFQ
concentrations, inflammatory markers) and physiological data, to determine the
degree by which two measured variables were related.
Statistical significance was considered with p values <0.05.
3.3 Results
3.3.1 Baseline patient characteristics
Patient characteristics, previous medical and drug history, functional capacity
and LV function are shown in Table 3-2 .

89
Age (years) 70.5 (61.7 – 76)
Male/Female (n) 28/12
BMI (Kg.m-2) 28 (25 – 33)
ASA physical status classification (n (%))
III
IV
33 (82)
7 (17)
Co-morbidities (n (%)):
Previous MI 5 (12)
Hypertension 28 (70)
Hypercholesterolemia 30 (75)
Diabetes 10 (25)
Smoker 5 (12)
COPD/Asthma 4 (10)
PVD 1 (2)
CVA 4 (10)
eGFR <90 28 (70)
Hypothyroid 3 (7)
Osteoporosis 1 (2)
Atrial fibrillation 7 (17)
Angina classification CCS (n (%))
No angina
1
2
3
4
13 (32)
6 (15)
16 (40)
3 (7)
2 (5)
NYHA functional class (n, (%))
1
2
3
19 (47)
14 (35)
7 (17)

90
Drug history (n (%)):
ACEI/ARB 23 (57)
Diuretic 13 (32)
β blocker 25 (62)
α blocker 2 (5)
Ca2+ channel blocker 6 (15)
Anti platelet therapy
Aspirin
Clopidogrel
Aspirin+Clopidogrel
Aspirin+Dypiridamol
27 (67)
20 (50)
3 (7)
2 (5)
2 (5)
Nitrates 12 (30)
Nicorandil 5 (12)
Statins
Simvastatin
Atorvastatin
30 (75)
24 (60)
6 (15)
Anti-arrhythmics
Amiodarone
Digoxin
4 (10)
1 (2)
3 (7)
Insulin 3 (7)
Oral hypoglycaemic 5 (12)
Warfarin 4 (10)
LV function (n (%)):
Good (EF > 50%) 25 (62)
Moderate (EF 30 – 50%) 12 (30)
Poor (EF <30%) 3 (7)
Table 3-2 Baseline patient characteristics. Values expressed as median
(Interquartile range, IQR) or number (%). BMI, Body Mass Index; ASA,
American Society of Anesthesiologists; CCS, Canadian Cardiovascular
Society; NYHA, New York heart Association.

91
3.3.2 Intra-operative and postoperative data, and physiological variables
Surgical details, physiological variables and laboratory blood results at
induction (t0), 3h (t3) and 18 – 24h (t24) post-CPB are shown in Table 3-3 and
Table 3-4. There was no significant difference between heart rate, mean
arterial pressure, white cell count and neutrophil count at t3 compared to t0.
Surgical procedure (n (%)):
CABG 17 (42.5)
Valve replacement 15 (37.5)
CABG + Valve replacement 7 (17.5)
Aortic root replacement 1 (2.5)
CPB time (mins) 89 (76 – 123)
Aorta cross-clamp time (mins) 54 (45 – 74)
Temperature on CPB (˚C) 32 (30 – 32)
Postoperative pacing (n (%)) 15 (37)
Blood transfusion at t3 (n (%)) 12 (30)
Blood transfusion at t24 (n (%)) 19 (47)
Inotropic support (n (%)) t3 t24
Minimal (Dopamine ≤5mcg.kg-1.min-1) 10 (25) 7 (17)
Moderate (Dopamine >5mcg.kg-1.min-1 and/or
adrenaline/noradrenaline ≤0.1mcg.kg-1.min-1)
20 (50) 9 (22)
Maximal (Dopamine >15mcg.kg-1.min-1, and/or
adrenaline/noradrenaline >0.1 mcg.kg-1.min-1)
2 (5) 3 (7)
Intra-aortic balloon pump at t24 (n (%)) 4 (10)
ITU stay (days) 1 (1 – 3.7)
Hospital stay (days) 15 (10 – 31)
30 Day mortality (n (%)) 1 (2)
Table 3-3. Surgical details. Values expressed as median (IQR) or number (%).

92
t0 t3 t24
HR (bpm) 64
(56 - 72)
85
(79 - 90)
84
(71 - 88)
MAP(mmHg) 90
(79 - 102)
70
(63 - 82)
75
(69 - 81)
Temperature (˚C)
36
(35.3 - 36.5)
36.8
(36.5 - 37.2)
SOFA score
5
(3.2 - 6)
4
(1 - 6)
WCC (x109/L) 7.9
(6.4 - 10) 10.5 (8.8 - 14.1)
10
(7.9 - 12.5)
Neutrophils (%)
66.5
(61 - 81)
83
(80.2 - 85.7)
84
(81 - 86)
Platelets (x109/L)
232
(187 - 267)
151.5
(128 - 208)
154
(116 - 197)
Creatinine
(µmol/L)
85
(76.2 - 102.3)
80
(71 - 100)
79
(67 - 120)
pH
7.37
(7.35 - 7.41)
7.37
(7.34 - 7.38)
BE
-3.5
(-2.2 - -4.8)
-2.8
(-1.8 - -3.7)
Lactate
2.1
(1.6 - 3.5)
1.4
(1 - 2.3)
PaO2/FiO2 (kPa)
31.4
(26.3 - 44.2)
43
(31 - 52)
Table 3-4. Physiological variables and laboratory blood results. Values
expressed as Median (IQR). HR, heart rate; MAP, mean arterial pressure;
SOFA, Sequential Organ Failure Assessment; WCC, white cell count; BE, Base
Excess; kPa, kilopascals. There was no significant difference between the
different sample timings (p value >0.05, Kruskal-Wallis ANOVA with Dunn’s
comparison test).
At 3h post-CPB, two patients needed an intra-aortic balloon pump (IABP), and
one of them needed milrinone. At 18 – 24h post-CPB, 8 patients were on

93
mechanical ventilation and sedated, 4 patients had an IABP and 1 patient was
on continuous veno-venous hemofiltration (CVVH). One patient died on day 31.
3.3.3 NOP and ppN/OFQ mRNA expression by PMN leucocytes
NOP and ppN/OFQ gene expression by polymorphonuclear leucocytes was
assessed by changes in ∆Ct (difference in cycle threshold between gene of
interest and housekeeping gene, GAPDH). An increase of ∆Ct represents a
reduction in gene expression. We present data for the ∆Ct, fold change (2(-∆∆Ct))
and percentage change.
NOP
NOP mRNA expression by polymorphonuclear leucocytes significantly reduced
at 3h post-CPB (t3) and remained significantly reduced at 18 – 24h post-CPB
(t24). This is expressed by an increase in ∆Ct from a median value of 4.9 at t0
to 6.1 at t3 (this one cycle difference is a halving of start material). All but 2 and
6 patients had NOP mRNA reduction at t3 and t24 respectively (Figure 3-1 and
Figure 3-2).
ppN/OFQ
ppN/OFQ mRNA expression by polymorphonuclear leucocytes decreased
significantly at t3 and remained significantly lower than baseline at t24. This is
expressed by an increase in ∆Ct from 13.7 at t0 to 18.2 at t3. Figure 3-3. and
Figure 3-4.

94
t0 t3 t240
2
4
6
8
10 * *
NOP Ct
NO
P
Ct
Trend of NOP Ct
t0 t3 t240
2
4
6
8
10
NO
P
Ct
Figure 3-1. NOP mRNA expression by polymorphonuclear leucocytes in patients undergoing cardiac surgery. Data expressed as
median (boxes and values in parentheses are IQR), end of whiskers indicate range. Data were analysed using Friedman ANOVA
with Dunn’s multiple comparison test. *p<0.05 compared to induction samples.
NOP t0 (n=40) t3 (n=40) t24 (n=40)
∆Ct 4.9 (4.5 – 5.3) 6.1 (5.7 - 6.6)*
5.6 (4.9 - 6.3)*

95
Fold change of NOP mRNA
0.0
0.5
1.0
1.5
t24t3t0
Fo
ld C
ha
ng
e
Figure 3-2. Fold change in NOP mRNA expression by polymorphonuclear leucocytes in patients undergoing cardiac surgery. n=40
at all three sampling times. Data expressed as median (IQR). t3 and t24 are compared to t0.
NOP t3 t24
Fold change 0.42
( 0.3 – 0.49)
0.55
(0.33 – 0.8)
% change ↓57%
(50% – 68%)
↓44%
(19% – 66%)

96
ppN/OFQ Ct
t0 t3 t240
10
20
30
40 **
pp
N/O
FQ
C
t
Trend of ppN/OFQ Ct
t0 t3 t240
10
20
30
40
pp
N/O
FQ
C
t
Figure 3-3. mRNA expression of ppN/OFQ by polymorphonuclear leucocytes in patients undergoing cardiac surgery. Data
expressed as median (boxes and values in parentheses are IQR), end of whiskers indicate range. *p<0.05 compared to induction
samples. Data were analysed using Kruskal-Wallis ANOVA with Dunn’s multiple comparison test.
t0 (n= 34) t3 (n= 36) t24 (n= 34)
ppN/OFQ ∆Ct 13.7 (12.7 - 15.3) 18.2 (16.8 - 20.5)* 16.8 (15.7 - 19.2)*
Undetermined ∆Ct n=6 n=4 n=6

97
Fold change of ppN/OFQ mRNA
0.0
0.5
1.0
1.5
t24t3t0
Fo
ld C
ha
ng
e
Figure 3-4. Fold change in ppN/OFQ mRNA expression by polymorphonuclear leucocytes in patients undergoing cardiac surgery.
Data expressed as median (IQR) comparing t3 and t24 with t0. 32 patients had ppN/OFQ ∆Ct determined both at t0 and t3; all had
reduced mRNA expression at t3. 31 patients had ppN/OFQ ∆Ct determined both at t0 and t24, 29 of these patients had reduced
mRNA expression.
ppN/OFQ
t3
n= 32
t24
n= 31
Fold change 0.04 (0.02 – 0.17) 0.1 (0.04 – 0.26)
% change ↓95% (81% – 98%) ↓91% (74% – 96%)

98
3.3.4 Relationship between NOP and ppN/OFQ mRNA
There was reduced mRNA expression of both N/OFQ receptor and peptide
precursor by polymorphonuclear leucocytes. However, there was no correlation
between NOP and ppN/OFQ reduction at 3h post-CPB, Figure 3-5.
NOP vs ppN/OFQ Ct
-1 0 1 2 3 4
5
10
15
rs= -0.12
p= 0.48
NOP Ct
pp
N/O
FQ
Ct
Figure 3-5. Spearman Correlation (rs) of NOP ∆∆Ct vs ppN/OFQ ∆∆Ct (∆Ct at
t3 minus ∆Ct at t0). n=36. There was no correlation between reduced mRNA
expression of NOP and reduced mRNA expression of ppN/OFQ at 3h post-
CPB.
3.3.5 N/OFQ plasma concentrations measured by RIA
Plasma concentrations of N/OFQ were analysed by radioimmunoassay.
Plasma N/OFQ increased significantly from a median value of 9.3 pg.ml-1 to
12.2 pg.ml-1 at 3h post- CPB, and returned to above baseline concentrations at
18 – 24h post-CPB (median 10.3 pg.ml-1), Figure 3-6.

99
N/OFQ Plasma concentrations
t0 t3 t24
0
5
10
15
20
25 *
pg.m
l-1
Trend N/OFQ plasma concentrations
t0 t3 t240
5
10
15
20
25
pg.m
l-1
Plasma N/OFQ t0 (n=35) t3 (n=36) t24 (n=37)
pg.ml-1 9.3 (7.4 – 12.6) 12.2 (9.2 – 14.4)* 10.3 (7.5 – 13.1)
Figure 3-6. Plasma N/OFQ concentrations by RIA during CPB. Data expressed as median (boxes and values in parentheses are
IQR), end of whiskers indicate range. Plasma N/OFQ was not determined in 5, 4 and 3 samples at t0, t3 and t24 respectively. In
25/33 patients there was a significant increase at t3 compared to t0, whilst in 8 patients the concentrations were lower. Data were
analysed using Kruskal-Wallis ANOVA with Dunn’s multiple comparison test. *p=0.01 compared to induction samples.

100
3.3.6 Relationship between plasma N/OFQ concentrations and NOP and
ppN/OFQ mRNA expression
During cardiopulmonary bypass there was an increased plasma concentration
of N/OFQ and a reduced expression of NOP and ppN/OFQ mRNA by
polymorphonuclear leucocytes. There was an inversely proportional
relationship between plasma N/OFQ and NOP mRNA expression. The higher
the plasma N/OFQ (∆N/OFQ = N/OFQ at t3 minus N/OFQ at t0) the lower the
NOP mRNA expression (expressed by a high ∆∆CT value. ∆∆CT= ∆Ct at t3
minus ∆Ct at t0). Regarding ppN/OFQ, there was no correlation between
plasma N/OFQ concentration and ppN/OFQ mRNA expression, Figure 3-7
-10 -5 5 10 15
-5
5
10
15
Ct ppN/OFQ
rs= 0.29 (p= 0.14)
Ct NOP
rs= 0.38 (p= 0.02)
N/OFQ pg.mL-1
Ct
Figure 3-7. Correlation between ∆N/OFQ (t3 minus t0) plasma concentrations
and NOP and ppN/OFQ ∆∆Ct (∆Ct at t3 minus ∆Ct at t0) using Spearman’s
correlation coefficient.

101
3.3.7 Inflammatory markers. Cytokines IL-8, IL-10, TNFα, and MPO
IL-8, IL-10, TNFα and MPO concentrations were measured in plasma at t0, t3
and t24.
IL-8
Plasma concentrations of IL-8 were determined in all 3 samples of all 40
patients. In 38 patients IL-8 increased from a median value of 11.6 pg.ml-1 at t0
to 91.2 pg.ml-1 at t3 (P value <0.01), and still remained significantly higher at
t24 (Figure 3-8).
IL-10
Plasma concentrations of IL-10 were obtained in 32 patients at t0 (other values
were below detection limit) and in all 40 patients at t3 and t24. In 30/32 patients
there was a significant increase of IL-10 from a median value of 35.4 pg.ml-1 at
t0 to 164.7 pg.ml-1 at t3. At t24 IL-10 returned to above baseline values, 82.2
pg.ml-1 (Figure 3-9).
TNFα
Plasma concentrations of TNFα were obtained in 36 patients at t0 and 39
patients at t3 and at t24 (other values were below detection limit). TNFα
remained largely unchanged after CPB (Figure 3-10).
MPO
MPO plasma concentrations were obtained in all 3 samples of all 40 patients.
In 37/40 patients MPO significantly increased from 79 ng.ml-1 at t0 to 129
ng.ml-1 at t3 (p value < 0.0001). At t24 MPO values returned to just below
baseline values (Figure 3-11).

102
IL-8
t0 t3 t24
1
10
100
1000
10000 * *
Lo
g
pg
.ml-1
Trend IL-8 plasma concentrations
t0 t3 t24
1
10
100
1000
10000
Lo
g
pg
.ml-1
Figure 3-8. IL-8 plasma concentrations in patients undergoing cardiac surgery. Data expressed as median (boxes and values in
parentheses are IQR), end of whiskers indicate range. Data were analysed using Friedman ANOVA with Dunn’s multiple
comparison test. *P<0.01
Plasma IL-8 t0 (n=40) t3 (n=40) t24 (n=40)
pg.ml-1 11.6 (5 - 135) 91.2 (58 - 357)* 51.33 (26 - 377)*
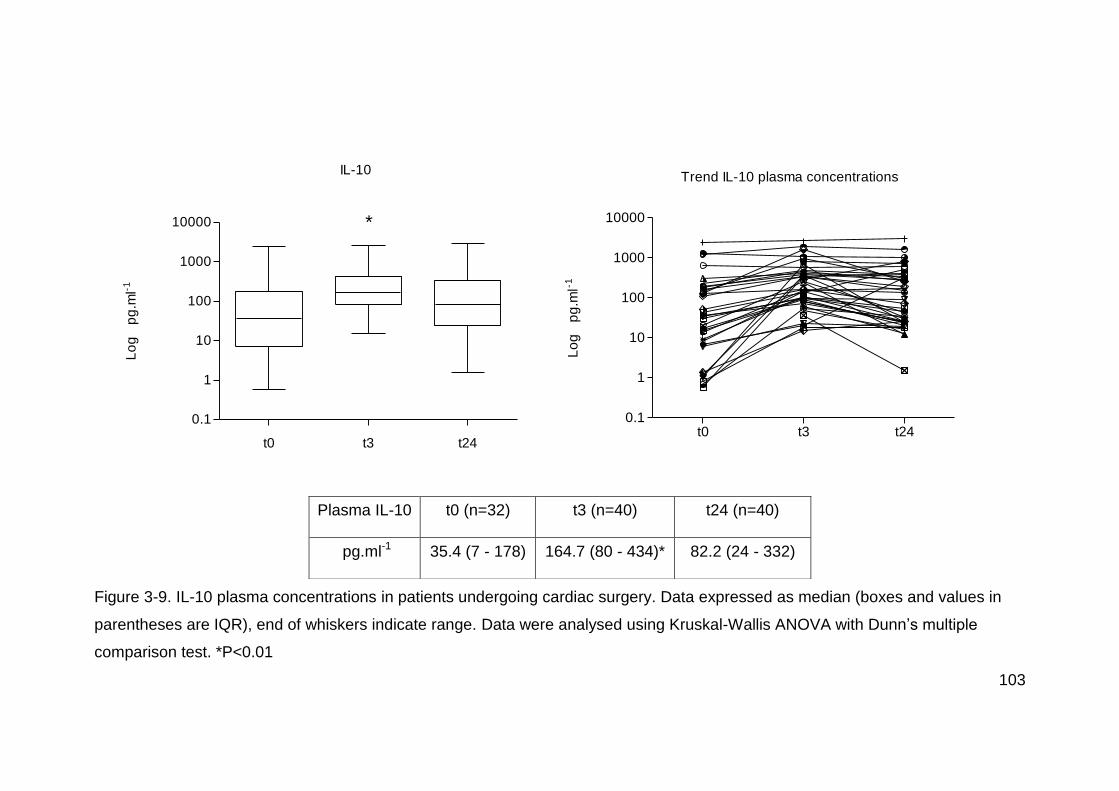
103
IL-10
t0 t3 t24
0.1
1
10
100
1000
10000 *
Lo
g
pg
.ml-1
Trend IL-10 plasma concentrations
t0 t3 t240.1
1
10
100
1000
10000
Lo
g
pg
.ml-1
Figure 3-9. IL-10 plasma concentrations in patients undergoing cardiac surgery. Data expressed as median (boxes and values in
parentheses are IQR), end of whiskers indicate range. Data were analysed using Kruskal-Wallis ANOVA with Dunn’s multiple
comparison test. *P<0.01
Plasma IL-10 t0 (n=32) t3 (n=40) t24 (n=40)
pg.ml-1 35.4 (7 - 178) 164.7 (80 - 434)* 82.2 (24 - 332)
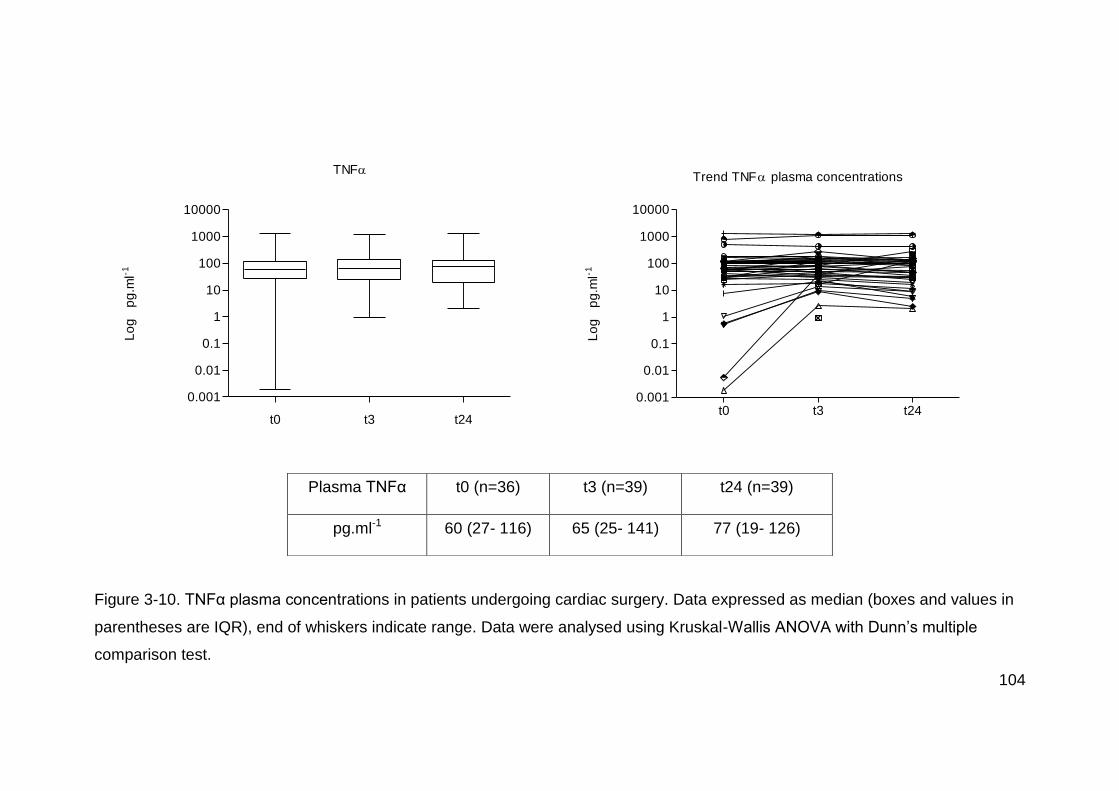
104
TNF
t0 t3 t24
0.001
0.01
0.1
1
10
100
1000
10000
Lo
g
pg
.ml-1
Trend TNF plasma concentrations
t0 t3 t240.001
0.01
0.1
1
10
100
1000
10000
Lo
g
pg
.ml-1
Figure 3-10. TNFα plasma concentrations in patients undergoing cardiac surgery. Data expressed as median (boxes and values in
parentheses are IQR), end of whiskers indicate range. Data were analysed using Kruskal-Wallis ANOVA with Dunn’s multiple
comparison test.
Plasma TNFα t0 (n=36) t3 (n=39) t24 (n=39)
pg.ml-1 60 (27- 116) 65 (25- 141) 77 (19- 126)

105
MPO
t0 t3 t24
0
100
200
300
400*
ng
.ml-1
Trend MPO plasma concentrations
t0 t3 t240
100
200
300
400
ng
.ml-1
Figure 3-11. MPO Plasma concentrations. Data expressed as median (boxes and values in parentheses are IQR), end of whiskers
indicate range. Data were analysed using Friedman ANOVA with Dunn’s multiple comparison test. *P<0.0001
Plasma MPO t0 (n=40) t3 (n=40) t24 (n=40)
ng.ml-1 79 (59 – 116) 129 (94 – 199)* 67 (52 – 103)

106
3.3.8 Relationship between NOP and ppN/OFQ mRNA expression and
inflammatory markers during inflammation
There was no relationship between the lower mRNA expression of NOP and
ppN/OFQ mRNA during CPB and the inflammatory response measured as
increased IL-8, IL-10 and MPO. Table 3-5 shows spearman correlation and p
values.
ΔΔCt NOP ΔΔCt ppN/OFQ
rs p value rs p value
ΔIL-8 0.004 0.9 0.06 0.72
ΔIL-10 0.25 0.16 -0.004 0.98
ΔMPO 0.12 0.43 -0.17 0.35
Table 3-5 Correlation between change in NOP and ppN/OFQ mRNA
expression (ΔΔCt (ΔCt at t3 minus ΔCt at t0)) and Δ of inflammatory markers
(change of concentrations between t3 and t0) using Spearman’s correlation
coefficient (rs).
3.3.9 Relationship between plasma N/OFQ concentrations and
inflammatory markers
Plasma N/OFQ concentrations displayed a similar response to CPB as the
inflammatory markers IL8, IL10 and MPO, an increase at 3h post-CPB which
reduced at 18 – 24h post-CPB. There was a correlation between plasma
concentrations of N/OFQ and plasma concentrations of MPO when comparing
all 3 samples. However, there was no correlation between concentrations of

107
plasma N/OFQ and those of IL-8 or IL-10. (Figure 3-12, Figure 3-13). This
may suggest the PMN cell as a common source for N/OFQ and MPO release.
0 5 10 15 20 250
100
200
300
400
rs= 0.24
p= 0.01
Plasma [N/OFQ] pg.ml-1
Pla
sm
a [
MP
O]
ng
.ml-1
Figure 3-12. Spearman correlation (rs) of plasma N/OFQ concentrations vs
plasma MPO concentrations.
0 5 10 15 20 25
0
200
400
2000
4000
IL-8
IL-10
Plasma [N/OFQ] pg.ml-1
Infla
mm
ato
ry m
ark
ers
pg
.ml-1
Figure 3-13. Spearman correlation (rs) comparing plasma N/OFQ
concentrations with plasma IL-8 and IL-10 concentrations.
IL-8 IL-10
rs 0.13 0.09
P value 0.16 0.33

108
There was no relationship between the change of IL8, IL10 or MPO (t3 minus
t0) with the change seen on plasma N/OFQ concentrations at 3h post-CPB, (t3
minus t0). Figure 3-14.
-10 -5 5 10 15
-500
500
1000
1500
2000
IL-10
Plasma [N/OFQ] pg.ml-1
IL-8
MPO
inflam
ma
tory
ma
rke
rs
Figure 3-14. Spearman correlation (rs) of plasma ΔN/OFQ concentrations (t3
minus t0) vs Δ inflammatory markers (t3 minus t0).
ΔN/OFQ vs ΔIL-8 ΔN/OFQ vs ΔIL-10 ΔN/OFQ vs ΔMPO
rs 0.33 0.24 0.003
P value 0.06 0.20 0.98

109
3.3.10 Correlation between clinical findings and laboratory results
We analysed the relationship between plasma N/OFQ concentrations, and
mRNA expression of NOP and ppN/OFQ with CPB time, AXC time, and
inotropic support. Data showed that plasma N/OFQ concentrations significantly
increased at t3 compared to t0, see Figure 3-15, and NOP mRNA expression
significantly reduced at t3 in patients with longer AXC time, see Figure 3-16.
CPB time did not have an effect on N/OFQ concentration or mRNA expression
of NOP or ppN/OFQ. Neither, there was a correlation between N/OFQ system
and inotropic support required.
Plasma N/OFQ vs AXC time
50 100 150 200
-10
-5
0
5
10
15
rs= 0.42
p= 0.01
AXC time (minutes)
N
/OF
Q p
g.m
l-1
Figure 3-15. Spearman correlation (rs) of change in plasma N/OFQ
concentration (ΔN/OFQ, t3-t0) vs aortic cross clamp (AXC) time.

110
AXC time vs NOP Ct
50 100 150 200
-1
0
1
2
3
4
rs = 0.46
p = 0.002
AXC time (minutes)
NO
P
Ct
Figure 3-16. Spearman correlation (rs) of aortic cross clamp time (AXC) vs NOP
ΔΔCt (ΔCt at t3 – ΔCt at t0).
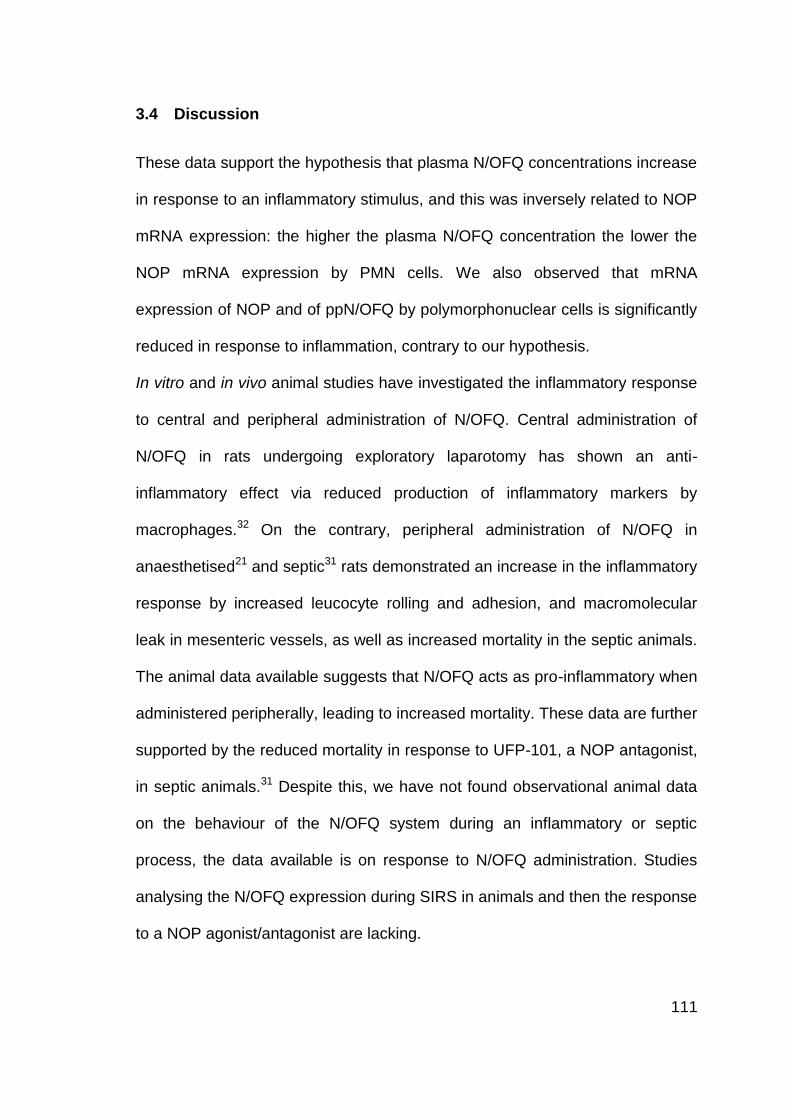
111
3.4 Discussion
These data support the hypothesis that plasma N/OFQ concentrations increase
in response to an inflammatory stimulus, and this was inversely related to NOP
mRNA expression: the higher the plasma N/OFQ concentration the lower the
NOP mRNA expression by PMN cells. We also observed that mRNA
expression of NOP and of ppN/OFQ by polymorphonuclear cells is significantly
reduced in response to inflammation, contrary to our hypothesis.
In vitro and in vivo animal studies have investigated the inflammatory response
to central and peripheral administration of N/OFQ. Central administration of
N/OFQ in rats undergoing exploratory laparotomy has shown an anti-
inflammatory effect via reduced production of inflammatory markers by
macrophages.32 On the contrary, peripheral administration of N/OFQ in
anaesthetised21 and septic31 rats demonstrated an increase in the inflammatory
response by increased leucocyte rolling and adhesion, and macromolecular
leak in mesenteric vessels, as well as increased mortality in the septic animals.
The animal data available suggests that N/OFQ acts as pro-inflammatory when
administered peripherally, leading to increased mortality. These data are further
supported by the reduced mortality in response to UFP-101, a NOP antagonist,
in septic animals.31 Despite this, we have not found observational animal data
on the behaviour of the N/OFQ system during an inflammatory or septic
process, the data available is on response to N/OFQ administration. Studies
analysing the N/OFQ expression during SIRS in animals and then the response
to a NOP agonist/antagonist are lacking.

112
The in vitro evidence available shows an increased N/OFQ production in rat
splenocytes stimulated with pro-inflammatory LPS and Concanavalin A.29
In humans, most N/OFQ studies relate to acute and chronic pain, and few
studies have been conducted in patients with cardiac disease. Our research
group reported that NOP is expressed in the human right atrium of patients with
coronary artery disease undergoing cardiac surgery under CPB (n=38), whilst
ppN/OFQ mRNA was not expressed (n=10).11 Whether the expression of NOP
is related to the underlying ischaemic heart disease or to the CPB is unknown.
Fontana and colleagues7 measured plasma N/OFQ concentrations in patients
with stable and unstable angina. Even though the plasma N/OFQ
concentrations were increased in those patients with unstable angina, it is
difficult to conclude whether this is related to pain or to ischaemic heart disease
itself.
3.4.1 Plasma N/OFQ
We found in this study that plasma N/OFQ concentrations increased in
response to the inflammatory stimulus of CPB. N/OFQ behaved in a similar
manner to known inflammatory markers such as IL-8, IL-10 and MPO. Williams
and colleagues33 also reported an increase in plasma N/OFQ concentrations in
response to sepsis. In Williams’ study the higher concentrations of N/OFQ were
found in patients who died of sepsis. We have conducted our study in mostly
elective patients undergoing cardiac surgery, where physiological and
biochemical patient response to CPB was similar amongst patients. Plasma

113
N/OFQ was found to be increased with prolonged aortic cross clamp time, but
not with CPB time.
3.4.2 NOP and ppN/OFQ mRNA expression by PMN cells
PMN cells comprise the majority of the immunocyte cell population and is
comprised mainly of neutrophils (42 – 70%).120 The most common response to
inflammation is leucocytosis with neutrophilia, where the neutrophil count can
reach over 90% of leucocytes, therefore we opted for analysing the PMN cell
population.
mRNA expression of NOP and ppN/OFQ is known to occur in various immune
cells, which is not the case for classical opioid receptors (mu: MOP, kappa:
KOP, delta: DOP).16 Monocytes, lymphocytes,14;15 and PMN cells, 14;17 they all
have been reported to express mRNA for the N/OFQ receptor and peptide.
In this study we observed reduced mRNA expression of both the N/OFQ
receptor NOP and its peptide precursor ppN/OFQ by PMN cells, contrary to our
hypothesis. These findings are partly similar to those of Stamer and
colleagues,34 where there was also a reduced expression of ppN/OFQ mRNA
but an increase in NOP mRNA in septic patients. It is clear that they are two
different patient populations (SIRS and Sepsis) with different cells being
analysed (PMN cells and peripheral blood cells), however one would hope for a
similar response by immunocytes to SIRS or Sepsis.
It is possible that when plasma N/OFQ concentrations increase in response to
the inflammatory process, ppN/OFQ and NOP mRNA expression fall as they
are degraded to produce protein.

114
To date, there are no other human studies available in the literature observing
the response of the N/OFQ system by immunocytes during inflammation.
3.4.3 Limitations of the study
There are some limitations to this study:
1. All PCR studies are limited to investigating the mRNA expression of a given
gene; however, this does not necessarily translate into the amount of protein,
which is the critical response to analyse. In our study we have measured
N/OFQ by RIA. In the absence of any usable specific antibodies and the limited
amount of tissue needed for radioligand binding assays we were unable to
directly quantify NOP protein.
2. Sampling time in CPB studies vary from either after the start or the end of
CPB. We chose to take the first sample at 3 hours after the start of CPB, as this
is the closest to the inflammatory stimulus and the inflammatory response is
more likely to be at its highest. In addition, there is the practical point that
immediate laboratory processing of the samples is needed and this is a lengthy
process which is facilitated by earlier sampling.
3. There are no data available relating to N/OFQ and CPB or N/OFQ
expression by PMN cells during inflammation. This was performed as a pilot
study. The number of 40 patients was chosen as being feasible to recruit with
the resources available, including time. The literature shows a great variety of
sample sizes in CPB studies, varying from around 15 to 150 patients. We
considered 40 patients for a pilot study would give an adequate representation
115
of the population regarding mRNA expression of the N/OFQ system by PMN
cells.
There were no exclusion criteria in this observational study. Adult patients listed
for elective or semi-elective cardiac surgery who gave informed consent were
recruited, thus reducing patient bias.
3.5 Conclusion
These data confirmed our hypothesis that plasma N/OFQ concentrations in
humans would increase in response to an inflammatory stimulus in a similar
manner to IL-8, IL-10 and MPO. The source of this peptide during inflammation
is unknown: immunocytes being a likely potential source. In this study we found
a reduced expression of mRNA precursor ppN/OFQ as well of its receptor
NOP; NOP expression was related to higher plasma N/OFQ concentrations. It
is possible that immunocytes release N/OFQ during an inflammatory process
and this leads to a negative feedback, reducing the expression of NOP and
ppN/OFQ from the immune cells. Further studies are needed to investigate the
protein expression of N/OFQ by immunocytes; in particular each immune cell
type.
116
4 Effect of N/OFQ in vitro on NOP and ppN/OFQ mRNA
expression by PMN cells
4.1 Introduction
Preliminary analysis of the mRNA expression of NOP and ppN/OFQ by PMN
cells during cardio pulmonary bypass (Chapter 3: The effect of Cardiac surgery
under cardiopulmonary bypass on the N/OFQ system), showed reduced mRNA
expression of both peptide and receptor at 3 hours after cardiopulmonary
bypass.
Previously, our research group found increased plasma N/OFQ concentrations
in those critically ill patients with sepsis who died,33 and we found increased
plasma N/OFQ concentrations in response to an inflammatory process such as
cardiopulmonary bypass. We, therefore, hypothesised that plasma N/OFQ has
a negative feedback effect on mRNA expression of NOP and ppN/OFQ by
PMN cells. With this in mind, we exposed PMN cells to N/OFQ in vitro and
analysed the change in NOP and ppN/OFQ mRNA expression.
4.1.1 Sample collection
Local research ethics committee approval was obtained as detailed in Chapter
3: The effect of Cardiac surgery under cardiopulmonary bypass on the N/OFQ
system.
Blood samples (7.5 ml in EDTA sampling bottles) were obtained before
induction of anaesthesia from 4 patients (study identification numbers CN18,

117
20, 23 and 26) undergoing cardiac surgery under cardiopulmonary bypass, and
transferred at room temperature to the laboratory.
4.1.2 Method
PMN cell extraction
PMN cell extraction was performed by gradient method using Polymorphprep™
(Axis-Shield), as described in Chapter 2: Methods, following the manufacturer’s
protocol.
Incubation
PMN cells were suspended in 1 ml of PBS. The cells were divided into two
groups:
- N/OFQ group: PMN cells + 1 µM N/OFQ (concentration chosen as top of
the dose response curve for most in vitro pharmacological measures) +
10 µM peptidase inhibitor to prevent peptide breakdown during the
experiment. These were amastatin, bestatin, phosphorhamidon and
captopril.
- Control group: PMN cells + 10 µM peptidase inhibitor
The samples were incubated at 37˚C for 3 h, which was the time the second
sample was taken in the CPB study described in Chapter 3, 3 hours after start
of CPB. .
After 3 h of incubation the cells were centrifuged and the pellet dissolved in 1
ml of Tri-reagent and stored at -80˚C for RT-PCR batch analysis (described in
Chapter 2: Methods).

118
4.1.3 Results
NOP
After 3 hours incubation there was reduced NOP mRNA expression in all 4
patients’ samples. However, the control group with only peptidase inhibitor had
similar reduced mRNA expression as the N/OFQ in vitro group. See Figure
4-1.

119
NOP - in vitro CN18
t0 t3 Control4.5
5.0
5.5
6.0
6.5
7.0
C
t
NOP - in vitro CN20
t0 t3 Control4
5
6
7
8
9
Ct at t3
post-CPB
C
t
NOP - in vitro CN23
t0 t3 Control4
5
6
7
8
9
C
t
NOP - in vitro CN26
t0 t3 Control4.5
5.0
5.5
6.0
6.5
C
t

120
NOP t0 ΔCt t3 in vitro ΔCt
(% change)
Control in vitro ΔCt
(% change)
t3 ΔCt Post-CPB
(% change)
CN 18 5.1 5.6 (↓28%) 5.7 (↓34%) 6.4 (↓58%)
CN 20 4.9 8.4 (↓91%) 8.3 (↓90%) 5.8 (↓44%)
CN 23 4.8 6.7 (↓72%) 6.6 (↓71%) 6.4 (↓65%)
CN 26 4.7 5.7 (↓49%) 5.6 (↓47%) 5.7 (↓48%)
Figure 4-1 NOP ΔCt of in vitro PMN cells from 4 patients undergoing
cardiopulmonary bypass. t0: induction of anaesthesia; t3 in vitro: 3 h post-
incubation on N/OFQ; Control in vitro: 3 h post-incubation on peptidase
inhibitor. In brackets % change of mRNA expression of NOP compared to t0.
An increase in ΔCt represents a reduction in mRNA expression (↓). ◊ indicates
ΔCt at 3 h post-CPB, for comparison.
ppN/OFQ
After 3 hours incubation of PMN cells with N/OFQ, ppN/OFQ mRNA expression
was reduced in 3 out of 4 patients’ samples. Similar effect was seen in the
control peptidase inhibitor only group. Comparing ppN/OFQ expression at 3
hours post-CPB and post-in vitro N/OFQ, there was higher reduction in mRNA
expression during CPB in 3 patients. See Figure 4-2.

121
ppN/OFQ - in vitro CN18
t0 t3 Control10
12
14
16
18
C
t
ppN/OFQ - in vitro CN20
t0 t3 Control12
14
16
18
20Ct at t3
post-CPB
C
t
ppN/OFQ - in vitro CN23
t0 t3 Control10
12
14
16
18
20
C
t
ppN/OFQ - in vitro CN26
t0 t3 Control12
14
16
18
20
22
24
C
t

122
ppN/OFQ t0 ΔCt t3 in vitro ΔCt
(% change)
Control in vitro ΔCt
(% change)
t3 ΔCt Post-CPB
(% change)
CN 18 12.4 16.9 (↓95%) 15 (↓83%) 17 (↓95%)
CN 20 13 14.4 (↓61%) 14.2 (↓54%) 17.3 (↓94%)
CN 23 11.5 15 (↓91%) 13.9 (↓81%) 18.4 (↓99%)
CN 26 15.1 14.2 (↑88%) 13.5 (↑209%) 21.5 (↓98%)
Figure 4-2 ppN/OFQ ΔCt of in vitro PMN cells from 4 patients undergoing
cardiopulmonary bypass. t0: induction of anaesthesia; t3 in vitro: 3 h post-
incubation on N/OFQ; Control in vitro: 3 h post-incubation on peptidase
inhibitor. In brackets % change of mRNA expression of ppN/OFQ compared to
t0. An increase in ΔCt represents a reduction in mRNA expression (↓) and vice
versa. ◊ indicates ΔCt at 3 h post-CPB, for comparison.
4.2 Discussion
Exposure of PMN cells to N/OFQ in vitro showed reduced expression of NOP
and ppN/OFQ mRNA, similar to the effect seen in vivo after 3 hours of CPB.
However, the control in vitro samples, with only peptidase inhibitor, had similar
mRNA expression response to N/OFQ as the N/OFQ samples.
From this small sample size we cannot draw any firm conclusions as to
whether N/OFQ is responsible for the reduced mRNA expression of NOP and
ppN/OFQ seen after CPB. The effect seen by peptidase inhibitor (PI) may be
due to PI protecting any released N/OFQ from the PMN cell and therefore
potentiating any autocrine feedback effect.
123
Further studies are needed in both healthy volunteers and patients, to quantify
the mRNA expression of PMN cells exposed to different doses of N/OFQ. In
addition other methods of peptide protection should be considered such as
using a range of more selective peptidase inhibitors.
4.3 Conclusion
The data obtained from this in vitro study suggests the possibility that increased
plasma N/OFQ concentration has an effect on mRNA expression of the N/OFQ
system by PMN cells. In this small in vitro study we found reduced NOP and
ppN/OFQ mRNA expression by PMN cells when exposed to N/OFQ 1 µM.
However, a similar response was obtained within the control group containing
Peptidase Inhibitor only. These results either suggest that in vitro N/OFQ has
no effect on mRNA expression of NOP / ppN/OFQ or that the peptidase
inhibitor potentiates the effect of any N/OFQ released by the PMN cell itself.

124
5 The effect of systemic sepsis on the N/OFQ system
5.1 Introduction
In the period between 1995 and 2000, 27% of the Intensive Care Unit (ICU)
admissions in the UK were due to severe sepsis.121 Of these patients 35% died
in the ICU and 47% during their hospital stay. There has been an increase in
the number of patients admitted to ICU with sepsis, from 23% in 1996 to 28% in
2004.122 Even though hospital mortality decreased from 48% in 1996 to 44% in
2004, the overall number of deaths increased.
The definitions of SIRS (systemic inflammatory response syndrome), sepsis,
severe sepsis, and septic shock, that describe the clinical response and
provide a working definition for clinical studies, were initially defined in the
consensus conference by the American College of Chest Physicians and the
Society of Critical Care Medicine in 1991,123 and have subsequently been
adapted or modified to make them more clinically applicable.124 Table 5-1

125
Condition Definition
SIRS Systemic inflammatory response to a variety of severe
clinical insults. The response is manifested by two or more
of the following conditions:
1) Temperature >38C or <36C
2) Heart rate >90 bpm
3) Respiratory rate >20 breaths per minute or PaCO2 <4.2
kPa
4) White blood cell count >12 x 109/l or <4 x 10⁹/l, or >10%
immature forms
Sepsis SIRS in response to infection, manifested by two or more of
the above conditions + evidence of infection.
Severe sepsis Sepsis associated with organ dysfunction, hypoperfusion,
or hypotension. Hypoperfusion may be manifested by lactic
acidosis, oliguria, acute alteration in mental status, acute
lung injury, cardiac dysfunction, amongst others.
Septic shock Severe sepsis associated with hypotension despite
adequate fluid resuscitation or need of inotropic support to
maintain mean BP > 60mmHg.
Table 5-1 Definitions of SIRS and sepsis.123;124
The pathophysiology of sepsis involves multiple inter-related pathways. One of
the initial processes of cellular immunity involves activation of leucocytes,
which triggers a sequence of events: neutrophil rolling and adhesion to
activated endothelium; migration of leucocytes into the affected tissues by
chemotaxis; recognition and binding to micro-organisms; and finally engulfment
and phagocytosis of microorganisms. These processes are mediated by
126
cytokines (tumour necrosis factor and interleukins IL-1, IL-2, IL-6, IL-8, IL-18)
released from macrophages, monocytes, and other cells, which maintain the
ongoing chemotaxis and inflammatory response.53
This inflammatory response is controlled by programmed cell death or
apoptosis of leucocytes, which seems to be delayed in sepsis. If the leucocyte-
mediated response is not limited to the zone of initial infection, a widespread
inflammatory response occurs. Moreover, neutrophils also contain proteolytic
enzymes and produce reactive oxygen species, which are necessary for the
degradation of engulfed pathogens. If these substances, along with
inflammatory cytokines are released, then damage to the surrounding healthy
tissue can occur.125 Mitochondrial-specific oxidative damage is a potential
treatment target to prevent the inflammatory response and multi-organ
failure.126
Consequences of sepsis include: 1) dysfunction of the macro and
microcirculation which compromises tissue perfusion and organ function; 2)
hypotension and vascular dysfunction secondary to increased nitric oxide (NO)
production, activation of vascular potassium channels and hormonal changes
(e.g. vasopressin and cortisol); and 3) metabolic dysfunction such as
hyperglycaemia which leads to widespread cellular damage.53
Various inflammatory markers and scoring systems have been investigated and
used in the critically ill patient with sepsis to assist with diagnosis, severity of

127
the disease, and prognosis. Increased CRP, PCT, IL-6, IL-8, IL-10 and TNFα
plasma concentrations relate to severity of sepsis.127-129
APACHE II and SOFA score are used to predict the outcome of ICU patients.
SOFA score on the first day of bacteraemia was shown to be an independent
prognostic factor for outcome.130
5.1.1 N/OFQ system and sepsis
Various in vitro and in vivo studies have shown the presence of NOP and
N/OFQ in immune cells and its involvement during an inflammatory and septic
process. At present there are only two human studies available in the literature
in patients with sepsis, observing the response of plasma N/OFQ33 and that of
NOP and ppN/OFQ mRNA expression by peripheral blood cells.34 This has
been explained in detail in Chapter 1: Introduction.

128
5.2 Materials and methods
5.2.1 Patients recruitment and sample collection
With research ethics committee approval (REC ref: 09/H0722/21) fifty one
critically ill patients with a clinical diagnosis of sepsis admitted to the Intensive
Care Unit at the Leicester Royal Infirmary were recruited between August 2009
and May 2011. Written consent or relative’s assent was obtained either
prospectively or retrospectively as appropriate. Two patients were withdrawn
from the study due to inability to obtain consent or assent, leaving 49 patients
in total.
Inclusion criteria were: patients who were admitted with sepsis, (SIRS +
infection, according to the definition given by the ACCP/SCCM), in the previous
24 hours or who developed sepsis in the ICU during the 24 hours before
recruitment. Clinical and laboratory data were collected at each sampling time.
Blood samples were taken mainly from the indwelling arterial catheter; in few
cases where the arterial line was not present blood samples were taken from
the central venous catheter.
We aimed to obtain 3 blood samples where feasible:
1. Day 1 sample (D1): sample obtained within 24 hours of admission or of
developing sepsis
2. Day 2 sample (D2): sample obtained 18 – 24 hours after the first blood
sample.
3. Recovery sample (Rec): sample obtained once the patient had clinically
recovered from the septic episode, did not have SIRS and all routine laboratory

129
markers of inflammation or infection had returned to normal. This sample was
obtained in 22/49 patients at 7 to 134 days post-recruitment (median [IQR]= 16
[9.7 – 41.2] days). The recovery sample was used as a baseline value and was
taken in either the hospital or at home. These 22 patients comprise the
recovery sub-group.
5.2.2 RT-PCR
Polymorphonuclear leucocytes were isolated from 15 ml of blood sample and
RT-PCR for NOP and ppN/OFQ mRNA expression performed. Details of
polymorphonuclear extraction, mRNA extraction using miRvana™ isolation kit
and RT-PCR are described in Chapter 2: Methods.
5.2.3 Blood collection for plasma extraction
As described in Chapter 2: Methods, 7.5 ml of blood was aspirated from the
arterial line into an EDTA bottle. 150 µl of aprotinin (containing 4.5 TIU, 0.6
TIU.ml-1) were immediately added to prevent protein degradation. The samples
were then transferred on ice to the laboratory and centrifuged at 3,000x g, 4˚C
for 15 minutes. The plasma obtained is stored in 1ml aliquots at -80˚C pending
use in batch analysis of N/OFQ peptide by radioimmunoassay, PCT and
cytokines and MPO by ELISA.
5.3 Statistical analysis
GraphPad Prism® 5 was used for statistical analysis. Data were assumed to
have non-parametric distribution. PCR results on D1, D2 and Recovery were
analysed using Kruskal-Wallis ANOVA with Dunn’s multiple comparison test

130
where appropriate. Spearman’s Correlation coefficient for non-parametric
continuous data was used to determine if there was a correlation between
laboratory data (PCR results and inflammatory markers) and physiological data
(e.g. inotropic support, white cell count, lactate concentrations, and survival
from sepsis).
5.3.1 Study power
This was a pilot observational study and therefore no prospective power
calculation. During study design, data collection and analysis, there were no
published data on gene expression in a similar patient population on which to
base a power calculation. Recently however, Stamer and colleagues34
published a PCR study on the expression of NOP and ppN/OFQ by peripheral
blood cells in 18 critically ill patients with sepsis and found higher NOP
expression compared to healthy controls. Notwithstanding the limitations of
retrospective power calculations, a retrospective power calculation based on
our results showed that: in order to detect a difference in PCR of 1 cycle in
ppN/OFQ and in NOP mRNA expression with a power of 80% and an alpha
error 0.05, a sample size of 52 and 12 patients respectively would be required.

131
5.4 Results
Baseline patient characteristics are shown in Table 5-2. Patients had mixed co-
morbidities and the source of sepsis was mainly either chest or abdomen.
Other sources of sepsis involved neutropenic sepsis, necrotising fascitis, and
central venous catheter sepsis.
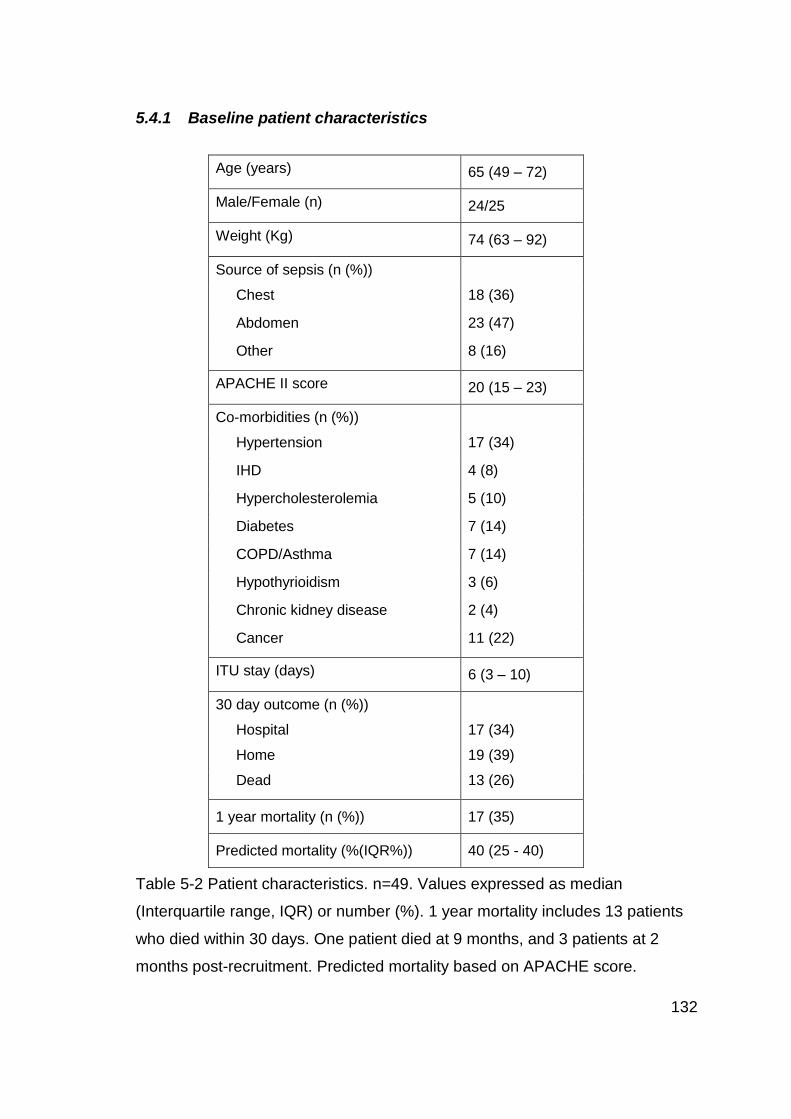
132
5.4.1 Baseline patient characteristics
Table 5-2 Patient characteristics. n=49. Values expressed as median
(Interquartile range, IQR) or number (%). 1 year mortality includes 13 patients
who died within 30 days. One patient died at 9 months, and 3 patients at 2
months post-recruitment. Predicted mortality based on APACHE score.
Age (years) 65 (49 – 72)
Male/Female (n) 24/25
Weight (Kg) 74 (63 – 92)
Source of sepsis (n (%))
Chest 18 (36)
Abdomen 23 (47)
Other 8 (16)
APACHE II score 20 (15 – 23)
Co-morbidities (n (%))
Hypertension 17 (34)
IHD 4 (8)
Hypercholesterolemia 5 (10)
Diabetes 7 (14)
COPD/Asthma 7 (14)
Hypothyrioidism 3 (6)
Chronic kidney disease 2 (4)
Cancer 11 (22)
ITU stay (days) 6 (3 – 10)
30 day outcome (n (%))
Hospital
Home
17 (34)
19 (39)
Dead 13 (26)
1 year mortality (n (%)) 17 (35)
Predicted mortality (%(IQR%)) 40 (25 - 40)

133
5.4.2 Physiological variables
Physiological variable D1 n=49 D2 n=46
Temperature (˚C) 37.8 (37 – 38.5) 37.2 (36.7 – 37.5)
MAP (mmHg) 78 (68 – 89) 79 (72 – 85)
HR 110 (97 – 118) 95 (87 – 108)
Creatinine (µmol.l-1) 125 (81 – 176) 116 (60 – 179)
WCC (x109.l-1) 13.1 (6.3 – 19.7) 13.5 (7.8 – 13.4)
Neutrophils (%) 87 (79 – 91) 88 (82 – 91)
CRP mg.l-1 205 (128 – 277)
n= 33
223 (164 – 284)
n= 36
SOFA score 6 (4 – 8) 5 (3 – 7)
PaO2/FiO2 (kPa) 30 (17 – 45) 41 (23 – 53)
Platelet count (x109.l-1) 213 (105 – 358) 203 (135 – 288)
Hb (g.dl-1) 9.7 (8.5 – 10.5) 9.4 (8.7 – 10.9)
INR 1.4 (1.3 – 1.7) 1.3 (1.2 – 1.6)
ALT (IU.l-1) 27 (19 – 53) 26 (18 – 38)
Albumin (g.l-1) 20 (14 – 24) 21 (16 – 24)
Arterial blood gases:
pH 7.32 (7.26 – 7.37) 7.34 (7.30 – 7.40)
Base deficit 6.2 (3.2 - 8.6) 5.1 (1.9 – 7.5)
Lactate 2.2 (1.2 – 3.3) 1.6 (1.1 – 2.4)
Inotropes
Noradrenaline
(µg.kg-1.min-1)
0.24 (0.09 – 0.43)
n=29
0.19 (0.11 – 0.27)
n=21
Adrenaline n=2 n=2
Ventilation
Spontaneous
NIPPV
IPPV
7 (14)
11 (22)
31 (63)
8 (17)
7 (15)
31 (67)
Table 5-3 Physiological variables on D1 and D2. 3 patients died before D2
sample. Values expressed as median (Interquartile range, IQR) or number (%).

134
5.4.3 Recovery sub-group patient characteristics, n=22
Age (years) 70 (45-72)
Male/Female (n) 10/12
Weight (Kg) 76 (66 – 97)
Source of sepsis (n (%))
Chest 8 (36)
Abdomen 11 (50)
Other* 3 (13)
APACHE II score 19 (15 – 20)
Co-morbidities (n (%))
Hypertension 9 (41)
IHD 2 (9)
Hypercholesterolemia 2 (9)
Diabetes 3 (14)
COPD/Asthma 3 (14)
Hypothyroidism 1 (4)
Chronic kidney disease 1 (4)
Cancer 4 (4)
ITU stay (days) 6.5 (5 – 9.5)
30 day outcome (n (%))
Hospital 8 (36)
Home 13 (59)
Dead 1 (4)
Table 5-4. Characteristics of patients with a recovery sample. n=22. Values
expressed as median (Interquartile range, IQR) or number (%).
*Sepsis from cellulitis (n=2) and from central line (n=1).

135
5.4.4 Physiological variables, recovery sub-group n=22
Physiological variable
D1 D2 Recovery
Temperature (˚C)
38.2
(37.5 – 38.8)
37.2
(36.7 – 38)
37
(36.5 – 37.2)
MAP (mmHg) 75
(66 – 92)
78
(74 – 84)
82
(76 – 92)
HR 110
(99 – 123)
90
(83 – 106)
95
(75 – 101)
Creatinine (µmol.l-1)
130
(80 – 183)
128
(70 – 193)
59
(44 – 81)
WCC (x109.l-1) 15.4
(10.3 – 19.9)
16.9
(9.5 – 23.0)
9
(7.5 – 10.9)
Neutrophils (%) 88
(82 – 93)
89
(83 – 92)
73
(60 – 81)
CRP mg.l-1 233
(159 – 289)
268
(213 – 307)
37
( 17 – 84)
SOFA score 6
(5 – 8)
4
(3 – 7)
PaO2/FiO2 (kPa) 32
(23 – 46)
44
(27 – 53)
Platelet count (x109.l-1)
244
(162 – 425)
227
(147 – 403)
397
(282 – 582)
Hb (g.dl-1) 9.8
(8.5 – 10.9)
9.4
(8.7 – 10.9)
9.8
(8.3 – 11.9)
INR 1.4
(1.3 – 1.7)
1.3
(1.2 – 1.6)
1.1
(1.1 – 1.2)
ALT (IU.l-1) 26
(21 – 45)
25
(18 – 38)
33
(20 – 43)
Albumin (g.l-1) 23
(15 – 28)
21
(17 – 24)
33
(29 – 36)
ABG
pH 7.33 (7.28 – 7.37) 7.34 (7.30 – 7.37)
Base deficit 6.2 (0.7 – 8.4) 5.1 (1.8 – 7.5)
Lactate 1.5 (1.2 – 3.0) 1.4 (1 – 2.5)
Inotropes
Noradrenaline
(µg.kg-1.min-1)
0.2 (0.08 – 0.39)
n=13
0.13 (0.08 – 0.23)
n= 9
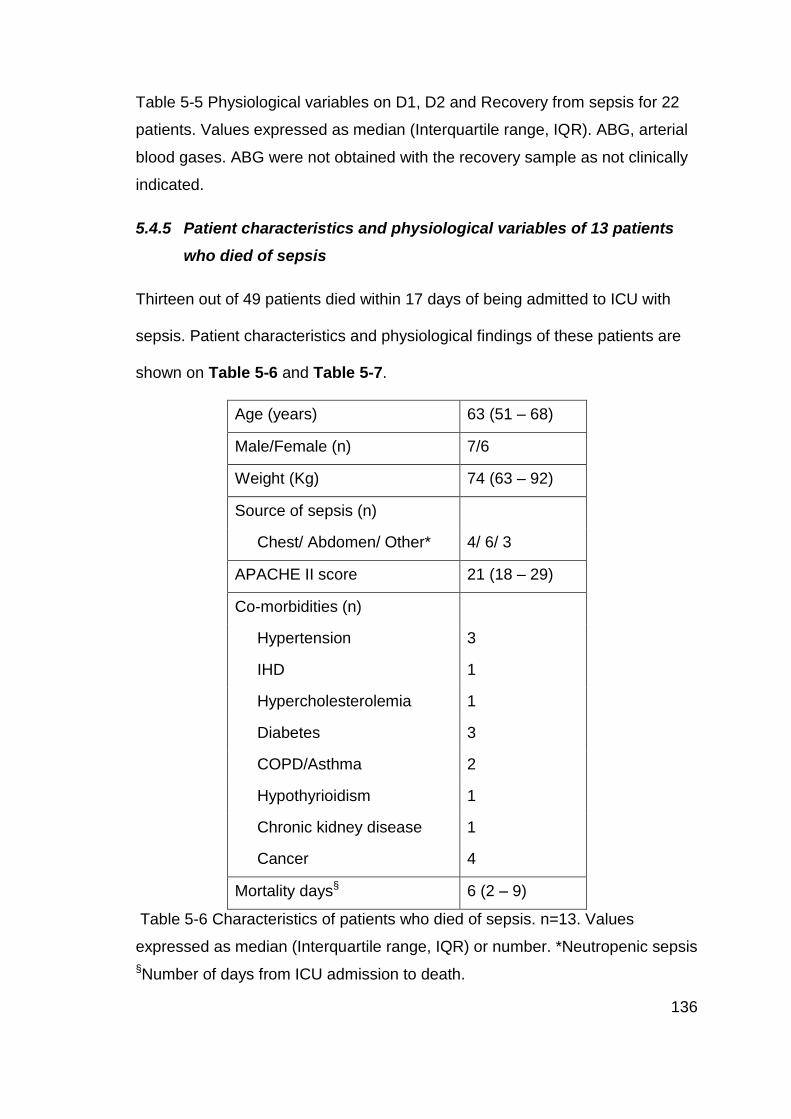
136
Table 5-5 Physiological variables on D1, D2 and Recovery from sepsis for 22
patients. Values expressed as median (Interquartile range, IQR). ABG, arterial
blood gases. ABG were not obtained with the recovery sample as not clinically
indicated.
5.4.5 Patient characteristics and physiological variables of 13 patients
who died of sepsis
Thirteen out of 49 patients died within 17 days of being admitted to ICU with
sepsis. Patient characteristics and physiological findings of these patients are
shown on Table 5-6 and Table 5-7.
Age (years) 63 (51 – 68)
Male/Female (n) 7/6
Weight (Kg) 74 (63 – 92)
Source of sepsis (n)
Chest/ Abdomen/ Other* 4/ 6/ 3
APACHE II score 21 (18 – 29)
Co-morbidities (n)
Hypertension 3
IHD 1
Hypercholesterolemia 1
Diabetes 3
COPD/Asthma 2
Hypothyrioidism 1
Chronic kidney disease 1
Cancer 4
Mortality days§ 6 (2 – 9)
Table 5-6 Characteristics of patients who died of sepsis. n=13. Values
expressed as median (Interquartile range, IQR) or number. *Neutropenic sepsis
§Number of days from ICU admission to death.

137
Physiological
variable
D1
n=13
D2
n=10
Temperature (˚C) 37.4 (36 – 37.9) 37.1 (36.7 – 37.3)
MAP (mmHg) 75 (64 – 85) 82 (68 – 85)
HR 103 (96 – 112) 98 (88 – 117)
Creatinine (µmol.l-1) 132 (93 – 265) 139 (92 – 234)
WCC (x109.l-1) 7.2 (1.5 – 14.6) 8.7 (6 – 12)
Neutrophils (%) 89 (73 – 93) 89 (80 – 93)
CRP mg.l-1 185 (133 - 236) 201 (147 - 208)
SOFA score 7 (4.5 – 11.5) 6.5 (5.5 – 12)
PaO2/FiO2 (kPa) 21 (14 - 34) 24 (15 - 36)
Platelet count (x109.l-1) 163 (52 – 310) 149 (49 – 208)
Hb (g.dl-1) 9.7 (8.6 – 10.1) 9.1 (8.1 – 10.3)
INR 1.7 (1.3 – 1.9) 1.3 (1.2 – 1.4)
ALT (IU.l-1) 24 (13 – 90) 19 (13 – 257)
Albumin (g.l-1) 20 (13 – 25) 22 (16 – 24)
ABG
pH 7.26 (7.2 – 7.35) 7.33 (7.24 – 7.38)
Base deficit 6.5 (2.7 - 10) 5.2 (3.6 – 8.4)
Lactate 2.7 (1.1 – 3.9) 2.3 (1.6 – 3.6)
Inotropes
Noradrenaline
(µg.kg-1.min-1)
0.31 (0.12 – 0.59)
n=9
0.26 (0.15 – 0.43)
n=6
Table 5-7 Physiological variables on D1 and D2 of patients who died of sepsis.
3 patients died before D2 sample could be taken. Values expressed as median
(Interquartile range, IQR). ABG, arterial blood gases

138
5.4.6 NOP and ppN/OFQ mRNA expression by Polymorphonuclear
leucocytes
Expression of the NOP and ppN/OFQ gene by polymorphonuclear cells was
assessed by qRT-PCR. The cycle threshold (Ct) and the ∆Ct, difference in
between Ct for the gene of interest and house keeper GAPDH, were used to
determine change in expression. Blood samples were taken on day 1 (D1,
n=49), day 2 (D2, n=46) and on recovery from sepsis (Rec, n=22). Three
patients died before the second blood sample was due. Even though the
recovery sample was taken last, here we present the results for recovery data
first to facilitate comparison, and compare ∆Ct on D1 and D2 of sepsis with ∆Ct
in recovery, in 22 patients.
NOP mRNA expression remained similar on D1 and D2 of sepsis, (∆Ct on D1=
6, and on D2=5.8). In the recovery sub-group there was a lower mRNA
expression of NOP on day 1 (∆Ct D1=5.9) compared to the recovery control
sample (∆Ct Rec=5.2), which was not statistically significant. Figure 5-1 and
Figure 5-2
ppN/OFQ mRNA expression was also similar on D1 and D2 of sepsis, (∆Ct on
D1=16.5 and on D2=15.7). In the recovery sub-group there was a significant
reduction in ppN/OFQ mRNA expression during sepsis compared to the control
sample (∆Ct D1=16.8, Rec=13.6). Figure 5-3 and Figure 5-4.

139
NOP Ct on D1 and D2 of sepsis
D1 D20
2
4
6
8
10
NO
P
Ct
Trend of NOP Ct on D1 and D2 of sepsis
D1 D20
2
4
6
8
10
NO
P
Ct
Figure 5-1 NOP mRNA expression by polymorphonuclear leucocytes in patients with sepsis. Data expressed as median (boxes and
values in parentheses are IQR), end of whiskers indicate range. NOP was not determined on 1 and 7 patients on D1 and D2
respectively. There was no statistically significant difference in between days 1and 2 of sepsis (p=0.4). Data were analysed using
paired Student’s t test.
D1 (n=48) D2 (n=42)
NOP ∆Ct 6.0
(5.3 – 7.0)
5.8
(5.2 – 6.7)

140
NOP Ct in recovery sub-group
Rec D1 D20
2
4
6
8
10
NO
P
Ct
Trend of NOP Ct
Rec D1 D20
2
4
6
8
10
NO
P
Ct
Figure 5-2 NOP mRNA expression in the recovery sub-group in patients with sepsis. In 2 out of 22 patients NOP ∆Ct was
undetermined on day 2. There was a trend towards lower mRNA expression of NOP (higher ∆Ct) on D1 compared to recovery
sample with no statistical significance (p= 0.37). Data expressed as median (boxes and values in parentheses are IQR), end of
whiskers indicate range. Data were analysed using Kruskal-Wallis ANOVA with Dunn’s multiple comparison test. Results for
Recovery samples shown first to facilitate comparison with D1 and D2.
Rec (n=22) D1 (n=22) D2 (n=20)
NOP ∆Ct 5.2 (4.7 – 6.2) 5.9 (5.3 – 6.4) 5.5 (4.8 – 6.5)
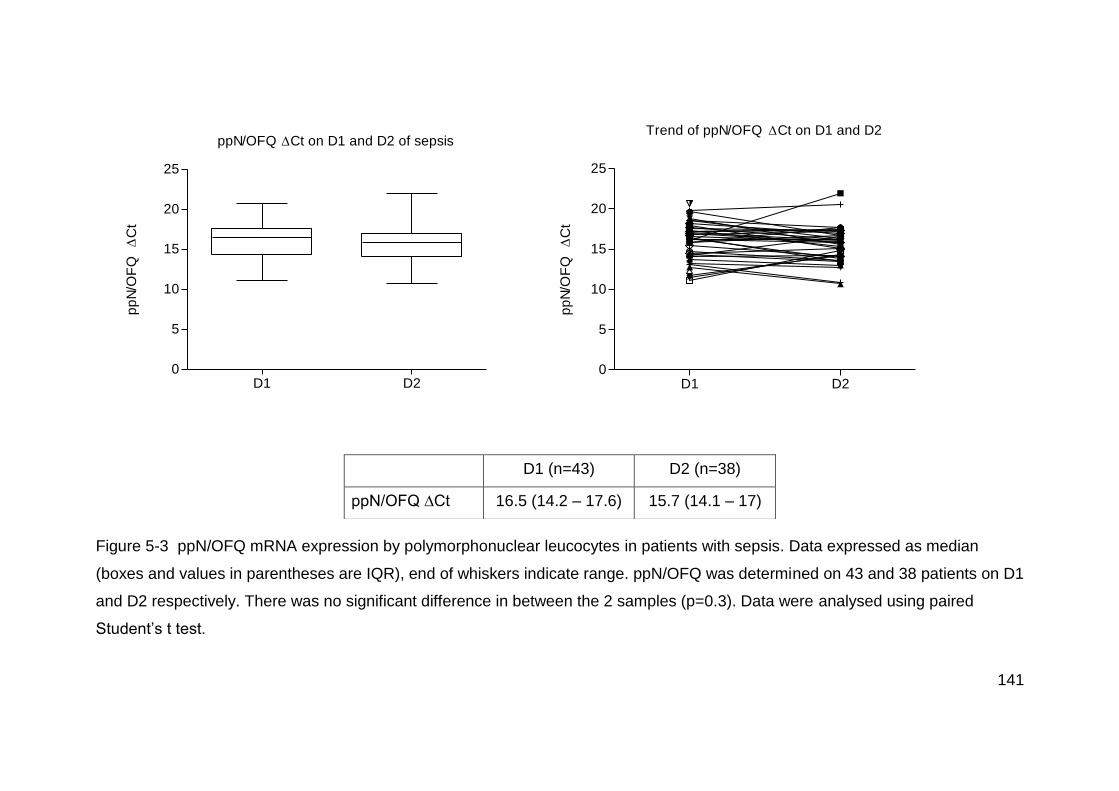
141
ppN/OFQ Ct on D1 and D2 of sepsis
D1 D20
5
10
15
20
25
pp
N/O
FQ
C
tTrend of ppN/OFQ Ct on D1 and D2
D1 D20
5
10
15
20
25
pp
N/O
FQ
C
t
Figure 5-3 ppN/OFQ mRNA expression by polymorphonuclear leucocytes in patients with sepsis. Data expressed as median
(boxes and values in parentheses are IQR), end of whiskers indicate range. ppN/OFQ was determined on 43 and 38 patients on D1
and D2 respectively. There was no significant difference in between the 2 samples (p=0.3). Data were analysed using paired
Student’s t test.
D1 (n=43) D2 (n=38)
ppN/OFQ ∆Ct 16.5 (14.2 – 17.6) 15.7 (14.1 – 17)
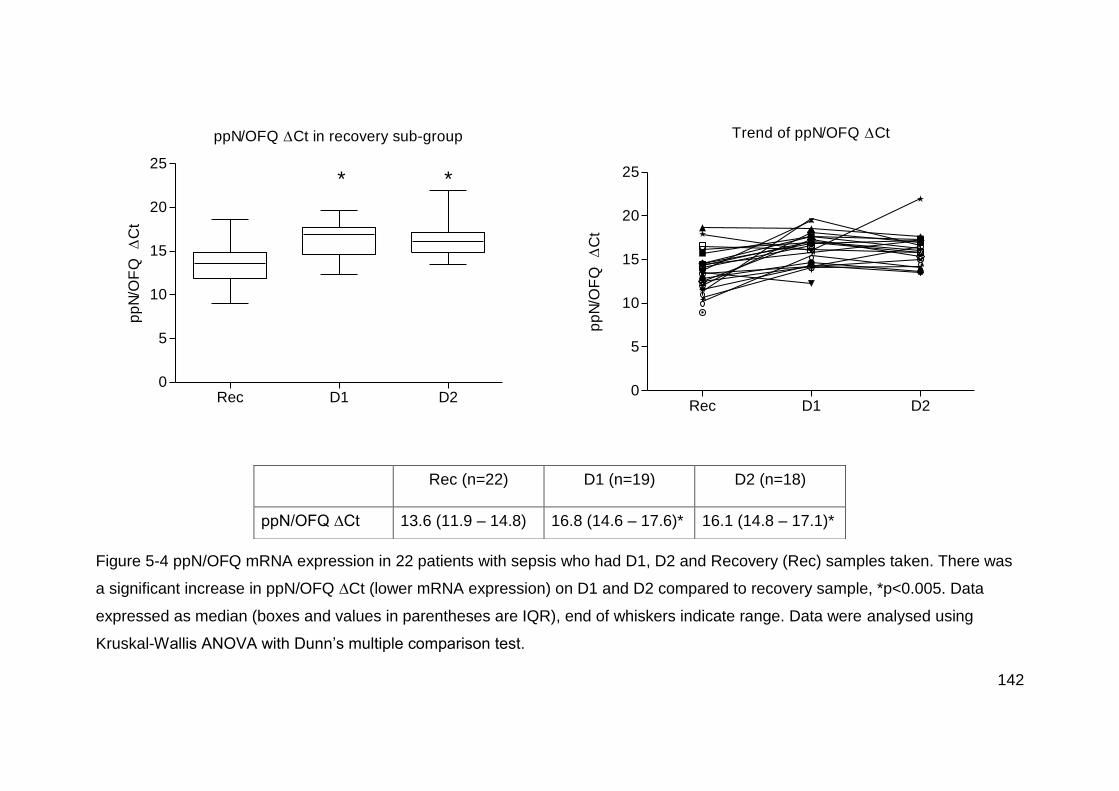
142
ppN/OFQ Ct in recovery sub-group
Rec D1 D20
5
10
15
20
25* *
pp
N/O
FQ
C
tTrend of ppN/OFQ Ct
Rec D1 D20
5
10
15
20
25
pp
N/O
FQ
C
t
Figure 5-4 ppN/OFQ mRNA expression in 22 patients with sepsis who had D1, D2 and Recovery (Rec) samples taken. There was
a significant increase in ppN/OFQ ∆Ct (lower mRNA expression) on D1 and D2 compared to recovery sample, *p<0.005. Data
expressed as median (boxes and values in parentheses are IQR), end of whiskers indicate range. Data were analysed using
Kruskal-Wallis ANOVA with Dunn’s multiple comparison test.
Rec (n=22) D1 (n=19) D2 (n=18)
ppN/OFQ ∆Ct 13.6 (11.9 – 14.8) 16.8 (14.6 – 17.6)* 16.1 (14.8 – 17.1)*

143
Fold change ppN/OFQ in recovery sub-group
0.0
0.5
1.0
1.5
Rec D1 D2
* *
Fo
ld c
ha
ng
e
Figure 5-5 Fold change of ppN/OFQ mRNA expression by PMN leucocytes in the recovery sub-group of patients with sepsis. D1
and D2 values are compared to Recovery (Rec) values. Data expressed as median (boxes on graph and values in parentheses are
IQR), error bars indicate range. All but 4 and 3 patients had ppN/OFQ mRNA reduction at D1 and D2 respectively. There was an
85% reduction in mRNA expression at D1 and D2. *p<0.005 compared to Rec sample. Data were analysed using Kruskal-Wallis
ANOVA with Dunn’s multiple comparison test.
ppN/OFQ D1
(n=19)
D2
(n=18)
Fold change 0.17
(0.04 – 0.59)
0.21
(0.06 – 0.39)
% change ↓85%
(72% – 97%)
↓85%
(69% – 93%)

144
5.4.7 Relationship between NOP and ppN/OFQ mRNA expression
There was significant reduction of ppN/OFQ mRNA expression by
polymorphonuclear leucocytes during sepsis, however, there was no correlation
between NOP and reduced ppN/OFQ mRNA expression on Day 1 of sepsis
compared to Recovery sample, Figure 5-6.
NOP vs ppN/OFQ Ct
-2 2 4 6
-5
5
10
rs= 0.096
p= 0.68
NOP Ct
pp
N/O
FQ
Ct
Figure 5-6 Spearman Correlation (rs) of NOP ∆∆Ct vs ppN/OFQ ∆∆Ct (∆Ct at D1
minus ∆Ct at Rec). n=22. There was no correlation between the change in NOP and
ppN/OFQ mRNA expression on day 1 of sepsis compared to recovery.
5.4.8 Relationship between clinical findings and mRNA expression of NOP
and ppN/OFQ
We analysed the relationship between NOP and ppN/OFQ mRNA expression with
various demographic and physiological parameters on Day 1 of sepsis. Table 5-8.
Correlation coefficients are simply tests of linear association between two variables,
and are limited by the data distribution and the presence of outliers. Performing

145
multiple correlations increases the chance of a Type 1 error (false positives), whilst
adjusting the p values for multiple correlations increases the chance of a Type 2
error (false negatives).131 We have analysed various correlation coefficients to simply
test the possible association with markers of clinical sepsis in a series of
observational pilot study. It is controversial whether adjusting the p value is valid and
therefore was not performed in this study.
Data show that the higher the white cell count and the percentage of neutrophils, the
higher the mRNA expression of NOP (expressed by a lower ∆Ct), Figure 5-7 and
Figure 5-8. ppN/OFQ mRNA expression on Day 1 of sepsis was lower (higher ∆Ct)
in those patients who required higher doses of Noradrenaline and in those with a
higher plasma lactate concentration. Figure 5-9 and Figure 5-10. To confirm
whether lactate, noradrenaline or other variables are associated with NOP or
ppN/OFQ, further studies will be needed.

146
NOP ∆Ct D1(n=48) ppN/OFQ ∆Ct D1 (n=43)
rs (95% CI) p value rs (95% CI) p value
Age 0.043 (-0.25 to 0.33) 0.76 -0.099 (-0.39 to 0.21) 0.52
Sex 0.212 (-0.08 to 0.47) 0.14 -0.120 (-0.41 to 0.19) 0.44
Source of sepsis 0.052 (-0.24 to 0.33) 0.72 0.204 (-0.11 to 0.48) 0.18
APACHE -0.110 (-0.39 to 0.18) 0.45 -0.050 (-0.35 to 0.26) 0.75
SOFA score 0.272 (-0.02 to 0.52) 0.06 0.178 (-0.13 to 0.46) 0.25
Noradrenaline use 0.206 (-0.09 to 0.47) 0.16 0.344 (0.03 to 0.59) 0.02
Creatinine -0.07 (-0.35 to 0.22) 0.63 0.013 (-0.29 to 0.32) 0.93
WCC -0.343 (-0.57 to -0.05) 0.01 -0.225 (-0.49 to 0.08) 0.14
%Neutrophils -0.310 (-0.55 to -0.01) 0.03 -0.001 (-0.31 to 0.31) 0.99
Lactate 0.162 (-0.13 to 0.43) 0.27 0.305 (-0.003 to 0.56) 0.04
ITU stay days 0.035 (-0.25 to 0.32) 0.81 -0.081 (-0.38 to 0.23) 0.60
Mortality at 30 days 0.114 (-0.18 to 0.39) 0.43 0.000 (-0.30 to 0.30) 1.00
Table 5-8 Correlation between NOP and ppN/OFQ ∆Ct on D1 of sepsis with demographic and physiological variables. NOP and
ppN/OFQ were undetermined in 1 and 6 patients on D1 respectively. Data were analysed using non-parametric Spearman
correlation (rs). 12 variables were correlated. CI, confidence interval.

147
WCC vs NOP Ct on D1
0 20 40 600
2
4
6
8
10
rs= -0.343
p= 0.01
WCC
NO
P
Ct
Figure 5-7 Correlation between white cell count (WCC) and NOP ∆Ct on D1 of
sepsis. n= 48, NOP ∆Ct was undetermined in 1 sample. Data were analysed using
non-parametric Spearman correlation (rs)
% Neutrophils vs NOP Ct on D1
0 50 100 1500
2
4
6
8
10
rs= -0.31
p= 0.03
% Neutrophils
NO
P
Ct
Figure 5-8 Correlation between % of Neutrophils and NOP ∆Ct on D1 of sepsis. n=
48, NOP ∆Ct was undetermined in 1 sample. Data were analysed using non-
parametric Spearman correlation (rs)

148
Noradrenaline use vs ppN/OFQ Ct on D1
0.0 0.5 1.0 1.5 2.00
5
10
15
20
25
rs= 0.344
p= 0.02
Noradrenaline (ug.kg.min-1
)
pp
N/O
FQ
C
t
Figure 5-9 Correlation of Noradrenaline requirements vs ppN/OFQ ∆Ct on Day 1 of
sepsis. n=43, ppN/OFQ mRNA was undetermined in 6 samples. Data were analysed
using non-parametric Spearman correlation (rs)

149
ppN/OFQ Ct vs lactate on D1
0 5 10 150
5
10
15
20
25
rs = 0.305
p = 0.04
Lactate
pp
N/O
FQ
C
t
Figure 5-10 Correlation of Lactate vs ppN/OFQ ∆Ct on Day 1 of sepsis. n=43,
ppN/OFQ mRNA was undetermined in 6 samples. Data were analysed using non-
parametric Spearman correlation (rs)

150
5.4.9 Survivors and non-survivors NOP and ppN/OFQ mRNA expression
The mRNA expression of NOP and ppN/OFQ by polymorphonuclear cells was
similar in those who died of sepsis compared to those who survived. Figure 5-11
NOP and ppN/OFQ Ct on D1 and mortality
0
5
10
15
20
25
Non-survivors
NOP ppN/OFQ
Survivors
C
t
Figure 5-11 Correlation of NOP and ppN/OFQ ∆Ct on D1 and mortality. NOP
survivors n=36, non-survivors n=12. ppN/OFQ survivors n=32, non-survivors n=11.
p= 0.43 and 0.98 for NOP and ppN/OFQ respectively. Data were analysed using
Mann-Whitney U test.

151
5.4.10 Correlation between clinical findings and changes in mRNA expression
of NOP and ppN/OFQ in the recovery sub-group, n=22
We analysed the correlation between various clinical findings and the change in
mRNA expression of NOP and ppN/OFQ in Day 1 of sepsis compared to Recovery
sample as the baseline (∆∆Ct).
Table 5-9. Data shows that those patients with a higher lactate on D1 of sepsis had a
lower mRNA expression of NOP, when compared to the recovery sample (given by a
higher ∆∆Ct, D1 ∆Ct minus recovery ∆Ct). Figure 5-12. A higher APACHE score on
admission to ITU was related to a higher ppN/OFQ mRNA expression (lower ∆∆Ct),
when compared to the recovery sample. Figure 5-13.

152
Table 5-9 Correlation between NOP and ppN/OFQ ∆∆Ct (D1 ∆Ct minus Rec ∆Ct) with demographic and physiological variables.
ppN/OFQ ∆∆Ct was undetermined in 3 patients. Data were analysed using non-parametric Spearman correlation (rs). 11 variables
were correlated. CI, confidence interval.
NOP ∆∆Ct (n=22) ppN/OFQ ∆∆Ct (n=19)
rs (95% CI) p value rs p value
Age -0.064 (-0.48 to 0.37) 0.77 0.068 (-0.41 to 0.51) 0.78
Sex 0.143 (-0.30 to 0.54) 0.52 -0.057 (-0.50 to 0.41) 0.81
Source of sepsis -0.083 (-0.49 to 0.36) 0.71 0.104 (-0.37 to 0.54) 0.67
APACHE 0.310 (-0.14 to 0.65) 0.15 -0.629 (-0.84 to -0.23) 0.003
SOFA score 0.028 (-0.40 to 0.45) 0.9 -0.159 (-0.58 to 0.33) 0.51
Noradrenaline use 0.222 (-0.23 to 0.59) 0.31 0.224 (-0.26 to 0.62) 0.35
Creatinine -0.003 (-0.43 to 0.42) 0.98 0.038 (-0.43 to 0.49) 0.87
WCC -0.195 (-0.57 to 0.25) 0.38 -0.269 (-0.65 to 0.22) 0.26
% Neutrophils -0.395 (-0.70 to 0.04) 0.06 -0.035 (-0.49 to 0.43) 0.88
Lactate 0.502 (-0.08 to 0.76) 0.01 -0.163 (-0.58 to 0.32) 0.5
ITU stay days 0.036 (-0.40 to 0.46) 0.87 -0.186 (-0.60 to 0.30) 0.44

153
Lactate vs NOP Ct
5 10 15
-2
0
2
4
6
rs= 0.502
p= 0.01
D1 Lactate
NO
P
Ct
Figure 5-12 Correlation of Lactate on D1 vs NOP ∆∆Ct (difference between D1 ∆Ct
minus recovery ∆Ct), n=22. Data were analysed using non-parametric Spearman
correlation (rs).
Apache score vs ppN/OFQ Ct
10 20 30 40
-5
0
5
10
rs= -0.629
p= 0.003
APACHE score
pp
N/O
FQ
Ct
Figure 5-13 Correlation of APACHE score on admission to ITU vs ppN/OFQ ∆∆Ct
(D1 ∆Ct minus Recovery ∆Ct). n=19. ∆∆Ct was undetermined in 3 patients. Data
were analysed using non-parametric Spearman correlation (rs).

154
5.4.11 Inflammatory markers – Clinical and biochemical
Clinical and biochemical markers of sepsis were investigated during sepsis and on recovery from sepsis. IL-8, IL-10, CRP and
SOFA score increased significantly on Day 1 of sepsis compared to non-sepsis (Recovery), confirming the diagnosis of sepsis.
TNFα plasma concentrations during sepsis were similar to those reported in the literature for patients with sepsis,129 even though it
did not increase significantly on Day 1 or Day 2 of sepsis compared to recovery. Table 5-10.
Recovery D1 D2
IL-8 41 (23 – 280)
n=22
378 (179 – 1149)*
n=49
297 (68 – 852)*
n=46
IL-10 29 (3 – 250)
n=22
161 (73 – 431)*
n=49
118 (51 – 381)
n=46
TNFα 33 (16 – 86)
n=21
96 (43 – 168)
n=49
66 (29 – 160)
n=46
CRP 37(17 – 84)
n=17
205 (128 – 277)*
n=33
223 (164 – 284)*
n=35
SOFA score 1 (0 – 1.2)
n=18
6 (4.5 – 8.5)*
n=49
5 (3 – 7)*
n=46
Table 5-10 Inflammatory markers. Cytokine concentrations (pg.ml-1), CRP (mg.dl-1) and SOFA score. Data expressed as median
(IQR). IL-8 and IL-10 concentrations were significantly higher during sepsis, *p value <0.01 compared to Recovery. Data were
analysed using Kruskal-Wallis ANOVA with Dunn’s multiple comparison test. SOFA: Sequential Organ Failure Assessment.
155
5.5 Discussion
These data showed that in critically ill patients with sepsis, ppN/OFQ mRNA
expression by PMN cells is reduced by 85% during sepsis compared to recovery
from sepsis. However, there were no changes in the mRNA expression of NOP. A
similar finding was reported by Stamer and colleagues,34 who investigated 18
critically ill patients with severe sepsis, and compared them to 28 healthy volunteers
as the control group. They reported reduced mRNA expression of ppN/OFQ in
pheripheral blood cells, and in contrast to our findings they observed increased
mRNA expression of NOP in patients with sepsis compared to healthy controls.
Figure 5-14 .
The control group in our study was the patient itself. The recovery sample was taken
when the patient had clinically recovered from sepsis. Despite the advantages that
this has by providing a sample from the patient with same physiological and clinical
background (opposed to volunteer controls), it has the problem of the timing of the
sample. We obtained the recovery sample at a variable time between 7 and 134
days post recruitment, at home or in hospital, when patients were judged to have
recovered from the episode of sepsis, based on clinical evaluation. However, this
clinical evaluation did not necessarily correlate with complete physiological recovery,
and full recovery from critical illness may take months. There are no data available
on the time the nociceptin system specifically can take to return to baseline values
(i.e. before sepsis)
The findings from this study do not support our hypothesis; if PMN cells are the
source of plasma N/OFQ during sepsis, the mRNA expression of NOP and ppN/OFQ

156
would be higher. However, it shows that there is a change in mRNA expression of
ppN/OFQ in the PMN cell during sepsis and it is possible that ppN/OFQ is used for
making more active peptide and therefore its expression reduces.
Figure 5-14 NOP and ppN/OFQ mRNA expression by peripheral blood cells in
Stamer and colleagues’ study.34 mRNA expression is presented as normalized ratio.
Graph A shows NOP mRNA expression was increased in ICU patients with sepsis
(those who died of sepsis (n=9), not in survivors) compared to healthy controls (HC).
Graph B shows ppN/OFQ mRNA expression was decreased in ICU patients with
sepsis compared to healthy controls (HC). Stamer and colleagues also investigated
cancer patients (CA) and post-operative patients (PO).
Graph taken from http://bja.oxfordjournals.org/content/106/4/566.long#F1. Accessed
on 6th September 2012.

157
We found no difference in NOP or ppN/OFQ mRNA expression by PMN cells
between survivors and non-survivors (36 and 13 patients respectively) of sepsis in
49 critically ill patients. However, we observed that patients who required higher
doses of noradrenaline and those who had higher plasma lactate concentrations had
reduced ppN/OFQ mRNA expression. Similarly, Stamer and colleagues observed
reduced ppN/OFQ mRNA expression in those patients with higher concentrations of
inflammatory markers, procalcitonin and IL-6. This evidence suggests that ppN/OFQ
mRNA expression by leucocytes correlates with severity of clinical condition
(increased noradrenaline requirements, increased plasma lactate, procalcitonin and
IL-6 concentratios).
Mortality in critically ill patients with sepsis correlated with plasma N/OFQ
concentrations and with NOP mRNA expression in Williams and colleagues and in
Stamer and colleagues studies respectively. Williams and colleagues33 studied 21
patients with sepsis and found significantly increased plasma concentrations of
N/OFQ in 4 patients who died compared to survivors. Figure 5-15. Stamer and
colleagues34 studied 18 critically ill patients with severe sepsis and found higher
NOP mRNA in peripheral blood cells of 9 patients who died compared to healthy
controls. It is worth noting that Williams and colleagues compared survivors vs non-
survivors, whilst Stamer and colleagues, compared patients to healthy volunteers.

158
Figure 5-15 Plasma N/OFQ concentrations in critically ill patients with sepsis
comparing survivors (n=17) and non-survivors (n=4), in Williams and colleagues
study. Bar represents data medians. They also investigated Urotensin-II
concentrations (U-II). Taken from http://bja.oxfordjournals.org/content/100/6/810.long
Accessed on 8th September 2012.
During the first five days of sepsis, mRNA expression of NOP and ppN/OFQ by
leucocytes and plasma concentrations of N/OFQ do not change significantly, as
seen in this study as well as in the studies of Williams and colleagues33 and Stamer
and colleagues.34 Plasma concentrations of sepsis biomarkers, such as CRP, IL-6,
TNFα, and PCT increase or decrease during the first days of sepsis depending on
the patient’s clinical condition.132;133 Sepsis evolves over a period of time that varies
amongst patients. When the patient is admitted into the Intensive Care Unit the time
course of the disease and the phase of the sepsis syndrome at which each patient
presents is unknown. This variability contributes to admission delay, ‘lead-time’, and

159
is seen in the lack of significant clinical and laboratory changes between days 1 and
2 of sepsis. This is an inherent problem in most studies of sepsis along with accurate
diagnosis.
Immunocytes play a key role in the development and outcome of the inflammatory
response. We now know that immune cells such as polymorphonuclear cells,
lymphocytes and monocytes express mRNA for NOP and ppN/OFQ. In the case of
ppN/OFQ it is uncertain how much of this mRNA is translated into functional protein
and released from the immunocyte.
5.5.1 Limitations of this study:
There are some limitations to these data:
1. All PCR studies are limited to investigating the mRNA expression of a given
gene; however, this does not necessarily translate into the amount of protein,
which is the critical response to analyse.
2. We have chosen to analyse PMN cells as this cell group is more likely to
increase during a septic process. However, it would be worth studying the
response of lymphocytes and monocytes as well. The method by which PMN
cells were isolated provides over 90% cell purity. In future studies the use of
FACS will allow for nearly 100% cell purity and analysis of mRNA in all white
cell sub-types.
3. We have recruited patients with a clinical diagnosis of sepsis in their first 24
hours of ICU admission. However, this does not represent the first 24 hours of
sepsis, as the time course in an individual patient varies and we do not know

160
the actual start time of sepsis, there is an admission delay (lead-time) into the
ICU.134
4. We have compared the mRNA expression of the N/OFQ system using the
patient itself as their own control. Further analysis should be performed using
matched healthy controls as well.
5.6 Conclusion
Sepsis is a severe inflammatory response that occurs in the presence of infection
and triggers multiple inflammatory pathways. It leads to multiple organ failure and
causes death in 35% of patients admitted with sepsis to Intensive Care Unit. The
N/OFQ system has been implicated in the adverse outcome from sepsis in animal
studies. In human studies plasma N/OFQ concentrations were increased in patients
who died from sepsis compared to survivors.
This observational, pilot study involving 49 patients with sepsis in Intensive Care,
showed that mRNA expression of the N/OFQ system (NOP and ppN/OFQ) by
polymorphonuclear cells, is similar during the first two days of sepsis, however,
ppN/OFQ mRNA expression is reduced 85% during sepsis compared with non-
sepsis status in the same patients (n=22).
Higher requirements for noradrenaline and higher lactate concentrations were
associated with lower ppN/OFQ mRNA expression by PMN cells on the first day of
sepsis.

161
To date, this is the second study available in the literature, to examine gene
expression of the N/OFQ system by immune cells in humans with sepsis. Our
research group will further compare and analyse these data with matched healthy
volunteers.

162
6 Discussion
Previous chapters in this thesis have described the pharmacology of N/OFQ and an
evaluation of its role in two clinical models of inflammation (i) CPB and (ii) sepsis.
Based on animal studies, it is known that in pain pathways N/OFQ produces
analgesia when administered at spinal sites and hyperalgesia/anti-opioid actions
when administered supraspinally.18 In humans, the evidence from observational
studies shows both increased plasma N/OFQ concentrations in acute and chronic
pain, and decreased plasma N/OFQ concentrations in fibromyalgia syndrome
patients. N/OFQ has anxiolytic effects while NOP antagonists are antidepressants
(animal studies). One human observational study showed plasma N/OFQ
concentrations to be increased in patients with post-partum depression compared to
healthy controls.
Cardiovascular effects of N/OFQ in animals include hypotension, vasodilatation, and
bradycardia. In humans, NOP partial agonist SER100 (previously known as
ZP120135) completed a Phase II trial for the management of decompensated heart
failure in patients treated with furosemide, having as end-point a change in dyspnoea
severity. Basic information about this un-published trial, sponsored by Serodus
(previously Zealand Pharma), can be found on http://clinicaltrials.gov/ct2/show/
NCT00283361.
Our main interest on N/OFQ was regarding its effect on the immune system and its
role during inflammation and sepsis. It is known that N/OFQ causes an inflammatory
response, and increased mortality in septic rats, but more importantly, that UFP-101,
a NOP antagonist, reduced mortality in septic animals. These actions were

163
demonstrated in two animal studies. In vitro N/OFQ caused increased
macromolecular leak, vasodilatation, decreased blood flow and leucocyte rolling and
adhesion in rat mesenteric vessels.21 In vivo rats made septic by CLP (caecal
ligation and perforation) had a mortality of 70%, which increased to 100% with sc
administration of N/OFQ, and reduced to 50% with UFP-101, a NOP antagonist.31 In
the latter study, a decreased number of bacteria in the blood was detected in the rats
treated with UFP-101, but it is unknown whether this is a direct or indirect effect of
UFP-101.136 This significant reduction in mortality of septic animals makes us
wonder if a similar effect could be obtained in patients with sepsis.
Kimura and colleagues137 explain a possible mechanism by which N/OFQ may
contribute to the inflammatory process. They observed increased vascular
permeability in rat skin regulated by histamine release, as it was antagonized by the
anti-histamine pyrilamine. This effect had a very short onset, 30 seconds after sc
injection of N/OFQ. They also observed that N/OFQ stimulated histamine release
from rat peritoneal mast cells in a dose-dependent manner.
Two observational studies in critically ill patients with sepsis suggest that high
plasma concentrations of N/OFQ correlate with patients who die of sepsis compared
to survivors,33 and that NOP and ppN/OFQ mRNA expression by leucocytes is
altered during sepsis.34
In vitro studies confirm that PBMCs and PMN cells express ppN/OFQ and NOP
mRNA.9;14-17;23 It is known that toxin-activated human PMN cells and lymphocytes
express N/OFQ, and that N/OFQ has pro- and anti-inflammatory effects on
immunocytes. Figure 6-1
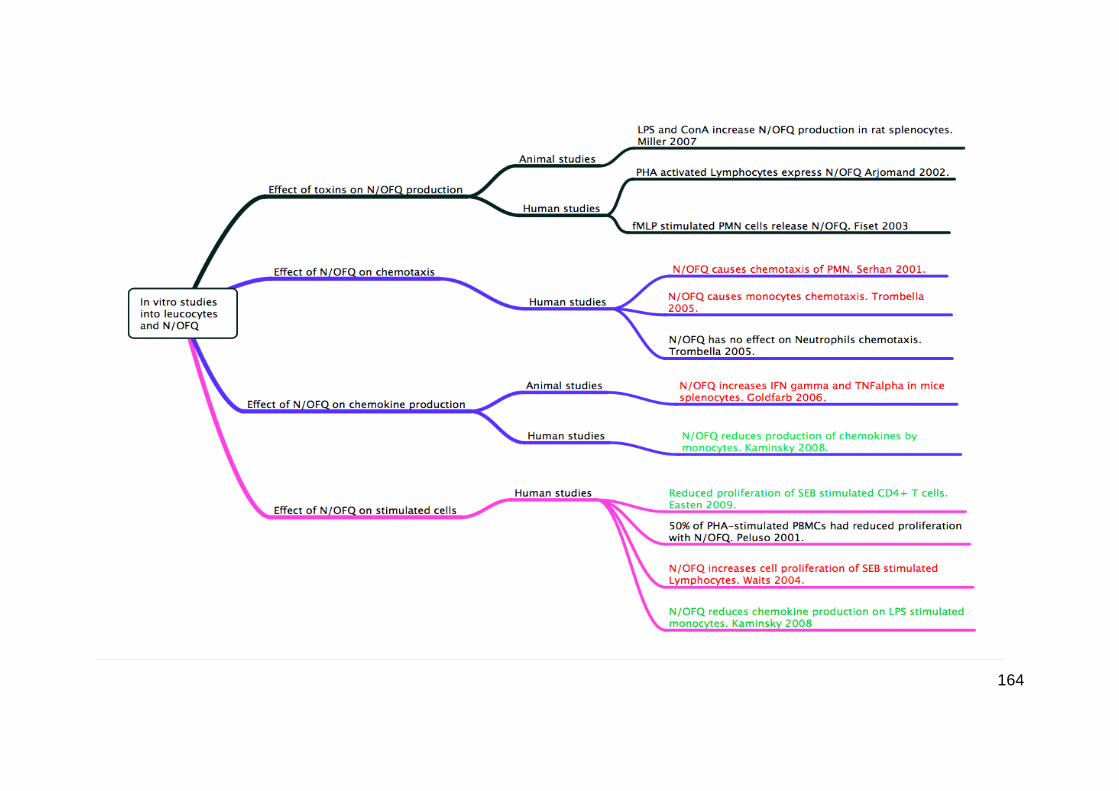
164
165
Figure 6-1In vitro studies on the effects of N/OFQ on leucocytes and toxins on
N/OFQ release. The diagram shows evidence for the effects of toxins on N/OFQ
production, N/OFQ on chemotaxis, N/OFQ on chemokine production and effects of
N/OFQ on stimulated cells. In red are those studies showing pro-inflammatory
effects; in green those showing anti-inflammatory effect of N/OFQ; and in black
those studies with no definite pro or anti-inflammatory effect and those analysing
N/OFQ response.
However, the evidence in humans is limited: we do not know how the N/OFQ system
changes during inflammatory and septic conditions and if there is any relationship
with severity of disease.
Based on current available data the aims of the studies described in this thesis were
to analyze changes in the expression of NOP and ppN/OFQ mRNA by PMN cells
and of N/OFQ peptide in plasma during inflammation and sepsis. A further aim was
to investigate the relationship between the N/OFQ system with physiological and
biochemical indicators of severity of disease.
The work presented in this thesis represents the first investigations into: i) the
changes of mRNA expression of NOP and ppN/OFQ by PMN cells specifically, as
these cells play a key role in the development of the inflammatory response; and ii)
the change of the N/OFQ system in plasma and in PMN cells, having the patient
itself as his own control.
The purpose of this section is to discuss and interpret the findings of the studies
described in Chapters 3, 4 and 5, and to outline possible future areas of research.
The response of the N/OFQ system during inflammation and sepsis by
polymorphonuclear leucocytes was investigated in two different patient populations:
166
40 patients undergoing cardiac surgery under cardiopulmonary bypass (CPB) as a
model of inflammation, and 49 patients with severe sepsis in the Intensive Care Unit.
Recruitment of this number of patients took 18 and 21 months respectively and was
particularly challenging in the ICU environment.
6.1 The effect of cardiopulmonary bypass on N/OFQ
The data presented in Chapter 3 showed that NOP and ppN/OFQ mRNA expression
by PMN cells was significantly reduced at 3h post-CPB by 57% and 95%
respectively. Table 6-1 .
We investigated changes in the N/OFQ system in humans during inflammation, and
chose patients undergoing cardiac surgery under cardiopulmonary bypass as a
model of inflammation.
CPB is known to cause a systemic inflammatory response, which has been
demonstrated by various authors by an increased plasma concentration of cytokines.
Onorati and colleagues studied 60 patients and found increased plasma
concentrations of IL-6, IL-8, and IL-10.99 Duggan and colleagues found increased
TNFα and IL-10 in 82 patients undergoing cardiac surgery under CPB.112 Galley and
colleagues reported increased plasma IL-10 concentrations in 150 patients.111
Other findings of the inflammatory response seen during CPB include endothelial cell
activation; activation of complement, kinin, fibrinolytic and coagulation cascades; and
activation and aggregation of neutrophils.100 PMN cells are activated by contact of
the cell with the CPB circuit, and this activation is enhanced by raised cytokines.
Activated PMN cells release proteolytic enzymes: MPO (myeloperoxidase), MMPs
(matrix-metalloproteinases), PMN elastases and oxygen-free radicals, all of which
promote organ dysfunction.88;89

167
The above pathophysiological changes lead to deleterious clinical effects such as
atrial fibrillation,138 lung dysfunction,139 renal impairment, gastrointestinal and
metabolic changes, cognitive dysfunction,140 and stroke.115;141
Some of the mechanisms that lead to the inflammatory response during CPB include
contact of blood with foreign surfaces in the extracorporeal circuit, non-physiologic
pulsatile perfusion and ischemia-reperfusion injury due to cardioplegic arrest.99
In our study, inflammatory markers IL-8, IL-10 and MPO significantly increased with
the inflammatory response. IL-8 increased 7-fold at 3h post-CPB, IL-10 4-fold, and
MPO increased by 63%. Plasma N/OFQ concentration increased directly in
proportion to the increase of MPO.
Sablotzki and colleagues,142 investigated the relationship between inflammatory
markers and mortality in 16 post-CPB patients with multi-organ dysfunction
syndrome and APACHE-II score >24, and reported increased plasma concentrations
of IL-8, IL-10, IL-18, TGF (transforming growth factor), and procalcitonin in those
who died compared to survivors.
Plasma TNFα concentrations did not change in our study. However, other studies
have reported an increase of TNFα and associated it with clinical findings. Abacilar
and colleagues studied 20 patients undergoing elective coronary artery bypass
grafting (CABG) and correlated an increase of TNFα of more than 20 pg.ml-1 in 13
patients with increased mediastinal bleed and longer endotracheal intubation.143
There is no evidence in the literature regarding mRNA expression of NOP or
ppN/OFQ by leucocytes during inflammation. However, there is some evidence
regarding G protein-coupled receptor kinase activity and NOP mRNA expression in
human right atrium. Hagen and colleagues144 investigated 15 patients undergoing
cardiac surgery under CPB, and observed that G protein-coupled receptor kinase

168
activity was reduced in mononuclear cells, and that this change correlated with
increased plasma concentrations of IL-6. Our group reported the presence of NOP
mRNA in human right atrium of 38 patients undergoing cardiac surgery under CPB.
We investigated 40 patients undergoing cardiac surgery under CPB and found
reduced mRNA expression of NOP, a G protein-coupled receptor, in PMN cells.
Plasma N/OFQ concentrations in patients with coronary artery disease have been
investigated by Fontana and colleagues, and by Krepuska and colleagues, reporting
opposite findings. Fontana and colleagues reported increased plasma N/OFQ
concentration in 41 patients with unstable angina compared to 7 patients with stable
angina and to 20 controls. Krepuska and colleagues reported reduced plasma
N/OFQ concentration in 12 patients with severe chronic angina compared to 10
patients with mild angina and to 14 healthy controls. Our results showed that plasma
N/OFQ concentration increased by 31% at 3h post-CPB and returned to above
baseline concentration at 24h post-CPB. High concentration of plasma N/OFQ was
associated with low NOP mRNA expression by PMN cells. Prolonged aortic cross-
clamp time was associated with higher concentration of plasma N/OFQ and lower
NOP mRNA expression.
In an attempt to determine whether the reduction in mRNA expression of NOP and of
ppN/OFQ by PMN cells during CPB was due to changes in plasma N/OFQ
concentrations, we performed an in vitro study. We incubated extracted PMN cells,
from the t0 sample of 4 patients, with 1 µM N/OFQ and peptidase inhibitor cocktail
for 3h. We compared the results to control samples, PMN cells incubated on
peptidase inhibitor only. We observed reduced expression of NOP and ppN/OFQ

169
mRNA after 3h of incubation on N/OFQ. However, the control samples, with only
peptidase inhibitor (PI), had similar mRNA expression response as the N/OFQ
samples. It is possible that PMN cells release N/OFQ into plasma during an
inflammatory process, and peptidase inhibitor prevented the breakdown of the added
and the intrinsic N/OFQ, therefore showing similar response in both groups. This
was a very small number of patient samples analysed and deserves further
investigation.
6.1.1 Unexpected findings in the CPB study
We hypothesized that an inflammatory stimulus such as cardio pulmonary bypass
would cause an increase in N/OFQ plasma concentrations. Our research group had
previously demonstrated that plasma N/OFQ concentrations increase in critically ill
patients with sepsis.
With the evidence that NOP and ppN/OFQ mRNA is expressed by immunocytes,9
we also hypothesized that these cells were the source of N/OFQ and therefore NOP
and ppN/OFQ mRNA expression would be increased in PMN cells.
The CPB study showed an increase in plasma N/OFQ concentrations but a reduction
in NOP and ppN/OFQ mRNA expression by the polymorphonuclear cell, opposite of
our hypothesis. We propose two possible mechanisms for this response: 1) when
plasma N/OFQ concentrations increase in response to the inflammatory process,
ppN/OFQ and NOP mRNA expression fall as they are degraded to produce protein,
and/or 2) immunocytes release N/OFQ during the inflammatory process and this
leads to a negative feedback, reducing the expression of NOP and ppN/OFQ from
the immune cells.
170
We measured inflammatory markers IL-8, IL-10, TNFα and MPO. TNFα was the only
inflammatory marker that failed to increase at 3 hours after CPB compared to
baseline values. Other CPB studies have shown increased TNFα response as part of
the inflammatory response.114;117;139 The reasons why we observed an increase in
IL-8, IL-10 and MPO, but not in TNFα, in response to CPB are unclear but may relate
to differences in techniques used for CPB between studies.
We also observed that 4 patients had ten times higher plasma concentrations of IL-8,
IL-10 and TNFα. However, there was neither clinical nor physiological explanation for
this finding and no change in outcome compared to the other 36 patients.
6.2 The effects of sepsis on N/OFQ
Sepsis has a complex pathogenesis involving a sequence of cellular processes such
as activation of neutrophils and monocytes; microvascular endothelial cells; and
activation of the complement, coagulation and fibrinolytic cascades. These are
necessary processes in order to clear the body of pathogens. However, there is a
cascade of mechanisms triggered by pathogen-derived signals leading to damage-
associated molecular pattern (DAMP) molecules being released from epithelial and
endothelial cells that maintain the inflammatory mediators in a positive feedback
mechanism. Excessive pro-inflammatory or anti-inflammatory mediators, which can
lead to an immunosuppressant state and opportunistic secondary infections, that
persist even after the pathogen has been cleared, are the basis of sepsis and multi-
organ failure.74;75
Most commonly used inflammatory markers during sepsis include C-reactive protein
(CRP) and procalcitonin (PCT). Beyond these molecules a wide range of biomarkers

171
have been investigated, including cytokines (IL-6, IL-8, IL-10, TNFα),127;129
coagulation factors, and vasoactive hormones.
N/OFQ has been linked to sepsis based on in vitro, and in vivo animal and human
studies described at the beginning of this chapter.
We investigated the N/OFQ system in 49 critically ill patients with sepsis during their
first 48h in the Intensive Care Unit. In 22/49 patients a blood sample was also
obtained once the patient had recovered from sepsis, and this was often taken at
home after discharge. NOP and ppN/OFQ mRNA expression by PMN leucocytes
was similar on Days 1 and 2 of sepsis. However, compared to recovery from sepsis,
ppN/OFQ mRNA expression decreased 85% during sepsis. Table 6-1 .
In a very recent study Stamer and colleagues,34 investigated 18 critically ill patients
with severe sepsis, and compared them to 28 healthy volunteers as the control
group, also reported reduced mRNA expression of ppN/OFQ in peripheral blood
cells. It is important to note that we investigated the PMN cell specifically whilst
Stamer and colleagues investigated peripheral blood cells (mononuclear and
polymorphonuclear cells).
Stamer and colleagues reported increased mRNA expression of NOP in patients
with sepsis compared to healthy controls. This contrasts our findings, where there
was no difference in the mRNA expression of NOP on Day 1 of sepsis compared to
recovery from sepsis.
When correlating NOP and ppN/OFQ mRNA expression with clinical and laboratory
findings, we observed that a higher APACHE score on admission to ITU was related
to a higher ppN/OFQ mRNA expression (lower ∆∆Ct), when compared to the
recovery sample. On day 1 of sepsis the need for higher doses of positive inotropic
drugs and higher serum lactate concentrations were both associated with lower

172
ppN/OFQ mRNA expression. These are the first correlations reported between the
N/OFQ system and indicators of severity of disease in patients with sepsis.
Williams and colleagues previously investigated 21 patients with sepsis and reported
increased plasma N/OFQ concentrations in 4 patients who died of sepsis compared
to survivors. In view of the presence of NOP and ppN/OFQ mRNA in PBMC and
PMN cell, it is possible that the origin of plasma N/OFQ is the immune cell and
therefore its mRNA expression is altered during sepsis. Stamer and colleagues34
reported higher NOP mRNA expression in peripheral blood cells of 9 patients who
died of severe sepsis compared to healthy controls. We did not find any difference in
the mRNA expression of NOP or of ppN/OFQ when comparing survivors (n=36) and
non-survivors (n=13) from sepsis.
6.2.1 Unexpected findings in the sepsis study
Our data showed an 85% reduction in ppN/OFQ mRNA expression by PMN cells
during sepsis with no change in NOP mRNA expression. These findings differ from
our hypothesis that if PMN cells are the source of plasma N/OFQ during sepsis its
mRNA expression of NOP and ppN/OFQ would be higher.
The reduced ppN/OFQ mRNA expression is similar to the changes observed in the
CPB study, where we believe this may be due to either ppN/OFQ being degraded to
produce protein, or to a negative feedback from higher concentrations of N/OFQ
peptide.
In contrast to the reduced expression of ppN/OFQ mRNA, the expression by PMN
cells of NOP mRNA did not change during sepsis when compared to recovery from
sepsis..
173
The lack of differences in the NOFQ system between days 1 and 2 of admission to
ICU may relate to heterogeneity in disease processes, illness severity and
responses to resuscitation or treatment. Alternatively there is a recognised ‘lead-
time’ before ICU admission and the disease process for an individual will have
evolved over a number of hours or days before they present to hospital or are
admitted to ICU. In this context, repeated sampling after 24 hours may be too short
an interval to demonstrate marked differences in the complex interacting pathways
involved in sepsis.

174
Table 6-1 Summary of findings of cardiopulmonary bypass (CPB) and sepsis studies. NC, no significant change. ND, not done.
mRNA expression
NOP ppN/OFQ
Plasma
N/OFQ
IL-8 IL-10 TNFα MPO Correlations
CPB
study ↓ 57% ↓ 95% ↑ 31% ↑ 7-fold ↑ 4-fold NC ↑ 63%
Longer AXC time ↓ NOP mRNA
↑ plasma N/OFQ
↑ plasma N/OFQ ↓ NOP mRNA
Sepsis
study NC ↓ 85% ND ↑ 9-fold ↑ 5-fold NC ND
↑ inotropic support ↓ ppN/OFQ mRNA
↑ lactate ↓ ppN/OFQ mRNA

175
6.3 Relevance of the N/OFQ system in inflammation and sepsis
Both N/OFQ and NOP are involved in a wide range of ‘non-pain’ responses including
immunomodulation and cardiovascular control. There is growing interest in the
involvement of this system during inflammation and sepsis.
The N/OFQ - NOP system is present in immune cells and N/OFQ modifies
immunocyte function. NOP and N/OFQ precursor ppN/OFQ mRNA are found in
monocytes, lymphocytes and polymorphonuclear cells.9;14;15 In vitro studies show
N/OFQ to be produced by immunocytes29 and to act as an immunomodulator
(N/OFQ causes chemotaxis of monocytes, PMN cells and increased cell proliferation
on lymphocytes).25;26 Its effects are mainly pro-inflammatory, e.g. induction of
chemotaxis and proliferation of immune cells.
In vivo animal studies have been conducted in septic and non-septic animal models
of inflammation. Pro-inflammatory effects were seen on mesenteric vessels of
anaesthetised rats when N/OFQ was injected iv: leucocyte rolling & adhesion,
increased macromolecular leak, reduced blood flow, and vasodilatation.21 Increased
mortality was seen on septic CLP rats after sc injection of N/OFQ. Furthermore,
there was reduced mortality after sc injection of the N/OFQ antagonist UFP-101 in
the same study conducted by Carvalho and colleagues.31 Opposed to these pro-
inflammatory effects, an anti-inflammatory response was observed by Zhao and
colleagues32 when N/OFQ was injected centrally, intracerebroventricular, in
anaesthetised rats. They studied rats undergoing exploratory laparotomy as a model
of traumatic stress, and determined IL-1 and TNFα production by peritoneal
macrophages in response to intracerebroventricular injection of N/OFQ. They
observed increased production of IL-1 and TNFα from peritoneal macrophage in

176
response to the traumatic stress, and this was reversed with intracerebroventricular
injection of N/OFQ. They also observed that N/OFQ and NOP mRNA transcripts
were reduced in cerebral cortex, hippocampus and hypothalamus after trauma, and
this could be reversed by central administration of N/OFQ. The opposite response to
centrally and peripherally administered N/OFQ is also seen in response to pain.
In humans, two observational studies in critically ill patients with sepsis have been
published. One study showed raised plasma N/OFQ concentrations in patients who
died of sepsis compared to survivors,33 and the other study showed increased NOP
mRNA expression by peripheral blood cells in those patients who died, with reduced
ppN/OFQ mRNA expression in patients with sepsis compared to controls.34 Limited
data are available regarding the N/OFQ system in patients with SIRS.
6.4 Problems encountered during the studies
6.4.1 CPB study
We faced the following problems recruiting patients into the CPB study:
a) cancellations of surgery on the day due to lack of ITU beds for the post-operative
period,
b) low volume of surgical cases during a period of time due to bed closures,
c) some patients denied consent, and
d) we were limited to recruiting patients whose surgery started before midday as
samples took 2 – 3hours to process in the laboratory.
Regarding timing of the second blood sample, we took the t2 sample 3 hours after
start of CPB (instead of after the end of CPB). In 33/40 patients CPB time was 1 – 2
hours, in 3 patients we took the blood sample whilst the patient was still on CPB

177
(CPB time of 203, 204 and 250 minutes), one of these patients was clinically
unstable requiring CPB a second time. One patient had a short CPB time of 43
minutes. We were consistent on sampling all patients at the same time in relation to
when they were started on CPB, the inflammatory stimulus.
6.4.2 Sepsis study
During the sepsis study 2 patients were withdrawn from the study. One after the first
sample was taken assent was denied by the relatives, the second patient had
relatives under age in which case assent was unacceptable. In both cases any blood
samples and records collected were destroyed.
We took a recovery blood sample once the patient had recovered clinically from
sepsis. This timing varied amongst patients, some were at hospital, and others were
at home. The recovery sample was obtained in 22/49 cases, 13 patients died of
sepsis within 30 days, and 2 patients died after 30 days of ICU admission. Reasons
for not been able to obtain the recovery samples in the other patients included:
transfer to another hospital, denial of consent for the recovery sample, unable to
contact the patients, and some lived over 30 minutes away from the hospital so we
would have been unable to process the blood samples within an acceptable time.
We used the patient themselves to act as their own control, to account for the effects
of co-morbidities, age, medication and other unknown factors that might affect the
N/OFQ system. Ideally one would like to take the control sample before the insult
occurs, however this is clearly impossible to do in with patients presenting as an
emergency with sepsis.
An alternative would be to obtain reference samples from healthy volunteers
matched by age and sex to the study group. This has the advantage that we could

178
match all of the study patients, including those who died of sepsis. This might
exclude some potential confounding variability and is an option for further research.
6.5 Suggestions for future research
We investigated the expression of the N/OFQ system by PMN cells in patients
exposed to an inflammatory process, and in critically ill patients with sepsis. To date,
there are various in vitro and in vivo studies showing the pro-inflammatory effect of
N/OFQ. However, there is limited information on the behaviour of the N/OFQ system
in humans during inflammation and sepsis. Further clinical studies are needed to
investigate the protein expression of N/OFQ by immunocytes; in particular each
immune cell type.
6.6 Conclusion
The expression of the N/OFQ - NOP system by the PMN cell changes in patients
exposed to an inflammatory process and to sepsis. Plasma concentration of N/OFQ
increases during inflammation whilst NOP and ppN/OFQ mRNA expression by PMN
cell decreases. Prolonged aortic cross clamp time during CPB is associated with
higher N/OFQ plasma concentrations. High noradrenaline requirement and lactate
concentrations during sepsis are associated with low NOP and ppN/OFQ mRNA
expression by the PMN cell.
Changes in the mRNA expression of the N/OFQ receptor NOP, and the N/OFQ
peptide precursor ppN/OFQ in the PMN cell along with changes in plasma N/OFQ
concentration, suggest that the PMN cell is the source of plasma N/OFQ during
inflammation and sepsis. These data support previous work which strongly suggest
the involvement of the NOFQ system in inflammatory processes. Further work is

179
required to elucidate the precise role, and whether pharmacological manipulation of
the N/OFQ system in sepsis would be useful in clinical practice.
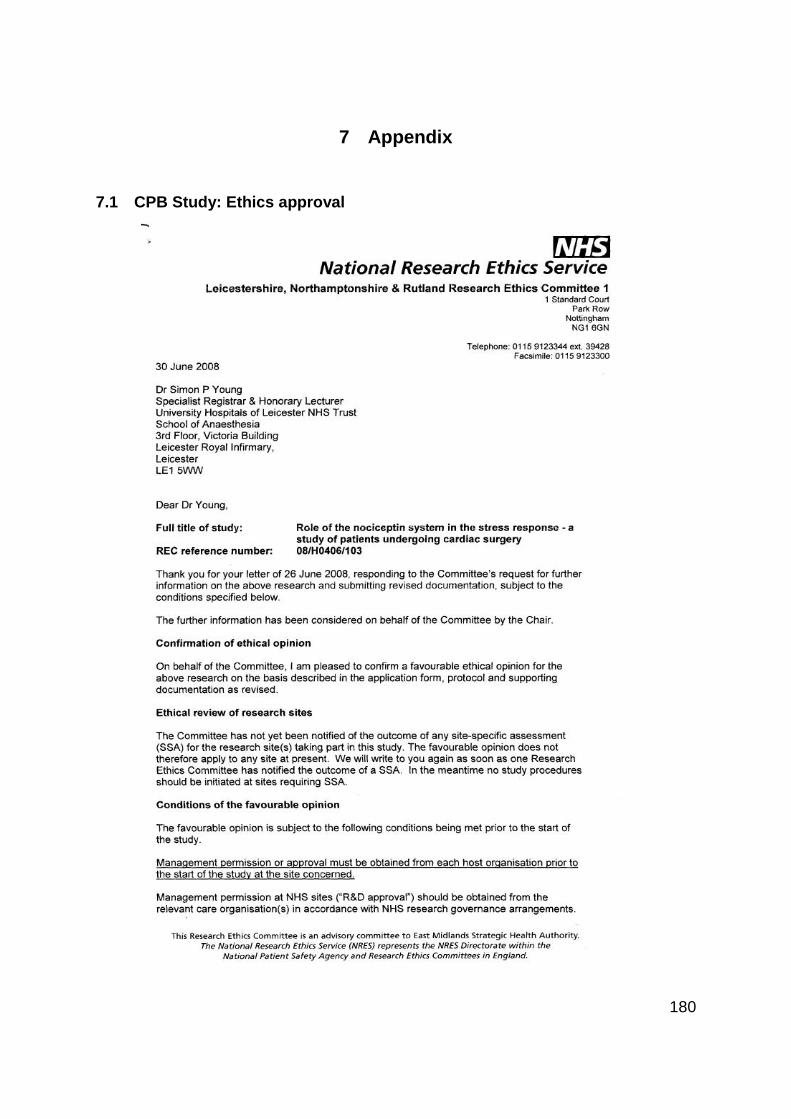
180
7 Appendix
7.1 CPB Study: Ethics approval

181
7.2 CPB study: Participant Information Sheet
PARTICIPANT INFORMATION SHEET v.3 (16 August 2009)
Study Title: Role of nociceptin in the stress response.
You are being invited to take part in a research study. Participation is entirely
voluntary. Please take time to read the following information carefully and discuss it
with others if you wish. If you agree to take part, we will ask you to sign a consent
form. You are free to withdraw from the study at any time, without giving a reason;
any blood samples you have donated will be destroyed.
Why have I been chosen?
Our laboratory has discovered an increase in blood levels of a ‘hormone’ called
nociceptin when the body is under stress. We believe that this hormone may
originate from the white cells in the blood. We wish to measure the production of
nociceptin by these white blood cells in patients undergoing cardiac surgery. With
the information gained from this study we may in the future be able to modify how
this hormone works, and improve the way the body reacts to stress.
Do I have to take part?
No, it is up to you to decide whether or not to take part. If you agree to take part you
can change your mind at any time and withdraw from the study without giving a
reason. Whether you take part or not, the standard of care you receive will not be
different in any way.
What will happen if I take part?
Your involvement in the study will only last as long as you are patient in hospital. We
will take a total of three small blood samples from you during and after the operation.
These will be taken from a special ‘drip’ (or ‘tap’) in your artery that will be placed
anyway as part of your anaesthetic, whether or not you are involved in the study.
This means that no extra needles will be used, and the taking of blood samples
should be painless. The total amount of blood taken will be 90 ml, or approximately
182
half a tea cup-full. Once the blood samples have been taken, you will have no further
involvement in the study. Your recovery after surgery will continue as it would
normally.
What are the advantages & disadvantages of taking part?
The information we obtain from the study will not affect you directly, but may help us
to improve the treatment that future patients receive. You will not receive any
payment for the samples. Neither you nor your relatives will benefit financially from
any inventions that result from the use of the blood samples.
What will happen to the results of the study?
Full analysis of the blood samples will take approximately 12 months. The blood
samples will be frozen & stored in locked laboratory facilities in the Department of
Anaesthesia, Critical Care & Pain Management, Leicester Royal Infirmary. Once the
tests have been performed, any remaining blood samples will be destroyed. It is our
intention to publish the results of the study in medical journals and at medical
meetings. This may however take a number of years.
Is the study confidential?
All information collected about you for this study will be kept strictly confidential, and
is locked away in offices & laboratories of the Department of Anaesthesia, Critical
Care & Pain Management, Leicester Royal Infirmary. Any information from the study
that is reported will not use your name or address or any other information that
would allow you to be recognised.
What if I am harmed by the study?
We do not anticipate any risk to you when donating blood samples. However, you
should know that if you are harmed by taking part in this study, there are no special
compensation arrangements. If you are harmed due to someone’s negligence then
you may have grounds for a legal action, but you may have to pay for it yourself.
Regardless of this, if you wish to complain, or have any concerns about any aspect
of the way you have been approached or treated during the course of this study, the
normal National Health Service complaints mechanisms are available to you. In the

183
University Hospitals Leicester NHS Trust there is a free & confidential service called
the Patient Advice & Liaison Service (PALS). Their contact details are as follows:
PALS Office Glenfield Hospital
Groby Road Leicester LE3 9QP
Tel: 0116 258 3100 e-mail: [email protected]
Who has reviewed the study?
All research in the NHS is looked at by an independent group of people, called a
Research Ethics Committee, to protect your safety, rights, wellbeing and dignity. This
study has been reviewed and given a favourable opinion by the local Research
Ethics Committee.
Contact for further information
Dr Alcira Serrano-Gomez (Principal Investigator)
Specialist Registrar & Honorary Lecturer
University Division of Anaesthesia, Critical Care & Pain Management
Department of Cardiovascular Sciences
3rd Floor, Victoria Building
Leicester Royal Infirmary
Leicester
LE1 5WW
Tel: 0116 258 5291 e-mail: [email protected]
Thank you for taking time to read this participant information leaflet.

184
7.3 CPB Study: Consent Form
CONSENT FORM
Study Title: Role of nociceptin in the stress response.
Investigators: Dr A Serrano-Gomez, Dr J Thompson, Prof D Lambert
Patient to initialise boxes
1. I confirm that I have read and understood the participant information leaflet dated 16 August 2009, version 3, and have had the opportunity to ask questions.
2. I understand that any blood samples are a gift and that I will not benefit from any intellectual property that results from their use.
3. I understand that my participation is voluntary and that I am free to withdraw at any time without giving any reason, and without my medical care or legal rights being affected.
4. I understand that sections of my medical records may be looked at by responsible individuals from the research team or from regulatory authorities. I give permission for these individuals to have access to my records.
5. I hereby consent to donate blood samples (total 90 ml), and to have these samples stored in the laboratory for testing of ‘stress’ hormones including nociceptin/orphanin FQ and cytokines. My blood samples will be destroyed once these tests have been performed.
Name of Patient ____________________ Signature of Patient ____________________ Date ________ Name of Researcher ____________________ Signature of Researcher____________________Date ________
Original form to be held in University Office, copies to Patient and Hospital Notes
Patient name, DOB and hospital number, or addressograph label

185
7.4 Sepsis Study: Ethics Approval

186
7.5 Sepsis Study: QED Audit

187
7.6 Sepsis study: Participant Information Sheet
PARTICIPANT INFORMATION SHEET v.5 (25 January 2010)
Study Title: Role of nociceptin in sepsis.
Principal Investigator:
Dr Alcira Serrano-Gomez Specialist Registrar & Honorary Lecturer University Division of Anaesthesia, Critical Care & Pain Management Department of Cardiovascular Sciences 3rd Floor, Victoria Building Leicester Royal Infirmary Leicester LE1 5WW Tel: 0116 258 5291 e-mail: [email protected]
You are being invited to take part in a research study. Before you decide it is
important for you to understand why the research is being done and what it will
involve. Please take time to read the following information carefully and discuss it
with others if you wish.
Participation is entirely voluntary. If you agree to take part, we will ask you to sign a
consent form to show that you agree to take part. You are free to withdraw from the
study at any time, without giving a reason. If you withdraw, any blood samples you
have donated will be destroyed.
What is the purpose of this study?
Our laboratory has discovered an increase in blood levels of a ‘hormone’ called
nociceptin when the body is invaded by infection. We believe that this hormone may
originate from the white cells in the blood. We wish to measure the production of
nociceptin by these white cells in patients with infection. With the information gained
from this study we may in the future be able to modify how this hormone works, and
improve the way the body reacts to infection.
188
Why have I been invited?
You have been approached for this study because you have been admitted to the
Intensive Care Unit at the Leicester Royal Infirmary with infection. We wish to
measure the production of the ‘hormone’ nociceptin and other stress hormones by
the white cells in the blood of patients having an infection. Our aim is to recruit 50
patients into this study.
Do I have to take part?
No, it is up to you to decide whether or not to take part.
What will happen if I take part?
Your involvement in the study will only last as long as you are patient in the hospital.
We will take a total of three small blood samples from you, the first two in two
consecutive days and the third one once you recover from the infection. The first two
samples will be taken from a special cannula (or ‘drip) in your artery or vein that will
be placed anyway as part of your routine care in ICU, whether or not you are
involved in the study. The third recovery sample may be taken with a needle from a
vein, if the special cannulas have been removed. The total amount of blood taken
will be 75 ml, or approximately half of a tea cup-full. The blood samples are not being
DNA tested.
What are the advantages of taking part?
The information we obtain from the study will not affect you directly, but may help us
to improve the treatment that future patients receive.
What are the possible disadvantages and risks of taking part?
We do not anticipate any risk to you when donating blood samples. There will be no
impact on life insurance or private medical insurance.
What do I have to do after the study?
Once the blood samples have been taken, you will have no further involvement in
the study. Your recovery after your stay in ICU will continue as it would normally.
189
Will I receive payment for the tissue I donate for this research study?
You will not receive any payment for the samples. The samples are a gift. Neither
you nor your relatives will benefit financially from any inventions that result from the
use of the blood samples.
What will happen to the results of the study?
Full analysis of the blood samples will take approximately 12 months. The blood
samples will be frozen & stored in locked laboratory facilities in the Department of
Anaesthesia, Critical Care & Pain Management, Leicester Royal Infirmary. Once the
tests on your blood have been performed, any remaining blood samples will be
destroyed. It is our intention to publish the results of the study in medical journals
and at medical meetings. This may however take a number of years.
Is the study confidential?
All information collected about you for this study will be kept strictly confidential, and
is locked away in offices & laboratories of the Department of Anaesthesia, Critical
Care & Pain Management, Leicester Royal Infirmary. Any information from the study
that is reported will not use your name or address or any other information that
would allow you to be recognised.
What if I am harmed by the study?
We do not anticipate you being harmed by this study. However, you should know
that if you are harmed by taking part in this study, there are no special compensation
arrangements. If you are harmed due to someone’s negligence then you may have
grounds for a legal action, but you may have to pay for it yourself. Regardless of this,
if you wish to complain, or have any concerns about any aspect of the way you have
been approached or treated during the course of this study, the normal National
Health Service complaints mechanisms are available to you. In the University
Hospitals Leicester NHS Trust there is a free & confidential service called the Patient
Advice & Liaison Service (PALS). Their contact details are as follows:
PALS Office Glenfield Hospital
Groby Road Leicester

190
LE3 9QP Tel: 0116 258 3100
e-mail: [email protected]
Who has reviewed the study?
All research in the NHS is looked at by an independent group of people, called a
Research Ethics Committee, to protect your safety, rights, wellbeing and dignity. This
study has been reviewed and given a favourable opinion by Camden & Islington
Community Research Ethics Committee.
Who is organising and funding the research?
This study is being organised and funded by the University Department of
Anaesthesia, Critical Care & Pain Management, based at Leicester Royal Infirmary
and is being conducted as part of an educational award.
Thank you for taking time to read this participant information leaflet.

191
7.7 Sepsis study: Consent Form
CONSENT FORM
Study Title: Role of nociceptin in sepsis.
Investigators: Dr A Serrano-Gomez, Dr M Wood, Dr N Ladak, Dr J Thompson, Prof D Lambert
Patient to initialise boxes
1. I confirm that I have read and understood the participant information leaflet dated 25 January 2010, version 5, and have had the opportunity to ask questions.
2. I understand that any blood samples are a gift and that I will not benefit from any intellectual property that results from their use.
3. I understand that my participation is voluntary and that I am free to withdraw at any time without giving any reason, and without my medical care or legal rights being affected.
4. I understand that sections of my medical records may be looked at by responsible individuals from the research team or from regulatory authorities. I give permission for these individuals to have access to my records.
5. I hereby consent to donate three blood samples (total 75 ml), and to have this sample stored in the laboratory for testing of ‘stress’ hormones (endogenous opioids, cytokines, endocannabinoids) and their receptors. My blood sample will be destroyed once these tests have been performed.
Name of Patient ____________________ Signature of Patient ____________________ Date ________ Name of Researcher ____________________ Signature of Researcher____________________ Date ________
Original form to be held in University Office, copies to Patient and Hospital Notes
Patient name, DOB and hospital number, or addressograph label

192
7.8 Sepsis study: Consultee/Relative’s Information Sheet
CONSULTEE / RELATIVE’S INFORMATION SHEET v.4 (25 January 2010)
Study Title: Role of nociceptin in sepsis.
Principal Investigator:
Dr Alcira Serrano-Gomez Specialist Registrar & Honorary Lecturer University Division of Anaesthesia, Critical Care & Pain Management Department of Cardiovascular Sciences 3rd Floor, Victoria Building Leicester Royal Infirmary Leicester LE1 5WW Tel: 0116 258 5291 e-mail: [email protected]
Your relative is being invited to take part in a research study. You have been
approached as the next of kin as your relative is incapable of making the decision
due to illness or sedation. Before you decide for him or her it is important to
understand why the research is being done and what it will involve. Please take time
to read the following information carefully and discuss it with others if you wish.
Participation is entirely voluntary. If you agree on behalf of your relative to take part,
we will ask you to sign a consent form. You are free to withdraw your relative from
the study at any time, without giving a reason. If you withdraw, any blood samples
your relative has donated will be destroyed.
What is the purpose of this study?
Our laboratory has discovered an increase in blood levels of a ‘hormone’ called
nociceptin when the body is invaded by infection. We believe that this hormone may
originate from the white cells in the blood. We wish to measure the production of
nociceptin and other stress hormones by these white cells in patients with infection.
With the information gained from this study we may in the future be able to modify
how this hormone works, and improve the way the body reacts to infection.
193
Does my relative have to take part?
No. It is up to you to decide whether or not your relative would wish to take part in
this research study.
What will happen if my relative takes part?
Involvement in the study will only last as long as your relative is a patient in the
hospital. We will take a total of three small blood samples. The first two samples will
be taken from a special cannula (or ‘drip) in the artery or vein that will be placed
anyway as part of your relative’s routine care in ICU, whether or not they are
involved in the study. The third recovery sample may be taken with a needle from a
vein, if the special cannulas have been removed. The total amount of blood taken
will be 75 ml, or approximately half of a tea cup-full.
What are the advantages to my relative of taking part?
The information we obtain from the study will not affect your relative directly, but may
help us to improve the treatment that future patients receive.
What are the possible disadvantages and risks to my relative?
We do not anticipate any risk to your relative when donating blood samples. There
will be no impact on life insurance or private medical insurance.
What will my relative have to do after the study?
Once the blood samples have been taken, you will have no further involvement in
the study. Your recovery after your stay in ICU will continue as it would normally.
Will my relative receive payment for the blood they donate for this research
study?
No payments will be made for the samples. The samples are a gift. Neither you nor
your relatives will benefit financially from any inventions that result from the use of
the blood samples.
What will happen to the results of the study?

194
Full analysis of the blood samples will take approximately 12 months. The blood
samples will be frozen & stored in locked laboratory facilities in the Department of
Anaesthesia, Critical Care & Pain Management, Leicester Royal Infirmary. Once the
tests on your relative’s blood have been performed, any remaining blood samples
will be destroyed. It is our intention to publish the results of the study in medical
journals and at medical meetings. This may however take a number of years.
Is the study confidential?
All information collected about your relative for this study will be kept strictly
confidential, and is locked away in offices & laboratories of the Department of
Anaesthesia, Critical Care & Pain Management, Leicester Royal Infirmary. Any
information from the study that is reported will not use your relative’s name or
address or any other information that would allow them to be recognised.
What if my relative is harmed by the study?
We do not anticipate your relative being harmed by this study. However, you should
know that if they are harmed by taking part in this study, there are no special
compensation arrangements. If they are harmed due to someone’s negligence then
you may have grounds for a legal action, but you may have to pay for it yourself.
Regardless of this, if you wish to complain, or have any concerns about any aspect
of the way you have been approached or treated during the course of this study, the
normal National Health Service complaints mechanisms are available to you. In the
University Hospitals Leicester NHS Trust there is a free & confidential service called
the Patient Advice & Liaison Service (PALS). Their contact details are as follows:
PALS Office Glenfield Hospital
Groby Road Leicester LE3 9QP
Tel: 0116 258 3100 e-mail: [email protected]
Who has reviewed the study?
All research in the NHS is looked at by an independent group of people, called a
Research Ethics Committee, to protect your safety, rights, wellbeing and dignity. This

195
study has been reviewed and given a favourable opinion by this Research Ethics
Committee.
Who is organising and funding the research?
This study is being organised and funded by the University Department of
Anaesthesia, Critical Care & Pain Management, based at Leicester Royal Infirmary.
Thank you for taking time to read this information leaflet.

196
7.9 Sepsis study: Consultee Consent Form
CONSULTEE CONSENT FORM
Study Title: Role of nociceptin in sepsis.
Investigators: Dr A Serrano-Gomez, Dr M Wood, Dr N Ladak, Dr J Thompson, Prof D Lambert
Regarding patient (name):_________________________________
Consultee to initialise boxes
6. I confirm that I have read and understood the information leaflet dated 25 January 2010, version 4, and have had the opportunity to ask questions.
7. I understand my role under the Mental Capacity Act 2005 (section 32), which allows me to decide if my relative would want to take part in this study. In my opinion he/she would not object to taking part.
8. I understand that participation in this study is voluntary and that I am free to withdraw my relative at any time without giving any reason, and without any medical care or legal rights being affected.
9. I understand that sections of my relative’s medical records may be looked at by responsible individuals from the research team or from regulatory authorities. I give permission for these individuals to have access to my relative’s records.
10. I understand that appropriate personal identifying information will be collected, stored and used by the study office to enable follow-up of my relative’s health status. This is on the understanding that any information will be treated securely and confidentiality will be maintained.
Name of Consultee _____________ Relationship to patient ____________ Signature of Consultee ____________________ Date ________ Name of Researcher ____________________ Signature of Researcher____________________ Date ________
Original form to be held in University Office, copies to Relative and Hospital Notes
197
7.10 Sepsis study: Research grant letter of approval
-----Original Message-----
From: Lambert, Dave G. (Prof.) [mailto:[email protected]]
Sent: 11 December 2009 15:17
To: 'Thompson, Jonathan'
Cc: '[email protected]'; '[email protected]'; 'David Bogod';
'Morguler Cenan'
Subject: Anaesthesia/AAGBI Small Grant Application-Funding
letter
11th December 2009
Dear Dr Thompson,
The NIAA grants committee with representatives from
Anaesthesia/AAGBI and BJA/RCoA met yesterday to consider your
application for an AAGBI Small Project grant. I delighted to
be able to inform you that your application was recommended
for support in the sum of £13,800.
This e.mail is a formal notification of funding for which we
would request an acceptance e.mail with cc to all.
For your information I attach a copy of your peer review.
I have also added to the peer review a copy of the abstract
from your application that we will post onto the NIAA (and
partner) websites along with funding details. Please have a
look at this and let me know if there are any (small) changes
that you may wish to make.
In order to claim the funding you (or your finance office)
will need to contact Anaesthesia/AAGBI directly and for your
information I copy the relevant details below. There may be
some additional conditions (e.g., the need for interim/final
reports) that the project funder will provide.
All funding queries (and especially finance office claims)
should be directed to Anaesthesia/AAGBI finance Dept and NOT
NIAA.
Ms L Devine [email protected]
With copy to Finance officer
Ian Johnston [email protected]
AAGBI full contact details are:

198
21 Portland Place
London W1B 1PY
Telephone: +44 (0) 20 7631 1650,
Fax: + 44 (0) 207 631 4352,
On behalf of NIAA and its funding partners I would like to
congratulate you on the quality of your application and look
forward to seeing your results published.
With kind regards
Professor DG Lambert
NIAA Grants Officer.
(cc L Devine, Dr Ian Johnston, Dr D Bogod and Morgan Cenan)

199
7.11 CPB Study: qPCR ΔCt Results for NOP and ppN/OFQ
NOP
ID t0 ΔCt t3 ΔCt ΔΔCt Fold
change
% knock down
t24 ΔCt ΔΔCt
Fold change
% knock down
01 6.9 8 1.025 0.49 50.88 9.3 2.39 0.19 80.86
02 4.5 6.2 1.65 0.32 68.14 6.3 1.79 0.29 71.08
03 5.4 6.6 1.23 0.43 57.37 7.6 2.25 0.21 78.98
04 5.38 8.5 3.124 0.11 88.54 6.4 1.074 0.47 52.51
05 5.6 8.8 3.20 0.11 89.12 8 2.36 0.19 80.52
06 9.2 9.6 0.396 0.76 24.05 9.3 0.06 0.96 3.74
07 6.42 6.15 -0.27 1.20 5.85 -0.57 1.48
08 5.93 7.47 1.54 0.34 65.66 5.99 0.06 0.96 3.94
09 5.24 6.92 1.68 0.31 68.68 5.66 0.41 0.75 24.89
10 6.67 6.37 -0.31 1.24 6.28 -0.40 1.32
11 6.084 6.447 0.363 0.78 22.25 6.400 0.316 0.80 19.67
12 4.305 5.789 1.484 0.36 64.25 5.291 0.986 0.50 49.51
13 4.929 6.168 1.239 0.42 57.63 5.143 0.214 0.86 13.79
14 5.00 6.1 1.08 0.47 53.0 5.3 0.2 0.85 15.2
15 4.562 5.234 0.672 0.63 37.24 4.687 0.125 0.92 8.30
16 4.716 5.744 1.028 0.49 50.96 6.609 1.893 0.27 73.08
17 4.924 5.869 0.945 0.52 48.06 5.251 0.327 0.80 20.28
18 5.178 6.448 1.270 0.41 58.53 5.987 0.809 0.57 42.92
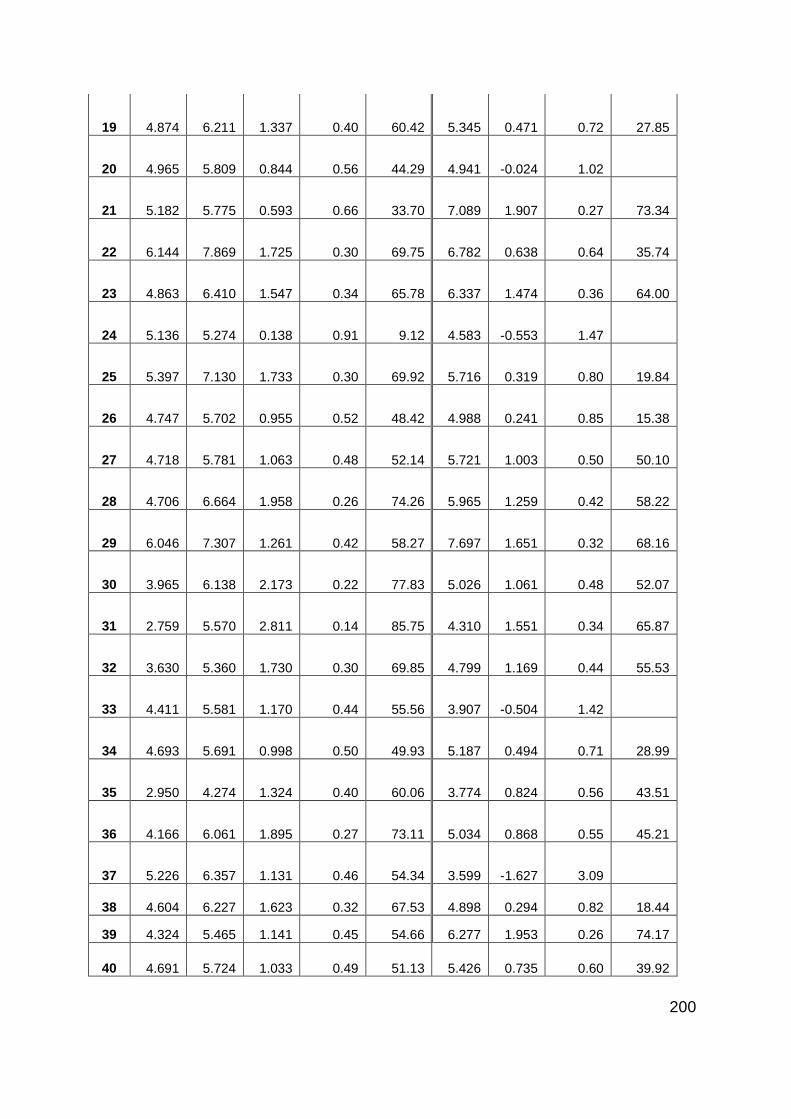
200
19 4.874 6.211 1.337 0.40 60.42 5.345 0.471 0.72 27.85
20 4.965 5.809 0.844 0.56 44.29 4.941 -0.024 1.02
21 5.182 5.775 0.593 0.66 33.70 7.089 1.907 0.27 73.34
22 6.144 7.869 1.725 0.30 69.75 6.782 0.638 0.64 35.74
23 4.863 6.410 1.547 0.34 65.78 6.337 1.474 0.36 64.00
24 5.136 5.274 0.138 0.91 9.12 4.583 -0.553 1.47
25 5.397 7.130 1.733 0.30 69.92 5.716 0.319 0.80 19.84
26 4.747 5.702 0.955 0.52 48.42 4.988 0.241 0.85 15.38
27 4.718 5.781 1.063 0.48 52.14 5.721 1.003 0.50 50.10
28 4.706 6.664 1.958 0.26 74.26 5.965 1.259 0.42 58.22
29 6.046 7.307 1.261 0.42 58.27 7.697 1.651 0.32 68.16
30 3.965 6.138 2.173 0.22 77.83 5.026 1.061 0.48 52.07
31 2.759 5.570 2.811 0.14 85.75 4.310 1.551 0.34 65.87
32 3.630 5.360 1.730 0.30 69.85 4.799 1.169 0.44 55.53
33 4.411 5.581 1.170 0.44 55.56 3.907 -0.504 1.42
34 4.693 5.691 0.998 0.50 49.93 5.187 0.494 0.71 28.99
35 2.950 4.274 1.324 0.40 60.06 3.774 0.824 0.56 43.51
36 4.166 6.061 1.895 0.27 73.11 5.034 0.868 0.55 45.21
37 5.226 6.357 1.131 0.46 54.34 3.599 -1.627 3.09
38 4.604 6.227 1.623 0.32 67.53 4.898 0.294 0.82 18.44
39 4.324 5.465 1.141 0.45 54.66 6.277 1.953 0.26 74.17
40 4.691 5.724 1.033 0.49 51.13 5.426 0.735 0.60 39.92

201
ppN/OFQ
ID t0 ΔCt t3 ΔCt ΔΔCT Fold
change
% knock down
t24 ΔCt ΔΔCT
Fold change
% knock down
01 13.36 13.51 0.16 0.90 10.35 14.75 1.40 0.38 62.00
02 ND 13.08 15.92
03 12.29 16.86 4.57 0.04 95.79 13.99 1.69 0.31 69.08
04 13.87 15.59 1.72 0.30 69.60 16.16 2.30 0.20 79.63
05 6.91 8.09 1.17 0.44 55.66 8.64 1.72 0.30 69.72
06 13.46 16.913 3.450 0.09 90.85 17.901 4.44 0.05 95.39
07 9.28 13.16 3.88 0.07 93.22 13.87 4.59 0.04 95.84
08 11.11 13.57 2.45 0.18 81.74 13.03 1.92 0.26 73.56
09 16.02 19.30 3.28 0.10 89.69 20.37 4.35 0.05 95.09
10 12.85 18.72 5.88 0.02 98.30 16.88 4.04 0.06 93.90
11 14.110 19.095 4.99 0.03 96.84 17.455 3.35 0.10 90.16
12 12.852 18.142 5.29 0.03 97.44 16.960 4.11 0.06 94.20
13 14.381 21.337 6.96 0.01 99.19 21.835 7.45 0.01 99.43
14 15.30 17.40 2.11 0.23 76.80 15.30 -0.04 1.03
15 14.052 19.927 5.88 0.02 98.30 20.123 6.07 0.01 98.51
16 15.798 21.396 5.60 0.02 97.94 16.750 0.95 0.52 48.31
17 18.411 20.940 2.53 0.17 82.67 ND
18 12.458 17.084 4.63 0.04 95.95 14.397 1.94 0.26 73.92
19 13.790 19.631 5.84 0.02 98.26 19.333 5.54 0.02 97.86

202
20 13.080 17.312 4.23 0.05 94.68 17.342 4.26 0.05 94.79
21 15.775 18.062 2.29 0.20 79.51 17.738 1.96 0.26 74.35
22 12.820 18.382 5.56 0.02 97.88 16.320 3.50 0.09 91.16
23 11.524 18.446 6.92 0.01 99.18 14.280 2.76 0.15 85.20
24 13.255 20.776 7.52 0.01 99.46 19.636 6.38 0.01 98.80
25 12.019 21.754 9.74 0.00 99.88 19.227 7.21 0.01 99.32
26 15.155 21.559 6.40 0.01 98.82 18.053 2.90 0.13 86.58
27 11.954 16.424 4.47 0.05 95.49 16.312 4.36 0.05 95.12
28 15.321 25.687 10.37 0.001 99.92 23.806 8.49 0.003 99.72
29 26.963 32.989 6.03 0.02 98.47 30.013 3.05 0.12 87.93
30 13.785 14.408 0.62 0.65 35.07 20.971 7.19 0.01 99.31
31 17.398 19.522 2.12 0.23 77.06 ND
32 ND 22.377 18.307
33 ND 17.941 ND
34 13.510 17.735 4.23 0.05 94.65 ND
35 ND ND 16.405
36 17.025 ND 16.130 -0.90 1.86
37 14.320 19.790 5.47 0.02 97.74 16.657 2.34 0.20 80.21
38 ND 17.839 ND
39 ND ND ND
40 15.240 ND 16.530 1.29 0.41 59.10

203
7.12 Sepsis Study: qPCR ΔCt Results for NOP and ppN/OFQ
NOP
ID D1 ∆Ct
D2 ∆Ct ∆∆CT
Fold change
% knock down or increase
Recovery ∆Ct ∆∆CT
Fold change
% knock down or increase
01 5.70 5.83 0.14 0.91 ↓9.18
02 7.34 7.46 0.12 0.92 ↓7.85
03 5.80 6.64 0.84 0.56 ↓44.22
04 7.06 7.14 0.08 0.95 ↓5.49
05 8.74 8.88 0.14 0.91 ↓9.44
06 6.25 6.65 0.40 0.76 ↓24.21 5.16 -1.09 2.13 ↑113.17
07 5.89 5.26 -0.63 1.55 ↑55.19 5.82 -0.07 1.05 ↑4.97
08 6.01 5.49 -0.52 1.43 ↑43.10 5.51 -0.50 1.42 ↑41.62
10 7.23
11 6.20 5.84 -0.36 1.28 ↑28.43
12 3.42 7.20 3.78 0.07 ↓92.74
13 6.96
6.84 -0.12 1.08 ↑8.45
14 6.06 5.46 -0.60 1.52 ↑51.78
15 5.33 5.67 0.33 0.79 ↓20.61
16 5.41
17 5.72 5.74 0.03 0.98 ↓1.85
18 8.10 7.16 -0.95 1.93 ↑92.52
19 6.02 6.28 0.26 0.84 ↓16.43
20 6.80 5.94 -0.86 1.81 ↑81.25

204
21 7.18 6.44 -0.75 1.68 ↑67.60 6.21 -0.97 1.96 ↑96.16
22 6.25 7.10 0.85 0.55 ↓44.52 6.90 0.65 0.64 ↓36.40
23 6.47 6.13 -0.34 1.26 ↑26.31 4.78 -1.69 3.24 ↑223.57
24 5.84 7.80 1.95 0.26 ↓74.17
25 ND ND
26 6.55 5.70 -0.85 1.80 ↑80.02
27 6.02 5.29 -0.74 1.66 ↑66.41 1.41 -4.62 24.58 ↑2357.55
28 5.42 5.59 0.17 0.89 ↓10.82 5.00 -0.43 1.34 ↑34.47
29 3.30 3.23 -0.08 1.05 ↑5.33
30 7.71 7.38 -0.33 1.26 ↑25.57 6.42 -1.29 2.44 ↑144.02
32 7.20 6.76 -0.44 1.35 ↑35.27
33 6.15 6.35 0.20 0.87 ↓12.83 7.51 1.36 0.39 ↓60.90
34 6.48 5.83 -0.65 1.57 ↑56.77
35 5.39 5.89 0.50 0.71 ↓29.21 4.60 -0.79 1.73 ↑73.30
36 7.36 5.40 -1.97 3.91 ↑291.45 7.59 0.22 0.86 ↓14.33
37 4.64 4.59 -0.05 1.04 ↑3.72
38 6.56 6.89 0.33 0.80 ↓20.49 5.42 -1.14 2.21 ↑121.04
39 5.22
5.68 0.46 0.73 ↓27.25
40 7.28 5.20 -2.07 4.21 ↑320.79
41 5.43 4.77 -0.65 1.57 ↑57.21 5.60 0.17 0.89 ↓11.11
42 7.06
43 5.52 2.43 -3.09 8.49 ↑749.36 5.06 -0.46 1.37 ↑37.40
44 2.74 4.64 1.90 0.27 ↓73.26
45 5.09 4.45 -0.64 1.56 ↑55.61 4.34 -0.75 1.68 ↑67.83

205
46 3.26
47 4.83 4.96 0.13 0.91 ↓8.83 4.75 -0.08 1.06 ↓5.55
48 5.75 6.63 0.88 0.54 ↓45.51 3.94 -1.82 3.52 ↑252.34
49 7.77 7.28 -0.50 1.41 ↑40.96
50 5.31 4.08 -1.23 2.34 ↑134.20 4.93 -0.38 1.30 ↑29.90
51 4.62 4.12 -0.50 1.42 ↑41.71 4.36 -0.26 1.20 ↑19.95
ppN/OFQ
ID Day 1 ∆Ct
Day 2 ∆Ct ∆∆CT
Fold change
% knock down or increase
Recovery ∆Ct ∆∆CT
Fold change
% knock down or increase
01 15.86 17.70 1.84 0.28 ↓72.11
02 17.95 15.07 -2.88 7.36 ↑635.95
03 12.78 10.66 -2.11 4.33 ↑332.87
04 18.82 15.53 -3.29 9.79 ↑878.64
05 18.53 16.30 -2.23 4.68 ↑368.46
06 14.66 13.61 -1.06 2.08 ↑108.35 12.83 -1.84 3.57 ↑257.02
07 17.59 17.34 -0.25 1.19 ↑19.09 15.74 -1.85 3.60 ↑260.00
08 18.50 17.63 -0.87 1.83 ↑82.64 18.67 0.17 0.89 ↓10.87
10 ND
11 16.33 13.79 -2.54 5.81 ↑481.19
12 ND
13 12.28
13.47 1.20 0.44 ↓56.35
14 14.47 15.09 0.62 0.65 ↓35.02
15 16.24 16.17 -0.07 1.05 ↑4.83
16 14.75

206
17 13.07 10.91 -2.16 4.47 ↑346.91
18 15.80 16.66 0.86 0.55 ↓44.98
19 16.50 13.40 -3.10 8.59 ↑758.61
20 13.75 13.01 -0.74 1.67 ↑66.90
21 16.87 17.23 0.36 0.78 ↓21.81 14.56 -2.31 4.97 ↑397.26
22 14.17 16.55 2.37 0.19 ↓80.67 12.51 -1.66 3.17 ↑216.67
23 16.22 15.82 -0.41 1.33 ↑32.50 16.56 0.33 0.79 ↓20.68
24 11.14 14.83 3.69 0.08 ↓92.22
25 ND ND
26 17.19 17.41 0.21 0.86 ↓13.79
27 17.05 16.01 -1.04 2.05 ↑105.45 14.30 -2.75 6.73 ↑573.44
28 16.95 15.77 -1.18 2.27 ↑126.74 16.18 -0.77 1.70 ↑69.94
29 11.53 14.33 2.80 0.14 ↓85.67
30 17.28 15.33 -1.95 3.86 ↑286.00 12.55 -4.73 26.56 ↑2556.42
32 19.80 20.59 0.80 0.58 ↓42.49
33 14.29 13.51 -0.77 1.71 ↑70.99 11.55 -2.73 6.65 ↑565.14
34 16.54 15.96 -0.57 1.49 ↑48.94
35 16.02 21.96 5.93 0.02 ↓98.36 17.94 1.91 0.27 ↓73.43
36 17.66 16.23 -1.43 2.69 ↑168.66 14.52 -3.13 8.77 ↑777.28
37 13.25 12.78 -0.48 1.39 ↑39.16
38 19.48 ND
13.73 -5.75 53.84 ↑5283.57
39 ND
8.97
40 17.19
41 5.43 4.77 -0.65 1.57 ↑57.21 5.60 0.17 0.89 ↓11.11

207
42 20.69
43 ND 15.00
13.36 -1.64 3.12 ↑212.03
44 17.18 17.29 0.11 0.93 ↓7.09
45 16.63 ND
14.11 -2.52 5.75 ↑475.07
46 17.61
47 18.16 16.96 -1.20 2.30 ↑129.87 12.04 -6.12 69.57 ↑6856.84
48 15.45 14.09 -1.36 2.56 ↑156.45 10.21 -5.24 37.90 ↑3690.48
49 11.71 14.13 2.42 0.19 ↓81.27
50 14.05 14.22 0.17 0.89 ↓11.11 10.73 -3.33 10.04 ↑904.14
51 19.68 16.65 -3.03 8.17 ↑716.53 11.30 -8.39 334.94 ↑33394.26

208
Reference List
(1) Meunier JC, Mollereau C, Toll L. Isolation and structure of the endogenous agonist of opioid receptor-like ORL1 receptor. Nature 1995; 377(6549):532-535.
(2) Reinscheid RK, Nothacker HP, Bourson A. Orphanin FQ: a neuropeptide that activates an opioidlike G protein-coupled receptor. Science (New York, N Y 1995; 270(5237):792-794.
(3) Mogil JS, Pasternak GW. The molecular and behavioral pharmacology of the orphanin FQ/nociceptin peptide and receptor family. Pharmacological reviews 2001; 53(3):381-415.
(4) Calo G, Guerrini R, Rizzi A, Salvadori S, Regoli D. Pharmacology of nociceptin and its receptor: a novel therapeutic target. British journal of pharmacology 2000; 129(7):1261-1283.
(5) Barnes TA, Lambert DG. Nociceptin/orphanin FQ peptide-receptor system: are we any nearer the clinic? British journal of anaesthesia 2004; 93(5):626-628.
(6) Krepuska M, Sotonyi P, Csobay-Novak C, Szeberin Z, Hartyanszky I, Zima E et al. Plasma nociceptin/orphanin FQ levels are lower in patients with chronic ischemic cardiovascular diseases--A pilot study. Regul Pept 2011; 169(1-3):1-5.
(7) Fontana F, Bernardi P, Pizzi C, Spampinato S, Bedini A, Pich EM. Plasma nociceptin/orphanin FQ levels rise after spontaneous episodes of angina, but not during induced myocardial ischemia. Peptides 2009; 30(9):1705-1709.
(8) Anna Borsodi, Girolamo Calo, Charles Chavkin, McDonald J.Christie, Olivier Civelli, Brian M.Cox et al. Opioid receptors: NOP. IUPHAR database [ 2010 [cited 2011 Mar. 1]; Available from: URL:http://www.iuphar-db.org/DATABASE/ObjectDisplayForward?0objectId=320.
(9) Peluso J, LaForge KS, Matthes HW. Distribution of nociceptin/orphanin FQ receptor transcript in human central nervous system and immune cells. Journal of neuroimmunology 1998; 81(1-2):184-192.
(10) Johnson EE, Lambert DG. Molecular pharmacology of the opioid/nociceptin system. Current Anaesthesia & Critical Care 2002; 13:305-312.
(11) McDonald J, Leonard AD, Serrano-Gomez A, Young SP, Swanevelder J, Thompson JP et al. Assessment of nociceptin/orphanin FQ and micro-opioid receptor mRNA in the human right atrium. British journal of anaesthesia 2010; 104(6):698-704.

209
(12) Mollereau C, Mouledous L. Tissue distribution of the opioid receptor-like (ORL1) receptor. Peptides 2000; 21(7):907-917.
(13) Granata F, Potenza RL, Fiori A. Expression of OP4 (ORL1, NOP1) receptors in vascular endothelium. European journal of pharmacology 2003; 482(1-3):17-23.
(14) Fiset ME, Gilbert C, Poubelle PE. Human neutrophils as a source of nociceptin: a novel link between pain and inflammation. Biochemistry 2003; 42(35):10498-10505.
(15) Williams JP, Thompson JP, Rowbotham DJ. Human peripheral blood mononuclear cells produce pre-pro-nociceptin/orphanin FQ mRNA. Anesthesia and analgesia 2008; 106(3):865-866.
(16) Williams JP, Thompson JP, McDonald J. Human peripheral blood mononuclear cells express nociceptin/orphanin FQ, but not mu, delta, or kappa opioid receptors. Anesthesia and analgesia 2007; 105(4):998-1005.
(17) Young SP, Serrano-Gomez A, McDonald J, Thompson JP, Lambert DG. Nociceptin/Orphanin FQ receptor and peptide expression by polymorphonuclear leucocytes during aortic surgery: a preliminary analysis. Britrish Journal of Anaesthesia 2008; 101(4):591.
(18) Lambert DG. The nociceptin/orphanin FQ receptor: a target with broad therapeutic potential. Nature reviews 2008; 7(8):694-710.
(19) Burmeister MA, Kapusta DR. Centrally administered nociceptin/orphanin FQ (N/OFQ) evokes bradycardia, hypotension, and diuresis in mice via activation of central N/OFQ peptide receptors. The Journal of pharmacology and experimental therapeutics 2007; 322(1):324-331.
(20) Burmeister MA, Ansonoff MA, Pintar JE. Nociceptin/orphanin FQ (N/OFQ)-evoked bradycardia, hypotension, and diuresis are absent in N/OFQ peptide (NOP) receptor knockout mice. The Journal of pharmacology and experimental therapeutics 2008; 326(3):897-904.
(21) Brookes ZL, Stedman EN, Guerrini R. Proinflammatory and vasodilator effects of nociceptin/orphanin FQ in the rat mesenteric microcirculation are mediated by histamine. American journal of physiology 2007; 293(5):2977-2985.
(22) New DC, Wong YH. The ORL1 receptor: molecular pharmacology and signalling mechanisms. Neuro-Signals 2002; 11(4):197-212.
(23) Arjomand J, Cole S, Evans CJ. Novel orphanin FQ/nociceptin transcripts are expressed in human immune cells. Journal of neuroimmunology 2002; 130(1-2):100-108.

210
(24) Easten KH, Harry RA, Purcell WM. Nociceptin-induced modulation of human T cell function. Peptides 2009; 30(5):926-934.
(25) Serhan CN, Fierro IM, Chiang N. Cutting edge: nociceptin stimulates neutrophil chemotaxis and recruitment: inhibition by aspirin-triggered-15-epi-lipoxin A4. J Immunol 2001; 166(6):3650-3654.
(26) Waits PS, Purcell WM, Fulford AJ. Nociceptin/orphanin FQ modulates human T cell function in vitro. Journal of neuroimmunology 2004; 149(1-2):110-120.
(27) Trombella S, Vergura R, Falzarano S. Nociceptin/orphanin FQ stimulates human monocyte chemotaxis via NOP receptor activation. Peptides 2005; 26(8):1497-1502.
(28) Peluso J, Gaveriaux-Ruff C, Matthes HW. Orphanin FQ/nociceptin binds to functionally coupled ORL1 receptors on human immune cell lines and alters peripheral blood mononuclear cell proliferation. Brain research bulletin 2001; 54(6):655-660.
(29) Miller TR, Fulford AJ. Regulation of nociceptin/orphaninFQ secretion by immune cells and functional modulation of interleukin-2. Peptides 2007; 28(11):2243-2252.
(30) Kaminsky DE, Rogers TJ. Suppression of CCL2/MCP-1 and CCL5/RANTES expression by nociceptin in human monocytes. J Neuroimmune Pharmacol 2008; 3(2):75-82.
(31) Carvalho D, Petronilho F, Vuolo F. The nociceptin/orphanin FQ-NOP receptor antagonist effects on an animal model of sepsis. Intensive care medicine 2008; 34(12):2284-2290.
(32) Zhao H, Wu GC, Cao XD. Immunomodulatory activity of orphanin FQ/nociceptin on traumatic rats. Acta pharmacologica Sinica 2002; 23(4):343-348.
(33) Williams JP, Thompson JP, Young SP. Nociceptin and urotensin-II concentrations in critically ill patients with sepsis. British journal of anaesthesia 2008; 100(6):810-814.
(34) Stamer UM, Book M, Comos C, Zhang L, Nauck F, Stuber F. Expression of the nociceptin precursor and nociceptin receptor is modulated in cancer and septic patients. British journal of anaesthesia 2011; 106(4):566-572.
(35) Kato S, Tsuzuki Y, Hokari R. Role of nociceptin/orphanin FQ (Noc/oFQ) in murine experimental colitis. Journal of neuroimmunology 2005; 161(1-2):21-28.

211
(36) Ji RR, Zhang Q, Law PY. Expression of mu-, delta-, and kappa-opioid receptor-like immunoreactivities in rat dorsal root ganglia after carrageenan-induced inflammation. J Neurosci 1995; 15(12):8156-8166.
(37) Jeanjean AP, Moussaoui SM, Maloteaux JM. Interleukin-1 beta induces long-term increase of axonally transported opiate receptors and substance P. Neuroscience 1995; 68(1):151-157.
(38) Stein C, Schafer M, Machelska H. Attacking pain at its source: new perspectives on opioids. Nature medicine 2003; 9(8):1003-1008.
(39) Rittner HL, Brack A, Machelska H. Opioid peptide-expressing leukocytes: identification, recruitment, and simultaneously increasing inhibition of inflammatory pain. Anesthesiology 2001; 95(2):500-508.
(40) Rittner HL, Brack A, Stein C. Pain and the immune system. British journal of anaesthesia 2008; 101(1):40-44.
(41) Pettersson LM, Sundler F, Danielsen N. Expression of orphanin FQ/nociceptin and its receptor in rat peripheral ganglia and spinal cord. Brain Res 2002; 945(2):266-275.
(42) Acosta C, Davies A. Bacterial lipopolysaccharide regulates nociceptin expression in sensory neurons. Journal of neuroscience research 2008; 86(5):1077-1086.
(43) Agostini S, Eutamene H, Broccardo M. Peripheral anti-nociceptive effect of nociceptin/orphanin FQ in inflammation and stress-induced colonic hyperalgesia in rats. Pain 2009; 141(3):292-299.
(44) Zeilhofer HU, Calo G. Nociceptin/orphanin FQ and its receptor--potential targets for pain therapy? The Journal of pharmacology and experimental therapeutics 2003; 306(2):423-429.
(45) Heinricher MM, McGaraughty S, Grandy DK. Circuitry underlying antiopioid actions of orphanin FQ in the rostral ventromedial medulla. J Neurophysiol 1997; 78(6):3351-3358.
(46) Kumar V, Sharma A. Is neuroimmunomodulation a future therapeutic approach for sepsis? Int Immunopharmacol 2010; 10(1):9-17.
(47) Elenkov IJ, Chrousos GP. Stress hormones, proinflammatory and antiinflammatory cytokines, and autoimmunity. Ann N Y Acad Sci 2002; 966:290-303.
(48) Green MK, Barbieri EV, Brown BD. Roles of the bed nucleus of stria terminalis and of the amygdala in N/OFQ-mediated anxiety and HPA axis activation. Neuropeptides 2007; 41(6):399-410.

212
(49) Devine DP, Watson SJ, Akil H. Nociceptin/orphanin FQ regulates neuroendocrine function of the limbic-hypothalamic-pituitary-adrenal axis. Neuroscience 2001; 102(3):541-553.
(50) Leggett JD, Harbuz MS, Jessop DS. The nociceptin receptor antagonist [Nphe1,Arg14,Lys15]nociceptin/orphanin FQ-NH2 blocks the stimulatory effects of nociceptin/orphanin FQ on the HPA axis in rats. Neuroscience 2006; 141(4):2051-2057.
(51) Bodnar RJ. Endogenous opiates and behavior: 2008. Peptides 2009; 30(12):2432-2479.
(52) Kapusta DR. Neurohumoral effects of orphanin FQ/nociceptin: relevance to cardiovascular and renal function. Peptides 2000; 21(7):1081-1099.
(53) Abraham E, Singer M. Mechanisms of sepsis-induced organ dysfunction. Critical care medicine 2007; 35(10):2408-2416.
(54) Houtani T, Nishi M, Takeshima H. Structure and regional distribution of nociceptin/orphanin FQ precursor. Biochemical and biophysical research communications 1996; 219(3):714-719.
(55) Boom A, Mollereau C, Meunier JC. Distribution of the nociceptin and nocistatin precursor transcript in the mouse central nervous system. Neuroscience 1999; 91(3):991-1007.
(56) Makman MH, Lyman WD, Dvorkin B. Presence and characterization of nociceptin (orphanin FQ) receptor binding in adult rat and human fetal hypothalamus. Brain research 1997; 762(1-2):247-250.
(57) Neal CR, Jr., Akil H, Watson SJ, Jr. Expression of orphanin FQ and the opioid receptor-like (ORL1) receptor in the developing human and rat brain. Journal of chemical neuroanatomy 2001; 22(4):219-249.
(58) Krowicki ZK, Kapusta DR. Tonic nociceptinergic inputs to neurons in the hypothalamic paraventricular nucleus contribute to sympathetic vasomotor tone and water and electrolyte homeostasis in conscious rats. The Journal of pharmacology and experimental therapeutics 2006; 317(1):446-453.
(59) Chu X, Xu N, Li P. Inhibition of cardiovascular activity following microinjection of novel opioid-like neuropeptide nociceptin (orphanin FQ) into the rat rostral ventrolateral medulla. Brain research 1999; 829(1-2):134-142.
(60) Guerrini R, Calo G, Rizzi A, Bigoni R, Bianchi C, Salvadori S et al. A new selective antagonist of the nociceptin receptor. Br J Pharmacol 1998; 123(2):163-165.
(61) Okawa H, Nicol B, Bigoni R, Hirst RA, Calo G, Guerrini R et al. Comparison of the effects of [Phe1psi(CH2-NH)Gly2]nociceptin(1-13)NH2 in rat brain, rat

213
vas deferens and CHO cells expressing recombinant human nociceptin receptors. Br J Pharmacol 1999; 127(1):123-130.
(62) McDonald J, Barnes TA, Okawa H, Williams J, Calo G, Rowbotham DJ et al. Partial agonist behaviour depends upon the level of nociceptin/orphanin FQ receptor expression: studies using the ecdysone-inducible mammalian expression system. British journal of pharmacology 2003; 140(1):61-70.
(63) Williams JP, Lambert DG. Opioids and the neuroimmune axis. British journal of anaesthesia 2005; 94(1):3-6.
(64) Giuliani S, Tramontana M, Lecci A. Effect of nociceptin on heart rate and blood pressure in anaesthetized rats. European journal of pharmacology 1997; 333(2-3):177-179.
(65) Hashiba E, Hirota K, Kudo T. Effects of nociceptin/orphanin FQ receptor ligands on blood pressure, heart rate, and plasma catecholamine concentrations in guinea pigs. Naunyn-Schmiedeberg's archives of pharmacology 2003; 367(4):342-347.
(66) Madeddu P, Salis MB, Milia AF. Cardiovascular effects of nociceptin in unanesthetized mice. Hypertension 1999; 33(3):914-919.
(67) Simonsen U, Laursen BE, Petersen JS. ZP120 causes relaxation by pre-junctional inhibition of noradrenergic neurotransmission in rat mesenteric resistance arteries. British journal of pharmacology 2008; 153(6):1185-1194.
(68) Ho M, Corbett AD, McKnight AT. Characterization of the ORL(1) receptor on adrenergic nerves in the rat anococcygeus muscle. British journal of pharmacology 2000; 131(2):349-355.
(69) Champion HC, Pierce RL, Kadowitz PJ. Nociceptin, a novel endogenous ligand for the ORL1 receptor, dilates isolated resistance arteries from the rat. Regulatory peptides 1998; 78(1-3):69-74.
(70) Champion HC, Bivalacqua TJ, Zadina JE. Role of nitric oxide in mediating vasodilator responses to opioid peptides in the rat. Clinical and experimental pharmacology & physiology 2002; 29(3):229-232.
(71) Francischetti I, Moreno JB, Scholz M, Yoshida WB. Leukocytes and the inflammatory response in ischemia-reperfusion injury. Rev Bras Cir Cardiovasc 2010; 25(4):575-584.
(72) Kovach MA, Standiford TJ. The function of neutrophils in sepsis. Curr Opin Infect Dis 2012; 25(3):321-327.
(73) Hotchkiss RS, Karl IE. The pathophysiology and treatment of sepsis. N Engl J Med 2003; 348(2):138-150.
214
(74) Lewis DH, Chan DL, Pinheiro D, Armitage-Chan E, Garden OA. The immunopathology of sepsis: pathogen recognition, systemic inflammation, the compensatory anti-inflammatory response, and regulatory T cells. J Vet Intern Med 2012; 26(3):457-482.
(75) Namas R, Zamora R, Namas R, An G, Doyle J, Dick TE et al. Sepsis: Something old, something new, and a systems view. J Crit Care 2012; 27(3):314-11.
(76) Gabay C, Kushner I. Acute-phase proteins and other systemic responses to inflammation. N Engl J Med 1999; 340(6):448-454.
(77) Wensley F, Gao P, Burgess S, Kaptoge S, Di Angelantonio E, Shah T et al. Association between C reactive protein and coronary heart disease: mendelian randomisation analysis based on individual participant data. BMJ 2011; 342:d548.
(78) Dinarello CA. Proinflammatory cytokines. Chest 2000; 118(2):503-508.
(79) Webster NR, Galley HF. Immunomodulation in the critically ill. British journal of anaesthesia 2009; 103(1):70-81.
(80) Cohen J, Carlet J. INTERSEPT: an international, multicenter, placebo-controlled trial of monoclonal antibody to human tumor necrosis factor-alpha in patients with sepsis. International Sepsis Trial Study Group. Critical care medicine 1996; 24(9):1431-1440.
(81) Reinhart K, Menges T, Gardlund B, Harm ZJ, Smithes M, Vincent JL et al. Randomized, placebo-controlled trial of the anti-tumor necrosis factor antibody fragment afelimomab in hyperinflammatory response during severe sepsis: The RAMSES Study. Critical care medicine 2001; 29(4):765-769.
(82) Opal SM, DePalo VA. Anti-inflammatory cytokines. Chest 2000; 117(4):1162-1172.
(83) Tsukamoto T, Chanthaphavong RS, Pape HC. Current theories on the pathophysiology of multiple organ failure after trauma. Injury 2010; 41(1):21-26.
(84) Iwamura H, Sato M, Wakitani K. Comparative study of glucocorticoids, cyclosporine A, and JTE-607 [(-)-Ethyl-N[3,5-dichloro-2-hydroxy-4-[2-(4-methylpiperazin-1-yl)ethoxy]benzoyl]- L-phenylalaninate dihydrochloride] in a mouse septic shock model. J Pharmacol Exp Ther 2004; 311(3):1256-1263.
(85) Borozdenkova S, Mant TG, Allen E, Pu K, Hoshino S, Jurcevic S. Effects of a cytokine inhibitor, JTE-607, on the response to endotoxin in healthy human volunteers. Int Immunopharmacol 2011; 11(11):1837-1843.

215
(86) Opal SM, Fisher CJ, Jr., Dhainaut JF, Vincent JL, Brase R, Lowry SF et al. Confirmatory interleukin-1 receptor antagonist trial in severe sepsis: a phase III, randomized, double-blind, placebo-controlled, multicenter trial. The Interleukin-1 Receptor Antagonist Sepsis Investigator Group. Crit Care Med 1997; 25(7):1115-1124.
(87) Tidswell M, Tillis W, Larosa SP, Lynn M, Wittek AE, Kao R et al. Phase 2 trial of eritoran tetrasodium (E5564), a toll-like receptor 4 antagonist, in patients with severe sepsis. Crit Care Med 2010; 38(1):72-83.
(88) Arnhold J, Flemmig J. Human myeloperoxidase in innate and acquired immunity. Arch Biochem Biophys 2010; 500(1):92-106.
(89) Ng CS, Wan S, Yim AP, Arifi AA. Pulmonary dysfunction after cardiac surgery. Chest 2002; 121(4):1269-1277.
(90) Klebanoff SJ. Myeloperoxidase: friend and foe. J Leukoc Biol 2005; 77(5):598-625.
(91) Kothari N, Keshari RS, Bogra J, Kohli M, Abbas H, Malik A et al. Increased myeloperoxidase enzyme activity in plasma is an indicator of inflammation and onset of sepsis. J Crit Care 2010.
(92) Ng LL, Khan SQ, Narayan H, Quinn P, Squire IB, Davies JE. Proteinase 3 and prognosis of patients with acute myocardial infarction. Clin Sci (Lond) 2010; 120(6):231-238.
(93) Uzzan B, Cohen R, Nicolas P, Cucherat M, Perret GY. Procalcitonin as a diagnostic test for sepsis in critically ill adults and after surgery or trauma: a systematic review and meta-analysis. Critical care medicine 2006; 34(7):1996-2003.
(94) Becker KL, Snider R, Nylen ES. Procalcitonin assay in systemic inflammation, infection, and sepsis: clinical utility and limitations. Critical care medicine 2008; 36(3):941-952.
(95) Tang BM, Eslick GD, Craig JC, McLean AS. Accuracy of procalcitonin for sepsis diagnosis in critically ill patients: systematic review and meta-analysis. Lancet Infect Dis 2007; 7(3):210-217.
(96) Jensen JU, Heslet L, Jensen TH, Espersen K, Steffensen P, Tvede M. Procalcitonin increase in early identification of critically ill patients at high risk of mortality. Critical care medicine 2006; 34(10):2596-2602.
(97) Schneider CP, Yilmaz Y, Kleespies A, Jauch KW, Hartl WH. Accuracy of procalcitonin for outcome prediction in unselected postoperative critically ill patients. Shock 2009; 31(6):568-573.

216
(98) Ailawadi G, Zacour RK. Cardiopulmonary bypass/extracorporeal membrane oxygenation/left heart bypass: indications, techniques, and complications. Surg Clin North Am 2009; 89(4):781-viii.
(99) Onorati F, Rubino AS, Nucera S, Foti D, Sica V, Santini F et al. Off-pump coronary artery bypass surgery versus standard linear or pulsatile cardiopulmonary bypass: endothelial activation and inflammatory response. Eur J Cardiothorac Surg 2010; 37(4):897-904.
(100) Laffey JG, Boylan JF, Cheng DC. The systemic inflammatory response to cardiac surgery: implications for the anesthesiologist. Anesthesiology 2002; 97(1):215-252.
(101) Paparella D, Yau TM, Young E. Cardiopulmonary bypass induced inflammation: pathophysiology and treatment. An update. Eur J Cardiothorac Surg 2002; 21(2):232-244.
(102) Tworoger SS, Hankinson SE. Collection, processing, and storage of biological samples in epidemiologic studies: sex hormones, carotenoids, inflammatory markers, and proteomics as examples. Cancer Epidemiol Biomarkers Prev 2006; 15(9):1578-1581.
(103) Shapiro HM. Practical Flow Cytometry. New York: Alan R Liss; 1988.
(104) Life technologies. Principles of flow cytometry. Life technologies website [ 2012 [cited 2012 Feb. 23]; Available from: URL:http://www.invitrogen.com/site/us/en/home/support/Tutorials.html
(105) Tefferi A, Wieben ED, Dewald GW, Whiteman DA, Bernard ME, Spelsberg TC. Primer on medical genomics part II: Background principles and methods in molecular genetics. Mayo Clin Proc 2002; 77(8):785-808.
(106) Applied Biosystems. Taqman probe. Applied Biosystems website [ 2012 [cited 2012 Feb. 24]; Available from: URL:http://www.appliedbiosystems.com/etc/medialib/appliedbio-media-library/images/application-and-technology/real-time-pcr/taqman-sybr-green-chemistry/data-images.Par.74690.Image.302.517.1.gif.Figure_2.gif
(107) Chomczynski P, Sacchi N. The single-step method of RNA isolation by acid guanidinium thiocyanate-phenol-chloroform extraction: twenty-something years on. Nat Protoc 2006; 1(2):581-585.
(108) Longo MC, Berninger MS, Hartley JL. Use of uracil DNA glycosylase to control carry-over contamination in polymerase chain reactions. Gene 1990; 93(1):125-128.
(109) Berson SA, Yalow RS. General principles of radioimmunoassay. 1968. Clin Chim Acta 2006; 369(2):125-143.

217
(110) Wu ZK, Laurikka J, Vikman S, Nieminen R, Moilanen E, Tarkka MR. High postoperative interleukin-8 levels related to atrial fibrillation in patients undergoing coronary artery bypass surgery. World J Surg 2008; 32(12):2643-2649.
(111) Galley HF, Lowe PR, Carmichael RL, Webster NR. Genotype and interleukin-10 responses after cardiopulmonary bypass. British journal of anaesthesia 2003; 91(3):424-426.
(112) Duggan E, Caraher E, Gately K, O'Dwyer M, McGovern E, Kelleher D et al. Tumor necrosis factor-alpha and interleukin-10 gene expression in peripheral blood mononuclear cells after cardiac surgery. Critical care medicine 2006; 34(8):2134-2139.
(113) http://www abcam com/index html?pageconfig=resource&rid=12232 [ 2013
(114) Galley HF, Macaulay GD, Webster NR. Matrix metalloproteinase-9, tissue inhibitor of metalloproteinase-1 and tumour necrosis factor alpha release during cardiopulmonary bypass. Anaesthesia 2002; 57(7):659-662.
(115) Halkos ME, Puskas JD. Off-pump versus on-pump coronary artery bypass grafting. Surg Clin North Am 2009; 89(4):913-22, ix.
(116) Fontana F, Bernardi P, Pizzi C, Spampinato S, Bedini A, Pich EM. Plasma nociceptin/orphanin FQ levels rise after spontaneous episodes of angina, but not during induced myocardial ischemia. Peptides 2009; 30(9):1705-1709.
(117) Poulsen TD, Andersen LW, Steinbruchel D, Gotze JP, Jorgensen OS, Olsen NV. Two large preoperative doses of erythropoietin do not reduce the systemic inflammatory response to cardiac surgery. J Cardiothorac Vasc Anesth 2009; 23(3):316-323.
(118) McBride WT, Armstrong MA, Crockard AD, McMurray TJ, Rea JM. Cytokine balance and immunosuppressive changes at cardiac surgery: contrasting response between patients and isolated CPB circuits. British journal of anaesthesia 1995; 75(6):724-733.
(119) Young SP, Serrano-Gomez A, McDonald J, Lambert DG, Thompson JP. Do Urotensin-II and nociceptin plasma concentrations change during AAA repair? Presented at the Annual Scientific Meeting of the Vascular Anaesthesia Society of Great Britain and Ireland . 2010.
(120) Yee DL, Bollard CM, Geaghan SM. Chapter 164: Normal blood values:
Selected reference values for neonatal, pediatric, and adult populations. In: Hoffman R, editor. Hematology: Basic Principles and Practice. 5th Ed ed. Churchill Livingstone Elsevier; 2009. 2431.
(121) Padkin A, Goldfrad C, Brady AR, Young D, Black N, Rowan K. Epidemiology of severe sepsis occurring in the first 24 hrs in intensive care units in

218
England, Wales, and Northern Ireland. Crit Care Med 2003; 31(9):2332-2338.
(122) Harrison DA, Welch CA, Eddleston JM. The epidemiology of severe sepsis in England, Wales and Northern Ireland, 1996 to 2004: secondary analysis of a high quality clinical database, the ICNARC Case Mix Programme Database. Crit Care 2006; 10(2):R42.
(123) Bone RC, Balk RA, Cerra FB, Dellinger RP, Fein AM, Knaus WA et al. Definitions for sepsis and organ failure and guidelines for the use of innovative therapies in sepsis. The ACCP/SCCM Consensus Conference Committee. American College of Chest Physicians/Society of Critical Care Medicine. Chest 1992; 101(6):1644-1655.
(124) Annane D, Bellissant E, Cavaillon JM. Septic shock. Lancet 2005; 365(9453):63-78.
(125) Brown KA, Brain SD, Pearson JD. Neutrophils in development of multiple organ failure in sepsis. Lancet 2006; 368(9530):157-169.
(126) Lowes DA, Thottakam BM, Webster NR. The mitochondria-targeted antioxidant MitoQ protects against organ damage in a lipopolysaccharide-peptidoglycan model of sepsis. Free Radic Biol Med 2008; 45(11):1559-1565.
(127) Tsalik EL, Jaggers LB, Glickman SW, Langley RJ, van Velkinburgh JC, Park LP et al. Discriminative value of inflammatory biomarkers for suspected sepsis. J Emerg Med 2012; 43(1):97-106.
(128) Que YA, Delodder F, Guessous I, Graf R, Bain M, Calandra T et al. Pancreatic stone protein as an early biomarker predicting mortality in a prospective cohort of patients with sepsis requiring ICU management. Crit Care 2012; 16(4):R114.
(129) Gogos CA, Drosou E, Bassaris HP, Skoutelis A. Pro- versus anti-inflammatory cytokine profile in patients with severe sepsis: a marker for prognosis and future therapeutic options. J Infect Dis 2000; 181(1):176-180.
(130) Routsi C, Pratikaki M, Sotiropoulou C, Platsouka E, Markaki V, Paniara O et al. Application of the sequential organ failure assessment (SOFA) score to bacteremic ICU patients. Infection 2007; 35(4):240-244.
(131) Perneger TV. What's wrong with Bonferroni adjustments. BMJ 1998; 316(7139):1236-1238.
(132) Iapichino G, Umbrello M, Albicini M, Spanu P, Bellani G, Polli F et al. Time course of endogenous nitric oxide inhibitors in severe sepsis in humans. Minerva Anestesiol 2010; 76(5):325-333.

219
(133) Georgopoulou AP, Savva A, Giamarellos-Bourboulis EJ, Georgitsi M, Raftogiannis M, Antonakos N et al. Early changes of procalcitonin may advise about prognosis and appropriateness of antimicrobial therapy in sepsis. J Crit Care 2011; 26(3):331-337.
(134) Junhasavasdikul D, Theerawit P, Kiatboonsri S. Association between admission delay and adverse outcome of emergency medical patients. Emerg Med J 2012.
(135) Fischetti C, Rizzi A, Gavioli EC, Marzola G, Trapella C, Guerrini R et al. Further studies on the pharmacological features of the nociceptin/orphanin FQ receptor ligand ZP120. Peptides 2009; 30(2):248-255.
(136) Gavioli EC, Romao PR. NOP Receptor Ligands as Potential Agents for Inflammatory and Autoimmune Diseases. J Amino Acids 2011; 2011:836569.
(137) Kimura T, Kitaichi K, Hiramatsu K, Yoshida M, Ito Y, Kume H et al. Intradermal application of nociceptin increases vascular permeability in rats: the possible involvement of histamine release from mast cells. Eur J Pharmacol 2000; 407(3):327-332.
(138) Anselmi A, Possati G, Gaudino M. Postoperative inflammatory reaction and atrial fibrillation: simple correlation or causation? Ann Thorac Surg 2009; 88(1):326-333.
(139) Santini F, Onorati F, Telesca M, Menon T, Mazzi P, Berton G et al. Selective pulmonary pulsatile perfusion with oxygenated blood during cardiopulmonary bypass attenuates lung tissue inflammation but does not affect circulating cytokine levels. Eur J Cardiothorac Surg 2012.
(140) van Harten AE, Scheeren TW, Absalom AR. A review of postoperative cognitive dysfunction and neuroinflammation associated with cardiac surgery and anaesthesia. Anaesthesia 2012; 67(3):280-293.
(141) Moller CH, Penninga L, Wetterslev J, Steinbruchel DA, Gluud C. Off-pump versus on-pump coronary artery bypass grafting for ischaemic heart disease. Cochrane Database Syst Rev 2012; 3:CD007224.
(142) Sablotzki A, Dehne MG, Friedrich I, Grond S, Zickmann B, Muhling J et al. Different expression of cytokines in survivors and non-survivors from MODS following cardiovascular surgery. Eur J Med Res 2003; 8(2):71-76.
(143) Abacilar F, Dogan OF, Duman U, Ucar I, Demircin M, Ersoy U et al. The changes and effects of the plasma levels of tumor necrosis factor after coronary artery bypass surgery with cardiopulmonary bypass. Heart Surg Forum 2006; 9(4):E703-E709.
(144) Hagen SA, Kondyra AL, Grocott HP, El-Moalem H, Bainbridge D, Mathew JP et al. Cardiopulmonary bypass decreases G protein-coupled receptor

220
kinase activity and expression in human peripheral blood mononuclear cells. Anesthesiology 2003; 98(2):343-348.


![Inflammation et sepsis — expérimental · Introduction : Le sepsis constitue une des causes majeures de décès en réanimation. La dysfonction myocardique [1] est fréquente au](https://img.pdfslide.us/doc/110x75/5f657ce622f1917dd333a623/inflammation-et-sepsis-a-exprimental-introduction-le-sepsis-constitue-une.jpg)